2014 Public Sector Construction Technology Report
10
e-Builder.net 2014 Public Sector Construction Technology Report WHITE PAPER
Transcript of 2014 Public Sector Construction Technology Report

e-Builder.net
2014 Public Sector Construction Technology Report
WHITE PAPER

e-Builder.net [email protected] | [email protected]
2014 PUBLIC SECTOR CONSTRUCTION TECHNOLOGY REPORT
EXECUTIVE SUMMARY
Public sector construction spending has declined over the last 3 years, down from the days at the end of the last decade when the country regularly spent upwards of $300 billion per year1. This decrease in annual budgets produces enormous pressure on public executives who are nevertheless expected to maintain their quality of service.
This report provides valuable insights for anyone who works in and around the construction and maintenance of public sector infrastructure or facilities, including finance, auditing, public works, and engineering professionals, and also elected officials. The study provides benchmarks against which agencies can compare their own metrics to identify areas for improvement.
REPORT FINDINGS
Public sector executives reported that staffing their capital program was of primary concern. Issues around project schedules and program cost were also listed. The main challenges identified by survey respondents were:
§ Not having enough staff to successfully manage projects
§ Projects taking longer than originally promised
§ Taking too long to on-board new staff members
§ Holding staff and vendors accountable for performance.
§ Spending more than what was budgeted
§ Other key findings of the report include:
Other key findings of the report include:
§ Agencies perform the majority of their work in-house, with half of survey respondents reporting that less than 25% of their program was managed externally.
§ On average, public sector organizations employee 1 full-time resource in design, construction or engineering for every $2.21m dollars of capital spent.
§ More organizations use off-the-shelf software such as Microsoft Excel and Project to manage their projects than those using a dedicated Project Management Information Systems (PMIS).
e-Builder, Inc. is a leading provider of Construction Program Management Software. This study surveyed our database of over 14, 000 public sector executives in North America, working in design, construction, engineering, finance and administrative functions. The study was conducted in order to:
§ Provide insights into the current and future state of public sector construction
§ Identify new and evolving trends
§ Assess the challenges faced and opportunities present for public infrastructure and facility owners
1. United States Department of Commerce, United States Census Bureau, Construction Spending Historical Data 2008-2013, https://www.census.gov/construction/c30/historical_data.html, retrieved 09/26/2014.

e-Builder.net [email protected] | [email protected]
WHITE PAPER
41+25+14+9+13ANSWER OPTIONS AS PRESENTED
RESPONSE PERCENT
0 - 25% new 40.8%
26 - 50% new 24.3%
51 - 75% new 13.6%
76 - 100% new 8.7%
Don’t know 12.6%
18+22+15+11+8+6+15SPEND RESPONSE PERCENT
Less than $5 million 17.5%
$5 million - $10 million 22.3%
$11 million - $20 million 14.6%
$21 million - $50 million 10.7%
$51 million - $100 million 7.8%
$101 million - $500 million 5.8%
$501 million or more 14.6%
e-Builder’s vision is to help the construction industry become the worldwide productivity leader, and the industry benchmark against which all other construction capital project management systems and software are measured. We would love to hear about your own experiences compared to the study’s findings.
DEMOGRAPHIC DATA
All participants surveyed were executives (director-level and above) working for local/regional, state (provincial) or federal agencies in the United States and Canada. Numerous C-level decision-makers, including Chief Financial Officers, Chief Technology Officers, and City Managers responded.
Roughly 57% of respondents reported working in a design, construction, facilities or engineering capacity, with another 40% describing their work as finance or administration, and approximately 3% responding IT or other.
The majority of respondents (just over 80%) indicated that they worked for local or regional agencies, while 15% worked for state-level organizations, and less than 5% for federal agencies.
SIZE CAPITAL SPENDING
We asked participants to indicate how much their organization spent on capital construction last year. The average capital spend across all respondents was about $115m.
We asked respondents to tell us what portion of the program was spent on new construction vs. maintenance and renovations. About 40% said that less than 25% of their program is spent on new construction.

e-Builder.net [email protected] | [email protected]
WHITE PAPER 25+20+12+7+7+1+0+8NUMBER OF PROJECTS RESPONSE PERCENT
Fewer than 10 34.0%
11 - 25 29.1%
26 - 50 11.7%
51 - 99 4.9%
100 - 150 4.9%
151 - 200 1.9%
200 - 299 0.0%
300+ 7.8%
GROWTH
We asked participants to anticipate whether the population their public agency serves is likely to increase or decrease over the next five years. Around two-thirds believed their population would increase, while the other third believe it would remain more or less the same. Very few respondents (2%) said that their population was decreasing.
STAFFING
We asked participants to tell us how many resources work in engineering, design, facilities or construction across all depart-ments at their organization. Answers were varied – a little less than one third answered ten or fewer resources, while 14% indicated more than 150 employees work in these functions.
We asked how many capital projects the organization was managing per year.
STAFF TO CAPITAL SPEND AND PROJECTS RATIO
Analyzing the survey results yields the following ratio table:
FTES SPEND # PROJECTS
1 $2.21m 1.11
That is, on average, organizations employ 1 full time resource for every $2.21m spent on capital construction, or for every 1.11 capital projects undertaken.
30+34+16+8+14FULL-TIME RESOURCES RESPONSE PERCENT
Fewer than 10 29.9%
10 - 50 employees 33.6%
51 - 100 employees 15.5%
101 - 150 employees 7.8%
150+ employees 13.6%
2+30+68FULL-TIME RESOURCES RESPONSE PERCENT
Fewer than 10 2%
10 - 50 employees 30%
51 - 100 employees 68%

e-Builder.net [email protected] | [email protected]
WHITE PAPER
FUNCTIONS PERFORMED BY STAFF
Participants were asked about which construction functions they manage in-house. On average, participants indicated that they manage 6 – 7 of the following functions internally.
USE OF PROGRAM MANAGERS
We asked respondents to tell us what percentage of their program was managed by an outside party e.g. construction manager or owner’s representative. About half the respondents indicated that 25% or less of their program was managed by an outside firm. About 15% do no outsourcing at all. NUMBER OF PROJECTS RESPONSE PERCENT
Project Planning and Prioritization 89.2%
Project Funding and Authorization 80.4%
Permitting / Entitlements 57.8%
Design Review 78.4%
Construction Administration (RFI, Submittal, Meeting Minutes) 65.7%
Change Management and Approval 67.6%
Field Management (Daily Inspections, Compliance, Punch List) 60.8%
IT / AV Equipment Purchase and Installation 21.6%
Safety 52.0%
Commissioning 14.7%
Occupancy / Move In 25.5%
15+35+21+13+10+4+3NUMBER OF PROJECTS RESPONSE PERCENT
0% 14.7%
1 - 25% 35.3%
26 - 50% 20.6%
51 - 75% 12.7%
76 - 99% 9.8%
100% 3.9%
Don’t know 2.9%

e-Builder.net [email protected] | [email protected]
WHITE PAPER
PROJECT MANAGEMENT TOOLS
We asked participants to share the project management software tools they are currently using to manage their projects today. Microsoft’s off the shelf Office suite of products, in particular Excel and Project, were rated highly, with around 80% of respondents using Excel in some capacity today.
Roughly one third indicated that they use an in-house or homegrown system.
We also asked respondents whether they use historical data to project future costs and how they stored historical data.
Over 80% stated that historical data is used to project cost.
How is historical information retained?
ANSWER OPTIONS AS PRESENTED RESPONSE PERCENT
Microsoft Excel 80.4%
Accounting / ERP system 25.5%
In-House / Home Grown System 30.4%
System Provided by Program Manager or Owner Representative
12.7%
Microsoft Project 1.0%
e-Builder 3.9%
Primavera Unifier / Contract Manager (Oracle) 20.6%
Prolog / Proliance (Trimble) 0.0%
Autodesk / Constructware / Buzzsaw 7.8%
70 +50 +60 +30 +15HOW RESPONSE PERCENT
Paper files 74.5%
Database 59.8%
Internal File Server / Share Drive 68.6%
Dedicated Document or Archival System 31.4%
Don’t know 2.9%
Yes
No
Don’t know81+7+12C81.4%
6.9%
11.8%
DO YOU USE HISTORICAL DATA?

e-Builder.net [email protected] | [email protected]
WHITE PAPER
SELECTION CRITERIA
We asked whether professional and construction services were procured on a price- or qualification-basis.
CONTRACT TYPE RESPONSE PERCENT
Lump Sum 62.7%
Cost Plus 23.5%
Guaranteed Maximum Price 35.3%
Time and Materials 45.1%
Unit Price 61.8%
Job Order Contracts 34.3%
PROJECT DELIVERY
We asked participants about the project delivery methods they use as well as their most common contract types they execute on their capital projects.
Design-Bid-Build was the most commonly cited delivery method, while Lump Sum was the most common contract type used.
PROCUREMENT METHOD RESPONSE PERCENT
Price-based 37.3%
Qualification-based 53.9%
Best Value (Combination of both) 75.5%DELIVERY METHOD RESPONSE PERCENT
Design-Bid-Build 77.5%
Design-Build 43.1%
CM at Risk 18.6%
Integrated Project Delivery (IPD) 8.8%
Public-Private Partnership 4.1%
Job Order Contracting 4.1%
CAPITAL CONSTRUCTION CHALLENGES
We set out to determine the areas in which public sector professionals experience challenges in managing their capital program, as it relates to their process and systems. We asked respondents to rate the level of “pain” they felt, from “No Pain” to “Severe Pain”. Different challenges were categorized and grouped together as financial, operational, legal/audit or systems pains.
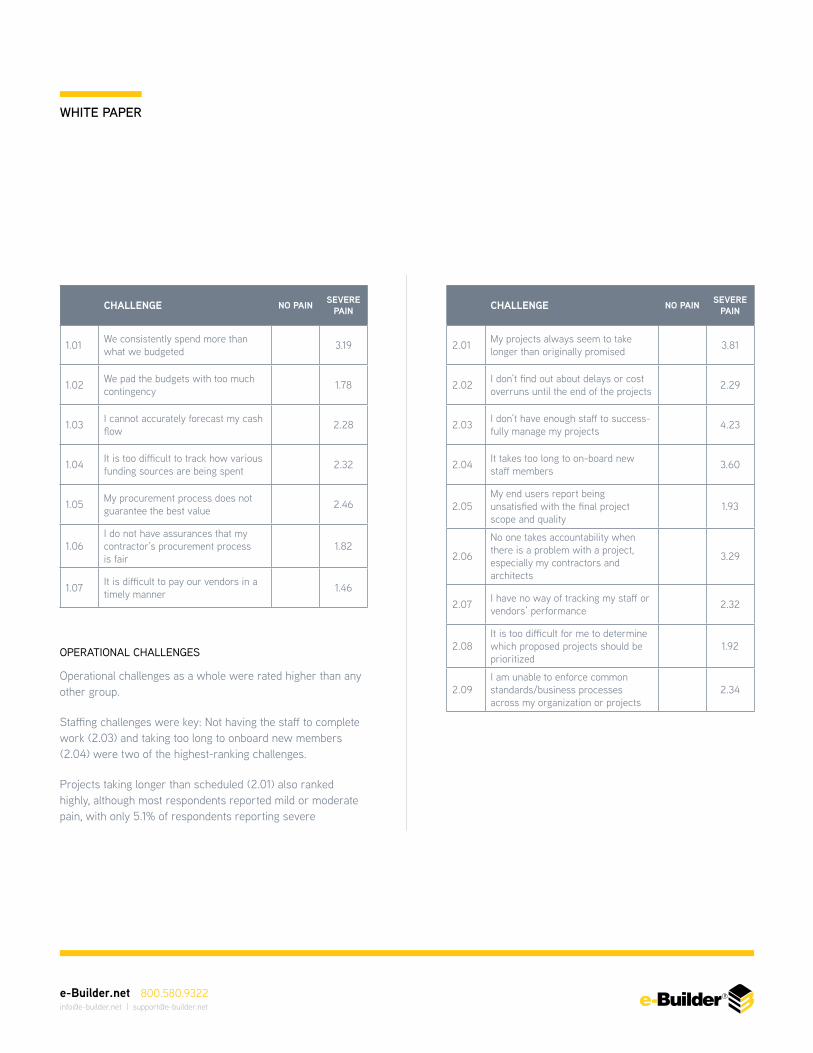
FINANCIAL CHALLENGES
Spending more than what was budgeted was the greatest financial challenge, with just less than two-thirds of respondents (65.5%) reporting some pain in this area.
The greatest variance for a single question was 1.07, with 7% of respondents saying they had “severe pain” with paying vendors on time, while 64% said they had “no pain at all”
e-Builder.net [email protected] | [email protected]
WHITE PAPER
OPERATIONAL CHALLENGES
Operational challenges as a whole were rated higher than any other group.
Staffing challenges were key: Not having the staff to complete work (2.03) and taking too long to onboard new members (2.04) were two of the highest-ranking challenges.
Projects taking longer than scheduled (2.01) also ranked highly, although most respondents reported mild or moderate pain, with only 5.1% of respondents reporting severe
CHALLENGE NO PAIN SEVERE PAIN
1.01 We consistently spend more than what we budgeted 3.19
1.02 We pad the budgets with too much contingency 1.78
1.03 I cannot accurately forecast my cash flow 2.28
1.04 It is too difficult to track how various funding sources are being spent 2.32
1.05 My procurement process does not guarantee the best value 2.46
1.06I do not have assurances that my contractor’s procurement process is fair
1.82
1.07 It is difficult to pay our vendors in a timely manner 1.46
CHALLENGE NO PAIN SEVERE PAIN
2.01 My projects always seem to take longer than originally promised 3.81
2.02 I don’t find out about delays or cost overruns until the end of the projects 2.29
2.03 I don’t have enough staff to success-fully manage my projects 4.23
2.04 It takes too long to on-board new staff members 3.60
2.05My end users report being unsatisfied with the final project scope and quality
1.93
2.06
No one takes accountability when there is a problem with a project, especially my contractors and architects
3.29
2.07 I have no way of tracking my staff or vendors’ performance 2.32
2.08It is too difficult for me to determine which proposed projects should be prioritized
1.92
2.09I am unable to enforce common standards/business processes across my organization or projects
2.34

e-Builder.net [email protected] | [email protected]
WHITE PAPER
CHALLENGE NO PAIN SEVERE PAIN
3.01I am concerned that I will have a claim or lawsuit at the end of a project
1.91
3.02
If I have a claim or lawsuit I am wor-ried that I will not have the proper documentation, time or resources to defend myself
2.02
3.03 I spend too much time preparing project information for our auditors 2.29
3.04 I am worried that the audit of the project will identify a discrepancy 1.55
3.05I am concerned that project funds are being mismanaged or misappro-priated
0.64
CHALLENGE NO PAIN SEVERE PAIN
4.01I cannot provide timely or accurate project information to executive management
2.31
4.02 I cannot provide timely or accurate project information to the public 2.12
4.03 I am frustrated by the lack of visibility regarding project status 2.01
4.04I am frustrated that I have to go to multiple systems to get project information
2.86
4.05I am frustrated that I have to enter project information into multiple systems
2.66
4.06 When I am on the road or in the field I cannot access project information 3.01
4.07When issues arise on a project, I don’t have the information to resolve them
1.95
4.08The information that I get from my project management systems is unreliable
1.67
LEGAL / AUDIT CHALLENGES
Overall, Legal / Audit challenges ranked lower than any other group.
Approximately 16% of respondents claimed moderate or severe pain around spending too much time preparing information for their auditors, the highest in this category.
SYSTEMS CHALLENGES
Being unable to access project information when outside of the office (4.06) was the highest rated pain in this group. Having to go to multiple systems to find project information and having to enter information into multiple systems were also rated as challenges, but lower.
Having unreliable data was not rated highly, with only 11% of respondents reporting moderate or severe pain in this area.

e-Builder.net [email protected] | [email protected]
WHITE PAPER
CHALLENGE RELATIVE SCORE
I don’t have enough staff to successfully manage my projects 4.23
My projects always seem to take longer than originally promised 3.81
It takes too long to on-board new staff members 3.60
No one takes accountability when there is a problem with a project, especially my contrac-tors and architects
3.29
We consistently spend more than what we budgeted 3.19
TOP CHALLENGES OVERALL
Two of the top three challenges across all groups related to staffing, with scheduling, budgeting and accountability also important. The concern over having enough staff to successfully complete projects was significantly higher than any other single challenge.
CONCLUSIONS
Public agencies continue to innovate in order to overcome challenges in delivering their capital programs.
These organizations will have to hire more staff or find ways to deliver more work with existing resources. Competition for labor is likely to be high in the near future, making the finding and retaining of internal staff a key advantage for organizations that perform well.
Hiring and on-boarding processes need to be refined in order to get new resources up to speed more quickly. A move to standardizing and codifying construction processes across an organization will help achieve this.
Schedule management and bringing projects in on-time continues to be the number one challenge for project delivery. Visibility was another common theme. The ability to detect problems early, track staff and vendor performance and hold them accountable for results were all highly-rated by survey participants.
Market penetration of true capital program management systems is low, with many organizations using off-the-shelf or generic software. Program management applications and other construction technology will become more ubiquitous as organizations look to solve the challenges outlined in this report.
e-Builder’s vision is to help the construction industry become the worldwide productivity leader, and the industry benchmark against which all other construction capital project management systems and software are measured. We would love to hear about your own experiences compared to the study’s findings.
To Request an Online Demo Visit: e-Builder.net or call 800.580.9322