2014 PACE Annual Report
138
PHARMACEUTICAL ASSISTANCE CONTRACT FOR THE ELDERLY ANNUAL REPORT TO THE PENNSYLVANIA GENERAL ASSEMBLY JANUARY 1 - DECEMBER 31, 2014 For the Pennsylvania Department of Aging Director Thomas M. Snedden Outreach and Enrollment Manager Rose M. Paulus Administrative Officer Kyle Kessler Administrative Officer Janis L. Rhodes Operations Manager Rebecca D. Lorah, MPA Administrative Assistant Carol Bebawi Administrative Assistant Megan McDaniel Research and Evaluation Chief Theresa V. Brown, MPA Program Analyst Ellaheh Otarod, MBA Program Analyst Antonino G. Vetrano, MPA Pennsylvania Department of Aging The PACE Program Forum Place Building 555 Walnut Street 5th Floor Harrisburg, PA 17101-1919 717-787-7313 [email protected] For Magellan Medicaid Administration, Inc. Officer in Charge Donald C. Moore Director, PACE Operations Bradley I. Kohler Assistant Director, PACE Operations Jean B. Sanders Cardholder Services Manager Janet N. Casterella Health Outcomes Scientist Jian Ding, PhD Clinical Pharmacist Judith Dooley, RPh Provider Services Manager Richard J. Flage Clinical Pharmacist Margaret R. Glessner, PharmD Senior Health Outcomes Scientist Debra A. Heller, PhD, MPH Medicare Part D Manager Lisa M. Irwin Clinical Pharmacist Colleen M. Moyer, RPh Business Services Manager Donald G. Smith LAN/WAN Manager W. Todd Spacht Quality Assurance Manager Lisa Spiegel Systems Manager John K. Wheeler Magellan Medicaid Administration 4000 Crums Mill Road, Suite 301 Harrisburg, PA 17112 717-651-3600 Any questions or comments pertaining to information within this report may be addressed to the Pennsylvania Department of Aging at the address given above.
Transcript of 2014 PACE Annual Report

PHARMACEUTICAL ASSISTANCE CONTRACT FOR THE ELDERLY
ANNUAL REPORT TO THE PENNSYLVANIA GENERAL ASSEMBLY
JANUARY 1 - DECEMBER 31, 2014
For the Pennsylvania Department of Aging Director Thomas M. Snedden Outreach and Enrollment Manager Rose M. Paulus Administrative Officer Kyle Kessler Administrative Officer Janis L. Rhodes Operations Manager Rebecca D. Lorah, MPA Administrative Assistant Carol Bebawi Administrative Assistant Megan McDaniel Research and Evaluation Chief Theresa V. Brown, MPA Program Analyst Ellaheh Otarod, MBA Program Analyst Antonino G. Vetrano, MPA
Pennsylvania Department of Aging
The PACE Program Forum Place Building
555 Walnut Street 5th Floor
Harrisburg, PA 17101-1919 717-787-7313 [email protected]
For Magellan Medicaid Administration, Inc. Officer in Charge Donald C. Moore Director, PACE Operations Bradley I. Kohler Assistant Director, PACE Operations Jean B. Sanders Cardholder Services Manager Janet N. Casterella Health Outcomes Scientist Jian Ding, PhD Clinical Pharmacist Judith Dooley, RPh Provider Services Manager Richard J. Flage Clinical Pharmacist Margaret R. Glessner, PharmD Senior Health Outcomes Scientist Debra A. Heller, PhD, MPH Medicare Part D Manager Lisa M. Irwin Clinical Pharmacist Colleen M. Moyer, RPh Business Services Manager Donald G. Smith LAN/WAN Manager W. Todd Spacht Quality Assurance Manager Lisa Spiegel Systems Manager John K. Wheeler
Magellan Medicaid Administration 4000 Crums Mill Road, Suite 301
Harrisburg, PA 17112 717-651-3600
Any questions or comments pertaining to information within this report may be addressed to the Pennsylvania Department of Aging at the address given above.
DAHeller
Typewritten Text
DAHeller
Typewritten Text
DAHeller
Typewritten Text
DAHeller
Typewritten Text


TABLE OF CONTENTS
Frequently Requested Program Statistics ......................................................................................... 1
History ............................................................................................................................................... 3
Administration ................................................................................................................................... 5
Section 1 – Program Research Highlights .............................................................................. 7-14 Section 2 – Financial Data by Date of Service ...................................................................... 15-30
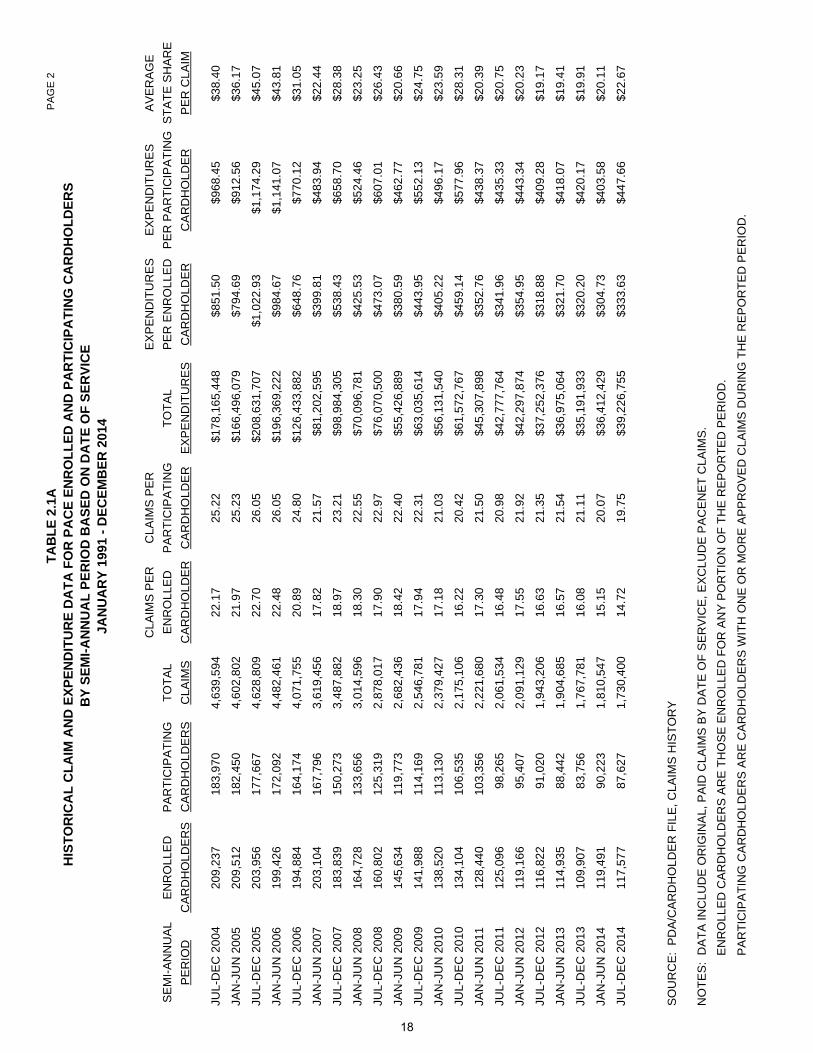
Table 2.1A Historical Claim and Expenditure Data for PACE Enrolled ........................... 17-18 and Participating Cardholders by Semi-Annual Period Based On Date of Service January 1991 - December 2014 Table 2.1B Historical Claim and Expenditure Data for PACENET Enrolled .................... 19-20 and Participating Cardholders by Semi-Annual Period Based On Date of Service July 1996 - December 2014 Figure 2.1 PACE and PACENET Claim Distribution by Amount Paid per Claim ................ 21 January - December 2014 Figure 2.2 Distribution of PACE Annual Benefit .................................................................. 22 January - December 2014 Figure 2.3 Distribution of PACENET Annual Benefit .......................................................... 23 January - December 2014 Table 2.2 PACE and PACENET Total Prescription Cost, Expenditures, Offsets .............. 24 and Recoveries January - December 2014 Figure 2.4 PACE and PACENET Enrollment, Claims, and ................................................. 25 Claims Expenditures by Calendar Year 1988-2014 Figure 2.5A PACE Total Enrolled and Participating Cardholders ......................................... 26 By Month January 2003 – January 2015 Figure 2.5B PACENET Total Enrolled and Participating Cardholders .................................. 27 By Month January 2003 – January 2015 Figure 2.6A PACE Average Wholesale Price (AWP) and .................................................... 28 Average Manufacturer’s Price (AMP), Brand Products Only, by Quarter
January 2000 – December 2014
Figure 2.6B PACE Average Wholesale Price (AWP) and .................................................... 29 Average Manufacturer’s Price (AMP), Generic Products Only, by Quarter
January 2000 – December 2014
Section 3 – Program Data by Date of Payment ..................................................................... 31-44
Table 3.1 PACE and PACENET Claims and Expenditures Paid by Fiscal Year .......... 33-35 July 1984 - December 2014 Table 3.2A PACE High Expenditure and High Volume Claims ....................................... 36-38 January - December 2014 Table 3.2B PACENET High Expenditure and High Volume Claims ................................ 39-41 January - December 2014 Table 3.3 PACE and PACENET Number and Percent of ............................................ 42-43 Expenditures and Claims by Manufacturer January - December 2014 Table 3.4 Manufacturers' Rebate Cash Receipts by Quarter/Year .................................... 44 Billed and by Fiscal Year Received January 1991 - December 2014
Section 4 – Cardholder Utilization Data ................................................................................. 45-60
Table 4.1 PACE and PACENET Cardholder Enrollments by Quarter .......................... 47-49 July 1984 – December 2014 Table 4.2A PACE Cardholder Enrollment, Participation, Utilization, ............................... 50-51 and Expenditures by Demographic Characteristics January - December 2014 Table 4.2B PACENET Cardholder Enrollment, Participation, Utilization, ....................... 52-53 and Expenditures by Demographic Characteristics January - December 2014 Figure 4.1A Percent of Enrolled PACE Cardholders by Income ........................................... 54 and Marital Status January - December 2014 Figure 4.1B Percent of Enrolled PACENET Cardholders by Income .................................... 55 and Marital Status January - December 2014 Table 4.3 Other Prescription Insurance Coverage of PACE and ....................................... 56 PACENET Enrolled Cardholders January - December 2014 Table 4.4 Part D Cardholder Enrollment, Participation, and Expenditures ................... 57-58 January - December 2014

Table 4.5 Annual Drug Expenditures for PACE/PACENET Enrolled ................................. 59 By Total Drug Spend, Part D Status, and LIS Status January - December 2014 Figure 4.2 PACE Generic Utilization Rates by Quarter ...................................................... 60 December 1988 - December 2014
Section 5 – County Data .......................................................................................................... 61-68
Table 5.1 Number and Percent of PACE and PACENET Cardholders ........................ 63-65 and Number of Providers by County January - December 2014 Figure 5.1 PACE and PACENET Cardholder, Claim, and Provider .................................... 66 Information by County Type (Percent of County Population Living in Urban Area) January - December 2014 Figure 5.2 Percent of Elderly Enrolled in PACE/PACENET and ......................................... 67 Percent Urban Population by County January - December 2014
Section 6 - Provider Data ......................................................................................................... 69-78
Table 6.1 PACE Claims by Product and Provider Type .................................................... 71 January - December 2014 Table 6.2 PACE Expenditures and Average State Share by Product and ........................ 72 Provider Type January - December 2014 Table 6.3 PACENET Claims and Expenditures by Provider Type ..................................... 73 January - December 2014 Table 6.4 PACENET Claims Volume by Phase of Coverage, ........................................... 74 Product Type, and Provider Type January - December 2014 Table 6.5 PACENET Expenditures by Phase of Coverage, ......................................... 75-76 Product Type, and Provider Type January - December 2014 Table 6.6 Average Cardholder and State Share Cost per PACENET ............................... 77 Claim by Phase of Coverage, Product Type, and Provider Type January - December 2014
Section 7 - Therapeutic Class Data and Drug Utilization Review Data ............................... 79-88
Table 7.1A Number and Percent of PACE Claims, State Share Expenditures, .............. 81-82 and Cardholders with Claims by Therapeutic Class January – December 2014

Table 7.1B Number and Percent of PACENET Claims, State Share .............................. 83-84 Expenditures, and Cardholders with Claims by Therapeutic Class January – December 2014 Figure 7.1 Percent of PACE State Share Expenditures by Therapeutic Class ................... 85 January - December 2014 Figure 7.2 Number and Percent of PACE and PACENET Claims ................................. 86-87 with a Prospective Review Message by Therapeutic Class January - December 2014
Section 8 - Pennsylvania Patient Assistance Program Clearinghouse (PA PAP) .............. 89-92 Appendix A - The PACE Application Center 2014 Report, ...................................................... 93-107
University of Pennsylvania and PACE/PACENET Behavioral Health Lab Program 2014 Report, and The PACE Academic Detailing Program Impact Analysis, January 2012 - December 2014
Appendix B - The PACE/PACENET Medical Exception Process.................................................. 108
Appendix C - American Hospital Formulary Service (AHFS) Classifications ................................ 109
Appendix D - PACE Prospective Drug Utilization Review Criteria ........................................ 110-128
Appendix E - State Funded Pharmacy Programs Utilizing the PACE Program Platform ...... 129-132

FREQUENTLY REQUESTED PROGRAM STATISTICS
The table below provides frequently requested Program information and lists references within the Annual Report for additional details.
2014 PACE AND PACENET SUMMARY PACE PACENET REFER TO: DEMOGRAPHIC DATA Total enrolled for 2014 125,801 192,351 Tables 4.2, A and B % Participating 77.8% 78.0% Tables 4.2, A and B Avg. age for enrolled 79.5 yrs. 78.4 yrs. Tables 4.2, A and B Female, avg. age 80.3 yrs. 78.9 yrs. Male, avg. age 76.9 yrs. 77.6 yrs. % Female 77.1% 66.8% Tables 4.2, A and B % Own residence 55.8% 68.8% Tables 4.2, A and B % Rent 27.6% 20.7% Tables 4.2, A and B % Married 9.7% 34.8% Tables 4.2, A and B Avg. Income $12,551 $21,778 Tables 4.2, A and B % Cardholders in urban counties 41.1% 37.1% Table 5.1 % Cardholders in rural counties 13.7% 14.2% Table 5.1 BENEFIT DATA Avg. total expenditures per enrolled cardholder $1,996 $2,109 Table 4.4 Avg. total expenditures per participant $2,567 $2,706 Table 4.4 Avg. total expenditures per claim $70.92 $79.75 Table 4.4 Avg. state share per enrolled cardholder $601 $598 Table 4.4 Avg. state share per participant $773 $767 Table 4.4 Avg. state share per claim $21.36 $22.62 Table 4.4 Avg. cardholder share per enrolled cardholder $139 $252 Table 4.4 Avg. cardholder share per participant $179 $324 Table 4.4 Avg. cardholder share per claim $4.94 $9.55 Table 4.4 Avg. TPL share per enrolled cardholder $1,256 $1,259 Table 4.4 Avg. TPL share per participant $1,615 $1,614 Table 4.4 Avg. TPL share per claim $44.62 $47.59 Table 4.4
2014 percent change in state share per claim 8.7%
increase 9.1%
increase Figure 2.1, 2013 and 2014
Avg. claims per participant 36.2 33.9 Tables 4.2, A and B Avg. number of therapeutic classes per participant 5.1 5.0 Tables 7.1, A and BUTILIZATION DATA (by date of payment) Total claims 3,541,146 5,098,787 Tables 6.1 and 6.4 Avg. claims per cardholder 28.1 26.5 Tables 6.1 and 6.4 Avg. deductible claims per cardholder - 4.8 Table 6.4 Avg. copaid claims per cardholder - 21.7 Table 6.4 Generic utilization rate 82.2% 81.6% Tables 6.1 and 6.4 PAYMENT DATA Total Program payout $66.57 M $123.40 M Table 3.1 Avg. weekly Program payout $1.28 M $2.37 M Table 3.1 Avg. annual Program payout per pharmacy $22,079 $40,928 Tables 3.1 and 5.1 % Program payout to chain pharmacies 59.0% 60.8% Tables 6.2 and 6.3
1
DAHeller
Typewritten Text

2

PENNSYLVANIA PHARMACEUTICAL ASSISTANCE CONTRACT FOR THE ELDERLY History The Pharmaceutical Assistance Contract for the Elderly (PACE) Program was enacted in November 1983, and implemented on July 1, 1984. Its purpose is to assist qualified state residents who are 65 years of age or older in paying for their prescription medications. The PACE legislation was amended in 1987 for reauthorization and, in 1992, for the manufacturers’ rebate reauthorization and additional cost containment initiatives. The legislature expanded income eligibility for PACE on four occasions: 1985, 1991, 1996, and 2003. The 1996 legislation also created the PACE Needs Enhancement Tier (PACENET). In July 2001, Act 2001-77, the Pennsylvania Master Tobacco Settlement, increased PACENET income eligibility by $1,000. Recognizing that the nominal increases in Social Security income were making enrollees ineligible for PACE, the legislature also created a limited PACE moratorium, effective January 1, 2001, until December 31, 2002, which permitted enrollees to remain in benefit even though their incomes exceeded the eligibility limits. Late in 2002, Act 2002-149 extended the moratorium for the PACE enrollment and expanded it to include the PACENET enrollment as well. While this moratorium expired on December 31, 2003, cardholders who were enrolled prior to the expiration, and had their eligibility periods extending into 2004, were permitted to remain in the Program until their eligibility end date. In November 2003, Act 2003-37 enabled an unprecedented expansion for enrollment eligibility in the Programs, modified the $500 annual PACENET deductible, and changed the PACE copay structure. The legislation raised the income limits for PACE to $14,500 for individuals and $17,700 for married couples; it boosted the income cap for PACENET to $23,500 for single persons and to $31,500 for married couples. With a $480 deductible divided into monthly $40 amounts, PACENET paid benefits after the first $40 in prescription costs each month. Beginning in 2004, PACE and PACENET had a two-tiered prescription copayment structure. The PACE copayment became $6 for generic drugs and $9 for brand name products. The PACENET copayment remained at the original amounts of $8 for generics and $15 for brand name drugs. Act 37 required both Programs to adjust the copayments to reflect increasing drug prices over time. Act 37 instituted federal upper limits (FUL) in the provider reimbursement formula and raised the dispensing fee fifty cents. The Program began to reimburse pharmacies the lesser of three prices: the Average Wholesale Price (AWP) minus 10%, plus a $4.00 dispensing fee; the Usual and Customary charge to the cash-paying public; or, the most current FUL established in the Medicaid program, plus a $4.00 dispensing fee. All payment methods include the subtraction of the cardholder’s copayment. The federal Medicare Prescription Drug, Improvement, and Modernization Act (MMA) of 2003 created a new outpatient prescription drug benefit, Part D of Medicare. Prior to the full implementation of Medicare Part D and beginning in June 2004, low income, non-HMO, PACE enrollees (134,393 cardholders over 18 months) were auto-enrolled into the interim Medicare Drug Discount Card and Transitional Assistance Program. They received a discount card that allowed for $600 per year in drug expenses in 2004 and again in 2005. Additional cardholders, estimated at 30,000, received this assistance through cards issued by their HMO. The PACE Program covered the Medicare drug card copayments for the auto-enrolled cardholders. The Medicare Transitional Assistance Program was a source of significant drug coverage for cardholders, with known savings in Program benefit payments of $112 million for the auto-enrolled cardholders. The Medicare Part D drug benefit began in January 2006. The PACE
3

Program elected to be a qualified State Pharmacy Assistance Program which, along with the passage of state Act 111 in July 2006, allowed for the creation of PACE Plus Medicare. The successful launch of “PACE Plus Medicare” on September 1, 2006, saw thousands of cardholders take advantage of the features of both PACE and Medicare Part D. With the goal of providing seamless coverage, “PACE Plus Medicare” provides benefits when Medicare Part D does not, for example, during the deductible and the coverage gap, for drugs excluded under MMA, for drugs not in a plan’s formulary, and for copayment differentials between the Part D plan coverage and the PACE and PACENET copayments. PACE Plus pays the Medicare premiums for Part D coverage for PACE cardholders. Act 111 also eliminated the monthly deductible for PACENET cardholders. PACENET cardholders who choose to forego Part D coverage are now responsible for a monthly benchmark premium payment ($32.59 in 2006; $28.45 in 2007; $26.59 in 2008; $29.23 in 2009; $32.09 in 2010; $34.07 in 2011, $34.32 in 2012; $36.57 in 2013; $35.50 in 2014; and, $33.91 in 2015) to the Program. The benchmark annual premium payment remains lower than the prior $40 per month deductible. Act 111 of 2006 recreated the PACE and PACENET moratoriums thereby permitting some 14,000 seniors to maintain their PACE or PACENET status despite disqualifying increases in their overall income due to Social Security cost-of-living increases. The PACE moratorium expired at the end of 2006; the PACENET moratorium continued through 2007. The Act revised provider reimbursement by adjusting the Average Wholesale Price formula from AWP minus 10% to AWP minus 12%, plus a $4.00 dispensing fee. Act 69 of 2008 recreated the PACE and PACENET moratoriums, thereby permitting 15,400 seniors to maintain their Program enrollment in 2010 despite disqualifying increases in their overall 2008 income due to Social Security cost-of-living increases. Act 21 of 2011 extended the moratorium until December 31, 2013, allowing 31,000 persons to remain enrolled. Act 12 of 2014 established the moratorium expiration date for December 31, 2015, preserving the enrollment for 28,000 older adults. This Act also instituted the exclusion of Medicare Part B premium costs from the definition of total income used for income eligibility determination. As of May 2014, 46,000 cardholders retained their enrollment in the Program due to these two provisions of Act 12. PACE covers all medications requiring a prescription in the Commonwealth, as well as insulin, insulin syringes, and insulin needles, unless a manufacturer does not participate in the Manufacturers’ Rebate Program. PACE does not cover experimental medications, medications for hair-loss or wrinkles, or over-the-counter (OTC) medications that can be purchased without a prescription. With appropriate documentation, PACE covers Drug Efficacy Study Implementation (DESI) medications. PACE requires generic substitution of brand multi-source products when an approved, Food and Drug Administration (FDA) A-rated generic is available. At the time of dispensing, a cardholder may encounter a prospective drug utilization review edit; PACE will not reimburse the prescription unless the pharmacist or physician documents the medical necessity for it. The Department of Aging recognizes the possibility of exceptional circumstances in connection with the application of therapeutic criteria and reimbursement edits. Appendix A contains a description of the PACE/PACENET medical exception process. With the advent of PACE Plus, cardholders enrolled in Part D plans conform to the reimbursement limits established by the plans, some of which allow up to a ninety-day supply. Otherwise, cardholders not enrolled in a Part D Plan receive a thirty-day supply or 100 units (tablets or capsules) whichever is less. The Program guarantees reimbursement to the provider (including nearly 2,900 Pennsylvania pharmacies) within 21 days, paying interest on any unpaid balance after 21 days. Six types of providers dispense PACE/PACENET-funded prescriptions to cardholders. The majority of providers are either independent pharmacies or chain
4

pharmacies. Other provider types include institutional pharmacies, nursing home pharmacies, mail order pharmacies, and dispensing physicians. All providers may offer mail order services if they are enrolled as a mail order pharmacy and if they follow specialized program requirements pertaining to record keeping and cardholder verification procedures. Manufacturers for innovator products pay the Program a rebate similar to the federal “best price” Medicaid rebate. Generic manufacturers pay an 11% rebate based on the average manufacturer price (AMP). An inflation penalty applies to innovator products if annual price increases exceed the consumer price index. The inflation penalty rebate was discontinued for generic products at the end of 2006. Effective January 2010, the federal Medicaid flat rebate rate increased from 15.1% of the AMP to 23.1%, and the generic rate increased from 11% to 13%. Administration The Pennsylvania Department of Aging administers the PACE/PACENET Program. A contractor directly responsible to the Department assists in conducting many of the day-to-day operations. Four primary operational responsibilities of the Program are to process applications, reimburse providers for prescriptions, protect enrollees from adverse drug events, and obtain the most cost-efficient reimbursement possible for the Program. Administrative responsibilities include research and policy development, monitoring and evaluating operations and ensuring that the mandates of the Act and Program regulations are met. Activities in these areas include conducting audits of not only the providers, but also of the cardholders and the contracting agency. The Program routinely reviews medication utilization profiles of the cardholders and dispensing practices of the providers and physicians. Annual reports for the PACE Application Center, the University of Pennsylvania and PACE/PACENET Behavioral Health Lab Program, and the PACE Academic Detailing Program are provided in Appendix A. The Department also evaluates the procedures used to implement the Program, identifies any trends which may be relevant for future administration, and carefully scrutinizes all expenditures. The Department of Aging receives funds through restricted revenue accounts to serve as the administrative and fiscal agent for other Commonwealth-sponsored drug reimbursement programs. Pharmaceutical claims for the Chronic Renal Disease Program, Cystic Fibrosis Program, Spina Bifida Program, Metabolic Conditions Program, including Maple Syrup Urine Disease Program and the Phenylketonuria Program (all within the Department of Health), and the two Special Pharmaceutical Benefits Programs (Department of Health for SP1 and Department of Human Services for SP2) are processed through the PACE/PACENET system. The program also adjudicates claims for two programs in the Department of Insurance, the Workers’ Compensation Security Fund and the Pennsylvania Automobile Catastrophic Loss Benefits Continuation Fund. The PACE Program serves as the fiscal agent for the General Assistance Program (Department of Human Services), the Special Pharmaceutical Assistance Program, and the Chronic Renal Disease Program for the collection of rebates from pharmaceutical manufacturers. The Program processes eligibility applications for the Chronic Renal Disease Program and for the SP1 Program. (See Appendix E.) The Pennsylvania Patient Assistance Program Clearinghouse (PA PAP) is available to assist all adult Pennsylvanians with the cost of prescription drugs. PA PAP outreaches to those who are uninsured or under-insured by helping them to apply for prescription assistance through various programs. Details about the Clearinghouse are found in Section 8 of this report.
5

6

SECTION 1
PROGRAM RESEARCH HIGHLIGHTS
7

8

INTERV
ENTIONS, GEN
ERAL
PRO
GRA
M ASSESSM
ENTS, A
ND M
EDICAT
ION ADHER
ENCE
STU
DIES
CURR
ENT PA
CE/PAC
ENET
COLLAB
ORA
TIVE
RESEA
RCH AND EVA
LUAT
ION PRO
JECT
S, 2008 – 2015, M
ARCH
2015 UPD
ATE
INTERV
ENTIONS
TOPIC
TITLE / RE
SEAR
CH GRO
UP
DESCR
IPTION
ASSESSMEN
T FO
R DEP
RESSION,
ANXIETY, AND
SLEEP
DISORD
ERS
TELEPH
ONE‐BA
SED
BEHAV
IORA
L HEA
LTH
ASSESSMEN
T FO
R SENIORS
ON
NEW
PSYCH
OTR
OPIC
MED
ICAT
ION
Beha
vioral Health
Lab
oratory,
Med
ical Schoo
l, University
of
Penn
sylvan
ia
Results from
aPA
CE statew
ide collabo
rative care program
by th
e Be
havioral Health
Laboratory (begun
in 2008) su
pport
concerns re
lated to psychotropic med
ication prescribing in th
e elde
rly and
raise
add
ition
al que
stions abo
ut off‐labe
l or
inapprop
riate prescrib
ing. Overall, 45.0%
of p
articipan
ts did not m
eet criteria fo
r any
men
tal health
disorde
r with
low
symptom
s ind
icated
. (Ab
out 4
2% of P
hase II participants are m
inim
ally sy
mptom
atic.) Just 6% m
et th
e crite
ria fo
r anxiety
disorders. The
stud
y foun
d that older, com
mun
ity dwelling patie
nts received ne
w psychotropic med
ications in
excess o
f what m
ight be expe
cted
based
on their relatively low sy
mptom
burde
n. M
any repo
rted
that th
e prescriptio
n was fo
r a
psycho
social stressor (4
3.8%
), while 15.8%
were un
aware of th
e reason
for the
prescrip
tion.
Interven
tion aims includ
e assigning individu
als with
clin
ically significan
t sym
ptom
s to minim
al m
onito
ring or m
onito
ring
with
care man
agem
ent a
nd social service su
pport in orde
r to de
term
ine whe
ther th
e clinical se
rvices are im
pacting
outcom
es. Outcomes analyses sho
w th
at enh
anced care m
anagem
ent improves sy
mptom
s and
overall functio
ning
relative
to standard m
onito
ring services alone
. The project u
ses intervention protocols that a
ddress persons with
eith
er high or low sy
mptom
measures. In the high
symptom
group
, care managem
ent a
dvice has led
to th
e referral of 3
9 pe
rson
s to specialist care. W
ith low sy
mptom
patie
nts, th
e assessmen
t explores reasons fo
r the
psychotropic med
ication and consideration of disc
ontin
uatio
n after
persisten
ce of m
easured low sy
mptom
s.
Care m
anagem
ent cases are asked
at the
nine week follo
w up ab
out the
ir satisfaction level. The
re is a very high
level of
enrollee satisfaction with
the care m
anagem
ent service (>
95%
satisfaction).
A recent analysis
of p
atient chron
ic pain foun
d sig
nificant d
ifferen
ces in levels of dep
ression, anxiety, and
quality of life
betw
een those who
experience interferen
ce of p
ain versus th
ose who
do no
t. Th
e Be
havioral Health
Lab
oratory also promotes non
‐pha
rmacological interven
tions and
offers assessmen
t and
assistance
with
add
ressing psycho
social stressors prio
r to the use of m
edication therap
y. The
acade
mic detailer in the Ph
ilade
lphia
region
marketed the assessmen
t services to ph
ysicians visited through academ
ic detailing (see
next p
age).
In 2014, se
ven initial assessm
ents were direct re
ferrals from th
e prescribing provider or from th
e PA
CE App
lication Ce
nter.
In 2014, th
e Be
havioral Health
Laboratory completed
736
initial assessm
ents fo
r new
patients a
nd caregivers. The
re were
2,735 follow‐up assessmen
ts with
cardh
olde
rs and
caregivers. A
mon
g them
, 226
cardh
olde
rs re
ceived
care managem
ent
services and
299
cardh
olde
rs re
ceived
symptom
and
med
ication mon
itorin
g services. Fourteen
cardh
olde
rs were referred
to
specialty
men
tal health
services; 19 caregivers participated
in th
e Telehe
alth Edu
catio
n Program fo
r caregivers o
f persons
with
dem
entia
.
FALLS
PREV
ENTION
FALLS‐FR
EE PA
Gradu
ate Scho
ol of P
ublic
Health
, University
of P
ittsburgh
The Ce
nters for Dise
ase Co
ntrol and
Prevention provided
fund
s for th
is tw
o year re
search grant. Re
searchers at th
e Gradu
ate Scho
ol of P
ublic Health
at the
University
of P
ittsburgh
and
the PA
Dep
artm
ent o
f Aging
examined
cou
nty level
falls incide
nce an
d the effect of the
De p
artm
ent’s
Hea
lthy Step
s for Olde r Adu
lts and
Hea
lthy Steps in Motion projects. A
phy sician ed
ucation comp o
n ent i nclud
ed su
rveying ph
ysicians who
see
older adu
lts in
their p
ractice an
d offerin
g mailed
and on
line ed
ucationa
l materials (h
ealth
yaging.pitt.edu
) with
CME/CEU credits. Find
ings from
the evaluatio
n of th
e He
althy Step
s program
s were incorporated
into well‐received Preven
ting Falls Amon
g the Elde
rly m
odule de
velope
d by
the
Inde
pend
ent D
rug Inform
ation Service (ID
IS) for th
e PA
CE Program
’s acade
mic detailing effort in
2014.
9
AC
ADEM
IC
DETAILING
UPD
ATING PHY
SICIAN
S AB
OUT
CHAN
GING THE
RAPIES IN
CO
MPLICAT
ED DISEA
SE STA
TES
The Division of Pha
rmaco‐
epidem
iology and
Pha
rmaco‐
econ
omics o
f the
Brig
ham and
Wom
en’s Hospital/Harvard
Med
ical Schoo
l
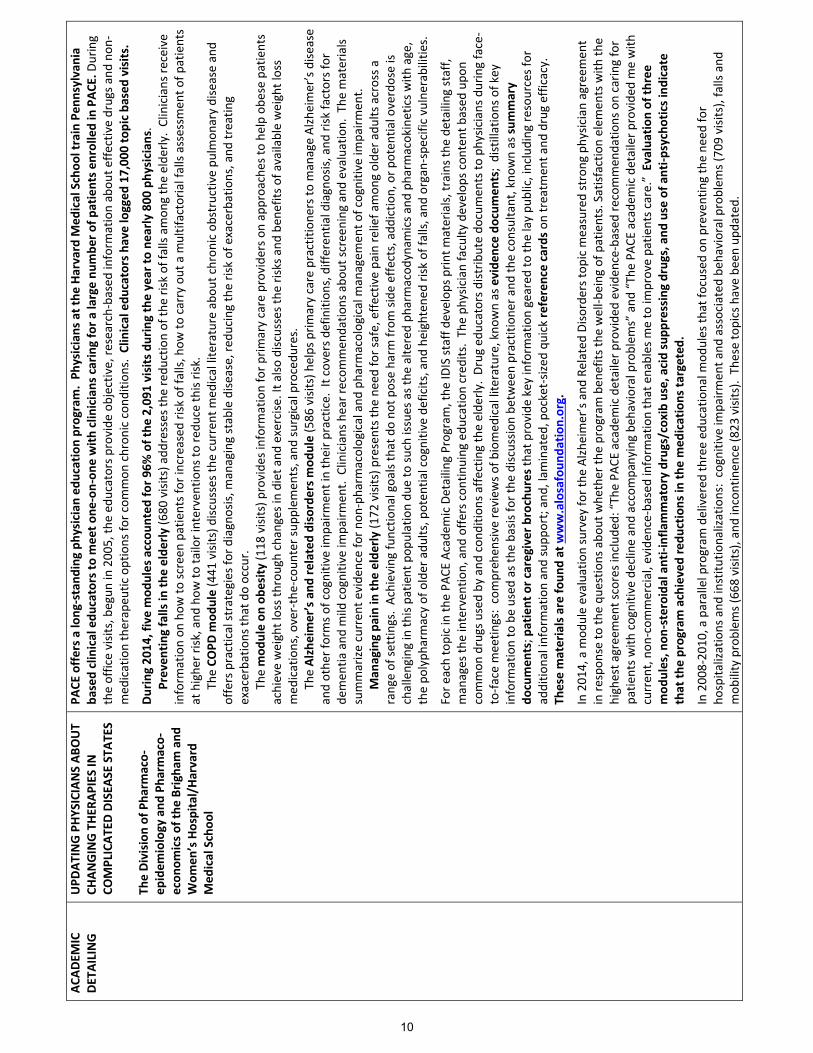
PACE
offersa long
‐stand
ing ph
ysician ed
ucation program. Ph
ysicians at the
Harvard M
edical Schoo
ltrain Pen
nsylvania
based clinical edu
cators to
meet o
ne‐on‐on
e with
clin
icians caring for a
large nu
mbe
r of p
atients en
rolled in PAC
E. During
the office visits, begun
in 2005, th
e ed
ucators p
rovide
objectiv
e, re
search‐based
inform
ation abou
t effe
ctive drugs a
nd non
‐med
ication therapeu
tic options fo
r com
mon
chron
ic con
ditio
ns. Clinical edu
cators have logged
17,000 topic ba
sed visits.
During 2014
, five mod
ules accou
nted
for 9
6% of the
2,091
visits
during the year to
nearly
800
physician
s.
Preventing falls in
the elde
rly (6
80 visits) add
resses th
e redu
ction of th
e risk of falls amon
g the elde
rly. Clinicians re
ceive
inform
ation on
how
to sc
reen
patients for increased risk of falls, how
to carry out a multifactoria
l falls assessmen
t of p
atients
at highe
r risk
, and
how
to ta
ilor interventions to
redu
ce th
is risk.
The
COPD
mod
ule (441
visits) d
iscusses the
current m
edical literature abo
ut chron
ic obstructive pu
l mon
ary disease and
offers practical strategies fo
r diagnosis, m
anaging stable dise
ase, re
ducing
the risk of exacerbations, and
treatin
g exacerbatio
ns th
at do occur.
The
mod
ule on
obe
sity (1
18 visits) p
rovide
s information for p
rimary care provide
rs on approaches to
help ob
ese patie
nts
achieve weight loss throu
gh changes in
diet a
nd exercise
. It a
lso disc
usses the
risks a
nd ben
efits of available weight loss
med
ications, over‐the‐coun
ter sup
plem
ents, and
surgical procedu
res.
The
Alzhe
imer’s and
related disorders m
odule (586
visits) h
elps prim
ary care practition
ers to manage Alzheimer’s dise
ase
and othe
r forms o
f cognitive im
pairm
ent in their p
ractice. It covers d
efinition
s, differen
tial diagnosis, and
risk factors for
demen
tia and
mild
cognitive im
pairm
ent. Clinicians hear recom
men
datio
ns abo
ut sc
reen
ing and evaluatio
n. The
materials
summarize
current evide
nce for n
on‐pharm
acological and
pharm
acological m
anagem
ent o
f cognitive im
pairm
ent.
M
anaging pa
in in
the elde
rly (1
72 visits) p
resents the
need for safe, effe
ctive pain re
lief amon
g olde
r adu
lts across a
range of se
ttings. Achieving functio
nal goals that do no
t pose harm
from
side
effe
cts, add
ictio
n, or p
oten
tial overdose is
challenging in th
is patie
nt pop
ulation du
e to su
ch issues as the
alte
red ph
armacod
ynam
ics a
nd pharm
acokinetics w
ith age,
the po
lyph
armacy of older adu
lts, poten
tial cognitiv
e de
ficits, and
heightene
d risk of falls, and
organ
‐spe
cific vulne
rabilities.
For e
ach topic in th
e PA
CE Acade
mic Detailing Program, the
IDIS staff d
evelop
s prin
t materials, trains th
e de
tailing
staff,
manages th
e interven
tion, and
offe
rs con
tinuing
edu
catio
n cred
its. The ph
ysician faculty
develop
s con
tent based
upo
n common
drugs used by and
con
ditio
ns affe
cting the elde
rly. Drug
edu
cators distrib
ute do
cumen
ts to
physic
ians during face‐
to‐fa
ce m
eetin
gs: comprehen
sive review
s of b
iomed
ical literature, kno
wn as evide
nce do
cumen
ts; distillations of key
inform
ation to be used
as the
basis for the
disc
ussio
n be
tween practitione
r and
the consultant, kno
wn as su
mmary
documen
ts; p
atient or caregiver brochures th
at provide
key inform
ation geared
to th
e lay pu
blic, including
resources for
additio
nal information and supp
ort; and, laminated
, pocket‐sized
quick re
ference cards on
treatm
ent a
nd drug efficacy.
These materials are fo
und at www.alosafoun
datio
n.org.
In 2014, a m
odule evaluatio
n survey fo
r the
Alzh
eimer’s and
Related
Diso
rders top
ic m
easured strong
physic
ian agreem
ent
in re
spon
se to
the qu
estio
ns abo
ut whe
ther th
e program ben
efits th
e well‐b
eing
of p
atients. Satisfactio
n elem
ents with
the
highest a
greemen
t scores include
d: “The PA
CE acade
mic detailer p
rovide
d eviden
ce‐based
recommen
datio
ns on carin
g for
patie
nts w
ith cognitive de
cline and accompanying be
havioral problem
s” and
“The PA
CE acade
mic detailer p
rovide
d me with
curren
t, no
n‐commercial, evide
nce‐based inform
ation that enables m
e to im
prove patie
nts c
are.” Evaluation of th
ree
mod
ules, n
on‐steroidal anti‐inflammatory drugs/coxib use, acid supp
ressing drugs, and
use of a
nti‐p
sychotics indicate
that th
e program achieved redu
ctions in
the med
ications ta
rgeted
. In 2008‐2010, a parallel program
delivered
three ed
ucational m
odules th
at fo
cused on
preventing the ne
ed fo
r ho
spita
lizations and
institu
tionalizations: cognitive im
pairm
ent a
nd associated be
havioral problem
s (709 visits), falls and
mob
ility problem
s (668 visits), and
incontinen
ce (8
23 visits). The
se to
pics have be
en upd
ated
.
10

GEN
ERAL
PRO
GRA
M ASSESSM
ENTS
TOPIC
TITLE / RE
SEAR
CH GRO
UP
DESCR
IPTION
IMPR
OVE
D
HEA
LTH
STAT
US AN
D
AVOIDAN
CE
OF NURS
ING
HOME EN
TRY
AND LAT
ER
ENTR
Y INTO
WAIVE
R PR
OGRA
MS
PACE
ENRO
LLMEN
T PR
OVIDE
S AD
VANTA
GE FO
R LO
W
INCO
ME, PRE
‐MED
ICAID
SENIORS
Pe
nnsylvan
ia Dep
artm
ents of
Aging an
d Pu
blic W
elfare,
Office of Lon
g Term
Living,
Magellan Health
Services/PAC
E, M
ercer
Governm
ent H
uman
Services
Consultin
g, and
the Health
Po
licy Institu
te at G
eorgetow
n University
A 2010
analysis
dem
onstrates that the
PAC
E Program su
pports m
any seniors p
rior to their M
edicaid en
rollm
ent. Da
ta
compare con
sumers w
ho “had” and
“did no
t have” PAC
E in a five year p
eriod prior to using long
‐term care or nursin
g waiver
services. Re
sults
suggest P
ACE en
rollm
ent e
nables sen
iors to
remain in th
e commun
ity longer, w
ith better h
ealth
, and
to
delay en
try into and
utilization of long
‐term care an
d waiver services. Findings include
:
Average length of n
ursin
g facility stay over a
5‐year p
eriod was 40 days less fo
r previou
s PAC
E en
rolled.
PA
CE m
embe
rs were olde
r at e
ntry into a nursin
g facility by
2.8 years.
The ages at w
aiver e
ntry sh
ow PAC
E mem
bers were olde
r by 3.1 years.
Later a
ge of e
ntry into nursin
g facilities p
rovide
d an
estim
ated
ann
ual savings of $
728.8 M.
De
ferred
waiver p
rogram
produ
ced estim
ated
ann
ual savings of $
86.5 M
.
PACE
enrollees who
have subseq
uent M
edicaid en
rollm
ent h
ave lower costs as a
result of earlier P
ACE coverage.
The Program ta
kes a
dvantage of its ideal position
to edu
cate th
ose PA
CE se
niors, who
are sp
ecifically kno
wn to be
income eligible, abo
ut th
e compreh
ensiv
e he
alth care coverage available through Med
icaid, produ
cing
a uniq u
e,
efficient outreach and im
proved
coo
rdination with
Med
icaid.
Analysts at M
ercer G
overnm
ent H
uman
Services C
onsulting
evaluated
the stud
y and were prep
ared
to certify results.
SATISFAC
TION
SURV
EYS
PACE
/PAC
ENET
SURV
EY ON
HEA
LTH AND W
ELL‐BE
ING
Magellan Health
Services/PA
CE
The Survey on Hea
lth and
Well‐B
eing
provides inform
ation ab
out the
cardh
olde
r pop
ulation. Q
uestions m
easure
cardho
lders’ self‐rep
orted he
alth status, self‐rep
orted med
ication ad
herence an
d affordab
ility, and
satisfaction with
their
PACE
/PAC
ENET
coverage. Survey da
ta are freq
uently link
ed with
other im
portan
t data sources, in
clud
ing prescriptio
n records, M
edicare services re
cords, and
vita
l statistics records, and
are used for p
rogram
evaluation an
d original re
search
stud
ies. Include
d in th
e PA
CE/PAC
ENET new
enrollm
ent a
pplication, th
e op
tional survey gathers impo
rtant information
abou
t a person’s h
ealth
immed
iately prio
r to joining PA
CE. The op
tional ren
ewal su
rvey is m
ailed to existing cardho
lders
througho
ut th
e year. Most ren
ewal su
rvey que
stions are th
e same as th
e ne
w enrollm
ent survey, but a fe
w questions are
diffe
rent. It provides im
portant information abou
t the
cardh
olde
r’s health
after being
in PAC
E. A
nnual upd
ates allow th
e stud
y of changes in
health
over tim
e. The
revised respon
se ra
te (after re
moval of 3
,324
deceased cardho
lders) was 49.9%
for
the 2012
rene
wal su
rvey.
Results
from
5% Ran
dom Sam
ple: N
early
31%
of current re
spon
dents ind
icated
that th
ey did not com
plete high
scho
ol with
11
% of current re
spon
dents ind
icating that th
ey had
an 8t
h grade or less edu
catio
n. U
nderstanding
the ed
ucational
backgrou
nd of the
pop
ulation he
lps to en
sure th
at cardh
olde
r com
mun
ications are at a
n approp
riate re
ading level. Amon
g cardho
lders w
ho were en
rolled in PAC
E at th
e tim
e that th
ey com
pleted
the survey, 88%
repo
rted
that th
ey were either
“extremely” or “qu
ite a bit”
satisfie
d with
PAC
E. A
mon
g PA
CENET
enrolled cardho
lders, 78%
were “extremely” or “qu
ite a
bit” sa
tisfie
d with
PAC
ENET. An
othe
r 9% of P
ACE en
rollees and
15%
of P
ACEN
ET enrollees were “m
oderately” sa
tisfie
d.
These data indicate high levels of sa
tisfaction with
both Programs. Cardh
olde
rs who
respon
ded to th
e survey also
expressed
a high
degree of sa
tisfaction with
the combinatio
n of PAC
E/PA
CENET and
Med
icare Part D by scoring a high
average
satisfaction that ra
nged
between strongly and
somew
hat a
gree
that th
e combinatio
n works well for th
em (1
.3 fo
r PAC
E and
1.5 for P
ACEN
ET on a 4.0 scale).
Nearly
41%
of respo
nden
ts se
lf‐repo
rted
a fa
ll in th
e pa
st year, with
abo
ut 12%
of respo
nden
ts indicatin
g more than
one
fall an
d at least o
ne injury due
to th
e fall. For global self‐rated
health
, 38%
of respo
nden
ts had
fair or poo
r health
. PA
CENET cardh
olde
rs re
port “no
t filling prescriptio
ns due
to cost” m
ore freq
uently th
an PAC
E cardho
lders w
ith 12%
of the
m
not filling a prescriptio
n tw
o or m
ore tim
es in
the past year com
pared to 7% fo
r PAC
E. PAC
E cardho
lders h
ave lower cost
sharing.
11

SELF‐RAT
ED
HEA
LTH
IMPA
CT OF VA
NTA
GE PO
INT
ON THE AS
SOCIAT
ION
BETW
EEN SELF‐RA
TED HEA
LTH
AND M
ORT
ALITY
Magellan Health
Services/PA
CE
and Th
e Med
icine, Health
, and
Ag
ing Project a
t Pen
n State
University
Num
erou
s studies dem
onstrate th
at se
lf‐rated he
alth predicts m
ortality. The
goa
l of this s
tudy
was to
explore how
self‐
ratin
g vantage po
int a
ffects m
ortality pred
ictio
n. Sub
jects include
d 137,188 PA
CE enrollees.
Three self‐rated he
alth van
tage points were used
: glob
al, age‐com
parativ
e (others o
f sam
e age) and
time compa
rativ
e (present vs. one
year a
go). M
ultiv
ariate Cox propo
rtional‐h
azards re
gressio
n was used to predict su
bseq
uent m
ortality over
two years, con
trolling for d
emograph
ics a
nd m
edication‐based comorbidity.
Whe
n comparin
g glob
al and
age‐com
parative ratin
gs, 73%
of p
ersons re
ported
equ
al global and
age‐com
parativ
e scores;
19% had
age‐com
parative scores th
at exceede
d glob
al sc
ores; and
, 8% indicated age‐comparative scores worse th
an global.
Age comparative scores worse th
an global increased
risk of m
ortality, while age‐com
parativ
e scores ex ceeding
global scores
redu
ced risk. The
impact of age‐com
parati ve de
viation from
global w
as stronger in
yo u
nger age grou p
s. Con
trolling for
glob
al se
lf‐rated he
alth, self‐a
ssessed change over the
past year in either dire
ction increased mortality risk, but th
e effect
varie
d by age (interactio
n p < .001), with
the greatest im
pact observed am
ong youn
ger e
lderly aged 65
‐79.
These results
suggest tha
t com
parativ
e ratin
gs are particularly useful w
hen used
alongside
globa
l ratings, and
that
potential age differen
ces in van
tage
point m
eaning
may have a be
aring on
mortality pred
ictio
n.
BERE
AVEM
ENT
AND
MORT
ALITY
MORT
ALITY FO
LLOWING
WIDOWHOOD:
THE RO
LE OF PR
IOR SPOUSA
L HEA
LTH
Magellan Health
Services/PAC
E, The
Med
icine,
Health
, and
Aging
Project at
Penn
State University
, and
Em
ory University
Rollin
s Scho
ol
of Pub
lic Health
Prior research has sho
wn that widow
hood
is associated with
increased mortality risk; how
ever, it is n
ot clear whe
ther th
e rapidity of the
prede
ceased
spou
se’s health
decline affects this risk
. Th
is stud
y used
group
‐based
trajectory m
odeling to
describ
e pred
eceased spou
ses’ patterns of health
declin
e, and
examined
associatio
ns with
post‐widow
hood
survival.
Subjects includ
ed 9,967
PAC
E/PA
CENET cardh
olde
rs who
were widow
ed between 2000
and
2006. The
prede
ceased
and
be
reaved
spou
ses’ health
trajectorie
s in the year before widow
hood
were evaluated for three
measures: the
Com
bine
d Co
morbidity Score, inp
atient hospitalized
days, and
ambu
latory visits. Multivariate Cox propo
rtional hazards m
odels w
ere
used
to evaluate whe
ther th
e pred
eceased spou
se’s pattern of h
ealth
decline affected
the subseq
uent su
rvival of the
be
reaved
spou
se, w
hile con
trolling for the
bereaved spou
se’s own historical health
trajectory and
other factors.
Multip
le trajectory patterns o
f health
decline be
fore death emerged in th
e pred
eceased sample. A
mon
g pred
eceased
hospice users, stable low and
late onset com
orbidity patterns w
ere bo
th associated with
greater m
ortality in th
e be
reaved
, relative to chron
ic high comorbidity (H
R=1.47
and
1.62, re
spectiv
ely). Re
lative to stable m
edium levels of ambu
latory visits
amon
g the predeceased, chron
ically high visit levels were associated
with
a lower m
ortality rate in
the be
reaved
(HR=
0.67),
while very low visit levels w
ere associated
with
highe
r post‐widow
hood
mortality in th
e be
reaved
(HR=
1.32).
These results
dem
onstrate th
e utility of group
‐based
trajectory m
odels for describing pa
tterns of e
nd‐of‐life
declin
e, and
suggest tha
t una
nticipated
deaths m
ay be associated
with
greater post‐widow
hood
mortality risk for b
ereaved spou
ses.
OUTR
EACH
PA
CE APP
LICA
TION CEN
TER
Bene
fits D
ata Trust,
Philade
lphia
The PA
CE App
lication Ce
nter con
ducts d
ata‐driven
outreach and application assistance to con
nect Pen
nsylvanians w
ith
public ben
efit programs. The
Cen
ter sub
mits PAC
E applications fo
r eligible persons and
enrolls eligible persons in
the
Med
icare Part D Low
Income Subsidy (Extra Help). In 2014, th
e Ce
nter con
ducted
mail, teleph
one, and
com
mun
ity‐based
ou
treach. In one
year, 26
,583
sen
ior h
ouseho
lds ap
pli ed for a
t least one
ben
efit, delivering $89.3 million in ben
efits.
PACE
Enrollm
ent O
utreach: The
Cen
ter u
ses P
rope
rty Tax and Re
nt Reb
ate rolls, and
ene
rgy, fo
od and
prescrip
tion
assistance listin
gs to
iden
tify en
rollm
ent candidates. In 2014, the
re were 351,563 ou
treach atte m
pts u
n iqu
e to PAC
E an
d 15
,21 6
PAC
E a p
plications su
bmitted
.
Low In
come Subsidy (LIS) O
utreach: The
PAC
E Program, by wrapp
ing arou
nd th
e Part D ben
efit, incurs costs th
at cou
ld be
offset by LIS be
nefits w
hich provide
financial help to low income en
rollees. In 2014, th
e Ce
nter su
bmitted
8,128
ap
plications on be
half of older Pen
nsylvanian
s, as a
result of 73,549 LIS ou
treach actions.
12

MED
ICAT
ION UTILIZA
TION STU
DIES
TOPIC
TITLE / RE
SEAR
CH GRO
UP
DESCR
IPTION
MED
ICAT
ION
ADHER
ENCE
AN
D HEA
LTH
OUTC
OMES
PROTO
N PUMP INHIBITO
R AD
HER
ENCE
AND FRA
CTURE
RISK
IN THE ELDER
LY
Magellan Health
Services/PA
CE
and Th
e Med
icine, Health
, and
Ag
ing Project a
t Pen
n State
University
Results of several re
cent stud
ies suggest th
at long
‐term use of p
roton pu
mp inhibitors (P
PIs) m
ay be associated
with
an
increased risk of fracture. The
goa
l of this s
tudy
was to
examine the relatio
nship be
tween med
ication ad
herence and
fracture risk amon
g elde
rly PPI users. The
stud
y coho
rt includ
ed 1,604
com
mun
ity‐dwelling PP
I users and
23,672 no
n‐users
who
were en
rolled in th
e PA
CE Program
. Prop
ortio
n of Days C
overed
(PDC
) was com
puted to m
easure adh
eren
ce based
on prescriptio
n refill patterns. Tim
e‐de
pend
ent C
ox propo
rtional hazards m
odels w
ere used
to estim
ate adjusted
hazard ratio
s of P
PI use/adh
eren
ce fo
r fracture
risk while con
trolling for d
emograph
ics, com
orbidity, bod
y mass ind
ex, smoking and no
n‐PP
I med
ication use. The
overall
incide
nce of any fracture per 100
person‐years w
as 8.7 fo
r PPI users and
5.0 fo
r non
‐users. A gradient in
fracture risk
according to PPI adh
eren
ce was observed. Relative to non
‐users, fracture hazard ra
tios a
ssociated with
the highest
adhe
rence (PDC
> 0.80), intermed
iate (P
DC 0.40‐0.79), and lowest (PD
C < 0.40) adh
eren
ce levels were 1.46
(p < 0.0001), 1.30
(p = 0.02), and
0.95 (p = 0.75), respe
ctively.
These results
provide
furthe
r evide
nce that PPI use m
ay increase risk in
the elde
rly, and
highlight th
e ne
ed fo
r clin
icians to
pe
riodically re
assess elderly patients’ individu
alized
needs fo
r ongoing
PPI th
erap
y, while weighing po
tential risks and
be
nefits. The
find
ings were pu
blish
ed in
Calcified Tissue
Internationa
l in Ap
ril 2014.
STAT
IN USE
ASSO
CIAT
ION BETWEEN
STAT
IN USE AND FRA
CTURE
RISK
AMONG THE ELDER
LY
Magellan Health
Services/PA
CE
and Th
e Med
icine, Health
, and
Ag
ing Project a
t Pen
n State
University
The im
pact of statin
s (widely used
to treat h
yperlipidem
ia)o
n fracture risk is still und
er deb
ate. The
goa
l of this s
tudy
was to
exam
ine the association be
tween statin use and
fracture risk amon
g the elde
rly by follo
wing 5,524 ne
w statin
users and
27
,089
non
‐users fo
r an average of 3.5 years.
Time‐de
pend
ent C
ox propo
rtional hazards m
odels w
ere used
to estim
ate adjusted
hazard ratio
s of statin
use fo
r fracture risk
while con
trolling for d
emograph
ics, com
orbidity, bod
y mass ind
ex, smoking status, alcoh
ol use, and
certain th
erapeu
tic
classes. The
incide
nce of any
fracture per 100
person‐years was 3.0 fo
r statin
users and
7.8 fo
r non
‐users. Re
lativ
e to non
‐users, th
e ha
zard ra
tio associated with
statin use was 0.86 (p < 0.001
). Statin
users with
highe
r and
lower average daily
dos e were associated
with
18%
and
9% decreased
fracture risk, respe
ctively.
The ha
zard ra
tio fo
r atorvastatin
was 0.81 (p < 0.001
), an
d the effects w
ere no
t significan
t for sim
vastatin and
pravastatin.
The protectiv
e effect of statin
user a
ppeared to be stronger amon
g users olde
r tha
n 85
years old. These results su
ggested
statin use is associated with
redu
ced fracture risk amon
g the elde
rly, and
the effect m
ay be de
pend
ent o
n age and statin
type
. The be
neficial effe
ct of statin
on bo
ne m
ay be he
lpful in the preven
tion of fractures a
mon
g elde
rly.
13

14

SECTION 2
FINANCIAL DATA
BY DATE OF SERVICE
15

16

TA
BL
E 2
.1A
HIS
TO
RIC
AL
CL
AIM
AN
D E
XP
EN
DIT
UR
E D
AT
A F
OR
PA
CE
EN
RO
LL
ED
AN
D P
AR
TIC
IPA
TIN
G C
AR
DH
OL
DE
RS
BY
SE
MI-
AN
NU
AL
PE
RIO
D B
AS
ED
ON
DA
TE
OF
SE
RV
ICE
JAN
UA
RY
199
1 -
DE
CE
MB
ER
201
4
PA
GE
1
CLA
IMS
PE
RC
LAIM
S P
ER
AV
ER
AG
E
SE
MI-
AN
NU
AL
EN
RO
LLE
DP
AR
TIC
IPA
TIN
GT
OT
AL
EN
RO
LLE
DP
AR
TIC
IPA
TIN
GT
OT
AL
ST
AT
E S
HA
RE
PE
RIO
DC
AR
DH
OLD
ER
SC
AR
DH
OLD
ER
SC
LAIM
SC
AR
DH
OLD
ER
CA
RD
HO
LDE
RE
XP
EN
DIT
UR
ES
PE
R C
LAIM
JAN
-JU
N 1
991
405,
358
337,
684
5,28
0,37
613
.03
15.6
4$1
16,0
74,6
18$2
86.3
5$3
43.7
4$2
1.98
JUL-
DE
C 1
991
394,
055
324,
574
4,67
7,15
911
.87
14.4
1$1
09,8
71,6
50$2
78.8
2$3
38.5
1$2
3.49
JAN
-JU
N 1
992
399,
721
326,
469
4,65
6,98
611
.65
14.2
6$1
16,0
82,5
06$2
90.4
1$3
55.5
7$2
4.93
JUL-
DE
C 1
992
385,
103
313,
430
4,60
2,26
111
.95
14.6
8$1
17,0
81,6
02$3
04.0
3$3
73.5
5$2
5.44
JAN
-JU
N 1
993
376,
916
310,
438
4,40
2,17
111
.68
14.1
8$1
13,0
68,7
54$2
99.9
8$3
64.2
2$2
5.68
JUL-
DE
C 1
993
357,
777
296,
802
4,45
6,22
312
.46
15.0
1$1
16,1
64,3
81$3
24.6
8$3
91.3
9$2
6.07
JAN
-JU
N 1
994
354,
819
293,
462
4,32
0,15
912
.18
14.7
2$1
15,4
13,5
42$3
25.2
7$3
93.2
8$2
6.72
JUL-
DE
C 1
994
340,
607
281,
465
4,40
4,25
712
.93
15.6
5$1
19,1
00,7
41$3
49.6
7$4
23.1
5$2
7.04
JAN
-JU
N 1
995
331,
965
277,
461
4,38
3,96
813
.21
15.8
0$1
21,1
47,2
11$3
64.9
4$4
36.6
3$2
7.63
JUL-
DE
C 1
995
317,
719
263,
576
4,34
7,33
513
.68
16.4
9$1
22,1
58,8
72$3
84.4
9$4
63.4
7$2
8.10
JAN
-JU
N 1
996
306,
062
253,
283
4,24
4,19
013
.87
16.7
6$1
20,8
68,6
54$3
94.9
2$4
77.2
1$2
8.48
JUL-
DE
C 1
996
292,
755
238,
963
4,20
4,46
114
.36
17.5
9$1
20,4
29,8
40$4
11.3
7$5
03.9
7$2
8.64
JAN
-JU
N 1
997
286,
126
236,
157
4,28
6,47
814
.98
18.1
5$1
16,7
32,8
47$4
07.9
8$4
94.3
0$2
7.23
JUL-
DE
C 1
997
276,
180
226,
806
4,35
8,89
215
.78
19.2
2$1
23,4
82,0
56$4
47.1
1$5
44.4
4$2
8.33
JAN
-JU
N 1
998
267,
225
222,
465
4,23
5,61
915
.85
19.0
4$1
26,8
72,5
48$4
74.7
8$5
70.3
0$2
9.95
JUL-
DE
C 1
998
257,
009
213,
694
4,33
1,39
016
.85
20.2
7$1
37,1
46,4
44$5
33.6
3$6
41.7
9$3
1.66
JAN
-JU
N 1
999
246,
467
208,
992
4,31
6,58
817
.51
20.6
5$1
42,4
12,9
78$5
77.8
2$6
81.4
3$3
2.99
JUL-
DE
C 1
999
238,
388
200,
921
4,45
0,89
318
.67
22.1
5$1
53,5
96,6
48$6
44.3
1$7
64.4
6$3
4.51
JAN
-JU
N 2
000
237,
017
202,
683
4,44
9,10
218
.77
21.9
5$1
60,6
15,3
39$6
77.6
5$7
92.4
5$3
6.10
JUL-
DE
C 2
000
230,
752
197,
777
4,53
0,82
919
.64
22.9
1$1
69,8
86,4
76$7
36.2
3$8
58.9
8$3
7.50
JAN
-JU
N 2
001
225,
325
197,
082
4,55
8,33
920
.23
23.1
3$1
78,6
50,9
79$7
92.8
6$9
06.4
8$3
9.19
JUL-
DE
C 2
001
218,
576
190,
540
4,59
0,21
621
.00
24.0
9$1
87,8
20,5
34$8
59.2
9$9
85.7
3$4
0.92
JAN
-JU
N 2
002
216,
719
190,
131
4,55
8,00
021
.03
23.9
7$1
94,7
88,8
89$8
98.8
1$1
,024
.50
$42.
74
JUL-
DE
C 2
002
209,
737
183,
318
4,60
5,90
621
.96
25.1
3$2
03,5
91,4
48$9
70.7
0$1
,110
.59
$44.
20
JAN
-JU
N 2
003
209,
761
182,
654
4,55
2,66
221
.70
24.9
3$2
08,1
03,6
30$9
92.1
0$1
,139
.33
$45.
71
JUL-
DE
C 2
003
207,
144
180,
460
4,68
3,17
322
.61
25.9
5$2
21,5
12,8
77$1
,069
.37
$1,2
27.4
9$4
7.30
JAN
-JU
N 2
004
215,
486
189,
762
4,67
5,69
921
.70
24.6
4$2
09,7
31,9
50$9
73.3
0$1
,105
.24
$44.
86
EX
PE
ND
ITU
RE
S
PE
R E
NR
OLL
ED
CA
RD
HO
LDE
R
EX
PE
ND
ITU
RE
S
PE
R P
AR
TIC
IPA
TIN
G
CA
RD
HO
LDE
R
17
TA
BL
E 2
.1A
HIS
TO
RIC
AL
CL
AIM
AN
D E
XP
EN
DIT
UR
E D
AT
A F
OR
PA
CE
EN
RO
LL
ED
AN
D P
AR
TIC
IPA
TIN
G C
AR
DH
OL
DE
RS
BY
SE
MI-
AN
NU
AL
PE
RIO
D B
AS
ED
ON
DA
TE
OF
SE
RV
ICE
JAN
UA
RY
199
1 -
DE
CE
MB
ER
201
4
PA
GE
2
CLA
IMS
PE
RC
LAIM
S P
ER
AV
ER
AG
E
SE
MI-
AN
NU
AL
EN
RO
LLE
DP
AR
TIC
IPA
TIN
GT
OT
AL
EN
RO
LLE
DP
AR
TIC
IPA
TIN
GT
OT
AL
ST
AT
E S
HA
RE
PE
RIO
DC
AR
DH
OLD
ER
SC
AR
DH
OLD
ER
SC
LAIM
SC
AR
DH
OLD
ER
CA
RD
HO
LDE
RE
XP
EN
DIT
UR
ES
PE
R C
LAIM
EX
PE
ND
ITU
RE
S
PE
R E
NR
OLL
ED
CA
RD
HO
LDE
R
EX
PE
ND
ITU
RE
S
PE
R P
AR
TIC
IPA
TIN
G
CA
RD
HO
LDE
R
JUL-
DE
C 2
004
209,
237
183,
970
4,63
9,59
422
.17
25.2
2$1
78,1
65,4
48$8
51.5
0$9
68.4
5$3
8.40
JAN
-JU
N 2
005
209,
512
182,
450
4,60
2,80
221
.97
25.2
3$1
66,4
96,0
79$7
94.6
9$9
12.5
6$3
6.17
JUL-
DE
C 2
005
203,
956
177,
667
4,62
8,80
922
.70
26.0
5$2
08,6
31,7
07$1
,022
.93
$1,1
74.2
9$4
5.07
JAN
-JU
N 2
006
199,
426
172,
092
4,48
2,46
122
.48
26.0
5$1
96,3
69,2
22$9
84.6
7$1
,141
.07
$43.
81
JUL-
DE
C 2
006
194,
884
164,
174
4,07
1,75
520
.89
24.8
0$1
26,4
33,8
82$6
48.7
6$7
70.1
2$3
1.05
JAN
-JU
N 2
007
203,
104
167,
796
3,61
9,45
617
.82
21.5
7$8
1,20
2,59
5$3
99.8
1$4
83.9
4$2
2.44
JUL-
DE
C 2
007
183,
839
150,
273
3,48
7,88
218
.97
23.2
1$9
8,98
4,30
5$5
38.4
3$6
58.7
0$2
8.38
JAN
-JU
N 2
008
164,
728
133,
656
3,01
4,59
618
.30
22.5
5$7
0,09
6,78
1$4
25.5
3$5
24.4
6$2
3.25
JUL-
DE
C 2
008
160,
802
125,
319
2,87
8,01
717
.90
22.9
7$7
6,07
0,50
0$4
73.0
7$6
07.0
1$2
6.43
JAN
-JU
N 2
009
145,
634
119,
773
2,68
2,43
618
.42
22.4
0$5
5,42
6,88
9$3
80.5
9$4
62.7
7$2
0.66
JUL-
DE
C 2
009
141,
988
114,
169
2,54
6,78
117
.94
22.3
1$6
3,03
5,61
4$4
43.9
5$5
52.1
3$2
4.75
JAN
-JU
N 2
010
138,
520
113,
130
2,37
9,42
717
.18
21.0
3$5
6,13
1,54
0$4
05.2
2$4
96.1
7$2
3.59
JUL-
DE
C 2
010
134,
104
106,
535
2,17
5,10
616
.22
20.4
2$6
1,57
2,76
7$4
59.1
4$5
77.9
6$2
8.31
JAN
-JU
N 2
011
128,
440
103,
356
2,22
1,68
017
.30
21.5
0$4
5,30
7,89
8$3
52.7
6$4
38.3
7$2
0.39
JUL-
DE
C 2
011
125,
096
98,2
652,
061,
534
16.4
820
.98
$42,
777,
764
$341
.96
$435
.33
$20.
75
JAN
-JU
N 2
012
119,
166
95,4
072,
091,
129
17.5
521
.92
$42,
297,
874
$354
.95
$443
.34
$20.
23
JUL-
DE
C 2
012
116,
822
91,0
201,
943,
206
16.6
321
.35
$37,
252,
376
$318
.88
$409
.28
$19.
17
JAN
-JU
N 2
013
114,
935
88,4
421,
904,
685
16.5
721
.54
$36,
975,
064
$321
.70
$418
.07
$19.
41
JUL-
DE
C 2
013
109,
907
83,7
561,
767,
781
16.0
821
.11
$35,
191,
933
$320
.20
$420
.17
$19.
91
JAN
-JU
N 2
014
119,
491
90,2
231,
810,
547
15.1
520
.07
$36,
412,
429
$304
.73
$403
.58
$20.
11
JUL-
DE
C 2
014
117,
577
87,6
271,
730,
400
14.7
219
.75
$39,
226,
755
$333
.63
$447
.66
$22.
67
SO
UR
CE
: P
DA
/CA
RD
HO
LDE
R F
ILE
, CLA
IMS
HIS
TO
RY
NO
TE
S:
DA
TA
INC
LUD
E O
RIG
INA
L, P
AID
CLA
IMS
BY
DA
TE
OF
SE
RV
ICE
, EX
CLU
DE
PA
CE
NE
T C
LAIM
S.
XX
XX
XX
EN
RO
LLE
D C
AR
DH
OLD
ER
S A
RE
TH
OS
E E
NR
OLL
ED
FO
R A
NY
PO
RT
ION
OF
TH
E R
EP
OR
TE
D P
ER
IOD
.
XX
XX
XX
PA
RT
ICIP
AT
ING
CA
RD
HO
LDE
RS
AR
E C
AR
DH
OLD
ER
S W
ITH
ON
E O
R M
OR
E A
PP
RO
VE
D C
LAIM
S D
UR
ING
TH
E R
EP
OR
TE
D P
ER
IOD
.
18

TA
BL
E 2
.1B
HIS
TO
RIC
AL
CL
AIM
AN
D E
XP
EN
DIT
UR
E D
AT
A F
OR
PA
CE
NE
T E
NR
OL
LE
D A
ND
PA
RT
ICIP
AT
ING
CA
RD
HO
LD
ER
SB
Y S
EM
I-A
NN
UA
L P
ER
IOD
BA
SE
D O
N D
AT
E O
F S
ER
VIC
EJU
LY
199
6 -
DE
CE
MB
ER
201
4
PA
GE
1
EX
PE
ND
ITU
RE
SP
ER
SE
MI-
AN
NU
AL
EN
RO
LLE
DP
AT
ING
TO
TA
LE
NR
OLL
ED
PA
TIN
GT
OT
AL
PE
R E
NR
OLL
ED
PA
RT
ICIP
AT
ING
PE
RIO
DC
AR
DH
OLD
ER
SC
AR
DH
OLD
ER
SC
LAIM
SC
AR
DH
OLD
ER
CA
RD
HO
LDE
RE
XP
EN
DIT
UR
ES
CA
RD
HO
LDE
RC
AR
DH
OLD
ER
JUL-
DE
C 1
996
1,52
374
02,
331
1.53
3.15
$823
$0.5
4$1
.11
$0.3
5
JAN
-JU
N 1
997
9,06
36,
369
75,7
218.
3511
.89
$592
,426
$65.
37$9
3.02
$7.8
2
JUL-
DE
C 1
997
12,5
239,
007
149,
187
11.9
116
.56
$2,6
76,2
59$2
13.7
1$2
97.1
3$1
7.94
JAN
-JU
N 1
998
18,0
5312
,683
175,
085
9.70
13.8
0$2
,909
,397
$161
.16
$229
.39
$16.
62
JUL-
DE
C 1
998
18,6
7313
,804
232,
846
12.4
716
.87
$4,7
38,1
27$2
53.7
4$3
43.2
4$2
0.35
JAN
-JU
N 1
999
22,2
7216
,649
263,
010
11.8
115
.80
$5,5
19,3
95$2
47.8
2$3
31.5
2$2
0.99
JUL-
DE
C 1
999
22,1
8716
,885
309,
280
13.9
418
.32
$7,4
16,8
66$3
34.2
9$4
39.2
6$2
3.98
JAN
-JU
N 2
000
25,7
3919
,762
339,
481
13.1
917
.18
$8,3
71,6
58$3
25.2
5$4
23.6
2$2
4.66
JUL-
DE
C 2
000
25,4
4619
,630
381,
074
14.9
819
.41
$10,
193,
859
$400
.61
$519
.30
$26.
75
JAN
-JU
N 2
001
29,5
2222
,146
412,
077
13.9
618
.61
$11,
255,
086
$381
.24
$508
.22
$27.
31
JUL-
DE
C 2
001
29,2
7823
,284
477,
954
16.3
220
.53
$13,
849,
683
$473
.04
$594
.82
$28.
98
JAN
-JU
N 2
002
35,5
0827
,594
540,
878
15.2
319
.60
$16,
333,
097
$459
.98
$591
.91
$30.
20
JUL-
DE
C 2
002
36,1
4628
,611
613,
528
16.9
721
.44
$20,
069,
086
$555
.22
$701
.45
$32.
71
JAN
-JU
N 2
003
39,2
6331
,011
644,
800
16.4
220
.79
$21,
627,
367
$550
.83
$697
.41
$33.
54
JUL-
DE
C 2
003
40,1
4831
,869
720,
687
17.9
522
.61
$25,
653,
456
$638
.97
$804
.97
$35.
60
JAN
-JU
N 2
004
93,8
6172
,605
1,30
5,26
613
.91
17.9
8$4
8,95
8,31
9$5
21.6
0$6
74.3
1$3
7.51
JUL-
DE
C 2
004
105,
018
82,6
311,
921,
310
18.3
023
.25
$71,
800,
234
$683
.69
$868
.93
$37.
37
JAN
-JU
N 2
005
123,
399
94,9
792,
176,
264
17.6
422
.91
$81,
372,
126
$659
.42
$856
.74
$37.
39
JUL-
DE
C 2
005
125,
108
99,2
422,
450,
953
19.5
924
.70
$96,
448,
835
$770
.92
$971
.86
$39.
35
JAN
-JU
N 2
006
134,
715
108,
462
2,70
8,71
020
.11
24.9
7$1
00,4
73,8
23$7
45.8
3$9
26.3
5$3
7.09
JUL-
DE
C 2
006
141,
099
109,
867
2,68
4,51
519
.03
24.4
3$7
7,09
3,60
0$5
46.3
8$7
01.7
0$2
8.72
JAN
-JU
N 2
007
162,
966
127,
001
2,63
0,62
916
.14
20.7
1$5
9,09
4,94
3$3
62.6
2$4
65.3
1$2
2.46
JUL-
DE
C 2
007
147,
627
116,
369
2,68
7,88
818
.21
23.1
0$8
5,50
6,49
9$5
79.2
1$7
34.7
9$3
1.81
JAN
-JU
N 2
008
176,
161
136,
910
2,95
0,98
816
.75
21.5
5$6
8,07
2,71
4$3
86.4
2$4
97.2
1$2
3.07
PA
RT
ICI-
AV
ER
AG
ES
TA
TE
SH
AR
EP
ER
CLA
IM
CLA
IMS
PE
RC
LAIM
S P
ER
PA
RT
ICI-
EX
PE
ND
ITU
RE
S
19

TA
BL
E 2
.1B
HIS
TO
RIC
AL
CL
AIM
AN
D E
XP
EN
DIT
UR
E D
AT
A F
OR
PA
CE
NE
T E
NR
OL
LE
D A
ND
PA
RT
ICIP
AT
ING
CA
RD
HO
LD
ER
SB
Y S
EM
I-A
NN
UA
L P
ER
IOD
BA
SE
D O
N D
AT
E O
F S
ER
VIC
EJU
LY
199
6 -
DE
CE
MB
ER
201
4
PA
GE
2
EX
PE
ND
ITU
RE
SP
ER
SE
MI-
AN
NU
AL
EN
RO
LLE
DP
AT
ING
TO
TA
LE
NR
OLL
ED
PA
TIN
GT
OT
AL
PE
R E
NR
OLL
ED
PA
RT
ICIP
AT
ING
PE
RIO
DC
AR
DH
OLD
ER
SC
AR
DH
OLD
ER
SC
LAIM
SC
AR
DH
OLD
ER
CA
RD
HO
LDE
RE
XP
EN
DIT
UR
ES
CA
RD
HO
LDE
RC
AR
DH
OLD
ER
PA
RT
ICI-
AV
ER
AG
ES
TA
TE
SH
AR
EP
ER
CLA
IM
CLA
IMS
PE
RC
LAIM
S P
ER
PA
RT
ICI-
EX
PE
ND
ITU
RE
S
JUL-
DE
C 2
008
182,
452
137,
834
3,07
8,47
716
.87
22.3
3$8
9,90
8,36
5$4
92.7
8$6
52.2
9$2
9.21
JAN
-JU
N 2
009
177,
553
140,
328
2,96
3,53
016
.69
21.1
2$6
6,83
3,67
1$3
76.4
2$4
76.2
7$2
2.55
JUL-
DE
C 2
009
184,
291
141,
689
3,02
3,68
616
.41
21.3
4$9
1,21
8,10
8$4
94.9
7$6
43.7
9$3
0.17
JAN
-JU
N 2
010
189,
558
148,
953
2,87
7,85
215
.18
19.3
2$7
8,56
0,90
4$4
14.4
4$5
27.4
2$2
7.30
JUL-
DE
C 2
010
192,
601
147,
462
2,84
9,51
814
.79
19.3
2$1
01,3
07,4
60$5
26.0
0$6
87.0
1$3
5.55
JAN
-JU
N 2
011
194,
040
151,
302
3,09
6,29
315
.96
20.4
6$6
5,22
3,93
9$3
36.1
4$4
31.0
8$2
1.07
JUL-
DE
C 2
011
193,
627
148,
687
3,06
4,46
315
.83
20.6
1$6
2,92
4,01
5$3
24.9
8$4
23.2
0$2
0.53
JAN
-JU
N 2
012
190,
699
149,
039
3,03
2,17
815
.90
20.3
4$6
4,05
3,62
3$3
35.8
9$4
29.7
8$2
1.12
JUL-
DE
C 2
012
189,
620
145,
552
2,98
3,62
815
.73
20.5
0$5
8,32
5,71
5$3
07.5
9$4
00.7
2$1
9.55
JAN
-JU
N 2
013
186,
979
143,
936
2,92
2,48
615
.63
20.3
0$5
8,08
2,93
7$3
10.6
4$4
03.5
3$1
9.87
JUL-
DE
C 2
013
183,
032
139,
397
2,85
3,56
515
.59
20.4
7$5
8,08
4,89
7$3
17.3
5$4
16.6
9$2
0.36
JAN
-JU
N 2
014
181,
792
138,
181
2,58
4,27
614
.22
18.7
0$5
6,59
8,68
1$3
11.3
4$4
09.6
0$2
1.90
JUL-
DE
C 2
014
168,
597
128,
307
2,50
2,79
114
.84
19.5
1$5
8,46
3,64
5$3
46.7
7$4
55.6
5$2
3.36
SO
UR
CE
: P
DA
/CA
RD
HO
LDE
R F
ILE
, CLA
IMS
HIS
TO
RY
NO
TE
S:
DA
TA
INC
LUD
E O
RIG
INA
L, P
AID
PA
CE
NE
T C
LAIM
S B
Y D
AT
E O
F S
ER
VIC
E.
TO
TA
L C
LAIM
S IN
CLU
DE
DE
DU
CT
IBLE
CLA
IMS
AN
D C
OP
AID
CLA
IMS
.
XX
XX
XX
EN
RO
LLE
D C
AR
DH
OLD
ER
S A
RE
TH
OS
E E
NR
OLL
ED
FO
R A
NY
PO
RT
ION
OF
TH
E R
EP
OR
TE
D P
ER
IOD
.
XX
XX
XX
PA
RT
ICIP
AT
ING
CA
RD
HO
LDE
RS
AR
E C
AR
DH
OLD
ER
S W
ITH
ON
E O
R M
OR
E A
PP
RO
VE
D C
LAIM
S D
UR
ING
TH
E R
EP
OR
TE
D P
ER
IOD
.
20

84.1
%
78.9
%
50
%
60
%
70
%
80
%
90
%
PE
RC
EN
T O
F C
LA
IMS
FIG
UR
E 2
.1P
AC
E A
ND
PA
CE
NE
T C
LA
IM D
IST
RIB
UT
ION
BY
AM
OU
NT
PA
ID P
ER
CL
AIM
JA
NU
AR
Y -
DE
CE
MB
ER
20
14
(PA
CE
N =
3,5
40
,94
7;
PA
CE
NE
T N
= 4
,18
0,5
40
)
PA
CE
(A
VE
RA
GE
CO
ST
PE
R C
LAIM
= $
21.3
6)
PA
CE
NE
T
(AV
ER
AG
E C
OS
T P
ER
CO
PA
ID C
LAIM
= $
27.5
2)
5.1%
1.9%
2.3%
1.3%
1.3%
4.0%
6.6%
3.0%
3.3%
2.0%
1.6%
4.6%
0%
10
%
20
%
30
%
40
%
$0
-$2
4.9
9$
25
-$4
9.9
9$
50
-$7
4.9
9$
75
-$9
9.9
9$
10
0-$
12
4.9
9$
12
5-$
14
9.9
9$
15
0 A
ND
OV
ER
AM
OU
NT
PA
ID P
ER
CL
AIM
(D
OL
LA
RS
)
SO
UR
CE
: P
DA
/CLA
IMS
HIS
TO
RY
NO
TE
: D
AT
A IN
CLU
DE
OR
IGIN
AL,
PA
ID C
LAIM
S B
Y D
AT
E O
F S
ER
VIC
E, E
XC
LUD
E P
AC
EN
ET
DE
DU
CT
IBLE
CLA
IMS
.
21

40.7
%
33.9
%
20
%
25
%
30
%
35
%
40
%
45
%
OLLED CARDHOLDERS
FIG
UR
E 2
.2D
IST
RIB
UT
ION
OF
PA
CE
AN
NU
AL
BE
NE
FIT
JA
NU
AR
Y -
DE
CE
MB
ER
20
14
N =
12
5,8
01
AV
ER
AG
E A
NN
UA
L P
AC
E B
EN
EF
IT =
$6
01
.26
8.4%
4.6%
3.1%
2.9%
2.1%
1.0%
0.7%
0.9%
1.0%
0.4%
0.4%
0%
5%
10
%
15
%
20
%
$0
$
1-$
49
9$
50
0-$
99
9$
1,0
00
-$
1,4
99
$1
,50
0-
$1
,99
9$
2,0
00
-$
2,4
99
$2
,50
0-
$2
,99
9$
3,0
00
-$
3,4
99
$3
,50
0-
$3
,99
9$
4,0
00
-$
4,9
99
$5
,00
0-
$7
,49
9$
7,5
00
-$
9,9
99
$1
0,0
00
+
PERCENT OF ENRO
AN
NU
AL
ST
AT
E S
HA
RE
(D
OL
LA
RS
)S
OU
RC
E:
PD
A/C
LAIM
S H
IST
OR
YN
OT
E:
DA
TA
INC
LUD
E O
RIG
INA
L, P
AID
CLA
IMS
BY
DA
TE
OF
SE
RV
ICE
, EX
CLU
DE
PA
CE
NE
T C
LAIM
S.
22

37.7
%
27.1
%
20
%
25
%
30
%
35
%
40
%
OLLED CARDHOLDERS
FIG
UR
E 2
.3D
IST
RIB
UT
ION
OF
PA
CE
NE
T A
NN
UA
L B
EN
EF
ITJ
AN
UA
RY
-D
EC
EM
BE
R 2
01
4N
= 1
92
,35
1
AV
ER
AG
E A
NN
UA
L P
AC
EN
ET
BE
NE
FIT
= $
59
8.1
9
8.7%
8.6%
4.9%
4.0%
4.0%
1.5%
0.9%
0.6%
0.6%
0.8%
0.3%
0.3%
0%
5%
10
%
15
%
$0
$
1-$
24
9$
25
0-
$4
99
$5
00
-$
99
9$
1,0
00
-$
1,4
99
$1
,50
0-
$1
,99
9$
2,0
00
-$
2,4
99
$2
,50
0-
$2
,99
9$
3,0
00
-$
3,4
99
$3
,50
0-
$3
,99
9$
4,0
00
-$
4,9
99
$5
,00
0-
$7
,49
9$
7,5
00
-$
9,9
99
$1
0,0
00
+
PERCENT OF ENRO
AN
NU
AL
ST
AT
E S
HA
RE
(D
OL
LA
RS
)
SO
UR
CE
: P
DA
/CLA
IMS
HIS
TO
RY
NO
TE
: D
AT
A IN
CLU
DE
PA
CE
NE
T O
RIG
INA
L, P
AID
CLA
IMS
BY
DA
TE
OF
SE
RV
ICE
, EX
CLU
DE
PA
CE
CLA
IMS
.
23

JAN - JUN JUL - DEC CY 2014
TOTAL PRESCRIPTION COST (DATE OF SERVICE) 325,629,969$ 331,198,733$ 656,828,702$ MEDICARE PART D PREMIUMS 8,377,493 18,596,163 26,973,656
GROSS CLAIMS/PREMIUMS SUBTOTAL 334,007,462 349,794,896 683,802,358 96.8%
MHS CONTRACT OPERATIONS (INCLUDES POSTAGE) 7,329,041 7,734,137 15,063,178
GROSS CONTRACT SUBTOTAL 7,329,041 7,734,137 15,063,178 2.1%
PDA ADMINISTRATION PERSONNEL 525,006 540,043 1,065,049 OPERATIONS 25,618 29,292 54,910
GROSS PDA ADMIN. SUBTOTAL 550,624 569,335 1,119,959 0.2%
OTHER ADMINISTRATION AUDITS 322,500 305,000 627,500 MEDICAL ADVISOR 21,882 - 21,882 THIRD PARTY RECOVERY 403,761 364,512 768,273
GROSS OTHER ADMIN. SUBTOTAL 748,143 669,512 1,417,655 0.2%
BEHAVIORAL HEALTH INTERVENTIONS 399,134 382,178 781,312 0.1%
ENROLLMENT OUTREACH 1,164,252 1,234,107 2,398,359 0.3%
PRESCRIBER EDUCATION 750,000 750,000 1,500,000 0.2%
GROSS EXPENDITURES 344,948,656 361,134,165 706,082,821 100.0%
PRESCRIPTION COST OFFSETS PART D/OTHER PAYER OFFSETS (198,282,755) (201,798,766) (400,081,521) -56.7% CARDHOLDER COPAYMENTS (34,336,104) (31,709,566) (66,045,671) -9.4%
TOTAL OFFSETS (232,618,859) (233,508,333) (466,127,192) -66.0%
RECOVERIES MANUFACTURER REBATES (19,456,456) (20,158,007) (39,614,463) REFUNDS FROM PROVIDERS (8,477) (580) (9,057) AUDIT ADJUSTMENTS IN CHECKWRITES (605,254) (1,173,100) (1,778,354) ATTORNEY GENERAL COLLECTIONS (538) - (538) THIRD-PARTY REIMBURSEMENTS (4,987,440) (2,672,370) (7,659,810)
COMBINED RECOVERIES (25,058,165) (24,004,057) (49,062,222)
PRIOR YEARS' FUL REIMBURSEMENT REVISION - 903,528 903,528 PRIOR YEARS' REBATE REFUNDS 984,007 56,933 1,040,940
NET RECOVERIES (24,074,158) (23,043,596) (47,117,754) -6.7%
NET PRESCRIPTION CLAIM EXPENDITURES STATE SHARE FOR RX BEFORE RECOVERIES 93,011,110 97,690,400 190,701,511 27.0% STATE SHARE FOR RX AFTER RECOVERIES 68,936,952 74,646,804 143,583,757 20.3%
NET STATE EXPENDITURES INCLUDING PREMIUMS
AND ADMINISTRATION 88,255,639$ 104,582,236$ 192,837,876$ 27.3%
NOTES
AUDIT ADJUSTMENTS ARE BY RECOVERY DATE; AUDITS OCCURRED IN CY 2010 - 2014. REBATES ($39.6 M) ARE 20.8% OF TOTAL STATE SHARE PRESCRIPTION DRUG COST ($190.7 M). TOTAL PRESCRIPTION COST DOES NOT INCLUDE CLAIMS PROCESSED ONLY BY THIRD PARTY COVERAGE. MEDICAL ADVISOR EXPENDITURE TRANSFERRED TO MHS CONTRACT.
TABLE 2.2TOTAL PRESCRIPTION COST, EXPENDITURES, OFFSETS AND RECOVERIES
JANUARY - DECEMBER 2014
EXPENDITURES, RECOVERIES, OFFSETS% OF TOTAL
GROSS EXPENDITURES
TABLE USES DATE OF SERVICE REFERENCE CLAIM COST FILE FOR ANNUAL DRUG EXPENDITURES.
24
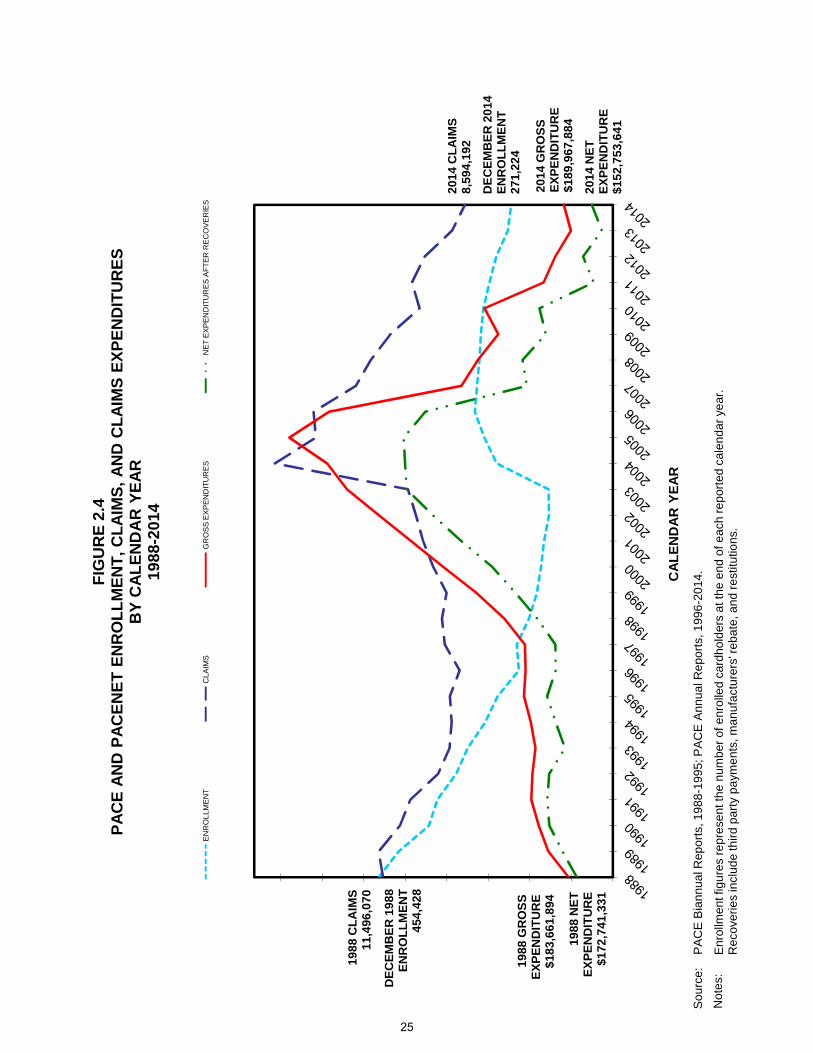
EN
RO
LL
ME
NT
CL
AIM
SG
RO
SS
EX
PE
ND
ITU
RE
SN
ET
EX
PE
ND
ITU
RE
S A
FT
ER
RE
CO
VE
RIE
S
DE
CE
MB
ER
19
88
E
NR
OL
LM
EN
T4
54
,42
8
19
88
CL
AIM
S1
1,4
96
,07
0
FIG
UR
E 2
.4P
AC
E A
ND
PA
CE
NE
T E
NR
OL
LM
EN
T,
CL
AIM
S,
AN
D C
LA
IMS
EX
PE
ND
ITU
RE
SB
Y C
AL
EN
DA
R Y
EA
R1
98
8-2
01
4
9
CA
LE
ND
AR
YE
AR
19
88
GR
OS
SE
XP
EN
DIT
UR
E$
18
3,6
61
,89
4
19
88
NE
TE
XP
EN
DIT
UR
E$
17
2,7
41
,33
1
DE
CE
MB
ER
20
14
E
NR
OL
LM
EN
T2
71
,22
4
20
14
CL
AIM
S8
,59
4,1
92
20
14
NE
TE
XP
EN
DIT
UR
E$
15
2,7
53
,64
1
20
14
GR
OS
SE
XP
EN
DIT
UR
E$
18
9,9
67
,88
4
En
rollm
en
t fig
ure
s re
pre
sen
t th
e n
um
be
r o
f en
rolle
d c
ard
ho
lde
rs a
t th
e e
nd
of
ea
ch r
ep
ort
ed
ca
len
da
r ye
ar.
Re
cove
rie
s in
clu
de
thir
d p
art
y p
aym
en
ts, m
an
ufa
ctu
rers
' re
ba
te, a
nd
re
stitu
tion
s.
So
urc
e:
P
AC
E B
ian
nu
al R
ep
ort
s, 1
98
8-1
99
5; P
AC
E A
nn
ua
l Re
po
rts,
19
96
-20
14
.
No
tes:
25

140,
000
165,
000
190,
000
215,
000
PERSONSF
IGU
RE
2.5
AP
AC
E T
OTA
L E
NR
OL
LE
D A
ND
PA
RT
ICIP
AT
ING
CA
RD
HO
LD
ER
S B
Y M
ON
TH
JA
NU
AR
Y 2
00
4 -
JA
NU
AR
Y 2
01
5
PA
CE
Enr
olle
dP
AC
E P
artic
ipat
ing 7.
0%
DEC
REA
SE
2.3%
D
ECR
EASE
1.3%
D
ECR
EASE
1.8%
D
ECR
EASE
2.0%
D
ECR
EASE
5.0%
D
ECR
EASE
12.5
%D
ECR
EASE
10.1
%D
ECR
EASE
7.2%
D
ECR
EASE
194,
530
191,
938
188 ,
514
179,
105
156,
688
140,
908
158,
106
154,
496
151,
363
135,
720
7.5%
D
ECR
EASE
40,0
00
65,0
00
90,0
00
115,
000
NUMBER OF
SO
UR
CE
: E
ND
-OF
-MO
NT
H P
AC
E E
NR
OLL
ED
TA
KE
N F
RO
M M
R-0
-01A
RE
PO
RT
, PA
RT
ICIP
AT
ING
TA
KE
N F
RO
M C
LAIM
S H
IST
OR
Y B
AS
ED
ON
DA
TE
OF
SE
RV
ICE
1
8.1%
DEC
REA
SE
8.4%
D
ECR
EASE
7.4%
D
ECR
EASE
DEC
REA
SE2.
6%
DEC
REA
SE9.
2%
DEC
REA
SE
7.7%
DEC
REA
SE11
.4%
DEC
REA
SE
7.0%
IN
CR
EASE
3.8%
IN
CR
EASE
2004
2005
2006
2007
2008
2009
2010
2011
2012
10.3
%
DEC
REA
SE
2013
15.5
%D
ECR
EASE
2014
11.0
%D
ECR
EASE
112,
513
109,
631
99,5
59
106,
548
130,
824
86,4
15
79,3
93
73,2
8064
,896
67,3
85
114,
691
101,
943
94,3
70
121,
013
26

100,
000
120,
000
140,
000
160,
000
180,
000
200,
000
OF PERSONSF
IGU
RE
2.5
BP
AC
EN
ET
TO
TAL
EN
RO
LL
ED
AN
D P
AR
TIC
IPA
TIN
G C
AR
DH
OL
DE
RS
BY
MO
NT
HJ
AN
UA
RY
20
04
-J
AN
UA
RY
20
15
PA
CE
NE
T E
nrol
led
PA
CE
NE
T P
artic
ipat
ing
3.7%
4.2%
IN
CR
EASE
0.
5%
DEC
REA
SE
0.5%
D
ECR
EASE
4.
9%
DEC
REA
SE
7.3%
D
ECR
EASE
101.
38%
IN
CR
EASE
17.3
%
INC
REA
SE
12%
13.4
%
INC
REA
SE
13.8
%IN
CR
EASE
8.1%
INC
REA
SE
121,
887
178,
127
177,
303
120,
445
117,
329
176,
483
167,
862
109,
979
155,
575
100,
075
118,
140
133,
987
110,
043
152,
476
164,
777
113,
994
117,
499
171,
007
3.8%
IN
CR
EASE
0
20,0
00
40,0
00
60,0
00
80,0
00
NUMBER O SO
UR
CE
: E
ND
-OF
-MO
NT
H P
AC
EN
ET
EN
RO
LLE
D T
AK
EN
FR
OM
MR
-0-0
1A R
EP
OR
T, P
AR
TIC
IPA
TIN
G T
AK
EN
FR
OM
CLA
IMS
HIS
TO
RY
BA
SE
D O
N D
AT
E O
F S
ER
VIC
E
1
INC
REA
SE3.
1%
INC
REA
SE
2.6%
D
ECR
EASE
6.
3%
DEC
REA
SE
8.2%
D
ECR
EASE
137.
1%
INC
REA
SE
2004
2005
2006
2007
22.2
%
INC
REA
SE
2008
2009
2010
1.2%
D
ECR
EASE
2011
9.1%
INC
REA
SE
2012
14.7
%IN
CR
EASE
2013
3.7%
INC
REA
SE
100,
929
30,3
68
50,0
30
72,0
06
87,9
86
95,9
80
2014
27

13
34
13
53
14
.19
18
.36
24
.25
19
.02
$1
5.0
0
$2
0.0
0
$2
5.0
0
$3
0.0
0
PRICE
Mea
n A
WP
Uni
t Pric
eM
ean
AM
P U
nit P
rice
TOTA
L IN
CR
EA
SE
IN M
EA
N A
WP
UN
IT
PR
ICE
OV
ER
15
YE
AR
S =
829
.1%
FIG
UR
E 2
.6A
PA
CE
AV
ER
AG
E W
HO
LE
SA
LE
PR
ICE
(A
WP
) A
ND
AV
ER
AG
E M
AN
UF
AC
TU
RE
R'S
PR
ICE
(A
MP
) *
BR
AN
D P
RO
DU
CT
S O
NL
Y, B
Y Q
UA
RT
ER
JA
NU
AR
Y 2
00
0 -
DE
CE
MB
ER
20
14
2.6
12
.90
3.4
24
.04
4.5
2
5.4
0
6.3
7
7.7
4
9.0
9
10
.49
11
.47
13
.34
13
.53
2.0
02
.25
2.6
33
.10
3.5
24
.21
4.9
4
6.0
5
7.5
18
.14
8.8
2
10
.21
10
.39
11
.33
14
.39
$0
.00
$5
.00
$1
0.0
0
12
34
12
34
12
34
12
34
12
34
12
34
12
34
12
34
12
34
12
34
12
34
12
34
12
34
12
34
12
34
20
00
20
01
20
02
20
03
20
04
20
05
20
06
20
07
20
08
20
09
20
10
20
11
20
12
20
13
20
14
UNIT
TOTA
L IN
CR
EA
SE
IN M
EA
N A
MP
UN
IT
PR
ICE
OV
ER
15
YE
AR
S =
851
.0%
SO
UR
CE
: P
AC
E C
LAIM
S H
IST
OR
Y A
ND
MA
NU
FA
CT
UR
ER
S' R
EB
AT
E H
IST
OR
Y
* D
AT
A IN
CLU
DE
CLA
IMS
FO
R N
DC
'S F
OR
WH
ICH
RE
BA
TE
AM
P D
AT
A A
RE
AV
AIL
AB
LE F
OR
AN
Y Q
UA
RT
ER
IN 2
000-
2014
.
28

1.9
5
2.0
7
2.1
6
2.4
4
2.9
42
.92
3.1
6
$2
.00
$2
.50
$3
.00
$3
.50
PRICE
Mea
n A
WP
Uni
t Pric
eM
ean
AM
P U
nit P
rice
TOTA
L IN
CR
EA
SE
IN M
EA
N A
WP
UN
IT
PR
ICE
OV
ER
15
YE
AR
S =
327
.0%
FIG
UR
E 2
.6B
PA
CE
AV
ER
AG
E W
HO
LE
SA
LE
PR
ICE
(A
WP
) A
ND
AV
ER
AG
E M
AN
UF
AC
TU
RE
R'S
PR
ICE
(A
MP
) *
GE
NE
RIC
PR
OD
UC
TS
ON
LY
, B
Y Q
UA
RT
ER
JA
NU
AR
Y 2
00
0 -
DE
CE
MB
ER
20
14
0.7
40
.78
0.8
40
.89
0.9
90
.97
1.0
7
1.4
41
.50
0.1
60
.15
0.1
70
.16
0.2
10
.13
0.1
5
0.2
80
.20
0.2
10
.24
0.2
30
.21
0.2
90
.27
0.3
6
$0
.00
$0
.50
$1
.00
$1
.50
12
34
12
34
12
34
12
34
12
34
12
34
12
34
12
34
12
34
12
34
12
34
12
34
12
34
12
34
12
34
20
00
20
01
20
02
20
03
20
04
20
05
20
06
20
07
20
08
20
09
20
10
20
11
20
12
20
13
20
14
UNIT P
TOTA
L IN
CR
EA
SE
IN M
EA
N A
MP
UN
IT
PR
ICE
OV
ER
15
YE
AR
S =
125
.0%
SO
UR
CE
: P
AC
E C
LAIM
S H
IST
OR
Y A
ND
MA
NU
FA
CT
UR
ER
S' R
EB
AT
E H
IST
OR
Y
* D
AT
A IN
CLU
DE
CLA
IMS
FO
R N
DC
'S F
OR
WH
ICH
RE
BA
TE
AM
P D
AT
A A
RE
AV
AIL
AB
LE F
OR
AN
Y Q
UA
RT
ER
IN 2
000-
2014
.
29

30

SECTION 3
PROGRAM DATA BY DATE OF
PAYMENT
31

32

PAGE 1
PACE PACENET
NUMBER OF SEMI-ANNUAL PROCESSED
PERIOD CLAIMS EXPENDITURES
JUL-DEC 1984 26 2,101,419 $20,714,685 $9.86
JAN-JUN 1985 26 3,475,440 $36,579,102 $10.53
1st YEAR TOTAL 5,576,859 $57,293,787 $10.27
JUL-DEC 1985 26 4,372,468 $50,616,334 $11.58
JAN-JUN 1986 26 4,966,536 $61,368,193 $12.36
2nd YEAR TOTAL 9,339,004 $111,984,527 $11.99
JUL-DEC 1986 26 5,237,141 $68,786,114 $13.13
JAN-JUN 1987 26 5,257,747 $72,761,148 $13.84
3rd YEAR TOTAL 10,494,888 $141,547,262 $13.49
JUL-DEC 1987 27 5,515,827 $80,237,477 $14.55
JAN-JUN 1988 25 5,440,743 $84,469,697 $15.53
4th YEAR TOTAL 10,956,570 $164,707,174 $15.03
JUL-DEC 1988 27 6,055,327 $99,192,197 $16.38
JAN-JUN 1989 26 5,937,088 $103,781,619 $17.48
5th YEAR TOTAL 11,992,415 $202,973,816 $16.93
JUL-DEC 1989 26 5,709,497 $106,600,899 $18.67
JAN-JUN 1990 26 5,544,295 $110,848,137 $19.99
6th YEAR TOTAL 11,253,792 $217,449,036 $19.32
WEEKS CLAIMS
TABLE 3.1PACE AND PACENET CLAIMS AND EXPENDITURES PAID BY FISCAL YEAR
JULY 1984 - DECEMBER 2014
NUMBER NUMBER OFSTATE SHARE STATE SHAREAVERAGE AVERAGE
PER PROCESSEDCLAIM *
OFEXPENDITURES
PER PROCESSEDCLAIM **
PROCESSED
JUL-DEC 1990 26 5,352,797 $112,293,188 $20.98
JAN-JUN 1991 26 5,453,044 $117,814,625 $21.61
7th YEAR TOTAL 10,805,841 $230,107,813 $21.29
JUL-DEC 1991 26 5,073,452 $115,304,410 $22.73
JAN-JUN 1992 26 4,816,750 $115,596,910 $24.00
8th YEAR TOTAL 9,890,202 $230,901,320 $23.35
JUL-DEC 1992 26 4,724,142 $115,980,339 $24.55
JAN-JUN 1993 26 4,403,096 $108,876,491 $24.73
9th YEAR TOTAL 9,127,238 $224,856,830 $24.64
JUL-DEC 1993 26 4,729,097 $118,778,523 $25.12
JAN-JUN 1994 26 4,341,896 $111,401,456 $25.66
10th YEAR TOTAL 9,070,993 $230,179,979 $25.38
JUL-DEC 1994 26 4,721,702 $122,294,905 $25.90
JAN-JUN 1995 27 4,228,653 $111,136,630 $26.28
11th YEAR TOTAL 8,950,355 $233,431,535 $26.08
JUL-DEC 1995 26 4,895,160 $131,701,547 $26.90
JAN-JUN 1996 26 4,443,096 $121,066,818 $27.25
12th YEAR TOTAL 9,338,256 $252,768,365 $27.07
JUL-DEC 1996 26 4,334,551 $119,612,179 $27.60 540 $23 $0.04
JAN-JUN 1997 26 4,523,225 $116,697,725 $25.80 74,647 $586,350 $7.85
13th YEAR TOTAL 8,857,776 $236,309,904 $26.68 75,187 $586,373 $7.80
JUL-DEC 1997 26 4,546,360 $121,880,844 $26.81 150,263 $2,680,675 $17.84
JAN-JUN 1998 26 4,497,031 $126,776,785 $28.19 171,797 $2,860,833 $16.65
14th YEAR TOTAL 9,043,391 $248,657,629 $27.50 322,060 $5,541,508 $17.21
33

PAGE 2
PACE PACENET
NUMBER OF SEMI-ANNUAL PROCESSED
PERIOD CLAIMS EXPENDITURES
JUL-DEC 1998 26 4,504,394 $134,229,706 $29.80 233,277 $4,737,561 $20.31
JAN-JUN 1999 26 4,220,448 $139,246,165 $32.99 256,109 $5,410,383 $21.13
15th YEAR TOTAL 8,724,842 $273,475,871 $31.34 489,386 $10,147,944 $20.74
JUL-DEC 1999 26 4,456,680 $153,781,999 $34.51 310,165 $7,421,422 $23.93
JAN-JUN 2000 26 4,453,977 $160,846,800 $36.11 339,250 $8,389,295 $24.73
8,910,657 $314,628,799 $35.31 649,415 $15,810,717 $24.35
JUL-DEC 2000 26 4,538,814 $170,118,213 $37.48 382,379 $10,200,170 $26.68
JAN-JUN 2001 26 4,536,651 $177,830,053 $39.20 420,529 $11,319,858 $26.92
9,075,465 $347,948,266 $38.34 802,908 $21,520,028 $26.80
JUL-DEC 2001 26 4,635,934 $189,489,307 $40.87 480,559 $13,924,106 $28.97
JAN-JUN 2002 26 4,554,962 $194,745,251 $42.75 542,321 $16,348,022 $30.14
9,190,896 $384,234,558 $41.81 1,022,880 $30,272,128 $29.59
JUL-DEC 2002 26 4,615,282 $203,947,092 $44.19 615,169 $20,100,929 $32.68
JAN-JUN 2003 26 4,554,809 $208,208,623 $45.71 644,320 $21,608,906 $33.54
19th YEAR TOTAL 9,170,091 $412,155,715 $44.95 1,259,489 $41,709,835 $33.12
JUL-DEC 2003 26 4,688,095 $221,734,037 $47.30 722,537 $25,698,628 $35.57
JAN-JUN 2004 26 4,581,399 $205,908,844 $44.94 1,268,014 $47,385,206 $37.37
20th YEAR TOTAL 9,269,494 $427,642,881 $46.13 1,990,551 $73,083,834 $36.72
PACE AND PACENET CLAIMS AND EXPENDITURES PAID BY FISCAL YEAR JULY 1984 - DECEMBER 2014
17th YEAR TOTAL
AVERAGE AVERAGENUMBER STATE SHARE NUMBER OF
OF PROCESSED PER PROCESSED
16th YEAR TOTAL
PER PROCESSEDWEEKS CLAIM *
STATE SHARE
TABLE 3.1
CLAIMS
18th YEAR TOTAL
EXPENDITURES CLAIM **
, , $ , , $ , , $ , , $
JUL-DEC 2004 26 4,646,945 $178,347,082 $38.38 1,922,663 $71,852,034 $37.37
JAN-JUN 2005 26 4,613,122 $166,886,748 $36.18 2,178,944 $81,479,300 $37.39
21st YEAR TOTAL 9,260,067 $345,233,830 $37.28 4,101,607 $153,331,334 $37.38
JUL-DEC 2005 26 4,632,516 $208,781,508 $45.07 2,451,200 $96,468,947 $39.36
JAN-JUN 2006 26 4,484,886 $196,409,910 $43.79 2,708,585 $100,489,805 $37.10
9,117,402 $405,191,418 $44.44 5,159,785 $196,958,752 $38.17
JUL-DEC 2006 26 4,074,738 $126,753,319 $31.11 2,686,230 $77,256,980 $28.76
JAN-JUN 2007 26 3,642,398 $82,054,486 $22.53 2,633,012 $59,270,762 $22.51
23rd YEAR TOTAL 7,717,136 $208,807,805 $27.06 5,319,242 $136,527,742 $25.67
JUL-DEC 2007 26 3,491,014 $99,077,033 $28.38 2,688,584 $85,271,656 $31.72
JAN-JUN 2008 26 3,015,416 $70,145,582 $23.26 2,947,413 $67,641,825 $22.95
24th YEAR TOTAL 6,506,430 $169,222,615 $26.01 5,635,997 $152,913,481 $27.13
JUL-DEC 2008 26 2,882,322 $76,213,073 $26.44 3,082,226 $89,890,137 $29.16
JAN-JUN 2009 26 2,675,602 $55,324,827 $20.68 2,960,252 $66,702,151 $22.53
25th YEAR TOTAL 5,557,924 $131,537,900 $23.67 6,042,478 $156,592,288 $25.92
JUL-DEC 2009 26 2,560,054 $63,361,329 $24.75 3,031,954 $91,430,885 $30.16
JAN-JUN 2010 26 2,380,428 $56,111,899 $23.57 2,824,223 $76,675,981 $27.15
26th YEAR TOTAL 4,940,482 $119,473,228 $24.18 5,856,177 $168,106,866 $28.71
JUL-DEC 2010 26 2,182,334 $61,837,441 $28.34 2,853,692 $101,435,537 $35.55
JAN-JUN 2011 26 2,226,942 $45,437,610 $20.40 3,102,948 $65,404,599 $21.08
27th YEAR TOTAL 4,409,276 $107,275,051 $24.33 5,956,640 $166,840,136 $28.01
22nd YEAR TOTAL
34

PAGE 3
PACE PACENET
NUMBER OF SEMI-ANNUAL PROCESSED
PERIOD CLAIMS EXPENDITURES
JUL-DEC 2011 26 2,067,181 $42,933,134 $20.77 3,072,410 $63,057,042 $20.52JAN-JUN 2012 26 2,093,727 $42,352,837 $20.23 3,035,747 $64,106,702 $21.12
28th YEAR TOTAL 4,160,908 $85,285,971 $20.50 6,108,157 $127,163,744 $20.82
JUL-DEC 2012 26 1,924,040 $36,823,185 $19.14 2,963,999 $58,046,309 $19.58JAN-JUN 2013 26 1,853,713 $36,063,995 $19.46 2,897,931 $57,828,530 $19.96
29th YEAR TOTAL 3,777,753 $72,887,180 $19.29 5,861,930 $115,874,839 $19.77
JUL-DEC 2013 26 1,597,139 $31,742,735 $19.87 2,702,648 $55,057,471 $20.37JAN-JUN 2014 26 1,618,419 $32,581,671 $20.13 2,725,253 $59,253,137 $21.74
30th YEAR TOTAL 3,215,558 $64,324,406 $20.00 5,427,901 $114,310,608 $21.06
JUL-DEC 2014 26 1,502,786 $33,987,697 $22.62 2,747,734 $64,145,379 $23.341,502,786 $33,987,697 $22.62 2,747,734 $64,145,379 $23.34
CUMULATIVE TOTAL 249,204,747 $6,686,482,168 $27.18 64,829,524 $1,751,437,535 $29.76
AVERAGENUMBER STATE SHARE NUMBER OF STATE SHARE
manufacturers, recoupments from insurance carriers, or audit disallowances received from providers and enrollees. The number of claims
original, paid claim would be higher than the values shown on this table.
OF PER PROCESSED
Reimbursement formulas for PACE:
July 1, 1984 - June 1985: The lesser of either the Average Wholesale Price (AWP) plus a $2.50 dispensing fee or the Usual and Customary
WEEKS CLAIM * CLAIMSPROCESSED PER PROCESSED
31st YEAR-TO-DATE TOTAL
Charge (U&C), then subtracting a $4.00 cardholder payment.
July 1, 1985 - June 1991: The lesser of either the AWP plus a $2.75 dispensing fee or the U&C, then subtracting a $4.00 cardholder payment.
* The State Share is the amount paid by the PACE Program for each claim. The State Share per processed claim does not reflect rebates from
includes all original, debit, credit and void claims. Some claims, therefore, do not have a payment associated with them. The State Share per
TABLE 3.1PACE AND PACENET CLAIMS AND EXPENDITURES PAID BY FISCAL YEAR
JULY 1984 - DECEMBER 2014
AVERAGE
EXPENDITURES CLAIM **
September 2006 - Present: Program providers are required to accept the Medicare Part D Plan reimbursements for those claims in the coverage
June 2004 - Present: Average state share per claim reflects savings from Medicare Part D.
September 2006 - Present: Program providers are required to accept the Medicare Part D Plan reimbursements for those claims in the coverage
June 2004 - Present: Average state share per claim reflects savings from Medicare Part D.
SOURCE: PDA/MRW200-01 & MRM730-01
Reimbursement formulas for PACENET:
November 22, 1996 - December 31, 2003: The lesser of either AWP minus 10% plus a $3.50 dispensing fee, or the U&C, then subtracting
subtracting a $6.00 copayment.November 22, 1996 - December 31, 2003: The lesser of either the AWP minus 10% plus a $3.50 dispensing fee, or the U&C, then
July 1, 1991 - November 21, 1996: Same as above with copayment increased to $6.00.
June 2004 - December 2005: Average PACE state share per claim reflects additional savings from the Transitional Assistance benefit for Medicare
January 1, 2004 - July 9, 2006: The lesser of either AWP minus 10% plus a $4.00 dispensing fee, or the U&C, or the Federal Upper Limit for a genericproduct plus a $4.00 dispensing fee, then subtracting a copayment of $6.00 for generics and $9.00 for brand products. The copayment can be adjusted
plus a $4.00 dispensing fee for claims not covered by an enrollee’s Part D Plan.
Discount Program cardholders.
phase received by cardholders who are enrolled in both Medicare Part D and the PACE/PACENET Program. These Part D Plan reimbursementsare comparable to the average commercial rate of AWP minus 17% plus a $2.00 dispensing fee. The Program reimburses at AWP minus 12% plus a $4.00 dispensing fee for claims not covered by an enrollee’s Part D Plan.
product plus a $4.00 dispensing fee, then subtracting a copayment of $8.00 for generics and $15.00 for brand products. The copayment can be adjuste
** The State Share is the amount paid by the PACENET Program when the cost of the claim(s) exceeds the monthly deductible premium amount plus the copayment. The number of processed claims includes all original, debit, credit and void claims and claims without a State Share payment in the premium deductible phases and all other claims with a State Share payment. Therefore, the State Share per claim on this table is lower
plus a $4.00 dispensing fee, then subtracting a copayment of $8.00 for generics and $15.00 for brand products. The copayment can be adjusted annua
than the State Share for claims beyond the premium deductible phase. The State Share per processed claim does not reflect rebates frommanufacturers, recoupments from insurance carriers, or audit disallowances received from providers.
phase received by cardholders who are enrolled in both Medicare Part D and the PACE/PACENET Program. These Part D Plan reimbursementsare comparable to the average commercial rate of AWP minus 17% plus a $2.00 dispensing fee. The Program reimburses at AWP minus 12%
July 10, 2006 - Present: The lesser of either AWP minus 12% plus a $4.00 dispensing fee, or the U&C, or the Federal Upper Limit for a generic produc
a copayment of $8.00 for generics and $15 for brand products.
January 1, 2004 - July 9, 2006: The lesser of either AWP minus 10% plus a $4.00 dispensing fee, or the U&C, or the Federal Upper Limit for a generic
35

PA
GE
1
% O
FA
LLM
AN
UF
AC
TU
RE
RP
RO
DU
CT
ST
RE
NG
TH
ND
C9
CLA
IMS
CLA
IMS
PR
OD
UC
T D
ES
CR
IPT
ION
AS
TR
A Z
EN
EC
AN
EX
IUM
40 M
G00
1865
040
$2,5
67,9
65.0
73.
421
31,3
270.
881
GA
ST
RO
INT
ES
TIN
AL
AG
EN
T
BO
EH
RIN
GE
R I
NG
ELH
EIM
SP
IRIV
A18
MC
G00
5970
075
$1,9
35,9
43.7
62.
582
25,0
180.
713
RE
SP
IRA
TO
RY
AG
EN
T
GLA
XO
SM
ITH
KLI
NE
AD
VA
IR D
ISK
US
250-
50 M
CG
0017
3069
6$1
,357
,581
.92
1.81
317
,043
0.48
11R
ES
PIR
AT
OR
Y A
GE
NT
PF
IZE
RC
ELE
BR
EX
200
MG
0002
5152
5$1
,088
,400
.41
1.45
414
,876
0.42
13A
NT
I-IN
FLA
MM
AT
OR
Y/A
NA
LGE
SIC
ME
RC
KZ
ET
IA10
MG
6658
2041
4$1
,077
,858
.64
1.44
518
,464
0.52
8LI
PID
-LO
WE
RIN
G A
GE
NT
SA
NO
FI-
AV
EN
TIS
LAN
TU
S S
OLO
ST
AR
100/
ML
0008
8221
9$9
99,3
85.6
71.
336
11,0
660.
3129
DIA
BE
TE
S T
RE
AT
ME
NT
ME
RC
KJA
NU
VIA
100
MG
0000
6027
7$8
46,7
26.3
51.
137
10,5
260.
3034
DIA
BE
TE
S T
RE
AT
ME
NT
FO
RE
ST
NA
ME
ND
A10
MG
0045
6321
0$8
15,5
91.6
91.
098
10,6
640.
3033
ALZ
HE
IME
R'S
DIS
EA
SE
TR
EA
TM
EN
T
AS
TR
A Z
EN
EC
AC
RE
ST
OR
10 M
G00
3100
751
$765
,713
.27
1.02
913
,263
0.37
15LI
PID
-LO
WE
RIN
G A
GE
NT
SA
NO
FI-
AV
EN
TIS
LAN
TU
S10
0/M
L00
0882
220
$600
,195
.18
0.80
107,
813
0.22
66D
IAB
ET
ES
TR
EA
TM
EN
T
JOH
NS
ON
& J
OH
NS
ON
XA
RE
LTO
20 M
G50
4580
579
$583
,030
.47
0.78
116,
295
0.18
96A
NT
ICO
AG
ULA
NT
BO
EH
RIN
GE
R I
NG
ELH
EIM
TR
AD
JEN
TA
5 M
G00
5970
140
$569
,744
.89
0.76
124,
149
0.12
192
DIA
BE
TE
S T
RE
AT
ME
NT
AS
TR
A Z
EN
EC
AC
RE
ST
OR
5 M
G00
3100
755
$568
,630
.36
0.76
139,
280
0.26
43LI
PID
-LO
WE
RIN
G A
GE
NT
NO
VA
RT
ISD
IOV
AN
160
MG
0007
8035
9$5
5679
808
074
1410
057
028
37A
NG
IOT
EN
SIN
IIR
EC
EP
TO
RA
NT
AG
TU
RE
SE
XP
EN
DIT
UR
EV
OLU
ME
TU
RE
BY
% O
F A
LLR
AN
K B
YR
AN
K
TA
BL
E 3
.2A
PA
CE
HIG
H E
XP
EN
DIT
UR
E A
ND
HIG
H V
OL
UM
E C
LA
IMS
JAN
UA
RY
- D
EC
EM
BE
R 2
014
EX
PE
ND
I-E
XP
EN
DI-
NO
VA
RT
ISD
IOV
AN
160
MG
0007
8035
9$5
56,7
98.0
80.
7414
10,0
570.
2837
AN
GIO
TE
NS
IN I
I R
EC
EP
TO
R A
NT
AG
.
AS
TR
A Z
EN
EC
AS
YM
BIC
OR
T16
0-4.
5MC
G00
1860
370
$548
,190
.47
0.73
156,
064
0.17
103
RE
SP
IRA
TO
RY
AG
EN
T
ALL
ER
GA
NLU
MIG
AN
0.01
%00
0233
205
$539
,912
.02
0.72
1610
,736
0.30
32G
LAU
CO
MA
TR
EA
TM
EN
T
ME
RC
KJA
NU
VIA
50 M
G00
0060
112
$533
,779
.39
0.71
176,
518
0.18
91D
IAB
ET
ES
TR
EA
TM
EN
T
BO
EH
RIN
GE
R I
NG
ELH
EIM
AG
GR
EN
OX
25M
G-2
00M
G00
5970
001
$522
,362
.72
0.70
185,
417
0.15
126
AN
TIP
LAT
ELE
T A
GE
NT
BO
EH
RIN
GE
R I
NG
ELH
EIM
PR
AD
AX
A15
0 M
G00
5970
135
$494
,172
.48
0.66
195,
075
0.14
143
AN
TIC
OA
GU
LAN
T
AM
GE
NE
NB
RE
L50
MG
/ML
5840
6044
5$4
81,8
15.2
30.
6420
353
0.01
1,65
1D
ISE
AS
E-M
OD
IFY
ING
AN
TIR
HE
UM
AT
I C
NO
VO
NO
RD
ISK
NO
VO
LOG
FLE
XP
EN
100/
ML
0016
9633
9$4
65,0
40.1
30.
6221
4,46
00.
1316
9D
IAB
ET
ES
TR
EA
TM
EN
T
ALL
ER
GA
NR
ES
TA
SIS
0.05
%00
0239
163
$458
,142
.54
0.61
224,
712
0.13
158
DR
Y E
YE
TR
EA
TM
EN
T
NO
VA
RT
ISD
IOV
AN
320
MG
0007
8036
0$4
48,0
21.6
10.
6023
7,47
10.
2170
AN
GIO
TE
NS
IN I
I R
EC
EP
TO
R A
NT
AG
.
AS
TE
LLA
SV
ES
ICA
RE
5 M
G51
2480
150
$440
,779
.26
0.59
246,
422
0.18
93O
VE
RA
CT
IVE
BLA
DD
ER
TR
EA
TM
EN
T
AS
TR
A Z
EN
EC
AC
RE
ST
OR
20 M
G00
3100
752
$437
,448
.58
0.58
257,
378
0.21
73LI
PID
-LO
WE
RIN
G A
GE
NT
BO
EH
RIN
GE
R I
NG
ELH
EIM
CO
MB
IVE
NT
RE
SP
IMA
T20
-100
MC
G00
5970
024
$427
,951
.26
0.57
265,
350
0.15
130
RE
SP
IRA
TO
RY
AG
EN
T
GLA
XO
SM
ITH
KLI
NE
AD
VA
IR D
ISK
US
500-
50 M
CG
0017
3069
7$4
12,6
66.9
90.
5527
4,14
10.
1219
3R
ES
PIR
AT
OR
Y A
GE
NT
ALC
ON
TR
AV
AT
AN
Z0.
004
%00
0650
260
$403
,905
.09
0.54
288,
833
0.25
48G
LAU
CO
MA
TR
EA
TM
EN
T
NO
VA
RT
ISD
IOV
AN
80 M
G00
0780
358
$369
,948
.61
0.49
297,
020
0.20
76A
NG
IOT
EN
SIN
II
RE
CE
PT
OR
AN
TA
G.
JOH
NS
ON
& J
OH
NS
ON
XA
RE
LTO
15 M
G50
4580
578
$350
,079
.48
0.47
303,
864
0.11
210
AN
TIC
OA
GU
LAN
T
36

PA
GE
2
% O
FA
LLM
AN
UF
AC
TU
RE
RP
RO
DU
CT
ST
RE
NG
TH
ND
C9
CLA
IMS
CLA
IMS
PR
OD
UC
T D
ES
CR
IPT
ION
TU
RE
SE
XP
EN
DIT
UR
EV
OLU
ME
TU
RE
BY
% O
F A
LLR
AN
K B
YR
AN
K
TA
BL
E 3
.2A
PA
CE
HIG
H E
XP
EN
DIT
UR
E A
ND
HIG
H V
OL
UM
E C
LA
IMS
JAN
UA
RY
- D
EC
EM
BE
R 2
014
EX
PE
ND
I-E
XP
EN
DI-
NO
VO
NO
RD
ISK
NO
VO
LOG
MIX
70-
30 F
LEX
PE
N70
-30/
ML
0016
9369
6$3
36,2
98.6
70.
4531
2,43
30.
0734
2D
IAB
ET
ES
TR
EA
TM
EN
T
FO
RE
ST
NA
ME
ND
A X
R28
MG
0045
6342
8$3
33,1
04.4
90.
4432
3,43
20.
1023
9A
LZH
EIM
ER
'S D
ISE
AS
E T
RE
AT
ME
NT
DA
IIC
HI
SA
NK
YO
BE
NIC
AR
40 M
G65
5970
104
$331
,582
.23
0.44
335,
930
0.17
109
AN
GIO
TE
NS
IN I
I R
EC
EP
TO
R A
NT
AG
.
AU
RO
BIN
DO
CLO
PID
OG
RE
L75
MG
6586
2035
7$3
29,0
37.2
50.
4434
19,2
090.
546
AN
TIP
LAT
ELE
T A
GE
NT
NO
VO
NO
RD
ISK
LEV
EM
IR F
LEX
PE
N10
0/M
L00
1696
439
$325
,115
.31
0.43
353,
514
0.10
235
DIA
BE
TE
S T
RE
AT
ME
NT
TA
KE
DA
DE
XIL
AN
T60
MG
6476
4017
5$3
14,7
57.1
50.
4236
4,79
30.
1415
2G
AS
TR
OIN
TE
ST
INA
L A
GE
NT
BR
IST
OL-
MY
ER
S S
QU
IBB
ON
GLY
ZA
5 M
G00
0034
215
$274
,559
.15
0.37
372,
190
0.06
375
DIA
BE
TE
S T
RE
AT
ME
NT
ELI
LIL
LYF
OR
TE
O20
MC
G/D
OS
E00
0028
400
$270
,859
.31
0.36
3853
30.
021,
236
OS
TE
OP
OR
OS
IS T
RE
AT
ME
NT
ME
RC
KV
YT
OR
IN10
MG
-40M
G66
5820
313
$267
,134
.10
0.36
392,
779
0.08
294
LIP
ID-L
OW
ER
ING
AG
EN
T
AS
TE
LLA
SV
ES
ICA
RE
10 M
G51
2480
151
$264
,184
.00
0.35
404,
018
0.11
200
OV
ER
AC
TIV
E B
LAD
DE
R T
RE
AT
ME
NT
ME
RC
KV
YT
OR
IN10
MG
-20M
G66
5820
312
$261
,525
.69
0.35
412,
675
0.08
302
LIP
ID-L
OW
ER
ING
AG
EN
T
AP
OT
EX
CLO
PID
OG
RE
L75
MG
6050
5025
3$2
40,3
09.4
10.
3242
12,2
530.
3521
AN
TIP
LAT
ELE
T A
GE
NT
NO
VA
RT
ISE
XE
LON
9.5M
G/2
4HR
0007
8050
2$2
40,0
35.7
30.
3243
2,12
00.
0639
0A
LZH
EIM
ER
'S D
ISE
AS
E T
RE
AT
ME
NT
GLA
XO
SM
ITH
KLI
NE
AD
VA
IRD
ISK
US
100
50M
CG
0017
3069
5$2
3801
948
032
443
648
010
223
RE
SP
IRA
TO
RY
AG
EN
TG
LAX
OS
MIT
HK
LIN
EA
DV
AIR
DIS
KU
S10
0-50
MC
G00
1730
695
$238
,019
.48
0.32
443,
648
0.10
223
RE
SP
IRA
TO
RY
AG
EN
T
BR
IST
OL-
MY
ER
S S
QU
IBB
PLA
VIX
75 M
G63
6531
171
$237
,628
.21
0.32
451,
596
0.05
502
AN
TIP
LAT
ELE
T A
GE
NT
PF
IZE
RD
ET
RO
L LA
4 M
G00
0095
191
$235
,782
.07
0.31
461,
937
0.05
416
OV
ER
AC
TIV
E B
LAD
DE
R T
RE
AT
ME
NT
TE
VA
TO
LTE
RO
DIN
E T
AR
TR
AT
E E
R4
MG
0009
3204
9$2
33,9
07.1
00.
3147
3,87
80.
1120
8O
VE
RA
CT
IVE
BLA
DD
ER
TR
EA
TM
EN
T
JOH
NS
ON
& J
OH
NS
ON
ZY
TIG
A25
0 M
G57
8940
150
$229
,489
.62
0.31
4813
80.
002,
675
PR
OS
TA
TE
CA
NC
ER
TR
EA
TM
EN
T
BO
EH
RIN
GE
R I
NG
ELH
EIM
PR
AD
AX
A75
MG
0059
7014
9$2
27,0
77.1
40.
3049
2,46
70.
0733
8A
NT
ICO
AG
ULA
NT
ALL
ER
GA
NA
LPH
AG
AN
P0.
1 %
0002
3932
1$2
26,0
93.8
80.
3050
5,18
00.
1513
8G
LAU
CO
MA
TR
EA
TM
EN
T
GLA
XO
SM
ITH
KLI
NE
VE
NT
OLI
N H
FA
90 M
CG
0017
3068
2$2
10,9
95.0
70.
2856
11,8
080.
3326
RE
SP
IRA
TO
RY
AG
EN
T
AP
OT
EX
AT
OR
VA
ST
AT
IN C
ALC
IUM
20 M
G60
5052
579
$204
,879
.96
0.27
5812
,036
0.34
23LI
PID
-LO
WE
RIN
G A
GE
NT
AP
OT
EX
AT
OR
VA
ST
AT
IN C
ALC
IUM
40 M
G60
5052
580
$176
,823
.07
0.24
719,
757
0.28
42LI
PID
-LO
WE
RIN
G A
GE
NT
TE
VA
PR
OA
IR H
FA
90 M
CG
5931
0057
9$1
64,0
83.9
20.
2276
10,2
230.
2935
RE
SP
IRA
TO
RY
AG
EN
T
AP
OT
EX
AT
OR
VA
ST
AT
IN C
ALC
IUM
10 M
G60
5052
578
$159
,053
.34
0.21
7812
,137
0.34
22LI
PID
-LO
WE
RIN
G A
GE
NT
AP
OT
EX
OM
EP
RA
ZO
LE20
MG
6050
5006
5$1
23,7
66.4
30.
1611
312
,280
0.35
20G
AS
TR
OIN
TE
ST
INA
L A
GE
NT
MY
LAN
OM
EP
RA
ZO
LE20
MG
0037
8615
0$1
18,9
32.8
80.
1611
711
,869
0.34
25G
AS
TR
OIN
TE
ST
INA
L A
GE
NT
KR
EM
ER
S U
RB
AN
OM
EP
RA
ZO
LE20
MG
6217
5011
8$9
2,38
9.95
0.12
146
9,81
20.
2841
GA
ST
RO
INT
ES
TIN
AL
AG
EN
T
UP
SH
ER
-SM
ITH
KLO
R-C
ON
M20
20 M
EQ
0024
5005
8$5
7,49
1.48
0.08
231
14,8
300.
4214
ELE
CT
RO
LYT
E
SA
ND
OZ
PO
TA
SS
IUM
CH
LOR
IDE
20 M
EQ
0078
1572
0$4
8,46
3.05
0.06
266
10,0
170.
2839
ELE
CT
RO
LYT
E
37

PA
GE
3
% O
FA
LLM
AN
UF
AC
TU
RE
RP
RO
DU
CT
ST
RE
NG
TH
ND
C9
CLA
IMS
CLA
IMS
PR
OD
UC
T D
ES
CR
IPT
ION
TU
RE
SE
XP
EN
DIT
UR
EV
OLU
ME
TU
RE
BY
% O
F A
LLR
AN
K B
YR
AN
K
TA
BL
E 3
.2A
PA
CE
HIG
H E
XP
EN
DIT
UR
E A
ND
HIG
H V
OL
UM
E C
LA
IMS
JAN
UA
RY
- D
EC
EM
BE
R 2
014
EX
PE
ND
I-E
XP
EN
DI-
DR
RE
DD
Y'S
OM
EP
RA
ZO
LE20
MG
5511
1015
8$4
3,12
4.12
0.06
289
28,4
300.
802
GA
ST
RO
INT
ES
TIN
AL
AG
EN
T
QU
ALI
TE
ST
HY
DR
OC
OD
ON
E-A
CE
TA
MIN
OP
HE
N5
MG
-325
MG
0060
3389
0$4
0,05
9.06
0.05
312
9,25
80.
2644
AN
ALG
ES
IC N
AR
CO
TIC
AG
EN
T
MY
LAN
LEV
OT
HY
RO
XIN
E S
OD
IUM
50 M
CG
0037
8180
3$3
5,64
2.02
0.05
355
20,9
650.
594
TH
YR
OID
RE
PLA
CE
ME
NT
MY
LAN
LEV
OT
HY
RO
XIN
E S
OD
IUM
75 M
CG
0037
8180
5$3
4,18
5.42
0.05
373
17,7
290.
5010
TH
YR
OID
RE
PLA
CE
ME
NT
LAN
NE
TT
DIG
OX
IN12
5 M
CG
0052
7132
4$2
8,15
3.73
0.04
454
9,24
50.
2645
CA
RD
IAC
GLY
CO
SID
E
TE
VA
VIT
AM
IN D
250
000
UN
IT50
1110
990
$26,
339.
630.
0448
79,
102
0.26
46V
ITA
MIN
SU
PP
LEM
EN
T
MY
LAN
LEV
OT
HY
RO
XIN
E S
OD
IUM
100
MC
G00
3781
809
$23,
908.
070.
0352
312
,339
0.35
19T
HY
RO
ID R
EP
LAC
EM
EN
T
DR
RE
DD
Y'S
CLO
PID
OG
RE
L75
MG
5511
1019
6$1
9,50
9.00
0.03
618
8,63
10.
2449
AN
TIP
LAT
ELE
T A
GE
NT
MY
LAN
LEV
OT
HY
RO
XIN
E S
OD
IUM
25 M
CG
0037
8180
0$1
5,93
3.56
0.02
710
11,4
370.
3227
TH
YR
OID
RE
PLA
CE
ME
NT
CA
MB
ER
AM
LOD
IPIN
E B
ES
YLA
TE
10 M
G31
7220
239
$8,6
10.2
50.
011,
110
12,8
190.
3617
CA
LCIU
M C
HA
NN
EL
BLO
CK
ER
TE
VA
TR
AM
AD
OL
HC
L50
MG
0009
3005
8$7
,065
.09
0.01
1,29
711
,009
0.31
30A
NA
LGE
SIC
NA
RC
OT
IC A
GE
NT
CA
MB
ER
AM
LOD
IPIN
E B
ES
YLA
TE
5 M
G31
7220
238
$7,0
30.2
60.
011,
300
18,8
540.
537
CA
LCIU
M C
HA
NN
EL
BLO
CK
ER
AM
NE
AL
TR
AM
AD
OL
HC
L50
MG
6516
2062
7$7
,017
.36
0.01
1,30
39,
951
0.28
40A
NA
LGE
SIC
NA
RC
OT
IC A
GE
NT
MY
LAN
LOR
AZ
EP
AM
0.5
MG
0037
8232
1$4
,279
.71
0.01
1,78
98,
842
0.25
47A
NX
IOLY
TIC
$M
YLA
NM
ET
OP
RO
LOL
TA
RT
RA
TE
25 M
G00
3780
018
$3,6
77.8
70.
001,
959
19,5
750.
555
BE
TA
BLO
CK
ER
CA
RA
CO
ME
TO
PR
OLO
L T
AR
TR
AT
E25
MG
5766
4050
6$3
,126
.34
0.00
2,12
211
,361
0.32
28B
ET
A B
LOC
KE
R
WA
TS
ON
LOR
AZ
EP
AM
0.5
MG
0059
1024
0$2
,787
.84
0.00
2,24
611
,008
0.31
31A
NX
IOLY
TIC
LUP
INLI
SIN
OP
RIL
20 M
G68
1800
515
$1,8
44.1
40.
002,
755
12,6
340.
3618
AC
E I
NH
IBIT
OR
CA
RA
CO
ME
TO
PR
OLO
L T
AR
TR
AT
E50
MG
5766
4047
7$1
,426
.49
0.00
3,06
810
,022
0.28
38B
ET
A B
LOC
KE
R
MY
LAN
ME
TO
PR
OLO
L T
AR
TR
AT
E50
MG
0037
8003
2$1
,242
.94
0.00
3,26
08,
572
0.24
50B
ET
A B
LOC
KE
R
QU
ALI
TE
ST
FU
RO
SE
MID
E40
MG
0060
3374
0$1
,062
.65
0.00
3,45
318
,219
0.51
9D
IUR
ET
IC
LUP
INLI
SIN
OP
RIL
10 M
G68
1800
514
$752
.83
0.00
3,93
613
,008
0.37
16A
CE
IN
HIB
ITO
R
SA
ND
OZ
FU
RO
SE
MID
E40
MG
0078
1196
6$6
44.7
40.
004,
142
11,9
300.
3424
DIU
RE
TIC
QU
ALI
TE
ST
FU
RO
SE
MID
E20
MG
0060
3373
9$4
94.8
10.
004,
539
16,4
000.
4612
DIU
RE
TIC
SA
ND
OZ
FU
RO
SE
MID
E20
MG
0078
1181
8$3
24.8
80.
005,
146
10,1
880.
2936
DIU
RE
TIC
TO
TA
L $2
8,75
9,40
3.57
38.3
081
4,67
523
.01
85 P
RO
DU
CT
S
TO
TA
L $7
5,08
0,77
7.01
100.
003,
541,
146
100.
00
ALL
PR
OD
UC
TS
NO
TE
: D
AT
A I
NC
LUD
E O
RIG
INA
L, P
AID
CLA
IMS
BY
DA
TE
OF
PA
YM
EN
T F
OR
PA
CE
ON
LY,
EX
CLU
DIN
G P
AC
EN
ET
.S
OU
RC
E:
PD
A/C
LAIM
S H
IST
OR
Y
38

PA
GE
1
ST
AT
ER
AN
K B
YC
AR
DH
OLD
ER
SH
AR
ET
OT
AL
% O
FE
XP
EN
DI-
% O
FM
AN
UF
AC
TU
RE
RP
RO
DU
CT
ST
RE
NG
TH
ND
C9
EX
PE
ND
ITU
RE
SE
XP
EN
DIT
UR
ES
EX
PE
ND
ITU
RE
ST
OT
AL
TU
RE
SC
LAIM
S
TO
TA
L
BO
EH
RIN
GE
R I
NG
ELH
EIM
SP
IRIV
A18
MC
G00
5970
075
$10,
211,
427.
89$3
,695
,246
.39
$13,
906,
674.
283.
221
42,6
990.
841
AS
TR
A Z
EN
EC
AN
EX
IUM
40 M
G00
1865
040
$7,7
92,5
60.9
2$2
,913
,122
.80
$10,
705,
683.
722.
542
34,1
860.
673
SA
NO
FI-
AV
EN
TIS
LAN
TU
S S
OL
OS
TA
R10
0/M
L00
0882
219
$7,0
07,6
84.9
8$2
,464
,091
.62
$9,4
71,7
76.6
02.
153
22,8
630.
4511
GLA
XO
SM
ITH
KLI
NE
AD
VA
IR D
ISK
US
250-
50 M
CG
0017
3069
6$6
,450
,866
.82
$2,3
73,1
37.3
6$8
,824
,004
.18
2.07
427
,506
0.54
6
ME
RC
KZ
ET
IA10
MG
6658
2041
4$4
,371
,163
.96
$1,7
58,0
89.9
1$6
,129
,253
.87
1.53
526
,342
0.52
7
SA
NO
FI-
AV
EN
TIS
LAN
TU
S10
0/M
L00
0882
220
$4,5
88,0
23.1
0$1
,531
,019
.89
$6,1
19,0
42.9
91.
336
15,8
240.
3126
ME
RC
KJA
NU
VIA
100
MG
0000
6027
7$4
,492
,441
.09
$1,5
24,3
44.5
0$6
,016
,785
.59
1.33
716
,542
0.32
24
PF
IZE
RC
ELE
BR
EX
200
MG
0002
5152
5$3
,813
,998
.00
$1,4
79,6
69.6
7$5
,293
,667
.67
1.29
818
,989
0.37
15
FO
RE
ST
NA
ME
ND
A10
MG
0045
6321
0$3
,873
,729
.99
$1,4
05,4
59.8
9$5
,279
,189
.88
1.22
917
,432
0.34
21
AS
TR
A Z
EN
EC
AC
RE
ST
OR
10 M
G00
3100
751
$3,0
50,5
59.6
1$1
,125
,476
.46
$4,1
76,0
36.0
70.
9810
18,3
310.
3616
NO
VO
NO
RD
ISK
NO
VO
LOG
FLE
XP
EN
100/
ML
0016
9633
9$3
,076
,848
.22
$1,0
93,6
27.5
4$4
,170
,475
.76
0.95
119,
168
0.18
89
JOH
NS
ON
& J
OH
NS
ON
XA
RE
LTO
20 M
G50
4580
579
$2,4
63,0
07.0
7$9
84,9
55.9
9$3
,447
,963
.06
0.86
1210
,480
0.21
68
AS
TR
A Z
EN
EC
AS
YM
BIC
OR
T16
0-4.
5MC
G00
1860
370
$1,9
47,2
90.7
9$8
89,9
65.7
1$2
,837
,256
.50
0.77
1310
,053
0.20
75
ME
RC
KJA
NU
VIA
50M
G00
0060
112
$237
756
169
$864
751
39$3
242
313
080
7514
899
30
1893
VO
LUM
E
TA
BL
E 3
.2B
PA
CE
NE
T H
IGH
EX
PE
ND
ITU
RE
AN
D H
IGH
VO
LU
ME
CL
AIM
SJA
NU
AR
Y -
DE
CE
MB
ER
201
4
RA
NK
BY
ME
RC
KJA
NU
VIA
50 M
G00
0060
112
$2,3
77,5
61.6
9$8
64,7
51.3
9$3
,242
,313
.08
0.75
148,
993
0.18
93
GLA
XO
SM
ITH
KLI
NE
AD
VA
IR D
ISK
US
500-
50 M
CG
0017
3069
7$2
,240
,841
.24
$853
,190
.91
$3,0
94,0
32.1
50.
7415
7,34
90.
1413
8
BO
EH
RIN
GE
R I
NG
ELH
EIM
PR
AD
AX
A15
0 M
G00
5970
135
$2,0
41,9
55.7
4$8
51,7
20.2
2$2
,893
,675
.96
0.74
168,
659
0.17
97
NO
VO
NO
RD
ISK
LE
VE
MIR
FL
EX
PE
N10
0/M
L00
1696
439
$2,3
63,5
90.2
7$8
21,7
11.7
6$3
,185
,302
.03
0.72
177,
515
0.15
130
BO
EH
RIN
GE
R I
NG
ELH
EIM
AG
GR
EN
OX
25M
G-2
00M
G00
5970
001
$1,9
39,5
07.4
1$8
17,1
94.8
3$2
,756
,702
.24
0.71
187,
623
0.15
125
NO
VA
RT
ISD
IOV
AN
160
MG
0007
8035
9$1
,610
,282
.17
$785
,587
.99
$2,3
95,8
70.1
60.
6819
12,4
200.
2448
BO
EH
RIN
GE
R I
NG
ELH
EIM
TR
AD
JEN
TA
5 M
G00
5970
140
$1,2
80,5
33.1
4$7
77,4
78.7
9$2
,058
,011
.93
0.68
206,
090
0.12
182
JOH
NS
ON
& J
OH
NS
ON
ZY
TIG
A25
0 M
G57
8940
150
$1,8
88,6
71.0
9$7
69,7
42.7
8$2
,658
,413
.87
0.67
2140
00.
011,
908
AS
TR
A Z
EN
EC
AC
RE
ST
OR
20 M
G00
3100
752
$2,0
53,1
34.4
4$7
60,7
84.5
0$2
,813
,918
.94
0.66
2212
,217
0.24
50
NO
VO
NO
RD
ISK
NO
VO
LOG
MIX
70-
30 F
LEX
PE
N 7
0-30
/ML
0016
9369
6$2
,089
,742
.12
$755
,479
.80
$2,8
45,2
21.9
20.
6623
4,85
40.
1024
0
AS
TR
A Z
EN
EC
AC
RE
ST
OR
5 M
G00
3100
755
$1,7
54,5
37.7
6$7
46,5
60.2
0$2
,501
,097
.96
0.65
2411
,368
0.22
60
ALL
ER
GA
NLU
MIG
AN
0.01
%00
0233
205
$1,6
42,8
79.5
3$7
41,4
83.3
8$2
,384
,362
.91
0.65
2515
,226
0.30
31
BO
EH
RIN
GE
R I
NG
ELH
EIM
CO
MB
IVE
NT
RE
SP
IMA
T
20-
100
MC
G00
5970
024
$1,6
62,2
55.4
0$6
46,1
84.2
9$2
,308
,439
.69
0.56
267,
420
0.15
135
NO
VA
RT
ISD
IOV
AN
320
MG
0007
8036
0$1
,368
,904
.95
$645
,069
.42
$2,0
13,9
74.3
70.
5627
9,26
30.
1885
ALL
ER
GA
NR
ES
TA
SIS
0.05
%00
0239
163
$1,8
10,2
61.0
4$6
28,1
56.6
6$2
,438
,417
.70
0.55
286,
502
0.13
166
AS
TE
LLA
SV
ES
ICA
RE
5 M
G51
2480
150
$1,6
32,6
15.5
5$6
04,8
71.1
2$2
,237
,486
.67
0.53
298,
629
0.17
100
ELI
LIL
LYH
UM
ALO
G10
0/M
L00
0028
799
$1,4
15,0
80.8
2$5
78,3
80.8
6$1
,993
,461
.68
0.50
304,
191
0.08
282
39

PA
GE
2
ST
AT
ER
AN
K B
YC
AR
DH
OLD
ER
SH
AR
ET
OT
AL
% O
FE
XP
EN
DI-
% O
FM
AN
UF
AC
TU
RE
RP
RO
DU
CT
ST
RE
NG
TH
ND
C9
EX
PE
ND
ITU
RE
SE
XP
EN
DIT
UR
ES
EX
PE
ND
ITU
RE
ST
OT
AL
TU
RE
SC
LAIM
S
TO
TA
LV
OLU
ME
TA
BL
E 3
.2B
PA
CE
NE
T H
IGH
EX
PE
ND
ITU
RE
AN
D H
IGH
VO
LU
ME
CL
AIM
SJA
NU
AR
Y -
DE
CE
MB
ER
201
4
RA
NK
BY
CE
LGE
NE
RE
VLI
MID
10 M
G59
5720
410
$1,1
68,7
05.9
9$5
69,5
23.2
7$1
,738
,229
.26
0.50
3117
50.
002,
842
ALC
ON
TR
AV
AT
AN
Z0.
004
%00
0650
260
$1,1
41,1
21.2
8$5
63,5
15.6
8$1
,704
,636
.96
0.49
3211
,966
0.23
55
NO
VA
RT
ISD
IOV
AN
80 M
G00
0780
358
$1,0
57,8
64.1
9$5
57,2
11.3
2$1
,615
,075
.51
0.49
339,
227
0.18
87
JOH
NS
ON
& J
OH
NS
ON
XA
RE
LTO
15 M
G50
4580
578
$1,3
01,0
99.6
3$5
42,7
60.0
1$1
,843
,859
.64
0.47
345,
730
0.11
195
SA
NO
FI-
AV
EN
TIS
MU
LTA
Q40
0 M
G00
0244
142
$1,1
80,2
35.4
7$5
02,3
75.7
4$1
,682
,611
.21
0.44
353,
882
0.08
313
TA
KE
DA
DE
XIL
AN
T6
0 M
G64
7640
175
$893
,800
.32
$496
,699
.74
$1,3
90,5
00.0
60.
4336
6,52
70.
1316
5
GIL
EA
D S
CIE
NC
ES
RA
NE
XA
500
MG
6195
8100
3$1
,099
,657
.01
$494
,832
.38
$1,5
94,4
89.3
90.
4337
5,45
80.
1121
0
NO
VO
NO
RD
ISK
NO
VO
LOG
100/
ML
0016
9750
1$1
,408
,042
.22
$488
,196
.42
$1,8
96,2
38.6
40.
4338
5,75
90.
1119
4
AM
GE
NE
NB
RE
L50
MG
/ML
5840
6044
5$1
,792
,241
.85
$480
,397
.12
$2,2
72,6
38.9
70.
4239
791
0.02
1,23
8
NO
VO
NO
RD
ISK
VIC
TO
ZA
3-P
AK
0.6M
G/0
.100
1694
060
$1,1
22,3
44.4
1$4
67,6
99.2
2$1
,590
,043
.63
0.41
402,
665
0.05
454
FO
RE
ST
NA
ME
ND
A X
R28
MG
0045
6342
8$1
,060
,812
.74
$463
,289
.38
$1,5
24,1
02.1
20.
4041
5,28
00.
1021
7
ELI
LIL
LYF
OR
TE
O20
MC
G/D
OS
E00
0028
400
$1,2
05,9
35.3
0$4
50,8
72.9
0$1
,656
,808
.20
0.39
421,
054
0.02
981
DA
IIC
HI
SA
NK
YO
BE
NIC
AR
40 M
G65
5970
104
$1,1
88,4
69.3
7$4
42,9
36.8
6$1
,631
,406
.23
0.39
438,
079
0.16
113
AB
BO
TT
HU
MIR
A40
MG
/08M
L00
0744
339
$184
051
974
$441
845
98$2
282
365
720
3844
759
001
127
4A
BB
OT
TH
UM
IRA
40M
G/0
.8M
L00
0744
339
$1,8
40,5
19.7
4$4
41,8
45.9
8$2
,282
,365
.72
0.38
4475
90.
011,
274
NO
VA
RT
ISE
XE
LON
9.5M
G/2
4HR
0007
8050
2$8
88,0
04.2
4$4
06,9
22.8
7$1
,294
,927
.11
0.35
453,
573
0.07
344
BR
IST
OL-
MY
ER
S S
QU
IBB
ON
GLY
ZA
5 M
G00
0034
215
$666
,647
.22
$399
,288
.85
$1,0
65,9
36.0
70.
3546
3,16
90.
0637
5
NO
VA
RT
ISA
FIN
ITO
R10
MG
0007
8056
7$5
36,4
42.8
5$3
97,6
12.1
6$9
34,0
55.0
10.
3547
980.
003,
592
PF
IZE
RLY
RIC
A75
MG
0007
1101
4$8
87,1
40.0
6$3
97,3
67.1
9$1
,284
,507
.25
0.35
484,
261
0.08
276
AU
RO
BIN
DO
CLO
PID
OG
RE
L75
MG
6586
2035
7$5
85,0
44.5
3$3
94,0
14.7
2$9
79,0
59.2
50.
3449
28,8
200.
574
AS
TE
LLA
SV
ES
ICA
RE
10 M
G51
2480
151
$1,1
38,8
35.3
5$3
92,5
26.8
1$1
,531
,362
.16
0.34
505,
926
0.12
185
GLA
XO
SM
ITH
KLI
NE
VE
NT
OLI
N H
FA
90 M
CG
0017
3068
2$5
86,0
94.9
7$2
96,5
48.0
2$8
82,6
42.9
90.
2666
17,5
790.
3420
AP
OT
EX
CLO
PID
OG
RE
L75
MG
6050
5025
3$3
85,0
61.0
2$2
41,6
38.2
6$6
26,6
99.2
80.
2183
17,4
170.
3422
TE
VA
PR
OA
IR H
FA
90 M
CG
5931
0057
9$5
58,3
47.7
1$2
28,4
45.7
9$7
86,7
93.5
00.
2093
14,1
680.
2840
AP
OT
EX
AT
OR
VA
ST
AT
IN C
ALC
IUM
20
MG
6050
5257
9$3
68,7
88.8
1$2
06,0
01.0
7$5
74,7
89.8
80.
1810
316
,148
0.32
25
BE
CT
ON
DIC
KIN
SO
NB
D U
LTR
A-F
INE
PE
N N
EE
DLE
32
GX
5/3
2"08
2903
201
$403
,324
.46
$202
,732
.08
$606
,056
.54
0.18
104
15,0
310.
2932
AP
OT
EX
AT
OR
VA
ST
AT
IN C
ALC
IUM
40 M
G60
5052
580
$298
,686
.85
$178
,493
.02
$477
,179
.87
0.16
120
14,2
540.
2838
AP
OT
EX
OM
EP
RA
ZO
LE20
MG
6050
5006
5$1
74,0
23.8
0$1
47,3
14.9
6$3
21,3
38.7
60.
1315
017
,042
0.33
23
AC
TA
VIS
TA
MS
ULO
SIN
HC
L0.
4 M
G00
2282
996
$242
,781
.15
$146
,495
.59
$389
,276
.74
0.13
151
14,1
740.
2839
AP
OT
EX
AT
OR
VA
ST
AT
IN C
ALC
IUM
10 M
G60
5052
578
$227
,568
.49
$115
,873
.51
$343
,442
.00
0.10
180
15,0
090.
2933
KR
EM
ER
S U
RB
AN
OM
EP
RA
ZO
LE20
MG
6217
5011
8$1
54,1
65.0
7$9
2,59
1.14
$246
,756
.21
0.08
224
13,7
520.
2742
40

PA
GE
3
ST
AT
ER
AN
K B
YC
AR
DH
OLD
ER
SH
AR
ET
OT
AL
% O
FE
XP
EN
DI-
% O
FM
AN
UF
AC
TU
RE
RP
RO
DU
CT
ST
RE
NG
TH
ND
C9
EX
PE
ND
ITU
RE
SE
XP
EN
DIT
UR
ES
EX
PE
ND
ITU
RE
ST
OT
AL
TU
RE
SC
LAIM
S
TO
TA
LV
OLU
ME
TA
BL
E 3
.2B
PA
CE
NE
T H
IGH
EX
PE
ND
ITU
RE
AN
D H
IGH
VO
LU
ME
CL
AIM
SJA
NU
AR
Y -
DE
CE
MB
ER
201
4
RA
NK
BY
MY
LAN
OM
EP
RA
ZO
LE20
MG
0037
8615
0$1
30,9
97.9
9$7
9,80
7.98
$210
,805
.97
0.07
247
13,3
110.
2646
SA
ND
OZ
PO
TA
SS
IUM
CH
LOR
IDE
20 M
EQ
0078
1572
0$2
62,2
99.0
3$5
0,98
2.40
$313
,281
.43
0.04
354
14,4
830.
2835
UP
SH
ER
-SM
ITH
KLO
R-C
ON
M20
20 M
EQ
0024
5005
8$4
66,0
98.4
1$4
7,21
1.31
$513
,309
.72
0.04
374
21,4
610.
4213
QU
ALI
TE
ST
HY
DR
OC
OD
ON
E-A
CE
TO
MIN
OP
HE
N5
MG
-325
MG
0060
3389
0$1
90,8
78.5
7$4
6,64
6.80
$237
,525
.37
0.04
378
14,9
100.
2934
DR
RE
DD
Y'S
OM
EP
RA
ZO
LE20
MG
5511
1015
8$3
54,4
96.5
6$4
0,86
6.87
$395
,363
.43
0.04
425
38,0
610.
752
DR
RE
DD
Y'S
CLO
PID
OG
RE
L75
MG
5511
1019
6$2
37,2
10.6
8$2
9,53
8.89
$266
,749
.57
0.03
551
13,6
030.
2744
TE
VA
PR
AV
AS
TA
TIN
SO
DIU
,4
0 M
G00
0937
202
$317
,654
.46
$25,
575.
62$3
43,2
30.0
80.
0261
212
,441
0.24
47
MY
LAN
LEV
OT
HY
RO
XIN
E S
OD
IUM
75 M
CG
0037
8180
5$2
77,1
39.9
6$1
4,21
1.71
$291
,351
.67
0.01
961
20,5
380.
4014
MY
LAN
LEV
OT
HY
RO
XIN
E S
OD
IUM
50 M
CG
0037
8180
3$3
03,0
38.1
1$1
3,54
9.15
$316
,587
.26
0.01
1,00
024
,186
0.47
10
MY
LAN
LEV
OT
HY
RO
XIN
E S
OD
IUM
100
MC
G00
3781
809
$216
,431
.43
$11,
657.
75$2
28,0
89.1
80.
011,
123
15,6
110.
3129
AM
NE
AL
TR
AM
AD
OL
HC
L50
MG
6516
2062
7$1
07,9
47.3
8$6
,094
.35
$114
,041
.73
0.01
1,69
715
,426
0.30
30
MY
LAN
LEV
OT
HY
RO
XIN
E S
OD
IUM
25 M
CG
0037
8180
0$1
59,2
23.2
5$5
,276
.54
$164
,499
.79
0.00
1,84
914
,013
0.27
41
TE
VA
TR
AM
AD
OL
HC
L50
MG
0009
3005
8$9
5,75
3.27
$4,5
33.4
5$1
00,2
86.7
20.
002,
010
13,6
460.
2743
CA
MB
ER
AM
LO
DIP
INE
BE
SY
LA
TE
10 M
G31
7220
239
$137
,910
.37
$3,0
74.1
9$1
40,9
84.5
60.
002,
458
17,6
310.
3518
CA
MB
ER
AM
LOD
IPIN
EB
ES
YLA
TE
5M
G31
7220
238
$166
313
61$1
639
29$1
6795
290
000
325
524
865
049
9C
AM
BE
RA
MLO
DIP
INE
BE
SY
LAT
E5
MG
3172
2023
8$1
66,3
13.6
1$1
,639
.29
$167
,952
.90
0.00
3,25
524
,865
0.49
9
WA
TS
ON
LOR
AZ
EP
AM
0.5
MG
0059
1024
0$8
7,82
7.89
$1,2
00.7
6$8
9,02
8.65
0.00
3,66
115
,784
0.31
27
MY
LAN
ME
TO
PR
OLO
L T
AR
TR
AT
E25
MG
0037
8001
8$1
47,2
42.6
2$8
62.1
2$1
48,1
04.7
40.
004,
127
27,9
530.
555
LUP
INLI
SIN
OP
RIL
20 M
G68
1800
515
$98,
007.
25$6
62.3
0$9
8,66
9.55
0.00
4,49
317
,604
0.35
19
CA
RA
CO
ME
TO
PR
OLO
L T
AR
TR
AT
E25
MG
5766
4050
6$8
1,23
5.51
$528
.16
$81,
763.
670.
004,
797
15,7
720.
3128
LUP
INLI
SIN
OP
RIL
5 M
G68
1800
513
$54,
855.
81$3
52.7
2$5
5,20
8.53
0.00
5,36
412
,365
0.24
49
CA
RA
CO
ME
TO
PR
OLO
L T
AR
TR
AT
E50
MG
5766
4047
7$7
5,12
8.26
$275
.33
$75,
403.
590.
005,
677
14,2
640.
2837
LUP
INLI
SIN
OP
RIL
10 M
G68
1800
514
$89,
718.
89$2
24.3
6$8
9,94
3.25
0.00
5,92
617
,934
0.35
17
QU
ALI
TE
ST
FU
RO
SE
MID
E40
MG
0060
3374
0$9
5,01
2.62
$175
.11
$95,
187.
730.
006,
248
25,2
670.
508
RA
NB
AX
YF
UR
OS
EM
IDE
40 M
G63
3040
625
$52,
082.
59$1
45.9
0$5
2,22
8.49
0.00
6,44
513
,314
0.26
45
QU
ALI
TE
ST
FU
RO
SE
MID
E20
MG
0060
3373
9$7
2,47
6.22
$123
.28
$72,
599.
500.
006,
622
21,7
420.
4312
SA
ND
OZ
FU
RO
SE
MID
E40
MG
0078
1196
6$5
2,69
2.43
$94.
51$5
2,78
6.94
0.00
6,87
914
,406
0.28
36
TO
TA
L$1
24,2
03,4
36.0
7$4
7,47
7,88
9.54
$171
,681
,325
.61
41.3
31,
147,
498
22.5
1
86 P
RO
DU
CT
S
TO
TA
L$2
89,7
91,6
73.6
5$1
14,8
63,5
27.9
3$4
04,6
55,2
01.5
810
0.00
5,09
8,78
710
0.00
ALL
PR
OD
UC
TS
NO
TE
: D
AT
A I
NC
LUD
E O
RIG
INA
L, P
AID
PA
CE
NE
T C
LAIM
S B
Y D
AT
E O
F P
AY
ME
NT
. T
OT
AL
CLA
IMS
IN
CLU
DE
DE
DU
CT
IBLE
CLA
IMS
AN
D C
OP
AID
CLA
IMS
.S
OU
RC
E:
PD
A C
LAIM
S H
IST
OR
Y
41

PA
GE
1
AS
SO
CIA
TE
D N
DC
RA
NK
BY
% O
F A
LL
% O
F A
LL
MA
NU
FA
CT
UR
ER
LA
BE
LE
R C
OD
ES
EX
PE
ND
ITU
RE
EX
PE
ND
ITU
RE
EX
PE
ND
ITU
RE
S
CL
AIM
SC
LA
IMS
AS
TR
A Z
EN
EC
A00
186,
003
101
$13,
004,
658.
606.
8%17
6,21
02.
0%
NO
VA
RT
IS00
067,
000
78, 0
0168
, 001
85, 0
0281
, 00
462,
007
81, 4
1679
, 613
14, 6
2577
, 63
851,
665
21, 6
6685
, 667
58
2$1
2,83
8,97
5.69
6.8%
684,
478
7.9%
BO
EH
RIN
GE
R IN
GE
LHE
IM00
054,
005
973
$12,
605,
917.
536.
6%21
9,91
62.
5%
ME
RC
K00
006,
000
85, 1
1523
, 411
00, 6
6582
4$1
0,93
6,46
7.81
5.8%
145,
041
1.7%
PF
IZE
R00
005,
000
08, 0
0009
, 000
13, 0
0025
, 00
046,
000
49, 0
0069
, 000
71, 0
0206
, 00
641,
597
62, 6
0793
, 615
70
5$1
0,33
8,39
5.54
5.4%
275,
160
3.2%
GLA
XO
SM
ITH
KLI
NE
0000
7, 0
0029
, 001
45, 0
0173
, 195
15,
4940
1, 4
9702
, 630
326
$9,4
20,1
87.5
05.
0%14
0,21
71.
6%
TA
BL
E 3
.3P
AC
E A
ND
PA
CE
NE
T N
UM
BE
R A
ND
PE
RC
EN
T O
F E
XP
EN
DIT
UR
ES
AN
D C
LA
IMS
BY
MA
NU
FA
CT
UR
ER
JAN
UA
RY
- D
EC
EM
BE
R 2
014
AC
TA
VIS
0022
8, 0
0258
, 004
30, 0
0456
, 004
72,
0053
5, 0
0536
, 005
91, 0
0785
, 145
50,
1625
2, 4
5963
, 525
44, 6
2037
, 677
67
7$8
,935
,040
.20
4.7%
421,
711
4.9%
TE
VA
0009
3, 0
0172
, 001
82. 0
0555
, 007
03,
5011
1, 5
1285
, 578
44, 5
9310
, 634
59,
6854
6
8$8
,567
,355
.03
4.5%
853,
933
9.9%
SA
NO
FI
0002
4, 0
0039
, 000
66, 0
0068
, 000
75,
0008
8, 0
0955
9$7
,138
,008
.00
3.8%
69,3
190.
8%
NO
VO
NO
RD
ISK
0016
910
$6,8
56,1
26.3
33.
6%69
,122
0.8%
JOH
NS
ON
& J
OH
NS
ON
0006
2, 0
0501
, 101
47, 5
0458
, 578
94,
5967
6, 6
8669
11$5
,909
,812
.84
3.1%
39,9
080.
5%
MY
LAN
0037
8, 4
9502
, 510
7912
$5,8
93,2
34.4
13.
1%78
5,32
39.
1%
ELI
LIL
LY00
002,
007
7713
$5,4
83,1
49.0
22.
9%43
,929
0.5%
42

PA
GE
2
AS
SO
CIA
TE
D N
DC
RA
NK
BY
% O
F A
LL
% O
F A
LL
MA
NU
FA
CT
UR
ER
LA
BE
LE
R C
OD
ES
EX
PE
ND
ITU
RE
EX
PE
ND
ITU
RE
EX
PE
ND
ITU
RE
S
CL
AIM
SC
LA
IMS
TA
BL
E 3
.3P
AC
E A
ND
PA
CE
NE
T N
UM
BE
R A
ND
PE
RC
EN
T O
F E
XP
EN
DIT
UR
ES
AN
D C
LA
IMS
BY
MA
NU
FA
CT
UR
ER
JAN
UA
RY
- D
EC
EM
BE
R 2
014
ALL
ER
GA
N00
023,
119
80, 6
0758
14$3
,700
,104
.84
1.9%
71,3
620.
8%
AP
OT
EX
6050
515
$3,4
21,2
09.9
61.
8%27
7,94
83.
2%
DA
IIC
HI S
AN
KY
O, I
NC
.63
395,
655
9716
$3,1
67,1
03.1
21.
7%55
,442
0.6%
BR
IST
OL-
MY
ER
S S
QU
IBB
0000
3, 0
0056
, 000
87, 6
3653
17$3
,091
,244
.18
1.6%
26,5
570.
3%
TA
KE
DA
6476
418
$2,8
03,8
43.4
51.
5%37
,307
0.4%
AM
GE
N55
513,
584
0619
$2,7
89,4
62.3
21.
5%6,
155
0.1%
AS
TE
LLA
S00
469,
512
4820
$2,7
70,2
41.6
61.
5%31
,329
0.4%
BA
US
CH
& L
OM
B00
187,
008
84, 1
3548
, 242
08, 2
5010
, 42
702,
644
55, 6
6490
, 674
25, 6
8682
, 68
782,
9920
7
21$2
,752
,364
.62
1.4%
61,4
080.
7%
6878
2, 9
9207
ALC
ON
0006
5, 0
0299
, 009
9822
$2,5
17,3
95.1
71.
3%46
,876
0.5%
EN
DO
/QU
ALI
TE
ST
0060
3, 6
0951
, 634
81, 6
7253
, 679
79,
6877
423
$2,1
33,4
41.2
11.
1%49
3,86
95.
7%
AB
BO
TT
0003
2, 0
0051
, 000
7424
$2,1
03,7
45.1
10.
6%42
,646
5.1%
AU
RO
BIN
DO
1310
7, 6
5862
25$1
,998
,422
.28
0.6%
279,
390
5.1%
TO
TA
L, T
OP
25
MA
NU
FA
CT
UR
ER
S$1
51,1
75,9
06.4
279
.6%
5,35
4,55
662
.0%
TO
TA
L, A
LL O
TH
ER
MA
NU
FA
CT
UR
ER
S$3
8,76
8,39
8.52
20.4
%3,
285,
377
38.0
%
TO
TA
L, A
LL M
AN
UF
AC
TU
RE
RS
$189
,944
,304
.94
100.
0%8,
639,
933
100.
0%
M
AN
UF
AC
TU
RE
R D
AT
A A
RE
SU
MM
AR
IZE
D B
Y T
HE
FIR
ST
FIV
E D
IGIT
S O
F T
HE
11-
DIG
IT N
AT
ION
AL
DR
UG
CO
DE
, i.e
., LA
BE
LER
CO
DE
.
SO
UR
CE
: PD
A C
LAIM
S H
IST
OR
YN
OT
ES
: D
AT
A IN
CLU
DE
OR
IGIN
AL,
PA
ID C
LAIM
S B
Y D
AT
E O
F P
AY
ME
NT
.
43

91-9
2T
HR
OU
GH
04-0
505
-06
06-0
707
-08
08-0
909
-10
10-1
111
-12
12-1
313
-14
14-1
5 Y
TD
RE
CE
IPT
S R
EC
EIP
TS
RE
CE
IPT
SR
EC
EIP
TS
RE
CE
IPT
SR
EC
EIP
TS
RE
CE
IPT
SR
EC
EIP
TS
RE
CE
IPT
SR
EC
EIP
TS
RE
CE
IPT
ST
OT
AL
JAN
-DE
C
1991
$22,
750,
782
$0$0
$20,
846
$0$0
$2,0
49$0
$0$2
26$0
$22,
773,
902
JAN
-DE
C
1992
$30,
124,
579
$0$0
$19,
211
$0$0
$3,3
95$3
$0$0
$0$3
0,14
7,18
7
JAN
-DE
C
1993
$32,
004,
504
$0$0
$12,
634
$0$0
$0$0
$0$0
$32,
017,
138
JAN
-DE
C
1994
$30,
666,
163
$0$2
48$0
$0$0
$0$2
$0$0
$0$3
0,66
6,41
3
JAN
-DE
C
1995
$32,
642,
778
$0$0
$0$0
$0$0
$60,
162
$0$0
$32,
702,
940
JAN
-DE
C
1996
$31,
176,
963
$0$0
$2,2
85$0
$0$0
$0$4
,602
$332
$0$3
1,18
4,18
1
JAN
-DE
C
1997
$38,
786,
457
$1,5
52$0
$12,
686
$0$3
,203
$2,3
97$0
$4,8
35($
672)
$0$3
8,81
0,45
8
JAN
-DE
C
1998
$48,
861,
633
$1,7
88$0
$12,
158
$0$1
57$1
,117
$0($
724)
($25
,719
)$0
$48,
850,
410
JAN
-DE
C19
99$5
2,28
9,75
6$2
17,6
71$0
$1,2
80$8
,203
$26,
070
$0$0
$14,
948
$21,
133
$0$5
2,57
9,06
0
JAN
-DE
C20
00$5
8,80
0,62
3$8
23$0
$186
,718
$0$0
$0$0
$15,
860
$13,
351
$0$5
9,01
7,37
5
JAN
-DE
C20
01$5
8,32
1,28
8($
78,0
55)
$18
$0$0
$0($
277)
($23
7)$4
,089
$9,9
34$0
$58,
256,
761
JAN
-DE
C20
02$7
5,38
6,26
2$4
43,5
63$3
,115
$4,0
75$1
,070
($61
9,51
5)($
21,5
93)
$0$6
7,12
6$2
36,9
61$0
$75,
501,
064
JAN
-DE
C20
03$9
6,24
0,85
5$7
,358
,829
($2,
733,
936)
$2,1
40$6
7,45
2$7
99,3
65$9
0,48
0($
17,4
38)
$110
,126
$60,
352
$0$1
01,9
78,2
25
JAN
-DE
C20
04$1
10,8
71,0
67$1
1,19
5,52
7$1
,651
,884
$171
,080
$57,
407
$248
,195
($31
9,33
1)$1
3,49
0$2
19,1
04$2
87,7
53$2
,863
$124
,399
,037
JAN
-DE
C20
05$1
2,45
0,10
3$1
19,8
35,7
90$1
,471
,061
($1,
052,
559)
$62,
506
$247
,835
($37
,832
)$4
,154
$104
,207
$84,
208
$1,8
48$1
33,1
71,3
22
JAN
-DE
C20
06$0
$25,
420,
400
$91,
426,
990
$1,6
48,3
92$2
99,6
90$4
66,6
18($
104,
619)
$4,1
05$2
05,0
36$8
,133
$3,6
70$1
19,3
78,4
17
JAN
-DE
C20
07$0
$0$6
,579
,637
$63,
067,
444
$362
,997
$3,1
92,4
81$5
42,4
78$1
89,7
71$7
8,23
5$1
1,23
3$1
88,9
44$7
4,21
3,21
9
JAN
-DE
C20
08$0
$0$0
$4,7
81,6
79$5
2,19
9,69
6$2
,561
,190
($47
,469
)$5
79,5
16($
62,8
75)
$274
,759
$62,
197
$60,
348,
693
JAN
-DE
C20
09$0
$0$0
$0$1
1,78
2,45
5$5
1,97
6,63
3$9
92,3
11$7
28,0
39$1
,622
,644
$137
,799
$91,
829
$67,
331,
710
JAN
-MA
R20
10$0
$0$0
$0$0
$4,1
20,8
23$7
,102
,307
$514
,401
$714
,977
($81
,312
)$2
,144
$12,
373,
341
AP
R-J
UN
2010
$0$0
$0$0
$0$0
$14,
253,
383
$475
,941
$101
,791
($15
6,34
2)($
7,74
4)$1
4,66
7,03
0
JUL-
SE
P20
10$0
$0$0
$0$0
$0$2
0,51
0,43
3$6
68,4
16$5
63,5
82$4
8,89
2($
6,07
4)$2
1,78
5,24
9
OC
T-D
EC
2010
$0$0
$0$0
$0$0
$24,
506,
336
$1,9
80,6
63$6
39,8
41$1
16,9
72($
42,7
53)
$27,
201,
059
JAN
-MA
R20
11$0
$0$0
$0$0
$0$8
,799
,454
$12,
183,
650
$364
,397
$74,
793
$45,
034
$21,
467,
328
AP
R-J
UN
2011
$0$0
$0$0
$0$0
$0$9
,546
,323
$466
,267
$37,
654
$253
,352
$10,
303,
596
JUL-
SE
P20
11$0
$0$0
$0$0
$0$0
$8,2
69,7
59$2
43,4
09$5
5,18
3$3
22,2
20$8
,890
,572
OC
T-D
EC
2011
$0$0
$0$0
$0$0
$0$7
,776
,320
$328
,504
$34,
280
$33,
404
$8,1
72,5
09
JAN
-MA
R20
12$0
$0$0
$0$0
$0$0
$3,6
28,7
94$8
,837
,594
$79,
815
$233
,927
$12,
780,
130
AP
R-J
UN
2012
$0$0
$0$0
$0$0
$0$0
$8,7
30,5
46$4
2,15
3$3
4,18
0$8
,806
,880
JUL-
SE
P20
12$0
$0$0
$0$0
$0$0
$0$9
,122
,955
$75,
016
$38,
253
$9,2
36,2
24
OC
T-D
EC
2012
$0$0
$0$0
$0$0
$0$0
$7,9
56,1
54$8
60,5
70$7
0,98
7$8
,887
,712
JAN
-MA
R20
13$0
$0$0
$0$0
$0$0
$0$0
$11,
119,
929
$17,
066
$11,
136,
996
AP
R-J
UN
2013
$0$0
$0$0
$0$0
$0$0
$0$7
,912
,287
$48,
699
$7,9
60,9
85
JUL-
SE
P20
13$0
$0$0
$0$0
$0$0
$0$0
$8,4
22,0
28$1
05,5
47$8
,527
,575
OC
T-D
EC
2013
$0$0
$0$0
$0$0
$0$0
$0$8
,313
,208
$519
,497
$8,8
32,7
04
JAN
-MA
R20
14$0
$0$0
$0$0
$0$0
$0$0
$1,1
84,0
63$7
,827
,462
$9,0
11,5
24
AP
R-J
UN
2014
$0$0
$0$0
$0$0
$0$0
$0$0
$7,1
25,0
18$7
,125
,018
JUL-
SE
P20
14$0
$0$0
$0$0
$0$0
$0$0
$0$1
,646
,625
$1,6
46,6
25
OC
T-D
EC
2014
$0$0
$0$0
$0$0
$0$0
$0$0
$0$0
TO
TA
L$7
31,3
73,8
11$1
64,3
97,8
88$9
8,39
9,01
8$6
8,89
0,06
7$6
4,84
1,47
6$6
3,02
3,05
4$7
6,27
5,02
0$4
6,54
5,67
1$4
0,51
7,39
4$3
9,25
8,97
2$1
8,61
8,19
6$1
,412
,140
,567
NO
TE
: IN
CLU
DE
S R
EB
AT
ES
RE
CE
IVE
D T
HR
OU
GH
DE
CE
MB
ER
201
4.
SO
UR
CE
: P
DA
CH
EC
K R
EC
EIP
TS
AS
RE
PO
RT
ED
ON
ST
AT
E S
TA
TU
S R
EP
OR
T F
OR
WE
EK
EN
DIN
G D
EC
EM
BE
R 2
6, 2
014.
TA
BL
E 3
.4M
AN
UF
AC
TU
RE
RS
' RE
BA
TE
CA
SH
RE
CE
IPT
SB
Y Q
UA
RT
ER
/YE
AR
BIL
LE
D A
ND
BY
FIS
CA
L Y
EA
R R
EC
EIV
ED
JAN
UA
RY
199
1 -
DE
CE
MB
ER
201
4
QU
AR
TE
R/Y
EA
RB
ILLE
D
44

SECTION 4
CARDHOLDER UTILIZATION
DATA
45

46

PAGE 1
NEWLYQUARTER ENROLLED *
1st JUL-SEP 1984 273,001 100.0 273,001PROGRAM OCT-DEC 1984 23,561 7.9 296,562YEAR JAN-MAR 1985 20,941 6.6 317,503
APR-JUN 1985 69,436 17.9 386,939
2nd JUL-SEP 1985 38,750 10.0 389,177PROGRAM OCT-DEC 1985 20,522 5.0 409,699YEAR JAN-MAR 1986 18,770 4.4 428,469
APR-JUN 1986 17,367 3.9 445,836
3rd JUL-SEP 1986 23,595 5.6 420,776PROGRAM OCT-DEC 1986 14,982 3.4 435,758YEAR JAN-MAR 1987 18,130 4.0 453,888
APR-JUN 1987 18,853 4.0 472,741
4th JUL-SEP 1987 26,133 5.9 439,967PROGRAM OCT-DEC 1987 10,432 2.3 450,399YEAR JAN-MAR 1988 13,429 2.9 463,828
APR-JUN 1988 13,944 2.9 477,772
ENROLLMENT NEWLY AT END
QUARTER OF QUARTER**
5th JUL-SEP 1988 15,990 3.6 443,518PROGRAM OCT-DEC 1988 26,069 5.7 454,428YEAR JAN-MAR 1989 41,866 9.1 460,232
APR-JUN 1989 57,406 12.7 451,547
6th JUL-SEP 1989 9,847 2.2 438,834PROGRAM OCT-DEC 1989 17,787 4.2 426,822YEAR JAN-MAR 1990 30,278 7.1 424,120
APR-JUN 1990 40,169 9.8 408,493
7th JUL-SEP 1990 6,714 1.7 394,821PROGRAM OCT-DEC 1990 26,742 6.9 384,854YEAR JAN-MAR 1991 37,239 9.7 383,792
APR-JUN 1991 46,020 12.4 371,592
8th JUL-SEP 1991 8,657 2.3 370,654PROGRAM OCT-DEC 1991 17,529 4.7 373,365YEAR JAN-MAR 1992 31,581 8.4 375,697
APR-JUN 1992 44,986 12.2 369,919
9th JUL-SEP 1992 7,115 2.0 355,319PROGRAM OCT-DEC 1992 13,436 3.9 347,371YEAR JAN-MAR 1993 29,556 8.4 353,309
APR-JUN 1993 41,397 12.1 341,361
10th JUL-SEP 1993 6,658 2.0 334,757PROGRAM OCT-DEC 1993 11,519 3.5 331,338YEAR JAN-MAR 1994 20,162 6.2 324,160
APR-JUN 1994 33,967 10.4 325,090
11th JUL-SEP 1994 7,091 2.3 312,413PROGRAM OCT-DEC 1994 11,167 3.6 307,231YEAR JAN-MAR 1995 22,732 7.3 311,450
APR-JUN 1995 31,995 10.5 304,153
12th JUL-SEP 1995 5,382 1.8 298,732PROGRAM OCT-DEC 1995 8,278 2.9 289,919YEAR JAN-MAR 1996 16,146 5.6 290,460
APR-JUN 1996 22,518 8.1 279,397
PACE
TABLE 4.1PACE AND PACENET CARDHOLDER ENROLLMENTS BY QUARTER
PACE
JULY 1984 - JUNE 1988% OF NEWLY CUMULATIVEENROLLED ENROLLMENTS
JULY 1988 - JUNE 1996CUMULATIVE % OF
NEWLYENROLLED ENROLLED
47

PAGE 2
ENROLLMENT CUMULATIVE % OF ENROLLMENT NEWLY AT END NEWLY NEWLY AT END
QUARTER OF QUARTER** ENROLLED ENROLLED OF QUARTER
13th JUL-SEP 1996 4,127 1.5 267,049PROGRAM OCT-DEC 1996 9,332 3.6 260,678 1,523 100.0 1,523YEAR JAN-MAR 1997 23,797 8.6 275,607 5,771 100.0 5,771
APR-JUN 1997 30,602 11.6 264,414 9,088 100.0 9,088
14th JUL-SEP 1997 4,536 1.8 257,291 1,949 17.7 11,037PROGRAM OCT-DEC 1997 8,694 3.5 250,671 3,801 29.5 12,889YEAR JAN-MAR 1998 16,693 6.6 251,915 5,710 48.5 11,771
APR-JUN 1998 22,838 9.3 245,553 7,419 53.8 13,802
15th JUL-SEP 1998 4,375 1.8 237,753 879 5.8 15,213PROGRAM OCT-DEC 1998 8,042 3.5 230,722 1,504 9.4 15,964YEAR JAN-MAR 1999 14,744 6.4 231,049 3,216 19.9 16,164
APR-JUN 1999 20,672 9.1 227,041 4,722 27.2 17,372
16th JUL-SEP 1999 4,086 1.8 221,535 761 4.2 18,195PROGRAM OCT-DEC 1999 7,981 3.7 217,103 1,510 8.1 18,655YEAR JAN-MAR 2000 18,146 8.2 220,896 4,169 21.6 19,298
APR-JUN 2000 25,583 11.8 217,140 6,125 30.1 20,375
17th JUL-SEP 2000 5,061 2.4 213,041 1,032 4.9 21,223PROGRAM OCT-DEC 2000 10,283 4.9 208,227 2,034 9.3 21,781YEAR JAN-MAR 2001 19,041 9.1 208,299 4,610 20.8 22,167
APR-JUN 2001 24,932 12.0 207,193 6,603 28.9 22,875
18th JUL-SEP 2001 3,877 1.9 204,839 1,710 6.9 24,929PROGRAM OCT-DEC 2001 7,907 4.0 199,898 3,132 12.1 25,873YEAR JAN-MAR 2002 16,319 8.2 199,719 6,931 23.3 29,692
APR-JUN 2002 22,742 11.4 198,629 9,938 32.7 30,346
19th JUL-SEP 2002 3,490 1.8 191,935 1,378 4.6 29,980PROGRAM OCT-DEC 2002 6,925 3.7 188,566 2,476 8.2 30,356YEAR JAN-MAR 2003 13,384 7.0 190,697 5,516 17.5 31,464
APR-JUN 2003 21,287 10.9 194,961 9,654 29.7 32,520
20th JUL-SEP 2003 4,467 2.4 187,914 2,299 6.8 33,855PROGRAM OCT-DEC 2003 8,106 4.4 185,143 3,737 10.9 34,314YEAR JAN-MAR 2004 21,568 10.8 200,130 37,246 51.4 72,474
APR-JUN 2004 28,312 14.3 197,600 43,224 49.7 87,007
21st JUL-SEP 2004 4,222 2.2 194,488 7,598 8.1 94,002PROGRAM OCT-DEC 2004 6,717 3.5 191,669 15,186 15.3 99,572YEAR JAN-MAR 2005 13,536 7.0 193,946 25,934 28.2 92,035
APR-JUN 2005 19,467 10.2 190,273 35,063 34.2 102,622
22nd JUL-SEP 2005 3,935 2.1 187,696 6,301 5.9 107,240PROGRAM OCT-DEC 2005 9,001 4.8 188,495 15,579 13.3 116,755YEAR JAN-MAR 2006 14,476 7.6 190,654 25,774 20.8 123,687
APR-JUN 2006 23,477 12.5 187,311 42,841 33.4 128,212
23rd JUL-SEP 2006 2,084 1.1 184,106 3,182 2.5 127,978PROGRAM OCT-DEC 2006 5,269 2.9 179,240 11,330 8.5 132,764YEAR JAN-MAR 2007 8,687 4.8 182,332 19,571 14.6 134,018
APR-JUN 2007 11,621 6.5 178,746 26,974 19.7 136,805
24th JUL-SEP 2007 2,143 1.2 174,824 3,940 2.8 138,701PROGRAM OCT-DEC 2007 4,477 2.8 158,560 8,642 5.5 157,874YEAR JAN-MAR 2008 6,956 4.5 155,547 19,078 11.9 160,227
APR-JUN 2008 9,712 6.3 155,026 29,033 17.2 169,043
PACE AND PACENET CARDHOLDER ENROLLMENTS BY QUARTER TABLE 4.1
JULY 1996 - DECEMBER 2014
PACE PACENET
CUMULATIVE % OF NEWLY
ENROLLED ENROLLED
48

PAGE 3
ENROLLMENT CUMULATIVE % OF ENROLLMENT NEWLY AT END NEWLY NEWLY AT END
QUARTER OF QUARTER** ENROLLED ENROLLED OF QUARTER
25th JUL-SEP 2008 2,321 1.5 150,074 6,087 3.6 170,931
PROGRAM OCT-DEC 2008 4,873 3.4 141,712 11,833 6.8 173,460
YEAR JAN-MAR 2009 6,838 6.7 101,470 17,435 10.5 165,925
APR-JUN 2009 8,521 6.3 134,590 23,075 13.8 167,488
26th JUL-SEP 2009 1,848 1.4 133,248 6,469 3.8 170,994
PROGRAM OCT-DEC 2009 2,654 2.0 131,002 13,898 8.2 169,270
YEAR JAN-MAR 2010 5,109 3.9 129,892 21,782 12.5 174,306
APR-JUN 2010 7,344 5.7 128,651 29,944 16.8 178,574
27th JUL-SEP 2010 1,203 1.0 126,424 4,636 2.6 178,869
PROGRAM OCT-DEC 2010 2,800 2.3 121,369 9,292 5.2 177,774
YEAR JAN-MAR 2011 4,553 3.8 120,244 15,376 8.6 179,606
APR-JUN 2011 6,438 5.4 118,605 20,912 11.6 181,016
28th JUL-SEP 2011 1,349 1.2 117,121 3,376 1.9 180,624
PROGRAM OCT-DEC 2011 3,291 2.9 112,850 7,820 4.4 176,771
YEAR JAN-MAR 2012 5,129 4.6 112,319 11,037 6.2 178,059
APR-JUN 2012 7,259 6.5 110,863 13,971 7.8 178,290
29th JUL-SEP 2012 1,382 1.3 110,133 2,571 1.4 177,702
PROGRAM OCT-DEC 2012 3,200 2.9 109,395 5,196 3.0 175,524
YEAR JAN-MAR 2013 4,756 4.5 106,109 8,428 4.9 173,206
APR-JUN 2013 5,971 5.7 104,853 11,836 6.8 173,220
30th JUL-SEP 2013 966 0.9 102,787 2,555 1.5 170,876
PROGRAM OCT-DEC 2013 2,273 2.2 101,375 6,018 3.5 173,456
YEAR JAN-MAR 2014 3,917 3.5 112,062 10,068 6.4 156,997 ***
APR-JUN 2014 5,651 5.1 110,606 13,673 8.7 157,043
31st JUL-SEP 2014 1,476 1.3 109,951 3,305 2.1 157,043
PROGRAM OCT-DEC 2014 3,547 3.3 106,796 7,754 5.0 154,936
YEAR
* THE NEWLY ENROLLED NUMBER IS CALCULATED AS A TOTAL FOR THE QUARTER.
** ENROLLMENT AT END OF QUARTER REPRESENTS THE ENROLLMENT REPORTED ON THE LAST DAY OF THE QUARTER (I.E., 106,796 PACE CARDHOLDERS AND 154,936 PACENET CARDHOLDERS ON THE FILE ON DECEMBER 31, 2014).
*** MOVED 13,280 PACENET CARDHOLDERS TO PACE AND ADDED 3,327 NEW PACENET CARDHOLDERS.
SOURCE: PDA/MR-0-01A/CARDHOLDER FILE
TABLE 4.1 PACE AND PACENET CARDHOLDER ENROLLMENTS BY QUARTER
JULY 1996 - DECEMBER 2014
PACE PACENET
CUMULATIVE % OF NEWLY
ENROLLED ENROLLED
49

PA
GE
1
CLA
IMS
PE
RS
TA
TE
SH
AR
E P
ER
OF
ALL
TO
TA
LP
AR
TIC
IPA
TIN
GS
TA
TE
SH
AR
EP
AR
TIC
IPA
TIN
GS
TA
TE
SH
AR
EC
LAIM
SC
AR
DH
OLD
ER
EX
PE
ND
ITU
RE
SC
AR
DH
OLD
ER
TO
TA
L12
5,80
197
,818
3,54
0,94
710
0.0
36.2
$75,
639,
185
$773
.26
100.
0
SE
X FE
MA
LE97
,005
78,2
742,
906,
136
82.1
37.1
$61,
333,
328
$783
.57
81.1
MA
LE28
,796
19,5
4463
4,81
117
.932
.5$1
4,30
5,85
7$7
31.9
818
.9
AG
E 65-6
9 Y
EA
RS
17,7
2811
,623
309,
876
8.8
26.7
$7,3
60,7
19$6
33.2
99.
7
70-7
4 Y
EA
RS
21,0
2515
,868
531,
756
15.0
33.5
$12,
286,
659
$774
.30
16.2
75-7
9 Y
EA
RS
23,9
2218
,879
699,
035
19.7
37.0
$15,
845,
150
$839
.30
20.9
80-8
4 Y
EA
RS
24,7
6920
,182
786,
905
22.2
39.0
$16,
944,
679
$839
.59
22.4
85 Y
EA
RS
OR
OV
ER
38,3
5731
,266
1,21
3,37
534
.338
.8$2
3,20
1,97
9$7
42.0
830
.7
RE
SID
EN
CE
TY
PE
OW
N70
,172
55,6
251,
978,
344
55.9
35.6
$44,
602,
897
$801
.85
59.0
RE
NT
34,7
0625
,752
928,
708
26.2
36.1
$17,
824,
343
$692
.15
23.6
NU
RS
ING
HO
ME
/2,
134
1,57
385
,740
2.4
54.5
$1,4
35,7
85$9
12.7
71.
9 P
ER
SO
NA
L C
AR
E H
OM
E
LIV
E W
ITH
RE
LAT
IVE
10,2
047,
968
294,
873
8.3
37.0
$6,7
96,3
06$8
52.9
59.
0
OT
HE
R7,
300
5,89
621
7,26
16.
136
.8$4
,176
,331
$708
.33
5.5
MIS
SIN
G1,
285
1,00
436
,021
1.0
35.9
$803
,523
$800
.32
1.1
MA
RIT
AL
ST
AT
US
SIN
GLE
OR
WID
OW
ED
93,5
8474
,028
2,74
7,94
677
.637
.1$5
7,29
3,57
1$7
73.9
475
.7
MA
RR
IED
12,2
258,
919
279,
812
7.9
31.4
$6,2
68,8
08$7
02.8
68.
3
DIV
OR
CE
D15
,550
11,5
5338
8,49
911
.033
.6$9
,131
,602
$790
.41
12.1
MA
RR
IED
, LIV
ING
4,44
23,
318
124,
690
3.5
37.6
$2,9
45,2
03$8
87.6
43.
9 S
EP
AR
AT
ELY
EN
RO
LLE
DT
OT
AL
CA
RD
HO
LDE
RS
PA
RT
ICIP
AT
ING
TO
TA
LP
ER
CE
NT
OF
TO
TA
LC
LAIM
S
PE
RC
EN
T
EX
PE
ND
ITU
RE
S
TA
BL
E 4
.2A
PA
CE
CA
RD
HO
LD
ER
EN
RO
LL
ME
NT
, PA
RT
ICIP
AT
ION
, UT
ILIZ
AT
ION
, AN
D E
XP
EN
DIT
UR
ES
BY
DE
MO
GR
AP
HIC
CH
AR
AC
TE
RIS
TIC
SJA
NU
AR
Y -
DE
CE
MB
ER
201
4
CA
RD
HO
LDE
RS
50

PA
GE
2
CLA
IMS
PE
RS
TA
TE
SH
AR
E P
ER
OF
ALL
TO
TA
LP
AR
TIC
IPA
TIN
GS
TA
TE
SH
AR
EP
AR
TIC
IPA
TIN
GS
TA
TE
SH
AR
EC
LAIM
SC
AR
DH
OLD
ER
EX
PE
ND
ITU
RE
SC
AR
DH
OLD
ER
EN
RO
LLE
DT
OT
AL
CA
RD
HO
LDE
RS
PA
RT
ICIP
AT
ING
TO
TA
LP
ER
CE
NT
OF
TO
TA
LC
LAIM
S
PE
RC
EN
T
EX
PE
ND
ITU
RE
S
TA
BL
E 4
.2A
PA
CE
CA
RD
HO
LD
ER
EN
RO
LL
ME
NT
, PA
RT
ICIP
AT
ION
, UT
ILIZ
AT
ION
, AN
D E
XP
EN
DIT
UR
ES
BY
DE
MO
GR
AP
HIC
CH
AR
AC
TE
RIS
TIC
SJA
NU
AR
Y -
DE
CE
MB
ER
201
4
CA
RD
HO
LDE
RS
ET
HN
IC O
RIG
IN
WH
ITE
100,
292
80,9
993,
062,
375
86.5
37.8
$64,
420,
036
$795
.32
85.2
AF
RIC
AN
-AM
ER
ICA
N10
,575
7,16
220
8,88
55.
929
.2$4
,718
,155
$658
.78
6.2
AM
ER
ICA
N IN
DIA
N15
610
23,
234
0.1
31.7
$99,
441
$974
.91
0.1
HIS
PA
NIC
2,15
71,
337
37,9
721.
128
.4$6
82,0
01$5
10.1
00.
9
AS
IAN
1234
787
16,9
800.
521
.6$6
71,1
18$8
52.7
50.
9
OT
HE
R1,
120
762
22,4
110.
629
.4$5
15,4
24$6
76.4
10.
7
MIS
SIN
G10
,267
6,66
918
9,09
05.
328
.4$4
,533
,010
$679
.71
6.0
INC
OM
E -
SIN
GLE
$0-$
2,99
93,
621
1,51
152
,957
1.5
35.0
$1,5
32,5
05$1
,014
.23
2.0
$3,0
00-$
5,99
92,
823
2,02
075
,291
2.1
37.3
$1,5
24,1
60$7
54.5
32.
0
$6,0
00-$
8,99
910
,273
7,93
226
7,26
77.
533
.7$6
,372
,641
$803
.41
8.4
$9,0
00-$
11,9
9922
,855
17,7
6763
4,24
417
.935
.7$1
3,94
0,79
1$7
84.6
518
.4
$12,
000-
$14,
500
57,1
1946
,384
1,74
8,20
649
.437
.7$3
6,08
9,29
1$7
78.0
547
.7
$14,
500
+16
,885
13,2
8548
3,17
013
.636
.4$9
,910
,989
$746
.03
13.1
INC
OM
E -
MA
RR
IED
$0-$
2,99
945
021
15,
623
0.2
26.6
$289
,123
$1,3
70.2
50.
4
$3,0
00-$
5,99
913
679
2,28
70.
128
.9$6
8,79
8$8
70.8
60.
1
$6,0
00-$
8,99
928
518
65,
646
0.2
30.4
$170
,059
$914
.30
0.2
$9,0
00-$
11,9
9954
635
910
,320
0.3
28.7
$294
,287
$819
.74
0.4
$12,
000-
$14,
999
1,33
294
929
,237
0.8
30.8
$763
,523
$804
.56
1.0
$15,
000-
$17,
700
5,49
94,
272
144,
968
4.1
33.9
$3,3
50,1
90$7
84.2
24.
4
$17,
700
+3,
977
2,86
381
,731
2.3
28.5
$1,3
32,8
29$4
65.5
41.
8
SO
UR
CE
: P
DA
/CLA
IMS
HIS
TO
RY
, CA
RD
HO
LDE
R F
ILE
NO
TE
: DA
TA
INC
LUD
E O
RIG
INA
L, P
AID
CLA
IMS
BY
DA
TE
OF
SE
RV
ICE
, EX
CLU
DE
PA
CE
NE
T C
LAIM
S.
TH
E H
IGH
ES
T IN
CO
ME
CA
TE
GO
RY
INC
LUD
ES
CA
RD
HO
LDE
RS
WH
O H
AV
E R
EM
AIN
ED
IN T
HE
PR
OG
RA
M E
VE
N T
HO
UG
H T
HE
IR IN
CO
ME
S E
XC
EE
D IN
CO
ME
E
LIG
IBIL
ITY
LIM
ITS
DU
E T
O N
OM
INA
L IN
CR
EA
SE
S IN
TH
EIR
SO
CIA
L S
EC
UR
ITY
INC
OM
E.
TH
IS IN
CO
ME
GR
OU
P M
AY
ALS
O IN
CLU
DE
CA
RD
HO
LDE
RS
WH
O E
XC
EE
D
TH
E IN
CO
ME
LIM
ITS
AN
D L
OS
E E
LIG
IBIL
ITY
DU
RIN
G T
HE
YE
AR
.
51

PA
GE
1
TO
TA
LS
TA
TE
% O
FC
AR
DH
OLD
ER
SH
AR
ET
OT
AL
TO
TA
LT
OT
AL
AN
D T
PL
EX
PE
ND
I-C
LAIM
SC
LAIM
SE
XP
EN
DIT
UR
ES
EX
PE
ND
ITU
RE
ST
UR
ES
TO
TA
L19
2,35
114
9,95
25,
087,
067
100.
033
.9$4
05,7
17,3
61$2
90,6
55,0
3471
.6$1
15,0
62,3
2628
.4$7
67.3
310
0.0
SE
X FE
MA
LE12
8,55
610
4,01
53,
610,
696
71.0
34.7
$281
,082
,730
$202
,552
,862
72.1
$78,
529,
868
27.9
$754
.99
68.2
MA
LE63
,795
45,9
371,
476,
371
29.0
32.1
$124
,634
,630
$88,
102,
172
70.7
$36,
532,
458
29.3
$795
.27
31.8
AG
E 65-6
9 Y
EA
RS
29,4
8720
,360
546,
737
10.7
26.9
$53,
850,
681
$39,
482,
769
73.3
$14,
367,
912
26.7
$705
.69
12.5
70-7
4 Y
EA
RS
36,8
0128
,357
926,
493
18.2
32.7
$85,
456,
184
$61,
667,
793
72.2
$23,
788,
392
27.8
$838
.89
20.7
75-7
9 Y
EA
RS
39,6
9631
,742
1,11
1,19
721
.835
.0$9
3,99
5,02
9$6
7,14
4,32
471
.4$2
6,85
0,70
528
.6$8
45.9
023
.380
-84
YE
AR
S38
,691
31,2
681,
115,
933
21.9
35.7
$84,
508,
930
$60,
301,
873
71.4
$24,
207,
057
28.6
$774
.18
21.0
85 Y
EA
RS
OR
OV
ER
47,6
7638
,225
1,38
6,70
727
.336
.3$8
7,90
6,53
5$6
2,05
8,27
670
.6$2
5,84
8,26
029
.4$6
76.2
122
.5
RE
SID
EN
CE
TY
PE
OW
N13
2,42
810
3,26
23,
406,
621
67.0
33.0
$273
,331
,623
$194
,651
,604
71.2
$78,
680,
019
28.8
$761
.95
68.4
RE
NT
39,8
1830
,549
1,05
9,89
420
.834
.7$8
4,06
0,01
5$6
1,05
8,59
572
.6$2
3,00
1,42
027
.4$7
52.9
420
.0N
UR
SIN
G H
OM
E/
2,91
32,
353
129,
194
2.5
54.9
$7,5
00,3
90$5
,348
,901
71.3
$2,1
51,4
8928
.7$9
14.3
61.
9
PE
RS
. CA
RE
HO
ME
LIV
E W
ITH
RE
LAT
IVE
9,36
17,
538
271,
006
5.3
36.0
$23,
148,
344
$16,
560,
664
71.5
$6,5
87,6
8028
.5$8
73.9
35.
7O
TH
ER
6,27
15,
012
177,
858
3.5
35.5
$13,
924,
141
$10,
297,
820
74.0
$3,6
26,3
2126
.0$7
23.5
33.
2M
ISS
ING
1,56
01,
238
42,4
940.
834
.3$3
,752
,847
$2,7
37,4
5172
.9$1
,015
,396
27.1
$820
.19
0.9
MA
RIT
AL
ST
AT
US
SIN
GLE
OR
WID
OW
ED
106,
365
84,5
622,
956,
321
58.1
35.0
$225
,402
,854
$161
,398
,451
71.6
$64,
004,
403
28.4
$756
.89
55.6
MA
RR
IED
66,9
9451
,068
1,66
5,03
332
.732
.6$1
39,0
84,0
81$9
9,34
1,34
571
.4$3
9,74
2,73
728
.6$7
78.2
334
.5D
IVO
RC
ED
15,5
3911
,672
372,
844
7.3
31.9
$33,
668,
077
$24,
501,
973
72.8
$9,1
66,1
0427
.2$7
85.3
18.
0M
AR
RIE
D, L
IVIN
G3,
453
2,65
092
,869
1.8
35.0
$7,5
62,3
48$5
,413
,266
71.6
$2,1
49,0
8328
.4$8
10.9
71.
9 S
EP
AR
AT
ELY
ET
HN
IC O
RIG
INW
HIT
E15
6,35
312
4,86
04,
406,
236
86.6
35.3
$347
,743
,451
$249
,097
,108
71.6
$98,
646,
343
28.4
$790
.06
85.7
AF
RIC
AN
-AM
ER
ICA
N10
,597
7,50
821
0,52
34.
128
.0$1
8,12
9,25
6$1
2,92
5,94
971
.3$5
,203
,307
28.7
$693
.04
4.5
AM
ER
ICA
N IN
DIA
N19
112
74,
842
0.1
38.1
$426
,998
$327
,388
76.7
$99,
610
23.3
$784
.33
0.1
HIS
PA
NIC
1,93
71,
354
36,5
480.
727
.0$3
,327
,058
$2,4
35,7
4373
.2$8
91,3
1626
.8$6
58.2
80.
8A
SIA
N87
656
511
,371
0.2
20.1
$1,4
59,1
53$1
,019
,859
69.9
$439
,295
30.1
$777
.51
0.4
OT
HE
R1,
886
1,38
441
,960
0.8
30.3
$3,6
62,5
47$2
,657
,774
72.6
$1,0
04,7
7327
.4$7
25.9
90.
9M
ISS
ING
20,5
1114
,154
375,
587
7.4
26.5
$30,
968,
897
$22,
191,
214
71.7
$8,7
77,6
8228
.3$6
20.1
67.
6
AN
D T
PL
TU
RE
S
CLA
IMS
CA
RD
HO
LDE
RS
EN
RO
LLE
DT
OT
AL
CA
RD
HO
LDE
RS
PA
RT
ICIP
AT
ING
TO
TA
L
CA
RD
HO
LDE
R
ST
AT
ES
HA
RE
EX
PE
ND
I -T
UR
ES
PA
TIN
G
SH
AR
E P
ER
PA
RT
ICI-
EX
PE
ND
I-
TA
BL
E 4
.2B
PA
CE
NE
T C
AR
DH
OL
DE
R E
NR
OL
LM
EN
T, P
AR
TIC
IPA
TIO
N, U
TIL
IZA
TIO
N, A
ND
EX
PE
ND
ITU
RE
S
JAN
UA
RY
- D
EC
EM
BE
R 2
014
BY
DE
MO
GR
AP
HIC
CH
AR
AC
TE
RIS
TIC
S
% O
F
PE
R
CA
RD
HO
LDE
RS
TA
TE
SH
AR
E (
%)
EX
PE
ND
I-T
UR
ES
CIP
AN
T
OF
TO
TA
LP
AR
TI-
ST
AT
ES
HA
RE
(%
)O
F T
OT
AL
52

PA
GE
2
TO
TA
LS
TA
TE
% O
FC
AR
DH
OLD
ER
SH
AR
ET
OT
AL
TO
TA
LT
OT
AL
AN
D T
PL
EX
PE
ND
I-C
LAIM
SC
LAIM
SE
XP
EN
DIT
UR
ES
EX
PE
ND
ITU
RE
ST
UR
ES
AN
D T
PL
TU
RE
S
CLA
IMS
CA
RD
HO
LDE
RS
EN
RO
LLE
DT
OT
AL
CA
RD
HO
LDE
RS
PA
RT
ICIP
AT
ING
TO
TA
L
CA
RD
HO
LDE
R
ST
AT
ES
HA
RE
EX
PE
ND
I -T
UR
ES
PA
TIN
G
SH
AR
E P
ER
PA
RT
ICI-
EX
PE
ND
I-
TA
BL
E 4
.2B
PA
CE
NE
T C
AR
DH
OL
DE
R E
NR
OL
LM
EN
T, P
AR
TIC
IPA
TIO
N, U
TIL
IZA
TIO
N, A
ND
EX
PE
ND
ITU
RE
S
JAN
UA
RY
- D
EC
EM
BE
R 2
014
BY
DE
MO
GR
AP
HIC
CH
AR
AC
TE
RIS
TIC
S
% O
F
PE
R
CA
RD
HO
LDE
RS
TA
TE
SH
AR
E (
%)
EX
PE
ND
I-T
UR
ES
CIP
AN
T
OF
TO
TA
LP
AR
TI-
ST
AT
ES
HA
RE
(%
)O
F T
OT
AL
INC
OM
E -
SIN
GLE
$14,
501
- $1
7,50
041
,519
31,7
6994
0,14
018
.529
.6$6
9,55
6,79
5$5
1,41
5,04
073
.9$1
8,14
1,75
526
.1$5
71.0
515
.8$1
7,50
1 -
$20,
500
46,2
8037
,211
1,40
0,55
827
.537
.6$1
09,4
71,4
24$7
7,46
7,34
970
.8$3
2,00
4,07
429
.2$8
60.0
727
.8$2
0,50
1 -
$23,
500
32,9
3926
,563
976,
526
19.2
36.8
$79,
302,
215
$56,
644,
465
71.4
$22,
657,
750
28.6
$852
.98
19.7
$23,
500
+4,
619
3,34
110
4,81
02.
131
.4$8
,302
,845
$5,7
86,8
3569
.7$2
,516
,010
30.3
$753
.07
2.2
INC
OM
E -
MA
RR
IED
$17,
701
- $2
2,50
011
,149
7,94
721
2,53
34.
226
.7$1
6,42
8,07
9$1
2,74
3,89
177
.6$3
,684
,188
22.4
$463
.59
3.2
$22,
501
- $2
7,00
022
,002
16,9
9158
3,37
311
.534
.3$4
7,18
8,46
0$3
3,51
0,66
271
.0$1
3,67
7,79
829
.0$8
05.0
011
.9$2
7,00
1 -
$31,
500
29,9
7123
,644
810,
400
15.9
34.3
$69,
333,
151
$49,
034,
963
70.7
$20,
298,
188
29.3
$858
.49
17.6
$31,
500
+3,
872
2,48
658
,727
1.2
23.6
$6,1
34,3
92$4
,051
,828
66.1
$2,0
82,5
6333
.9$8
37.7
21.
8
SO
UR
CE
: P
DA
/CLA
IMS
HIS
TO
RY
, CA
RD
HO
LDE
R F
ILE
NO
TE
: D
AT
A IN
CLU
DE
OR
IGIN
AL,
PA
ID P
AC
EN
ET
CLA
IMS
BY
DA
TE
OF
SE
RV
ICE
. T
OT
AL
CLA
IMS
INC
LUD
E D
ED
UC
TIB
LE C
LAIM
S A
ND
CO
PA
ID C
LAIM
S.
TH
E H
IGH
ES
T IN
CO
ME
CA
TE
GO
RY
INC
LUD
ES
CA
RD
HO
LDE
RS
WH
O H
AV
E R
EM
AIN
ED
IN T
HE
PR
OG
RA
M E
VE
N T
HO
UG
H T
HE
IR IN
CO
ME
S E
XC
EE
D IN
CO
ME
ELI
GIB
ILIT
Y L
IMIT
S D
UE
T
O N
OM
INA
L IN
CR
EA
SE
S IN
TH
EIR
SO
CIA
L S
EC
UR
ITY
INC
OM
E.
TH
IS IN
CO
ME
GR
OU
P M
AY
ALS
O IN
CLU
DE
CA
RD
HO
LDE
RS
WH
O E
XC
EE
D T
HE
INC
OM
E L
IMIT
S A
ND
LO
SE
ELI
GIB
ILIT
Y
DU
RIN
G T
HE
YE
AR
.
53

FIG
UR
E 4
.1A
PE
RC
EN
T O
F E
NR
OL
LE
D P
AC
E C
AR
DH
OL
DE
RS
BY
IN
CO
ME
AN
D M
AR
ITA
L S
TA
TU
SJA
NU
AR
Y -
DE
CE
MB
ER
201
4(T
OT
AL
N =
125
,801
)
SIN
GL
EN
=11
3,57
6M
AR
RIE
DN
=12
,225
$0
-$2
,99
93
.7%
$3
,00
0-$
5,9
99
1.1
% $6
,00
0-$
8,9
99
2.3
%$
9,0
00
-$1
1,9
99
4.5
%
$1
2,0
00
-$1
4,9
991
0.9
%
*$1
7,7
00
+3
2.5
%
$0
-$2
,99
93
.2%
$3
,00
0-$
5,9
99
2.5
%$
6,0
00
-$8
,99
99
.0%
*$1
4,5
00
+1
4.9
%
in
the
ir S
oci
al S
ecu
rity
inco
me
. T
his
inco
me
gro
up
ma
y a
lso
incl
ud
e c
ard
ho
lde
rs w
ho
exc
ee
d th
e in
com
e li
mits
an
d lo
se e
ligib
ility
du
ring
the
ye
ar.
* T
he
hig
he
st in
com
e c
ate
go
ry in
clu
de
s ca
rdh
old
ers
wh
o h
ave
re
ma
ine
d in
the
pro
gra
m e
ven
tho
ug
h th
eir
inco
me
s e
xce
ed
inco
me
elig
ibili
ty li
mits
du
e to
no
min
al i
ncr
ea
ses
SO
UR
CE
: P
DA
CA
RD
HO
LD
ER
FIL
E
NO
TE
: D
ue
to r
ou
nd
ing
, ca
teg
ory
pe
rce
nta
ge
s m
ay
no
t ad
d u
p to
10
0%
.
$1
5,0
00
-$1
7,7
004
5.0
%
$9
,00
0-$
11
,99
92
0.1
%$
12
,00
0-$
14
,500
50
.3%
54

FIG
UR
E 4
.1B
PE
RC
EN
T O
F E
NR
OL
LE
D P
AC
EN
ET
CA
RD
HO
LD
ER
SB
Y I
NC
OM
E A
ND
MA
RIT
AL
ST
AT
US
JAN
UA
RY
- D
EC
EM
BE
R 2
014
(TO
TA
L N
=19
2,35
1)
SIN
GL
EN
=12
5,35
7M
AR
RIE
DN
=66
,994
$1
7,7
01
-$2
2,5
001
6.6
%
*$3
1,5
00
+5
.8%
$1
4,5
01
-$1
7,5
003
3.1
%$
20
,50
1-$
23
,500
26
.3%
*$2
3,5
00
+3
.7%
NO
TE
: D
ue
to r
ou
nd
ing
, ca
teg
ory
pe
rce
nta
ge
s m
ay
no
t ad
d u
p to
10
0%
.
SO
UR
CE
: P
DA
CA
RD
HO
LD
ER
FIL
E
* T
he
hig
he
st in
com
e c
ate
go
ry in
clu
de
s ca
rdh
old
ers
wh
o h
ave
re
ma
ine
d in
the
pro
gra
m e
ven
tho
ug
h th
eir
inco
me
s e
xce
ed
inco
me
elig
ibili
ty li
mits
du
e to
no
min
al i
ncr
ea
ses
in
the
ir S
oci
al S
ecu
rity
inco
me
. T
his
inco
me
gro
up
ma
y a
lso
incl
ud
e c
ard
ho
lde
rs w
ho
exc
ee
d th
e in
com
e li
mits
an
d lo
se e
ligib
ility
du
ring
the
ye
ar.
$2
2,5
01
-$2
7,0
003
2.8
%$
27
,00
1-$
31
,500
44
.7%
$1
7,5
01
-$2
0,5
003
6.9
%
55

TA
BL
E 4
.3O
TH
ER
PR
ES
CR
IPT
ION
INS
UR
AN
CE
CO
VE
RA
GE
OF
PA
CE
AN
D P
AC
EN
ET
EN
RO
LL
ED
CA
RD
HO
LD
ER
SJA
NU
AR
Y -
DE
CE
MB
ER
201
4
PA
CE
PA
CE
ST
AT
E S
HA
RE
A.
PA
CE
EN
RO
LLE
D C
AR
DH
OLD
ER
SC
LAIM
SE
XP
EN
DIT
UR
ES
CLA
IMS
PE
RT
OT
AL
ST
AT
EE
XP
EN
DIT
UR
ES
TO
TA
LE
NR
OLL
ED
SH
AR
EP
ER
EN
RO
LLE
DN
UM
BE
R%
OF
TO
TA
LC
LAIM
SC
AR
DH
OLD
ER
EX
PE
ND
ITU
RE
SC
AR
DH
OLD
ER
121,
205
96.3
3,50
5,47
128
.9$7
3,54
9,59
5$6
06.8
2
ME
DIC
AR
E P
AR
T D
CO
VE
RA
GE
109,
891
87.4
3,13
1,93
828
.5$4
9,31
3,44
8$4
48.7
5
NO
N M
ED
ICA
RE
PA
RT
D C
OV
ER
AG
E11
,314
9.0
373,
533
33.0
$24,
236,
146
$2,1
42.1
4
NO
OT
HE
R K
NO
WN
PR
ES
CR
IPT
ION
CO
VE
RA
GE
4,59
63.
735
,476
7.7
$2,0
89,5
90$4
54.6
5
TO
TA
L P
AC
E E
NR
OLL
ED
125,
801
100.
03,
540,
947
28.1
$75,
639,
185
$601
.26
PA
CE
NE
TP
AC
EN
ET
ST
AT
E S
HA
RE
B.
PA
CE
NE
TE
NR
OLL
ED
CA
RD
HO
LDE
RS
CLA
IMS
EX
PE
ND
ITU
RE
SC
LAIM
S P
ER
TO
TA
L S
TA
TE
EX
PE
ND
ITU
RE
ST
OT
AL
EN
RO
LLE
DS
HA
RE
PE
R E
NR
OLL
ED
NU
MB
ER
% O
F T
OT
AL
CLA
IMS
CA
RD
HO
LDE
RE
XP
EN
DIT
UR
ES
CA
RD
HO
LDE
R
183,
801
95.6
5,03
9,87
727
.4$1
12,2
08,2
02$6
10.4
9
ME
DIC
AR
E P
AR
T D
CO
VE
RA
GE
164,
029
85.3
4,58
4,77
928
.0$8
5,49
0,35
4$5
21.1
9
NO
N M
ED
ICA
RE
PA
RT
D C
OV
ER
AG
E19
,772
10.3
455,
098
23.0
$26,
717,
848
$1,3
51.3
0
NO
OT
HE
R K
NO
WN
PR
ES
CR
IPT
ION
CO
VE
RA
GE
8,55
04.
447
,190
5.5
$2,8
54,1
24$3
33.8
2
TO
TA
L P
AC
EN
ET
EN
RO
LLE
D19
2,35
110
0.0
5,08
7,06
726
.4$1
15,0
62,3
26$5
98.1
9
SO
UR
CE
: P
DA
/CA
RD
HO
LDE
R F
ILE
, CLA
IMS
HIS
TO
RY
NO
TE
S:
DA
TA
INC
LUD
E O
RIG
INA
L, P
AID
CLA
IMS
BY
DA
TE
OF
SE
RV
ICE
. S
OM
E C
AR
DH
OLD
ER
S W
ER
E E
NR
OLL
ED
IN B
OT
H P
RO
GR
AM
S F
OR
SO
ME
PO
RT
ION
OF
TH
E Y
EA
R.
NO
T A
LL C
AR
DH
OLD
ER
S W
ITH
IDE
NT
IFIE
D R
X IN
SU
RA
NC
E H
AD
AC
TIV
E T
HIR
D P
AR
TY
CO
VE
RA
GE
FO
R D
RU
GS
RE
IMB
UR
SE
D B
Y P
AC
E A
T T
HE
TIM
E O
F D
ISP
EN
SIN
G.
OT
HE
R P
RE
SC
RIP
TIO
N C
OV
ER
AG
E ID
EN
TIF
IED
OT
HE
R P
RE
SC
RIP
TIO
N C
OV
ER
AG
E ID
EN
TIF
IED
56
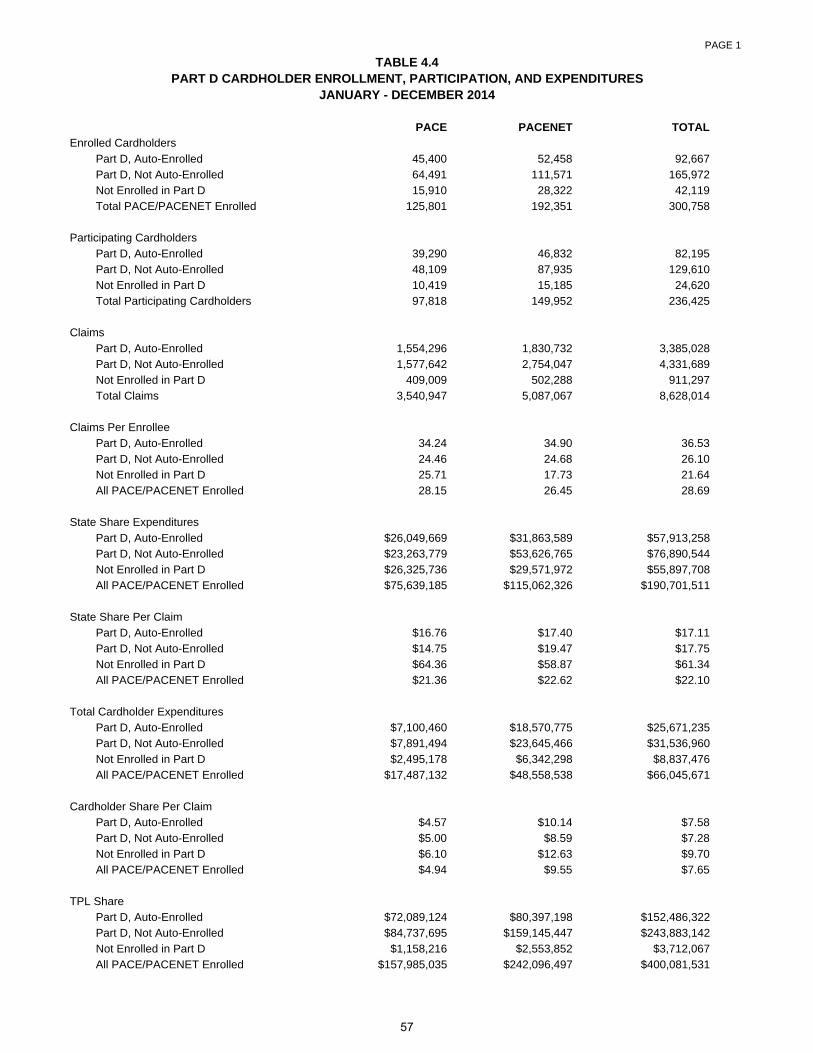
TABLE 4.4PART D CARDHOLDER ENROLLMENT, PARTICIPATION, AND EXPENDITURES
JANUARY - DECEMBER 2014
PAGE 1
PACE PACENET TOTAL
Part D, Auto-Enrolled 45,400 52,458 92,667Part D, Not Auto-Enrolled 64,491 111,571 165,972Not Enrolled in Part D 15,910 28,322 42,119Total PACE/PACENET Enrolled 125,801 192,351 300,758
Part D, Auto-Enrolled 39,290 46,832 82,195Part D, Not Auto-Enrolled 48,109 87,935 129,610Not Enrolled in Part D 10,419 15,185 24,620Total Participating Cardholders 97,818 149,952 236,425
Part D, Auto-Enrolled 1,554,296 1,830,732 3,385,028Part D, Not Auto-Enrolled 1,577,642 2,754,047 4,331,689Not Enrolled in Part D 409,009 502,288 911,297Total Claims 3,540,947 5,087,067 8,628,014
Part D, Auto-Enrolled 34.24 34.90 36.53Part D, Not Auto-Enrolled 24.46 24.68 26.10Not Enrolled in Part D 25.71 17.73 21.64All PACE/PACENET Enrolled 28.15 26.45 28.69
Part D, Auto-Enrolled $26,049,669 $31,863,589 $57,913,258Part D, Not Auto-Enrolled $23,263,779 $53,626,765 $76,890,544Not Enrolled in Part D $26,325,736 $29,571,972 $55,897,708All PACE/PACENET Enrolled $75,639,185 $115,062,326 $190,701,511
Part D, Auto-Enrolled $16.76 $17.40 $17.11Part D, Not Auto-Enrolled $14.75 $19.47 $17.75Not Enrolled in Part D $64.36 $58.87 $61.34All PACE/PACENET Enrolled $21.36 $22.62 $22.10
Part D, Auto-Enrolled $7,100,460 $18,570,775 $25,671,235Part D, Not Auto-Enrolled $7,891,494 $23,645,466 $31,536,960Not Enrolled in Part D $2,495,178 $6,342,298 $8,837,476All PACE/PACENET Enrolled $17,487,132 $48,558,538 $66,045,671
Part D, Auto-Enrolled $4.57 $10.14 $7.58Part D, Not Auto-Enrolled $5.00 $8.59 $7.28Not Enrolled in Part D $6.10 $12.63 $9.70All PACE/PACENET Enrolled $4.94 $9.55 $7.65
Part D, Auto-Enrolled $72,089,124 $80,397,198 $152,486,322Part D, Not Auto-Enrolled $84,737,695 $159,145,447 $243,883,142Not Enrolled in Part D $1,158,216 $2,553,852 $3,712,067All PACE/PACENET Enrolled $157,985,035 $242,096,497 $400,081,531
Total Cardholder Expenditures
Cardholder Share Per Claim
TPL Share
State Share Expenditures
State Share Per Claim
Enrolled Cardholders
Participating Cardholders
Claims
Claims Per Enrollee
57

TABLE 4.4PART D CARDHOLDER ENROLLMENT, PARTICIPATION, AND EXPENDITURES
JANUARY - DECEMBER 2014
PAGE 2
PACE PACENET TOTAL
Part D, Auto-Enrolled $46.38 $43.92 $45.05Part D, Not Auto-Enrolled $53.71 $57.79 $56.30Not Enrolled in Part D $2.83 $5.08 $4.07All PACE/PACENET Enrolled $44.62 $47.59 $46.37
Part D, Auto-Enrolled $105,239,253 $130,831,562 $236,070,815Part D, Not Auto-Enrolled $115,892,969 $236,417,678 $352,310,646Not Enrolled in Part D $29,979,130 $38,468,121 $68,447,251All PACE/PACENET Enrolled $251,111,352 $405,717,361 $656,828,713
Full LIS 19,257 4,662 22,625Partial LIS 3,096 3,101 5,778No LIS 23,047 44,695 64,264Total Auto-Enrolled Cardholders 45,400 52,458 92,667
Part D LIS Status Among Other Part D EnrolledFull LIS 31,428 11,873 39,981Partial LIS 4,537 7,738 11,309No LIS 28,526 91,960 114,682Total Other Part D Enrolled Cardholders 64,491 111,571 165,972
claim adjudication system. There may be additional prescription expenditures that were not submitted to PACE/PACENET.
Total Expenditures (State, Cardholder, TPL)
Part D LIS Status Among Auto-Enrolled
TPL Share Per Claim
Notes: Auto-enrolled cardholders include individuals who were enrolled or re-enrolled by PACE/PACENET into Part D partner plans within the two years prior to January 2014, and who had active coverage in a PACE/PACENET Part D partnerplan during 2014. The expenditure totals shown are based only on claims that were recorded in the PACE/PACENET
58

TO
TA
L D
RU
G S
PE
ND
CA
TE
GO
RY
PA
RT
D A
ND
LIS
ST
AT
US
TO
TA
L E
NR
OLL
ED
TO
TA
L C
LAIM
ST
OT
AL
DR
UG
SP
EN
DT
OT
AL
ST
AT
E S
HA
RE
TO
TA
L C
AR
DH
OLD
ER
S
HA
RE
TO
TA
L T
PL
SH
AR
E
$0N
O P
AR
T D
17,5
000
$0$0
$0$0
PA
RT
D-L
IS19
,004
0$0
$0$0
$0P
AR
T D
-NO
LIS
27,8
300
$0$0
$0$0
TO
TA
L64
,334
0$0
$0$0
$0
$0.0
1-$3
10.0
0N
O P
AR
T D
7,06
564
,754
$819
,662
$263
,606
$514
,211
$41,
846
PA
RT
D-L
IS13
,525
128,
128
$1,6
76,4
40$1
92,9
53$3
84,2
02$1
,099
,286
PA
RT
D-N
O L
IS31
,224
325,
375
$4,1
84,0
18$7
02,9
96$2
,304
,330
$1,1
76,6
92T
OT
AL
51,8
1451
8,25
7$6
,680
,121
$1,1
59,5
54$3
,202
,742
$2,3
17,8
24
$310
.01-
$2,8
50.0
0N
O P
AR
T D
9,93
431
9,20
0$1
2,29
1,49
1$8
,442
,846
$3,0
51,5
86$7
97,0
59P
AR
T D
-LIS
28,4
4788
6,09
8$3
6,11
8,97
9$4
,330
,721
$3,1
94,7
31$2
8,59
3,52
7P
AR
T D
-NO
LIS
69,7
182,
234,
637
$88,
128,
995
$20,
890,
932
$18,
002,
962
$49,
235,
102
TO
TA
L10
8,09
93,
439,
935
$136
,539
,465
$33,
664,
499
$24,
249,
278
$78,
625,
688
> $
2,85
0.00
NO
PA
RT
D7,
621
527,
343
$55,
336,
098
$47,
191,
257
$5,2
71,6
80$2
,873
,162
PA
RT
D-L
IS18
,717
1,06
9,60
0$1
08,1
26,8
72$1
3,71
3,31
4$4
,819
,361
$89,
594,
197
PA
RT
D-N
O L
IS50
,174
3,07
2,87
9$3
50,1
46,1
56$9
4,97
2,88
7$2
8,50
2,60
9$2
26,6
70,6
60T
OT
AL
76,5
124,
669,
822
$513
,609
,126
$155
,877
,457
$38,
593,
650
$319
,138
,019
$2,8
50.0
0-$6
,455
.00/
$6,6
90.7
7*N
O P
AR
T D
4,94
128
9,40
4$2
1,90
2,68
0$1
7,73
6,37
7$2
,880
,862
$1,2
85,4
40P
AR
T D
-LIS
13,7
8873
2,14
1$6
0,62
9,96
7$6
,604
,487
$3,1
45,6
75$5
0,87
9,80
5P
AR
T D
-NO
LIS
33,7
051,
808,
408
$148
,119
,599
$45,
266,
907
$16,
933,
053
$85,
919,
639
TO
TA
L52
,434
2,82
9,95
3$2
30,6
52,2
46$6
9,60
7,77
2$2
2,95
9,59
0$1
38,0
84,8
84
> $
6,45
5.00
/$6,
690.
77*
NO
PA
RT
D2,
680
237,
939
$33,
433,
419
$29,
454,
879
$2,3
90,8
18$1
,587
,722
PA
RT
D-L
IS4,
929
337,
459
$47,
496,
905
$7,1
08,8
26$1
,673
,687
$38,
714,
392
PA
RT
D-N
O L
IS16
,469
1,26
4,47
1$2
02,0
26,5
57$4
9,70
5,97
9$1
1,56
9,55
6$1
40,7
51,0
22T
OT
AL
24,0
781,
839,
869
$282
,956
,881
$86,
269,
685
$15,
634,
060
$181
,053
,135
TO
TA
LN
O P
AR
T D
42,1
2091
1,29
7$6
8,44
7,25
1$5
5,89
7,70
8$8
,837
,476
$3,7
12,0
67P
AR
T D
-LIS
79,6
932,
083,
826
$145
,922
,291
$18,
236,
988
$8,3
98,2
94$1
19,2
87,0
09P
AR
T D
-NO
LIS
178,
946
5,63
2,89
1$4
42,4
59,1
69$1
16,5
66,8
15$4
8,80
9,90
1$2
77,0
82,4
54T
OT
AL
300,
759
8,62
8,01
4$6
56,8
28,7
12$1
90,7
01,5
11$6
6,04
5,67
1$4
00,0
81,5
31
TA
BL
E 4
.5A
NN
UA
L D
RU
G E
XP
EN
DIT
UR
ES
FO
R P
AC
E/P
AC
EN
ET
EN
RO
LL
ED
BY
TO
TA
L D
RU
G S
PE
ND
, PA
RT
D S
TA
TU
S, A
ND
LIS
ST
AT
US
JAN
UA
RY
- D
EC
EM
BE
R 2
014
* C
AT
AS
TR
OP
HIC
TH
RE
SH
OLD
VA
RIE
S B
Y L
IS S
TA
TU
S:
$6,4
55.0
0 F
OR
LIS
, $6,
690.
77 F
OR
NO
N-L
IS D
UR
ING
201
4.
59

5055606570758085
RCENT
XS
EP
TE
MB
ER
200
6--P
AC
E B
EG
INS
A
UT
O-E
NR
OLL
ME
NT
IN
ME
DIC
AR
E P
AR
T D
FIG
UR
E 4
.2P
AC
E G
EN
ER
IC U
TIL
IZA
TIO
N R
AT
ES
BY
QU
AR
TE
RD
EC
EM
BE
R 1
98
8 -
DE
CE
MB
ER
20
14
15202530354045
12/8
812
/89
12/9
012
/91
12/9
212
/93
12/9
412
/95
12/9
612
/97
12/9
812
/99
12/0
012
/01
12/0
212
/03
12/0
412
/05
12/0
612
/07
12/0
812
/09
12/1
012
/11
12/1
212
/13
12/1
4
PER
SO
UR
CE
: PD
A/MONTH
LY COST CONTA
INMEN
T RE
PORT
XX
XX
XN
OV
EM
BE
R 1
996-
-PA
CE
AC
T M
AN
DA
TE
S
GE
NE
RIC
SU
BS
TIT
UT
ION
OF
A-R
AT
ED
P
RO
DU
CT
S
QU
AR
TE
R E
ND
ING
JAN
UA
RY
200
4--P
AC
E IN
TR
OD
UC
ES
D
IFF
ER
EN
TIA
L C
OP
AY
ME
NT
S F
OR
B
RA
ND
AN
D G
EN
ER
IC P
RO
DU
CT
S
X
DE
CE
MB
ER
198
8--A
ME
ND
ME
NT
TO
PA
GE
NE
RIC
DR
UG
LA
WS
UM
ME
R 1
989-
-FD
A IN
VE
ST
IGA
TIO
NS
OF
FR
AU
D IN
TH
E G
EN
ER
IC IN
DU
ST
RY
BE
GIN
JUL
Y 1
990-
-FD
A 'O
RA
NG
E B
OO
K' B
EC
OM
ES
ST
AN
DA
RD
FO
R G
EN
ER
IC S
UB
ST
ITU
TIO
N IN
PA
JU
LY
199
1--P
AC
E C
AR
DH
OLD
ER
CO
PA
Y A
DJU
ST
ED
TO
$6.
00D
EC
EM
BE
R 1
992-
-AM
EN
DM
EN
T T
O P
AC
E L
AW
RE
QU
IRIN
G G
EN
ER
IC S
UB
ST
ITU
TIO
N O
N O
RA
L R
XS
X
60

SECTION 5
COUNTY DATA
61

62

PA
GE
1
NU
MB
ER
OF
NU
MB
ER
OF
P
AC
EP
AC
EN
ET
TO
TA
LE
NR
OLL
ED
EN
RO
LLE
DN
UM
BE
R%
OF
PA
RT
ICIP
AT
ING
NU
MB
ER
OF
ST
AT
EP
AC
EP
AC
EN
ET
PA
CE
PA
CE
NE
TC
OU
NT
YC
AR
DH
OLD
ER
SC
AR
DH
OLD
ER
SE
NR
OLL
ED
*T
OT
AL
CA
RD
HO
LDE
RS
PR
OV
IDE
RS
SH
AR
EC
LAIM
SC
LAIM
SS
TA
TE
SH
AR
ES
TA
TE
SH
AR
E
PE
NN
SY
LVA
NIA
125,
801
192,
351
300,
758
100.
023
6,42
53,
015
78.7
$190
,701
,511
3,54
0,94
75,
087,
067
$75,
639,
185
$115
,062
,326
AD
AM
S
969
1,48
62,
305
0.8
1,86
815
46.3
$1,2
00,0
5629
,195
42,8
11$4
56,1
43$7
43,9
12
ALL
EG
HE
NY
11
,809
17,9
8428
,213
9.4
22,1
3728
897
.5$1
8,48
6,46
031
0,48
444
6,28
9$7
,616
,600
$10,
869,
860
AR
MS
TR
ON
G
845
1,37
22,
098
0.7
1,68
217
32.5
$1,3
33,6
0525
,409
35,4
88$4
93,1
14$8
40,4
91
BE
AV
ER
1,
863
3,58
95,
155
1.7
4,13
341
74.2
$3,4
30,5
8751
,629
93,1
39$1
,221
,157
$2,2
09,4
30
BE
DF
OR
D
1,00
41,
513
2,37
40.
81,
886
1516
.2$1
,924
,910
30,0
5142
,879
$752
,848
$1,1
72,0
62
BE
RK
S
3,15
35,
655
8,35
62.
86,
560
7376
.3$4
,353
,152
85,2
5514
7,10
2$1
,502
,890
$2,8
50,2
62
BLA
IR
1,97
23,
217
4,89
91.
63,
820
4876
.6$3
,540
,154
55,9
2886
,581
$1,4
12,7
12$2
,127
,442
BR
AD
FO
RD
90
31,
302
2,08
00.
71,
610
1427
.8$9
72,0
1323
,998
32,5
30$3
52,5
00$6
19,5
13
BU
CK
S
3,29
75,
398
8,23
42.
76,
554
141
91.2
$7,6
03,4
7893
,295
137,
929
$3,1
41,9
64$4
,461
,514
BU
TLE
R
1,58
32,
754
4,09
91.
43,
205
4158
.0$2
,746
,008
45,9
3073
,815
$1,0
59,9
18$1
,686
,090
CA
MB
RIA
2,
445
3,83
55,
932
2.0
4,59
638
68.0
$4,7
88,9
6275
,773
98,1
88$2
,102
,034
$2,6
86,9
28
CA
ME
RO
N
6117
522
20.
118
11
52.7
$145
,392
1,90
55,
114
$24,
668
$120
,724
CA
RB
ON
1,
046
1,58
02,
476
0.8
1,96
213
52.8
$1,4
00,1
7131
,908
40,9
03$5
24,1
20$8
76,0
51
CE
NT
RE
89
61,
537
2,30
40.
81,
809
2967
.8$9
42,2
6625
,635
42,1
26$3
26,6
77$6
15,5
88
CH
ES
TE
R
2,19
53,
324
5,23
01.
74,
104
9686
.7$3
,770
,183
61,1
6484
,322
$1,4
82,1
98$2
,287
,986
CLA
RIO
N
543
979
1,42
10.
51,
151
1323
.4$9
88,4
5017
,196
26,1
53$3
86,4
46$6
02,0
04
CLE
AR
FIE
LD
1,20
72,
203
3,22
61.
12,
544
1846
.2$1
,909
,890
35,5
9059
,769
$645
,604
$1,2
64,2
85
CLI
NT
ON
59
91,
022
1,52
20.
51,
227
854
.3$7
75,5
2517
,669
31,5
91$2
36,8
68$5
38,6
57
CO
LUM
BIA
1,
170
1,81
22,
785
0.9
2,19
714
59.2
$1,4
37,8
2935
,585
47,8
69$5
17,5
34$9
20,2
95
CR
AW
FO
RD
1,
097
1,99
62,
920
1.0
2,25
620
36.3
$1,6
50,1
2929
,123
47,4
92$6
27,4
38$1
,022
,691
CU
MB
ER
LAN
D
1,74
73,
039
4,49
31.
53,
637
7677
.8$2
,591
,111
48,7
1781
,824
$886
,410
$1,7
04,7
02
DA
UP
HIN
1,
923
2,85
04,
483
1.5
3,48
259
86.7
$2,3
75,2
8550
,377
71,9
21$8
91,3
47$1
,483
,937
DE
LAW
AR
E
3,67
05,
104
8,32
92.
86,
437
140
99.5
$6,5
41,5
7193
,887
128,
666
$2,7
32,4
14$3
,809
,157
ELK
38
086
61,
179
0.4
974
1044
.3$7
68,2
7111
,157
26,2
50$2
30,0
48$5
38,2
23
ER
IE
2,60
64,
568
6,79
02.
35,
292
5980
.0$3
,588
,491
69,3
9611
5,95
5$1
,275
,779
$2,3
12,7
11
FA
YE
TT
E
2,27
63,
418
5,39
11.
84,
246
4052
.1$4
,807
,205
65,6
7094
,875
$1,9
29,9
76$2
,877
,229
FO
RE
ST
86
174
251
0.1
196
20.
0$1
40,0
712,
135
4,46
1$4
0,24
2$9
9,82
9
FR
AN
KLI
N
1,29
02,
092
3,18
31.
12,
524
2659
.7$1
,653
,676
41,2
4759
,546
$624
,713
$1,0
28,9
63
FU
LTO
N
211
306
484
0.2
373
30.
0$2
63,6
776,
809
10,2
79$8
2,10
7$1
81,5
70
GR
EE
NE
38
154
487
90.
368
99
33.2
$568
,953
10,8
9315
,054
$239
,536
$329
,417
PO
PU
LAT
ION
TA
BL
E 5
.1N
UM
BE
R A
ND
PE
RC
EN
T O
F P
AC
E A
ND
PA
CE
NE
T C
AR
DH
OL
DE
RS
AN
D N
UM
BE
R O
F P
RO
VID
ER
S B
Y C
OU
NT
YJA
NU
AR
Y -
DE
CE
MB
ER
201
4
NU
MB
ER
OF
% U
RB
AN
63

PA
GE
2
NU
MB
ER
OF
NU
MB
ER
OF
P
AC
EP
AC
EN
ET
TO
TA
LE
NR
OLL
ED
EN
RO
LLE
DN
UM
BE
R%
OF
PA
RT
ICIP
AT
ING
NU
MB
ER
OF
ST
AT
EP
AC
EP
AC
EN
ET
PA
CE
PA
CE
NE
TC
OU
NT
YC
AR
DH
OLD
ER
SC
AR
DH
OLD
ER
SE
NR
OLL
ED
*T
OT
AL
CA
RD
HO
LDE
RS
PR
OV
IDE
RS
SH
AR
EC
LAIM
SC
LAIM
SS
TA
TE
SH
AR
ES
TA
TE
SH
AR
EP
OP
ULA
TIO
N
TA
BL
E 5
.1N
UM
BE
R A
ND
PE
RC
EN
T O
F P
AC
E A
ND
PA
CE
NE
T C
AR
DH
OL
DE
RS
AN
D N
UM
BE
R O
F P
RO
VID
ER
S B
Y C
OU
NT
YJA
NU
AR
Y -
DE
CE
MB
ER
201
4
NU
MB
ER
OF
% U
RB
AN
HU
NT
ING
DO
N
699
1,13
51,
715
0.6
1,36
09
31.3
$987
,986
20,2
1331
,418
$342
,972
$645
,014
IND
IAN
A
1,00
31,
623
2,46
50.
81,
917
1839
.9$1
,502
,402
29,7
5941
,721
$620
,026
$882
,376
JEF
FE
RS
ON
72
61,
311
1,90
70.
61,
558
1138
.5$1
,585
,097
24,4
7439
,403
$603
,032
$982
,065
JUN
IAT
A
354
602
890
0.3
751
517
.8$4
95,6
7313
,092
20,1
07$1
84,9
90$3
10,6
83
LAC
KA
WA
NN
A
3,73
84,
796
8,07
32.
76,
730
7283
.7$5
,631
,254
133,
065
149,
142
$2,5
95,8
18$3
,035
,437
LAN
CA
ST
ER
3,
513
6,66
59,
567
3.2
7,55
710
578
.7$4
,862
,058
102,
528
189,
335
$1,6
02,6
41$3
,259
,417
LAW
RE
NC
E
1,36
22,
376
3,54
61.
22,
869
2459
.7$2
,219
,709
37,7
9863
,054
$745
,224
$1,4
74,4
85
LEB
AN
ON
1,
231
2,13
73,
195
1.1
2,42
624
73.4
$1,4
19,4
5333
,529
55,3
82$4
71,4
44$9
48,0
09
LEH
IGH
2,
437
4,04
96,
151
2.0
4,86
272
92.1
$3,3
32,3
0468
,250
106,
741
$1,2
60,5
85$2
,071
,720
LUZ
ER
NE
6,
229
7,64
813
,118
4.4
10,8
3592
80.0
$8,3
17,8
6522
0,60
224
8,16
1$3
,641
,225
$4,6
76,6
40
LYC
OM
ING
1,
492
2,43
33,
701
1.2
2,97
626
63.7
$1,7
87,6
5045
,933
69,9
12$6
28,4
87$1
,159
,163
MC
KE
AN
51
490
41,
338
0.4
1,04
911
36.5
$645
,565
16,6
6527
,275
$205
,483
$440
,082
ME
RC
ER
1,
314
2,81
93,
930
1.3
3,06
631
55.5
$2,9
09,2
2238
,266
74,7
99$9
54,6
17$1
,954
,605
MIF
FLI
N
856
1,52
52,
247
0.7
1,88
510
49.5
$1,1
28,4
1631
,671
51,5
98$3
40,3
58$7
88,0
58
MO
NR
OE
1,
403
2,13
03,
350
1.1
2,52
936
61.7
$1,7
76,4
6433
,127
48,4
62$6
21,6
26$1
,154
,838
MO
NT
GO
ME
RY
4,
371
6,72
910
,518
3.5
8,32
319
497
.1$8
,369
,525
118,
708
170,
387
$3,2
91,2
99$5
,078
,226
MO
NT
OU
R
205
308
482
0.2
389
746
.2$2
31,4
136,
789
8,42
5$8
2,22
3$1
49,1
89
NO
RT
HA
MP
TO
N
2,80
74,
791
7,17
82.
45,
782
6887
.2$3
,984
,527
80,1
7313
0,04
2$1
,487
,510
$2,4
97,0
17
2,71
74,
418
1.5
3,60
622
65.1
$2,5
00,5
7071
,548
80,5
12$1
,035
,800
$1,4
64,7
70
PE
RR
Y
477
797
1,19
70.
498
58
11.5
$697
,404
13,3
5320
,204
$244
,325
$453
,079
PH
ILA
DE
LPH
IA
15,9
7316
,302
30,6
7110
.222
,091
441
100.
0$2
0,06
2,36
135
2,58
936
2,56
3$9
,841
,909
$10,
220,
451
PIK
E
499
715
1,13
70.
481
611
29.2
$549
,583
10,8
2314
,250
$231
,205
$318
,378
PO
TT
ER
26
441
663
60.
246
84
0.0
$307
,992
7,10
411
,490
$107
,603
$200
,389
SC
HU
YLK
ILL
3,11
34,
148
6,86
82.
35,
538
3463
.5$3
,459
,056
100,
986
118,
175
$1,4
63,2
70$1
,995
,786
SN
YD
ER
44
083
01,
190
0.4
989
1133
.2$6
35,6
2314
,512
25,7
30$2
17,3
04$4
18,3
19
SO
ME
RS
ET
1,
501
2,35
43,
640
1.2
2,96
117
29.2
$3,1
69,9
1449
,847
68,0
88$1
,332
,255
$1,8
37,6
58
SU
LLIV
AN
13
214
125
00.
120
22
0.0
$108
,847
4,12
22,
871
$69,
338
$39,
509
SU
SQ
UE
HA
NN
A
569
750
1,23
80.
494
18
16.0
$809
,907
14,6
3417
,895
$273
,692
$536
,215
TIO
GA
63
190
71,
450
0.5
1,10
69
9.9
$734
,895
17,1
0622
,084
$303
,845
$431
,050
UN
ION
44
077
91,
154
0.4
968
857
.2$6
23,9
3914
,686
22,4
50$2
28,8
08$3
95,1
31
NO
RT
HU
MB
ER
LAN
D
1,9
71
64
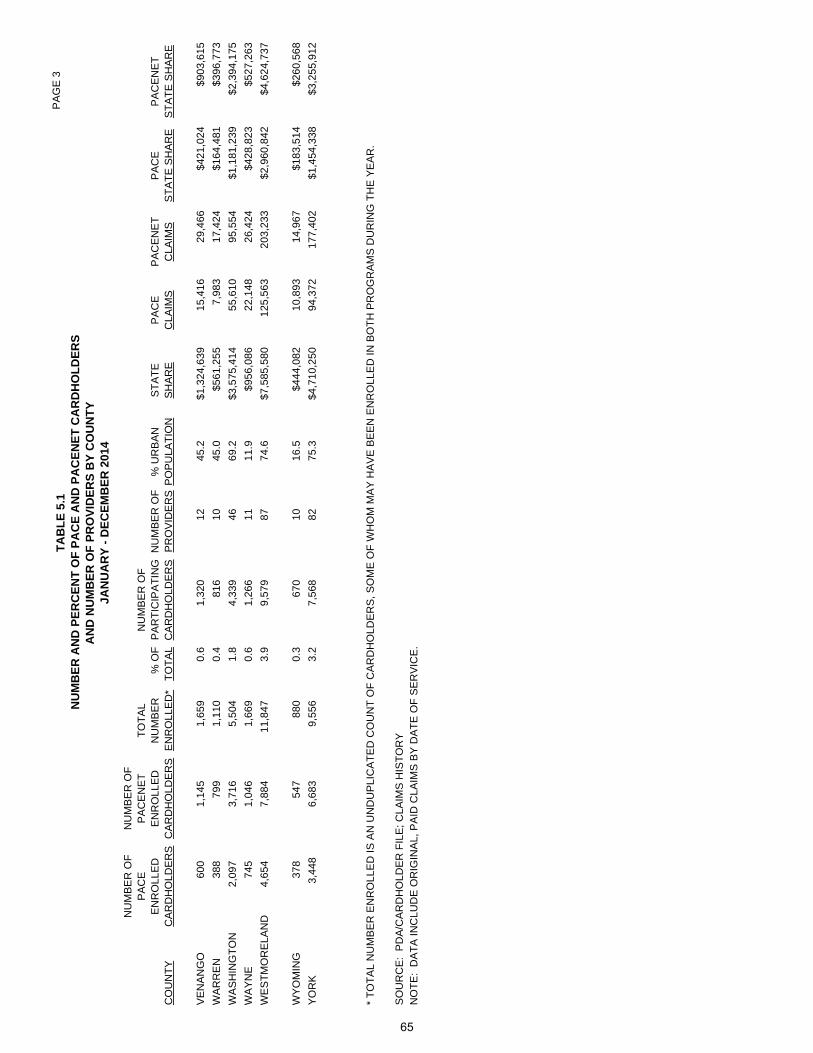
PA
GE
3
NU
MB
ER
OF
NU
MB
ER
OF
P
AC
EP
AC
EN
ET
TO
TA
LE
NR
OLL
ED
EN
RO
LLE
DN
UM
BE
R%
OF
PA
RT
ICIP
AT
ING
NU
MB
ER
OF
ST
AT
EP
AC
EP
AC
EN
ET
PA
CE
PA
CE
NE
TC
OU
NT
YC
AR
DH
OLD
ER
SC
AR
DH
OLD
ER
SE
NR
OLL
ED
*T
OT
AL
CA
RD
HO
LDE
RS
PR
OV
IDE
RS
SH
AR
EC
LAIM
SC
LAIM
SS
TA
TE
SH
AR
ES
TA
TE
SH
AR
EP
OP
ULA
TIO
N
TA
BL
E 5
.1N
UM
BE
R A
ND
PE
RC
EN
T O
F P
AC
E A
ND
PA
CE
NE
T C
AR
DH
OL
DE
RS
AN
D N
UM
BE
R O
F P
RO
VID
ER
S B
Y C
OU
NT
YJA
NU
AR
Y -
DE
CE
MB
ER
201
4
NU
MB
ER
OF
% U
RB
AN
VE
NA
NG
O
600
1,14
51,
659
0.6
1,32
012
45.2
$1,3
24,6
3915
,416
29,4
66$4
21,0
24$9
03,6
15
WA
RR
EN
38
879
91,
110
0.4
816
1045
.0$5
61,2
557,
983
17,4
24$1
64,4
81$3
96,7
73
WA
SH
ING
TO
N
2,09
73,
716
5,50
41.
84,
339
4669
.2$3
,575
,414
55,6
1095
,554
$1,1
81,2
39$2
,394
,175
WA
YN
E
745
1,04
61,
669
0.6
1,26
611
11.9
$956
,086
22,1
4826
,424
$428
,823
$527
,263
WE
ST
MO
RE
LAN
D
4,65
47,
884
11,8
473.
99,
579
8774
.6$7
,585
,580
125,
563
203,
233
$2,9
60,8
42$4
,624
,737
WY
OM
ING
37
854
788
00.
367
010
16.5
$444
,082
10,8
9314
,967
$183
,514
$260
,568
YO
RK
3,
448
6,68
39,
556
3.2
7,56
882
75.3
$4,7
10,2
5094
,372
177,
402
$1,4
54,3
38$3
,255
,912
SO
UR
CE
: P
DA
/CA
RD
HO
LDE
R F
ILE
; CLA
IMS
HIS
TO
RY
NO
TE
: D
AT
A IN
CLU
DE
OR
IGIN
AL,
PA
ID C
LAIM
S B
Y D
AT
E O
F S
ER
VIC
E.
* T
OT
AL
NU
MB
ER
EN
RO
LLE
D IS
AN
UN
DU
PLI
CA
TE
D C
OU
NT
OF
CA
RD
HO
LDE
RS
, SO
ME
OF
WH
OM
MA
Y H
AV
E B
EE
N E
NR
OLL
ED
IN B
OT
H P
RO
GR
AM
S D
UR
ING
TH
E Y
EA
R.
65

PE
NN
SY
LV
AN
IA S
EN
IOR
PA
RT
ICIP
AT
ING
EN
RO
LL
ED
CIT
IZE
N P
OP
UL
AT
ION
CA
RD
HO
LD
ER
SC
AR
DH
OL
DE
RS
N =
2,0
91,3
30N
= 2
36,4
25N
= 3
00,7
58
PA
CE
AN
D P
AC
EN
ET
CA
RD
HO
LD
ER
, C
LA
IM,
AN
D P
RO
VID
ER
IN
FO
RM
AT
ION
BY
CO
UN
TY
TY
PE
(P
ER
CE
NT
OF
CO
UN
TY
PO
PU
LA
TIO
N L
IVIN
G I
N U
RB
AN
AR
EA
)J
AN
UA
RY
- D
EC
EM
BE
R 2
01
4
FIG
UR
E 5
.1
0.5%
2.9%
9.1%
22.4
%
55.9
%
9.2%
0.5%
3.7%
11.3
%
27.1
%48
.1%
9.3%
0.5%
3.7%
11.2
%
26.8
%47
.6%
10.2
%
TO
TA
L C
LA
IMS
PE
NN
SY
LV
AN
IA C
OU
NT
IES
PA
CE
PR
OV
IDE
RS
N =
8,6
28,0
14N
= 6
7N
= 3
,015
SO
UR
CE
: P
DA
/CA
RD
HO
LDE
R F
ILE
, C
LAIM
S H
IST
OR
Y,
AN
D 2
013
PO
PU
LAT
ION
ES
TIM
AT
ES
NO
TE
: D
AT
A I
NC
LUD
E O
RIG
INA
L, P
AID
CLA
IMS
BY
DA
TE
OF
SE
RV
ICE
.
0.6%
3.8%
11.7
%
27.5
%48
.2%
8.3%
6.0%
11.9
% 26.9
%29
.9%
23.9
%1.
5%0.
4%2.
6%7.
6%
19.5
%
55.2
%
14.6
%
0.00
% U
rban
0.01
-25.
00%
Urb
an25
.01-
50.0
0% U
rban
50.0
1-75
.00%
Urb
an75
.01-
99.9
9% U
rban
100.
00%
Urb
an
66
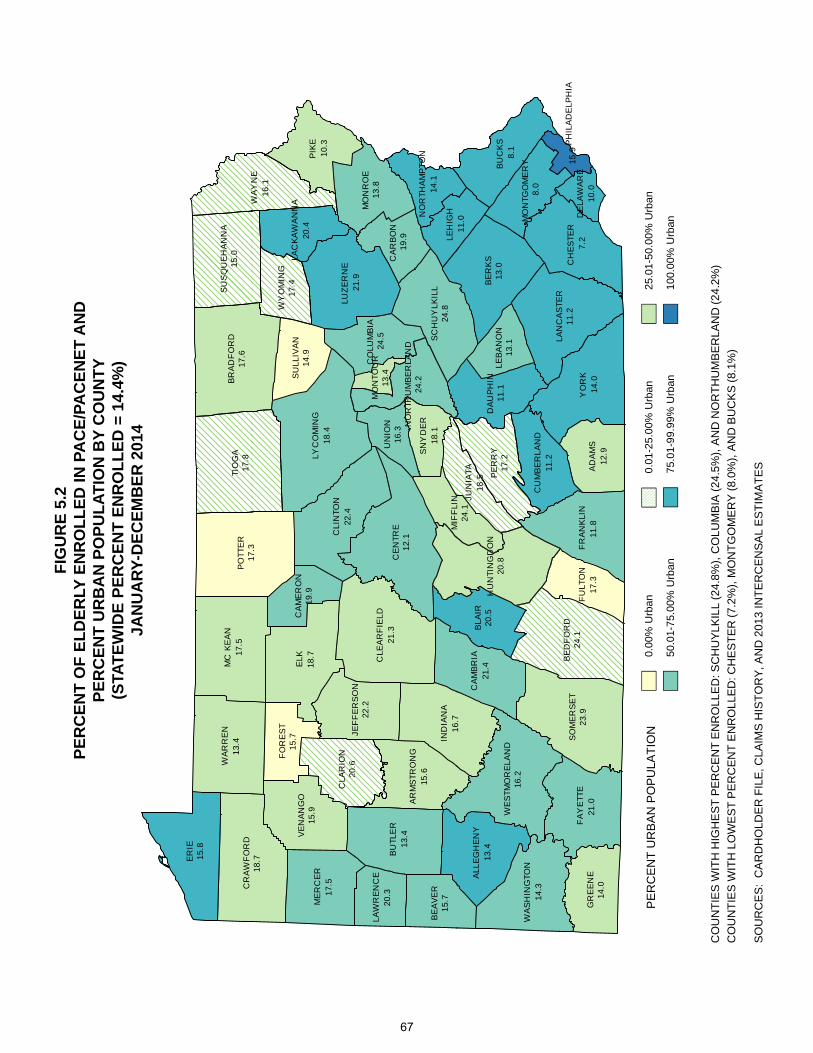
FIG
UR
E 5
.2P
ER
CE
NT
OF
EL
DE
RLY
EN
RO
LL
ED
IN
PA
CE
/PA
CE
NE
T A
ND
PE
RC
EN
T U
RB
AN
PO
PU
LA
TIO
N B
Y C
OU
NT
Y(S
TAT
EW
IDE
PE
RC
EN
T E
NR
OL
LE
D =
14.
4%)
JAN
UA
RY
-DE
CE
MB
ER
201
4
17.6
BR
AD
FO
RD
CR
AW
FO
RD
15.8
ER
IE
17.5
MC
KE
AN
173
PO
TTE
R15
.0S
US
QU
EH
AN
NA
17.8
TIO
GA
13.4
WA
RR
EN
WA
YN
E
19.9
CA
ME
RO
N
20.6
CLA
RIO
N22
.4C
LIN
TON
18.7
18.7
ELK
15.
7F
OR
ES
T
JEF
FE
RS
ON
20.4
LAC
KA
WA
NN
A
219
LUZ
ER
NE
18.
4LY
CO
MIN
G
17.5
ME
RC
ER
10.
3P
IKE
17.3
14.
9S
UL
LIV
AN
15.9
VE
NA
NG
O
16.1
WA
YN
E
17.4
WY
OM
ING
15.6
AR
MS
TR
ON
G
15.
7B
EA
VE
R
13.4
BU
TLE
R19
.9C
AR
BO
N
12.1
CE
NTR
E21
.3C
LEA
RF
IELD
24.5
CO
LUM
BIA
16.
7IN
DIA
NA
22.2
JEF
FE
RS
ON
20.
3LA
WR
EN
CE
110
LE
HIG
H
21.9
MIF
FLI
N
13.
8M
ON
RO
E
13.4
MO
NTO
UR
14.
1N
OR
THA
MP
TO
N24
.2N
OR
THU
MB
ER
LAN
D
24.8
SC
HU
YLK
ILL
18.
1S
NY
DE
R
16.3
UN
ION
13.4
ALL
EG
HE
NY
13.0
BE
RK
S20
.5B
LA
IR
8.1
BU
CK
S
21.4
CA
MB
RIA
11.2
CU
MB
ER
LA
ND
11.1
DA
UP
HIN
20.8
HU
NT
ING
DO
N
16.
7
18.5
JUN
IAT
A
LA
NC
AS
TER
13.1
LEB
AN
ON
11.0
24.1
8.0
MO
NTG
OM
ER
Y
17.2
PE
RR
Y
14.
3W
AS
HIN
GTO
N16
.2W
ES
TMO
RE
LAN
D
12.9
AD
AM
S
24.
1B
ED
FO
RD
7.2
CH
ES
TE
R
10.0
DE
LAW
AR
E21
.0F
AY
ETT
E
11.8
FR
AN
KLI
N17
.3F
ULT
ON
14.0
GR
EE
NE
11.2
LA
NC
AS
TER
15.9
PH
ILA
DE
LP
HIA
23.
9S
OM
ER
SE
T
14.0
YO
RK
0.00
% U
rban
0.01
-25
.00
% U
rban
25.0
1-5
0.0
0%
Urb
anP
ER
CE
NT
UR
BA
N P
OP
ULA
TIO
N
50.0
1-7
5.0
0%
Urb
an75
.01-
99
.99
% U
rban
100.
00%
Urb
an
CO
UN
TIE
S W
ITH
HIG
HE
ST
PE
RC
EN
T E
NR
OLL
ED
: SC
HU
YLK
ILL
(24.
8%),
CO
LUM
BIA
(24
.5%
), A
ND
NO
RT
HU
MB
ER
LAN
D (
24.2
%)
CO
UN
TIE
S W
ITH
LO
WE
ST
PE
RC
EN
T E
NR
OLL
ED
: CH
ES
TE
R (
7.2%
), M
ON
TG
OM
ER
Y (
8.0%
), A
ND
BU
CK
S (
8.1%
)
SO
UR
CE
S:
CA
RD
HO
LDE
R F
ILE
, CLA
IMS
HIS
TO
RY
, AN
D 2
013
INT
ER
CE
NS
AL
ES
TIM
AT
ES
67

68

SECTION 6
PROVIDER DATA
69

70

PR
OV
IDE
RT
YP
EN
O.
%N
O.
%N
O.
%N
O.
%N
O.
%
IND
EP
EN
DE
NT
932
31.0
148,
888
13.8
46,9
424.
388
6,21
481
.91,
082,
044
100.
0P
HA
RM
AC
IES
DIS
PE
NS
ING
381.
332
867
.111
2.2
150
30.7
489
100.
0P
HY
SIC
IAN
S
INS
TIT
UT
ION
AL
270.
983
46.
964
95.
410
,580
87.7
12,0
6310
0.0
PH
AR
MA
CIE
S
CH
AIN
1,84
761
.428
7,80
813
.791
,915
4.4
1,72
3,64
681
.92,
103,
369
100.
0P
HA
RM
AC
IES
NU
RS
ING
HO
ME
135
4.5
37,7
2812
.110
,166
3.2
265,
195
84.7
313,
089
100.
0P
HA
RM
AC
IES
MA
IL O
RD
ER
291.
04,
331
14.4
1,23
84.
124
,507
81.5
30,0
7610
0.0
PH
AR
MA
CIE
S
HO
ME
INF
US
ION
10.
05
31.3
531
.36
37.5
1610
0.0
PH
AR
MA
CIE
S
TO
TA
L3,
009
100.
047
9,92
213
.615
0,92
64.
32,
910,
298
82.2
3,54
1,14
610
0.0
SO
UR
CE
: PD
A/P
S-0
-100
, CLA
IMS
HIS
TO
RY
NO
TE
: DA
TA
INC
LUD
E O
RIG
INA
L, P
AID
CLA
IMS
BY
DA
TE
OF
PA
YM
EN
T, E
XC
LUD
E P
AC
EN
ET
CLA
IMS
.
TA
BL
E 6
.1P
AC
E C
LA
IMS
BY
PR
OD
UC
T A
ND
PR
OV
IDE
R T
YP
EJA
NU
AR
Y -
DE
CE
MB
ER
201
4
PR
OV
IDE
RS
BR
AN
D S
ING
LE-S
OU
RC
EB
RA
ND
MU
LTI-
SO
UR
CE
GE
NE
RIC
TO
TA
L C
LAIM
S
71

IND
EP
EN
DE
NT
$12,
660,
932
52.8
$85.
04$2
,872
,792
12.0
$61.
20$8
,427
,182
35.2
$9.5
1$2
3,96
0,90
610
0.0
$22.
14P
HA
RM
AC
IES
DIS
PE
NS
ING
$343
,374
90.2
$1,0
46.8
7$1
,738
0.5
$158
.01
$35,
541
9.3
$236
.94
$380
,653
100.
0$7
78.4
3P
HY
SIC
IAN
S
INS
TIT
UT
ION
AL
$80,
930
40.8
$97.
04$2
7,16
913
.7$4
1.86
$90,
495
45.6
$8.5
5$1
98,5
9410
0.0
$16.
46P
HA
RM
AC
IES
CH
AIN
$24,
627,
099
55.6
$85.
57$5
,475
,122
12.4
$59.
57$1
4,22
2,35
532
.1$8
.25
$44,
324,
575
100.
0$2
1.07
PH
AR
MA
CIE
S
NU
RS
ING
HO
ME
$2,7
00,4
8252
.1$7
1.58
$460
,242
8.9
$45.
27$2
,027
,295
39.1
$7.6
4$5
,188
,018
100.
0$1
6.57
PH
AR
MA
CIE
S
MA
IL O
RD
ER
$833
,867
84.2
$192
.53
$48,
430
4.9
$39.
12$1
07,5
8510
.9$4
.39
$989
,881
100.
0$3
2.91
PH
AR
MA
CIE
S
HO
ME
INF
US
ION
$37,
335
97.9
$7,4
67.0
8$7
722.
0$1
54.5
0$4
10.
1$6
.80
$38,
149
100.
0$2
,384
.29
PH
AR
MA
CIE
S
TO
TA
L$4
1,28
4,02
055
.0$8
6.02
$8,8
86,2
6511
.8$5
8.88
$24,
910,
492
33.2
$8.5
6$7
5,08
0,77
710
0.0
$21.
20
SO
UR
CE
: PD
A/P
S-0
-100
, CLA
IMS
HIS
TO
RY
NO
TE
: DA
TA
INC
LUD
E O
RIG
INA
L, P
AID
CLA
IMS
BY
DA
TE
OF
PA
YM
EN
T, E
XC
LUD
E P
AC
EN
ET
CLA
IMS
.
EX
PE
ND
ITU
RE
%
EX
PE
ND
ITU
RE
%
BR
AN
D S
ING
LE-S
OU
RC
E
EX
PE
ND
ITU
RE
%
TA
BL
E 6
.2P
AC
E E
XP
EN
DIT
UR
ES
AN
D A
VE
RA
GE
ST
AT
E S
HA
RE
BY
PR
OD
UC
T A
ND
PR
OV
IDE
R T
YP
EJA
NU
AR
Y -
DE
CE
MB
ER
201
4
PR
OV
IDE
R
TY
PE
BR
AN
D M
ULT
I-S
OU
RC
EG
EN
ER
ICT
OT
AL,
ALL
PR
OD
UC
TS
EX
PE
ND
ITU
RE
%
AV
ER
AG
E
ST
AT
E
SH
AR
E
AV
ER
AG
E
ST
AT
E
SH
AR
E
AV
ER
AG
E
ST
AT
E
SH
AR
E
AV
ER
AG
E
ST
AT
E
SH
AR
E
72

TA
BL
E 6
.3P
AC
EN
ET
CL
AIM
S A
ND
EX
PE
ND
ITU
RE
S B
Y P
RO
VID
ER
TY
PE
JAN
UA
RY
- D
EC
EM
BE
R 2
014
CO
PA
IDT
OT
AL
CA
RD
HO
LDE
RO
TH
ER
PA
YE
RS
TA
TE
SH
AR
ET
OT
AL
CLA
IMS
CLA
IMS
EX
PE
ND
ITU
RE
SE
XP
EN
DIT
UR
ES
EX
PE
ND
ITU
RE
SE
XP
EN
DIT
UR
ES
IND
EP
EN
DE
NT
P
HA
RM
AC
IES
1,01
992
927
2,21
41,
186,
218
1,45
8,43
228
.6$1
3,66
5,62
2$6
5,00
2,44
9$3
4,25
4,44
9$1
12,9
22,5
2027
.9
DIS
PE
NS
ING
P
HY
SIC
IAN
S11
146
4366
070
30.
0$1
1,09
7$1
,528
,412
$445
,480
$1,9
84,9
890.
5
INS
TIT
UT
ION
AL
PH
AR
MA
CIE
S33
291,
863
9,82
111
,684
0.2
$91,
947
$865
,545
$435
,829
$1,3
93,3
200.
3
CH
AIN
P
HA
RM
AC
IES
1,86
41,
845
564,
853
2,56
2,34
43,
127,
197
61.3
$30,
509,
234
$146
,766
,132
$69,
804,
170
$247
,079
,536
61.1
NU
RS
ING
HO
ME
P
HA
RM
AC
IES
147
135
71,3
4134
4,76
841
6,10
98.
2$3
,254
,513
$13,
620,
133
$6,5
62,8
38$2
3,43
7,48
45.
8
MA
IL O
RD
ER
P
HA
RM
AC
IES
4431
5,86
378
,762
84,6
251.
7$1
,181
,833
$13,
209,
409
$3,3
48,8
36$1
7,74
0,07
94.
4
HO
ME
INF
US
ION
P
HA
RM
AC
IES
31
037
370.
0$6
53$8
4,69
3$1
1,92
7$9
7,27
30.
0
TO
TA
L (A
LL
PR
OV
IDE
RS
)3,
221
3,01
691
6,17
74,
182,
610
5,09
8,78
710
0.0
$48,
714,
900
$241
,076
,774
$114
,863
,528
$404
,655
,202
100.
0
SO
UR
CE
: P
DA
/CLA
IMS
HIS
TO
RY
NO
TE
: D
AT
A IN
CLU
DE
OR
IGIN
AL,
PA
ID C
LAIM
S B
Y D
AT
E O
F P
AY
ME
NT
.
PA
CE
NE
T C
AR
DH
OLD
ER
S W
HO
AR
E N
OT
EN
RO
LLE
D IN
PA
RT
D A
RE
RE
QU
IRE
D T
O P
AY
TH
E B
EN
CH
MA
RK
AM
OU
NT
PR
IOR
TO
AN
Y P
AC
EN
ET
CLA
IM C
OV
ER
AG
E.
EN
RO
LLE
D
EX
PE
ND
ITU
RE
S
PR
OV
IDE
R T
YP
E
PR
OV
IDE
RS
% O
FC
LAIM
SD
ED
UC
TIB
LE
CLA
IMS
1
CLA
IMS
% O
F T
OT
AL
EX
PE
ND
ITU
RE
SP
AR
TIC
I-P
AT
ING
1 IN 2
014,
TH
E M
ON
TH
LY P
AC
EN
ET
DE
DU
CT
IBLE
WA
S C
HA
NG
ED
TO
$35
.50
TO
CO
INC
IDE
WIT
H T
HE
RE
GIO
NA
L M
ED
ICA
RE
PA
RT
D P
RE
MIU
M B
EN
CH
MA
RK
.
73

TABLE 6.4
PACENET CLAIMS VOLUME BY PHASE OF COVERAGE1, PRODUCT TYPE, AND PROVIDER TYPEJANUARY - DECEMBER 2014
PROVIDER TYPE NO. % NO. % NO. % NO. %
INDEPENDENT PHARMACIES 7,271 2.7 4,419 1.6 260,524 95.7 272,214 100.0
DISPENSING PHYSICIANS 0 0.0 0 0.0 43 100.0 43 100.0
INSTITUTIONAL PHARMACIES 63 3.4 69 3.7 1,731 92.9 1,863 100.0
CHAIN PHARMACIES 13,428 2.4 9,477 1.7 541,948 95.9 564,853 100.0
NURSING HOME PHARMACIES 2,281 3.2 1,247 1.7 67,813 95.1 71,341 100.0
MAIL ORDER PHARMACIES 127 2.2 83 1.4 5,653 96.4 5,863 100.0
TOTAL (ALL PROVIDERS) 23,170 2.5 15,295 1.7 877,712 95.8 916,177 100.0
PROVIDER TYPE NO. % NO. % NO. % NO. %
INDEPENDENT PHARMACIES 203,517 17.2 53,190 4.5 929,511 78.4 1,186,218 100.0
DISPENSING PHYSICIANS 453 68.6 49 7.4 158 23.9 660 100.0
INSTITUTIONAL PHARMACIES 1,001 10.2 541 5.5 8,279 84.3 9,821 100.0
CHAIN PHARMACIES 446,386 17.4 117,503 4.6 1,998,455 78.0 2,562,344 100.0
NURSING HOME PHARMACIES 50,147 14.5 11,963 3.5 282,658 82.0 344,768 100.0
MAIL ORDER PHARMACIES 10,118 12.8 3,245 4.1 65,399 83.0 78,762 100.0
HOME INFUSION PHARMACIES 6 16.2 18 48.6 13 35.1 37 100.0
TOTAL (ALL PROVIDERS) 711,628 17.0 186,509 4.5 3,284,473 78.5 4,182,610 100.0
SOURCE: PDA/CLAIMS HISTORYNOTE: DATA INCLUDE ORIGINAL, PAID CLAIMS BY DATE OF PAYMENT.
THE DEDUCTIBLE. GENERIC UTILIZATION RATES MAY THEREFORE BE HIGHER IN THE DEDUCTIBLE PHASE
FOR WHICH THE TOTAL PRICE IS LESS THAN THE $8 OR $15 COPAY ARE NOT NECESSARILY SUBMITTED DURING THE COPAYMENT PHASE, BUT MAY BE SUBMITTED DURING THE DEDUCTIBLE PHASE TO SATISFY
DUE TO THE OVER-REPRESENTATION OF LOW-PRICED GENERIC CLAIMS.
1IN 2014, THE MONTHLY PACENET DEDUCTIBLE WAS CHANGED TO $35.50 TO COINCIDE WITH THE REGIONALMEDICARE PART D PREMIUM BENCHMARK. PACENET CARDHOLDERS WHO ARE NOT ENROLLED IN PART D ARE REQUIRED TO PAY THE BENCHMARK AMOUNT PRIOR TO ANY PACENET CLAIM COVERAGE. THE DEDUCT-IBLE AND COPAYMENT PHASES DIFFER IN THE TYPES OF CLAIMS SUBMITTED. LOW-PRICED PRESCRIPTIONS
TOTAL(ALL PRODUCTS)
SINGLE-SOURCE MULTI-SOURCE GENERIC (ALL PRODUCTS)BRAND BRAND TOTAL
DEDUCTIBLE PHASE CLAIMS
COPAYMENT PHASE CLAIMS
SINGLE-SOURCE MULTI-SOURCE GENERICBRAND BRAND
74

TABLE 6.5PACENET EXPENDITURES BY PHASE OF COVERAGE, PRODUCT TYPE, AND PROVIDER TYPE
JANUARY - DECEMBER 2014
PAGE 1
A. DEDUCTIBLE PHASE CLAIMS1
PROVIDER TYPE AMOUNT % AMOUNT % AMOUNT % AMOUNT %
INDEPENDENT PHARMACIES
CARDHOLDER EXPENDITURES $165,736 9.0 $76,078 4.1 $1,610,199 86.9 $1,852,013 100.0
OTHER PAYER EXPENDITURES $1,215,741 36.0 $359,372 10.6 $1,805,643 53.4 $3,380,756 100.0
STATE SHARE EXPENDITURES $1,320 72.0 $39 2.2 $473 25.8 $1,832 100.0
TOTAL EXPENDITURES $1,382,797 26.4 $435,489 8.3 $3,416,315 65.3 $5,234,601 100.0
DISPENSING PHYSICIANS
CARDHOLDER EXPENDITURES $0 0.0 $0 0.0 $179 100.0 $179 100.0
OTHER PAYER EXPENDITURES $0 0.0 $0 0.0 $364 100.0 $364 100.0
STATE SHARE EXPENDITURES $0 – $0 – $0 – $0 –
TOTAL EXPENDITURES $0 0.0 $0 0.0 $543 100.0 $543 100.0
INSTITUTIONAL PHARMACIES
CARDHOLDER EXPENDITURES $449 3.7 $893 7.3 $10,885 89.0 $12,227 100.0
OTHER PAYER EXPENDITURES $17,014 58.3 $2,460 8.4 $9,712 33.3 $29,186 100.0
STATE SHARE EXPENDITURES $0 – $0 – $0 – $0 –
TOTAL EXPENDITURES $17,463 42.2 $3,353 8.1 $20,597 49.7 $41,413 100.0
CHAIN PHARMACIES
CARDHOLDER EXPENDITURES $340,857 8.6 $160,532 4.0 $3,470,598 87.4 $3,971,987 100.0
OTHER PAYER EXPENDITURES $2,341,698 34.8 $669,540 10.0 $3,718,061 55.3 $6,729,299 100.0
STATE SHARE EXPENDITURES $1,393 53.4 $109 4.2 $1,108 42.5 $2,610 100.0
TOTAL EXPENDITURES $2,683,949 25.1 $830,181 7.8 $7,189,767 67.2 $10,703,896 100.0
NURSING HOME PHARMACIES
CARDHOLDER EXPENDITURES $43,600 10.6 $16,142 3.9 $350,724 85.5 $410,466 100.0
OTHER PAYER EXPENDITURES $343,265 35.4 $78,301 8.1 $548,109 56.5 $969,676 100.0
STATE SHARE EXPENDITURES $462 26.5 $164 9.5 $1,114 64.0 $1,740 100.0
TOTAL EXPENDITURES $387,328 28.0 $94,607 6.9 $899,947 65.1 $1,381,882 100.0
MAIL ORDER PHARMACIES
CARDHOLDER EXPENDITURES $2,852 8.3 $1,513 4.4 $30,119 87.3 $34,484 100.0
OTHER PAYER EXPENDITURES $169,443 68.1 $8,575 3.5 $70,663 28.4 $248,681 100.0
STATE SHARE EXPENDITURES $178 100.0 $0 0.0 $0 0.0 $178 100.0
TOTAL EXPENDITURES $172,474 60.9 $10,088 3.6 $100,782 35.6 $283,344 100.0
TOTAL (ALL PROVIDERS)
CARDHOLDER EXPENDITURES $553,495 8.8 $255,158 4.1 $5,472,703 87.1 $6,281,357 100.0
OTHER PAYER EXPENDITURES $4,087,162 36.0 $1,118,248 9.9 $6,152,553 54.2 $11,357,962 100.0
STATE SHARE EXPENDITURES $3,353 52.7 $313 4.9 $2,695 42.4 $6,361 100.0
TOTAL EXPENDITURES $4,644,010 26.3 $1,373,719 7.8 $11,627,951 65.9 $17,645,680 100.0
SOURCE: PDA/CLAIMS HISTORY
NOTE: DATA INCLUDE ORIGINAL, PAID CLAIMS BY DATE OF PAYMENT.
THE OUTSTANDING DEDUCTIBLE AMOUNT AND A COPAYMENT, WHILE PACENET COVERS THE REMAINING COST, IF ANY, OF
1IN 2014, THE MONTHLY PACENET DEDUCTIBLE WAS CHANGED TO $35.50 TO COINCIDE WITH THE REGIONAL MEDICARE PART D
BENCHMARK PREMIUM. STATE SHARE EXPENDITURES FOR DEDUCTIBLE CLAIMS ARE ONLY INCURRED FOR TRANSITION
CLAIMS WHICH COMPLETE THE $35.50 MONTHLY DEDUCTIBLE ACCUMULATION. FOR THESE CLAIMS, THE CARDHOLDER PAYS
THE PRESCRIPTION.
BRAND BRAND
SINGLE-SOURCE MULTI-SOURCE GENERIC ALL PRODUCTS
75

TABLE 6.5PACENET EXPENDITURES BY PHASE OF COVERAGE, PRODUCT TYPE, AND PROVIDER TYPE
JANUARY - DECEMBER 2014
PAGE 2
B. COPAYMENT PHASE CLAIMS
PROVIDER TYPE AMOUNT % AMOUNT % AMOUNT % AMOUNT %
INDEPENDENT PHARMACIES
CARDHOLDER EXPENDITURES $4,119,570 34.9 $1,017,756 8.6 $6,676,283 56.5 $11,813,609 100.0
OTHER PAYER EXPENDITURES $43,049,369 69.9 $5,339,924 8.7 $13,232,401 21.5 $61,621,693 100.0
STATE SHARE EXPENDITURES $20,645,930 60.3 $3,599,152 10.5 $10,007,535 29.2 $34,252,616 100.0
TOTAL EXPENDITURES $67,814,868 63.0 $9,956,832 9.3 $29,916,219 27.8 $107,687,919 100.0
DISPENSING PHYSICIANS
CARDHOLDER EXPENDITURES $8,794 80.6 $944 8.7 $1,179 10.8 $10,917 100.0
OTHER PAYER EXPENDITURES $1,449,307 94.9 $34,655 2.3 $44,087 2.9 $1,528,048 100.0
STATE SHARE EXPENDITURES1 $404,088 90.7 $25,813 5.8 $15,579 3.5 $445,480 100.0
TOTAL EXPENDITURES $1,862,188 93.8 $61,412 3.1 $60,845 3.1 $1,984,446 100.0
INSTITUTIONAL PHARMACIES
CARDHOLDER EXPENDITURES $18,560 23.3 $8,376 10.5 $52,784 66.2 $79,720 100.0
OTHER PAYER EXPENDITURES $638,238 76.3 $69,882 8.4 $128,238 15.3 $836,359 100.0
STATE SHARE EXPENDITURES $281,826 64.7 $41,284 9.5 $112,719 25.9 $435,829 100.0
TOTAL EXPENDITURES $938,625 69.4 $119,541 8.8 $293,741 21.7 $1,351,907 100.0
CHAIN PHARMACIES
CARDHOLDER EXPENDITURES $9,568,921 36.1 $2,306,109 8.7 $14,662,217 55.3 $26,537,247 100.0
OTHER PAYER EXPENDITURES $97,550,866 69.7 $11,687,726 8.4 $30,798,241 22.0 $140,036,833 100.0
STATE SHARE EXPENDITURES $44,198,158 63.3 $7,625,956 10.9 $17,977,446 25.8 $69,801,560 100.0
TOTAL EXPENDITURES $151,317,945 64.0 $21,619,791 9.2 $63,437,903 26.8 $236,375,640 100.0
NURSING HOME PHARMACIES
CARDHOLDER EXPENDITURES $885,331 31.1 $194,210 6.8 $1,764,506 62.0 $2,844,047 100.0
OTHER PAYER EXPENDITURES $8,109,698 64.1 $1,001,419 7.9 $3,539,341 28.0 $12,650,458 100.0
STATE SHARE EXPENDITURES $3,704,541 56.5 $597,764 9.1 $2,258,792 34.4 $6,561,098 100.0
TOTAL EXPENDITURES $12,699,570 57.6 $1,793,393 8.1 $7,562,639 34.3 $22,055,603 100.0
MAIL ORDER PHARMACIES
CARDHOLDER EXPENDITURES $353,571 30.8 $95,417 8.3 $698,361 60.9 $1,147,349 100.0
OTHER PAYER EXPENDITURES $9,957,843 76.8 $742,081 5.7 $2,260,804 17.4 $12,960,728 100.0
STATE SHARE EXPENDITURES $2,816,628 84.1 $235,964 7.1 $296,065 8.8 $3,348,658 100.0
TOTAL EXPENDITURES $13,128,042 75.2 $1,073,462 6.2 $3,255,231 18.7 $17,456,735 100.0
HOME INFUSION PHARMACIES
CARDHOLDER EXPENDITURES $256 39.2 $270 41.3 $127 19.5 $653 100.0
OTHER PAYER EXPENDITURES $2,727 3.2 $81,717 96.5 $250 0.3 $84,693 100.0
STATE SHARE EXPENDITURES $5,482 46.0 $6,097 51.1 $347 2.9 $11,927 100.0
TOTAL EXPENDITURES $8,465 8.7 $88,084 90.6 $724 0.7 $97,273 100.0
TOTAL (ALL PROVIDERS)
CARDHOLDER EXPENDITURES $14,955,004 35.2 $3,623,082 8.5 $23,855,458 56.2 $42,433,543 100.0
OTHER PAYER EXPENDITURES $160,758,047 70.0 $18,957,403 8.3 $50,003,362 21.8 $229,718,811 100.0
STATE SHARE EXPENDITURES $72,056,654 62.7 $12,132,030 10.6 $30,668,483 26.7 $114,857,167 100.0
TOTAL EXPENDITURES $247,769,704 64.0 $34,712,515 9.0 $104,527,303 27.0 $387,009,522 100.0
SOURCE: PDA/CLAIMS HISTORY
NOTE: DATA INCLUDE ORIGINAL, PAID CLAIMS BY DATE OF PAYMENT.
THE OUTSTANDING DEDUCTIBLE AMOUNT AND A COPAYMENT, WHILE PACENET COVERS THE REMAINING COST, IF ANY, OF
THE PRESCRIPTION.
1IN 2014, THE MONTHLY PACENET DEDUCTIBLE WAS CHANGED TO $35.50 TO COINCIDE WITH THE REGIONAL MEDICARE PART D
BRAND BRAND
SINGLE-SOURCE MULTI-SOURCE GENERIC ALL PRODUCTS
BENCHMARK PREMIUM. STATE SHARE EXPENDITURES FOR DEDUCTIBLE CLAIMS ARE ONLY INCURRED FOR TRANSITION
CLAIMS WHICH COMPLETE THE $35.50 MONTHLY DEDUCTIBLE ACCUMULATION. FOR THESE CLAIMS, THE CARDHOLDER PAYS
76

TABLE 6.6AVERAGE CARDHOLDER AND STATE SHARE COST PER PACENET CLAIM
BY PHASE OF COVERAGE, PRODUCT TYPE, AND PROVIDER TYPEJANUARY - DECEMBER 2014
BRAND BRAND BRAND BRANDSINGLE- MULTI- SINGLE- MULTI-SOURCE SOURCE GENERIC TOTAL SOURCE SOURCE GENERIC TOTAL
INDEPENDENT PHARMACIESAVERAGE CARDHOLDER SHARE2 $22.79 $17.22 $6.18 $6.80 $20.24 $19.13 $7.18 $9.96AVERAGE OTHER PAYER SHARE $167.20 $81.32 $6.93 $12.42 $211.53 $100.39 $14.24 $51.95AVERAGE STATE SHARE $0.18 $0.01 $0.00 $0.01 $101.45 $67.67 $10.77 $28.88AVERAGE TOTAL RX COST $190.18 $98.55 $13.11 $19.23 $333.21 $187.19 $32.18 $90.78
DISPENSING PHYSICIANSAVERAGE CARDHOLDER SHARE2 – – $4.17 $4.17 $19.41 $19.27 $7.46 $16.54AVERAGE OTHER PAYER SHARE – – $8.46 $8.46 $3,199.35 $707.24 $279.03 $2,315.22AVERAGE STATE SHARE – – $0.00 $0.00 $892.03 $526.80 $98.60 $674.97AVERAGE TOTAL RX COST – – $12.63 $12.63 $4,110.79 $1,253.31 $385.10 $3,006.74
INSTITUTIONAL PHARMACIESAVERAGE CARDHOLDER SHARE2 $7.13 $12.95 $6.29 $6.56 $18.54 $15.48 $6.38 $8.12AVERAGE OTHER PAYER SHARE $270.06 $35.65 $5.61 $15.67 $637.60 $129.17 $15.49 $85.16AVERAGE STATE SHARE $0.00 $0.00 $0.00 $0.00 $281.54 $76.31 $13.62 $44.38AVERAGE TOTAL RX COST $277.20 $48.60 $11.90 $22.23 $937.69 $220.96 $35.48 $137.65
CHAIN PHARMACIESAVERAGE CARDHOLDER SHARE2 $25.38 $16.94 $6.40 $7.03 $21.44 $19.63 $7.34 $10.36AVERAGE OTHER PAYER SHARE $174.39 $70.65 $6.86 $11.91 $218.53 $99.47 $15.41 $54.65AVERAGE STATE SHARE $0.10 $0.01 $0.00 $0.00 $99.01 $64.90 $9.00 $27.24AVERAGE TOTAL RX COST $199.88 $87.60 $13.27 $18.95 $338.98 $183.99 $31.74 $92.25
NURSING HOME PHARMACIESAVERAGE CARDHOLDER SHARE2 $19.11 $12.94 $5.17 $5.75 $17.65 $16.23 $6.24 $8.25AVERAGE OTHER PAYER SHARE $150.49 $62.79 $8.08 $13.59 $161.72 $83.71 $12.52 $36.69AVERAGE STATE SHARE $0.20 $0.13 $0.02 $0.02 $73.87 $49.97 $7.99 $19.03AVERAGE TOTAL RX COST $169.81 $75.87 $13.27 $19.37 $253.25 $149.91 $26.76 $63.97
MAIL ORDER PHARMACIESAVERAGE CARDHOLDER SHARE2 $22.46 $18.23 $5.33 $5.88 $34.94 $29.40 $10.68 $14.57AVERAGE OTHER PAYER SHARE $1,334.20 $103.31 $12.50 $42.42 $984.17 $228.68 $34.57 $164.56AVERAGE STATE SHARE $1.40 $0.00 $0.00 $0.03 $278.38 $72.72 $4.53 $42.52AVERAGE TOTAL RX COST $1,358.06 $121.54 $17.83 $48.33 $1,297.49 $330.80 $49.77 $221.64
HOME INFUSION PHARMACIESAVERAGE CARDHOLDER SHARE2 – – – – $42.72 $15.00 $9.78 $17.66AVERAGE OTHER PAYER SHARE – – – – $454.45 $4,539.81 $19.21 $2,289.00AVERAGE STATE SHARE – – – – $913.66 $338.74 $26.71 $322.34AVERAGE TOTAL RX COST – – – – $1,410.83 $4,893.55 $55.69 $2,629.00
TOTAL (ALL PROVIDERS)AVERAGE CARDHOLDER SHARE2 $23.89 $16.68 $6.24 $6.86 $21.02 $19.43 $7.26 $10.15AVERAGE OTHER PAYER SHARE $176.40 $73.11 $7.01 $12.40 $225.90 $101.64 $15.22 $54.92AVERAGE STATE SHARE $0.14 $0.02 $0.00 $0.01 $101.26 $65.05 $9.34 $27.46AVERAGE TOTAL RX COST $200.43 $89.81 $13.25 $19.26 $348.17 $186.12 $31.82 $92.53
SOURCE: PDA/CLAIMS HISTORYNOTE: DATA INCLUDE ORIGINAL, PAID CLAIMS BY DATE OF PAYMENT.
PAYMENTS IF BRAND IS CHOSEN OVER GENERIC. THE CARDHOLDER SHARE DURING THE COPAYMENT PHASE MAYTHEREFORE EXCEED THE $8 OR $15 COPAYMENT.
DEDUCTIBLE PHASE1 COPAYMENT PHASE
PROVIDER TYPE
2THE CARDHOLDER SHARE INCLUDES THE DEDUCTIBLE PAYMENTS, COPAYMENTS, AND GENERIC DIFFERENTIAL
1IN 2014, THE MONTHLY PACENET DEDUCTIBLE WAS CHANGED TO $35.50 TO COINCIDE WITH THE REGIONAL MEDICARE PART D BENCHMARK PREMIUM. STATE SHARE EXPENDITURES FOR DEDUCTIBLE CLAIMS ARE ONLY INCURRED FOR TRANSITION CLAIMS WHICH COMPLETE THE $35.50 MONTHLY DEDUCTIBLE ACCUMULATION. FOR THESE CLAIMS, THE CARDHOLDER PAYS THE OUTSTANDING DEDUCTIBLE AMOUNT AND A COPAYMENT, WHILE PACENET COVERS THE REMAINING COST, IF ANY, OF THE PRESCRIPTION.
77

78

SECTION 7
THERAPEUTIC CLASS DATA
AND DRUG UTILIZATION
REVIEW DATA
79

80

PA
GE
1
% O
FT
OT
AL
% O
F%
OF
WIT
H A
NY
PA
RT
ICIP
AT
ING
TH
ER
AP
EU
TIC
CLA
SS
1C
LAIM
ST
OT
AL
TO
TA
LC
LAIM
SC
AR
DH
OLD
ER
S
AN
TI-
INF
EC
TIV
E A
GE
NT
S
108,
524
3.1
$1,5
54,3
63.6
02.
142
,691
43.6
$36.
41$1
2.36
QU
INO
LON
ES
21,4
140.
6$1
68,1
16.5
70.
214
,549
14.9
$11.
56$1
.34
CE
PH
ALO
SP
OR
INS
14,6
660.
4$6
2,27
7.97
0.1
10,2
5210
.5$6
.07
$0.5
0
AN
TIN
EO
PLA
ST
IC A
GE
NT
S
18,0
190.
5$2
,261
,516
.74
3.0
3,36
13.
4$6
72.8
7$1
7.98
AU
TO
NO
MIC
DR
UG
S
141,
286
4.0
$5,1
70,1
96.7
26.
826
,224
26.8
$197
.16
$41.
10A
NT
ICH
OLI
NE
RG
ICS
42,7
291.
2$2
,698
,600
.92
3.6
8,96
09.
2$3
01.1
8$2
1.45
AD
RE
NE
RG
IC A
GE
NT
S33
,961
1.0
$728
,074
.60
1.0
10,9
8711
.2$6
6.27
$5.7
9
BLO
OD
FO
RM
AT
ION
& C
OA
GU
LAT
ION
AG
EN
TS
144,
339
4.1
$4,3
90,4
05.0
95.
821
,949
22.4
$200
.03
$34.
90
CA
RD
IOV
AS
CU
LAR
DR
UG
S
1,17
6,36
333
.2$1
7,51
6,19
4.27
23.2
79,9
1481
.7$2
19.1
9$1
39.2
4C
AR
DIA
C D
RU
GS
765,
064
21.6
$8,5
91,8
30.3
211
.471
,476
73.1
$120
.21
$68.
30A
NG
IOT
EN
SIN
RE
CE
PT
OR
BLO
CK
ER
S12
5,85
03.
6$4
,595
,729
.28
6.1
18,9
1619
.3$2
42.9
5$3
6.53
CA
RD
-H
OLD
ER
SA
NN
UA
L C
OS
T(P
ER
SO
NS
AN
NU
AL
CO
ST
(A
LL
EN
RO
LLE
D)2
TO
TA
L
EX
PE
ND
ITU
RE
WIT
H C
LAIM
S
IN C
LAS
S)
TA
BL
E 7
.1A
NU
MB
ER
AN
D P
ER
CE
NT
OF
PA
CE
CL
AIM
S,
ST
AT
E S
HA
RE
EX
PE
ND
ITU
RE
S,
AN
D C
AR
DH
OL
DE
RS
WIT
H C
LA
IMS
BY
TH
ER
AP
EU
TIC
CL
AS
SJA
NU
AR
Y -
DE
CE
MB
ER
201
4
AC
E I
NH
IBIT
OR
S14
1,93
04.
0$1
80,4
17.0
90.
224
,655
25.2
$7.3
2$1
.43
CA
RD
IAC
GLY
CO
SID
ES
25,3
370.
7$9
2,30
5.46
0.1
4,17
34.
3$2
2.12
$0.7
3A
NT
IAR
RH
YT
HM
IC A
GE
NT
S12
,260
0.3
$430
,471
.40
0.6
2,30
82.
4$1
86.5
1$3
.42
BE
TA
BLO
CK
ER
S26
6,05
47.
5$1
,345
,291
.28
1.8
41,5
8842
.5$3
2.35
$10.
69C
ALC
IUM
CH
AN
NE
L B
LOC
KE
RS
190,
150
5.4
$1,6
71,3
66.0
32.
229
,677
30.3
$56.
32$1
3.29
LIP
ID-L
OW
ER
ING
AG
EN
TS
325,
313
9.2
$7,2
60,2
07.2
59.
648
,663
49.7
$149
.19
$57.
71H
YP
OT
EN
SIV
E A
GE
NT
S33
,853
1.0
$261
,649
.28
0.3
5,51
95.
6$4
7.41
$2.0
8V
AS
OD
ILA
TIN
G A
GE
NT
S50
,914
1.4
$1,3
33,3
40.0
21.
89,
621
9.8
$138
.59
$10.
60
AN
ALG
ES
ICS
/AN
TIP
YR
ET
ICS
17
9,69
95.
1$3
,880
,992
.65
5.1
36,0
0136
.8$1
07.8
0$3
0.85
NS
AID
S53
,072
1.5
$1,7
53,9
22.9
32.
314
,574
14.9
$120
.35
$13.
94C
OX
-2 I
NH
IBIT
OR
S16
,709
0.5
$1,2
11,4
65.9
01.
63,
308
3.4
$366
.22
$9.6
3O
PIA
TE
AG
ON
IST
S12
4,28
73.
5$1
,975
,118
.20
2.6
28,0
9728
.7$7
0.30
$15.
70
PS
YC
HO
TH
ER
AP
EU
TIC
AG
EN
TS
18
3,07
85.
2$2
,760
,686
.86
3.6
25,0
8825
.6$1
10.0
4$2
1.94
AN
TID
EP
RE
SS
AN
TS
157,
980
4.5
$1,6
51,6
46.7
12.
223
,653
24.2
$69.
83$1
3.13
SS
RI
AN
TID
EP
RE
SS
AN
TS
91,2
642.
6$3
53,7
54.1
60.
515
,664
16.0
$22.
58$2
.81
AN
TIP
SY
CH
OT
ICS
25,0
980.
7$1
,109
,040
.15
1.5
3,75
63.
8$2
95.2
7$8
.82
AN
XIO
LYT
ICS
/SE
DA
TIV
ES
/HY
PN
OT
ICS
10
9,79
23.
1$4
57,5
66.6
60.
620
,158
20.6
$22.
70$3
.64
BE
NZ
OD
IAZ
EP
INE
S82
,216
2.3
$210
,755
.61
0.3
16,1
6516
.5$1
3.04
$1.6
8M
ISC
ELL
AN
EO
US
AN
X/S
ED
/HY
PN
OT
ICS
25,9
350.
7$2
16,5
38.4
10.
35,
528
5.7
$39.
17$1
.72
81

PA
GE
2
% O
FT
OT
AL
% O
F%
OF
WIT
H A
NY
PA
RT
ICIP
AT
ING
TH
ER
AP
EU
TIC
CLA
SS
1C
LAIM
ST
OT
AL
TO
TA
LC
LAIM
SC
AR
DH
OLD
ER
S
CA
RD
-H
OLD
ER
SA
NN
UA
L C
OS
T(P
ER
SO
NS
AN
NU
AL
CO
ST
(A
LL
EN
RO
LLE
D)2
TO
TA
L
EX
PE
ND
ITU
RE
WIT
H C
LAIM
S
IN C
LAS
S)
TA
BL
E 7
.1A
NU
MB
ER
AN
D P
ER
CE
NT
OF
PA
CE
CL
AIM
S,
ST
AT
E S
HA
RE
EX
PE
ND
ITU
RE
S,
AN
D C
AR
DH
OL
DE
RS
WIT
H C
LA
IMS
BY
TH
ER
AP
EU
TIC
CL
AS
SJA
NU
AR
Y -
DE
CE
MB
ER
201
4
RE
PLA
CE
ME
NT
PR
EP
AR
AT
ION
S
70,9
472.
0$4
24,1
78.0
90.
613
,160
13.5
$32.
23$3
.37
DIU
RE
TIC
S
200,
352
5.7
$626
,017
.72
0.8
34,2
6135
.0$1
8.27
$4.9
8LO
OP
DIU
RE
TIC
S11
0,18
33.
1$1
35,3
28.5
00.
221
,195
21.7
$6.3
8$1
.08
PO
TA
SS
IUM
-SP
AR
ING
DIU
RE
TIC
S26
,968
0.8
$60,
204.
390.
15,
012
5.1
$12.
01$0
.48
TH
IAZ
IDE
DIU
RE
TIC
S52
,094
1.5
$38,
997.
550.
110
,423
10.7
$3.7
4$0
.31
RE
SP
IRA
TO
RY
TR
AC
T A
GE
NT
S70
,825
2.0
$4,1
10,3
50.7
05.
416
,037
16.4
$256
.30
$32.
67
EY
E,
EA
R,
NO
SE
AN
D T
HR
OA
T P
RE
PA
RA
TIO
NS
118,
642
3.4
$3,7
76,5
08.2
25.
025
,403
26.0
$148
.66
$30.
02
GA
ST
RO
INT
ES
TIN
AL
AG
EN
TS
24
7,92
57.
0$6
,958
,111
.03
9.2
40,3
6941
.3$1
72.3
6$5
5.31
H2-
RE
CE
PT
OR
AN
TA
GO
NIS
TS
25,8
370.
7$3
9,89
4.50
0.1
5,65
65.
8$7
.05
$0.3
2P
RO
TO
N P
UM
P I
NH
IBIT
OR
S17
9,84
75.
1$5
,860
,072
.08
7.7
30,1
5330
.8$1
94.3
4$4
6.58
OT
HE
R M
ISC
ELL
. A
NT
I-U
LCE
R A
GE
NT
S4,
010
0.1
$107
,592
.11
0.1
1,22
41.
3$8
7.90
$0.8
6
HO
RM
ON
ES
AN
D S
YN
TH
ET
IC S
UB
ST
AN
CE
S39
1,18
911
.0$9
,887
,545
.99
13.1
48,3
3449
.4$2
04.5
7$7
8.60
AD
RE
NA
LS A
ND
CO
MB
.33
,200
0.9
$137
,798
.39
0.2
13,8
6314
.2$9
.94
$1.1
0E
ST
RO
GE
NS
AN
D C
OM
B.
7,03
20.
2$3
82,2
14.9
60.
51,
999
2.0
$191
.20
$3.0
4A
NT
IDIA
BE
TIC
AG
EN
TS
196,
511
5.5
$8,8
58,4
00.7
011
.721
,969
22.5
$403
.22
$70.
42T
HY
RO
ID A
ND
AN
TIT
HY
RO
ID A
GE
NT
S15
3,47
74.
3$4
06,1
27.6
90.
522
,478
23.0
$18.
07$3
.23
SM
OO
TH
MU
SC
LE R
ELA
XA
NT
S
41,7
181.
2$2
,378
,362
.14
3.1
7,24
47.
4$3
28.3
2$1
8.91
TH
EO
PH
YLL
INE
AN
D R
ELA
TE
D D
RU
GS
2,51
10.
1$2
4,91
0.36
0.0
410
0.4
$60.
76$0
.20
39,3
111.
1$1
,260
,755
.81
1.7
7,11
27.
3$1
77.2
7$1
0.02
ALL
OT
HE
R D
RU
GS
298,
938
8.4
$8,2
25,4
32.2
810
.947
,404
48.5
$173
.52
$65.
38
ALL
CLA
SS
ES
CO
MB
INE
D3,
540,
947
100.
0$7
5,63
9,18
4.57
100.
097
,818
100.
0$7
73.2
6$6
01.2
6
1 T
he a
vera
ge a
nnua
l num
ber
of u
niqu
e th
erap
eutic
cla
sses
use
d by
car
dhol
ders
with
one
or
mor
e cl
aim
s in
201
4 w
as 5
.1 (
base
d on
bro
ad t
hera
peut
ic c
ateg
ory)
.2 T
he a
nnua
l cos
t pe
r en
rolle
e is
bas
ed o
n to
tal c
ardh
olde
rs e
nrol
led
in P
AC
E f
or a
ny p
ortio
n of
cal
enda
r ye
ar 2
014
(N=
125,
801)
.
SO
UR
CE
: P
DA
/CLA
IMS
HIS
TO
RY
AN
D D
RU
G F
ILE
SN
OT
E:
DA
TA
IN
CLU
DE
OR
IGIN
AL,
PA
ID C
LAIM
S B
Y D
AT
E O
F S
ER
VIC
E,
EX
CLU
DE
PA
CE
NE
T C
LAIM
S.
DR
UG
S F
OR
OS
TE
OP
OR
OS
IS
82
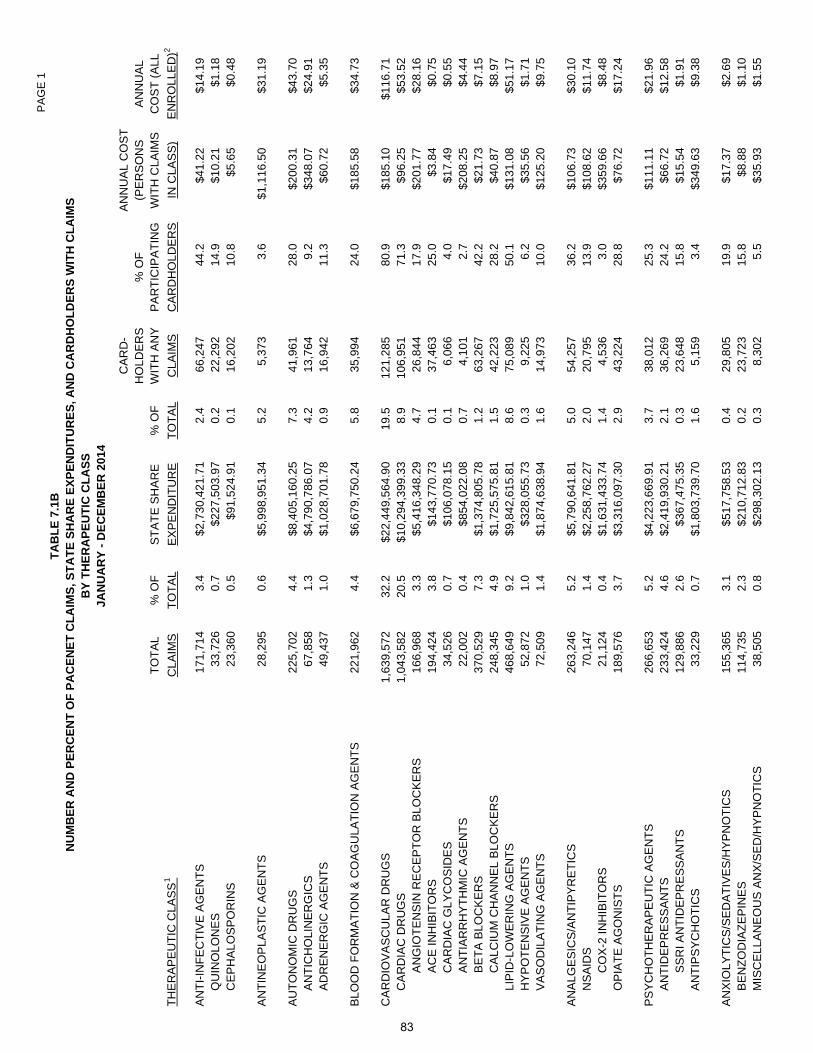
PA
GE
1
% O
FA
NN
UA
LT
OT
AL
% O
F%
OF
WIT
H A
NY
PA
RT
ICIP
AT
ING
CO
ST
(A
LL
TH
ER
AP
EU
TIC
CLA
SS
1C
LAIM
ST
OT
AL
TO
TA
LC
LAIM
SC
AR
DH
OLD
ER
SE
NR
OLL
ED
)2
AN
TI-
INF
EC
TIV
E A
GE
NT
S
171,
714
3.4
$2,7
30,4
21.7
12.
466
,247
44.2
$41.
22$1
4.19
QU
INO
LON
ES
33,7
260.
7$2
27,5
03.9
70.
222
,292
14.9
$10.
21$1
.18
CE
PH
ALO
SP
OR
INS
23,3
600.
5$9
1,52
4.91
0.1
16,2
0210
.8$5
.65
$0.4
8
AN
TIN
EO
PLA
ST
IC A
GE
NT
S
28,2
950.
6$5
,998
,951
.34
5.2
5,37
33.
6$1
,116
.50
$31.
19
AU
TO
NO
MIC
DR
UG
S
225,
702
4.4
$8,4
05,1
60.2
57.
341
,961
28.0
$200
.31
$43.
70A
NT
ICH
OLI
NE
RG
ICS
67,8
581.
3$4
,790
,786
.07
4.2
13,7
649.
2$3
48.0
7$2
4.91
AD
RE
NE
RG
IC A
GE
NT
S49
,437
1.0
$1,0
28,7
01.7
80.
916
,942
11.3
$60.
72$5
.35
BLO
OD
FO
RM
AT
ION
& C
OA
GU
LAT
ION
AG
EN
TS
221,
962
4.4
$6,6
79,7
50.2
45.
835
,994
24.0
$185
.58
$34.
73
CA
RD
IOV
AS
CU
LAR
DR
UG
S
1,63
9,57
232
.2$2
2,44
9,56
4.90
19.5
121,
285
80.9
$185
.10
$116
.71
CA
RD
IAC
DR
UG
S1,
043,
582
20.5
$10,
294,
399.
338.
910
6,95
171
.3$9
6.25
$53.
52A
NG
IOT
EN
SIN
RE
CE
PT
OR
BLO
CK
ER
S16
6,96
83.
3$5
,416
,348
.29
4.7
26,8
4417
.9$2
01.7
7$2
8.16
AC
E IN
HIB
ITO
RS
194,
424
3.8
$143
,770
.73
0.1
37,4
6325
.0$3
.84
$0.7
5C
AR
DIA
C G
LYC
OS
IDE
S34
,526
0.7
$106
,078
.15
0.1
6,06
64.
0$1
7.49
$0.5
5A
NT
IAR
RH
YT
HM
IC A
GE
NT
S22
,002
0.4
$854
,022
.08
0.7
4,10
12.
7$2
08.2
5$4
.44
BE
TA
BLO
CK
ER
S37
0,52
97.
3$1
,374
,805
.78
1.2
63,2
6742
.2$2
1.73
$7.1
5C
ALC
IUM
CH
AN
NE
L B
LOC
KE
RS
248,
345
4.9
$1,7
25,5
75.8
11.
542
,223
28.2
$40.
87$8
.97
LIP
ID-L
OW
ER
ING
AG
EN
TS
468,
649
9.2
$9,8
42,6
15.8
18.
675
,089
50.1
$131
.08
$51.
17H
YP
OT
EN
SIV
E A
GE
NT
S52
,872
1.0
$328
,055
.73
0.3
9,22
56.
2$3
5.56
$1.7
1V
AS
OD
ILA
TIN
G A
GE
NT
S72
,509
1.4
$1,8
74,6
38.9
41.
614
,973
10.0
$125
.20
$9.7
5
AN
ALG
ES
ICS
/AN
TIP
YR
ET
ICS
26
3,24
65.
2$5
,790
,641
.81
5.0
54,2
5736
.2$1
06.7
3$3
0.10
NS
AID
S70
,147
1.4
$2,2
58,7
62.2
72.
020
,795
13.9
$108
.62
$11.
74C
OX
-2 IN
HIB
ITO
RS
21,1
240.
4$1
,631
,433
.74
1.4
4,53
63.
0$3
59.6
6$8
.48
OP
IAT
E A
GO
NIS
TS
189,
576
3.7
$3,3
16,0
97.3
02.
943
,224
28.8
$76.
72$1
7.24
PS
YC
HO
TH
ER
AP
EU
TIC
AG
EN
TS
26
6,65
35.
2$4
,223
,669
.91
3.7
38,0
1225
.3$1
11.1
1$2
1.96
AN
TID
EP
RE
SS
AN
TS
233,
424
4.6
$2,4
19,9
30.2
12.
136
,269
24.2
$66.
72$1
2.58
SS
RI A
NT
IDE
PR
ES
SA
NT
S12
9,88
62.
6$3
67,4
75.3
50.
323
,648
15.8
$15.
54$1
.91
AN
TIP
SY
CH
OT
ICS
33,2
290.
7$1
,803
,739
.70
1.6
5,15
93.
4$3
49.6
3$9
.38
AN
XIO
LYT
ICS
/SE
DA
TIV
ES
/HY
PN
OT
ICS
15
5,36
53.
1$5
17,7
58.5
30.
429
,805
19.9
$17.
37$2
.69
BE
NZ
OD
IAZ
EP
INE
S11
4,73
52.
3$2
10,7
12.8
30.
223
,723
15.8
$8.8
8$1
.10
MIS
CE
LLA
NE
OU
S A
NX
/SE
D/H
YP
NO
TIC
S38
,505
0.8
$298
,302
.13
0.3
8,30
25.
5$3
5.93
$1.5
5
HO
LDE
RS
AN
NU
AL
CO
ST
(PE
RS
ON
S
TA
BL
E 7
.1B
NU
MB
ER
AN
D P
ER
CE
NT
OF
PA
CE
NE
T C
LA
IMS
, ST
AT
E S
HA
RE
EX
PE
ND
ITU
RE
S, A
ND
CA
RD
HO
LD
ER
S W
ITH
CL
AIM
SB
Y T
HE
RA
PE
UT
IC C
LA
SS
JAN
UA
RY
- D
EC
EM
BE
R 2
014
ST
AT
E S
HA
RE
EX
PE
ND
ITU
RE
WIT
H C
LAIM
S
IN C
LAS
S)
CA
RD
-
83

PA
GE
2
% O
FA
NN
UA
LT
OT
AL
% O
F%
OF
WIT
H A
NY
PA
RT
ICIP
AT
ING
CO
ST
(A
LL
TH
ER
AP
EU
TIC
CLA
SS
1C
LAIM
ST
OT
AL
TO
TA
LC
LAIM
SC
AR
DH
OLD
ER
SE
NR
OLL
ED
)2
HO
LDE
RS
AN
NU
AL
CO
ST
(PE
RS
ON
S
TA
BL
E 7
.1B
NU
MB
ER
AN
D P
ER
CE
NT
OF
PA
CE
NE
T C
LA
IMS
, ST
AT
E S
HA
RE
EX
PE
ND
ITU
RE
S, A
ND
CA
RD
HO
LD
ER
S W
ITH
CL
AIM
SB
Y T
HE
RA
PE
UT
IC C
LA
SS
JAN
UA
RY
- D
EC
EM
BE
R 2
014
ST
AT
E S
HA
RE
EX
PE
ND
ITU
RE
WIT
H C
LAIM
S
IN C
LAS
S)
CA
RD
-
RE
PLA
CE
ME
NT
PR
EP
AR
AT
ION
S
96,6
531.
9$4
12,6
87.5
00.
419
,174
12.8
$21.
52$2
.15
DIU
RE
TIC
S
273,
034
5.4
$743
,075
.99
0.6
50,0
4733
.4$1
4.85
$3.8
6LO
OP
DIU
RE
TIC
S15
0,22
43.
0$1
95,9
90.3
90.
230
,883
20.6
$6.3
5$1
.02
PO
TA
SS
IUM
-SP
AR
ING
DIU
RE
TIC
S39
,102
0.8
$66,
268.
890.
18,
007
5.3
$8.2
8$0
.34
TH
IAZ
IDE
DIU
RE
TIC
S69
,256
1.4
$37,
314.
800.
015
,241
10.2
$2.4
5$0
.19
RE
SP
IRA
TO
RY
TR
AC
T A
GE
NT
S10
9,88
82.
2$7
,338
,385
.44
6.4
24,7
5716
.5$2
96.4
2$3
8.15
EY
E, E
AR
, NO
SE
AN
D T
HR
OA
T P
RE
PA
RA
TIO
NS
16
6,13
43.
3$4
,968
,232
.69
4.3
37,6
4425
.1$1
31.9
8$2
5.83
GA
ST
RO
INT
ES
TIN
AL
AG
EN
TS
32
6,74
56.
4$8
,027
,495
.01
7.0
57,7
6238
.5$1
38.9
8$4
1.73
H2-
RE
CE
PT
OR
AN
TA
GO
NIS
TS
32,2
940.
6$3
6,41
8.07
0.0
7,76
75.
2$4
.69
$0.1
9P
RO
TO
N P
UM
P IN
HIB
ITO
RS
234,
408
4.6
$6,2
98,8
92.8
85.
542
,744
28.5
$147
.36
$32.
75O
TH
ER
MIS
CE
LL. A
NT
I-U
LCE
R A
GE
NT
S6,
208
0.1
$155
,545
.77
0.1
1,90
51.
3$8
1.65
$0.8
1
HO
RM
ON
ES
AN
D S
YN
TH
ET
IC S
UB
ST
AN
CE
S57
9,68
011
.4$1
8,96
1,88
8.06
16.5
75,0
0850
.0$2
52.8
0$9
8.58
AD
RE
NA
LS A
ND
CO
MB
.55
,856
1.1
$286
,976
.99
0.2
23,3
7815
.6$1
2.28
$1.4
9E
ST
RO
GE
NS
AN
D C
OM
B.
10,2
370.
2$5
01,6
90.1
50.
43,
015
2.0
$166
.40
$2.6
1A
NT
IDIA
BE
TIC
AG
EN
TS
314,
789
6.2
$17,
626,
961.
6115
.335
,789
23.9
$492
.52
$91.
64T
HY
RO
ID A
ND
AN
TIT
HY
RO
ID A
GE
NT
S19
6,74
53.
9$2
65,4
01.1
30.
231
,928
21.3
$8.3
1$1
.38
SM
OO
TH
MU
SC
LE R
ELA
XA
NT
S
58,6
031.
2$3
,059
,915
.32
2.7
10,6
577.
1$2
87.1
3$1
5.91
TH
EO
PH
YLL
INE
AN
D R
ELA
TE
D D
RU
GS
4,07
50.
1$3
6,34
4.07
0.0
716
0.5
$50.
76$0
.19
DR
UG
S F
OR
OS
TE
OP
OR
OS
IS46
,716
0.9
$1,5
19,0
13.2
11.
39,
247
6.2
$164
.27
$7.9
0
ALL
OT
HE
R D
RU
GS
457,
105
9.0
$13,
235,
714.
1711
.572
,712
48.5
$182
.03
$68.
81
ALL
CLA
SS
ES
CO
MB
INE
D5,
087,
067
100.
0$1
15,0
62,3
26.0
810
0.0
149,
952
100.
0$7
67.3
3$5
98.1
9
1 T
he a
vera
ge a
nnua
l num
ber
of u
niqu
e th
erap
eutic
cla
sses
use
d by
car
dhol
ders
with
one
or
mor
e cl
aim
s in
201
4 w
as 5
.0 (
base
d on
bro
ad th
erap
eutic
cat
egor
y).
2 T
he a
nnua
l cos
t per
enr
olle
e is
bas
ed o
n to
tal c
ardh
olde
rs e
nrol
led
in P
AC
EN
ET
for
any
port
ion
of c
alen
dar
year
201
4 (N
=19
2,35
1).
SO
UR
CE
: P
DA
/CLA
IMS
HIS
TO
RY
AN
D D
RU
G F
ILE
SN
OT
E:
DA
TA
INC
LUD
E O
RIG
INA
L, P
AID
PA
CE
NE
T C
LAIM
S B
Y D
AT
E O
F S
ER
VIC
E.
TO
TA
L C
LAIM
S IN
CLU
DE
DE
DU
CT
IBLE
CLA
IMS
AN
D C
OP
AID
CLA
IMS
.
84

3.0%
5.0%5.1%5.
4%
5.8%
6.8%
9.2%
9.6%
11.4
%
11.7
%
AN
TIN
EO
PLA
ST
IC A
GE
NT
S
EY
E, E
AR
, NO
SE
, TH
RO
AT
PR
EP
AR
AT
ION
S
AN
ALG
ES
ICS
/AN
TIP
YR
ET
ICS
RE
SP
IRA
TO
RY
TR
AC
T A
GE
NT
S
BLO
OD
FO
RM
AT
ION
& C
OA
GU
LAT
ION
AG
EN
TS
AU
TO
NO
MIC
DR
UG
S
GA
ST
RO
INT
ES
TIN
AL
AG
EN
TS
LIP
ID-L
OW
ER
ING
AG
EN
TS
CA
RD
IAC
DR
UG
S
AN
TID
IAB
ET
IC A
GE
NT
S
FIG
UR
E 7
.1
PE
RC
EN
T O
F P
AC
E S
TAT
E S
HA
RE
EX
PE
ND
ITU
RE
S B
Y T
HE
RA
PE
UT
IC C
LA
SS
J
AN
UA
RY
-D
EC
EM
BE
R 2
01
4(T
OTA
L E
XP
EN
DIT
UR
ES
= $
75
,63
9,1
85
)
TH
ER
AP
EU
TIC
CL
AS
S
15.0
%
0.3%0.
5%
0.6%
0.6%0.
8%
1.5%1.
7%1.8%2.
1%2.2%
0.0%
2.0%
4.0%
6.0%
8.0%
10.0
%12
.0%
14.0
%16
.0%
ALL
OT
HE
R D
RU
GS
HY
PO
TE
NS
IVE
AG
EN
TS
ES
TR
OG
EN
S &
CO
MB
INA
TIO
N A
GE
NT
S
RE
PLA
CE
ME
NT
PR
EP
AR
AT
ION
S
AN
XIO
LYT
ICS
/SE
DA
TIV
ES
/HY
PN
OT
ICS
DIU
RE
TIC
S
AN
TIP
SY
CH
OT
ICS
OS
TE
OP
OR
OS
IS T
RE
AT
ME
NT
VA
SO
DIL
AT
ING
AG
EN
TS
AN
TI-
INF
EC
TIV
E A
GE
NT
S
AN
TID
EP
RE
SS
AN
TS
SO
UR
CE
: P
DA
/CL
AIM
S H
IST
OR
Y A
ND
DR
UG
FIL
ES
NO
TE
: D
AT
A I
NC
LUD
E O
RIG
INA
L,
PA
ID C
LAIM
S B
Y D
AT
E O
F S
ER
VIC
E,
EX
CLU
DE
PA
CE
NE
T C
LAIM
S.
PE
RC
EN
T O
F E
XP
EN
DIT
UR
ES
85

56(
01%
)14
9 (0
.1%
)41
1 (0
.3%
)
204
(0.2
%)
206
(0.2
%)
444
(0.4
%)
4,06
5 (3
.4%
)
17 (
<0.
1%)
23 (
<0.
1%)
119
(0.1
%)
465
(0.4
%)
1,36
6 (1
.1%
)
162
(0.1
%)
234
(0.2
%)
385
(0.3
%)
1,01
0 (0
.9%
)1,
343
(1.1
%)
7,46
8 (6
.3%
)
MA
XIM
UM
DA
ILY
DO
SE
MA
XIM
UM
INIT
IAL
DO
SE
MA
XIM
UM
INIT
IAL
QU
AN
TIT
YD
UP
LIC
AT
E T
HE
RA
PY
MA
XIM
UM
DA
ILY
DO
SE
MA
XIM
UM
INIT
IAL
DO
SE
DU
RA
TIO
N O
F T
HE
RA
PY
MA
XIM
UM
DA
ILY
DO
SE
DU
PL
ICA
TE
TH
ER
AP
YM
AX
IMU
M IN
ITIA
L D
OS
EM
AX
IMU
M IN
ITIA
L Q
UA
NT
ITY
DR
UG
CO
NT
RA
IND
ICA
TE
D F
OR
GE
ND
ER
INIT
IAL
DR
UG
RE
VIE
WM
AX
IMU
M D
AIL
Y D
OS
ED
UP
LIC
AT
E T
HE
RA
PY
MA
XIM
UM
INIT
IAL
QU
AN
TIT
YM
AX
IMU
M IN
ITIA
L D
OS
E
FIG
UR
E 7
.2N
UM
BE
R A
ND
PE
RC
EN
T O
F P
AC
E A
ND
PA
CE
NE
T C
LA
IMS
WIT
H A
PR
OS
PE
CT
IVE
RE
VIE
W M
ES
SA
GE
BY
TH
ER
AP
EU
TIC
CL
AS
SJ
AN
UA
RY
-D
EC
EM
BE
R 2
01
4N
= 1
18
,80
1
PA
GE
1
AN
XIO
LY
TIC
S,
SE
DA
TIV
ES
,&
HY
PN
OT
ICS
AN
TI-
SE
IZU
RE
DR
UG
S
AN
TID
EP
RE
SS
AN
TS
AN
TIP
SY
CH
OT
ICS
20 (
<0.
1%)
106
(0.1
%)
668
(0.6
%)
16 (
<0.
1%)
69 (
0.1%
)75
(0.
1%)
96 (
0.1%
)21
1 (0
.2%
)37
1 (0
.3%
)
99 (
0.1%
)41
6 (0
.4%
)72
6 (0
.6%
)1,
253
(1.1
%)
3,15
0 (2
.7%
)14
,476
(12
.2%
)
398
(0.3
%)
5 6 (
<0.
1%)
02,
000
4,00
06,
000
8,00
010
,000
12,0
0014
,000
16,0
00
MA
XIM
UM
DA
ILY
DO
SE
DU
RA
TIO
N O
F T
HE
RA
PY
MA
XIM
UM
INIT
IAL
QU
AN
TIT
Y
INIT
IAL
DR
UG
RE
VIE
WM
AX
IMU
M IN
ITIA
L D
OS
EM
AX
IMU
M D
AIL
Y D
OS
ED
UR
AT
ION
OF
TH
ER
AP
YM
AX
IMU
M IN
ITIA
L Q
UA
NT
ITY
DU
PL
ICA
TE
TH
ER
AP
Y
DU
PL
ICA
TE
TH
ER
AP
YIN
ITIA
L D
RU
G R
EV
IEW
MA
XIM
UM
DA
ILY
DO
SE
QU
AN
TIT
Y L
IMIT
MA
XIM
UM
INIT
IAL
QU
AN
TIT
YD
UR
AT
ION
OF
TH
ER
AP
Y
MA
XIM
UM
INIT
IAL
QU
AN
TIT
Y
MA
XIM
UM
INIT
IAL
QU
AN
TIT
Y
NU
MB
ER
OF
CL
AIM
SS
OU
RC
E:
PD
A/C
LAIM
S H
IST
OR
Y
NO
TE
S:
BA
SE
D O
N A
TO
TA
L O
F 8
,628
,014
AP
PR
OV
ED
AN
D 1
74,8
17 D
EN
IED
CLA
IMS
.D
AT
A IN
CLU
DE
CL
AIM
S B
Y D
AT
E O
F S
ER
VIC
E W
ITH
MU
LT
IPL
E S
UB
MIS
SIO
NS
OF
SA
ME
CLA
IM O
N S
AM
E D
AY
DE
LET
ED
.
AN
TIP
AR
KIN
SO
NIS
M D
RU
GS
MU
SC
LE
RE
LA
XA
NT
S
NS
AID
S &
CO
X-2
INH
IBIT
OR
AN
AL
GE
SIC
S
NA
RC
OT
IC A
NA
LG
ES
ICS
86

61 (
0.1%
)1,
635
(1.4
%)
2,02
0 (1
.7%
)
139
(0.1
%)
2,19
9 (1
.9%
)2,
577
(2.2
%)
3,62
3 (3
.0%
)
541
(0.5
%)
4,08
5 (3
.4%
)5,
696
(4.8
%)
90 (
0.1%
)20
6 (0
.2%
)61
4 (0
.5%
)2,
106
(1.8
%)
85 (
0.1%
)22
6 (0
.2%
)2,
375
(2.0
%)
MA
XIM
UM
DA
ILY
DO
SE
INIT
IAL
DR
UG
RE
VIE
WM
AX
IMU
M IN
ITIA
L Q
UA
NT
ITY
DU
RA
TIO
N O
F T
HE
RA
PY
MA
XIM
UM
INIT
IAL
QU
AN
TIT
YM
AX
IMU
M D
AIL
Y D
OS
ED
UP
LIC
AT
E T
HE
RA
PY
MA
XIM
UM
DA
ILY
DO
SE
MA
XIM
UM
INIT
IAL
QU
AN
TIT
YD
UP
LIC
AT
E T
HE
RA
PY
MA
XIM
UM
DA
ILY
DO
SE
MA
XIM
UM
INIT
IAL
DO
SE
MA
XIM
UM
INIT
IAL
QU
AN
TIT
YD
UP
LIC
AT
E T
HE
RA
PY
MA
XIM
UM
INIT
IAL
QU
AN
TIT
YM
AX
IMU
M D
AIL
Y D
OS
EM
AX
IMU
M IN
ITIA
L D
OS
E
FIG
UR
E 7
.2 (
CO
NT
INU
ED
)N
UM
BE
R A
ND
PE
RC
EN
T O
F P
AC
E A
ND
PA
CE
NE
T C
LA
IMS
WIT
H A
PR
OS
PE
CT
IVE
RE
VIE
W M
ES
SA
GE
BY
TH
ER
AP
EU
TIC
CL
AS
SJ
AN
UA
RY
-D
EC
EM
BE
R 2
01
4N
= 1
18
,80
1
PA
GE
2
CH
OL
INE
ST
ER
AS
E IN
HIB
ITO
RS
DIA
BE
TE
ST
RE
AT
ME
NT
GA
ST
RO
INT
ES
TIN
AL
AG
EN
TS
OT
HE
R C
AR
DIO
VA
SC
UL
AR
DR
UG
S
LIP
ID-L
OW
ER
ING
DR
UG
S
734
(0.6
%)
10,0
32 (
8.4%
)31
,279
(26
.3%
)
24 (
<0.
1%)
63 (
0.1%
)67
(0.
1%)
82 (
0.1%
)26
8 (0
.2%
)1,
004
(0.8
%)
1,00
8 (0
.8%
)3,
786
(3.2
%)
45 (
<0.
1%)
407
(0.3
%)
13 (
<0.
1%)
17 (
<0.
1%)
24 (
<0.
1%)
66 (
0.1%
)18
8 (0
.2%
)2,
641
(2.2
%)
05,
000
10,0
0015
,000
20,0
0025
,000
30,0
0035
,000
DR
UG
S IN
AP
PR
OP
RIA
TE
FO
R E
LD
ER
LY
DR
UG
-TO
-DR
UG
INT
ER
AC
TIO
NP
LA
N P
RO
TO
CO
L/O
TH
ER
CA
SE
RE
VIE
W
INIT
IAL
DR
UG
RE
VIE
WM
AX
IMU
M IN
ITIA
L D
OS
ED
UP
LIC
AT
E T
HE
RA
PY
QU
AN
TIT
Y L
IMIT
MA
XIM
UM
DA
ILY
DO
SE
DR
UG
CO
NT
RA
IND
ICA
TE
D F
OR
GE
ND
ER
DU
RA
TIO
N O
F T
HE
RA
PY
MA
XIM
UM
INIT
IAL
QU
AN
TIT
Y
INIT
IAL
DR
UG
RE
VIE
WM
AX
IMU
M D
AIL
Y D
OS
E
DR
UG
CO
NT
RA
IND
ICA
TE
D F
OR
GE
ND
ER
QU
AN
TIT
Y L
IMIT
MA
XIM
UM
INIT
IAL
QU
AN
TIT
YD
UP
LIC
AT
E T
HE
RA
PY
MA
XIM
UM
DA
ILY
DO
SE
DU
RA
TIO
N O
F T
HE
RA
PY
NU
MB
ER
OF
CL
AIM
SS
OU
RC
E:
PD
A/C
LAIM
S H
IST
OR
Y
NO
TE
S:
BA
SE
D O
N A
TO
TA
l OF
8,6
28,0
14A
PP
RO
VE
D A
ND
174
,817
DE
NIE
D C
LAIM
S.
DA
TA
INC
LU
DE
CL
AIM
S B
Y D
AT
E O
F S
ER
VIC
E W
ITH
MU
LT
IPL
E S
UB
MIS
SIO
NS
OF
SA
ME
CLA
IM O
N S
AM
E D
AY
DE
LET
ED
.
MU
LT
IPL
EC
LA
SS
ES
OT
HE
R S
PE
CIF
IC C
LA
SS
ES
OS
TE
OP
OR
OS
IS T
RE
AT
ME
NT
IMP
OT
EN
CE
TR
EA
TM
EN
T
87

88

SECTION 8
PENNSYLVANIA PATIENT
ASSISTANCE CLEARINGHOUSE
89

90

PENNSYLVANIA PATIENT ASSISTANCE PROGRAM CLEARINGHOUSE (PA PAP) In January 2001, the PACE Program began a referral program to assist Pennsylvanians ages 60 through 64 that facilitated contact between the Area Agency on Aging offices and the patient assistance programs offered by pharmaceutical manufacturers. That Program has evolved in recent years, and, as a result, the Program now accepts applications from individual patients, physician offices, social workers and other agencies throughout the Commonwealth. In late 2004, the name of the Program changed to reflect the Program’s current objectives; it became the Pennsylvania Patient Assistance Program Clearinghouse (PA PAP). Eighty of the largest pharmaceutical manufacturers offer limited prescription drug assistance to persons who are not eligible for other forms of pharmaceutical coverage and who cannot afford the cost of one or more of their medications. The PA PAP coordinator provides the expertise necessary to determine the likelihood of eligibility for persons seeking assistance from manufacturers’ medication programs, gathers the patient information required to complete the pharmacy assistance applications, offers guidance and assistance to the patient throughout the application and—if successful—reapplication processes. In 2006, the Clearinghouse extended assistance to all adult Pennsylvania residents who appear to meet the selected guidelines, without regard to age. Pharmaceutical manufacturers which offer pharmacy assistance programs set their income and eligibility guidelines as individual companies; they limit the products and the length of time for assistance. Typically, the gross household income should be at or below 200% of federal poverty level guidelines, but many manufacturers will consider circumstances of hardship that fall outside their usual guidelines. Household income is one factor of many criteria used by the manufacturers to determine eligibility for medication. Manufacturers require a wide range of information on company-specific forms which further complicates the application and review process. A substantial amount of coordination needs to occur between the PA PAP coordinator, the patient, and the patient’s physician. Since the inception of Medicare Part D, some manufacturers have instituted programs to assist cardholders while they are in the Part D coverage gap. The requirements for the Medicare Part D coverage gap programs differ from the base programs offered by the manufacturers. As a result of different settlements from the Pennsylvania Attorney General’s office, the Pennsylvania Patient Assistance Program Clearinghouse has been able to offer assistance for specific medications to patients who are not eligible for the manufacturer’s assistance programs. Eligible patients can receive a 30-day supply of medication for which they are charged varying copayments based on the program they are enrolled in. At the end of 2014, the Clearinghouse successfully enrolled 109 additional patients into this program. Despite the inherent difficulties of application, the lengthy wait for approval from the manufacturer, and the strictly limited amount of medication granted with each approval, the collaborative efforts of the local and central coordinators responded to inquiries from 28,213 patients after thirteen years of operation. At the end of 2014, 47% (13,191 persons) were receiving medication assistance through the PA PAP Clearinghouse. The Program successfully enrolled persons to the PACE Program (1,201), PACENET Program (3,235), VA benefits (63), or other insurance (228). Among the remaining inactive patients, 65 were over the income limits set by the manufacturers and were not eligible for PACE or PACENET benefits. Among the 13,191 persons receiving assistance through the PA PAP Clearinghouse, a total of 44,587 medications were obtained. Current initiatives include continuing to process manufacturers’ pharmacy assistance applications for cardholders who are uninsured, assist cardholders with Medicare Part D, assist cardholders with Medicare part D apply for Low Income Subsidy (LIS), and to initiate any new Programs that are the result of Attorney General lawsuit settlements.
91
In October 2014, The Clearinghouse expanded its scope to assisting Pennsylvania residents who were paroled from a Pennsylvania State Correctional Institution. This project is a combined effort between the Department of Aging’s Clearinghouse and the Department of Probation and Parole. This effort has taken the Clearinghouse beyond its current scope of assistance. The effort has been able to provide assistance to willing individuals with their medications, transportation services, Supplemental Nutrition Assistance Program (SNAP), Low-Income Home Energy Assistance Program (LIHEAP), Medical Assistance, enrollment into other state and federally funded programs and other life sustaining benefits. At the end of 2014, the Clearinghouse contacted 275 parolees. Of these parolees, 10 were enrolled in one of the Attorney General pharmaceutical settlement programs, 12 in PACE, 13 in SNAP benefits, and 38 in LIS. In addition to the initiatives listed above, Clearinghouse coordinators aided these individuals with finding furniture, physicians, and grants to assist with utility bills. The Clearinghouse plans to expand the current database of information, so that these Pennsylvanians and their family members may be better served with available benefits.
92

APPENDIX A
The PACE Application Center 2014 Report
University of Pennsylvania and PACE/PACENET Behavioral Health Lab Program 2014 Report
The PACE Academic Detailing Program Impact Analysis January 2012 - December 2014
93

The PACE Application Center 2014 Report
Overview Since 2006, the PACE Application Center for the Pennsylvania Department of Aging has conducted data-driven outreach and application assistance to connect older Pennsylvanians with public benefit programs that help seniors cover the cost of prescriptions, shelter and food. The PACE Application Center provides services
to locate eligible persons and submit PACE applications on their behalf, to enroll persons in the Medicare Part D Extra Help Low-Income Subsidy (LIS), to assist older Pennsylvanians in accessing other benefit programs including the
Supplemental Nutrition Assistance Program (SNAP), Property Tax/Rent Rebate (PTRR), Low-Income Home Energy Assistance Program (LIHEAP), Medicare Savings Programs (MSP), and Medicaid coverage.
The PACE Application Center uses multiple sources of state, private and public data to conduct outreach. To date, the Center outreach efforts have resulted in over 163,000 applications for the PACE and PACENET programs, and 74,600 applications for LIS. In addition, the PACE Application Center has submitted over 47,800 additional benefit applications on behalf of Pennsylvania’s seniors. All told, the PACE Application Center has delivered approximately $730 million in benefits to help older Pennsylvanians afford their prescriptions, age in place, and live with dignity.
Outreach and Applications Submitted Through mail, telephone and community-based outreach in 2014, the PACE Application Center assisted 26,500 senior households in applying for at least one benefit, delivering $89 million in benefits in one year.
2014 OUTREACH AND APPLICATION ASSISTANCE
TOTAL PACE/PACENET OUTREACH 562,440
UNIQUE PACE/PACENET OUTREACH 351,563
TOTAL LIS OUTREACH 73,549
UNIQUE LIS OUTREACH 49,360
PACE/PACENET APPLICATIONS SUBMITTED 15,216
LIS APPLICATIONS SUBMITTED 8,128
SNAP APPLICATIONS SUBMITTED 11,062
PTRR APPLICATIONS SUBMITTED 3,364
LIHEAP APPLICATIONS SUBMITTED 1,106
MSP APPLICATIONS SUBMITTED 1,650
MEDICAID APPLICATIONS SUBMITTED 1,397 TOTAL SENIOR HOUSEHOLDS WITH AT LEAST ONE BENEFIT APPLICATION SUBMITTED
26,583
ESTIMATED ANNUAL BENEFIT VALUE $89,251,470
94

Message Testing Results The PACE Application Center was successful in reaching eligible seniors who were not yet enrolled in PACE, PACENET, or LIS by outreaching to them about other needs that they may have, such as access to food and to programs that assist with shelter costs. The PACE Application Center tested outreach to previous non-responders that invited seniors to call for assistance applying for the Supplemental Nutrition Assistance Program (SNAP) and the Property Tax/Rent Rebate (PTRR) Program. Overall, the Center found that using these messages on letters garnered higher response rates than using a prescription assistance message. The Center also found that the SNAP message letter was more effective than the LIS letter in identifying individuals who were eligible for Medicare Part D Extra Help (LIS).
PTRR MESSAGE LETTERS VS. PACE MESSAGE LETTERS TO NON-RESPONDERS (8/19/14 - 10/22/14)
LETTER TYPE
MAILINGS RESPONSES RATE PACE
SUBMISSIONS
PACE SUBMISSION RATE FROM RESPONSES
PACE SUBMISSION RATE FROM
TOTAL MAILINGS
PTRR MESSAGE LETTER
29,847 813 2.72% 137 16.85% 0.46%
PACE MESSAGE LETTER
24,500 236 0.96% 50 21.19% 0.20%
SNAP MESSAGE LETTERS VS. LIS MESSAGE LETTERS TO NON-RESPONDERS (9/17/14 - 11/5/14)
LETTER TYPE
MAILINGS RESPONSES RATE LIS
SUBMISSIONS
LIS SUBMISSION RATE FROM RESPONSES
LIS SUBMISSION RATE FROM
TOTAL MAILINGS
SNAP MESSAGE LETTER
9,000 931 10.34% 292 31.36% 3.24%
LIS MESSAGE LETTER
5,736 380 6.62% 81 21.32% 1.41%
95

2015 Initiatives In 2015, the Center anticipates conducting new outreach efforts and expanding its messaging about available services. The Center will:
receive 116,800 new, unique names for PACE/PACENET outreach. receive 8,000 new, unique names for LIS outreach. mail to non-responders to connect with older Pennsylvanians who may have
experienced a change in their circumstances and are now more likely to respond and apply for PACE, LIS or other benefit programs.
test messages that cover a variety of needs, such as access to food, energy assistance, and income.
generate applications for PACE, PACENET and LIS via alternate messaging. use existing data sources to identify current PACE and PACENET enrollees who
are likely eligible for food stamps, property tax and rent rebates, energy assistance and other benefits.
use existing PACE and PACENET enrollment data, the PACE Application Center will conduct mail and telephone outreach to assist with access to multiple programs. Analysis indicates that approximately 180,000 individuals who are enrolled in PACE and PACENET are likely eligible for, but not yet receiving, additional state and federal benefits.
AVAILABLE DATA SOURCES FOR OUTREACH
NEW NAMES AVAILABLE FOR PACE OUTREACH 116,800
NEW NAMES AVAILABLE FOR LIS OUTREACH 8,000
NON-RESPONDER NAMES AVAILABLE FOR PACE OUTREACH 544,383
NON-RESPONDER NAMES AVAILABLE FOR LIS OUTREACH 31,701
PACE/PACENET ENROLLEES LIKELY ELIGIBLE BUT NOT ENROLLED IN AT LEAST ONE ADDITIONAL BENEFIT 182,529
96
University of Pennsylvania and PACE/PACENET Behavioral Health Lab Program 2014 Report
Overview Mental health conditions, such as depression, anxiety, and dementia, are prevalent in later life and lead to significant morbidity and disability, thereby contributing to increased medical services utilization, nursing home utilization, and mortality. Despite advances in the assessment and treatment of behavioral health disorders among older adults, under-treatment of such disorders remains a major public health concern. For example, less than 20% of patients treated for major depression are seen monthly for the first three months, and they often do not achieve remission. To address these issues, there has been a sustained effort to improve rates of treatment and to facilitate guideline adherent care for seniors in primary care settings. Much of the focus has been on the delivery of care management strategies either in person or by telephone. One such evidence based and algorithm driven program is the University of Pennsylvania Behavioral Health Lab (BHL) program. For several years, the BHL has been shown to be effective in improving the management and treatment of mental health issues, which are closely linked to quality of life, morbidity, and mortality among older adults. We have demonstrated the feasibility of delivering services to the PACE/PACENET program despite difficulty having appropriate contact information for many cardholders. Thus, the BHL program is well suited to help reduce or delay the onset and progression of functional limitations, as well as provide information about and access to resources that enable independent living for longer periods of time. Assessments In 2014, BHL completed:
736 initial assessments for cardholders and caregivers new to the program o 613 initial assessments with cardholders o 123 initial assessments with caregivers
2,735 follow-up assessments
o 226 cardholders received care management services with BHL program providers
o 299 cardholders received symptom and medication monitoring services o 14 cardholders worked with BHL program providers to get referrals to
specialty mental health services o 19 caregivers participated in the Telehealth Education Program (TEP) for
caregivers of individuals with dementia
7 initial assessments were referrals from the prescribing provider or from the PACE Application Center
o These individuals received follow-up care management services with BHL program providers and referrals to specialty mental health services
97

Overall Outcomes This analysis highlights the differences between monitoring only (standard care) or monitoring with additional therapy and care management (enhanced care). In all cases, care management improves symptoms and function relative to monitoring alone. DEPRESSION SYMPTOMS ANXIETY SYMPTOMS (LOWER IS BETTER) (LOWER IS BETTER)
OVERALL FUNCTIONING (HIGHER IS BETTER)
0
5
10
0Month
3 6
PH
Q-9
Sco
re All Enrollees
Standard Care Enhanced Care
0
2
4
6
0Month
3 6
GA
D-7
Sco
re All Enrollees
Standard Care Enhanced Care
40
45
50
55
0 3 6
SF1
2 M
CS
Sco
re
Month
All Enrollees
Standard Care Enhanced Care
98

2014 Caregiver Outreach In November 2014, the BHL started a Caregiver Outreach and Telehealth Education Program that specifically targets caregivers of cardholders with dementia or Alzheimer’s Disease.
Caregivers receive care management services with Behavioral Health providers combined with education and support
22 initial assessments o 8 initial assessments with cardholders o 14 initial assessments with caregivers
Presentations Fries, A.E., Leong, S., Benson, A., Streim, J.E., DiFilippo, S., & Oslin, D.W. (2014, March). Suicidal ideation and health outcomes in an ‘old-old’ population. Presented at the American Association for Geriatric Psychiatry 2014 Annual Meeting, Orlando, FL. Haratz, J., Zimmerman, J., Leong, S., Helstrom, A., Benson, A., DiFilippo, S., Streim, J.E., & Oslin, D.W. (2014, March). A telephone-based intervention for chronic pain in older adults enrolled in a behavioral health care management program. Presented at the American Association for Geriatric Psychiatry 2014 Annual Meeting, Orlando, FL. 2015 Initiatives
Caregiver Outreach and TEP o Starting January 2015, BHL began receiving weekly referrals for this pilot
program and anticipates an increase in caregiver participation in the care management and telehealth education services.
Enhanced partnership with the PACE Application Center o Starting January 2015, the BHL program implemented a mechanism to
refer cardholders and caregivers to the PACE Application Center for assistance accessing state and federal resources and benefits.
Continued support for cardholders prescribed psychotropic medications o The BHL program will continue to enroll cardholders prescribed
psychotropic medications into the care management and medication monitoring programs.
99

The PACE Academic Detailing Program Impact Analysis January 2012 - December 2014
Overview The PACE Program provides funding and support to the Alosa Foundation for the delivery of an academic detailing service to primary care clinicians who care for PACE beneficiaries. Academic detailing is outreach education for health care professionals to improve clinical decision making. Rather than promote particular products, educators provide comprehensive summaries of the body of evidence for a particular topic to help clinicians prescribe the safest, most effective medications for their patients. The information is compiled from comparative effectiveness research that compares the effectiveness, benefits, and harms of different medical treatment options. This provides a convenient and efficient way for primary care providers to stay current on the latest medical findings about the health issues they most commonly treat. The model uses trained clinical educators who meet one-on-one with physicians, nurse practitioners, and physician assistants at their practice locations to discuss the most recent clinical data on a particular primary care topic. This report reflects activity over three calendar years, between January 2012 and December 2014. During this time, there were nine academic detailing modules covering a wide range of conditions managed by providers in primary care.
THERAPEUTIC AREA MODULE TITLE RELEASED
Pain Management Managing Pain in the Elderly Dec. 2014
Alzheimer’s Disease and Related Disorders
Evaluation and Management of Alzheimer's Disease and Related Disorders: Evidence-based Guidance for Primary Care Clinicians
Aug. 2014
Falls and Mobility Preventing Falls In The Elderly: What Primary Care Clinicians Can Do to Reduce Injury and Death Apr. 2014
Chronic Obstructive Lung Disease and Smoking Cessation
Helping Patients with COPD Breathe Easier: Integrating the Latest Evidence on Chronic Lung Disease into Primary Care Practice
Nov. 2013
Obesity Weighing the Evidence on Obesity and Its Management Aug. 2013
Type 2 Diabetes Just a Spoonful of Medicine Helps the Sugar Go Down: Improving the Management of Type 2 Diabetes
Apr. 2013
Antiplatelet Therapy Aggregating the Latest Evidence on Antiplatelet Drugs: A Review of Recent Clinical Trials Nov. 2012
Acid Suppression Acid Suppression Therapy: Neutralizing the Hype Jul. 2012
Antipsychotics Antipsychotic Medications in Primary Care: Limited Benefit, Sizeable Risk Apr. 2012
100

Evaluation Both qualitative and quantitative data are helpful to assess the impact of the program on prescribers and to improve the program’s design for the primary care setting.
Clinician participants complete post-visit surveys after each educational session to measure knowledge, as well as to assess how the program impacts prescribing for their older patients.
Alosa conducts drug utilization analyses using PACE claims information. The clinical educators record feedback from the participants after each academic
detailing visit, capturing the clinicians’ impressions on the relevance of the current module to their practice and their perceived utility of the module in helping to improve patient care.
Alosa reports the number of prescribers educated on each topic by provider type (physician, nurse practitioner, or physician assistant).
Post-Visit Surveys Participant surveys began with the obesity module in 2013 and have continued for subsequent topics. For each module, the providers rate topic-specific statements and broader statements on the benefit to their patients. When asked after the obesity module whether they would like to see the program continue, 99% agreed or strongly agreed that they would. The majority of visited providers strongly agree that PACE Academic Detailing favorably impacts the way they make clinical decisions in caring for their older patients; 91% of those who completed the survey following the Evaluation and Management of Alzheimer's Disease and Related Disorders topic strongly agreed with this statement. For those completing the Preventing Falls in the Elderly topic, 90% strongly agreed.
RATINGS* FOR ALZHEIMER'S DISEASE MODULE (AUGUST 2014)
Please rate how strongly you agree or disagree with the following statements. 5 = Strongly Agree; 3 = Neutral; 1 = Strongly Disagree
The PACE academic detailer. . .
PERCENT OF
RESPONDENTS (N=211)
5 4 3 2 1
described best practices for identifying patients with cognitive symptoms who may have reversible causes, or require further evaluation.
96 4 0 0 0
provided me with evidence-based recommendations on caring for patients with cognitive decline and accompanying behavioral problems.
98 2 0 0 0
gave me useful, helpful information on local Pennsylvania community resources to which I can refer patients and their caregivers.
96 4 0 0 0
IDIS and the PACE academic detailer provide current, non-commercial, evidence-based information that enables me to improve patient care.
98 2 0 0 0
the PACE academic detailing program has impacted the way I make clinical decisions in caring for my older patients.
91 8 1 0 0
information provided by the PACE academic detailing program benefits the well-being of my patients.
96 4 0 0 0
101

RATINGS* FOR FALL PREVENTION MODULE (APRIL 2014)
Please rate how strongly you agree or disagree with the following statements. 5 = Strongly Agree; 3 = Neutral; 1 = Strongly Disagree
The PACE academic detailer. . .
PERCENT OF
RESPONDENTS (N=307)
5 4 3 2 1
presented useful, evidence-based information on assessing fall risk in my elderly patients.
96 3 1 0 0
described simple and efficient methods to assess gait and mobility. 94 5 1 0 0
provided me with evidence-based recommendations of effective interventions to reduce fall risks.
95 4 1 0 0
provided me with helpful information on local Pennsylvania community resources I can recommend to my patients.
94 6 0 0 0
IDIS and the PACE academic detailer provide current, non-commercial, evidence-based information that enables me to improve patient care.
94 5 1 0 0
the PACE academic detailing program has impacted the way I make clinical decisions in caring for my older patients.
90 9 1 0 0
*Rating results are also available for these Helping Patients with COPD Breathe Easier and Weighing the Evidence on Obesity and Its Management.
The quality of the materials and the knowledge of the clinical educators delivering the modules are consistently highly rated. For the COPD topic, 97% of those who responded strongly agreed that the module provided current, non-commercial, evidence-based information that had helped them improve patient care. Of those completing the Alzheimer's Disease module, 98% strongly agreed with this statement. Drug Use Analysis Overuse of antipsychotic medications in older patients is common and it increases the risk of death. These drugs can cause elevation in blood sugar, cardiac abnormalities, over-sedation, and confusion. This drug use evaluation sought to measure the impact of the PACE Academic Detailing module, titled Restrained Use of Antipsychotic Medications (APMs): Rational Management of Irrationality (released April 2012), on antipsychotic medication use. The module provided primary care providers with balanced, evidence-based information on the risks and benefits of antipsychotic medications in their older patients. The role of these medications (e.g. risperidone, quetiapine, olanzapine) is less well supported by the evidence in the management of depression, where other equally effective, safer alternatives exist. More worrisome still is the use of these powerful medications for the management of behavioral and psychological symptoms of dementia. These drugs are frequently used off-label in older patients with dementia, despite evidence from several large, randomized controlled trials of the increased risk of mortality and morbidity in patients treated with these medications. The US Food and Drug Administration issued a black box warning highlighting a 60-70% increased risk of death when these medications are used for the management of dementia.
102

As a result of this academic detailing program, one would expect to see a reduction in the volume of prescriptions for antipsychotic medications filled by PACE enrollees. The analysis measured the prescribing of visited clinicians in the 12 months before and after they participated in the PACE academic detailing session. The date the educational session occurred was the index date with each 30-day period in the 12 months before and after the index date divided into intervals to assess changes over time. The cohort was comprised of prescribers with prescriptions for a full year after the educational session. The analysis included paid claims data to quantify the number of prescriptions for antipsychotic medications and the number of patients during each 30-day interval. Because of the slight downward trend in prescriptions reimbursed by PACE over time, as well as the number of PACE beneficiaries during this time, the analysis weighted each prescriber by individual level of total prescriptions and total PACE beneficiaries during each interval to more accurately define the impact. Prescribers in the analysis wrote, on average, one or more APM prescriptions per month in the 12 months before the intervention. The outcomes examined were rates of prescribing of APM prescriptions and rates of PACE beneficiaries who filled a prescription for an APM. In addition, rates of APM prescribing in those classified as ‘responders’ to the message were studied. This data will be used in conjunction with the evaluation of other modules to show which prescribers appear to be most responsive to the educational program. Of the 662 unique prescribers who took part in the PACE Academic Detailing Program for this module, 621 met the inclusion criteria and were identified in the PACE claims dataset with at least one year of post-visit claims. Of these, 377 had prescribed an APM at least once to a PACE beneficiary in the 12 months before the intervention. There were 178 who prescribed higher volumes of APMs (12 or more) to PACE beneficiaries.
COHORT FOR APM MODULE EVALUATION
Number of prescribers who participated in this module 662
Number of participating prescribers matched with PACE prescribers (2010-2014) 653
Number of prescribers with one year of post visit prescriptions (intervention date <= 31 March 2013)
621
Number of higher volume prescribers, defined as 12 or more APM prescriptions in the 12 months preceding the intervention
178
Weighting the volume of APM prescription for each prescriber by the number of prescriptions in that interval yielded the rate of APM prescribing per 1,000 prescriptions. The impact of the program is clearly visible in the next figure, with lower rates of prescribing of APMs in the 12 months after the intervention. Combining the data before
103

the intervention and comparing it to the 12 months after, the average rate of APM Rx per 1,000 prescriptions by higher volume prescribers fell from 15.64 to 13.75; a reduction of 12.2% (p=0.0235; paired t-test).
MEAN RATE OF APM Rx PER 1,000 Rxs PER PRESCRIBER FOR HIGHER VOLUME PRESCRIBERS (n=178)
In the next figure, there are similar reductions seen when viewing the number of PACE beneficiaries who received an APM. The reduction in the number of beneficiaries prescribed an antipsychotic medication is maintained even after controlling for the overall reduction in number of PACE beneficiaries prescribed.
VOLUME OF APM PRESCRIPTIONS
BY HIGHER VOLUME PRESCRIBERS (n=178)
15.64
13.75
12.00
12.50
13.00
13.50
14.00
14.50
15.00
15.50
16.00
16.50
pre post
104

For every 1,000 patients with prescriptions from these prescribers, the number of patients issued an APM prescriptions fell from an average of 44.9 in the year before the intervention, to 39.3 after the intervention, a relative reduction of 12.5%; (p=0.0185, paired t-test).
MEAN RATE OF APM PATIENTS PER 1,000 PATIENTS
PER PRESCRIBER, FOR HIGHER VOLUME PRESCRIBERS (n=178)
By addressing the use of antipsychotic medications in the PACE population, the PACE Academic Detailing Program succeeded in reducing the number of prescriptions written by providers who participated in the program for these overused and often dangerous medications. The evaluation found a significant decline in both the volume of prescribing and the number of PACE beneficiaries taking an antipsychotic medication.
Qualitative Feedback At the end of each educational session, the academic detailer records specifics on how the messages were received by the prescriber. This provides Alosa with valuable insight on the program, and helps the clinical educator reflect on how they presented the message so that they can engage in continuous quality improvement. Below are direct comments from clinicians participating in the program. Feedback on other modules is available from the PACE Program office. Managing Pain in the Elderly A practitioner stated that she finds this information very helpful in terms of how long pain medications should be prescribed to patients. She also noted that she has always felt that the program is extremely useful for her practice. Many practitioners have commented that they are very excited to learn about the PMP [the Pennsylvania Prescription Monitoring Program] and looking forward to using it. They have all expressed interest in the details of it, as it will be helpful for their practice.
44.9
39.3
35.00
36.00
37.00
38.00
39.00
40.00
41.00
42.00
43.00
44.00
45.00
46.00
pre post
105
A practitioner provided feedback that he tries to incorporate non-pharmacological treatments but patients sometimes want a quick fix. He was interested in lack of data for long-term opioid use, as this will help him validate his rationale with his patients to use some non-pharmacological forms of treatment. Evaluation and Management of Alzheimer's Disease and Related Disorders This prescriber discussed how uncertain she is to prescribe Alzheimer’s medications due to efficacy and side effects. She said the information we provided was most helpful in determining what to do. She also felt that the caregiver resources that we provided were very comprehensive. A clinical educator described a visit in which the practitioner stated that he uses the Mini-Cog assessment and stated that the information she provided him was very useful. The practitioner appreciated that our reference card supports the use of the Mini-Cog assessment tool. He told the detailer that he feels it is nice to have evidence come in the form of unbiased material. During a discussion between a clinical educator and a physician, the physician stated, "It's good to see PACE put their money where it is effective and worth the expense. I always want to get this type of information. This makes sense to spend money on this program!" Preventing Falls in the Elderly: What Primary Care Clinicians Can Do to Reduce Injury and Death A practitioner mentioned that the falls topic has been the best he has been detailed on. He has never had someone spend time to speak with him about prevention of falls. This topic is what matters most for his patient population. A clinical educator recounted a visit where she could hear the doctor and CRNP discussing how the office needed to implement the TUG [Timed Up and Go test] immediately. During another office visit, the staff measured the TUG distance while our detailer was still talking. Another clinical educator reported that many of the doctors they have visited like and plan to use AAA [Area Agency on Aging] resources and Falls Home Safety Checklist with their patients, especially those who wish to live independently without home health agents in their homes. Smoking and COPD: Helping Patients Breathe Easier A significant proportion of doctors were not familiar with the new guidelines, but more were eager to begin using them if they weren’t already. Doctors and nurses often tell our clinical educators how the material influences the clinical decisions they are making, specifically around prescribing practices, and will sometimes make changes as indicated on the survey. Multiple doctors were very receptive to the program material and noted that the information kept them updated on unbiased evidence-based information, drug recommendations, and guidelines. Weighing the Evidence on Obesity and Its Management Multiple doctors mentioned how much they enjoyed the obesity topic, its relevance to their patients, and how frequently they recommend and print information about the Mediterranean diet as a reference tool. Many of the doctors expressed gratitude for the brochures and tear-off pads so that they can easily provide their patients with key information around weight and obesity as an alternative to using medication. One doctor expressed eagerness to pass along a brochure to a single mother with four overweight kids. Upon visiting with a new clinician, the doctor expressed how grateful she was to have such a helpful resource. She said it was relevant information that would help her engage with her new patients as she began building a practice in this new location.
106

Visit Metrics The two tables below show the total number of educational visits each year, and the number of unique provider types educated. As the primary target for the program, physicians continue to represent the majority of prescribers taking part in the program. However, nurse practitioners and physician assistants are visited as well.
EDUCATIONAL VISITS BY CONTRACT YEAR
PRESCRIBER TYPE 2011-2012 2012-2013 2013-2014
Physician 2,067 1,788 1,746 Physician Assistant 223 253 249 Nurse Practitioner 173 193 227 Other 4 2 0 Total 2,467 2,236 2,222
UNIQUE PROVIDERS EDUCATED IN EACH CONTRACT YEAR
PRESCRIBER TYPE 2011-2012 2012-2013 2013-2014
Physician 742 624 607 Physician Assistant 79 89 90 Nurse Practitioner 64 78 83 Other 2 1 0 Total 887 792 780
107

APPENDIX B
THE PACE/PACENET MEDICAL EXCEPTION PROCESS BACKGROUND: Act 134-96, the State Lottery Law, requires publication and dissemination of the medical exception process used by the Department of Aging for the Pharmaceutical Assistance Contract for the Elderly (PACE) and for the Pharmaceutical Assistance Contract for the Elderly Needs Enhancement Tier (PACENET). Specifically, the legislation addresses the medical exception process with regard to generic substitution when an A-rated therapeutically equivalent medication is available. The law further requires that the Department of Aging distribute the medical exception process to providers and recipients in the Program. THE MEDICAL EXCEPTION PROCESS: Through the online claims processing system, the PACE/PACENET Program provides prospective therapeutic review of prescriptions before the pharmacist dispenses the medication to the cardholder. The review checks for potential drug interactions, duplicative therapies, over-utilization, under-utilization and other misutilization. The Department of Aging, of course, recognizes the possibility of exceptional circumstances in connection with the application of therapeutic criteria and reimbursement edits. A medical exception will be considered by the Program when the cardholder’s physician indicates the diagnosis, medical rationale, anticipated therapeutic outcomes, the expected length of exception therapy, and the last trial at alternative therapy. Act 134-96 requires a pharmacist to dispense the A-rated, therapeutically equivalent, generic drug to the cardholder if they have a prescription for a multi-source brand product. If a cardholder seeks an exception to this mandate, a pharmacist may request a short term medical exception at the time of dispensing by calling 1-800-835-4080. The PACE Program may grant a 30-day medical exception if requested. Immediately following approval of the exception, the Program sends a follow-up letter to the cardholder’s prescribing physician. This letter serves as notice that the Program granted a temporary medical exception to the mandatory substitution requirement. The letter seeks the therapeutic rationale for continuing the medical exception. The Program allows 30 days for the return of the written medical exception request from the prescriber. If the Program does not receive written documentation, the short term medical exception will expire. If the prescriber does respond to the letter and provides appropriate information, the Program may grant a longer medical exception period. The cardholder may continue to obtain the brand medication without paying the extra cost of a generic differential. The Program may refer a request to a physician consultant or to a therapeutics committee for special review and consideration. The cardholder will receive a short term medical exception until completion of the review process. If the Program denies a request for a medical exception to the mandatory generic requirement, the cardholder may opt to continue using the brand multi-source product and, then, pay the generic differential. If this occurs, the pharmacist must collect the copay for the brand name product plus 70 percent of the average wholesale price of the brand name product from the cardholder. Please direct questions regarding the implementation of the medical exception process to 1-800-835-4080 or in writing to: Mr. Thomas M. Snedden Director, Bureau of Pharmaceutical Assistance Pennsylvania Department of Aging 555 Walnut Street, 5th Floor Harrisburg, PA 17101-1919 Source: Pennsylvania Bulletin, Vol. 26, No. 52, December 28, 1996; address change December 8, 1997.
108
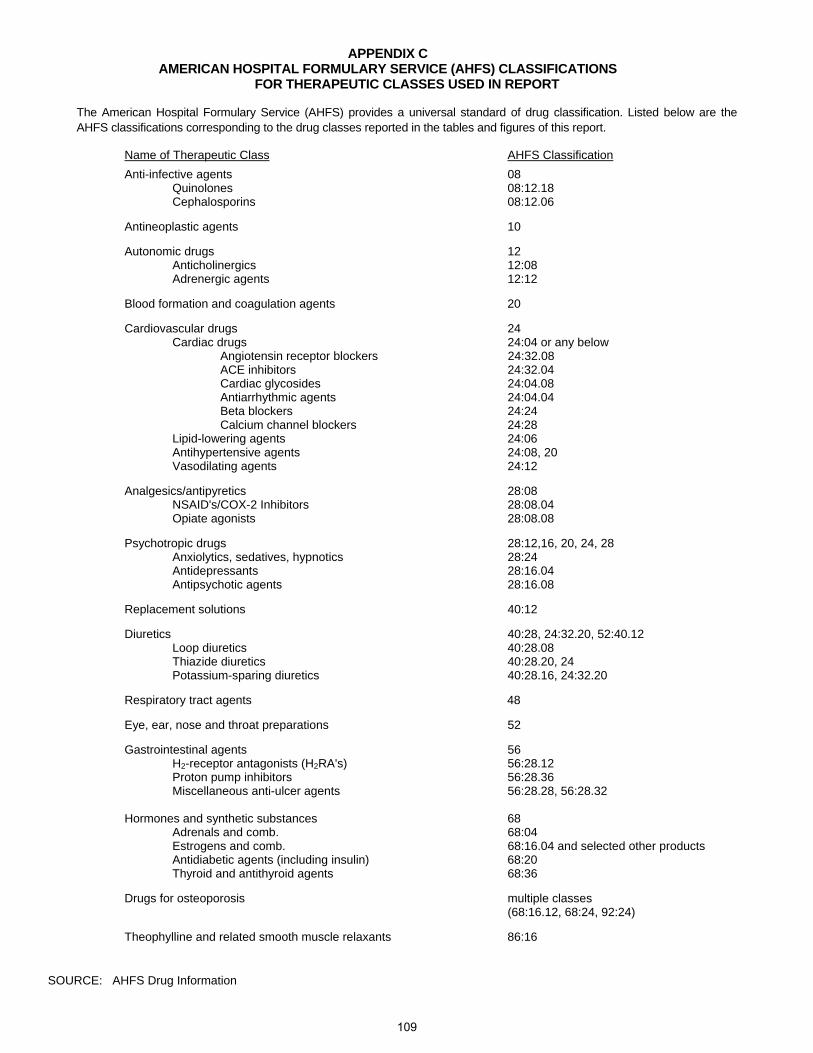
APPENDIX C AMERICAN HOSPITAL FORMULARY SERVICE (AHFS) CLASSIFICATIONS
FOR THERAPEUTIC CLASSES USED IN REPORT The American Hospital Formulary Service (AHFS) provides a universal standard of drug classification. Listed below are the AHFS classifications corresponding to the drug classes reported in the tables and figures of this report.
Name of Therapeutic Class AHFS Classification Anti-infective agents 08 Quinolones 08:12.18 Cephalosporins 08:12.06 Antineoplastic agents 10 Autonomic drugs 12 Anticholinergics 12:08 Adrenergic agents 12:12 Blood formation and coagulation agents 20 Cardiovascular drugs 24 Cardiac drugs 24:04 or any below Angiotensin receptor blockers 24:32.08 ACE inhibitors 24:32.04 Cardiac glycosides 24:04.08 Antiarrhythmic agents 24:04.04 Beta blockers 24:24 Calcium channel blockers 24:28 Lipid-lowering agents 24:06 Antihypertensive agents 24:08, 20 Vasodilating agents 24:12 Analgesics/antipyretics 28:08 NSAID's/COX-2 Inhibitors 28:08.04 Opiate agonists 28:08.08 Psychotropic drugs 28:12,16, 20, 24, 28 Anxiolytics, sedatives, hypnotics 28:24 Antidepressants 28:16.04 Antipsychotic agents 28:16.08 Replacement solutions 40:12 Diuretics 40:28, 24:32.20, 52:40.12 Loop diuretics 40:28.08 Thiazide diuretics 40:28.20, 24 Potassium-sparing diuretics 40:28.16, 24:32.20 Respiratory tract agents 48 Eye, ear, nose and throat preparations 52 Gastrointestinal agents 56 H2-receptor antagonists (H2RA's) 56:28.12 Proton pump inhibitors 56:28.36 Miscellaneous anti-ulcer agents 56:28.28, 56:28.32 Hormones and synthetic substances 68 Adrenals and comb. 68:04 Estrogens and comb. 68:16.04 and selected other products Antidiabetic agents (including insulin) 68:20 Thyroid and antithyroid agents 68:36 Drugs for osteoporosis multiple classes (68:16.12, 68:24, 92:24) Theophylline and related smooth muscle relaxants 86:16
SOURCE: AHFS Drug Information
109

APPENDIX D
PACE
PROSPECTIVE DRUG
UTILIZATION REVIEW
CRITERIA
Updated 4/15/2015
110

Angiotensin Converting Enzyme Inhibitors - Criteria Elements and Implementation Dates
Maximum Initial Dose Maximum Daily Dose
MG Per Day Date Begun MG Per Day Date Begun Class Date Begun
Angiotensin II Receptor Antagonists - Criteria Elements and Implementation Dates
Maximum Initial Dose Maximum Daily Dose Duplicate Therapy
MG Per Day Date Begun MG Per Day Date Begun Class Date Begun
Candesartan (Atacand)
No Criteria ---Less than or equal to
32 mg/day05/19/99 No Criteria ---
Irbesartan (Avapro)
No Criteria ---Less than or equal to
300 mg/day05/15/99 No Criteria ---
Eprosartan (Teveten)
No Criteria ---Less than or equal to
800 mg/day10/08/01 No Criteria ---
Telmisartan (Micardis)
No Criteria ---Less than or equal to
80 mg/day10/08/01 No Criteria ---
Olmesartan (Benicar)
No Criteria ---Less than or equal to
40 mg/day08/19/03 No Criteria ---
Less than or equal to 30 mg/day
Less than or equal to 16 mg/day
Benazepril (Lotensin)
Captopril (Capoten)
Enalapril (Vasotec)
Fosinopril (Monopril)
Lisinopril (Prinivil)
Less than or equal to 40 mg/day
Less than or equal to 80 mg/day
Less than or equal to 80 mg/day
Less than or equal to 450 mg/day
---
05/15/99
No Criteria
No Criteria
No Criteria
No Criteria
No Criteria
No Criteria
---
---
Less than or equal to 20 mg/day
Less than or equal to 40 mg/day
10/18/95
01/12/98
Less than or equal to 80 mg/day
---
---
No Criteria
No Criteria
Drug Name Generic (Brand)
---
---
No Criteria ---
---
No Criteria
---
---
---
Concurrent with other ACE Inhibitors
Concurrent with other ACE Inhibitors
05/13/02
Quinapril (Accupril)
Ramipril (Altace)
Moexipril (Univasc)
Perindopril (Aceon)
---Less than or equal to
100 mg/day04/22/98
Valsartan (Diovan)
Losartan (Cozaar)
No Criteria
08/18/97
Duplicate Therapy
Concurrent with other ACE Inhibitors
05/15/99
Concurrent with other ACE Inhibitors
05/15/99
Concurrent with other ACE Inhibitors
10/18/95
10/18/95
10/18/95
10/18/95
10/22/96
10/22/96Concurrent with other
ACE Inhibitors
10/22/96
10/22/96
Concurrent with other ACE Inhibitors
Concurrent with other ACE Inhibitors
10/22/96
05/13/02
Concurrent with other ACE Inhibitors
01/12/98
05/15/99
Drug Name Generic (Brand)
No Criteria
No Criteria
Less than or equal to 320 mg/day
111

Beta Blockers - Criteria Elements and Implementation Dates
Drug NameGeneric(Brand) MG Per Day Date Begun MG Per Day Date Begun Class Date Begun
Cardiac Glycosides - Criteria Elements and Implementation Dates
Maximum Initial Dose Maximum Daily Dose Duplicate TherapyMG Per Day MG Per Day Date Begun Class Date Begun
Less than or equal to 60 mg/day
Less than or equal to 120 mg/day
Propranolol extended release
(Innopran XL)
Sotalol (Betapace)
Timolol (Blocadren)
---
No Criteria
No Criteria
---
---
Bisoprolol (Zebeta)
Carvedilol (Coreg)
Digoxin (Lanoxin)
No Criteria
Less than or equal to 20 mg/day
Less than or equal to 100 mg/day
No Criteria
No Criteria
No Criteria
No Criteria
No Criteria
No Criteria
Atenolol (Tenormin)
Betaxolol (Kerlone)
Carteolol (Cartrol)
Penbutolol (Levatol)
Pindolol (Visken)
Propranolol (Inderal)
Propranolol LA (Inderal LA)
Metoprolol (Toprol XL)
Nadolol (Corgard)
10/18/95
10/18/95
08/18/97
---
---
---
---
---
Less than or equal to 80 mg/day
Less than or equal to 60 mg/day
---
---
---
---
---
---
---
---
---
Less than or equal to 20 mg/day
Less than or equal to 10 mg/day
Less than or equal to 640 mg/day
Less than or equal to 640 mg/day
Less than or equal to 400 mg/day
Less than or equal to 450 mg/day
Labetalol (Normodyne)
Metoprolol (Lopressor)
10/18/95
10/18/95
10/18/95
03/29/04
10/18/95
10/18/95
10/18/95
10/18/95
No Criteria
No Criteria
No Criteria
No Criteria
No Criteria
No Criteria
Less than or equal to 320 mg/day
Less than or equal to 200 mg/day
Less than or equal to 320 mg/day
10/18/95
10/18/95
Duplicate Therapy
10/18/95
10/18/95Concurrent with other
Beta Blockers
No Criteria
No Criteria
Acebutolol (Sectral)
Maximum Initial Dose Maximum Daily Dose
10/18/95
Less than or equal to 2400 mg/day
Concurrent with other Beta Blockers
10/18/95
10/18/95
Concurrent with other Beta Blockers
Concurrent with other Beta Blockers
10/18/95
10/18/95
10/18/95
Concurrent with other Beta Blockers
10/18/95
Concurrent with other Beta Blockers
Concurrent with other Beta Blockers
10/18/95
Concurrent with other Beta Blockers
10/18/95
Less than or equal to 1200 mg/day
Concurrent with other Beta Blockers
08/18/97
Concurrent with other Beta Blockers
10/18/95
Concurrent with other Beta Blockers
10/18/95
Concurrent with other Beta Blockers
10/18/95
Concurrent with other Beta Blockers
10/18/95
Concurrent with other Beta Blockers
10/18/95
Concurrent with other Beta Blockers
10/18/95
Concurrent with other other Beta Blockers
03/29/04
Concurrent with other Beta Blockers
12/09/9505/15/99No Criteria
Drug Name Generic (Brand)
Less than or equal to .375 mg/day
No Criteria ---10/18/95
112

Calcium Channel Blockers - Criteria Elements and Implementation Dates
Drug NameGeneric Maximum Initial Dose Maximum Daily Dose(Brand) MG Per Day Date Begun MG Per Day Date Begun Class Date Begun
Kinase Inhibitors - Criteria Elements and Implementation Dates
Drug NameGeneric Maximum Initial Dose Maximum Daily Dose(Brand) MG Per Day Date Begun MG Per Day Date Begun Class Date Begun
Nisoldipine (Sular)
Amlodipine & Atorvastatin
(Caduet)
Nifedipine (Procardia)
Verapamil (Calan, Isoptin)
Felodipine (Plendil)
Isradipine (DynaCirc)
Nicardipine (Cardene)
Duplicate Therapy
Cabozantinib (Cametriq)
No Criteria ---Less than or equal to
180 mg/dayNo Criteria ---
08/18/97
Concurrent with Other Calcium Channel
Blockers
Concurrent with Other Calcium Channel
Blockers
Concurrent with Other Calcium Channel
Blockers
02/14/05
10/18/95
10/18/95
10/18/95
10/18/95
10/18/95
02/14/05
Concurrent with Other Calcium Channel
Blockers
08/18/97
10/18/95
---
---
No Criteria
No Criteria
No Criteria
Less than or equal to 80 mg/day (based on
Atorvastatin)
No CriteriaLess than or equal to
120 mg/day---
---Less than or equal to
480 mg/day
Less than or equal to 60 mg/day
10/18/95
12/09/95
10/18/95
10/18/95
10/15/95
---
Concurrent with Other Calcium Channel
Blockers
Concurrent with Other Calcium Channel
Blockers
No Criteria
No Criteria
No Criteria
No Criteria
No Criteria ---
Concurrent with Other Calcium Channel
Blockers---
---
Less than or equal to 20 mg/day
Less than or equal to 20 mg/day
Less than or equal to 120 mg/day
10/18/95
10/18/95
10/18/95
05/15/99
Bepridil (Vascor)
No CriteriaLess than or equal to
10 mg/day
Less than or equal to 400 mg/day
---
Concurrent with Other Calcium Channel
Blockers
Concurrent with Other Calcium Channel
Blockers
Concurrent with Other Calcium Channel
Blockers
Concurrent with Other Calcium Channel
Blockers
10/18/95
No Criteria
12/09/95Amlodipine (Norvasc)
Duplicate Therapy
---
Diltiazem (Cardizem)
Diltiazem CD (Cardizem CD)
Less than or equal to 360 mg/day
Less than or equal to 540 mg/day
10/18/95
---
113

Lipid Lowering Agents - Criteria Elements and Implementation Dates
MG per Date DateDay Begun MG Per Day Begun
No Criteria
Antiplatelet Agents - Criteria Elements and Implementation Dates
MG per Date Date Date Day Begun MG Per Day Begun Begun Period
Cilostazol (Pletal)
No Criteria --- Less than or equal to 200 mg/day
04/10/00 No Criteria ---
Ticlopidine (Ticlid)
No Criteria --- Less than or equal to 500 mg/day
05/15/99 No Criteria ---
Clopidogrel bisulfate (Plavix)
No Criteria --- Less than or equal to 75 mg/day
10/08/01 No Criteria ---
Aspirin/ dipyridamole (Aggrenox)
No Criteria --- Less than or equal to 50 mg/400 mg/day
10/08/01 No Criteria ---
Less than or equal to 80 mg/day
Less than or equal to 80 mg/day
Less than or equal to 80 mg/day
Less than or equal to 10 mg/day
---
---
---
02/14/05Less than or equal to 40 mg/day
Date Begun
No Criteria
---
Duration of Therapy
--- No Criteria
---
---
Class---
No Criteria
---
---
12/04/97Concurrent HMG-Co A Reductase
Inhibitors
Simvastatin (Zocor)
05/15/99
04/15/97Less than or equal to 80 mg/day
Concurrent HMG-Co A Reductase
Inhibitors
04/15/97 ---
---
---
No Criteria
Max. Initial Dose Maximum Daily Dose Duration of Therapy
ClassDate
BegunDate
BegunConcurrent HMG-Co A Reductase
Inhibitors
---
Drug Name Generic (Brand)
Fluvastatin (Lescol)
No Criteria
Duplicate Therapy
No Criteria
---
Period
Max. Initial Dose Maximum Daily Dose
--- 03/29/04
Concurrent HMG-Co A Reductase
Inhibitors
---
04/15/97No Criteria
No Criteria
No Criteria
No Criteria---
02/14/05
12/04/97
04/15/97
04/15/97
04/15/97
Concurrent HMG-Co A Reductase
Inhibitors
04/15/97
Concurrent HMG-Co A Reductase
Inhibitors
Less than or equal to 80 mg/day
No Criteria
No Criteria
Rosuvastatin (Crestor)
Ezetimibe (Zetia)
Drug Name Generic (Brand)
Duplicate Therapy
No Criteria
02/14/05
Lovastatin (Mevacor)
Pravastatin (Pravachol)
Atorvastatin (Lipitor)
No Criteria
No Criteria
No Criteria
No Criteria
Less than or equal to 5 mg
114

Oral Antihyperglycemic Agents - Criteria Elements and Implementation Dates
MG per Date Date Date Day Begun MG Per Day Begun Begun Period
Thioglitazones – Additional Criteria Elements and Implementation Dates
1/6/2009
Drug Name Generic (Brand) Step Therapy Date BegunRosiglitazone and combinations
(Avandia, Avandamet, Avandaryl)Medical exception required 1/6/2009
Pioglitazone (Actos) Previous therapy required with a sulfonylurea, metformin or insulin.
06/02/09---
---
---
---
---
Less than or equal to 45 mg/day
New therapy denied for
reimbursement
No Criteria
No Criteria
Plan Protocol
---
01/06/09Class
---No Criteria --- No Criteria
No Criteria
---No Criteria
---
---
---
---
---Prior therapy with either metformin, a sulfonylurea or
insulin in the previous 60 days.
---
Rosiglitazone (Avandia)
Drug Name Generic (Brand)
No Criteria
Max. Initial Dose
--- 04/10/00Less than or equal to 8 mg/day
Less than or equal to 16 mg/day
Less than or equal to 300 mg/day
Maximum Daily Dose
--- 04/10/00
--- 04/10/00
------10/08/01 No Criteria No CriteriaLess than or equal to 20 mg/2000 mg/day
Metformin (Glucophage)
No Criteria --- 04/10/00Less than or equal to 2550 mg/day
No Criteria
Acarbose (Precose)
No Criteria
Repaglinide (Prandin)
No Criteria
---
No Criteria
Less than or equal to 360 mg/day
Less than or equal to 300 mg/day
No Criteria
No Criteria
10/08/01
10/08/01
04/10/00Miglitol (Glyset)
No Criteria
Less than or equal to 30 mg/day
Nateglinide (Starlix)
No Criteria
Pioglitazone (Actos)
No Criteria
Pioglitazone/ glimepride (Duetact)
No Criteria
Glyburide/ metformin
(Glucovance)
No Criteria
Date Begun
Duplicate Therapy
---
---
---
---
No Criteria
No Criteria
No Criteria
No Criteria
Sagliptin (Onglyza)
No Criteria --- Less than or equal to 5 mg/day
---12/14/10 No Criteria --- No Criteria
--- No Criteria ---Sitagliptin (Januvia)
No Criteria --- --- 04/01/11 Prior therapy with either metformin, a sulfonylurea or
insulin in the previous 60 days.
115

Maximum Daily Dose Duplicate TherapyDate Begun Period Date Begun Class Date Begun
Aspirin (Legend) 08/06/94 No Criteria --- 08/16/92(Easprin, Zorprin)
Choline Magnesium 10/28/94 No Criteria --- 10/28/94Sulfate (Trilisate)
Diclofenac (Voltaren) 03/29/95 No Criteria --- 08/16/92(Normal Release)
Diclofenac (Cataflam) 10/28/94 No Criteria --- 10/28/94(Quick Release)
Diflunisal 07/05/93 No Criteria --- 08/16/92(Dolobid)Etodolac 07/05/93 No Criteria --- 08/16/92(Lodine)
Fenoprofen 07/05/93 No Criteria --- 08/16/92(Nalfon)
Flurbiprofen 07/05/93 No Criteria --- 08/16/92(Ansaid)Ibuprofen 07/05/93 No Criteria --- 08/16/92(Motrin)
Indomethacin 07/05/93 No Criteria --- 08/16/92(Indocin)
Indomethacin SR 07/05/93 No Criteria --- 08/16/92(Indocin SR)Ketoprofen 07/05/93 No Criteria --- 08/16/92
(Orudis, Oruvail)Ketorolac (Toradol)
I.M. Therapy 7/15/1993 5 days/ 05/15/95 08/16/9230 days
Oral Therapy 07/05/93 5 days/ 05/15/95 08/16/9230 days
Meclofenamate 07/05/93 No Criteria --- 08/16/92(Meclomen)
Mefenamic Acid 07/05/93 No Criteria --- 08/16/92(Ponstel)
Nabumetone 07/05/93 No Criteria --- 08/16/92(Relafen)Naproxen 07/05/93 No Criteria --- 08/16/92
(Naprosyn)Naproxen Sodium 07/05/93 No Criteria --- 08/16/92
(Anaprox)Oxaprozin 07/05/93 No Criteria --- 08/16/92(Daypro)Piroxicam 07/05/93 No Criteria --- 08/16/92(Feldene)Salsalate 10/28/94 No Criteria --- 10/28/94(Disalcid)Sulindac 07/05/93 No Criteria --- 08/16/92(Clinoril)Tolmetin 07/05/93 No Criteria --- 08/16/92(Tolectin)
Meloxicam 05/13/02 No Criteria --- 05/13/02(Mobic)
Diclofenac Epolamine No Criteria --- 03/10/09(Flector Patch)
Diclofenac Potassium 12/14/10 No Criteria --- 12/14/10(Zipsor)
Concurrent NSAIDS
Concurrent NSAIDS
Concurrent NSAIDS
Concurrent NSAIDS
Concurrent NSAIDS
Concurrent NSAIDS
Concurrent NSAIDS
Concurrent NSAIDS
Concurrent NSAIDS
Concurrent NSAIDS
Concurrent NSAIDS
Concurrent NSAIDS
Concurrent NSAIDS
Concurrent NSAIDS
Concurrent NSAIDS
Concurrent NSAIDS
Concurrent NSAIDS
Concurrent NSAIDS
Concurrent NSAIDS
Concurrent NSAIDS
Concurrent NSAIDS
to 2000 mg/dayLess than or equal
to 15 mg/day
Concurrent NSAIDS
Concurrent NSAIDS
Concurrent NSAIDS
Concurrent NSAIDS
Concurrent NSAIDS
Concurrent NSAIDS
Less than or equal
to 1800 mg/dayLess than or equal
to 40 mg/dayLess than or equal
Less than or equalto 100 mg/day
to 1650 mg/dayLess than or equal
to 1250 mg/dayLess than or equal
to 2000 mg/dayLess than or equal
to 3000 mg/dayLess than or equal
to 400 mg/day
Less than or equalto 400 mg/day
Less than or equal
to 300 mg/day
Less than or equalto 60 mg/day
Less than or equal
to 1500 mg/dayLess than or equal
to 200 mg/dayLess than or equal
to 200 mg/dayLess than or equal
to 300 mg/dayLess than or equal
to 3200 mg/dayLess than or equal
to 40 mg/day
to 3000 mg/dayLess than or equal
to 225 mg/day
to 1200 mg/dayLess than or equal
to 3200 mg/dayLess than or equal
to 200 mg/dayLess than or equal
to 1500 mg/dayLess than or equal
Non-Steroidal Anti-Inflammatory Agents (NSAIDS) - Criteria Elements and Implementation Dates
MG Per DayMaximum DurationDrug Name
Generic (Brand)
Less than or equalto 6000 mg/day
Less than or equal
Less than or equal
116

COX-2 Inhibitors - Criteria Elements and Implementation Dates
Maximum Daily Dose Duplicate Therapy
Date Begun Period Date Begun Class Date Begun
Celecoxib 04/10/00 No Criteria --- 04/10/00
(Celebrex)
Valdecoxib 08/19/03 No Criteria --- 08/19/03
(Bextra)
Centrally Acting Analgesics - Criteria Elements and Implementation Dates
Maximum Daily Dose Duplicate Therapy
Date Begun Period Date Begun Class Date Begun12/04/97 No Criteria --- ---
Combination Analgesics - Criteria Elements and Implementation Dates
Maximum Daily Dose Duplicate Therapy
Date Begun Period Date Begun Class Date Begun
Hydrocodone and 04/22/98 10 days/ 04/22/98 ---
Ibuprofen 30 days
(Vicoprofen)
Opiate Agonists - Criteria Elements and Implementation Dates
Maximum Daily Dose Duplicate Therapy
Date Begun Period Date Begun Class Date Begun
Tramadol/acetaminophen 08/20/03 5 days out 08/20/03 ---
(Ultracet) of every 30
Agents to Treat Benign Prostatic Hyperplasia - Criteria Elements and Implementation Dates
Maximum Daily Dose Gender Edit
Date Begun MG Per Day Date Begun Male/ Female Date Begun
Tamsulosin HCI - No Criteria - 01/04/07
(Flomax)Dutasteride - No Criteria - 02/22/07(Avodart)
Finasteride - No Criteria - 02/22/07(Proscar)Alfuzosin - No Criteria - 02/22/07
(Uroxatral)
Inhaled Corticosteroids - Criteria Elements and Implementation Dates
Maximum Daily Dose Gender EditDate Begun MG Per Day Date Begun Male/ Female Date Begun
Budesonide 06/03/09 No Criteria - -(Pulmicort-Respules) 1 mg/day
Concurrent NSAIDS
Concurrent NSAIDS
to 37.5 mg/day
Drug Name Generic (Brand)
No Criteria
Maximum Initial Dose
Tramadol (Ultram)
Less than or equal
Less than or equal
to 400 mg/day
MG Per Day
MG Per Day
Drug Name Generic (Brand)
Drug Name Generic (Brand)
Duration of Therapy
MG Per Day
Less than or equal
Drug Name Generic (Brand)
Maximum Duration
MG Per Day
Drug Name Generic (Brand)
Maximum Duration
300 mg daily if over 75 years of age
No Criteria
400 mg daily if under 75 years of age
Maximum Duration
to 10mg/day
Less than or equal
No CriteriaLess than or equal to
Male Only
Male Only
Male Only
No Criteria
to 300 mg/day
Drug Name Generic (Brand)
Maximum Initial DoseMG Per Day
MG Per Day
Male OnlyNo Criteria
No Criteria
No Criteria
No Criteria
117

Oth
er A
nal
ges
ics
- C
rite
ria
Ele
men
ts a
nd
Imp
lem
enta
tio
n D
ates
Dat
e B
egu
nD
rug
Dat
e B
egu
nQ
uan
tity
Dat
e B
egu
nP
erio
dD
ate
Beg
un
Qu
anti
tyD
ate
Beg
un
Pro
poxy
phen
e H
Cl
05/1
3/02
No
Crit
eria
---
No
Crit
eria
---
No
Crit
eria
---
No
Crit
eria
---
(Dar
von)
Pro
poxy
phen
e na
psyl
ate
05/1
3/02
No
Crit
eria
---
No
Crit
eria
---
No
Crit
eria
---
No
Crit
eria
---
(Dar
voce
t)
Ace
tam
inop
hen/
Cod
eine
05/1
3/02
No
Crit
eria
---
No
Crit
eria
---
180
days
out
10/1
8/04
No
Crit
eria
---
Com
bina
tions
of 2
10
No
Crit
eria
10/1
8/04
No
Crit
eria
No
Crit
eria
No
Crit
eria
10/1
8/04
No
Crit
eria
---
Fen
tany
l buc
cal
---
06/0
3/09
No
Crit
eria
---
No
Crit
eria
---
No
Crit
eria
---
(Fen
tora
®)
Fen
tany
l Citr
ate
No
Crit
eria
No
Crit
eria
10/1
8/04
6 un
its10
/18/
04N
o C
riter
ia--
-10
/18/
04
(Act
iq)
Fen
tany
l Tra
nsde
rmal
N
o C
riter
ia10
/27/
04N
o C
riter
iaN
o C
riter
ia10
/18/
0410
/18/
04
(Dur
ages
ic)
Oxy
cont
in03
/29/
04N
o C
riter
iaN
o C
riter
iaN
o C
riter
iaN
o C
riter
ia18
0 da
ys o
ut
of 2
1010
/18/
04N
o C
riter
iaN
o C
riter
ia
Tap
enta
dol (
Nuc
ynta
)12
/14/
10N
o C
riter
iaN
o C
riter
iaN
o C
riter
iaN
o C
riter
iaN
o C
riter
iaN
o C
riter
iaN
o C
riter
iaN
o C
riter
ia
Fen
tany
l Sub
lingu
al
(Sub
sys)
---
---
---
100
mcg
---
---
4
Cal
ciu
m P
ho
sph
ate
Bin
der
- C
rite
ria
Ele
men
ts a
nd
Imp
lem
enta
tio
n D
ates
Dat
e B
egu
nD
rug
Dat
e B
egu
nQ
uan
tity
Dat
e B
egu
nP
erio
dD
ate
Beg
un
Qu
anti
tyD
ate
Beg
un
Sev
elam
er C
arbo
nate
04/2
1/08
No
Crit
eria
No
Crit
eria
No
Crit
eria
No
Crit
eria
---
---
No
Crit
eria
No
Crit
eria
(Ren
vela
)to
720
0 m
g/da
y
Max
imu
m D
ura
tio
nM
axim
um
Qu
anti
ty
MG
Per
Day
Less
than
or
equa
l
Dru
g N
ame
Gen
eric
(B
ran
d)
Max
imu
m D
aily
Do
seP
lan
Pro
toco
lIn
itia
l Qu
anti
ty
Max
imu
m Q
uan
tity
48 u
nits
in a
30
day
perio
d
Max
imu
m D
aily
Do
se
to 6
00 m
g/da
y
---
10 p
atch
es in
a
30 d
ay p
erio
d.
Dos
e in
crea
se
will
per
mit
an
addi
tiona
l 10
patc
hes.
Less
than
or
equa
l to
320
mg
No
Crit
eria
Less
than
or
equa
l to
600
mg
Dru
g N
ame
Gen
eric
(B
ran
d)
No
Crit
eria
Mor
phin
e S
ulfa
te
(Kad
ian,
Var
ious
)
Pat
ches
gre
ater
than
50
mcg
mus
t sho
w p
rior
conv
ersi
on w
ith o
piat
e.
Tab
lets
gre
ater
than
10
0/m
g m
ust s
how
co
nver
sion
from
Act
iq
Less
than
or
equa
l
Mus
t sho
w p
rior
conv
ersi
on w
ith o
piat
e be
fore
rei
mbu
rsem
ent
of 2
00 m
g ex
tend
ed
rele
ase
tab.
180
days
out
of
210
Max
imu
m D
ura
tio
n
MG
Per
Day
Less
than
or
equa
l
Pla
n P
roto
col
Init
ial Q
uan
tity
to 4
000
mg/
day
Less
than
or
equa
l
to 3
90 m
g/da
y
No
Crit
eria
No
Crit
eria
118

Histamine H2 Receptor Antagonists - Criteria Elements and Implementation Dates
Date Date DateMG Per Day Begun Period Begun Class Begun
Cimetidine (Tagamet)
Maintenance 08/16/92 Unlimited 10/08/04 08/16/92
TherapyFamotidine (Pepcid)
Maintenance 08/16/92 Unlimited 10/08/04 08/16/92Therapy
Nizatidine (Axid)Maintenance 08/16/92 Unlimited 10/08/04 08/16/92
TherapyRanitidine (Zantac)
Maintenance 08/16/92 Unlimited 10/08/04 08/16/92Therapy
Dexlansoprazole(Dexilant) 12/14/10 Unlimited 03/30/10 12/14/10
Miscellaneous Gastrointestinal Agents - Criteria Elements and Implementation Dates
Date Date DateMG Per Day Begun Period Begun Class Begun
Metoclopramide
(Reglan)
Misoprostol
(Cytotec)
Omeprazole Proton Pump Inhibitors/
(Prilosec) H2 Receptor Antagonists
Sucralfate
(Carafate)
Lansoprazole Proton Pump Inhibitors/
(Prevacid) H2 Receptor Antagonists
Pantoprazole Proton Pump Inhibitors/
(Protonix) H2 Receptor Antagonists
Esomeprazole Proton Pump Inhibitors/
(Nexium) H2 Receptor Antagonists
Rabeprazole Proton Pump Inhibitors/
(Aciphex) H2 Receptor Antagonists
Naproxen and
Lansoprazole
(Prevacid NapraPAC)
Agent to Treat Irritable Bowel - Criteria Elements and Implementation Dates
Date Date DateMG Per Day Begun mg/day Begun Male/Female Begun
Alosetron
(Lotronex)
20 mg/day
40 mg/day
Less than or equal to
Less than or equal to
Less than or equal to
40 mg/day
No Criteria08/28/95
Proton Pump Inhibitors and Concurrent H2.
Proton Pump Inhibitors and Concurrent H2.
Proton Pump Inhibitors and Concurrent H2.
Proton Pump Inhibitors and Concurrent H2.
30 mg/day
4000 mg/day
Less than or equal to
Less than or equal to
Less than or equal to
Less than or equal to
60 mg/day
Duplicate Therapy
Maximum Daily Dose
---
---
10/28/94
07/05/93
No Criteria
No Criteria
07/05/93 08/28/95Less than or equal to
40 mg/day
Less than or equal to300 mg/day
1600 mg/day
40 mg/day
Drug Name Generic (Brand)
---
Drug Name Generic (Brand)
Duration of TherapyMaximum Daily Dose
Less than or equal to
Less than or equal to300 mg/day
800 mcg/day
Less than or equal to
No Criteria
1000 mg (based on
Duplicate TherapyDuration of Therapy
07/05/93
10/08/01 10/08/01
No Criteria
No Criteria
No Criteria
No Criteria
---
10/08/01 No Criteria --- 10/08/01
Drug Name Generic (Brand)
Maximum Daily Dose Maximum Initial Dose
Naproxen)---
10/18/04
No Criteria
No Criteria No Criteria No Criteria Female only
02/14/05 No Criteria
Gender Edit
Proton Pump Inhibitors and Concurrent H2.Less than or equal to
60 mg/day
---
---
---
---
No Criteria
No Criteria
---
10/08/01 No Criteria --- 10/08/01
--- 08/28/95
119
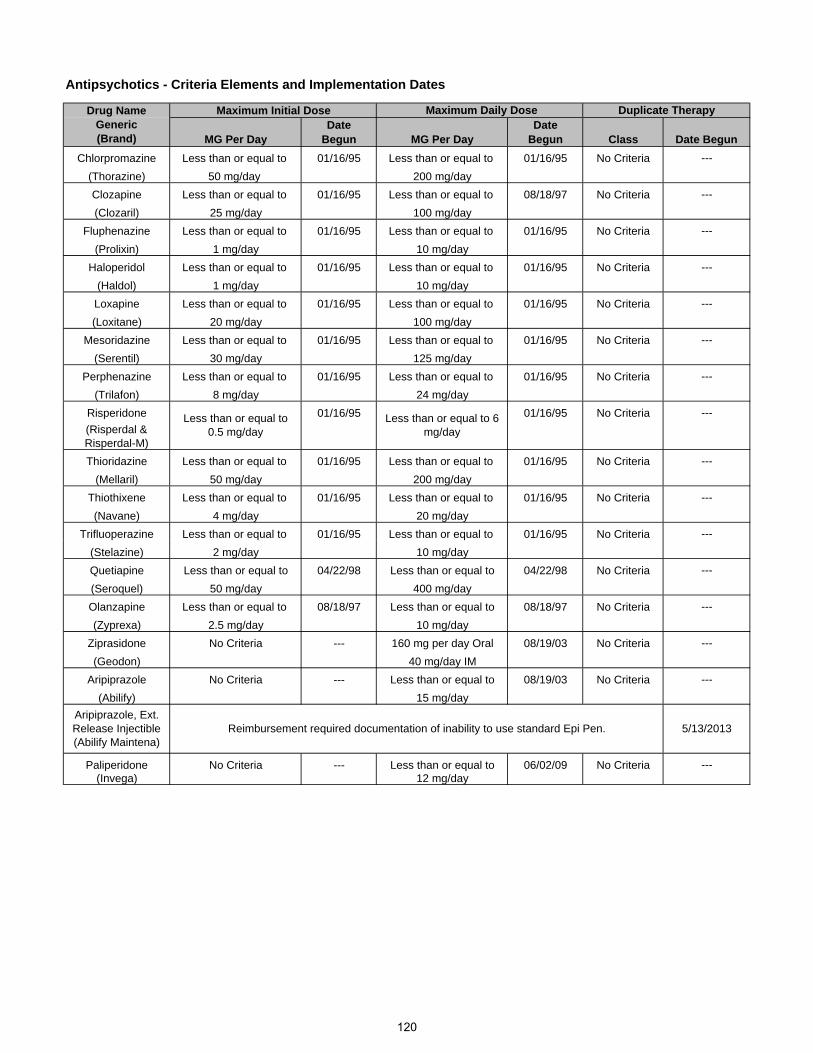
Antipsychotics - Criteria Elements and Implementation Dates
Maximum Initial DoseDate Date
MG Per Day Begun MG Per Day Begun
Chlorpromazine Less than or equal to 01/16/95 Less than or equal to 01/16/95 No Criteria
(Thorazine) 50 mg/day 200 mg/day
Clozapine Less than or equal to 01/16/95 Less than or equal to 08/18/97 No Criteria
(Clozaril) 25 mg/day 100 mg/day
Fluphenazine Less than or equal to 01/16/95 Less than or equal to 01/16/95 No Criteria
(Prolixin) 1 mg/day 10 mg/day
Haloperidol Less than or equal to 01/16/95 Less than or equal to 01/16/95 No Criteria
(Haldol) 1 mg/day 10 mg/day
Loxapine Less than or equal to 01/16/95 Less than or equal to 01/16/95 No Criteria
(Loxitane) 20 mg/day 100 mg/day
Mesoridazine Less than or equal to 01/16/95 Less than or equal to 01/16/95 No Criteria
(Serentil) 30 mg/day 125 mg/day
Perphenazine Less than or equal to 01/16/95 Less than or equal to 01/16/95 No Criteria
(Trilafon) 8 mg/day 24 mg/day
Risperidone 01/16/95 01/16/95 No Criteria
(Risperdal & Risperdal-M)
Thioridazine Less than or equal to 01/16/95 Less than or equal to 01/16/95 No Criteria
(Mellaril) 50 mg/day 200 mg/day
Thiothixene Less than or equal to 01/16/95 Less than or equal to 01/16/95 No Criteria
(Navane) 4 mg/day 20 mg/day
Trifluoperazine Less than or equal to 01/16/95 Less than or equal to 01/16/95 No Criteria
(Stelazine) 2 mg/day 10 mg/day
Quetiapine Less than or equal to 04/22/98 Less than or equal to 04/22/98 No Criteria
(Seroquel) 50 mg/day 400 mg/day
Olanzapine Less than or equal to 08/18/97 Less than or equal to 08/18/97 No Criteria
(Zyprexa) 2.5 mg/day 10 mg/day
Ziprasidone No Criteria --- 160 mg per day Oral 08/19/03 No Criteria
(Geodon) 40 mg/day IM
Aripiprazole No Criteria --- Less than or equal to 08/19/03 No Criteria
(Abilify) 15 mg/day
Paliperidone No Criteria --- Less than or equal to 06/02/09 No Criteria(Invega) 12 mg/day
---
---
---
Aripiprazole, Ext. Release Injectible (Abilify Maintena)
Reimbursement required documentation of inability to use standard Epi Pen. 5/13/2013
---
---
---
---
---
---
---
Less than or equal to 0.5 mg/day
Less than or equal to 6 mg/day
---
---
---
---
---
---
Drug Name Generic (Brand)
Maximum Daily Dose Duplicate Therapy
Class Date Begun
120

Maximum Initial Dose
Date Date
MG Per Day Begun MG Per Day BegunAmitriptyline Less than or equal to 01/16/95 Less than or equal to 01/16/95 No Criteria
(Elavil) 75 mg/day 250 mg/dayAmoxapine Less than or equal to 01/16/95 Less than or equal to 01/16/95 No Criteria(Asendin) 75 mg/day 300 mg/dayBupropion Less than or equal to 01/16/95 Less than or equal to 01/16/95 No Criteria
(Wellbutrin) 200 mg/day 450 mg/dayCitalopram Less than or equal to 05/15/99 Less than or equal to 05/15/99 No Criteria(Celexa) 20 mg/day 40 mg/day
Clomipramine Less than or equal to 01/16/95 Less than or equal to 01/16/95 No Criteria(Anafranil) 50 mg/day 250 mg/day
Desipramine Less than or equal to 01/16/95 Less than or equal to 01/16/95 No Criteria(Norpramin) 75 mg/day 250 mg/day
Doxepin Less than or equal to 01/16/95 Less than or equal to 01/16/95 No Criteria(Sinequan) 75 mg/day 250 mg/dayFluoxetine Less than or equal to 01/16/95 Less than or equal to 01/16/95 No Criteria(Prozac) 20 mg/day 60 mg/day
Imipramine Less than or equal to 01/16/95 Less than or equal to 01/16/95 No Criteria(Tofranil) 75 mg/day 250 mg/day
Isocarboxazid Less than or equal to 01/16/95 Less than or equal to 01/16/95 No Criteria(Marplan) 30 mg/day 50 mg/day
Maprotiline Less than or equal to 01/16/95 Less than or equal to 01/16/95 No Criteria(Ludiomil) 50 mg/day 200 mg/day
Mirtazapine Less than or equal to 8/18/97 Less than or equal to 08/18/97 No Criteria(Remeron) 15 mg/day 45 mg/day
Nefazodone No Criteria --- Less than or equal to 08/28/95 No Criteria(Serzone) 600 mg/day
Nortriptyline Less than or equal to 01/16/95 Less than or equal to 01/16/95 No Criteria(Pamelor) 50 mg/day 150 mg/dayParoxetine Less than or equal to 01/16/95 Less than or equal to 01/16/95 No Criteria
(Paxil) 20 mg/day 40 mg/dayPhenelzine Less than or equal to 01/16/95 Less than or equal to 01/16/95 No Criteria
(Nardil) 45 mg/day 90 mg/dayProtriptyline Less than or equal to 01/16/95 Less than or equal to 01/16/95 No Criteria
(Vivactil) 15 mg/day 40 mg/daySertraline Less than or equal to 01/16/95 Less than or equal to 01/16/95 No Criteria(Zoloft) 50 mg/day 200 mg/day
Tranylcypromine Less than or equal to 01/16/95 Less than or equal to 01/16/95 No Criteria(Parnate) 30 mg/day 60 mg/day
Trazodone Less than or equal to 01/16/95 Less than or equal to 01/16/95 No Criteria(Desyrel) 150 mg/day 400 mg/day
Trimipramine Less than or equal to 01/16/95 Less than or equal to 01/16/95 No Criteria(Surmontil) 75 mg/day 250 mg/dayVenlafaxine Less than or equal to 01/16/95 Less than or equal to 01/16/95 No Criteria
(Effexor) 75 mg/day 225 mg/dayParoxetine Less than or equal to 08/19/03 Less than or equal to 08/19/03 No Criteria(Paxil CR) 12.5 mg/day 50 mg/day
Escitalopram Less than or equal to 08/19/03 Less than or equal to 08/19/03 No Criteria(Lexapro) 10 mg/day 20 mg/dayBupropion Less than or equal to 02/06/97 Less than or equal to 02/06/97 No Criteria
(Wellbutrin XL) 300 mg/day 400 mg/dayFluoxetine
(Prozac weekly)Duloxetine No Criteria --- Less than or equal to 02/11/08 No Criteria(Cymbalta) 60 mg/day
Desvenlafaxine No Criteria No Criteria Less than or equal to 12/14/10 No Criteria(Pristiq) 50 mg/day
Bupropion Less than or equal to 12/16/10(Aplenzin) 348 mg/day
Milnacipran No Criteria --- Max dose 12/14/10 No Criteria(Savella) 200 mg/day
---
---
---
---
---
---
---
---
---
---
---
---
Antidepressants (SSRI, SSNRI) - Criteria Elements and Implementation Dates
---
---
---
---
---
Drug Name Generic (Brand)
Maximum Daily Dose Duplicate Therapy
Class Date Begun
---
12/14/2010
---
Step TherapyRequires use of bupropin tablets (not T12 or T24) prior to
---
---
---
---
Prior to Prozac weekly being approved, 90 days of therapy with Prozac daily is required
---
---
---
---
---
121

Benzodiazepines/Miscellaneous Sedative/Hypnotics - Criteria Elements and Implementation Dates
Maximum Initial Dose Maximum Daily Dose Duration of TherapyDate Date Date
MG Per Day Begun MG Per Day Begun Begun Class01/16/95 01/16/95 ---
01/16/95 01/16/95 ---
01/16/95 01/16/95 ---
03/01/94 03/01/94 03/01/94
01/31/92 01/31/92 01/31/92
01/16/95 01/16/95 ---
--- 02/19/07 ---
--- 11/01/05 ---
--- 02/19/07 ---
--- 02/19/07 No Criteria ---
Obsessive-Compulsive Disorder Agent - Criteria Elements and Implementation Dates
Maximum Initial Dose Maximum Daily Dose Duration of TherapyDate Date
MG Per Day Begun MG Per Day BegunFluvoxamine 08/28/95 08/28/95 No Criteria No Criteria ---
(Luvox)
Benzodiazepines - Criteria Elements and Implementation Dates
Maximum Initial Dose Maximum Daily Dose Duration of TherapyDate Date
Begun BegunAlprazolam 01/16/95 01/16/95 No Criteria Concurrent
(Xanax)Alprazolam 03/29/04 03/29/04(Xanax XR)
Chlordiazepoxide 01/16/95 01/16/95 No Criteria Concurrent (Librium)
Clonazepam 01/16/95 01/16/95 No Criteria Concurrent (Klonopin)
Clorazepate 01/16/95 01/16/95 No Criteria Concurrent (Tranxene)Diazepam 01/16/95 01/16/95 No Criteria Concurrent (Valium)
Halazepam 01/16/95 01/16/95 No Criteria Concurrent (Paxipam)Lorazepam 01/16/95 01/16/95 No Criteria Concurrent
(Ativan)Oxazepam 01/16/95 01/16/95 No Criteria Concurrent
(Serax)
Less than or equalto 300 mg/day
Duplicate Therapy
Period
Date Begun
Duplicate Therapy
Class
240 mg/6 mos
PeriodDate
Begun
No Criteria
Period
---
---
03/13/00
03/13/00
4 mg/6 mos
No Criteria
Date Begun
---
No Criteria
03/13/00
03/13/00
03/13/00
03/13/00
03/13/00
---
---
Drug Name Generic (Brand)
No Criteria
No Criteria
No Criteria
Less than or equal to 1 mg/day
Less than or equal to 15 mg/day
Less than or equal to 15 mg/day
Less than or equal to 2 mg/day
Less than or equal to 30 mg/day
Less than or equal to 15 mg/day
Date Begun
Drug Name Generic (Brand) MG Per Day MG Per Day
Drug Name Generic (Brand)
Less than or equalto 50 mg/day
No Criteria
No CriteriaRamelteon (Rozerem)
Eszopiclone (Lunesta)
Duplicate Therapy
Estazolam (Prosom)
Flurazepam (Dalmane)
Quazepam (Doral)
Temazepam (Restoril)
Less than or equal to .125 mg/day
Less than or equal to 8 mg/day
Less than or equal to 2 mg/day
to 30 mg/day
to 2 mg/day
to 40 mg/day
to 5 mg/day
Less than or equal
Less than or equal
Less than or equal
Less than or equal
Less than or equalto .75 mg/day
to 0.5 mg/day
Less than or equal
Less than or equal
Less than or equal
Less than or equal
to 6 mg/day
Less than or equal
to 6 mg/day
to 100 mg/day
to 4 mg/day
to 60 mg/day
to 40 mg/day
to 40 mg/day
to 15 mg/day
to 1 mg/day
to 20 mg/day
Concurrent Benzodiazepines and Misc Sed/Hypnotics
03/13/00
03/13/00
03/13/00
Concurrent Benzodiazepines and Misc Sed/Hypnotics
Concurrent Benzodiazepines and Misc Sed/Hypnotics
to 60 mg/day Less than or equal
Less than or equal
Less than or equal
Less than or equal
Less than or equal
Less than or equal
Less than or equal
Less than or equalto 3 mg/day
Date BegunClass
---
---
Only for Panic Disorder
--- 03/13/00
---
10/25/05
No Criteria
Concurrent Benzodiazepines and Misc Sed/Hypnotics
Concurrent Benzodiazepines and Misc Sed/Hypnotics
Concurrent Benzodiazepines and Misc Sed/Hypnotics
10/25/05
03/13/00
03/13/00
10/25/05
10/25/05
12/14/10
10/25/05
Less than or equal to 6.25 mg/day
Zolpidem (Edluar) Step Therapy
Documentation required as to need for sublingual dosage formLess than or equal
to 10 mg/day Concurrent
Benzodiazepines and Misc Sed/Hypnotics
No CriteriaZaleplon (Sonata)
Zolpidem (Ambien CR)
No Criteria
Less than or equal to 7.5 mg/day
Concurrent Benzodiazepines and Misc Sed/Hypnotics
Less than or equal to 5 mg/day
Zolpidem (Ambien)
Less than or equal to 15 mg/day
Less than or equal to .25 mg/day
Less than or equal to 10 mg/day
Concurrent Benzodiazepines and Misc Sed/Hypnotics
Concurrent Benzodiazepines and Misc Sed/Hypnotics
Triazolam (Halcion)
122

Miscellaneous Sedative/Hypnotics - Criteria Elements and Implementation Dates
Maximum Initial Dose Maximum Daily Dose Duration of Therapy Duplicate TherapyDate Date Date Date
Begun MG Per Day Begun Period Begun Class BegunAmobarbital No Criteria --- Less than or equal to 06/07/00 14 days out 06/07/00 No Criteria ---
(Amytal) 200 mg/day of every 180Butabarbital No Criteria --- Less than or equal to 11/26/97 14 days out 04/20/98 No Criteria ---
(Butisol) 90 mg/day of every 180Chloral Hydrate No Criteria --- Less than or equal to 11/26/97 14 days out 04/20/98 No Criteria ---
(Somnote) 1 gm/day of every 180Ethchlorvynol No Criteria --- Less than or equal to 11/26/97 14 days out 06/01/98 No Criteria ---
(Placidyl) 500 mg/day of every 180Secobarbital No Criteria --- Less than or equal to 11/26/97 14 days out 06/01/98 No Criteria ---
(Seconal) 100 mg/day of every 180Amobarbital/Secobarbital No Criteria --- Less than or equal to 11/26/97 14 days out 04/20/98 No Criteria ---
(Tuinal) 50 mg/day of every 180
Maximum Initial Dose Maximum Daily Dose Duration of Therapy Duplicate TherapyDate Date Date Date
Begun MG Per Day Begun Period Begun Class Begun
---
No Criteria
No Criteria
---
document at least 5%
weight loss after 12 weeks
Lorcaserin HCL (Belviq)
Phentermine/Topiramate (Qsymia)
Requires documentation of adherence to manufacturer recommendations for dose titration as well as weight loss related to use at each dose
08/28/13 No Criteria ---
---
Orlistat (Xenical)
No Criteria ---Less than or equal to
360 mg/day07/26/99
60 days out of every 90
08/09/99 ---
Phentermine HCL (Suprenza)
---
---
----
----
---
---
Diethylpropion (Tenuate)
No Criteria ---Less than or equal to
100 mg/day 07/26/99
60 days out of every 120
08/09/99 ---
Phendimetrazine (Bontril)
---
60 days out of every 120
08/09/99 ---
60 days out of every 90
07/26/99
No Criteria ---Less than or equal to
105 mg/day07/26/99
document at least 5%
weight loss after 12 weeks
concurrent with all other anti-obesity medications
concurrent with all other anti-obesity medications
concurrent with all other anti-obesity medications
concurrent with all other anti-obesity medications
concurrent with all other anti-obesity medications
concurrent with all other anti-obesity medications
concurrent with all other anti-obesity medications
08/09/9960 days out of every 120
Drug Name Generic (Brand)
Anti-Obesity Agents - Criteria Elements and Implementation Dates
Drug Name Generic (Brand)
MG Per Day
MG Per Day
08/09/99Sibutramine
(Meridia)
Phentermine HCL (Adipex-P)
No Criteria ---Less than or equal to
37.5 mg/day07/26/99
No Criteria ---Less than or equal to
30 mg/day
123

Maximum Initial Dose Maximum Daily Dose Duration of Therapy Duplicate Therapy
MG Per Day Date Begun Period Date Begun ClassDate
Begun
No Criteria --- 08/19/03 No Criteria --- No Criteria ---
No Criteria --- 03/29/04 No Criteria --- No Criteria ---
No Criteria --- 03/29/04 24 months 12/14/10 No Criteria ---
Maximum Initial Dose Maximum Daily Dose Duration of Therapy Duplicate TherapyDate Date Date Date
Begun MG Per Day Begun Period Begun Class Begun
Bisphosphonates and Recombinant Human Parathyroid Hormone Analog
Drug Name Generic (Brand) MG Per Day
Laxatives - Criteria Elements and Implementation Dates
Drug Name Generic (Brand) MG Per Day
Date Begun
Criteria Elements and Implementation Dates
Less than or equal to 5
mg/day
Less than or equal to 5
mg/day
Less than or equal to 10
mg/day
Alendronate (Fosamax)
Risedronate (Actonel)
Teriparatide (Forteo)
No Criteria ---
Sodium picosulfate, magnesium oxide, and
anhydrous citric acid (Prepopik)
No Criteria --- --- ---1 day out of every 365
124

DateBegun
No Criteria --- Less than or equal 06/05/00 --- 21 daysto 1400 mg/day out of 30
No Criteria --- Less than or equal 06/05/00 --- 21 daysto 3000 mg/day out of 30
No Criteria --- Less than or equal 04/19/06 --- 21 daysto 30 mg/day out of 30
No Criteria --- Less than or equal 06/05/00 --- 21 daysto 400 mg/day out of 30
No Criteria --- Less than or equal 06/05/00 --- 21 daysto 3200 mg/day out of 30
No Criteria --- Less than or equal 06/05/00 --- 21 daysto 4500 mg/day out of 30
No Criteria --- Less than or equal 06/05/00 --- 21 daysto 200 mg/day out of 30
No Criteria --- Less than or equal 06/05/00 --- 21 daysto 36 mg/day out of 30
No Criteria --- Less than or equal 06/05/00 --- 21 daysto 80 mg/day out of 30
Maximum Daily Dose Duplicate Therapy Maximum Duration
MG Per DayDate
Begun MG Per DayDate
Begun ClassDate
Begun PeriodDate
BegunDonepezil (Aricept)
Less than or equal to 5 mg
per day
05/15/99 Less than or equal to 10 mg per day
05/15/99 No Criteria --- No Criteria ---
Tacrine (Cognex)
Less than or equal to 40 mg
per day
05/15/99 Less than or equal to 160 mg per day
05/15/99 No Criteria --- No Criteria ---
Rivastigmine (Exelon)
Less than or equal to 3 mg
per day
05/13/02 Less than or equal to 12 mg per day
05/13/02 No Criteria --- No Criteria ---
Galantamine (Reminyl)
Less than or equal to 8 mg
per day
05/13/02 Less than or equal to 24 mg per day
05/13/02 No Criteria --- No Criteria ---
Memantine (Namenda)
Less than or equal to 5 mg
02/14/05 Less than or equal to 20 mg per day
02/14/05 No Criteria --- No Criteria ---
Memantine (Namenda XR)
Less than or equal to 7 mg
03/02/15 Less than or equal to 28 mg per day
03/02/15 No Criteria --- No Criteria ---
Rivastigmine (Exelon Patch)
Less than or equal to 4.6 mg/24 hour
03/12/15 Less than or equal to 4.6 mg/24 hour
for patch
03/02/15 No Criteria --- No Criteria ---
Less than or equal to 9.5 mg/24 hour
for patch
Less than or equal to 13.3 mg/24 hour
for patch
Baclofen (Lioresal)
No Criteria 06/12/00
Orphenadrine Citrate (Norflex)
No Criteria 06/12/00
Tizanidine (Zanaflex)
No Criteria 06/12/00
06/12/00
Methocarbamol (Robaxin)
No Criteria 06/12/00
Metaxalone (Skelaxin)
06/12/00
Dantrolene (Dantrium)
No Criteria 06/12/00
Cyclobenzaprine (Flexeril)
No Criteria
Chlorzoxazone (Parafon Forte)
No Criteria 06/12/00
Carisoprodol (Soma)
No CriteriaClass
Date Begun Period
Date Begun
06/12/00
Skeletal Muscle Relaxants - Criteria and Implementation Dates
Maximum Initial Dose
Drug Name Generic (Brand)
Maximum Initial Dose Maximum Daily Dose Duplicate Therapy
No Criteria
Duration of Therapy
MG Per Day MG Per DayDate
Begun
Cholinesterase Inhibitors - Criteria Elements and Implementation Dates
Drug Name Generic (Brand)
125

ClassDate
Begun MG Per DayDate
BegunMale/
FemaleDate
Begun PeriodDate
BegunSildenafil Citrate
(Viagra)Concurrent with other erectile
dysfunction agents
05/07/04 Less than or equal to 50 mg/day
06/01/98 Male 10/18/04 8 days out of every 30
01/04/99
Vardenafil (Levitra)
Concurrent with other erectile
dysfunction agents
05/07/04 No Criteria --- Male 10/18/04 8 days out of every 30
10/31/03
Tadalafil (Cialis)
Concurrent with other erectile
dysfunction agents
04/29/08 Less than or equal to 20 mg/day
03/15/04 Male 10/18/04 8 days out of every 30
05/05/04
Alprostadil (Caverject)
Concurrent with other erectile
dysfunction agents
05/07/04 No Criteria --- Male 02/11/08 8 days out of every 30
02/11/08
MG Per DayDate
Begun MG Per DayDate
Begun ClassDate
Begun PeriodDate
BegunDoxycycline (Periostat)
No Criteria --- Less than or equal to 40 mg/day
05/13/02 No Criteria --- 9 months out of every 12
05/13/02
Rifaximin (Xifaxan)
No Criteria --- No Criteria --- No Criteria --- 3 days out of every 180
06/03/09
Duplicate TherapyDrug Name Generic (Brand)
Erectile Dysfunction Agents - Criteria Elements and Implementation Dates
Maximum DurationGender EditDrug Name Generic (Brand)
Maximum Initial Dose Maximum Daily Dose Maximum Duration
Antibiotics - Criteria Elements and Implementation Dates
Duplicate Therapy Maximum Daily Dose
126

DateBegun
Cetirizine No Criteria --- Less than or equal 08/19/03 08/19/03 No Criteria(Zyrtec, Zyrtec-D) to 10 mg/day
Desloratadine No Criteria --- Less than or equal 08/19/03 08/19/03 No Criteria(Clarinex, Clarinex-D) to 5 mg/day
Fexofenadine No Criteria --- Less than or equal 08/19/03 08/19/03 No Criteria(Allegra, Allegra-D) to 120 mg/day
Fexofenadine No Criteria --- Less than or equal 08/19/03 08/19/03 No Criteria(Allegra, 180 mg to 180 mg/daystrength tablet)
DateBegun
Zolmitriptan No Criteria --- Less than or equal 08/19/03 08/19/03 3 days out(Zomig, ZMT) to 10 mg/day of every 30Almatriptan No Criteria --- Less than or equal 08/19/03 08/19/03 4 days out
(Axert) to 25 mg/day of every 30Methysergide No Criteria --- Less than or equal 08/19/03 08/19/03 150 days out
maleate to 8 mg/daily of every 180(Sansert)
Naratriptan(Amerge)
Frovatriptan No Criteria --- Less than or equal 08/19/03 08/19/03 4 days out(Frova) to 7.5 mg/day of every 30
Dihydroergotamine No Criteria --- Less than or equal 08/19/03 08/19/03 4 days out(Migranal) to 2 bottles daily of every 30Rizatriptan No Criteria --- Less than or equal 08/19/03 08/19/03 4 days out
(Maxalt, to 30 mg/day of every 30 Maxalt MLT)
Eletriptan No Criteria --- Less than or equal 03/29/04 03/29/04 3 days out(Relpax) to 40 mg/day of every 30
Sumitriptan and (Treximet)
DateBegun
Varenicline No Criteria --- No Criteria --- 12 weeks followed(Chantix) by another 12 weeks
if smoking cessation has been documented
Date Begun
Reimbursement requires documentation of inability to use standard Epi-Pen.
Anaphylaxis Treatment - Criteria and Implementation Dates
Drug Name Generic (Brand)
Antihistamines - Criteria and Implementation Dates
Drug Name Generic (Brand)
Maximum Initial Dose Maximum Daily Dose Duplicate Therapy Duration of Therapy
MG Per Day MG Per DayDate
Begun Class Date Begun Period
Duration of Therapy
---
---
---
Date Begun
Concurrent with other antihistamines
Concurrent with other antihistamines
Concurrent with other antihistamines
Concurrent with other antihistamines
---
08/19/03Epinephrine Injection (AUVI-Q)
Step Therapy
MG Per DayDate
Begun Class Date Begun PeriodDate
Begun
02/19/07
Smoking Cessation Agent - Criteria and Implementation Dates
Drug Name Generic (Brand)
Maximum Initial Dose Maximum Daily Dose Duration of Therapy
MG Per Day MG Per DayDate
Begun Period Date Begun
Antimigraine Agents - Criteria and Implementation Dates
Drug Name Generic (Brand)
Maximum Initial Dose Maximum Daily Dose Duplicate Therapy
Concurrent with other anti-migraines
Concurrent with other anti-migraines
Concurrent with other anti-migraines
Concurrent with other anti-migraines
MG Per DayConcurrent with other
anti-migrainesConcurrent with other
anti-migraines
08/19/03
08/19/03
03/29/04
Not indicated in the elderly
08/19/03
08/19/03
08/19/03Concurrent with other anti-migraines
Not recommended for the elderly
08/19/03
127

Pro
pu
lsid
Mo
nis
tat
IVS
po
ran
ox
Niz
ora
lT
AO
Mac
rolid
es
oth
er t
han
T
AO
No
n-S
edat
ing
A
nti
his
tam
ines
Ser
zon
eE
ffex
or
Lu
vox
MA
OIn
hib
ito
rsN
itro
-g
lyce
rin
Via
gra
An
ti-
arry
thm
ics
Cla
ss 1
A, I
IIT
ricy
clic
An
ti-
dep
ress
ants
An
ti-
psy
cho
tics
Vas
cor,
H
ism
anal
, Z
agam
Cym
bal
ta
Pro
pu
lsid
co-a
dmin
co-a
dmin
co-a
dmin
co-a
dmin
co-a
dmin
co-a
dmin
co-a
dmin
co-a
dmin
Mo
nis
tat
IVco
-adm
in
Sp
ora
no
xco
-adm
inco
-adm
in
Niz
ora
lco
-adm
inco
-adm
in
TA
Oco
-adm
inco
-adm
in
Mac
rolid
es o
ther
th
an T
AO
co-a
dmin
No
n-S
edat
ing
An
tih
ista
min
esco
-adm
inco
-adm
inco
-adm
inco
-adm
inco
-adm
inco
-adm
in
Ser
zon
eco
-adm
inco
-adm
in,
14 d
ays
Eff
exo
rco
-adm
in,
14 d
ays
Lu
vox
co-a
dmin
co-a
dmin
,14
day
s
MA
OIn
hib
ito
rsco
-adm
in,
7 da
ysco
-adm
in,
7 da
ysco
-adm
in,
14 d
ays
co-a
dmin
,14
day
s
Nit
rog
lyce
rin
co-a
dmin
Via
gra
co-a
dmin
An
tiar
rhyt
hm
ics
Cla
ss 1
A, I
IIco
-adm
in
Tri
cycl
ic
An
tid
epre
ssan
tsco
-adm
in
An
tip
sych
oti
csco
-adm
in
Vas
cor,
His
man
al,
Zag
amco
-adm
in
Cym
bal
taco
-adm
in,
14 d
ays
Inco
min
g C
laim
Che
ck fo
r Dru
gs A
lread
y in
His
tory
MA
TR
IX O
F D
RU
G-D
RU
G IN
TE
RA
CT
ION
S
128

APPENDIX E
State Funded Pharmacy Programs
Utilizing the PACE Program Platform
Updated January 2015
129

STATE FUNDED PHARMACY PROGRAMS UTILIZING THE PACE PROGRAM PLATFORM
SECTION A: ENROLLMENT OUTREACH, ADJUDICATION, AND
CUSTOMER SUPPORT
PROGRAM NAME ACRONYM ENROLLEES MEMBER
APPLICATION PROCESSING
MEMBER ELIGIBILITY
DETERMINATION
MEMBER CUSTOMER SUPPORT
PART D PLAN COORDINATION1
PHARMACEUTICAL ASSISTANCE CONTRACT FOR THE ELDERLY, PDA
PACE 125,801 YES YES YES YES
PHARMACEUTICAL ASSISTANCE CONTRACT FOR THE ELDERLY NEEDS ENHANCEMENT TIER, PDA
PACENET 192,352 YES YES YES YES
ANCILLARY Rx BENEFIT PROGRAMS
CHRONIC RENAL DISEASE PROGRAM, DOH
CRDP 7,447 YES YES YES YES
SPECIAL PHARMACEUTICAL BENEFITS PROGRAM, HIV/AIDS, DOH
SPBP1 8,805 YES YES YES YES
SPECIAL PHARMACEUTICAL BENEFITS PROGRAM, MENTAL HEALTH, DHS
SPBP2 1,468 YES YES
CYSTIC FIBROSIS, DOH CF 18
SPINA BIFIDA, DOH SB 6
PHENYLKETONURIA DISEASE, DOH PKU 258
MAPLE SYRUP URINE DISEASE, DOH MSUD
AUTOMOTIVE CATASTROPHIC LOSS BENEFITS CONTINUATION FUND, PDI
AUTO CAT FUND 439
WORKERS COMPENSATION SECURITY FUND, PDI
WCSF 1,440
PENNSYLVANIA PATIENT ASSISTANCE PROGRAM, PDA
PA PAP 12,627 YES YES YES
DEPARTMENT OF MILITARY AFFAIRS DMVA 301 YES YES YES YES
NON-BENEFIT SUPPORTED PROGRAMS
DEPARTMENT OF AGING PDA
DEPARTMENT OF CORRECTIONS DOC 51,121 YES YES
DEPARTMENT OF GENERAL SERVICES
DGS
DEPARTMENT OF HUMAN SERVICES, GENERAL ASSISTANCE PROGRAM
GA
BOARD OF PROBATION AND PAROLE (BENEFIT OUTREACH)
PBPP 343 YES YES YES YES
1 Includes exchange of enrollment and payment information with partner and non-partner plans; verification of premium invoices; and, management of cardholder drug coverage appeals and prior authorizations with Part D plans
Updated January 2015
130

SECTION B: CLAIMS ADJUDICATION AND PROVIDER SUPPORT
SECTION C: DUR INTERVENTIONS AND CLINICAL
SUPPORT
PHARMACY
CLAIMS
ANNUAL EXPENDITURES
CY 2014
PHARMACY CLAIMS
ADJUDICATION
PHARMACY NETWORK ENROLL-
MENT
PROVIDER CUSTOMER SUPPORT
PROVIDER AUDIT
SUPPORT
CLINICAL MANAGE-
MENT
FORMULARY MAINTEN-
ANCE
PACE 3,450,935 $74,284,400 YES YES YES YES YES YES
PACENET 4,795,176 $108,756,800 YES YES YES YES YES YES
CRDP 99,926 $4,342,200 YES YES YES YES YES YES
SPBP1 265,828 $98,254,100 YES YES YES YES YES
SPBP2 12,232 $1,202,800 YES YES YES YES YES
CF 138 $30,000 YES YES YES YES
SB 22178 $3,100 YES YES YES YES
PKU 1,970 $887,500 YES YES YES YES
MSUD - - YES YES YES YES
AUTO CAT
FUND 6,126 $949,400 YES YES YES YES YES YES
WCSF 11,129 $3,033,100 YES YES YES YES YES YES
PA PAP 8712 $381,500 YES YES YES YES YES
DMVA 4,604 $51,400 YES YES YES
PDA
DOC $47,500,000 YES YES YES
DGS
GA
PBPP
2 Includes online, real time claims adjudication; claim denials when claim exceeds drug utilization review criteria; and, seamless wrap-around of other pharmacy benefits.
Updated January 2015
131

SECTION D: CRITICAL OPERATIONS, FINANCE AND RESEARCH ACTIVITIES
FINANCIAL MGMT AND REPORTING
MANUFACTURER REBATE MGMT
QUALITY IMPROVEMENT
PROGRAM DATA MGMT
MGMT REPORTING
AD HOC REPORTING
RESEARCH AND
EVALUATION
WEBSITE SUPPORT
PACE YES YES YES YES YES YES YES YES
PACENET YES YES YES YES YES YES YES YES
CRDP YES YES YES YES YES YES YES 3
SPBP1 YES YES YES YES YES YES YES 3
SPBP2 YES YES YES YES YES YES YES 3
CF YES YES YES YES YES YES
SB YES YES YES YES YES YES
PKU YES YES YES YES YES YES
MSUD YES YES YES YES YES YES
AUTO CAT FUND YES YES YES YES YES YES
WCSF YES YES YES YES YES YES
PA PAP YES YES YES YES YES YES YES YES
DMVA YES YES YES YES YES
PDA YES YES YES YES YES
DOC YES YES YES YES YES YES YES
DGS YES YES YES YES YES
GA YES
PBPP YES
3 Although technical support for the website is not provided, documentation relevant to the program is provided for inclusion on the website.
Updated January 2015
132