2014 National Survey of Technology, Policy and Strategic Issues © 2014 Technology Councils of...
32
2014 National Survey of Technology, Policy and Strategic Issues w w w . t e c h n o l o g y c o u n c i l s . o r g © 2014 Technology Councils of North America. All rights reserved. Results for: Chattanooga & Nashville Technology Councils
-
Upload
philip-cobb -
Category
Documents
-
view
214 -
download
0
Transcript of 2014 National Survey of Technology, Policy and Strategic Issues © 2014 Technology Councils of...

2014 National Survey of Technology, Policy and Strategic Issues
ww
w.t
ec
hn
olo
gy
co
un
cils
.org
© 2014 Technology Councils of North America. All rights reserved.
Results for: Chattanooga & Nashville Technology Councils

About TECNA | CompTIA | TechAmerica
About TECNAThe Technology Councils of North America (TECNA) represents almost 50+ IT and Technology trade organizations who, in turn, represent more than 22,000 technology-related companies in North America. TECNA serves its members and the industry through its strong peer-to-peer network and its regional initiatives to raise the visibility and viability of the technology industry.
About CompTIACompTIA is the voice of the world’s information technology (IT) industry. Its members are the companies at the forefront of innovation; and the professionals responsible for maximizing the benefits organizations receive from their investments in technology. CompTIA is dedicated to advancing industry growth through its educational programs, market research, networking events, professional certifications, and public policy advocacy.
TechAmerica is the public sector and public policy department of CompTIA, advocating before decision-makers at the state, federal and international levels of government. Representing technology companies of all sizes, TechAmerica is committed to expanding market opportunities and driving the competitiveness of the U.S. technology industry around the world.


About This Research
The data for this quantitative study was collected via an online survey conducted during October 2014. A total of 1,561 senior (C-level) U.S. IT and business executives belonging to one of the regional technology associations affiliated with the Technology Councils of North America (TECNA) participated in the survey.
The margin of sampling error at the 95% confidence level for the overall results is +/- 2.5 percentage points. Sampling error is larger for subgroups of the data, such as region or company size.
As with any survey, sampling error is only one source of possible error. While non-sampling error cannot be accurately calculated, precautionary steps were taken in all phases of the survey design, collection and processing of the data to minimize its influence.
The study was conducted in conjunction with the Computing Technology Industry Association (CompTIA), with data collection support from Decipher, Inc.
CompTIA is a member of the Market Research Association (MRA) and adheres to its guidelines for research best practices and ethics. Any questions about the research methodology or data collection can be directed to [email protected].

Profile of Survey RespondentsIndustry Sector of Survey Respondent
Overall Nashville/CTCIT services / Solution providers 20% 26%Enterprise Software 12% 10%Consulting 11% 6%Healthcare / Life sciences 7% 16%Finance 5% 2%Digital media / E-commerce 4% 4%Cloud service provider 4% 0%Telecommunications services / ISP 4% 8%Hardware / OEM 3% 0%Data / Analytics 2% 4%Advanced manufacturing 2% 2%Social / Web 2% 4%Energy technology / Cleantech 2% 2%Mobile apps 1% 0%Semiconductor 1% 0%Gaming 0% 0%Advanced materials 0% 0%Other 20% 16%
Firm Size by Employee Count
Overall Nashville/CTCLess than 10 23% 14%10 to 19 9% 12%20 to 49 14% 10%50 to 99 11% 14%100 to 499 17% 10%500 to 999 5% 10%1000 or more employees 22% 30%
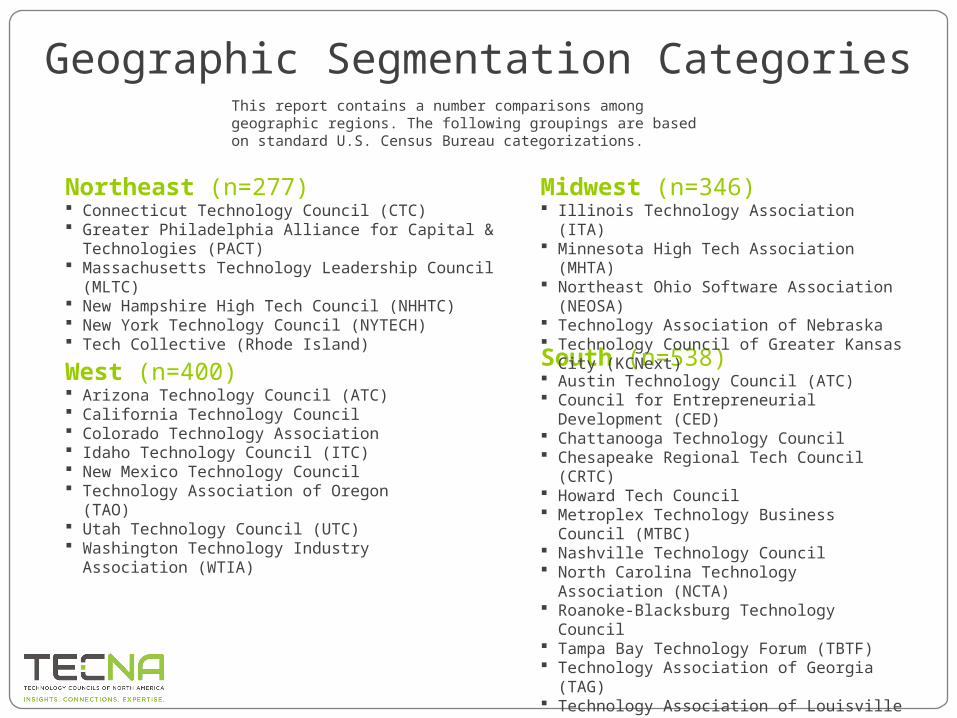
Geographic Segmentation Categories
Northeast (n=277) Connecticut Technology Council (CTC) Greater Philadelphia Alliance for Capital & Technologies (PACT) Massachusetts Technology Leadership Council (MLTC) New Hampshire High Tech Council (NHHTC) New York Technology Council (NYTECH) Tech Collective (Rhode Island)
South (n=538) Austin Technology Council (ATC) Council for Entrepreneurial Development (CED) Chattanooga Technology Council Chesapeake Regional Tech Council (CRTC) Howard Tech Council Metroplex Technology Business Council (MTBC) Nashville Technology Council North Carolina Technology Association (NCTA) Roanoke-Blacksburg Technology Council Tampa Bay Technology Forum (TBTF) Technology Association of Georgia (TAG) Technology Association of Louisville Kentucky (TALK) Tech Birmingham
This report contains a number comparisons among geographic regions. The following groupings are based on standard U.S. Census Bureau categorizations.
Midwest (n=346) Illinois Technology Association (ITA) Minnesota High Tech Association (MHTA) Northeast Ohio Software Association (NEOSA) Technology Association of Nebraska Technology Council of Greater Kansas City (KCNext)
West (n=400) Arizona Technology Council (ATC) California Technology Council Colorado Technology Association Idaho Technology Council (ITC) New Mexico Technology Council Technology Association of Oregon (TAO) Utah Technology Council (UTC) Washington Technology Industry Association (WTIA)

Assessment of Business Conditions and the Economy
Section 1

53.0
61.5
69.6 69.9
55.4
63.3
72.9 72.9
55.4
64.4
72.4 71.7
54.0
62.8
72.1 73.7
56.4
66.4
71.2 70.2
Northeast
Midwest
South
West
Nashville/CTC
Business Sentiment Segmentation: Regional Ratings
Source: TECNABase: 1,561 senior U.S. technology and business executives
Northeast=277, Midwest=346, South=538, West=400, NTC/CTC=50

Nashville/CTC 6-Month Outlook Generally Favorable
Global Economy
U.S. Economy
Tech Sector
Company Self-Assessment
26%
44%
30%
40%
52%
8%
48%
50%
2%
69%
29%
2%
% Expecting Improvement
% Expecting Weakening
% Expecting No Change
Source: TECNABase: 50 Nashville/Chattanooga Technology Council executives
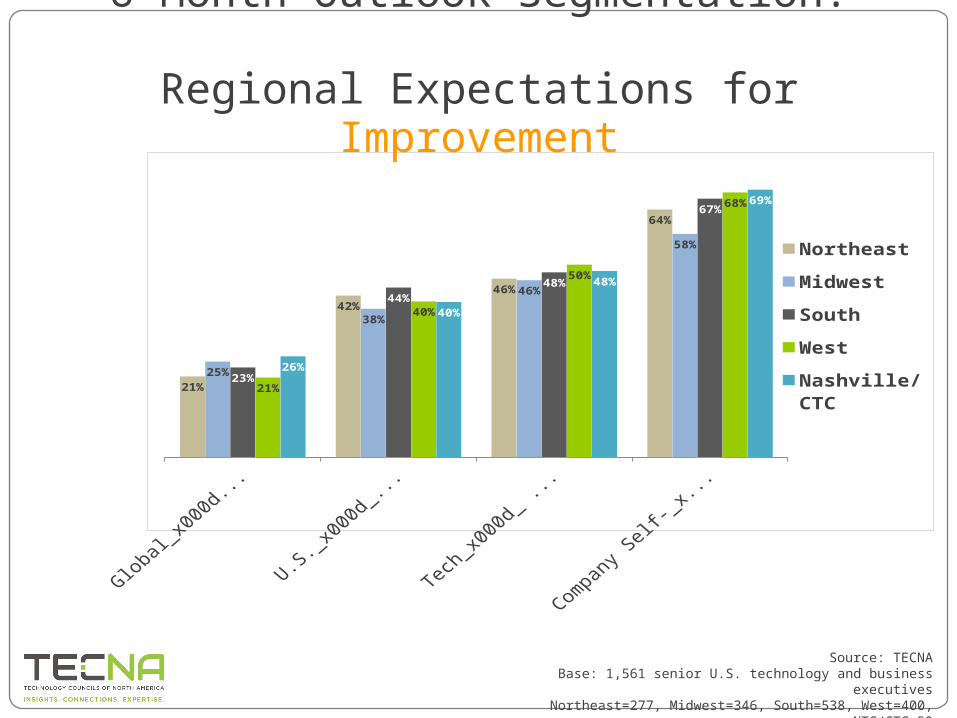
21%
42%
46%
64%
25%
38%
46%
58%
23%
44%48%
67%
21%
40%
50%
68%
26%
40%
48%
69%
Northeast
Midwest
South
West
Nashville/CTC
6-Month Outlook Segmentation: Regional Expectations for Improvement
Source: TECNABase: 1,561 senior U.S. technology and business executives
Northeast=277, Midwest=346, South=538, West=400, NTC/CTC=50

Business Investment Drivers and Factors that Could Slow Growth
Section 2

Business Investment Segmentation
Planned Increase Northeast Midwest South West Nashville/CTC
Investments in new products/business lines 62% 58% 62% 65% 76%
Staffing levels in technical positions 54% 58% 59% 58% 70%
Technology expenditures 50% 47% 54% 56% 60%
Marketing/advertising expenditures 54% 46% 50% 55% 50%
Staffing levels in non technical positions 49% 42% 47% 52% 56%
Staff training or professional development 40% 45% 46% 48% 54%
Business travel 31% 34% 34% 38% 34%
Capital expenditures 32% 33% 33% 36% 40%
Cost cutting 18% 28% 26% 22% 29%
Percent indicating a planned increase in investment over next 6 months
Source: TECNABase: 1,561 senior U.S. technology and business executives
Northeast=277, Midwest=346, South=538, West=400, NTC/CTC=50

Cost cutting
Business travel
Capital expenditures
Marketing/advertising expenditures
Staff training or professional development
Staffing levels in non technical positions
Technology expenditures
Staffing levels in technical positions
Investments in new products/business lines
6%
2%
8%
4%
4%
0%
6%
0%
2%
65%
64%
52%
46%
42%
44%
34%
30%
22%
29%
34%
40%
50%
54%
56%
60%
70%
76%
Nashville/CTC Business Investment Expectations
Timeframe: over next 6 months
Planning Increases
Planning Decreases
No Change Expected
Source: TECNABase: 50 Nashville/Chattanooga Technology Council executives
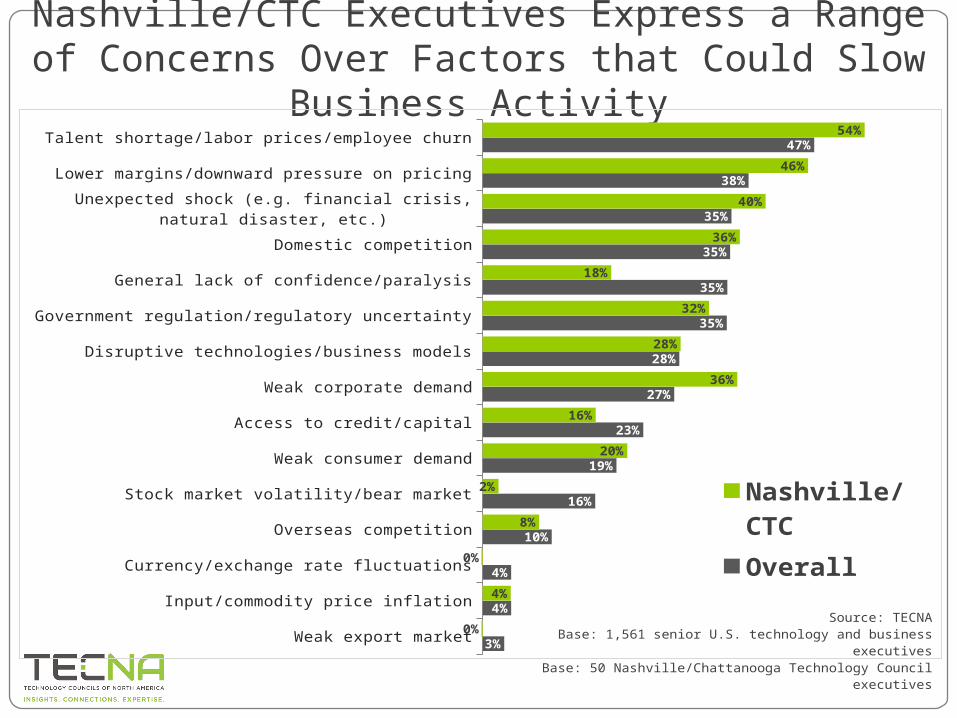
Nashville/CTC Executives Express a Range of Concerns Over Factors that Could Slow Business Activity
Weak export market
Input/commodity price inflation
Currency/exchange rate fluctuations
Overseas competition
Stock market volatility/bear market
Weak consumer demand
Access to credit/capital
Weak corporate demand
Disruptive technologies/business models
Government regulation/regulatory uncertainty
General lack of confidence/paralysis
Domestic competition
Unexpected shock (e.g. financial crisis, natural disaster, etc.)
Lower margins/downward pressure on pricing
Talent shortage/labor prices/employee churn
3%
4%
4%
10%
16%
19%
23%
27%
28%
35%
35%
35%
35%
38%
47%
0%
4%
0%
8%
2%
20%
16%
36%
28%
32%
18%
36%
40%
46%
54%
Nashville/CTC
Overall
Source: TECNABase: 1,561 senior U.S. technology and business executives
Base: 50 Nashville/Chattanooga Technology Council executives

Workforce Issues
Section 3

Significant surplus
Moderate surplus
Equilibrium, supply roughly equals demand
Moderate shortage
Significant shortage
0%0%
8%
52%
38%
0%4%
8%
63%
24%
Quantity of Talent Quality of Talent
Note: don’t know responses not shown
Nashville/CTC Perceptions of Tech Talent Quantity and Quality
NET shortage of quantity of talent= 90%
Source: TECNABase: 50 Nashville/Chattanooga Technology Council executives
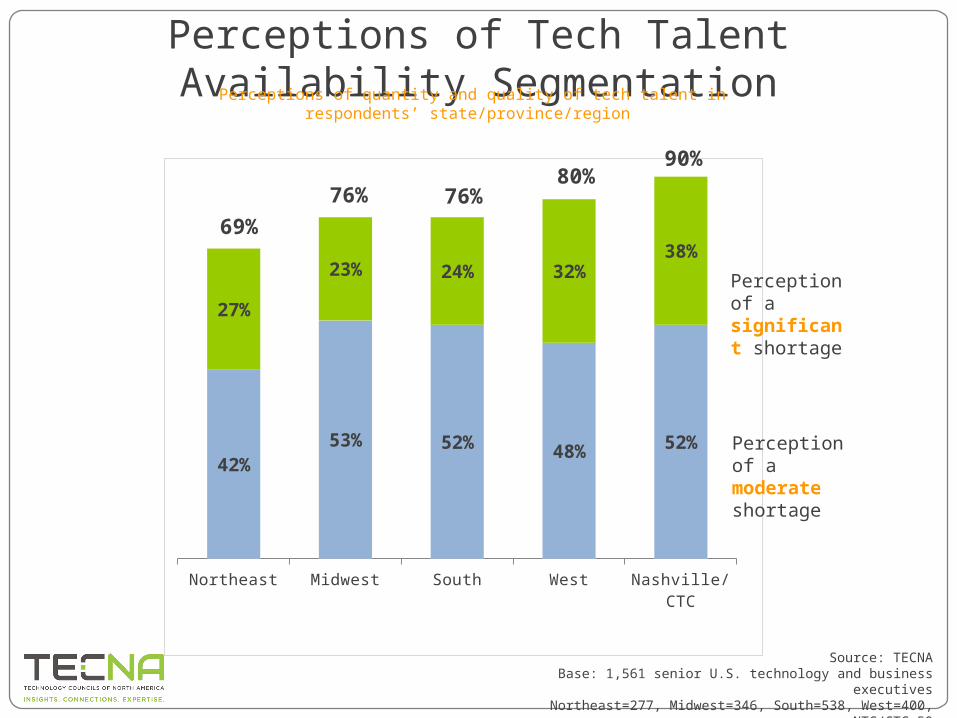
Perceptions of Tech Talent Availability Segmentation
Northeast Midwest South West Nashville/CTC
42%53% 52% 48% 52%
27%
23% 24% 32%38%
69%76% 76%
80%
Perception of a significant shortage
Perception of a moderate shortage
Perceptions of quantity and quality of tech talent in respondents’ state/province/region
90%
Source: TECNABase: 1,561 senior U.S. technology and business executives
Northeast=277, Midwest=346, South=538, West=400, NTC/CTC=50

Nashville/CTC Workforce Gains / Losses Projections
None of above - expect no hiring nor layoffs
Laying-off staff - positions reduced due to downsizing,_x000d_ slow sales or other business cycle issues
Laying-off staff - positions that_x000d_ have been permanently eliminated
Hiring staff - back-fill openings_x000d_ for existing headcount
Hiring staff - positions newly_x000d_ created or additional headcount
16%
7%
5%
34%
63%
4%
8%
4%
42%
78%
Nashville/CTC
Overall
Timeframe: over next 12 months
Source: TECNABase: 1,561 senior U.S. technology and business executives
Base: 50 Nashville/Chattanooga Technology Council executives

Workforce Gains / Losses Projections Segmentation
6% 5%
33%
60%
10%6%
36%
58%
8% 7%
34%
64%
4% 3%
34%
66%
8%4%
42%
78%
Northeast
Midwest
South
West
Nashville/CTCHiring staff -
positions newly created or additional headcount
Hiring staff - back-fill openings for
existing headcount
Laying-off staff - positions that
have been permanently eliminated
Laying-off staff – positions reduced due to downsizing, slow sales or other
business cycle issues
Source: TECNABase: 1,561 senior U.S. technology and business executives
Northeast=277, Midwest=346, South=538, West=400, NTC/CTC=50

Public Policy Issues
Section 4

12%
35%
41%
12%
0%6%
14%
34%
44%
2%
Rating of Federal Government Rating of State/Local Government
Rating of How Well Government Represents the Interests of the Tech Sector
Source: TECNABase: 50 Nashville/Chattanooga Technology Council executives

Rating of How Well State/Regional Government Represents the Interests of the Tech Sector
NET poorly Just okay NET well
41%43%
16%
43% 43%
14%
48%
40%
12%
44%
40%
16%
20%
34%
46%Northeast
Midwest
South
West
Nashville/CTC
Source: TECNABase: 1,561 senior U.S. technology and business executives
Northeast=277, Midwest=346, South=538, West=400, NTC/CTC=50

Nashville/CTC Preferences for Policy Actions in 2015
Immigration policy to restrict STEM workers
Access to public data
Tech adoption in healthcare in rural and urban areas
Opportunities for tech transfer to create new tech companies
Modernization of telecommunications laws
Immigration policy to allow more STEM skilled workers
Tech infrastructure in schools
Promotion of business between public sector and tech companies
Increased broadband deployment
Govt. efficiency through the use of technology
Access to state level funding for innovation
Access to capital for tech companies
Taxation and regulation
STEM education K-12 level
STEM education at higher ed levels
3%
11%
18%
19%
22%
25%
25%
25%
25%
26%
32%
36%
42%
43%
44%
2%
26%
42%
18%
18%
14%
30%
24%
32%
30%
28%
26%
42%
44%
48%
Nashville/CTC
Overall
Source: TECNABase: 1,561 senior U.S. technology and business executives
Base: 50 Nashville/Chattanooga Technology Council executives
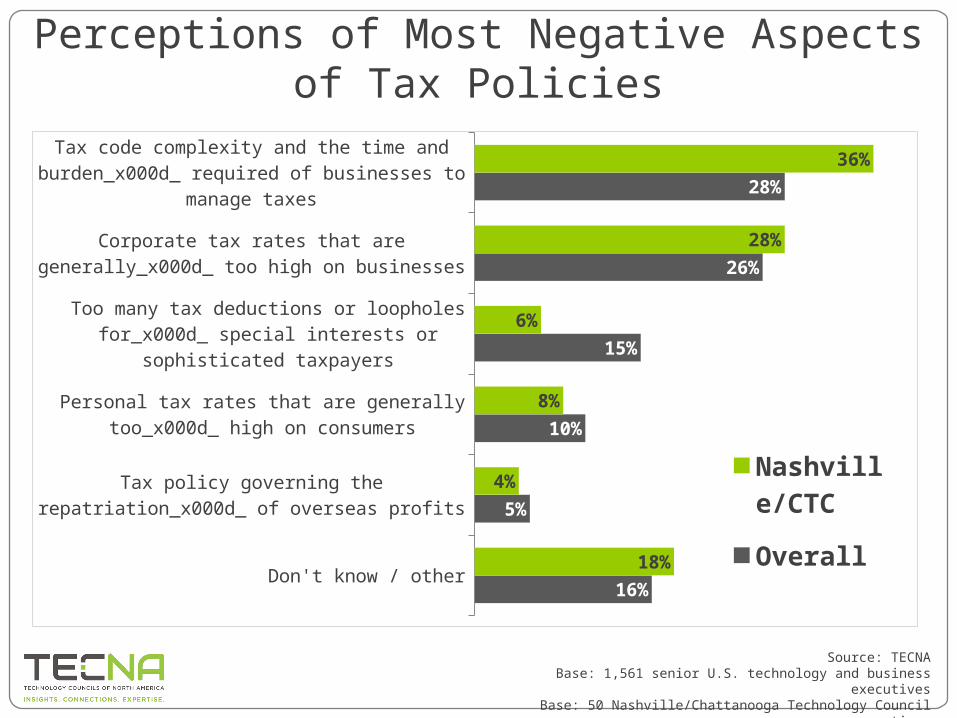
Perceptions of Most Negative Aspects of Tax Policies
Don't know / other
Tax policy governing the repatriation_x000d_ of overseas profits
Personal tax rates that are generally too_x000d_ high on consumers
Too many tax deductions or loopholes for_x000d_ special interests or sophisticated taxpayers
Corporate tax rates that are generally_x000d_ too high on businesses
Tax code complexity and the time and burden_x000d_ required of businesses to manage taxes
16%
5%
10%
15%
26%
28%
18%
4%
8%
6%
28%
36%
Nashville/CTC
Overall
Source: TECNABase: 1,561 senior U.S. technology and business executives
Base: 50 Nashville/Chattanooga Technology Council executives

Perceptions of Most Negative Aspects of Tax Policies Segmentation
Northeast Midwest South West Nashville/CTC
Tax code complexity and the time and burden required of businesses to manage taxes 26% 24% 33% 26% 36%
Corporate tax rates that are generally too high on businesses 22% 26% 28% 28% 28%
Too many tax deductions or loopholes for special interests or sophisticated taxpayers 20% 17% 10% 18% 6%
Personal tax rates that are generally too high on consumers 11% 7% 10% 10% 8%
Tax policy governing the repatriation of overseas profits 4% 7% 4% 3% 4%
Source: TECNABase: 1,561 senior U.S. technology and business executives
Northeast=277, Midwest=346, South=538, West=400, NTC/CTC=50
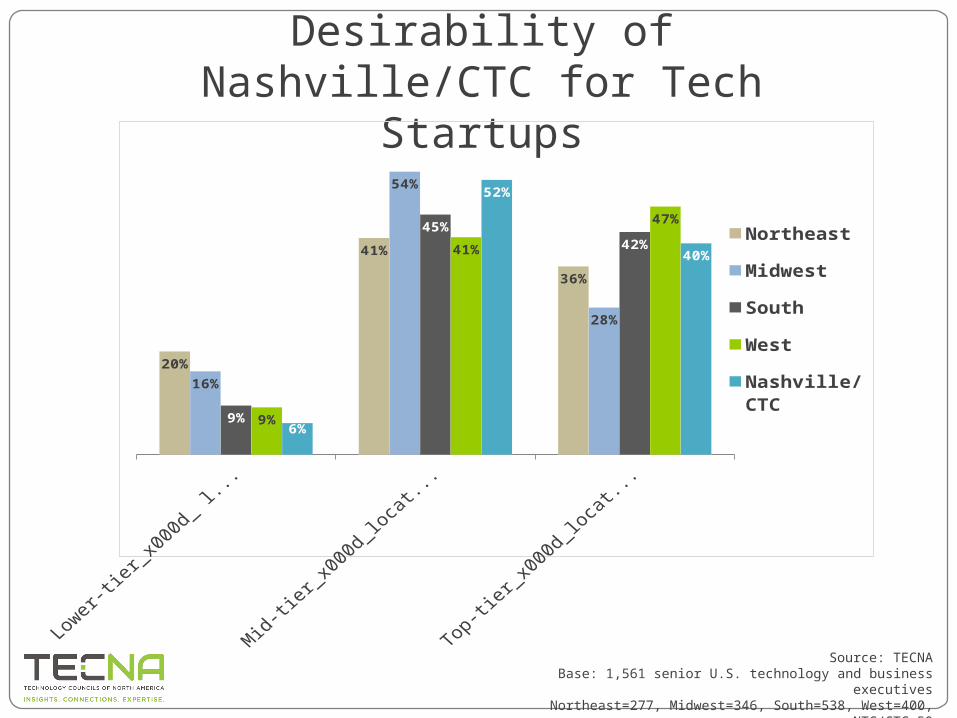
Self Assessment of Desirability of Nashville/CTC for Tech Startups
20%
41%
36%
16%
54%
28%
9%
45%42%
9%
41%
47%
6%
52%
40%Northeast
Midwest
South
West
Nashville/CTC
Source: TECNABase: 1,561 senior U.S. technology and business executives
Northeast=277, Midwest=346, South=538, West=400, NTC/CTC=50
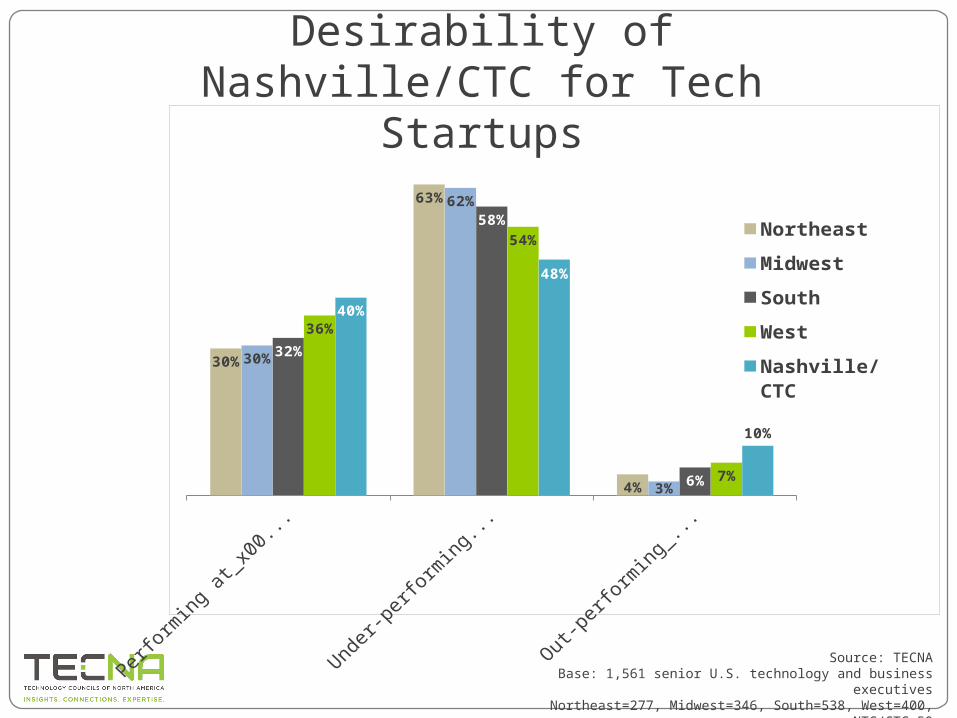
Self Assessment of Desirability of Nashville/CTC for Tech Startups
30%
63%
4%
30%
62%
3%
32%
58%
6%
36%
54%
7%
40%
48%
10%
Northeast
Midwest
South
West
Nashville/CTC
Source: TECNABase: 1,561 senior U.S. technology and business executives
Northeast=277, Midwest=346, South=538, West=400, NTC/CTC=50

Perceptions of Factors Contributing to a Healthy Tech Sector in Nashville/CTC
Other factors
K-12 education
Transportation capacity/quality
Commercial sector ecosystem
Early, mid, late-stage financing capacity
General infrastructure capacity / quality
University alignment with industry needs
Research universities
Business friendly environment
Cost advantages (e.g. land, labor, inputs, etc.)
Skilled workforce
Entrepreneurship/innovation ecosystem
Quality of life
2%
4%
7%
9%
9%
14%
24%
26%
26%
27%
36%
44%
57%
2%
6%
6%
6%
14%
16%
14%
6%
44%
36%
14%
60%
64%
Nashville/CTC
Overall
Source: TECNABase: 1,561 senior U.S. technology and business executives
Base: 50 Nashville/Chattanooga Technology Council executives

Perceptions of Factors Contributing to a Healthy Tech Sector in Nashville/CTC Segmentation
Northeast Midwest South West Nashville/CTC
Quality of life 49% 55% 55% 69% 64%
Entrepreneurship/innovation ecosystem 45% 42% 41% 50% 60%
Skilled workforce 42% 39% 32% 37% 14%
Cost advantages 11% 23% 34% 32% 36%
Business friendly environment 11% 20% 33% 33% 44%
Research universities 37% 20% 30% 19% 6%
University alignment with industry needs 29% 25% 28% 17% 14%
General infrastructure capacity 11% 20% 14% 13% 16%
Early, mid, late-stage financing capacity 18% 8% 6% 9% 14%
Commercial sector ecosystem 9% 14% 7% 7% 6%
Transportation capacity/quality 10% 12% 5% 3% 6%
K-12 education 4% 8% 3% 1% 6%
Source: TECNABase: 1,561 senior U.S. technology and business executives
Northeast=277, Midwest=346, South=538, West=400, NTC/CTC=50

Perceptions of Factors that can Inhibit Nashville/CTC Tech Sector Growth / Performance
Quality of life
Research universities / R&D capacity
Commercial sector ecosystem
General infrastructure capacity / quality
Entrepreneurship/innovation ecosystem
University/college alignment with industry needs
Business environment
K-12 education
Transportation capacity/quality
Workforce
Costs (e.g. land, labor, inputs, etc.)
Early, mid, late stage financing capacity
0%
22%
4%
14%
4%
41%
6%
39%
27%
59%
2%
37%
Source: TECNABase: 2014 – 50 Nashville/Chattanooga Technology Council executives

Expectations of Sectors that Will Drive Innovation / Startups / Job Growth
Advanced materials
Defense / military technology
Telecommunications
Broadcasting / Digital media / entertainment technology
Advanced manufacturing
Energy technology / Cleantech
IT services
Data center / cloud computing infrastructure
Cybersecurity
Data / analytics
Software / apps
Life sciences or healthcare technology
1%
4%
3%
2%
3%
3%
8%
8%
6%
9%
30%
22%
0%
2%
2%
2%
0%
0%
2%
6%
2%
17%
21%
46%
Nashville/CTC
Overall
Source: TECNABase: 1,561 senior U.S. technology and business executives
Base: 50 Nashville/Chattanooga Technology Council executives

2-Year Outlook for Sectors that Will Drive Innovation / Startups / Job Growth
Advanced materials
Defense / military technology
Telecommunications
Broadcasting / Digital media / entertainment technology
Advanced manufacturing
Energy technology / Cleantech
IT services
Data center / cloud computing infrastructure
Cybersecurity
Data / analytics
Software / apps
Life sciences or healthcare technology
1%
2%
6%
2%
4%
1%
10%
8%
6%
14%
24%
22%
0%
0%
2%
4%
4%
2%
2%
8%
4%
31%
12%
31%
Nashville/CTC
Overall
Source: TECNABase: 1,561 senior U.S. technology and business executives
Base: 50 Nashville/Chattanooga Technology Council executives