2014 Model Annual Financial Report Final
59
ANNUAL REPORT 2013-2014 FINANCIAL REPORT
Transcript of 2014 Model Annual Financial Report Final
ANNUAL REPORT 2013-2014
FINANCIAL REPORT

FINANCIAL REPORT
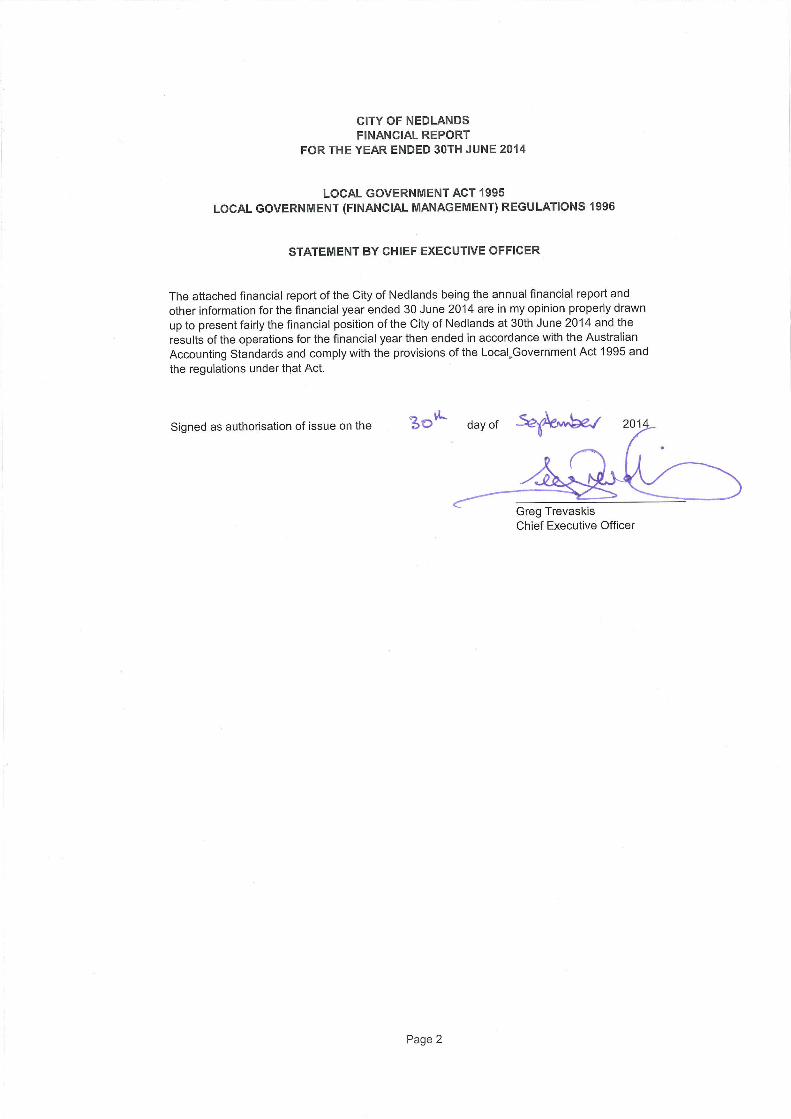
FOR THE YEAR ENDED 30TH JUNE 2014
TABLE OF CONTENTS
Statement by Chief Executive Officer 2
Statement of Comprehensive Income by Nature or Type 3
Statement of Comprehensive Income by Program 4
Statement of Financial Position 5
Statement of Changes in Equity 6
Statement of Cash Flows 7
Rate Setting Statement 8
Notes to and Forming Part of the Financial Report 9 - 55
Independent Audit Report 56
CITY OF NEDLANDS
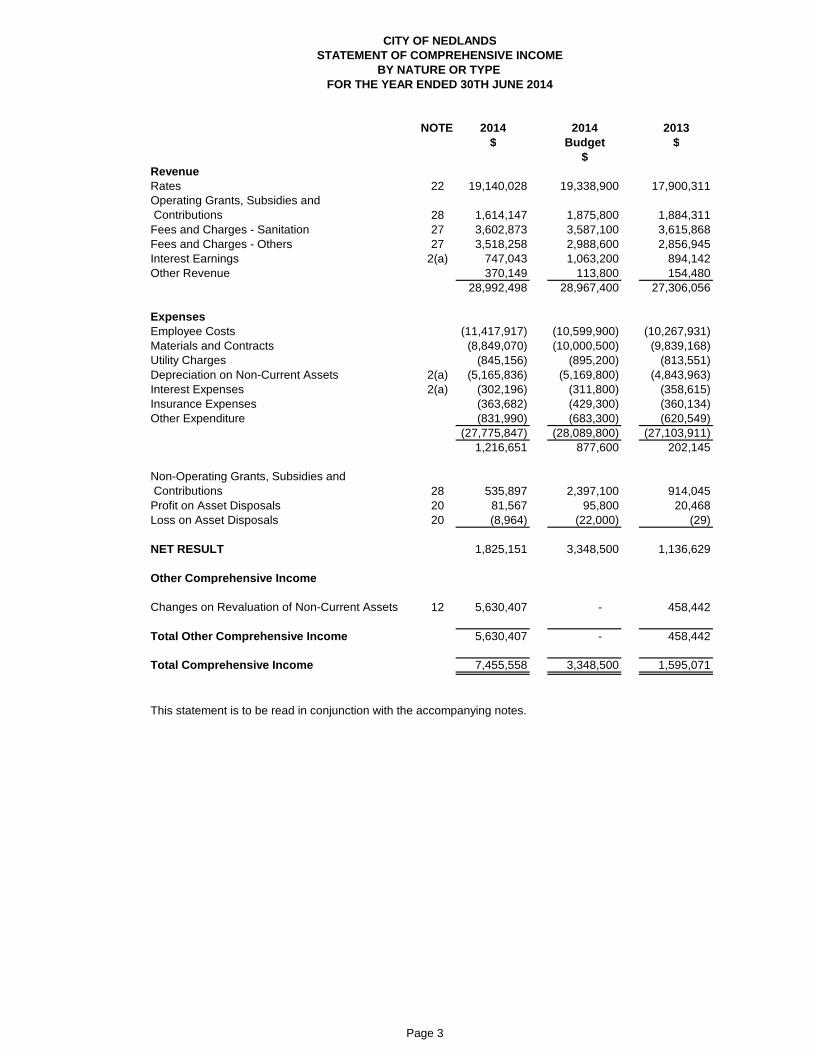
CITY OF NEDLANDSSTATEMENT OF COMPREHENSIVE INCOME
BY NATURE OR TYPEFOR THE YEAR ENDED 30TH JUNE 2014
NOTE 2014 2014 2013$ Budget $
$RevenueRates 22 19,140,028 19,338,900 17,900,311Operating Grants, Subsidies and Contributions 28 1,614,147 1,875,800 1,884,311Fees and Charges - Sanitation 27 3,602,873 3,587,100 3,615,868Fees and Charges - Others 27 3,518,258 2,988,600 2,856,945Interest Earnings 2(a) 747,043 1,063,200 894,142Other Revenue 370,149 113,800 154,480
28,992,498 28,967,400 27,306,056
ExpensesEmployee Costs (11,417,917) (10,599,900) (10,267,931)Materials and Contracts (8,849,070) (10,000,500) (9,839,168)Utility Charges (845,156) (895,200) (813,551)Depreciation on Non-Current Assets 2(a) (5,165,836) (5,169,800) (4,843,963)Interest Expenses 2(a) (302,196) (311,800) (358,615)Insurance Expenses (363,682) (429,300) (360,134)Other Expenditure (831,990) (683,300) (620,549)
(27,775,847) (28,089,800) (27,103,911)1,216,651 877,600 202,145
Non-Operating Grants, Subsidies and Contributions 28 535,897 2,397,100 914,045Profit on Asset Disposals 20 81,567 95,800 20,468Loss on Asset Disposals 20 (8,964) (22,000) (29)
NET RESULT 1,825,151 3,348,500 1,136,629
Other Comprehensive Income
Changes on Revaluation of Non-Current Assets 12 5,630,407 - 458,442
Total Other Comprehensive Income 5,630,407 - 458,442
Total Comprehensive Income 7,455,558 3,348,500 1,595,071
This statement is to be read in conjunction with the accompanying notes.
Page 3

CITY OF NEDLANDSSTATEMENT OF COMPREHENSIVE INCOME
BY PROGRAMFOR THE YEAR ENDED 30TH JUNE 2014
NOTE 2014 2014 2013$ Budget $
$RevenueGovernance 388,732 147,900 203,178General Purpose Funding 20,373,959 21,180,700 19,659,768Law, Order, Public Safety 103,926 72,200 60,664Health 157,183 62,800 95,309Education and Welfare 1,567,879 1,431,000 1,362,059Community Amenities 4,261,633 4,205,100 4,167,728Recreation and Culture 736,621 613,400 645,042Transport 499,131 522,600 519,143Economic Services 880,323 719,100 578,153Other Property and Services 23,111 12,600 15,012
2(a) 28,992,498 28,967,400 27,306,056
ExpensesGovernance (2,509,931) (1,821,100) (1,786,031)General Purpose Funding (243,448) (157,600) (211,844)Law, Order, Public Safety (944,863) (935,100) (873,666)Health (558,257) (431,100) (418,897)Education and Welfare (2,112,326) (2,414,200) (2,509,624)Community Amenities (4,969,292) (5,594,000) (5,286,980)Recreation & Culture (7,294,138) (7,066,000) (7,246,473)Transport (4,656,794) (4,809,000) (4,576,164)Economic Services (3,783,920) (3,626,200) (3,554,070)Other Property and Services (400,682) (923,700) (281,547)
2(a) (27,473,651) (27,778,000) (26,745,296)
Financial CostsGeneral Purpose Funding (302,196) (311,800) (358,615)
2(a) (302,196) (311,800) (358,615)
Non-Operating Grants, Subsidies and ContributionsEducation and Welfare 90,795 - - Community Amenities - 200,000 - Recreation & Culture 55,819 289,300 258,263Transport 389,283 1,907,800 655,782
535,897 2,397,100 914,045
Profit/(Loss) on Disposal of AssetsGovernance - - (29)Other Property and Services 72,603 73,800 20,468
72,603 73,800 20,439
Net Result 1,825,151 3,348,500 1,136,629
Other Comprehensive Income
Changes on revaluation of non-current assets 12 5,630,407 - 458,442
Total Other Comprehensive Income 5,630,407 - 458,442
Total Comprehensive Income 7,455,558 3,348,500 1,595,071
This statement is to be read in conjunction with the accompanying notes.
Page 4
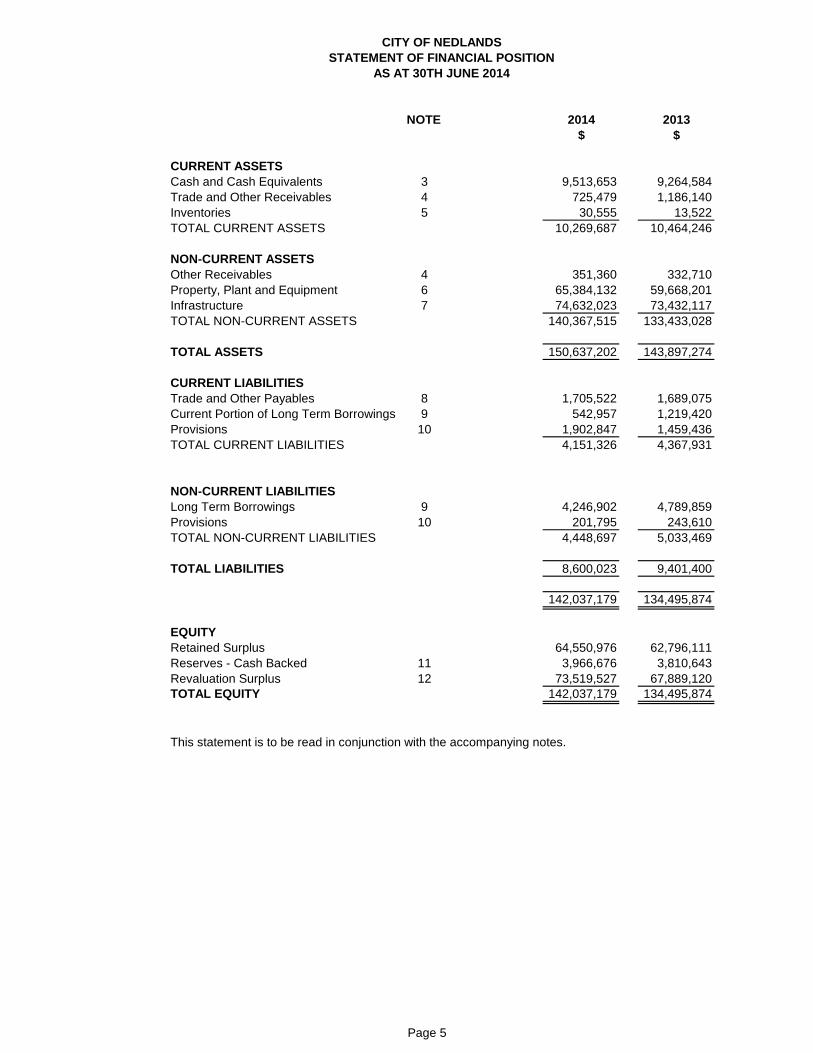
CITY OF NEDLANDSSTATEMENT OF FINANCIAL POSITION
AS AT 30TH JUNE 2014
NOTE 2014 2013$ $
CURRENT ASSETSCash and Cash Equivalents 3 9,513,653 9,264,584Trade and Other Receivables 4 725,479 1,186,140Inventories 5 30,555 13,522TOTAL CURRENT ASSETS 10,269,687 10,464,246
NON-CURRENT ASSETSOther Receivables 4 351,360 332,710Property, Plant and Equipment 6 65,384,132 59,668,201Infrastructure 7 74,632,023 73,432,117TOTAL NON-CURRENT ASSETS 140,367,515 133,433,028
TOTAL ASSETS 150,637,202 143,897,274
CURRENT LIABILITIESTrade and Other Payables 8 1,705,522 1,689,075Current Portion of Long Term Borrowings 9 542,957 1,219,420Provisions 10 1,902,847 1,459,436TOTAL CURRENT LIABILITIES 4,151,326 4,367,931
NON-CURRENT LIABILITIESLong Term Borrowings 9 4,246,902 4,789,859Provisions 10 201,795 243,610TOTAL NON-CURRENT LIABILITIES 4,448,697 5,033,469
TOTAL LIABILITIES 8,600,023 9,401,400
142,037,179 134,495,874
EQUITYRetained Surplus 64,550,976 62,796,111Reserves - Cash Backed 11 3,966,676 3,810,643Revaluation Surplus 12 73,519,527 67,889,120TOTAL EQUITY 142,037,179 134,495,874
This statement is to be read in conjunction with the accompanying notes.
Page 5
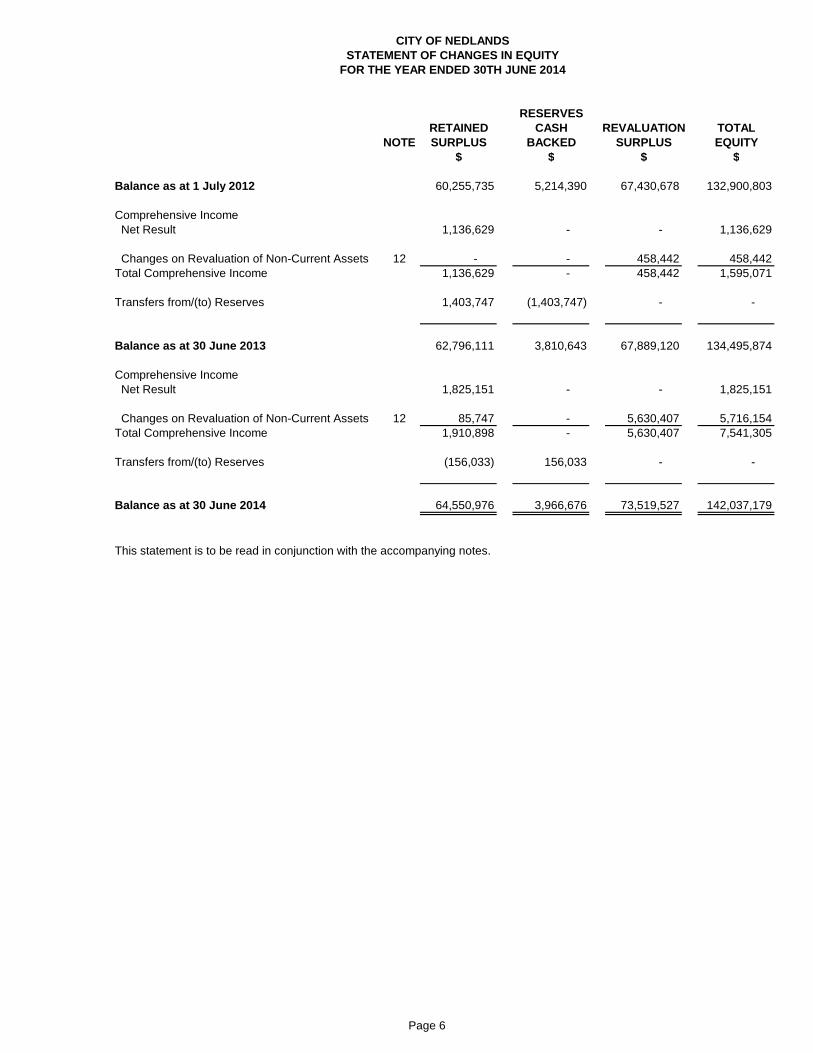
CITY OF NEDLANDSSTATEMENT OF CHANGES IN EQUITY
FOR THE YEAR ENDED 30TH JUNE 2014
RESERVESRETAINED CASH REVALUATION TOTAL
NOTE SURPLUS BACKED SURPLUS EQUITY$ $ $ $
Balance as at 1 July 2012 60,255,735 5,214,390 67,430,678 132,900,803
Comprehensive Income Net Result 1,136,629 - - 1,136,629
Changes on Revaluation of Non-Current Assets 12 - - 458,442 458,442Total Comprehensive Income 1,136,629 - 458,442 1,595,071
Transfers from/(to) Reserves 1,403,747 (1,403,747) - -
Balance as at 30 June 2013 62,796,111 3,810,643 67,889,120 134,495,874
Comprehensive Income Net Result 1,825,151 - - 1,825,151
Changes on Revaluation of Non-Current Assets 12 85,747 - 5,630,407 5,716,154Total Comprehensive Income 1,910,898 - 5,630,407 7,541,305
Transfers from/(to) Reserves (156,033) 156,033 - -
Balance as at 30 June 2014 64,550,976 3,966,676 73,519,527 142,037,179
This statement is to be read in conjunction with the accompanying notes.
Page 6

CITY OF NEDLANDSSTATEMENT OF CASH FLOWS
FOR THE YEAR ENDED 30TH JUNE 2014
NOTE 2014 2014 2013$ Budget $
Cash Flows From Operating Activities $ReceiptsRates 19,716,799 19,338,900 17,345,271Operating Grants, Subsidies and Contributions 1,501,928 1,875,780 1,884,311Fees and Charges 7,121,131 6,575,700 6,578,537Interest Earnings 747,043 1,063,200 894,142Goods and Services Tax (5,448) - 23,932Other Revenue 370,149 129,020 154,480
29,451,602 28,982,600 26,880,673PaymentsEmployee Costs (11,028,672) (10,799,900) (9,897,459)Materials and Contracts (8,827,706) (9,721,500) (10,525,153)Utility Charges (845,156) (895,200) (813,551)Interest Expenses (311,795) (311,800) (360,134)Insurance Expenses (363,682) (429,200) (367,497)Goods and Services Tax (17,094) - 105,693Other Expenditure (831,990) (333,800) (620,549)
(22,226,095) (22,491,400) (22,478,650)Net Cash Provided By (Used In) Operating Activities 13(b) 7,225,507 6,491,200 4,402,023
Cash Flows from Investing ActivitiesPayments for Purchase of Property, Plant & Equipment (2,010,564) (1,533,500) (3,044,563)Payments for Construction of Infrastructure (4,704,066) (7,103,700) (3,576,503)Non-Operating Grants, Subsidies and Contributions 535,897 2,397,100 914,045Proceeds from Sale of Fixed Assets 421,715 407,400 154,782Net Cash Provided by (Used in)Investment Activities (5,757,018) (5,832,700) (5,552,239)
Cash Flows from Financing ActivitiesRepayment of Debentures (1,219,420) (1,219,500) (1,152,827)Net Cash Provided By (Used In)Financing Activities (1,219,420) (1,219,500) (1,152,827)
Net Increase (Decrease) in Cash Held 249,069 (561,000) (2,303,045)Cash at Beginning of Year 9,264,584 8,863,600 11,567,629Cash and Cash Equivalents at the End of the Year 13(a) 9,513,653 8,302,600 9,264,584
This statement is to be read in conjunction with the accompanying notes.
Page 7

CITY OF NEDLANDSRATE SETTING STATEMENT
FOR THE YEAR ENDED 30TH JUNE 2014
2014 2014 2013NOTE Actual Budget Actual
$ $ $RevenueGovernance 388,732 147,900 203,178General Purpose Funding 1,233,931 1,841,800 1,759,457Law, Order, Public Safety 103,926 72,200 60,664Health 157,183 62,800 95,309Education and Welfare 1,658,674 1,431,000 1,362,059Community Amenities 4,261,633 4,405,100 4,167,728Recreation and Culture 792,440 902,700 903,305Transport 888,414 2,430,400 1,174,925Economic Services 880,323 719,100 578,153Other Property and Services 104,678 108,400 35,480
10,469,934 12,121,400 10,340,258ExpensesGovernance (2,509,931) (1,821,100) (1,786,060)General Purpose Funding (545,644) (469,400) (570,459)Law, Order, Public Safety (944,863) (935,100) (873,666)Health (558,257) (431,100) (418,897)Education and Welfare (2,112,326) (2,414,200) (2,509,624)Community Amenities (4,969,292) (5,594,000) (5,286,980)Recreation and Culture (7,294,138) (7,066,000) (7,246,473)Transport (4,656,794) (4,809,000) (4,576,164)Economic Services (3,783,920) (3,626,200) (3,554,070)Other Property and Services (409,646) (945,700) (281,547)
(27,784,811) (28,111,800) (27,103,940)
Net Result Excluding Rates (17,314,877) (15,990,400) (16,763,682)
Adjustments for Cash Budget Requirements:
(Profit)/Loss on Asset Disposals 20 (72,603) (73,800) (20,439)Movement in Deferred Pensioner Rates (Non-Current) (18,650) - (26,882)Movement in Employee Benefit Provisions (Non-current) (41,815) - 110,300Depreciation and Amortisation on Assets 2(a) 5,165,836 5,169,800 4,843,963Capital Expenditure and Revenue
Purchase Land and Buildings 6(a) (307,680) (229,000) (2,518,323)Purchase Furniture and Equipment 6(a) (678,812) (398,000) (131,486)Purchase Plant and Equipment 6(a) (1,024,072) (906,500) (394,754)Purchase Infrastructure Assets - Roads 7(a) (3,139,150) (5,617,300) (2,366,319)Purchase Infrastructure Assets - Footpaths 7(a) (176,659) - - Purchase Infrastructure Assets - Drainage 7(a) (311,214) - - Purchase Infrastructure Assets - Parks, Gardens & Reserves 7(a) (951,281) (1,486,400) (1,210,184)Purchase Infrastructure Assets - Street Furniture 7(a) (125,762) - - Proceeds from Disposal of Fixed Assets 20 421,715 407,400 154,782Repayment of Debentures 21(a) (1,219,420) (1,219,500) (1,152,827)Transfers to Reserves (Restricted Assets) 11 (314,233) (102,100) (305,937)Transfers from Reserves (Restricted Assets) 11 158,200 200,000 1,709,684
ADD Estimated Surplus/(Deficit) July 1 B/Fwd 22(b) 3,505,091 1,448,900 3,676,886LESS Estimated Surplus/(Deficit) June 30 C/Fwd 22(b) 2,694,642 542,000 3,505,091
Total Amount Raised from General Rate 22(a) (19,140,028) (19,338,900) (17,900,309)
This statement is to be read in conjunction with the accompanying notes.
Page 8
CITY OF NEDLANDSNOTES TO AND FORMING PART OF THE FINANCIAL REPORT
FOR THE YEAR ENDED 30TH JUNE 2014
1. SUMMARY OF SIGNIFICANT ACCOUNTING POLICIES
(a) Basis of PreparationThe financial report comprises general purpose financial statements which have been prepared in accordance with Australian Accounting Standards (as they apply to local governments and not-for-profit entities), Australian Accounting Interpretations, other authoritative pronouncements of the Australian Accounting Standards Board, the Local Government Act 1995 and accompanying regulations. Material accounting policies which have been adopted in the preparation of this financial report are presented below and have beenconsistently applied unless stated otherwise.
Except for cash flow and rate setting information, the report has also been prepared on the accrual basis and is based on historical costs, modified, where applicable, by the measurement at fair value of selected non-current assets, financial assets and liabilities.
Critical Accounting EstimatesThe preparation of a financial report in conformity with Australian Accounting Standards requires management to make judgements, estimates and assumptions that effect the application of policies and reported amounts of assets and liabilities, income and expenses.
The estimates and associated assumptions are based on historical experience and various other factors that are believed to be reasonable under the circumstances; the results of which form the basis of making the judgements about carrying values of assets and liabilities that are not readily apparent from other sources. Actual results may differ from these estimates.
The Local Government Reporting EntityAll Funds through which the City controls resources to carry on its functions have been included in the financial statements forming part of this financial report.
In the process of reporting on the local government as a single unit, all transactions and balances between those Funds (for example, loans and transfers between Funds) have been eliminated.
All monies held in the Trust Fund are excluded from the financial statements. A separate statement ofthose monies appears at Note 19. to these financial statements.
(b) Goods and Services Tax (GST)Revenues, expenses and assets are recognised net of the amount of GST, except where the amount of GST incurred is not recoverable from the Australian Taxation Office (ATO).
Receivables and payables are stated inclusive of GST receivable or payable.The net amount of GST recoverable from, or payable to, the ATO is included with receivables or payables in the statement of financial position.
Cash flows are presented on a gross basis. The GST components of cash flows arising from investing or financing activities which are recoverable from, or payable to, the ATO are presented as operatingcash flows.
(c) Cash and Cash EquivalentsCash and cash equivalents include cash on hand, cash at bank, deposits available on demand with banks and other short term highly liquid investments that are readily convertible to known amounts of cash and which are subject to an insignificant risk of changes in value and bank overdrafts.
Bank overdrafts are reported as short term borrowings in current liabilities in the statement of financial position.
Page 9

CITY OF NEDLANDSNOTES TO AND FORMING PART OF THE FINANCIAL REPORT
FOR THE YEAR ENDED 30TH JUNE 2014
1. SUMMARY OF SIGNIFICANT ACCOUNTING POLICIES (Continued)
(d) Trade and Other ReceivablesTrade and other receivables include amounts due from ratepayers for unpaid rates and service charges and other amounts due from third parties for goods sold and services performed in the ordinary course of business.
Receivables expected to be collected within 12 months of the end of the reporting period are classified as current assets. All other receivables are classified as non-current assets.
Collectability of trade and other receivables is reviewed on an ongoing basis. Debts that are known to be uncollectible are written off when identified. An allowance for doubtful debts is raised when there is objective evidence that they will not be collectible.
(e) Inventories
GeneralInventories are measured at the lower of cost and net realisable value.
Net realisable value is the estimated selling price in the ordinary course of business less the estimated costs of completion and the estimated costs necessary to make the sale.
Land Held for SaleLand held for development and sale is valued at the lower of cost and net realisable value. Cost includes the cost of acquisition, development, borrowing costs and holding costs until completion of development.Finance costs and holding charges incurred after development is completed are expensed.
Gains and losses are recognised in profit or loss at the time of signing an unconditional contract of sale if significant risks and rewards, and effective control over the land, are passed on to the buyer at this point.
Land held for sale is classified as current except where it is held as non-current based on City’s intentions to release for sale.
(f) Property, Plant and Equipment and InfrastructureEach class of fixed assets within either property, plant and equipment or infrastructure, is carried at cost or fair value as indicated less, where applicable, any accumulated depreciation and impairment losses.
Mandatory Requirement to Revalue Non-Current AssetsEffective from 1 July 2012, the Local Government (Financial Management) Regulations were amended and the measurement of non-current assets at Fair Value became mandatory.
The amendments allow for a phasing in of fair value in relation to fixed assets over three years as follows:
(a) for the financial year ending on 30 June 2013, the fair value of all of the assets of the local government that are plant and equipment; and(b) for the financial year ending on 30 June 2014, the fair value of all of the assets of the local government - (i) that are plant and equipment; and (ii) that are - (I) land and buildings; or- (II) Infrastructure;and(c) for a financial year ending on or after 30 June 2015, the fair value of all of the assets of the local government.
Page 10
CITY OF NEDLANDSNOTES TO AND FORMING PART OF THE FINANCIAL REPORT
FOR THE YEAR ENDED 30TH JUNE 2014
1. SUMMARY OF SIGNIFICANT ACCOUNTING POLICIES (Continued)
(f) Property, Plant and Equipment and Infrastructure (Continued)
Mandatory Requirement to Revalue Non-Current Assets (Continued)Thereafter, in accordance with the regulations, each asset class must be revalued at least every 3 years.
The City has commenced the process of adopting Fair Value in accordance with the Regulations.
Relevant disclosures, in accordance with the requirements of Australian Accounting Standards, have been made in the financial report as necessary.
Land Under ControlIn accordance with Local Government (Financial Management) Regulation 16(a), the City was required to include as an asset (by 30 June 2013), Crown Land operated by the local government as a golf course,showground, racecourse or other sporting or recreational facility of State or Regional significance.
The City has two golf courses which have been leased to private clubs. They have been revalued along with other land in accordance with the other policies detailed in this Note during this financial year.
Initial Recognition and Measurement between Mandatory Revaluation DatesAll assets are initially recognised at cost and subsequently revalued in accordance with the mandatory measurement framework detailed above.
In relation to this initial measurement, cost is determined as the fair value of the assets given as consideration plus costs incidental to the acquisition. For assets acquired at no cost or for nominal consideration, cost is determined as fair value at the date of acquisition. The cost of non-current assets constructed by the City includes the cost of all materials used in construction, direct labour on the project and an appropriate proportion of variable and fixed overheads.
Individual assets acquired between initial recognition and the next revaluation of the asset class in accordance with the mandatory measurement framework detailed above, are carried at cost less accumulated depreciation as management believes this approximates fair value. They will be subject to subsequent revaluation at the next anniversary date in accordance with the mandatory measurement framework detailed above.
RevaluationIncreases in the carrying amount arising on revaluation of assets are credited to a revaluation surplus in equity. Decreases that offset previous increases of the same asset are recognised against revaluation surplus directly in equity. All other decreases are recognised in profit or loss.
Transitional ArrangementsDuring the time it takes to transition the carrying value of non-current assets from the cost approach to the fair value approach, the City may still be utilising both methods across differing asset classes.
Those assets carried at cost will be carried in accordance with the policy detailed in the Initial Recognition section as detailed above.
Those assets carried at fair value will be carried in accordance with the Revaluation Methodologysection as detailed above.
Early Adoption of AASB 13 - Fair Value MeasurementWhilst the new accounting standard in relation to Fair Value, AASB 13 – Fair Value Measurement onlybecome applicable for the year ended 30 June 2014 (in relation to City), given the legislative need to commence using Fair Value methodology in the previous reporting period (year ended 30 June 2013) the City chose to early adopt AASB 13.
Page 11

CITY OF NEDLANDSNOTES TO AND FORMING PART OF THE FINANCIAL REPORT
FOR THE YEAR ENDED 30TH JUNE 2014
1. SUMMARY OF SIGNIFICANT ACCOUNTING POLICIES (Continued)
(f) Property, Plant and Equipment and Infrastructure (Continued)
Land Under RoadsIn Western Australia, all land under roads is Crown Land, the responsibility for managing which, is vested in the local government.
Effective as at 1 July 2008, City elected not to recognise any value for land under roads acquired on or before 30 June 2008. This accords with the treatment available in Australian Accounting Standard AASB 1051 Land Under Roads and the fact Local Government (Financial Management) Regulation 16(a)(i) prohibits local governments from recognising such land as an asset.
In respect of land under roads acquired on or after 1 July 2008, as detailed above, Local Government (Financial Management) Regulation 16(a)(i) prohibits local governments from recognising such land as an asset.
Whilst such treatment is inconsistent with the requirements of AASB 1051, Local Government (Financial Management) Regulation 4(2) provides, in the event of such an inconsistency, the Local Government (Financial Management) Regulations prevail.
Consequently, any land under roads acquired on or after 1 July 2008 is not included as an asset of the City.
DepreciationThe depreciable amount of all fixed assets including buildings but excluding freehold land, are depreciated on a straight-line basis over the individual asset’s useful life from the time the asset is held ready for use. Leasehold improvements are depreciated over the shorter of either the unexpired period of the lease or the estimated useful life of the improvements.
When an item of property, plant and equipment is revalued, any accumulated depreciation at the date of the revaluation is eliminated against the gross carrying amount of the asset and the net amountrestated to the revalued amount of the asset.
Major depreciation periods used for each class of depreciable asset are:
Buildings 40 yearsFurniture and Equipment 4 to 10 yearsPlant and Equipment 5 to 15 yearsSealed roads and streets formation not depreciated pavement 50 years seal - bituminous / asphalt 20 yearsGravel roads formation not depreciated pavement 50 years gravel sheet 12 yearsFormed roads formation not depreciated pavement 50 yearsFootpaths - slab 20 yearsSewerage piping 100 yearsWater supply piping and drainage systems 75 years
The assets residual values and useful lives are reviewed, and adjusted if appropriate, at the end of each reporting period.
Page 12
CITY OF NEDLANDSNOTES TO AND FORMING PART OF THE FINANCIAL REPORT
FOR THE YEAR ENDED 30TH JUNE 2014
1. SUMMARY OF SIGNIFICANT ACCOUNTING POLICIES (Continued)
(f) Property, Plant and Equipment and Infrastructure (Continued)
Depreciation (Continued)An asset's carrying amount is written down immediately to its recoverable amount if the asset's carryingamount is greater than its estimated recoverable amount.
Gains and losses on disposals are determined by comparing proceeds with the carrying amount. These gains and losses are included in the statement of comprehensive income in the period in whichthey arise.
When revalued assets are disposed of, amounts included in the revaluation surplus relating to that asset are transferred to retained surplus.
Capitalisation ThresholdExpenditure on items of equipment under $1,000 is not capitalised. Rather, it is recorded on an asset inventory listing.
(g) Fair Value of Assets and LiabilitiesWhen performing a revaluation, the City uses a mix of both independent and management valuationsusing the following as a guide:
Fair Value is the price that City would receive to sell the asset or would have to pay to transfer a liability,in an orderly (i.e. unforced) transaction between independent, knowledgeable and willing market participantsat the measurement date.
As fair value is a market-based measure, the closest equivalent observable market pricing information is used to determine fair value. Adjustments to market values may be made having regard to the characteristicsof the specific asset. The fair values of assets that are not traded in an active market are determined usingone or more valuation techniques. These valuation techniques maximise, to the extent possible, the use of observable market data.
To the extent possible, market information is extracted from either the principal market for the asset (i.e. the market with the greatest volume and level of activity for the asset or, in the absence of such a market, the most advantageous market available to the entity at the end of the reporting period (i.e. the market that maximises the receipts from the sale of the asset after taking into account transaction costs and transport costs).
Fair Value HierarchyAASB 13 requires the disclosure of fair value information by level of the fair value hierarchy, which categorisesfair value measurement into one of three possible levels based on the lowest level that an input that is significant to the measurement can be categorised into as follows:
Level 1Measurements based on quoted prices (unadjusted) in active markets for identical assets or liabilities that the entity can access at the measurement date.
Level 2Measurements based on inputs other than quoted prices included in Level 1 that are observable for the asset or liability, either directly or indirectly.
Level 3Measurements based on unobservable inputs for the asset or liability.
Page 13
CITY OF NEDLANDSNOTES TO AND FORMING PART OF THE FINANCIAL REPORT
FOR THE YEAR ENDED 30TH JUNE 2014
1. SUMMARY OF SIGNIFICANT ACCOUNTING POLICIES (Continued)
(g) Fair Value of Assets and Liabilities (Continued)
Fair Value Hierarchy (Continued)The fair values of assets and liabilities that are not traded in an active market are determined using one or more valuation techniques. These valuation techniques maximise, to the extent possible, the use of observable market data. If all significant inputs required to measure fair value are observable, the asset or liability is included in Level 2. If one or more significant inputs are not based on observable market data, the asset or liability is included in Level 3.
Valuation techniquesThe City selects a valuation technique that is appropriate in the circumstances and for which sufficient data is available to measure fair value. The availability of sufficient and relevant data primarily depends on the specific characteristics of the asset or liability being measured. The valuation techniques selected by the City are consistent with one or more of the following valuation approaches:
Market approachValuation techniques that use prices and other relevant information generated by market transactions for identical or similar assets or liabilities.Income approachValuation techniques that convert estimated future cash flows or income and expenses into a single discounted present value.
Cost approachValuation techniques that reflect the current replacement cost of an asset at its current service capacity.
Each valuation technique requires inputs that reflect the assumptions that buyers and sellers would use when pricing the asset or liability, including assumptions about risks. When selecting a valuation technique, the City gives priority to those techniques that maximise the use of observable inputs and minimise the use of unobservable inputs. Inputs that are developed using market data (such as publicly available information on actual transactions) and reflect the assumptions that buyers and sellers would generally use when pricing the asset or liability and considered observable, whereas inputs for which market data is not available and therefore are developed using the best information available about such assumptions are considered unobservable.
As detailed above, the mandatory measurement framework imposed by the Local Government (Financial Management) Regulations requires, as a minimum, all assets carried at a revalued amount to be revalued at least every 3 years.
(h) Financial Instruments
Initial Recognition and MeasurementFinancial assets and financial liabilities are recognised when the City becomes a party to the contractual provisions to the instrument. For financial assets, this is equivalent to the date that the City commits itself to either the purchase or sale of the asset (i.e. trade date accounting is adopted).
Financial instruments are initially measured at fair value plus transaction costs, except where the instrument is classified 'at fair value through profit or loss', in which case transaction costs are expensed to profit or loss immediately.
Classification and Subsequent MeasurementFinancial instruments are subsequently measured at fair value, amortised cost using the effective interest rate method, or at cost.
Page 14

CITY OF NEDLANDSNOTES TO AND FORMING PART OF THE FINANCIAL REPORT
FOR THE YEAR ENDED 30TH JUNE 2014
1. SUMMARY OF SIGNIFICANT ACCOUNTING POLICIES (Continued)
(h) Financial Instruments (Continued)
Classification and Subsequent Measurement (Continued)
Amortised cost is calculated as:
(a) the amount in which the financial asset or financial liability is measured at initial recognition;
(b) less principal repayments and any reduction for impairment; and
(c) plus or minus the cumulative amortisation of the difference, if any, between the amount initially recognised and the maturity amount calculated using the effective interest rate method.
The effective interest method is used to allocate interest income or interest expense over the relevant period and is equivalent to the rate that discounts estimated future cash payments or receipts (including fees, transaction costs and other premiums or discounts) through the expected life (or when this cannot be reliably predicted, the contractual term) of the financial instrument to the net carrying amount of the financial asset or financial liability. Revisions to expected future net cash flows will necessitate an adjustment to the carrying value with a consequential recognition of an income or expense in profit or loss.
(i) Financial assets at fair value through profit and loss Financial assets are classified at “fair value through profit or loss” when they are held for trading for the purpose of short-term profit taking. Such assets are subsequently measured at fair value with changes in carrying amount being included in profit or loss. Assets in this category are classified as current assets.
(ii) Loans and receivables Loans and receivables are non-derivative financial assets with fixed or determinable payments that are not quoted in an active market and are subsequently measured at amortised cost. Gains or losses are recognised in profit or loss.
Loans and receivables are included in current assets where they are expected to mature within 12 months after the end of the reporting period.
(iii) Held-to-maturity investments Held-to-maturity investments are non-derivative financial assets with fixed maturities and fixed or determinable payments that the City has the positive intention and ability to hold to maturity. They are subsequently measured at amortised cost. Gains or losses are recognised in profit or loss.
Held-to-maturity investments are included in non-current assets, where they are expected to mature within 12 months after the end of the reporting period. All other investments are classified as non-current.
(iv) Available-for-sale financial assets Available-for-sale financial assets are non-derivative financial assets that are either not suitable to be classified into other categories of financial assets due to their nature, or they are designated as such by management. They comprise investments in the equity of other entities where there is neither a fixed maturity nor fixed or determinable payments.
They are subsequently measured at fair value with changes in such fair value (i.e. gains or losses) recognised in other comprehensive income (except for impairment losses). When the financial asset is derecognised, the cumulative gain or loss pertaining to that asset previously recognised in other comprehensive income is reclassified into profit or loss.
Page 15

CITY OF NEDLANDSNOTES TO AND FORMING PART OF THE FINANCIAL REPORT
FOR THE YEAR ENDED 30TH JUNE 2014
1. SUMMARY OF SIGNIFICANT ACCOUNTING POLICIES (Continued)
(h) Financial Instruments (Continued)
Classification and Subsequent Measurement (Continued)
Available-for-sale financial assets are included in current assets, where they are expected to be sold within 12 months after the end of the reporting period. All other available-for-sale financial assets are classified as non-current.
(v) Financial liabilitiesNon-derivative financial liabilities (excluding financial guarantees) are subsequently measured at amortised cost. Gains or losses are recognised in profit or loss.
ImpairmentA financial asset is deemed to be impaired if, and only if, there is objective evidence of impairment asa result of one or more events (a “loss event”) having occurred, which will have an impact on the estimated future cash flows of the financial asset(s).
In the case of available-for-sale financial assets, a significant or prolonged decline in the market value of the instrument is considered a loss event. Impairment losses are recognised in profit or loss immediately. Also, any cumulative decline in fair value previously recognised in other comprehensive income is reclassified to profit or loss at this point.
In the case of financial assets carried at amortised cost, loss events may include: indications that the debtors or a group of debtors are experiencing significant financial difficulty, default or delinquency in interest or principal payments; indications that they will enter bankruptcy or other financial reorganisation; and changes in arrears or economic conditions that correlate with defaults.
For financial assets carried at amortised cost (including loans and receivables), a separate allowance account is used to reduce the carrying amount of financial assets impaired by credit losses. After having taken all possible measures of recovery, if management establishes that the carrying amount cannot be recovered by any means, at that point the written-off amounts are charged to the allowance account or the carrying amount of impaired financial assets is reduced directly if no impairment amount was previously recognised in the allowance account.
DerecognitionFinancial assets are derecognised where the contractual rights to receipt of cash flows expire or theasset is transferred to another party whereby the City no longer has any significant continual
involvement in the risks and benefits associated with the asset.
Financial liabilities are derecognised where the related obligations are discharged, cancelled or expired. The difference between the carrying amount of the financial liability extinguished or transferred to another party and the fair value of the consideration paid, including the transfer of non-cash assets or liabilities assumed, is recognised in profit or loss.
(i) Impairment of AssetsIn accordance with Australian Accounting Standards the City's assets, other than inventories,are assessed at each reporting date to determine whether there is any indication they may be impaired.
Where such an indication exists, an impairment test is carried out on the asset by comparing the recoverable amount of the asset, being the higher of the asset's fair value less costs to sell and value in use, to the asset's carrying amount.
Page 16
CITY OF NEDLANDSNOTES TO AND FORMING PART OF THE FINANCIAL REPORT
FOR THE YEAR ENDED 30TH JUNE 2014
1. SUMMARY OF SIGNIFICANT ACCOUNTING POLICIES (Continued)
(i) Impairment of Assets (Continued)Any excess of the asset's carrying amount over its recoverable amount is recognised immediately in profit or loss, unless the asset is carried at a revalued amount in accordance with another standard (e.g. AASB 116) whereby any impairment loss of a revalued asset is treated as a revaluation decrease in accordance with that other standard.
For non-cash generating assets such as roads, drains, public buildings and the like, value in use isrepresented by the depreciated replacement cost of the asset.
(j) Trade and Other PayablesTrade and other payables represent liabilities for goods and services provided to the City prior to the end of the financial year that are unpaid and arise when the City becomes obliged to make future payments in respect of the purchase of these goods and services. The amounts are unsecured, are recognised as a current liability and are normally paid within 30 days of recognition.
(k) Employee BenefitsShort-Term Employee Benefits Provision is made for the City’s obligations for short-term employee benefits. Short-term employee benefits are benefits (other than termination benefits) that are expected to be settled wholly before 12 months after the end of the annual reporting period in which the employees render the related service, including wages, salaries and sick leave. Short-term employee benefits are measured at the (undiscounted) amounts expected to be paid when the obligation is settled.
The City’s obligations for short-term employee benefits such as wages, salaries and sick leave are recognised as a part of current trade and other payables in the statement of financial position. The City’s obligations for employees’ annual leave and long service leave entitlements are recognised as provisions in the statement of financial position.
Other Long-Term Employee BenefitsProvision is made for employees’ long service leave and annual leave entitlements not expected to be settled wholly within 12 months after the end of the annual reporting period in which the employees render the related service. Other long-term employee benefits are measured at the present value of the expected future payments to be made to employees. Expected future payments incorporate anticipated future wage and salary levels, durations or service and employee departures and are discounted at rates determined by reference to market yields at the end of the reporting period on government bonds that have maturity dates that approximate the terms of the obligations. Any remeasurements for changes in assumptions of obligations for other long-term employee benefits are recognised in profit or loss in the periods in which the changes occur.
The City’s obligations for long-term employee benefits are presented as non-current provisions in its statement of financial position, except where the City does not have an unconditional right to defer settlement for at least 12 months after the end of the reporting period, in which case the obligations are presented as current provisions.
(l) Borrowing CostsBorrowing costs are recognised as an expense when incurred except where they are directly attributable to the acquisition, construction or production of a qualifying asset. Where this is the case, they are capitalised as part of the cost of the particular asset until such time as the asset is substantially ready for its intended use or sale.
Page 17

CITY OF NEDLANDSNOTES TO AND FORMING PART OF THE FINANCIAL REPORT
FOR THE YEAR ENDED 30TH JUNE 2014
1. SUMMARY OF SIGNIFICANT ACCOUNTING POLICIES (Continued)
(m) ProvisionsProvisions are recognised when the City has a present legal or constructive obligation, as a result of past events, for which it is probable that an outflow of economic benefits will result and that outflow can be reliably measured.
Provisions are measured using the best estimate of the amounts required to settle the obligation at the end of the reporting period.
(n) LeasesLeases of fixed assets where substantially all the risks and benefits incidental to the ownership of the asset, but not legal ownership, are transferred to the City, are classified as finance leases.
Finance leases are capitalised recording an asset and a liability at the lower amounts equal to the fair value of the leased property or the present value of the minimum lease payments, including anyguaranteed residual values. Lease payments are allocated between the reduction of the lease liabilityand the lease interest expense for the period.
Leased assets are depreciated on a straight line basis over the shorter of their estimated useful lives or the lease term.
Lease payments for operating leases, where substantially all the risks and benefits remain with thelessor, are charged as expenses in the periods in which they are incurred.
Lease incentives under operating leases are recognised as a liability and amortised on a straight linebasis over the life of the lease term.
(o) Investment in AssociatesAn associate is an entity over which the City has significant influence. Significant influence is the power to participate in the financial operating policy decisions of that entity but is not control or joint control of those policies. Investments in associates are accounted for in the financial statements by applying the equity method of accounting, whereby the investment is initially recognised at cost and adjusted thereafter for the post-acquisition change in the City’s share of net assets of the associate.
The carrying amount of the investment includes, where applicable, goodwill relating to the associate. Any discount on acquisition, whereby the City’s share of the net fair value of the associate exceeds the cost of investment, is recognised in profit or loss in the period in which the investment is acquired.
Profits and losses resulting from transactions between the City and the associate are eliminated to the extent of the City’s interest in the associate.
When the City’s share of losses in an associate equals or exceeds its interest in the associate, the City discontinues recognising its share of further losses unless it has incurred legal or constructive obligations or made payments on behalf of the associate. When the associate subsequently makes profits, the City will resume recognising its share of those profits once its share of the profits equals the share of the losses not recognised.
In addition, the City’s share of the profit or loss of the associate is included in the City’s profit or loss.
Page 18

CITY OF NEDLANDSNOTES TO AND FORMING PART OF THE FINANCIAL REPORT
FOR THE YEAR ENDED 30TH JUNE 2014
1. SUMMARY OF SIGNIFICANT ACCOUNTING POLICIES (Continued)
(p) Interests in Joint ArrangementsJoint arrangements represent the contractual sharing of control between parties in a business venture where unanimous decisions about relevant activities are required.
Separate joint venture entities providing joint venturers with an interest to net assets are classified as a joint venture and accounted for using the equity method. Refer to note 1(o) for a description of the equity method of accounting.
Joint venture operations represent arrangements whereby joint operators maintain direct interests in each asset and exposure to each liability of the arrangement. The City’s interests in the assets, liabilities, revenue and expenses of joint operations are included in the respective line items of the financial statements. The City has not entered into any joint venture arrangements.
(q) Rates, Grants, Donations and Other ContributionsRates, grants, donations and other contributions are recognised as revenues when the local government obtains control over the assets comprising the contributions.
Control over assets acquired from rates is obtained at the commencement of the rating period or, where earlier, upon receipt of the rates.
Where contributions recognised as revenues during the reporting period were obtained on the condition that they be expended in a particular manner or used over a particular period, and those conditions were undischarged as at the reporting date, the nature of and amounts pertaining to 'those undischarged conditions are disclosed in Note 2(c). That note also discloses the amount of contributions recognised as revenues in a previous reporting period which were obtained in respect of the local government's operations for the current reporting period.
(r) SuperannuationThe City contributes to a number of Superannuation Funds on behalf of employees. All funds to which the City contributes are defined contribution plans.
(s) Current and Non-Current ClassificationIn the determination of whether an asset or liability is current or non-current, consideration is given to the time when each asset or liability is expected to be settled. The asset or liability is classified as current if it is expected to be settled within the next 12 months, being the City’s operational cycle. In the case of liabilities where the City does not have the unconditional right to defer settlement beyond 12 months, such as vested long service leave, the liability is classified as current even if not expected to be settled within the next 12 months. Inventories held for trading are classified as current even if not expected to be realised in the next 12 months except for land held for sale where it is held as non-current based on the City’s intentions to release for sale.
(t) Rounding Off FiguresAll figures shown in this annual financial report, other than a rate in the dollar, are rounded to the nearest dollar.
(u) Comparative FiguresWhere required, comparative figures have been adjusted to conform with changes in presentation for the current financial year.
When the City applies an accounting policy retrospectively, makes a retrospective restatement or reclassifies items in its financial statement, an additional (third) statement of financial position as at thebeginning of the preceding period in addition to the minimum comparative financial statements is presented.
(v) Budget Comparative FiguresUnless otherwise stated, the budget comparative figures shown in this annual financial report relate to the original budget estimate for the relevant item of disclosure.
Page 19
CIT
Y O
F N
ED
LA
ND
SN
OT
ES
TO
AN
D F
OR
MIN
G P
AR
T O
F T
HE
FIN
AN
CIA
L R
EP
OR
TF
OR
TH
E Y
EA
R E
ND
ED
30T
H J
UN
E 2
014
1.
SIG
NIF
ICA
NT
AC
CO
UN
TIN
G P
OL
ICIE
S (
Co
nti
nu
ed)
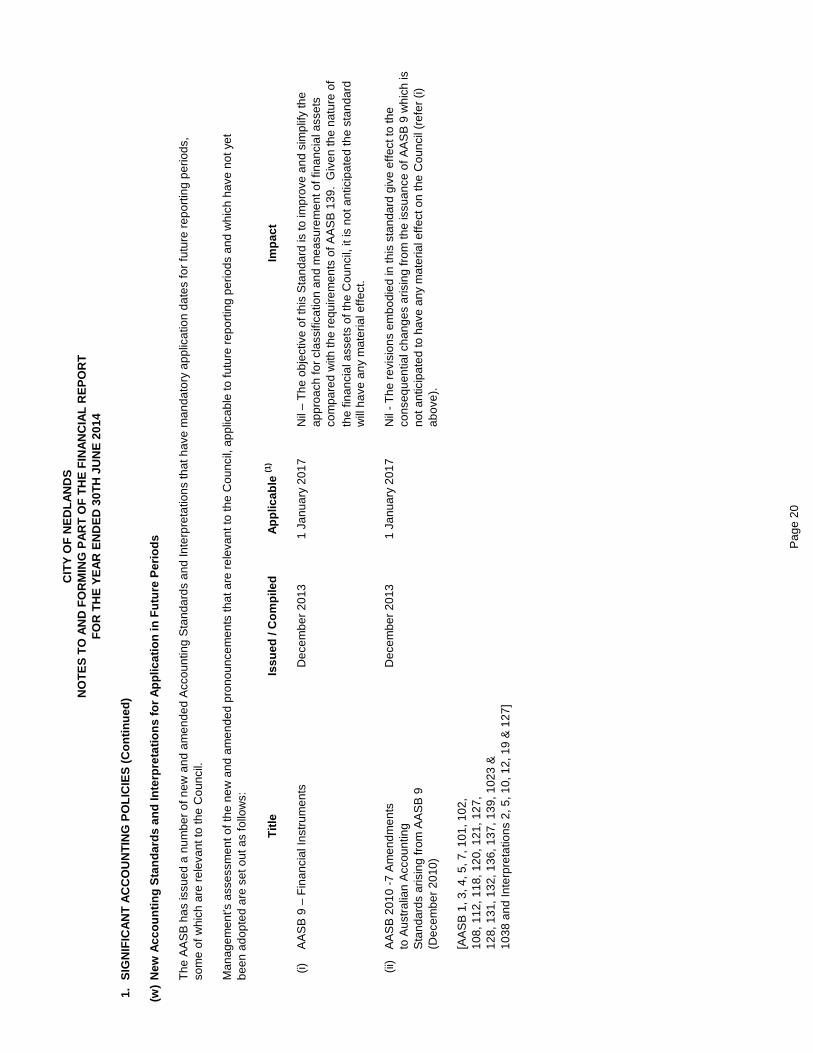
(w)
New
Acc
ou
nti
ng
Sta
nd
ard
s an
d In
terp
reta
tio
ns
for
Ap
plic
atio
n in
Fu
ture
Per
iod
s
Man
agem
ent's
ass
essm
ent o
f the
new
and
am
ende
d pr
onou
ncem
ents
that
are
rel
evan
t to
the
Cou
ncil,
app
licab
le to
futu
re r
epor
ting
perio
ds a
nd w
hich
hav
e no
t yet
been
ado
pted
are
set
out
as
follo
ws:
Tit
leIs
sued
/ C
om
pile
dA
pp
licab
le (1
)Im
pac
t
(i)
AA
SB
9 –
Fin
anci
al In
stru
men
tsD
ecem
ber
2013
1 Ja
nuar
y 20
17N
il –
The
obj
ectiv
e of
this
Sta
ndar
d is
to im
prov
e an
d si
mpl
ify th
e ap
proa
ch fo
r cl
assi
ficat
ion
and
mea
sure
men
t of f
inan
cial
ass
ets
com
pare
d w
ith th
e re
quire
men
ts o
f AA
SB
139
. G
iven
the
natu
re o
f th
e fin
anci
al a
sset
s of
the
Cou
ncil,
it is
not
ant
icip
ated
the
stan
dard
w
ill h
ave
any
mat
eria
l effe
ct.
(ii)
AA
SB
201
0 -7
Am
endm
ents
D
ecem
ber
2013
1 Ja
nuar
y 20
17N
il -
The
rev
isio
ns e
mbo
died
in th
is s
tand
ard
give
effe
ct to
the
to A
ustr
alia
n A
ccou
ntin
g co
nseq
uent
ial c
hang
es a
risin
g fr
om th
e is
suan
ce o
f AA
SB
9 w
hich
is
Sta
ndar
ds a
risin
g fr
om A
AS
B 9
no
t ant
icip
ated
to h
ave
any
mat
eria
l effe
ct o
n th
e C
ounc
il (r
efer
(i)
(Dec
embe
r 20
10)
abov
e).
[AA
SB
1, 3
, 4, 5
, 7, 1
01, 1
02,
108,
112
, 118
, 120
, 121
, 127
, 12
8, 1
31, 1
32, 1
36, 1
37, 1
39, 1
023
&
1038
and
Inte
rpre
tatio
ns 2
, 5, 1
0, 1
2, 1
9 &
127
]
The
AA
SB
has
issu
ed a
num
ber
of n
ew a
nd a
men
ded
Acc
ount
ing
Sta
ndar
ds a
nd In
terp
reta
tions
that
hav
e m
anda
tory
app
licat
ion
date
s fo
r fu
ture
rep
ortin
g pe
riods
,so
me
of w
hich
are
rel
evan
t to
the
Cou
ncil.
Pag
e 20
CIT
Y O
F N
ED
LA
ND
SN
OT
ES
TO
AN
D F
OR
MIN
G P
AR
T O
F T
HE
FIN
AN
CIA
L R
EP
OR
TF
OR
TH
E Y
EA
R E
ND
ED
30T
H J
UN
E 2
014
1.
SIG
NIF
ICA
NT
AC
CO
UN
TIN
G P
OL
ICIE
S (
Co
nti
nu
ed)
(w)
New
Acc
ou
nti
ng
Sta
nd
ard
s an
d In
terp
reta
tio
ns
for
Ap
plic
atio
n in
Fu
ture
Per
iod
s (C
on
tin
ued
)
Tit
leIs
sued
/ C
om
pile
dA
pp
licab
le (1
)Im
pac
t
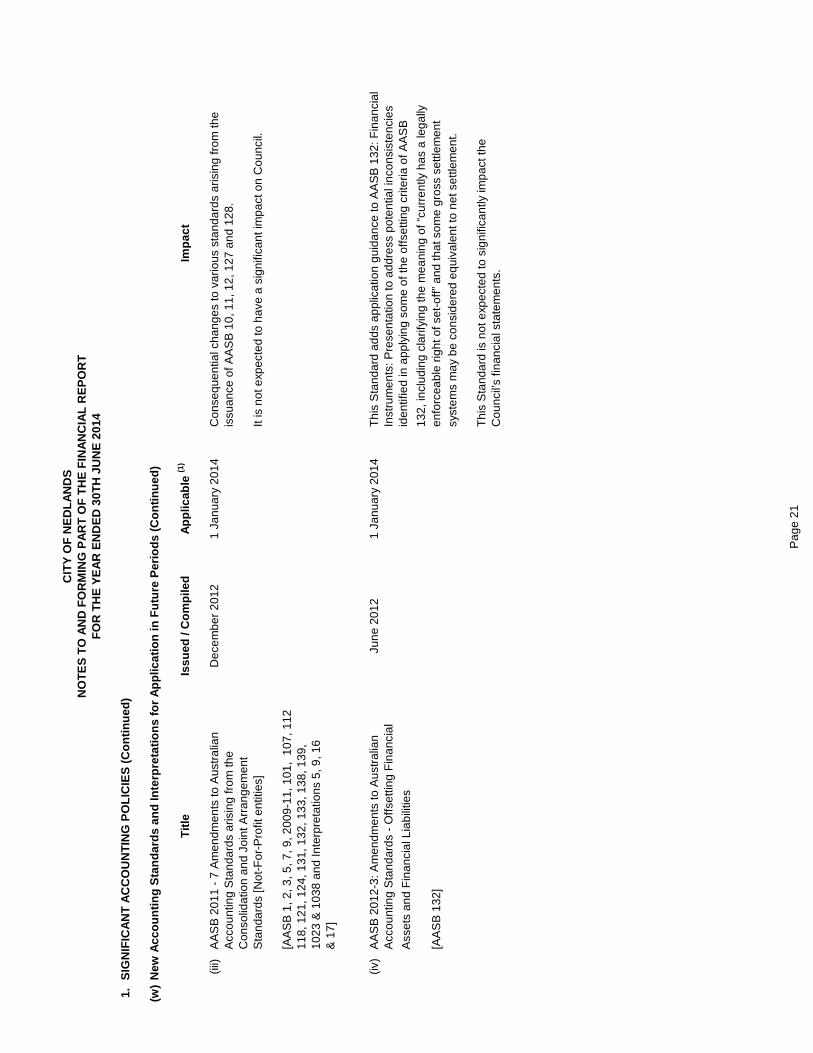
(iii)
AA
SB
201
1 -
7 A
men
dmen
ts to
Aus
tral
ian
Dec
embe
r 20
121
Janu
ary
2014
Con
sequ
entia
l cha
nges
to v
ario
us s
tand
ards
aris
ing
from
the
Acc
ount
ing
Sta
ndar
ds a
risin
g fr
om th
e is
suan
ce o
f AA
SB
10,
11,
12,
127
and
128
.C
onso
lidat
ion
and
Join
t Arr
ange
men
tS
tand
ards
[Not
-For
-Pro
fit e
ntiti
es]
It is
not
exp
ecte
d to
hav
e a
sign
ifica
nt im
pact
on
Cou
ncil.
[AA
SB
1, 2
, 3, 5
, 7, 9
, 200
9-11
, 101
, 10
7, 1
1211
8, 1
21, 1
24, 1
31, 1
32, 1
33, 1
38, 1
39,
1023
& 1
038
and
Inte
rpre
tatio
ns 5
, 9, 1
6&
17]
(iv)
AA
SB
201
2-3:
Am
endm
ents
to A
ustr
alia
nJu
ne 2
012
1 Ja
nuar
y 20
14T
his
Sta
ndar
d ad
ds a
pplic
atio
n gu
idan
ce to
AA
SB
132
: Fin
anci
al
Acc
ount
ing
Sta
ndar
ds -
Offs
ettin
g F
inan
cial
In
stru
men
ts: P
rese
ntat
ion
to a
ddre
ss p
oten
tial i
ncon
sist
enci
es
Ass
ets
and
Fin
anci
al L
iabi
litie
s id
entif
ied
in a
pply
ing
som
e of
the
offs
ettin
g cr
iteria
of A
AS
B
132,
incl
udin
g cl
arify
ing
the
mea
ning
of “
curr
ently
has
a le
gally
[A
AS
B 1
32]
enfo
rcea
ble
right
of s
et-o
ff” a
nd th
at s
ome
gros
s se
ttlem
ent
syst
ems
may
be
cons
ider
ed e
quiv
alen
t to
net s
ettle
men
t.
Thi
s S
tand
ard
is n
ot e
xpec
ted
to s
igni
fican
tly im
pact
the
Cou
ncil’
s fin
anci
al s
tate
men
ts.
Pag
e 21
CIT
Y O
F N
ED
LA
ND
SN
OT
ES
TO
AN
D F
OR
MIN
G P
AR
T O
F T
HE
FIN
AN
CIA
L R
EP
OR
TF
OR
TH
E Y
EA
R E
ND
ED
30T
H J
UN
E 2
014
1.
SIG
NIF
ICA
NT
AC
CO
UN
TIN
G P
OL
ICIE
S (
Co
nti
nu
ed)
(w)
New
Acc
ou
nti
ng
Sta
nd
ard
s an
d In
terp
reta
tio
ns
for
Ap
plic
atio
n in
Fu
ture
Per
iod
s (C
on
tin
ued
)
Tit
leIs
sued
/ C
om
pile
dA
pp
licab
le (1
)Im
pac
t
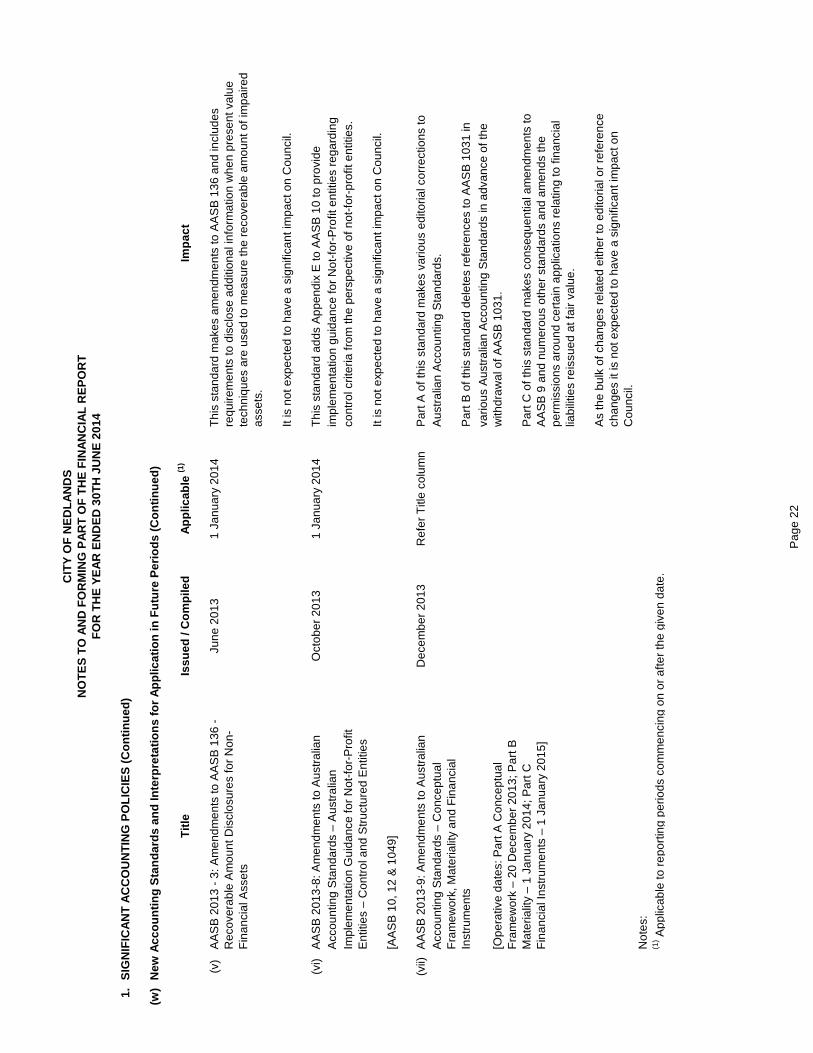
(v)
AA
SB
201
3 -
3: A
men
dmen
ts to
AA
SB
136
-
Rec
over
able
Am
ount
Dis
clos
ures
for
Non
-F
inan
cial
Ass
ets
June
201
31
Janu
ary
2014
Thi
s st
anda
rd m
akes
am
endm
ents
to A
AS
B 1
36 a
nd in
clud
es
requ
irem
ents
to d
iscl
ose
addi
tiona
l inf
orm
atio
n w
hen
pres
ent v
alue
te
chni
ques
are
use
d to
mea
sure
the
reco
vera
ble
amou
nt o
f im
paire
d as
sets
.
It is
not
exp
ecte
d to
hav
e a
sign
ifica
nt im
pact
on
Cou
ncil.
(vi)
AA
SB
201
3-8:
Am
endm
ents
to A
ustr
alia
n O
ctob
er 2
013
1 Ja
nuar
y 20
14T
his
stan
dard
add
s A
ppen
dix
E to
AA
SB
10
to p
rovi
de
Acc
ount
ing
Sta
ndar
ds –
Aus
tral
ian
impl
emen
tatio
n gu
idan
ce fo
r N
ot-f
or-P
rofit
ent
ities
reg
ardi
ng
Impl
emen
tatio
n G
uida
nce
for
Not
-for
-Pro
fit
cont
rol c
riter
ia fr
om th
e pe
rspe
ctiv
e of
not
-for
-pro
fit e
ntiti
es.
Ent
ities
– C
ontr
ol a
nd S
truc
ture
d E
ntiti
esIt
is n
ot e
xpec
ted
to h
ave
a si
gnifi
cant
impa
ct o
n C
ounc
il.[A
AS
B 1
0, 1
2 &
104
9]
(vii)
AA
SB
201
3-9:
Am
endm
ents
to A
ustr
alia
n D
ecem
ber
2013
Ref
er T
itle
colu
mn
Par
t A o
f thi
s st
anda
rd m
akes
var
ious
edi
toria
l cor
rect
ions
to
Acc
ount
ing
Sta
ndar
ds –
Con
cept
ual
Aus
tral
ian
Acc
ount
ing
Sta
ndar
ds.
Fra
mew
ork,
Mat
eria
lity
and
Fin
anci
al
Inst
rum
ents
Par
t B o
f thi
s st
anda
rd d
elet
es r
efer
ence
s to
AA
SB
103
1 in
vario
us A
ustr
alia
n A
ccou
ntin
g S
tand
ards
in a
dvan
ce o
f the
[O
pera
tive
date
s: P
art A
Con
cept
ual
with
draw
al o
f AA
SB
103
1.F
ram
ewor
k –
20 D
ecem
ber
2013
; Par
t B
Mat
eria
lity
– 1
Janu
ary
2014
; Par
t C
Par
t C o
f thi
s st
anda
rd m
akes
con
sequ
entia
l am
endm
ents
to
Fin
anci
al In
stru
men
ts –
1 J
anua
ry 2
015]
AA
SB
9 a
nd n
umer
ous
othe
r st
anda
rds
and
amen
ds th
e pe
rmis
sion
s ar
ound
cer
tain
app
licat
ions
rel
atin
g to
fina
ncia
l lia
bilit
ies
reis
sued
at f
air
valu
e.
As
the
bulk
of c
hang
es r
elat
ed e
ither
to e
dito
rial o
r re
fere
nce
chan
ges
it is
not
exp
ecte
d to
hav
e a
sign
ifica
nt im
pact
on
Cou
ncil.
Not
es:
(1) A
pplic
able
to r
epor
ting
perio
ds c
omm
enci
ng o
n or
afte
r th
e gi
ven
date
.
Pag
e 22
CIT
Y O
F N
ED
LA
ND
SN
OT
ES
TO
AN
D F
OR
MIN
G P
AR
T O
F T
HE
FIN
AN
CIA
L R
EP
OR
TF
OR
TH
E Y
EA
R E
ND
ED
30T
H J
UN
E 2
014
1.
SIG
NIF
ICA
NT
AC
CO
UN
TIN
G P
OL
ICIE
S (
Co
nti
nu
ed)
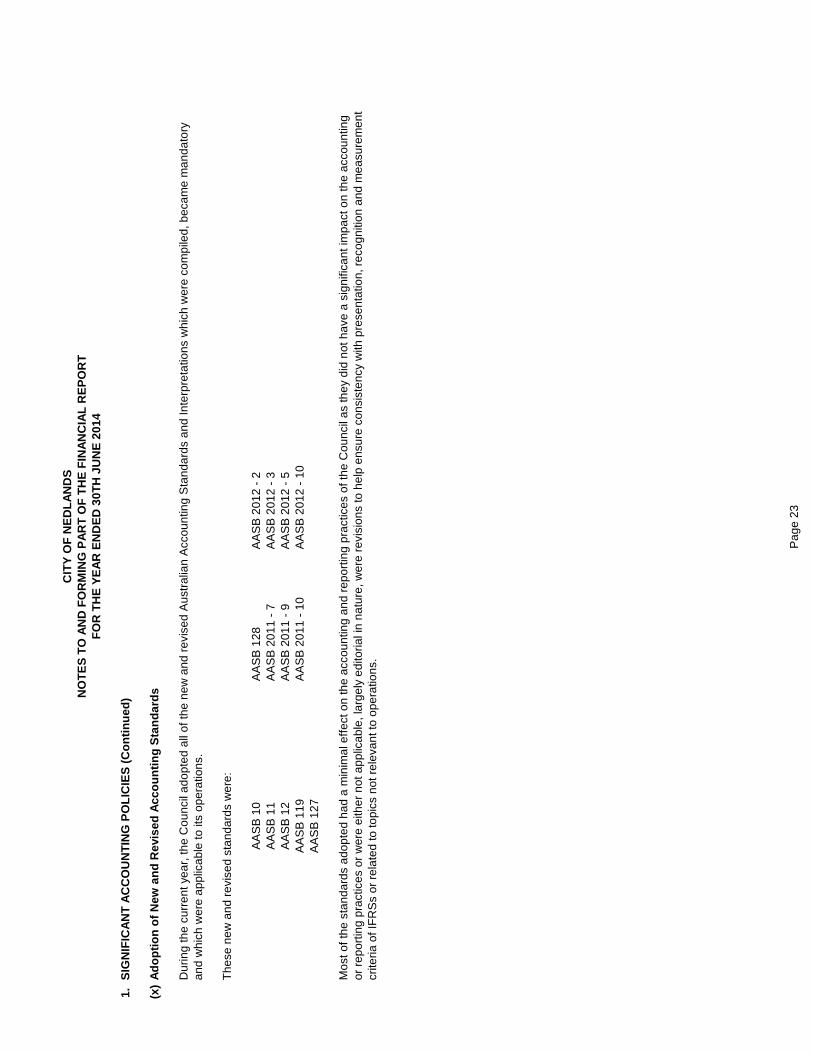
(x)
Ad
op
tio
n o
f N
ew a
nd
Rev
ised
Acc
ou
nti
ng
Sta
nd
ard
s
AA
SB
10
AA
SB
128
AA
SB
201
2 -
2A
AS
B 1
1A
AS
B 2
011
- 7
AA
SB
201
2 -
3A
AS
B 1
2A
AS
B 2
011
- 9
AA
SB
201
2 -
5A
AS
B 1
19A
AS
B 2
011
- 10
AA
SB
201
2 -
10A
AS
B 1
27
crite
ria o
f IF
RS
s or
rel
ated
to to
pics
not
rel
evan
t to
oper
atio
ns.
or r
epor
ting
prac
tices
or
wer
e ei
ther
not
app
licab
le, l
arge
ly e
dito
rial i
n na
ture
, wer
e re
visi
ons
to h
elp
ensu
re c
onsi
sten
cy w
ith p
rese
ntat
ion,
rec
ogni
tion
and
mea
sure
men
t
Dur
ing
the
curr
ent y
ear,
the
Cou
ncil
adop
ted
all o
f the
new
and
rev
ised
Aus
tral
ian
Acc
ount
ing
Sta
ndar
ds a
nd In
terp
reta
tions
whi
ch w
ere
com
pile
d, b
ecam
e m
anda
tory
The
se n
ew a
nd r
evis
ed s
tand
ards
wer
e:
Mos
t of t
he s
tand
ards
ado
pted
had
a m
inim
al e
ffect
on
the
acco
untin
g an
d re
port
ing
prac
tices
of t
he C
ounc
il as
they
did
not
hav
e a
sign
ifica
nt im
pact
on
the
acco
untin
g
and
whi
ch w
ere
appl
icab
le to
its
oper
atio
ns.
Pag
e 23
CITY OF NEDLANDSNOTES TO AND FORMING PART OF THE FINANCIAL REPORT
FOR THE YEAR ENDED 30TH JUNE 2014
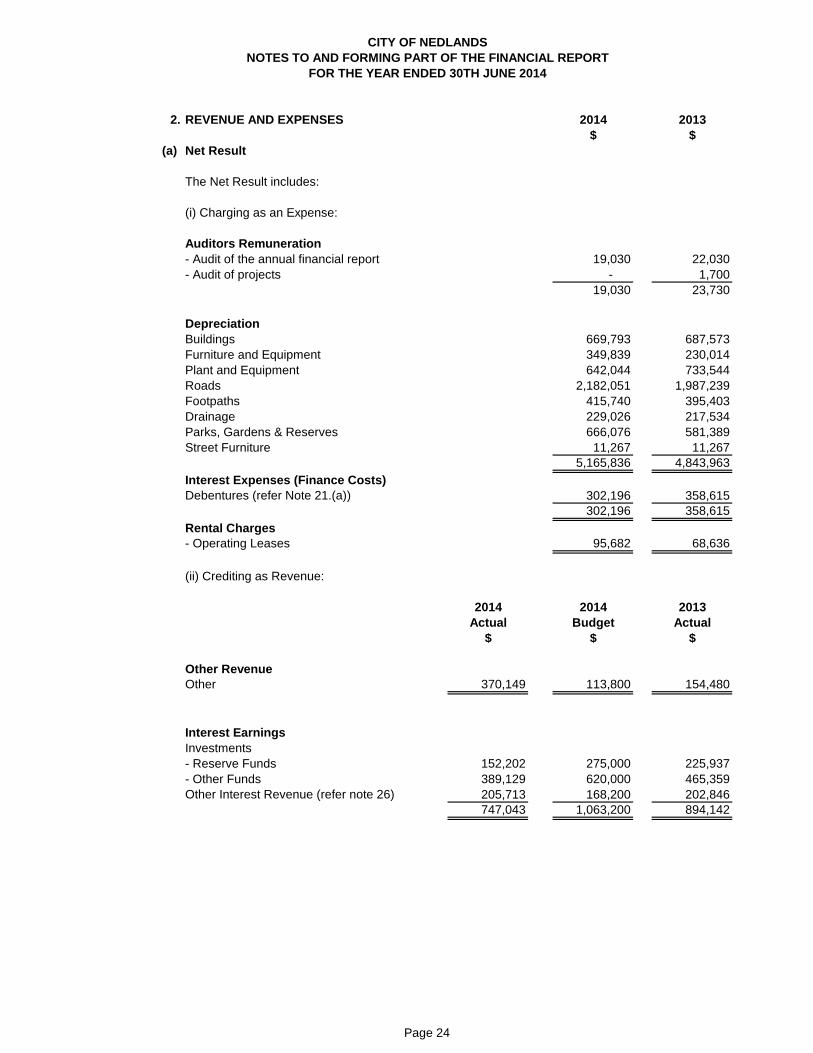
2. REVENUE AND EXPENSES 2014 2013$ $
(a) Net Result
The Net Result includes:
(i) Charging as an Expense:
Auditors Remuneration- Audit of the annual financial report 19,030 22,030- Audit of projects - 1,700
19,030 23,730
DepreciationBuildings 669,793 687,573Furniture and Equipment 349,839 230,014Plant and Equipment 642,044 733,544Roads 2,182,051 1,987,239Footpaths 415,740 395,403Drainage 229,026 217,534Parks, Gardens & Reserves 666,076 581,389Street Furniture 11,267 11,267
5,165,836 4,843,963Interest Expenses (Finance Costs)Debentures (refer Note 21.(a)) 302,196 358,615
302,196 358,615Rental Charges- Operating Leases 95,682 68,636
(ii) Crediting as Revenue:
2014 2014 2013Actual Budget Actual
$ $ $
Other RevenueOther 370,149 113,800 154,480
Interest EarningsInvestments- Reserve Funds 152,202 275,000 225,937- Other Funds 389,129 620,000 465,359Other Interest Revenue (refer note 26) 205,713 168,200 202,846
747,043 1,063,200 894,142
Page 24
CITY OF NEDLANDSNOTES TO AND FORMING PART OF THE FINANCIAL REPORT
FOR THE YEAR ENDED 30TH JUNE 2014
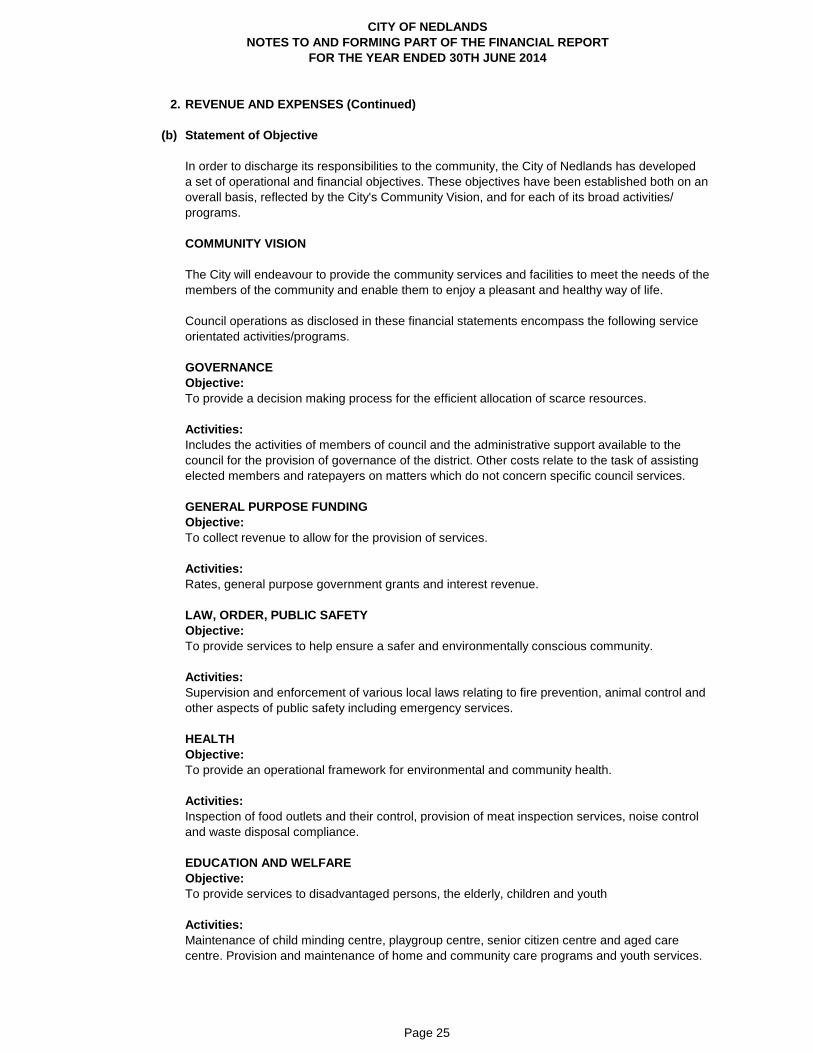
2. REVENUE AND EXPENSES (Continued)
(b) Statement of Objective
a set of operational and financial objectives. These objectives have been established both on an overall basis, reflected by the City's Community Vision, and for each of its broad activities/programs.
COMMUNITY VISION
members of the community and enable them to enjoy a pleasant and healthy way of life.
Council operations as disclosed in these financial statements encompass the following service orientated activities/programs.
GOVERNANCEObjective:
Activities:
GENERAL PURPOSE FUNDINGObjective:
Activities:
LAW, ORDER, PUBLIC SAFETYObjective:
Activities:
HEALTHObjective:
Activities:
EDUCATION AND WELFAREObjective:
Activities:
To provide a decision making process for the efficient allocation of scarce resources.
Includes the activities of members of council and the administrative support available to the
and waste disposal compliance.
centre. Provision and maintenance of home and community care programs and youth services.
In order to discharge its responsibilities to the community, the City of Nedlands has developed
The City will endeavour to provide the community services and facilities to meet the needs of the
Rates, general purpose government grants and interest revenue.
To provide services to help ensure a safer and environmentally conscious community.
Supervision and enforcement of various local laws relating to fire prevention, animal control and
To provide an operational framework for environmental and community health.
Inspection of food outlets and their control, provision of meat inspection services, noise control
council for the provision of governance of the district. Other costs relate to the task of assistingelected members and ratepayers on matters which do not concern specific council services.
other aspects of public safety including emergency services.
To collect revenue to allow for the provision of services.
To provide services to disadvantaged persons, the elderly, children and youth
Maintenance of child minding centre, playgroup centre, senior citizen centre and aged care
Page 25

CITY OF NEDLANDSNOTES TO AND FORMING PART OF THE FINANCIAL REPORT
FOR THE YEAR ENDED 30TH JUNE 2014
2. REVENUE AND EXPENSES (Continued)
(b) Statement of Objective (Continued)
COMMUNITY AMENITIESObjective:
Activities:
RECREATION AND CULTUREObjective:
being of the community.
Activities:
TRANSPORTObjective:
Activities:
ECONOMIC SERVICESObjective:
Activities:
OTHER PROPERTY AND SERVICESObjective:
Activities:
Tourism and area promotion including the maintenance and operation of a caravan park.
and traffic control. Cleaning of streets and maintenance of street trees, street lighting etc.
To provide services required by the community.
Rubbish collection services, operation of rubbish disposal sites, litter control, construction and
To establish and effectively manage infrastructure and resource which will help the social well
town planning schemes, cemetery and public conveniences.maintenance of urban storm water drains, protection of the environment and administration of
Maintenance of public halls, civic centres, aquatic centre, beaches, recreation centres and
To provide safe, effective and efficient transport services to the community.
various sporting facilities. Provision and maintenance of parks, gardens and playgrounds.Operation of library, museum and other cultural facilities.
Provision of rural services including weed control, vermin control and standpipes. Building
Private works operation, plant repair and operation costs and engineering operation costs.
To monitor and control council’s overheads operating accounts.
Control.
Construction and maintenance of roads, streets, footpaths, depots, cycleways, parking facilities
To help promote the shire and its economic wellbeing.
Page 26
CIT
Y O
F N
ED
LA
ND
SN
OT
ES
TO
AN
D F
OR
MIN
G P
AR
T O
F T
HE
FIN
AN
CIA
L R
EP
OR
TF
OR
TH
E Y
EA
R E
ND
ED
30T
H J
UN
E 2
014
2.R
EV
EN
UE
AN
D E
XP
EN
SE
S (
Co
nti
nu
ed)
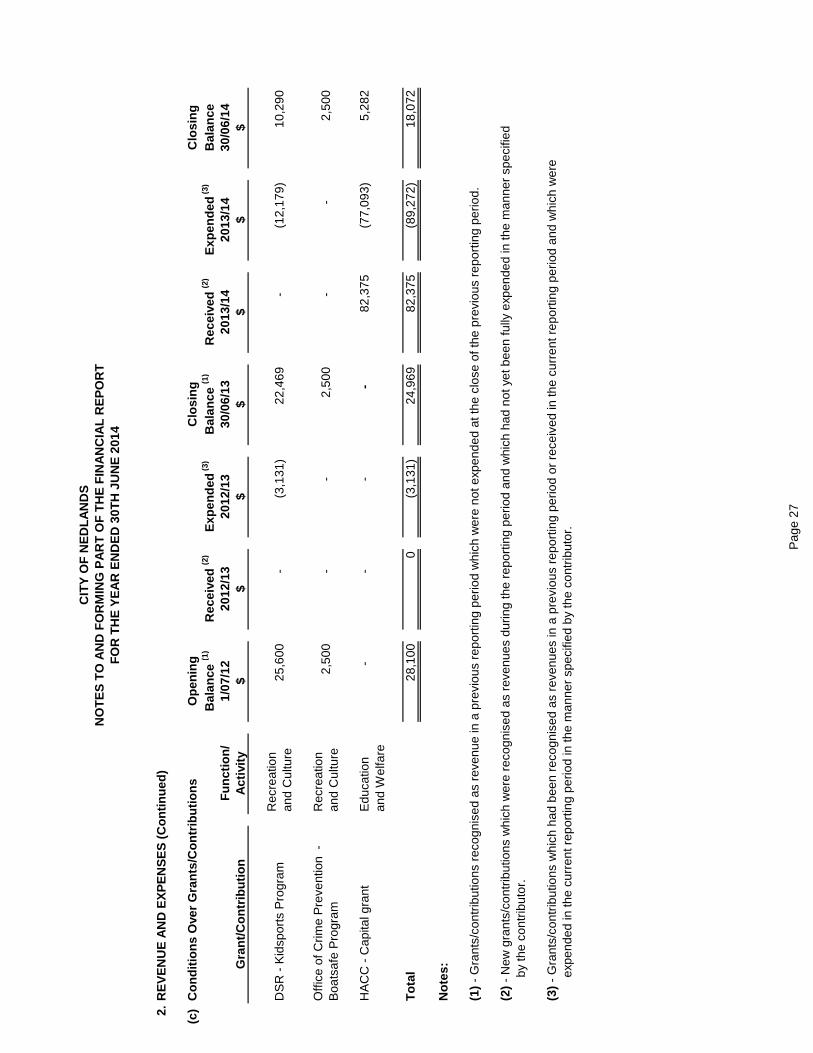
(c)
Co
nd
itio
ns
Ove
r G
ran
ts/C
on
trib
uti
on
sO
pen
ing
Clo
sin
gC
losi
ng
Bal
ance
(1)
Rec
eive
d (2
)E
xpen
ded
(3)
Bal
ance
(1)
Rec
eive
d (2
)E
xpen
ded
(3)
Bal
ance
Fu
nct
ion
/1/
07/1
220
12/1
320
12/1
330
/06/
1320
13/1
420
13/1
430
/06/
14G
ran
t/C
on
trib
uti
on
Act
ivit
y$
$$
$$
$$
DS
R -
Kid
spor
ts P
rogr
amR
ecre
atio
n an
d C
ultu
re25
,600
-
(3,1
31)
22,4
69-
(1
2,17
9)10
,290
Offi
ce o
f Crim
e P
reve
ntio
n -
B
oats
afe
Pro
gram
Rec
reat
ion
and
Cul
ture
2,50
0-
-
2,
500
-
-
2,50
0
HA
CC
- C
apita
l gra
ntE
duca
tion
-
-
-
-
82,3
75(7
7,09
3)5,
282
and
Wel
fare
To
tal
28,1
000
(3,1
31)
24,9
6982
,375
(89,
272)
18,0
72
No
tes:
(1)
- G
rant
s/co
ntrib
utio
ns r
ecog
nise
d as
rev
enue
in a
pre
viou
s re
port
ing
perio
d w
hich
wer
e no
t exp
ende
d at
the
clos
e of
the
prev
ious
rep
ortin
g pe
riod.
(2)
- N
ew g
rant
s/co
ntrib
utio
ns w
hich
wer
e re
cogn
ised
as
reve
nues
dur
ing
the
repo
rtin
g pe
riod
and
whi
ch h
ad n
ot y
et b
een
fully
exp
ende
d in
the
man
ner
spec
ified
by
the
cont
ribut
or.
(3)
- G
rant
s/co
ntrib
utio
ns w
hich
had
bee
n re
cogn
ised
as
reve
nues
in a
pre
viou
s re
port
ing
perio
d or
rec
eive
d in
the
curr
ent r
epor
ting
perio
d an
d w
hich
wer
e
e
xpen
ded
in th
e cu
rren
t rep
ortin
g pe
riod
in th
e m
anne
r sp
ecifi
ed b
y th
e co
ntrib
utor
.
Pag
e 27
CITY OF NEDLANDSNOTES TO AND FORMING PART OF THE FINANCIAL REPORT
FOR THE YEAR ENDED 30TH JUNE 2014
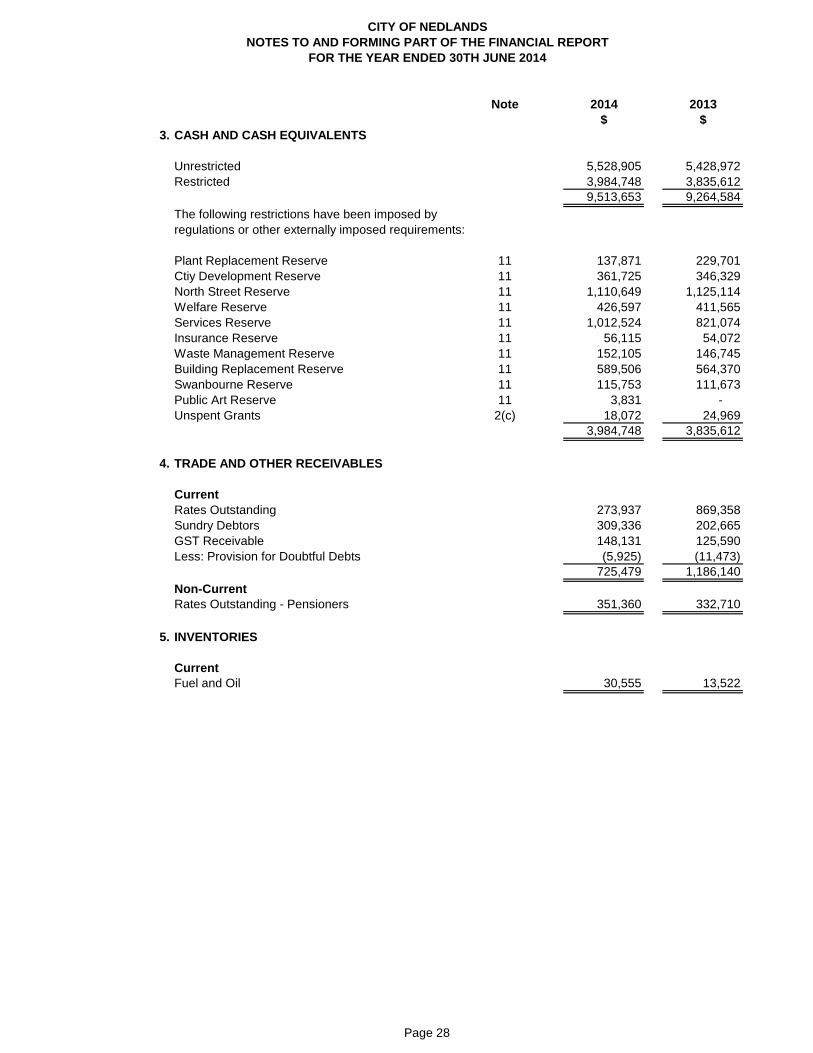
Note 2014 2013$ $
3. CASH AND CASH EQUIVALENTS
Unrestricted 5,528,905 5,428,972Restricted 3,984,748 3,835,612
9,513,653 9,264,584The following restrictions have been imposed byregulations or other externally imposed requirements:
Plant Replacement Reserve 11 137,871 229,701Ctiy Development Reserve 11 361,725 346,329North Street Reserve 11 1,110,649 1,125,114Welfare Reserve 11 426,597 411,565Services Reserve 11 1,012,524 821,074Insurance Reserve 11 56,115 54,072Waste Management Reserve 11 152,105 146,745Building Replacement Reserve 11 589,506 564,370Swanbourne Reserve 11 115,753 111,673Public Art Reserve 11 3,831 - Unspent Grants 2(c) 18,072 24,969
3,984,748 3,835,612
4. TRADE AND OTHER RECEIVABLES
CurrentRates Outstanding 273,937 869,358Sundry Debtors 309,336 202,665GST Receivable 148,131 125,590Less: Provision for Doubtful Debts (5,925) (11,473)
725,479 1,186,140Non-CurrentRates Outstanding - Pensioners 351,360 332,710
5. INVENTORIES
CurrentFuel and Oil 30,555 13,522
Page 28

CITY OF NEDLANDSNOTES TO AND FORMING PART OF THE FINANCIAL REPORT
FOR THE YEAR ENDED 30TH JUNE 2014
2014 2013$ $
6. PROPERTY, PLANT AND EQUIPMENT
Land Freehold Land at: - Independent Valuation 2014 35,625,000 30,400,582
35,625,000 30,400,582
Land Vested In and Under the Control of Council at: - Independent Valuation 2014 97,000 -
97,000 -
Total Land 35,722,000 30,400,582
Total Buildings 25,547,500 25,514,877
Total Land and Buildings 61,269,500 55,915,459
Furniture and Equipment at: - Management Valuation 2013 824,820 824,825 - Additions after Valuation - Cost 678,812 - Less Accumulated Depreciation (349,839) -
1,153,793 824,825
Plant and Equipment at: - Management Valuation 2013 2,578,811 2,927,917 - Additions after Valuation - Cost 1,024,072 - Less Accumulated Depreciation (642,044) -
2,960,839 2,927,917
65,384,132 59,668,201
Land Where there is comparable market evidence Level 2 valuation inputs are used to value land held in freehold title as well as land used for special purposes that are restricted in use under current zoning rules. Sales prices of comparable land sites in close proximity are adjusted for differences in key attributes such as property size. The most significant inputs into this valuation approach are price per square metre.
Page 29

CITY OF NEDLANDSNOTES TO AND FORMING PART OF THE FINANCIAL REPORT
FOR THE YEAR ENDED 30TH JUNE 2014
6. PROPERTY, PLANT AND EQUIPMENT (CONTINUED)
Land (Continued)
Buildings
Plant and Equipment
Furniture and Equipment:
Where there was no observable market evidence for a land asset due to its configuration, or council zoning restrictions, Level 3 valuation inputs are used. This provides only a low level of comparability.
The Cottesloe and Nedlands Golf Courses have been valued on the basis that both courses were developed privately and, whilst a lease is in place for a nominal amount per year for 21 years for each of the Courses, the independent valuation consultant has applied Present Values to the remaining periods of the ground leases.
Land that is vested or held under a management order has not been valued in accordance with Section 16, Local Government (Financial Management) Regulations 1996, and is not included as an asset in this annual financial report.
It has been determined that the Current Written Down Values of Furniture and Equipment as well as IT equipment are accurate representation of the value of Furniture and Equipment for the current Financial year. Due to the nature of the assets and their use by the City it would not be efficient to obtain a revaluation of these assets. The City has determined that written down value based on original purchase price sufficiently represents the value of the Furniture and Equipment. Further valuation of these assets would not add value to the recognition of these assets in our books.
Plant and Equipment will be comprehensively revalued during the year ending 30 June 2016.
Most plant and equipment assets are generally valued using the market and cost approach usingcomparable sales and relevant industry market price reference guides, and have been classified asbeing valued at Level 2 of the fair value hierarchy. The most significant inputs into this valuationapproach are the make, size, year of manufacture and condition.
The City’s building and improvement assets such as the City’s Depot, community centres, pavilions, etc. which are considered to be of a “specialised nature” (non-market type properties which are not readily traded in the market place) were valued by professionally qualified Registered Valuer using the cost approach. This approach is commonly referred to as the depreciated replacement cost (DRC) method.
The “DRC” approach considers the cost (sourced from cost guides such as Rawlinsons, Cordell, professional quantity surveyors and recent construction costs for similar projects throughout Western Australia) to reproduce or replace similar assets with an asset in new condition, including allowance for installation, less an amount for depreciation to accommodate accrued physical wear and tear, economic and functional obsolescence. The depreciation consists of a combination of unit rates based on square metres and quantification of the component parts of the asset. Other inputs (i.e. remaining useful life, asset condition and utility) required extensive professional judgement and impacted significantly on the final determination of fair value. Therefore, specialised building assets were classified as having been valued using Level 3 valuation inputs.
Plant and equipment were revalued in 2013 as part of the mandatory requirements embodied in LocalGovernment (Financial Management) Regulation 17A. The additions since 1 July 2013 have beenbrought into the books at cost. Given they were acquired at arms length and any accumulateddepreciation reflects the usage of service potential, it is considered that the recorded written downvalues approximate fair values.
Page 30
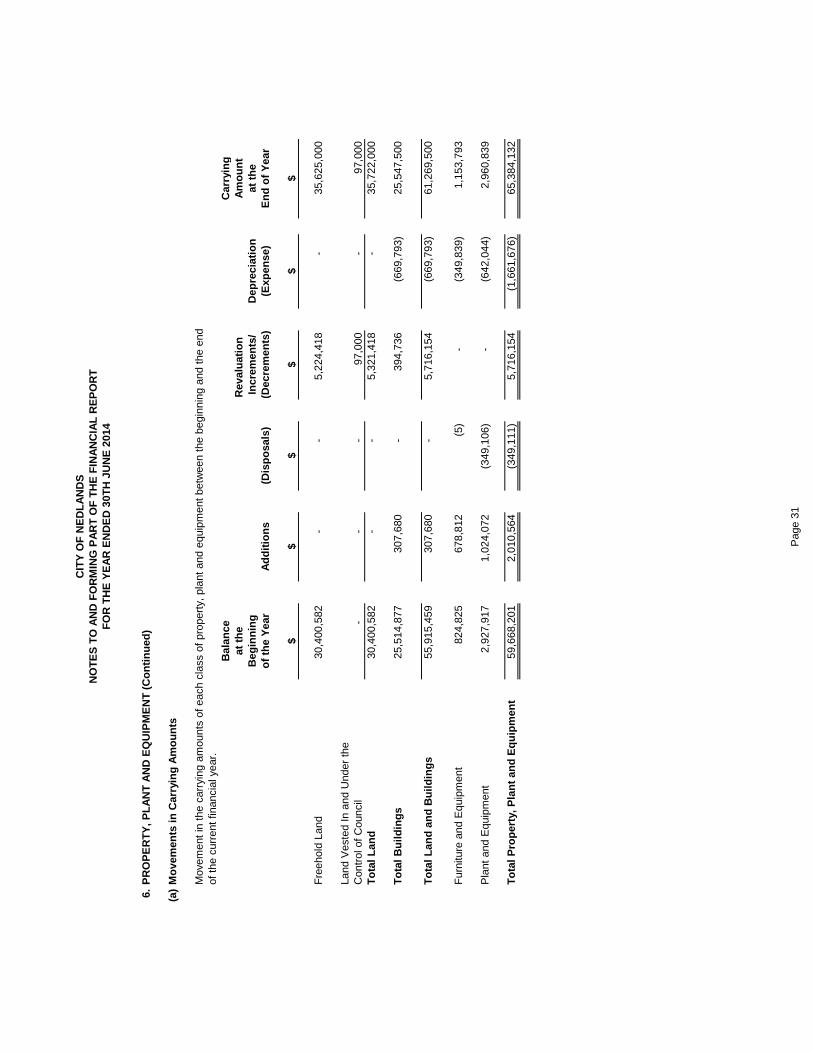
CIT
Y O
F N
ED
LA
ND
SN
OT
ES
TO
AN
D F
OR
MIN
G P
AR
T O
F T
HE
FIN
AN
CIA
L R
EP
OR
TF
OR
TH
E Y
EA
R E
ND
ED
30T
H J
UN
E 2
014
6.P
RO
PE
RT
Y, P
LA
NT
AN
D E
QU
IPM
EN
T (
Co
nti
nu
ed)
(a)
Mo
vem
ents
in C
arry
ing
Am
ou
nts
Mov
emen
t in
the
carr
ying
am
ount
s of
eac
h cl
ass
of p
rope
rty,
pla
nt a
nd e
quip
men
t bet
wee
n th
e be
ginn
ing
and
the
end
of th
e cu
rren
t fin
anci
al y
ear.
Bal
ance
Car
ryin
gat
th
eR
eval
uat
ion
Am
ou
nt
Beg
inn
ing
Incr
emen
ts/
Dep
reci
atio
nat
th
eo
f th
e Y
ear
Ad
dit
ion
s(D
isp
osa
ls)
(Dec
rem
ents
)(E
xpen
se)
En
d o
f Y
ear
$$
$$
$$
Fre
ehol
d La
nd30
,400
,582
-
-
5,22
4,41
8-
35,6
25,0
00
-
-
-
97
,000
-
97
,000
To
tal L
and
30,4
00,5
82-
-
5,
321,
418
-
35
,722
,000
To
tal B
uild
ing
s25
,514
,877
307,
680
-
394,
736
(669
,793
)25
,547
,500
To
tal L
and
an
d B
uild
ing
s55
,915
,459
307,
680
-
5,71
6,15
4(6
69,7
93)
61,2
69,5
00
Fur
nitu
re a
nd E
quip
men
t82
4,82
567
8,81
2(5
)-
(3
49,8
39)
1,15
3,79
3
Pla
nt a
nd E
quip
men
t2,
927,
917
1,02
4,07
2(3
49,1
06)
-
(642
,044
)2,
960,
839
To
tal P
rop
erty
, Pla
nt
and
Eq
uip
men
t59
,668
,201
2,01
0,56
4(3
49,1
11)
5,71
6,15
4(1
,661
,676
)65
,384
,132
Land
Ves
ted
In a
nd U
nder
the
Con
trol
of C
ounc
il
Pag
e 31
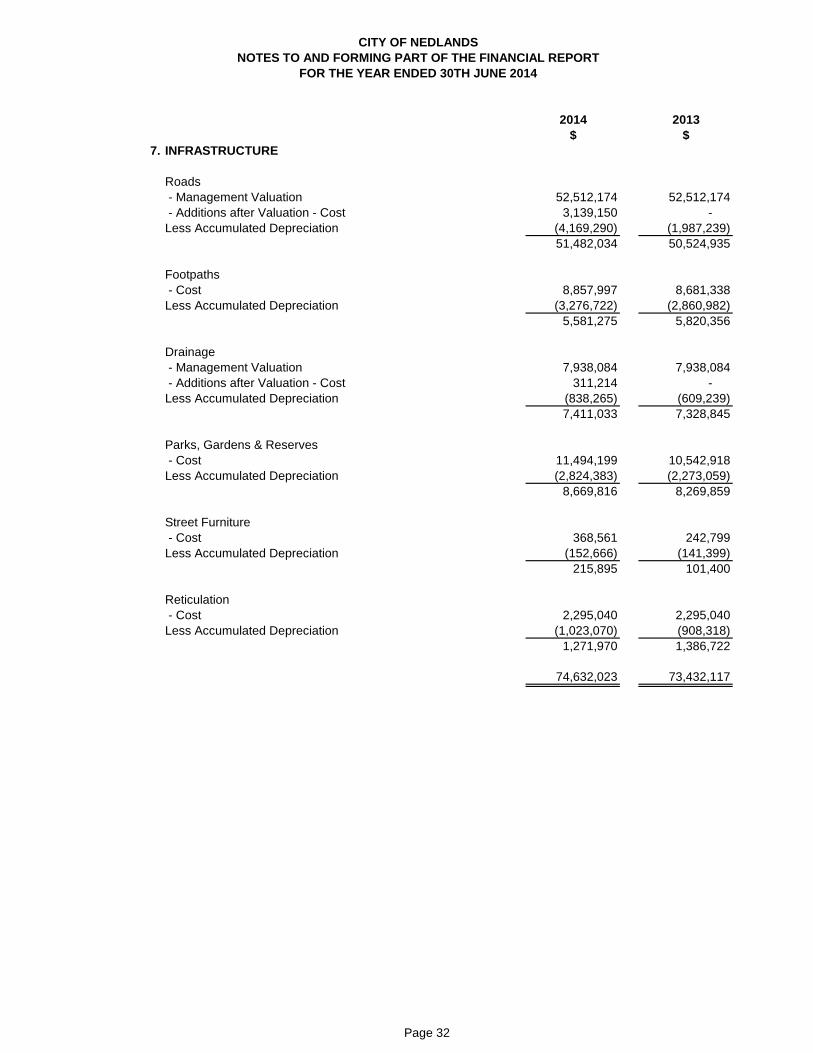
CITY OF NEDLANDSNOTES TO AND FORMING PART OF THE FINANCIAL REPORT
FOR THE YEAR ENDED 30TH JUNE 2014
2014 2013$ $
7. INFRASTRUCTURE
Roads - Management Valuation 52,512,174 52,512,174 - Additions after Valuation - Cost 3,139,150 - Less Accumulated Depreciation (4,169,290) (1,987,239)
51,482,034 50,524,935
Footpaths - Cost 8,857,997 8,681,338Less Accumulated Depreciation (3,276,722) (2,860,982)
5,581,275 5,820,356
Drainage - Management Valuation 7,938,084 7,938,084 - Additions after Valuation - Cost 311,214 - Less Accumulated Depreciation (838,265) (609,239)
7,411,033 7,328,845
Parks, Gardens & Reserves - Cost 11,494,199 10,542,918Less Accumulated Depreciation (2,824,383) (2,273,059)
8,669,816 8,269,859
Street Furniture - Cost 368,561 242,799Less Accumulated Depreciation (152,666) (141,399)
215,895 101,400
Reticulation - Cost 2,295,040 2,295,040Less Accumulated Depreciation (1,023,070) (908,318)
1,271,970 1,386,722
74,632,023 73,432,117
Page 32
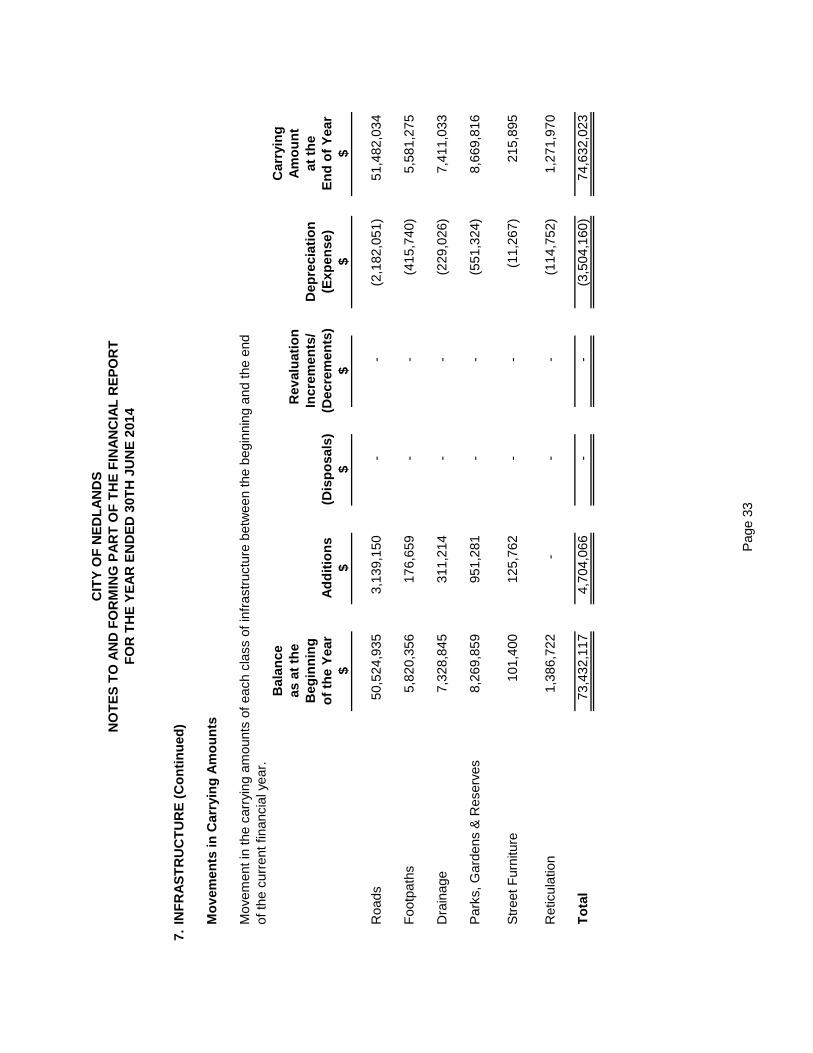
CIT
Y O
F N
ED
LA
ND
SN
OT
ES
TO
AN
D F
OR
MIN
G P
AR
T O
F T
HE
FIN
AN
CIA
L R
EP
OR
TF
OR
TH
E Y
EA
R E
ND
ED
30T
H J
UN
E 2
014
7.IN
FR
AS
TR
UC
TU
RE
(C
on
tin
ued
)
Mo
vem
ents
in C
arry
ing
Am
ou
nts
Mov
emen
t in
the
carr
ying
am
ount
s of
eac
h cl
ass
of in
fras
truc
ture
bet
wee
n th
e be
ginn
ing
and
the
end
of th
e cu
rren
t fin
anci
al y
ear.
Bal
ance
Car
ryin
gas
at
the
Rev
alu
atio
nA
mo
un
tB
egin
nin
gIn
crem
ents
/D
epre
ciat
ion
at t
he
of
the
Yea
rA
dd
itio
ns
(Dis
po
sals
)(D
ecre
men
ts)
(Exp
ense
)E
nd
of
Yea
r$
$$
$$
$
Roa
ds50
,524
,935
3,13
9,15
0-
-
(2
,182
,051
)51
,482
,034
Foo
tpat
hs5,
820,
356
176,
659
-
-
(415
,740
)5,
581,
275
Dra
inag
e7,
328,
845
311,
214
-
-
(229
,026
)7,
411,
033
Par
ks, G
arde
ns &
Res
erve
s8,
269,
859
951,
281
-
-
(551
,324
)8,
669,
816
Str
eet F
urni
ture
101,
400
125,
762
-
-
(11,
267)
215,
895
Ret
icul
atio
n1,
386,
722
-
-
-
(1
14,7
52)
1,27
1,97
0
To
tal
73,4
32,1
174,
704,
066
-
-
(3,5
04,1
60)
74,6
32,0
23
Pag
e 33
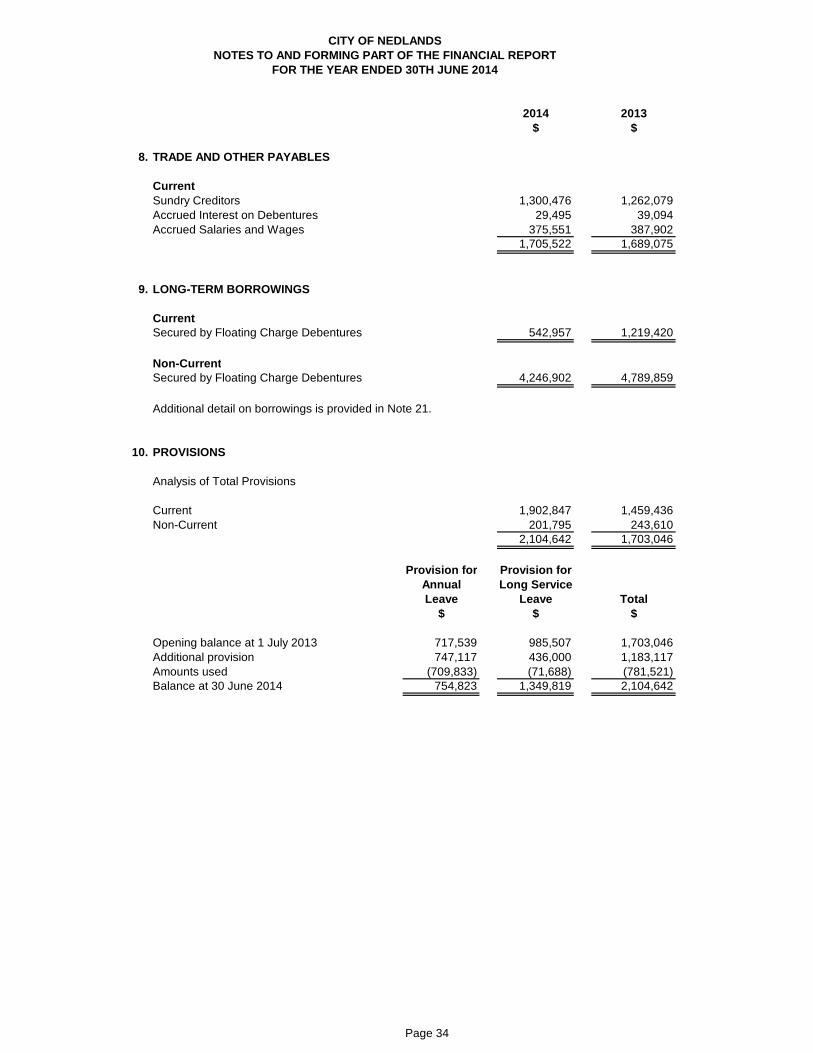
CITY OF NEDLANDSNOTES TO AND FORMING PART OF THE FINANCIAL REPORT
FOR THE YEAR ENDED 30TH JUNE 2014
2014 2013$ $
8. TRADE AND OTHER PAYABLES
CurrentSundry Creditors 1,300,476 1,262,079Accrued Interest on Debentures 29,495 39,094Accrued Salaries and Wages 375,551 387,902
1,705,522 1,689,075
9. LONG-TERM BORROWINGS
CurrentSecured by Floating Charge Debentures 542,957 1,219,420
Non-CurrentSecured by Floating Charge Debentures 4,246,902 4,789,859
Additional detail on borrowings is provided in Note 21.
10. PROVISIONS
Analysis of Total Provisions
Current 1,902,847 1,459,436Non-Current 201,795 243,610
2,104,642 1,703,046
Provision for Provision forAnnual Long ServiceLeave Leave Total
$ $ $
Opening balance at 1 July 2013 717,539 985,507 1,703,046Additional provision 747,117 436,000 1,183,117Amounts used (709,833) (71,688) (781,521)Balance at 30 June 2014 754,823 1,349,819 2,104,642
Page 34
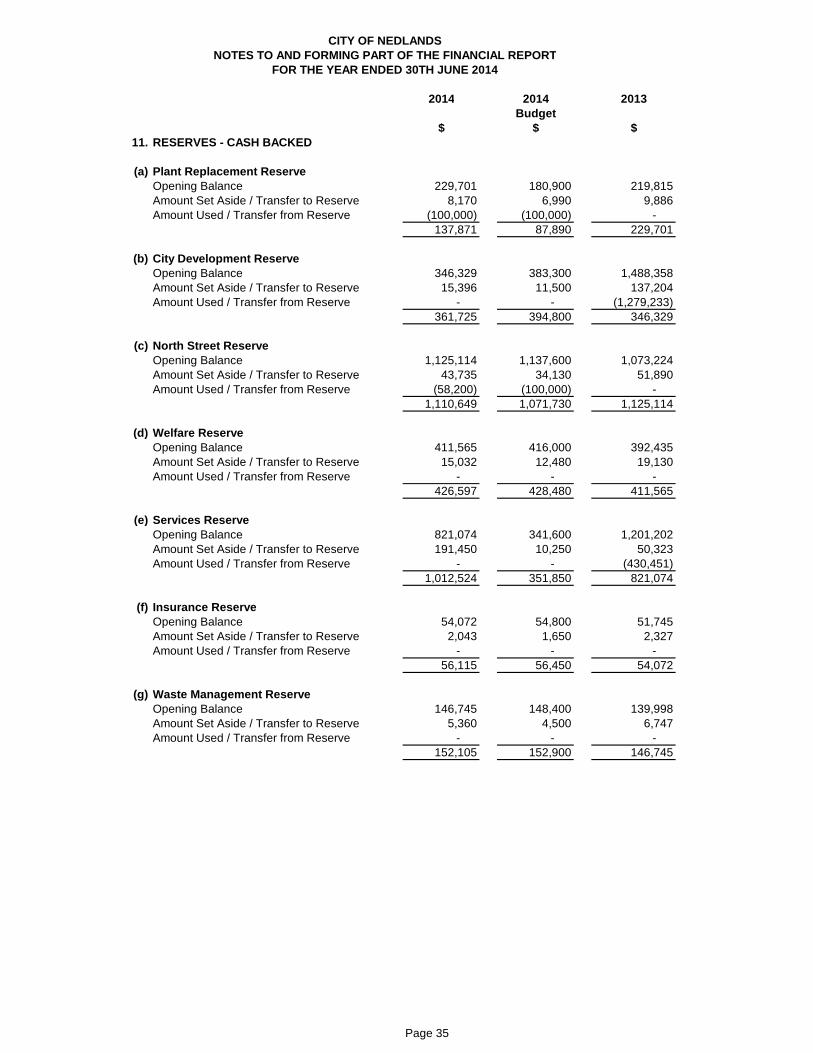
CITY OF NEDLANDSNOTES TO AND FORMING PART OF THE FINANCIAL REPORT
FOR THE YEAR ENDED 30TH JUNE 2014
2014 2014 2013Budget
$ $ $11. RESERVES - CASH BACKED
(a) Plant Replacement ReserveOpening Balance 229,701 180,900 219,815Amount Set Aside / Transfer to Reserve 8,170 6,990 9,886Amount Used / Transfer from Reserve (100,000) (100,000) -
137,871 87,890 229,701
(b) City Development ReserveOpening Balance 346,329 383,300 1,488,358Amount Set Aside / Transfer to Reserve 15,396 11,500 137,204Amount Used / Transfer from Reserve - - (1,279,233)
361,725 394,800 346,329
(c) North Street ReserveOpening Balance 1,125,114 1,137,600 1,073,224Amount Set Aside / Transfer to Reserve 43,735 34,130 51,890Amount Used / Transfer from Reserve (58,200) (100,000) -
1,110,649 1,071,730 1,125,114
(d) Welfare ReserveOpening Balance 411,565 416,000 392,435Amount Set Aside / Transfer to Reserve 15,032 12,480 19,130Amount Used / Transfer from Reserve - - -
426,597 428,480 411,565
(e) Services ReserveOpening Balance 821,074 341,600 1,201,202Amount Set Aside / Transfer to Reserve 191,450 10,250 50,323Amount Used / Transfer from Reserve - - (430,451)
1,012,524 351,850 821,074
(f) Insurance ReserveOpening Balance 54,072 54,800 51,745Amount Set Aside / Transfer to Reserve 2,043 1,650 2,327Amount Used / Transfer from Reserve - - -
56,115 56,450 54,072
(g) Waste Management ReserveOpening Balance 146,745 148,400 139,998Amount Set Aside / Transfer to Reserve 5,360 4,500 6,747Amount Used / Transfer from Reserve - - -
152,105 152,900 146,745
Page 35

CITY OF NEDLANDS
NOTES TO AND FORMING PART OF THE FINANCIAL REPORTFOR THE YEAR ENDED 30TH JUNE 2014
2014 2014 2013Budget
$ $ $11. RESERVES - CASH BACKED (Continued)
(h) Building Replacement ReserveOpening Balance 564,370 573,600 541,074Amount Set Aside / Transfer to Reserve 25,136 17,210 23,296Amount Used / Transfer from Reserve - - -
589,506 590,810 564,370
(i) Swanbourne ReserveOpening Balance 111,673 112,900 106,539Amount Set Aside / Transfer to Reserve 4,080 3,390 5,134Amount Used / Transfer from Reserve - - -
115,753 116,290 111,673
(j) Public Art ReserveOpening Balance - - - Amount Set Aside / Transfer to Reserve 3,831 3,900 - Amount Used / Transfer from Reserve - - -
3,831 3,900 -
TOTAL RESERVES 3,966,676 3,255,100 3,810,643
Total Opening Balance 3,810,643 3,349,100 5,214,390Total Amount Set Aside / Transfer to Reserve 314,233 102,100 305,937Total Amount Used / Transfer from Reserve (158,200) (200,000) (1,709,684)TOTAL RESERVES 3,966,676 3,251,200 3,810,643
All of the reserve accounts are supported by money held in financial institutions and match theamount shown as restricted cash in Note 3 to this financial report.
Page 36

11. RESERVES - CASH BACKED (continued)
In accordance with council resolutions in relation to each reserve account, the purpose for whichthe funds are set aside are as follows:
(a) Plant Replacement Reserve
(b) City Development Reserve
(c) North Street Reserve
The use of funds in this reserve is on going.
(d) Welfare Reserve
(e) Services Reserve
street works, provision of street lighting and building maintenance. The use of funds in this reserve is ongoing.
(f) Insurance Reserve
(g) Waste Management Reserve
(h) Building Replacement Reserve
(i) Swanbourne Reserve
(j) Public Art ReserveTo provide funds for the works of art in the City. The use of funds in this reserve is ongoing.
To provide funds for the replacement of the City's rubbish bin stock so that the cost is spread
To provide funds for the capital works in the swanbourne area associated with the Swanbourne
To provide funds for the replacement of the City's plant and equipment so that the cost is spread
To provide funds for the improvement of property, plant and and equiptment. The use of funds
To provide funds for the operational and capital costs of community facilities in Mt Claremont,
To provide funds for the operational and capital costs of welfare services. The use of funds in
is ongoing.
Masterplan. The use of funds in this reserve is ongoing.
over a number of years. The use of funds in this reserve is ongoing.
in this reserve is on going.
community and recreation facilities in Swanbourne and infrastructure generally.
this reserve is ongoing.
premium. To cover any excess that may arise from having a performance based workers compensation
To fund the upgrade and/or replacement of City buildings. The use of funds in this reserve
over a number of years. The use of funds in this reserve is ongoing.
schemes, valuation and legal expenses, items of works of an urgent nature such as drainage,
CITY OF NEDLANDSNOTES TO AND FORMING PART OF THE FINANCIAL REPORT
FOR THE YEAR ENDED 30TH JUNE 2013
To provide funds for the purchase of land for parking areas, streets, depots, etc., town planning
Page 37
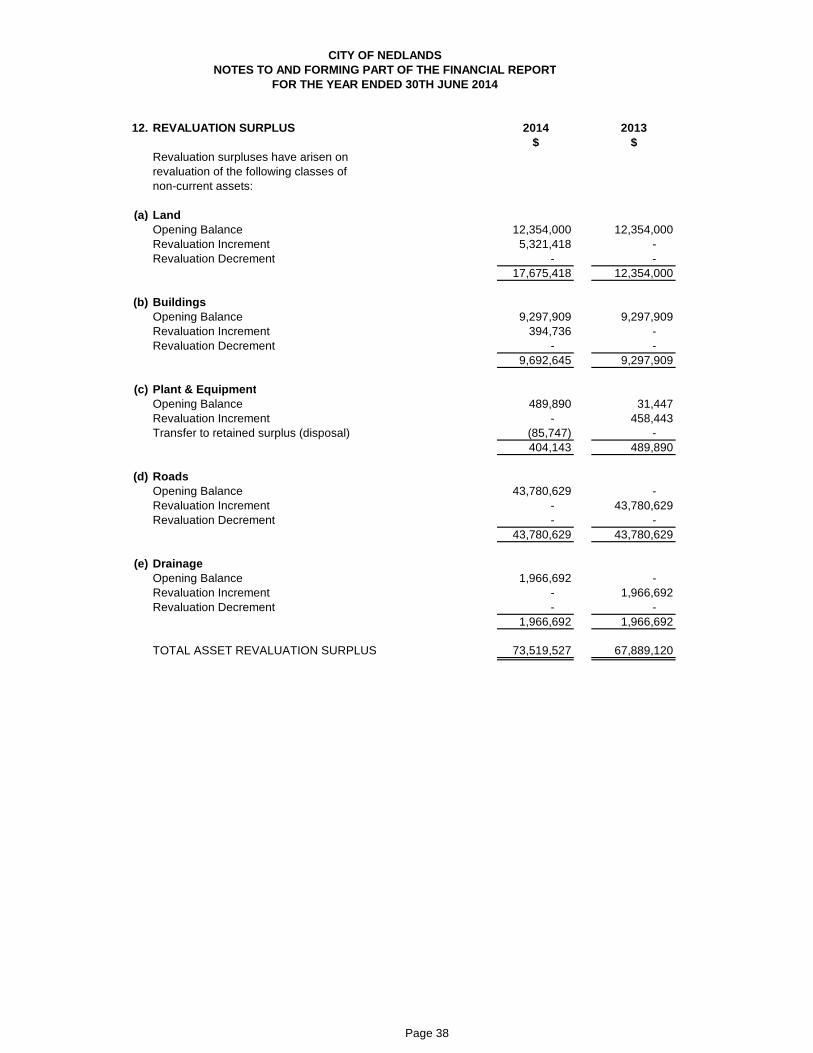
CITY OF NEDLANDSNOTES TO AND FORMING PART OF THE FINANCIAL REPORT
FOR THE YEAR ENDED 30TH JUNE 2014
12. REVALUATION SURPLUS 2014 2013$ $
Revaluation surpluses have arisen onrevaluation of the following classes ofnon-current assets:
(a) Land Opening Balance 12,354,000 12,354,000Revaluation Increment 5,321,418 - Revaluation Decrement - -
17,675,418 12,354,000
(b) BuildingsOpening Balance 9,297,909 9,297,909Revaluation Increment 394,736 - Revaluation Decrement - -
9,692,645 9,297,909
(c) Plant & EquipmentOpening Balance 489,890 31,447Revaluation Increment - 458,443Transfer to retained surplus (disposal) (85,747) -
404,143 489,890
(d) RoadsOpening Balance 43,780,629 - Revaluation Increment - 43,780,629Revaluation Decrement - -
43,780,629 43,780,629
(e) DrainageOpening Balance 1,966,692 - Revaluation Increment - 1,966,692Revaluation Decrement - -
1,966,692 1,966,692
TOTAL ASSET REVALUATION SURPLUS 73,519,527 67,889,120
Page 38
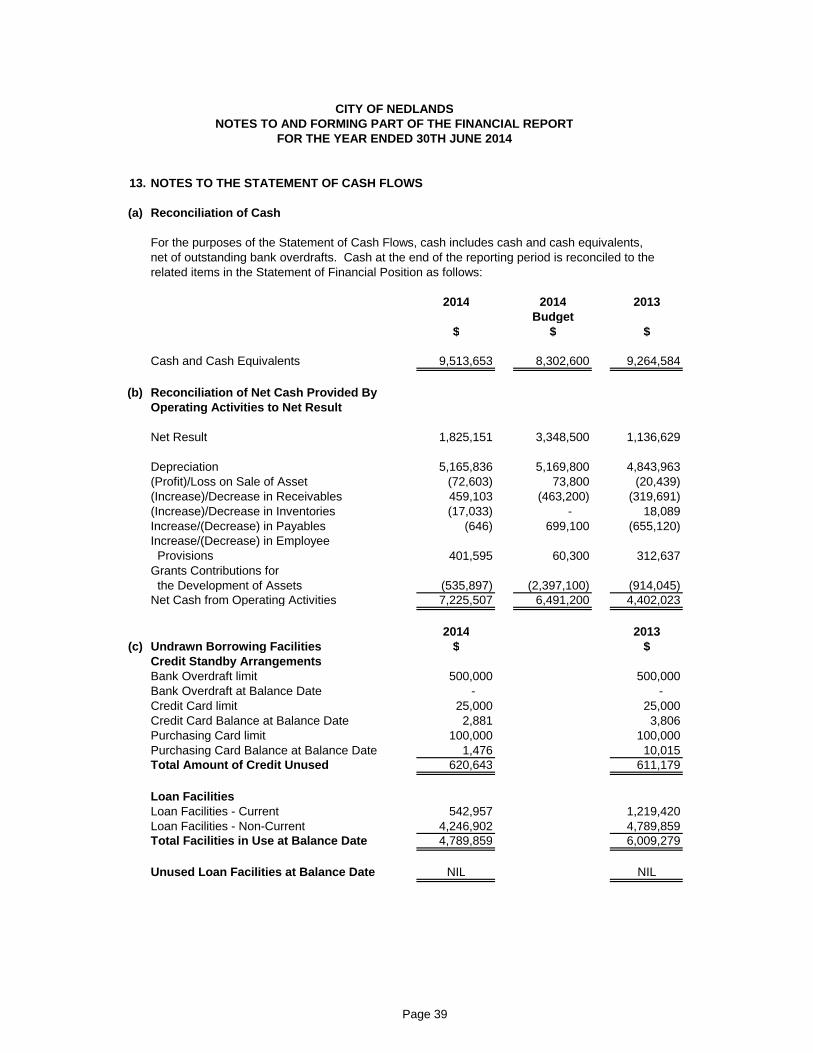
CITY OF NEDLANDSNOTES TO AND FORMING PART OF THE FINANCIAL REPORT
FOR THE YEAR ENDED 30TH JUNE 2014
13. NOTES TO THE STATEMENT OF CASH FLOWS
(a) Reconciliation of Cash
For the purposes of the Statement of Cash Flows, cash includes cash and cash equivalents,net of outstanding bank overdrafts. Cash at the end of the reporting period is reconciled to therelated items in the Statement of Financial Position as follows:
2014 2014 2013Budget
$ $ $
Cash and Cash Equivalents 9,513,653 8,302,600 9,264,584
(b) Reconciliation of Net Cash Provided ByOperating Activities to Net Result
Net Result 1,825,151 3,348,500 1,136,629
Depreciation 5,165,836 5,169,800 4,843,963(Profit)/Loss on Sale of Asset (72,603) 73,800 (20,439)(Increase)/Decrease in Receivables 459,103 (463,200) (319,691)(Increase)/Decrease in Inventories (17,033) - 18,089Increase/(Decrease) in Payables (646) 699,100 (655,120)Increase/(Decrease) in Employee Provisions 401,595 60,300 312,637Grants Contributions for the Development of Assets (535,897) (2,397,100) (914,045)Net Cash from Operating Activities 7,225,507 6,491,200 4,402,023
2014 2013(c) Undrawn Borrowing Facilities $ $
Credit Standby ArrangementsBank Overdraft limit 500,000 500,000Bank Overdraft at Balance Date - - Credit Card limit 25,000 25,000Credit Card Balance at Balance Date 2,881 3,806Purchasing Card limit 100,000 100,000Purchasing Card Balance at Balance Date 1,476 10,015Total Amount of Credit Unused 620,643 611,179
Loan FacilitiesLoan Facilities - Current 542,957 1,219,420Loan Facilities - Non-Current 4,246,902 4,789,859Total Facilities in Use at Balance Date 4,789,859 6,009,279
Unused Loan Facilities at Balance Date NIL NIL
Page 39

CITY OF NEDLANDSNOTES TO AND FORMING PART OF THE FINANCIAL REPORT
FOR THE YEAR ENDED 30TH JUNE 2014
14. CONTINGENT LIABILITIES
2014 201315. CAPITAL AND LEASING COMMITMENTS $ $
(a) Operating Lease Commitments
Payable:- not later than one year 49,012 29,999- later than one year but not later than five years 46,670 38,637- later than five years - -
95,682 68,636
(b) Capital Expenditure Commitments
Contracted for:- capital expenditure projects 291,800 500,000
Payable:- not later than one year 291,800 500,000
16. JOINT VENTURE ARRANGEMENTS
17. TOTAL ASSETS CLASSIFIED BY FUNCTION AND ACTIVITY2014 2013
$ $
Governance 39,064,633 33,837,841General Purpose Funding - - Law, Order, Public Safety 1,393,587 1,419,912Health 339,357 436,324Education and Welfare 2,805,769 2,996,471Community Amenities 56,758 63,649Recreation and Culture 27,762,067 26,246,781Transport 67,682,598 66,432,473Economic Services 9,248 12,198Other Property and Services 11,523,185 12,450,224Unallocated - 1,401
150,637,202 143,897,274
Street and renewal of dirt bicycle track at College Park.
The City has not entered into any joint venture arrangements.
The City is not aware of any legal claims against the City.
Non-cancellable operating leases contracted for but not capitalised in the accounts.
The City did not have any future operating lease commitments at the reporting date.
The capital expenditure project outstanding at the end of the current reporting period representsBlackspot projects on Stirling Highway, Broadway Road, West Coast Highway and North
Page 40
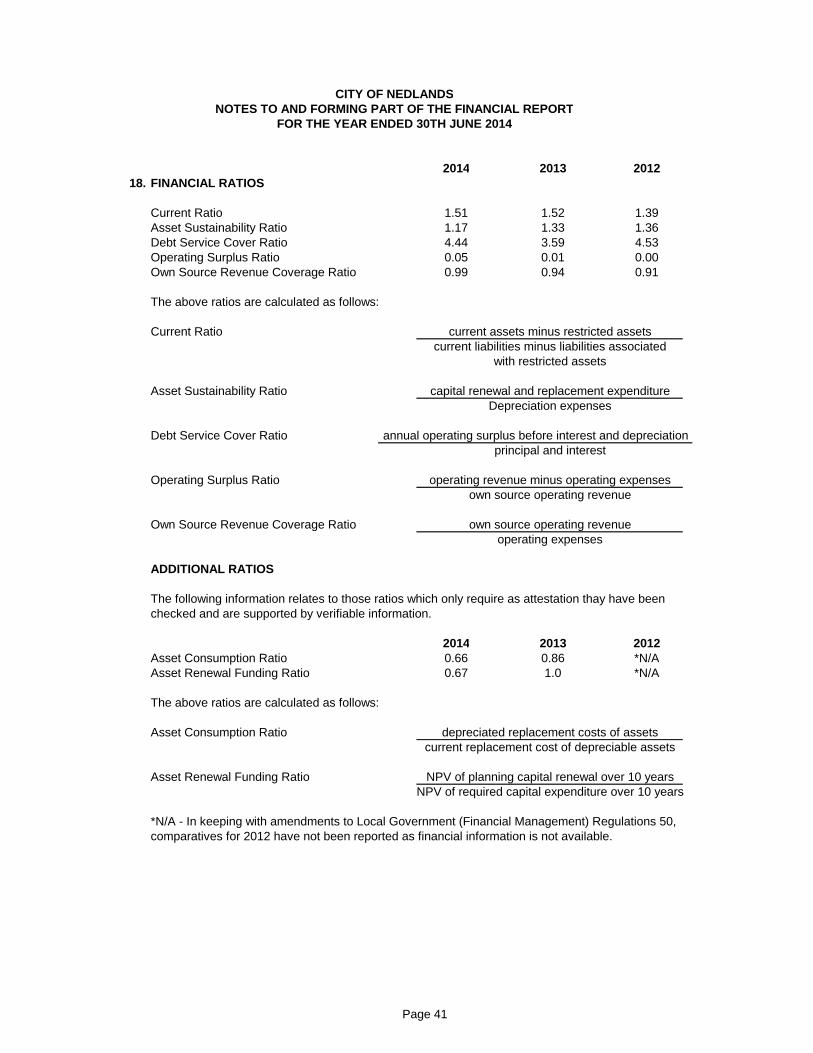
CITY OF NEDLANDSNOTES TO AND FORMING PART OF THE FINANCIAL REPORT
FOR THE YEAR ENDED 30TH JUNE 2014
2014 2013 201218. FINANCIAL RATIOS
Current Ratio 1.51 1.52 1.39Asset Sustainability Ratio 1.17 1.33 1.36Debt Service Cover Ratio 4.44 3.59 4.53Operating Surplus Ratio 0.05 0.01 0.00Own Source Revenue Coverage Ratio 0.99 0.94 0.91
The above ratios are calculated as follows:
Current Ratio current assets minus restricted assetscurrent liabilities minus liabilities associated
with restricted assets
Asset Sustainability RatioDepreciation expenses
Debt Service Cover Ratioprincipal and interest
Operating Surplus Ratio operating revenue minus operating expensesown source operating revenue
Own Source Revenue Coverage Ratio own source operating revenueoperating expenses
ADDITIONAL RATIOS
The following information relates to those ratios which only require as attestation thay have been checked and are supported by verifiable information.
2014 2013 2012Asset Consumption Ratio 0.66 0.86 *N/AAsset Renewal Funding Ratio 0.67 1.0 *N/A
The above ratios are calculated as follows:
Asset Consumption Ratio depreciated replacement costs of assetscurrent replacement cost of depreciable assets
Asset Renewal Funding Ratio NPV of planning capital renewal over 10 yearsNPV of required capital expenditure over 10 years
*N/A - In keeping with amendments to Local Government (Financial Management) Regulations 50, comparatives for 2012 have not been reported as financial information is not available.
annual operating surplus before interest and depreciation
capital renewal and replacement expenditure
Page 41

CITY OF NEDLANDSNOTES TO AND FORMING PART OF THE FINANCIAL REPORT
FOR THE YEAR ENDED 30TH JUNE 2014
19. TRUST FUNDS
Funds held at balance date over which the City has no control and which are not included inthe financial statements are as follows:
Balance Amounts Amounts Balance1 July 2013 Received Paid 30 June 2014
Particular $ $ ($) $
Bonds and Deposits 1,477,015 1,306,517 (1,335,386) 1,448,146Unclaimed Monies 17,484 1,648 (568) 18,564
1,494,499 1,466,710
20. DISPOSALS OF ASSETS - 2013/14 FINANCIAL YEAR
The following assets were disposed of during the year.
Net Book Value Sale Price Profit (Loss)Actual Budget Actual Budget Actual Budget
$ $ $ $ $ $Plant and EquipmentOther property and Services 349,106 333,600 421,715 407,400 72,609 73,800
Furniture and equipmentOther property and Services 6 - - - (6) -
349,112 333,600 421,715 407,400 72,603 73,800
Profit 81,567 95,800Loss (8,964) (22,000)
72,603 73,800
Page 42

CIT
Y O
F N
ED
LA
ND
SN
OT
ES
TO
AN
D F
OR
MIN
G P
AR
T O
F T
HE
FIN
AN
CIA
L R
EP
OR
TF
OR
TH
E Y
EA
R E
ND
ED
30T
H J
UN
E 2
014
21.
INF
OR
MA
TIO
N O
N B
OR
RO
WIN
GS
(a)
Rep
aym
ents
- D
eben
ture
s
P
rin
cip
alP
rin
cip
alP
rin
cip
alIn
tere
stN
ewR
epay
men
ts30
Ju
ne
2014
Rep
aym
ents
Lo
ans
Act
ual
Bu
dg
etA
ctu
alB
ud
get
Act
ual
Bu
dg
etP
arti
cula
rsLo
an #
$$
$$
$$
$$
Gen
eral
Pu
rpo
se F
un
din
gW
aste
Bin
s 17
846
3,42
173
,357
73,4
0039
0,06
439
0,10
025
,661
26,7
00R
oad
Infr
astr
uctu
res
179
1,22
1,15
080
,802
80,8
001,
140,
347
1,14
0,30
072
,200
72,8
00B
uild
ings
& R
oads
180
705,
269
705,
269
705,
300
-
-
20,7
0326
,900
Bui
ldin
gs &
Infr
astr
uctu
res
181
1,68
7,98
017
0,28
817
0,30
01,
517,
692
1,51
7,70
095
,893
97,2
00B
uild
ings
& In
fras
truc
ture
s18
21,
931,
459
189,
704
189,
700
1,74
1,75
51,
741,
800
87,7
4088
,200
6,00
9,27
9-
1,
219,
420
1,21
9,50
04,
789,
859
4,78
9,90
030
2,19
631
1,80
0
All
loan
rep
aym
ents
wer
e fin
ance
d by
gen
eral
pur
pose
rev
enue
.
(b)
New
Deb
entu
res
- 20
13/1
4
(c)
Uns
pent
Deb
entu
res
(d)
Ove
rdra
ft
Cou
ncil
esta
blis
hed
an o
verd
raft
faci
lity
of $
500,
000
in 2
008
to a
ssis
t with
sho
rt te
rm li
quid
ity r
equi
rem
ents
.
1 Ju
ly
2013
The
City
did
not
take
up
any
new
deb
entu
res
durin
g th
e ye
ar e
nded
30
June
201
4.
The
City
did
not
hav
e an
y un
spen
t deb
entu
res
as a
t 30
June
201
4.
The
bal
ance
of t
he b
ank
over
draf
t at 1
Jul
y 20
13 a
nd 3
0 Ju
ne 2
014
was
$ 0
.
Pag
e 43
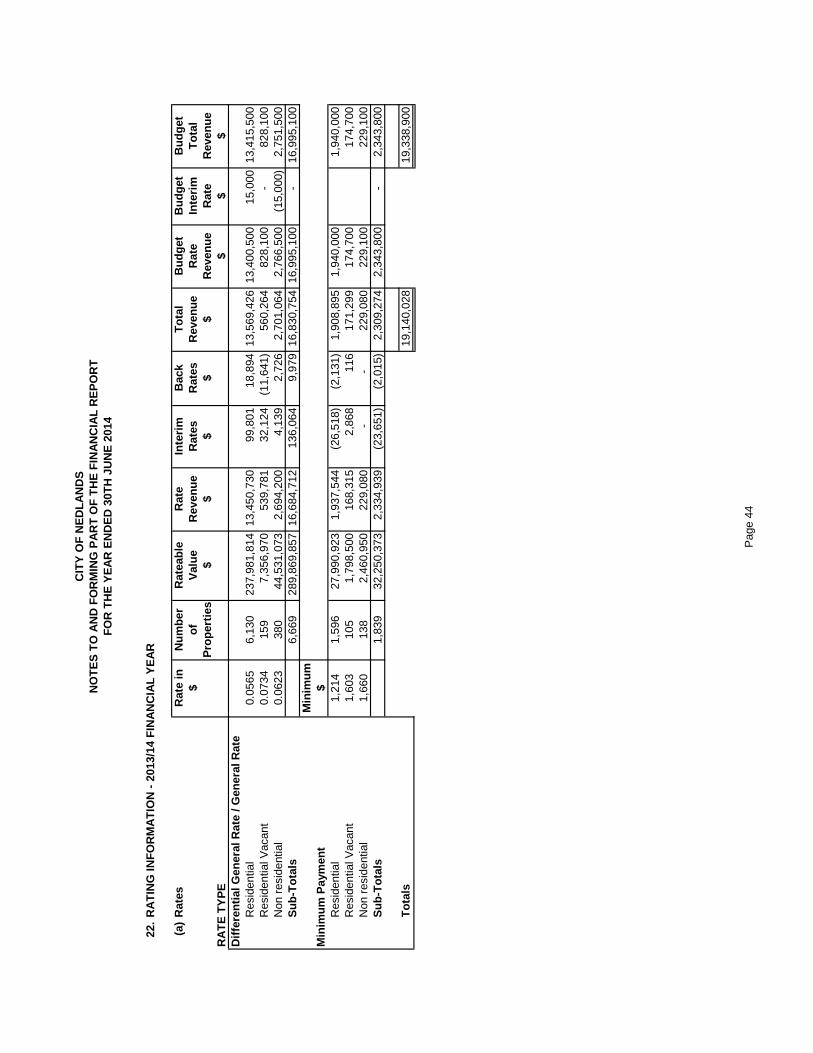
CIT
Y O
F N
ED
LA
ND
SN
OT
ES
TO
AN
D F
OR
MIN
G P
AR
T O
F T
HE
FIN
AN
CIA
L R
EP
OR
TF
OR
TH
E Y
EA
R E
ND
ED
30T
H J
UN
E 2
014
22.
RA
TIN
G IN
FO
RM
AT
ION
- 2
013/
14 F
INA
NC
IAL
YE
AR
(a)
Rat
esR
ate
inN
um
ber
Rat
eab
leR
ate
Inte
rim
Bac
kT
ota
lB
ud
get
Bu
dg
etB
ud
get
$o
fV
alu
eR
even
ue
Rat
esR
ates
Rev
enu
eR
ate
Inte
rim
To
tal
Pro
per
ties
$$
$$
$R
even
ue
Rat
eR
even
ue
RA
TE
TY
PE
$$
$D
iffe
ren
tial
Gen
eral
Rat
e / G
ener
al R
ate
Res
iden
tial
0.05
656,
130
237,
981,
814
13,4
50,7
3099
,801
18,8
9413
,569
,426
13,4
00,5
0015
,000
13,4
15,5
00R
esid
entia
l Vac
ant
0.07
3415
97,
356,
970
539,
781
32,1
24(1
1,64
1)56
0,26
482
8,10
0-
828,
100
Non
res
iden
tial
0.06
2338
044
,531
,073
2,69
4,20
04,
139
2,72
62,
701,
064
2,76
6,50
0(1
5,00
0)2,
751,
500
Su
b-T
ota
ls6,
669
289,
869,
857
16,6
84,7
1213
6,06
49,
979
16,8
30,7
5416
,995
,100
-
16
,995
,100
Min
imu
mM
inim
um
Pay
men
t$
Res
iden
tial
1,21
41,
596
27,9
90,9
231,
937,
544
(26,
518)
(2,1
31)
1,90
8,89
51,
940,
000
1,94
0,00
0R
esid
entia
l Vac
ant
1,60
310
51,
798,
500
168,
315
2,86
811
617
1,29
917
4,70
017
4,70
0N
on r
esid
entia
l1,
660
138
2,46
0,95
022
9,08
0-
-
229,
080
229,
100
229,
100
Su
b-T
ota
ls1,
839
32,2
50,3
732,
334,
939
(23,
651)
(2,0
15)
2,30
9,27
42,
343,
800
-
2,
343,
800
To
tals
19,1
40,0
2819
,338
,900
Pag
e 44
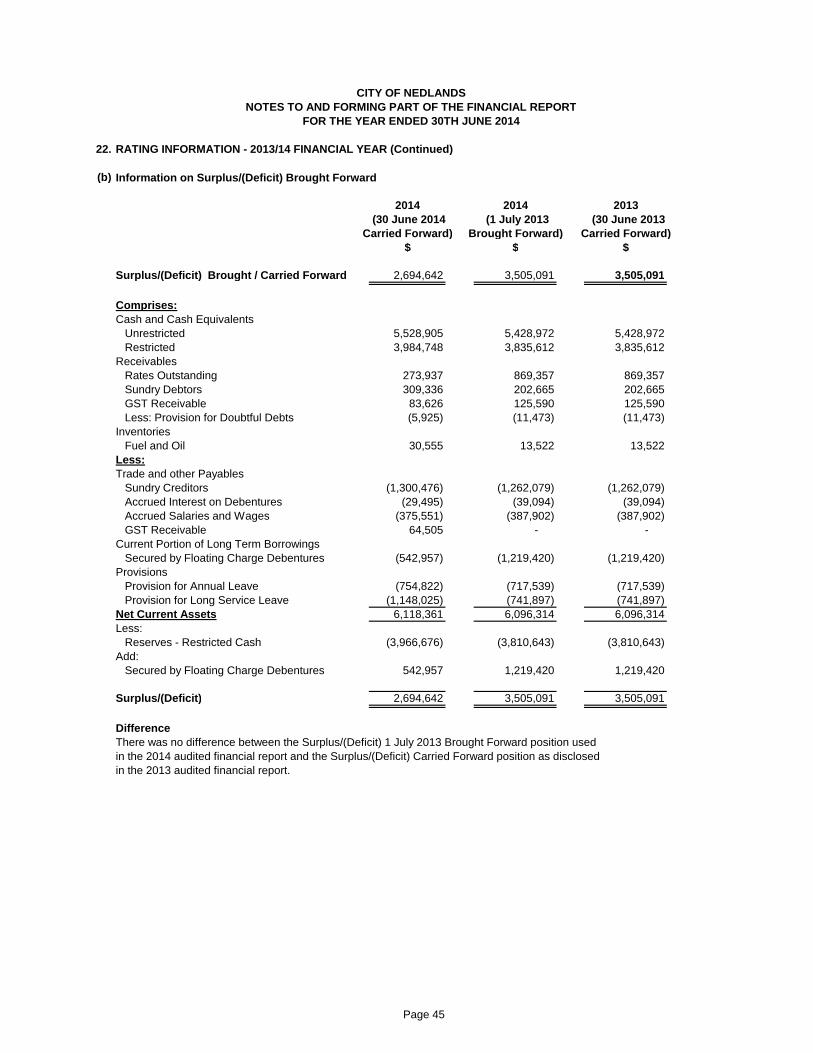
CITY OF NEDLANDSNOTES TO AND FORMING PART OF THE FINANCIAL REPORT
FOR THE YEAR ENDED 30TH JUNE 2014
22. RATING INFORMATION - 2013/14 FINANCIAL YEAR (Continued)
(b)
2014 2014 2013
Carried Forward) Brought Forward) Carried Forward)$ $ $
Surplus/(Deficit) Brought / Carried Forward 2,694,642 3,505,091 3,505,091
Comprises:Cash and Cash Equivalents
Unrestricted 5,528,905 5,428,972 5,428,972Restricted 3,984,748 3,835,612 3,835,612
ReceivablesRates Outstanding 273,937 869,357 869,357Sundry Debtors 309,336 202,665 202,665GST Receivable 83,626 125,590 125,590Less: Provision for Doubtful Debts (5,925) (11,473) (11,473)
InventoriesFuel and Oil 30,555 13,522 13,522
Less:Trade and other Payables
Sundry Creditors (1,300,476) (1,262,079) (1,262,079)Accrued Interest on Debentures (29,495) (39,094) (39,094)Accrued Salaries and Wages (375,551) (387,902) (387,902)GST Receivable 64,505 - -
Current Portion of Long Term BorrowingsSecured by Floating Charge Debentures (542,957) (1,219,420) (1,219,420)
ProvisionsProvision for Annual Leave (754,822) (717,539) (717,539)Provision for Long Service Leave (1,148,025) (741,897) (741,897)
Net Current Assets 6,118,361 6,096,314 6,096,314Less:
Reserves - Restricted Cash (3,966,676) (3,810,643) (3,810,643)Add:
Secured by Floating Charge Debentures 542,957 1,219,420 1,219,420
Surplus/(Deficit) 2,694,642 3,505,091 3,505,091
Difference
in the 2014 audited financial report and the Surplus/(Deficit) Carried Forward position as disclosedin the 2013 audited financial report.
Information on Surplus/(Deficit) Brought Forward
(30 June 2013
There was no difference between the Surplus/(Deficit) 1 July 2013 Brought Forward position used
(1 July 2013(30 June 2014
Page 45

23.
The City of Nedlands did not levy any Special Area Rate in 2013/14 financial year.
24. SERVICE CHARGES - 2013/14 FINANCIAL YEAR
The City of Nedlands did not impose any service charges.
25. DISCOUNTS, INCENTIVES, CONCESSIONS, & WRITE-OFFS- 2013/14 FINANCIAL YEAR
26. INTEREST CHARGES AND INSTALMENTS - 2013/14 FINANCIAL YEAR
Interest Admin. Revenue BudgetedRate Charge $ Revenue
% $ $Interest on Unpaid Rates 11.00% 68,377 62,500ESL Interest Income 11.00% 5,779 3,200Interest on Instalments Plan 5.50% 121,238 92,200Deferred Rates Interest 10,319 10,300Total Interst Income 205,713 168,200Admin Charges on Instalment Plan 27 57,798 52,500
263,511 220,700
Ratepayers had the option of paying rates in four equal instalments, due on 19 August Month 2013,18 November 2013, 20 January 2014 and 24 March 2014. Administration charges andinterest applied for the final three instalments.
2014 201327. FEES & CHARGES $ $
Governance 89,582 69,679General Purpose Funding 68,172 49,875Law, Order, Public Safety 80,051 38,597Health 154,666 95,309Education and Welfare 581,350 424,686Community Amenities 4,261,633 4,164,333Recreation and Culture 638,926 559,376Transport 449,600 480,139Economic Services 774,211 575,807Other Property and Services 22,940 15,012
7,121,131 6,472,813
There were no changes during the year to the amount of the fees or charges detailed in the original
CITY OF NEDLANDSNOTES TO AND FORMING PART OF THE FINANCIAL REPORT
FOR THE YEAR ENDED 30TH JUNE 2014
SPECIFIED AREA RATE - 2013/14 FINANCIAL YEAR
budget.
There were no discounts, incentives, concessions, and write-offs during the 2013/14 financial year.
Page 46
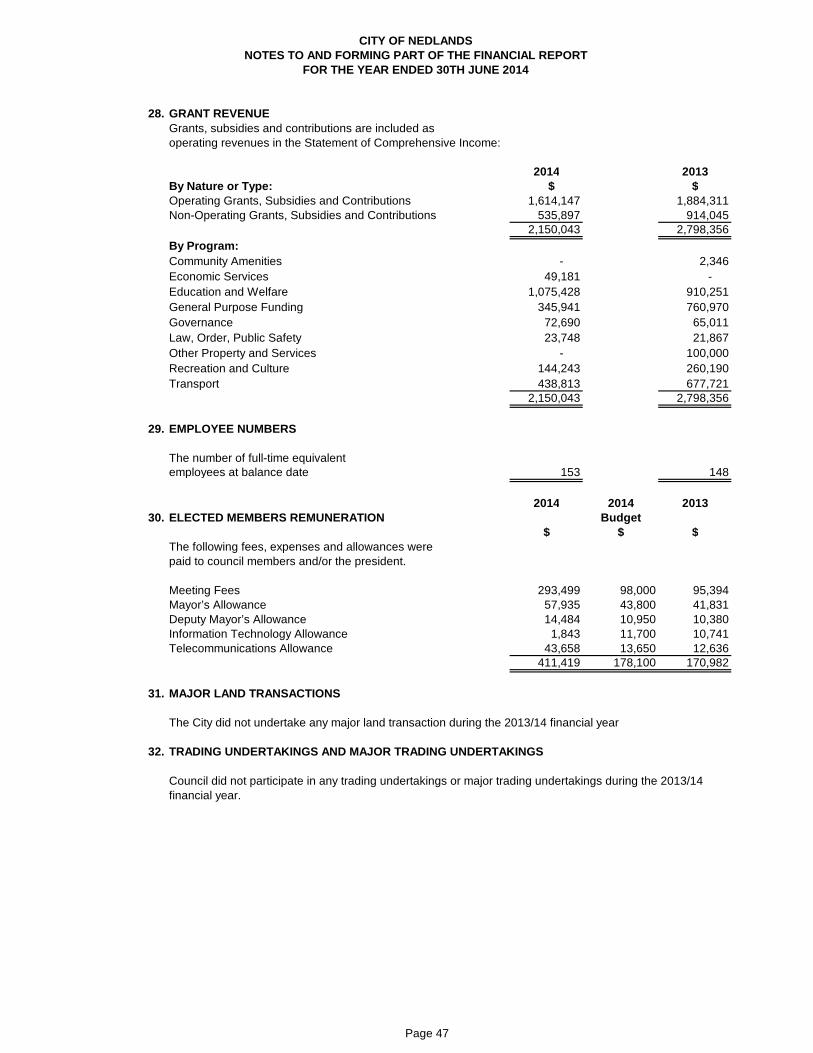
28. GRANT REVENUEGrants, subsidies and contributions are included as operating revenues in the Statement of Comprehensive Income:
2014 2013By Nature or Type: $ $Operating Grants, Subsidies and Contributions 1,614,147 1,884,311Non-Operating Grants, Subsidies and Contributions 535,897 914,045
2,150,043 2,798,356By Program:Community Amenities - 2,346Economic Services 49,181 - Education and Welfare 1,075,428 910,251General Purpose Funding 345,941 760,970Governance 72,690 65,011Law, Order, Public Safety 23,748 21,867Other Property and Services - 100,000Recreation and Culture 144,243 260,190Transport 438,813 677,721
2,150,043 2,798,356
29. EMPLOYEE NUMBERS
The number of full-time equivalentemployees at balance date 153 148
2014 2014 201330. ELECTED MEMBERS REMUNERATION Budget
$ $ $The following fees, expenses and allowances werepaid to council members and/or the president.
Meeting Fees 293,499 98,000 95,394Mayor’s Allowance 57,935 43,800 41,831Deputy Mayor’s Allowance 14,484 10,950 10,380Information Technology Allowance 1,843 11,700 10,741Telecommunications Allowance 43,658 13,650 12,636
411,419 178,100 170,982
31. MAJOR LAND TRANSACTIONS
The City did not undertake any major land transaction during the 2013/14 financial year
32. TRADING UNDERTAKINGS AND MAJOR TRADING UNDERTAKINGS
CITY OF NEDLANDSNOTES TO AND FORMING PART OF THE FINANCIAL REPORT
FOR THE YEAR ENDED 30TH JUNE 2014
financial year.Council did not participate in any trading undertakings or major trading undertakings during the 2013/14
Page 47
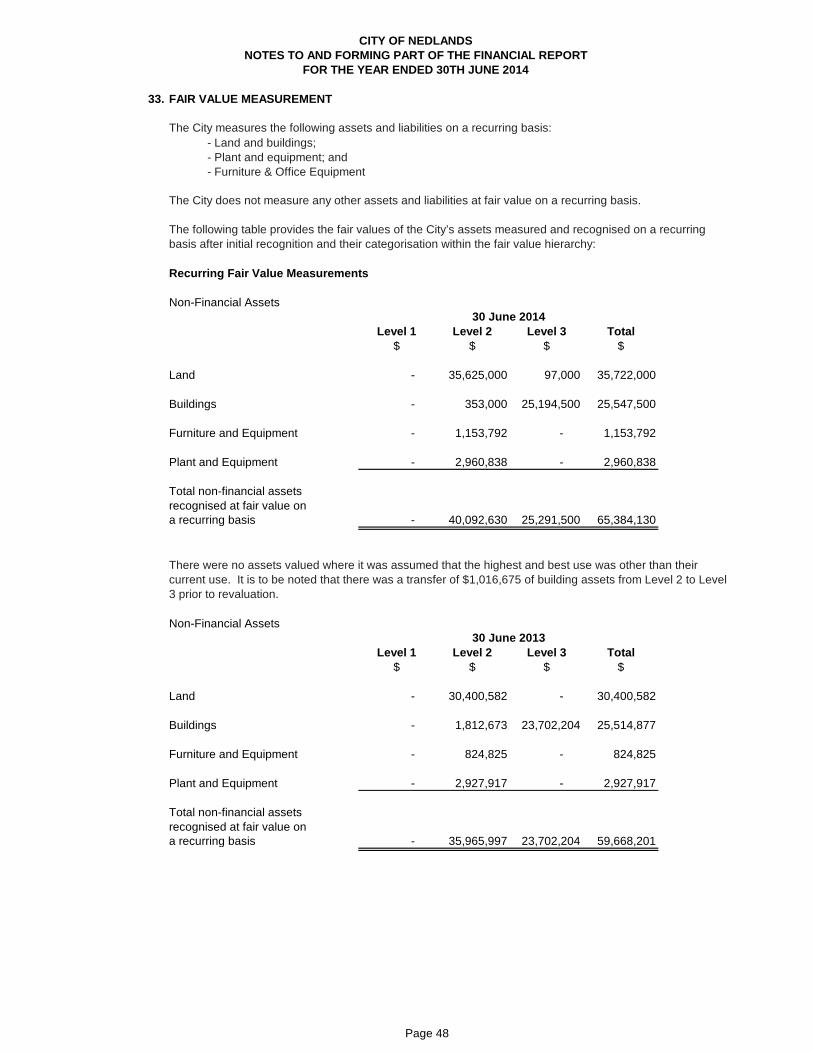
33. FAIR VALUE MEASUREMENT
- Land and buildings; - Plant and equipment; and- Furniture & Office Equipment
Recurring Fair Value Measurements
Non-Financial Assets
Level 1 Level 2 Level 3 Total$ $ $ $
Land - 35,625,000 97,000 35,722,000
Buildings - 353,000 25,194,500 25,547,500
Furniture and Equipment - 1,153,792 - 1,153,792
Plant and Equipment - 2,960,838 - 2,960,838
Total non-financial assetsrecognised at fair value ona recurring basis - 40,092,630 25,291,500 65,384,130
Non-Financial Assets
Level 1 Level 2 Level 3 Total$ $ $ $
Land - 30,400,582 - 30,400,582
Buildings - 1,812,673 23,702,204 25,514,877
Furniture and Equipment - 824,825 - 824,825
Plant and Equipment - 2,927,917 - 2,927,917
Total non-financial assetsrecognised at fair value ona recurring basis - 35,965,997 23,702,204 59,668,201
The following table provides the fair values of the City’s assets measured and recognised on a recurring basis after initial recognition and their categorisation within the fair value hierarchy:
There were no assets valued where it was assumed that the highest and best use was other than their current use. It is to be noted that there was a transfer of $1,016,675 of building assets from Level 2 to Level 3 prior to revaluation.
CITY OF NEDLANDS
30 June 2014
30 June 2013
NOTES TO AND FORMING PART OF THE FINANCIAL REPORTFOR THE YEAR ENDED 30TH JUNE 2014
The City measures the following assets and liabilities on a recurring basis:
The City does not measure any other assets and liabilities at fair value on a recurring basis.
Page 48

33. FAIR VALUE MEASUREMENT (Continued)
Recurring Fair Value Measurements (Continued)
Quantitative Information about the significant unobservable inputs and relationship to fair value
Description Land vested and under the Specialised buildingsControl of City - Golf Courses
Value as at 30 June 2014 $97,000 $25,194,500
Valuation technique Income and Cost approach Cost approach (depreciatedreplacement cost)
Unobservable inputs Ground rent Relationship between asset consumption rating scale and the level of consumed service potential
Range of inputs +/- 5% +/- 5%(probability-weighted average)
Relationship of unobservable A change of 5 % would result in a A change of 5 % would result in a inputs to fair value change in fair value by $4,850 change in fair value by $1,259,724
Valuation processes
The City’s land and buildings were independently valued in June 2011 on market value basis. Management decided that the values obtained in 2011, less accumulated depreciation for buildings, represent fair value as at 30 June 2013. Additions since the independent valuation until 30 June 2013 were included at cost. The policy of the City of Nedlands is to recognise transfers into and transfers out of the fair value hierarchy levels as at the end of the reporting period.
An annual assessment is undertaken to determine whether the carrying amount of the assets is materially different from the fair value. If any variation is considered material a revaluation is undertaken either by comprehensive revaluation or by applying an interim revaluation using appropriate indices.
As at 30 June 2014 a comprehensive revaluation was undertaken for all land and building assets by GriffinValuation Advisory.
CITY OF NEDLANDSNOTES TO AND FORMING PART OF THE FINANCIAL REPORT
FOR THE YEAR ENDED 30TH JUNE 2014
The council engages external, independent and qualified valuers to determine the fair value of the entity’s land, buildings, infrastructure and major plant on a regular basis.
Page 49
CITY OF NEDLANDSNOTES TO AND FORMING PART OF THE FINANCIAL REPORT
FOR THE YEAR ENDED 30TH JUNE 2014
33. FAIR VALUE MEASUREMENT (Continued)
Valuation processes (Continued)
Disclosed Fair Value Measurements
- Borrowings
Fair ValueHierarchy Valuation
Description Note Level Technique Inputs Used
LiabilitiesBorrowings 34 2 Income Current
approach treasuryusing borrowingdiscounted rates for cash flow similarmethodology instruments
Income Capitalisation Approach for Vested Land under the Control of the City. This approach considers income and expense data relating to the property being valued and estimates value through a capitalisation process. Capitalisation relates income, usually a net income figure, and a defined value type by converting an income amount into a value estimate. This process may consider direct relationships, yield or discount rates.
Relationship between asset consumption rating scale and the level of consumed service potential: Under the cost approach the estimated cost to replace the asset is calculated and then adjusted to take account of an accumulated depreciation. In order to achieve this the valuer determines an asset consumption rating scale for each asset type based on the interrelationship between a range of factors. These factors and their relationship to the fair value require professional judgement and include asset condition, legal and commercial obsolescence, and the determination of key depreciation related assumptions such as residual value, useful life and pattern of consumption of the future economic benefit.
There has been no change in the valuation technique used to calculate the fair values disclosed in the notes to the financial statements.
The following assets and liabilities are not measured at fair value in the statement of financial position, but their fair values are disclosed in the notes:
The following table provides the level of fair value hierarchy within which the disclosed fair value measurements are categorised in their entirety and a description of the valuation technique and inputs used:
The main Level 3 inputs used are derived and evaluated as follows:
Page 50

CITY OF NEDLANDSNOTES TO AND FORMING PART OF THE FINANCIAL REPORT
FOR THE YEAR ENDED 30TH JUNE 2014
34. FINANCIAL RISK MANAGEMENT
foreign currency risk.
Carrying Value Fair Value2014 2013 2014 2013
$ $ $ $Financial AssetsCash and cash equivalents 9,513,653 9,264,584 9,513,653 9,264,584Receivables 1,076,839 1,518,850 1,076,839 1,518,850
10,590,492 10,783,434 10,590,492 10,783,434
Financial LiabilitiesPayables 1,705,522 1,689,075 1,705,522 1,689,075Borrowings 4,789,859 6,009,279 4,315,478 5,374,901
6,495,381 7,698,354 6,021,000 7,063,976
Fair value is determined as follows:
• Cash and Cash Equivalents, Receivables, Payables - estimated to the carrying value whichapproximates net market value.
• Borrowings, Held to Maturity Investments, estimated future cash flows discounted by the current market interest rates applicable to assets and liabilities with similar risk profiles.
• Financial Assets at Fair Value through profit and loss, Available for Sale Financial Assets - based on quoted market prices at the reporting date or independent valuation.
interest rate risk. The City’s overall risk management focuses on the unpredictability of financial markets and seeks to minimise potential adverse effects on the financial performance of the City.
City’s activities expose it to a variety of financial risks including price risk, credit risk, liquidity risk and
City does not engage in transactions expressed in foreign currencies and is therefore not subject to
Financial risk management is carried out by the finance area under policies approved by the City.
The City held the following financial instruments at balance date:
Page 51
CITY OF NEDLANDSNOTES TO AND FORMING PART OF THE FINANCIAL REPORT
FOR THE YEAR ENDED 30TH JUNE 2014
34. FINANCIAL RISK MANAGEMENT (Continued)(a) Cash and Cash Equivalents
The major risk associated with investments is price risk - the risk that the capital value of investmentsmay fluctuate due to changes in market prices, whether these changes are caused by factors specificto individual financial instruments of their issuers or factors affecting similar instruments traded in amarket.
could affect returns.
2014 2013$ $
Impact of a 1% (1) (2013 - 2%) movement in interest rates on cash
- Equity 95,100 185,300 - Statement of Comprehensive Income 95,100 (2) 185,300 (*)
Notes:(1)
(2)
obligations under a financial instrument resulting in a financial loss to City.
banks. City also seeks advice from independent advisers (where applicable) before placing any cash and investments.
Sensitivity percentages based on management's expectation of future possible market movements.
Maximum impact.
level of liquidity and preserving capital. The finance area manages the cash and investments portfolio with the assistance of independent advisers (where applicable). City has an investment policy and the policy is subject to review by City. An Investment Report is provided to City on a monthly basis setting out the make-up and performance of the portfolio.
Cash and investments are also subject to interest rate risk - the risk that movements in interest rates
Another risk associated with cash is credit risk – the risk that a contracting entity will not complete its
City manages these risks by diversifying its portfolio and only investing in registered commercial
City’s objective is to maximise its return on cash and investments whilst maintaining an adequate
Page 52
CITY OF NEDLANDSNOTES TO AND FORMING PART OF THE FINANCIAL REPORT
FOR THE YEAR ENDED 30TH JUNE 2014
34. FINANCIAL RISK MANAGEMENT (Continued)(b) Receivables
most non-rate debtors.
2014 2013
Percentage of Rates and Annual Charges
- Current 1.43% 4.86% - Overdue 3.27% 6.72%
Percentage of Other Receivables
- Current 51.38% 22.97% - Overdue 48.62% 77.03%
risk associated with these receivables is credit risk – the risk that the debts may not be repaid. City manages this risk by monitoring outstanding debt and employing debt recovery policies. It also
City’s major receivables comprise rates and annual charges and user charges and fees. The major
City makes suitable provision for doubtful receivables as required and carries out credit checks on
There are no material receivables that have been subject to a re-negotiation of repayment terms.
encourages ratepayers to pay rates by the due date through incentives.
a secured charge over the land – that is, the land can be sold to recover the debt. City is also able to charge interest on overdue rates and annual charges at higher than market rates, which further encourages payment.
monitored for acceptable collection performance.
Credit risk on rates and annual charges is minimised by the ability of City to recover these debts as
The profile of the City’s credit risk at balance date was:
The level of outstanding receivables is reported to City monthly and benchmarks are set and
Page 53
CIT
Y O
F N
ED
LA
ND
SN
OT
ES
TO
AN
D F
OR
MIN
G P
AR
T O
F T
HE
FIN
AN
CIA
L R
EP
OR
TF
OR
TH
E Y
EA
R E
ND
ED
30T
H J
UN
E 2
014
34.
FIN
AN
CIA
L R
ISK
MA
NA
GE
ME
NT
(C
on
tin
ued
)(c
)P
ayab
les
Bo
rro
win
gs
Du
eD
ue
Du
eT
ota
lw
ith
inb
etw
een
afte
rco
ntr
actu
alC
arry
ing
1 ye
ar1
& 5
yea
rs5
year
sca
sh f
low
sva
lues
$$
$$
$20
14
Pay
able
s1,
341,
330
-
-
1,34
1,33
01,
641,
017
Bor
row
ings
798,
950
3,14
5,77
11,
719,
746
5,66
4,46
74,
789,
859
2,14
0,28
03,
145,
771
1,71
9,74
67,
005,
797
6,43
0,87
6
2013
Pay
able
s1,
689,
075
-
-
1,68
9,07
51,
689,
075
Bor
row
ings
1,53
1,21
33,
195,
800
2,46
8,66
77,
195,
680
6,00
9,27
93,
220,
288
3,19
5,80
02,
468,
667
8,88
4,75
57,
698,
354
Pay
able
s an
d bo
rrow
ings
are
bot
h su
bjec
t to
liqui
dity
ris
k –
that
is th
e ris
k th
at in
suffi
cien
t fun
ds m
ay b
e on
han
d to
mee
t pay
men
t obl
igat
ions
The
con
trac
tual
und
isco
unte
d ca
sh fl
ows
of C
ounc
il’s
Pay
able
s an
d B
orro
win
gs a
re s
et o
ut in
the
Liqu
idity
Sen
sitiv
ity T
able
bel
ow:
as a
nd w
hen
they
fall
due.
Cou
ncil
man
ages
this
ris
k by
mon
itorin
g its
cas
h flo
w r
equi
rem
ents
and
liqu
idity
leve
ls a
nd m
aint
aini
ng a
n ad
equa
te
cash
buf
fer.
Pay
men
t ter
ms
can
be e
xten
ded
and
over
draf
t fac
ilitie
s dr
awn
upon
if r
equi
red.
Pag
e 54

CIT
Y O
F N
ED
LA
ND
SN
OT
ES
TO
AN
D F
OR
MIN
G P
AR
T O
F T
HE
FIN
AN
CIA
L R
EP
OR
TF
OR
TH
E Y
EA
R E
ND
ED
30T
H J
UN
E 2
014
34.
FIN
AN
CIA
L R
ISK
MA
NA
GE
ME
NT
(C
on
tin
ued
)
(c)
Pay
able
sB
orr
ow
ing
s (C
on
tin
ued
)
nego
tiatio
n.
The
follo
win
g ta
bles
set
out
the
carr
ying
am
ount
, by
mat
urity
, of t
he fi
nanc
ial i
nstr
umen
ts e
xpos
ed to
inte
rest
rat
e ris
k:W
eig
hte
dA
vera
ge
Eff
ecti
ve<1
yea
r>1
<2 y
ears
>2<3
yea
rs>3
<4 y
ears
>4<5
yea
rs>5
yea
rsT
ota
lIn
tere
st R
ate
$$
$$
$$
$%
Yea
r E
nd
ed 3
0 Ju
ne
2014
Bo
rro
win
gs
Fix
ed R
ate
Deb
entu
res
-
-
-
-
-
4,
789,
859
4,78
9,85
95.
55%
Wei
ghte
d A
vera
geE
ffect
ive
Inte
rest
Rat
e5.
55%
Yea
r E
nd
ed 3
0 Ju
ne
2013
Bo
rro
win
gs
Fix
ed R
ate
Deb
entu
res
705,
269
-
-
-
-
5,30
4,01
16,
009,
280
5.58
%W
eigh
ted
Ave
rage
Effe
ctiv
e In
tere
st R
ate
5.78
%5.
55%
Bor
row
ings
are
als
o su
bjec
t to
inte
rest
rat
e ris
k -
the
risk
that
mov
emen
ts in
inte
rest
rat
es c
ould
adv
erse
ly a
ffect
fund
ing
cost
s. C
ounc
il m
anag
es th
is r
isk
by b
orro
win
g lo
ng te
rm a
nd fi
the
inte
rest
rat
e to
the
situ
atio
n co
nsid
ered
the
mos
t adv
anta
geou
s at
the
time
of
Pag
e 55


71 Stirling Highway Nedlands WA 6009PO Box 9 Nedlands WA 6909
T 9273 3500F 9273 3670TTY 9273 3646
www.nedlands.wa.gov.au
This document is available in alternative formats upon request. Printed on 100 per cent recycled paper.