2014 July GrayReports - Student Demand Trends
38
GRAYREPORTS Demand for Educational Programs www.GrayAssociates.com Results through July 2014
-
Upload
gray-associates-inc -
Category
Education
-
view
210 -
download
0
Transcript of 2014 July GrayReports - Student Demand Trends

GRAYREPORTS Demand for Educational Programs
www.GrayAssociates.com
Results through July 2014
617.401.7662 www.GrayAssociates.com 2
GRAY For more information please contact Bob Atkins. Email: [email protected]
Agenda
1. Introduction
2. Demand: National Overview
3. Demand for On-Line Programs
4. Demand for On-Ground Programs
5. Medical Assisting: Preview of Upcoming Report
6. Summary

617.401.7662 www.GrayAssociates.com 3
GRAY For more information please contact Bob Atkins. Email: [email protected]
Key Demand Trends and Observations
1. Data on market demand is now available that can help guide your decision.
2. Overall inquiry volume was down in July.
3. However, conversions appear to be increasing.
4. Market share is shifting between on-line and on-ground programs.
5. Market share is also shifting from PPI to internal inquiries.
6. In September, a new report will be available to help you take advantage of an emerging opportunity in Medical Assisting.
617.401.7662 www.GrayAssociates.com 4
GRAY For more information please contact Bob Atkins. Email: [email protected]
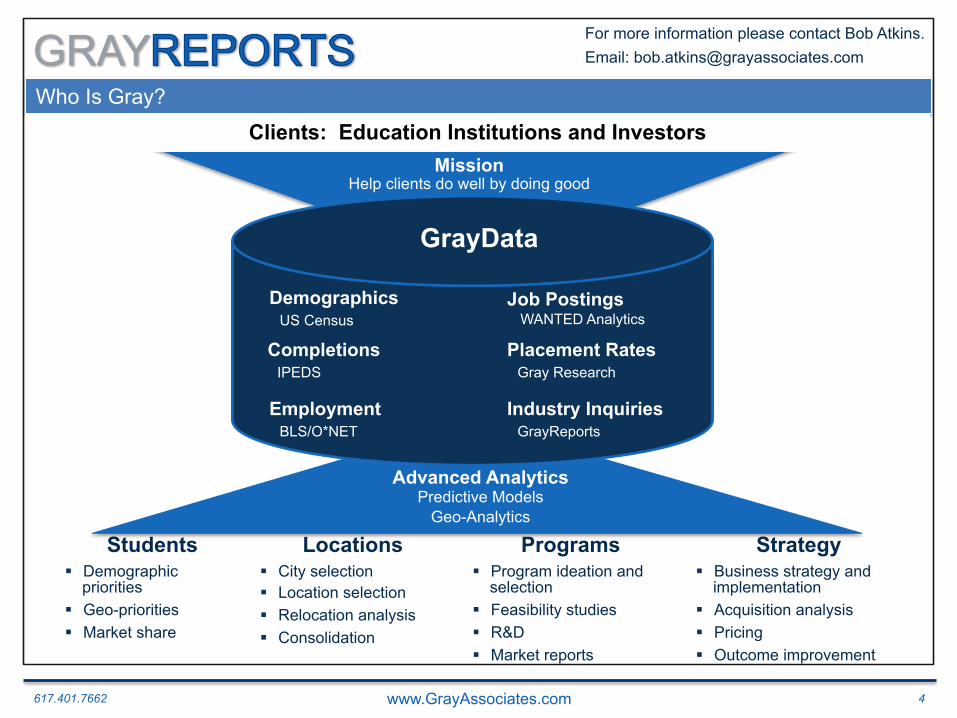
Who Is Gray?
GrayData
Completions IPEDS
Employment BLS/O*NET
Placement Rates Gray Research
Industry Inquiries GrayReports
Demographics US Census
Job Postings WANTED Analytics
Students Programs Strategy Locations § Demographic
priorities § Geo-priorities § Market share
§ City selection § Location selection § Relocation analysis § Consolidation
§ Program ideation and selection
§ Feasibility studies § R&D § Market reports
§ Business strategy and implementation
§ Acquisition analysis § Pricing § Outcome improvement
Advanced Analytics Predictive Models
Geo-Analytics
Clients: Education Institutions and Investors Mission
Help clients do well by doing good
617.401.7662 www.GrayAssociates.com 5
GRAY For more information please contact Bob Atkins. Email: [email protected]
What is GrayReports?
Nearly 32 million qualified inquiries January 2012 to the present
Over 880,000 new inquiries in July 149 programs with over 10,000 inquiries
257 cities with over 10,000 inquiries

617.401.7662 www.GrayAssociates.com 6
GRAY For more information please contact Bob Atkins. Email: [email protected]
Agenda
1. Introduction
2. Demand: National Overview
3. Demand for On-Line Programs
4. Demand for On-Ground Programs
5. Medical Assisting: Preview of Upcoming Report
6. Summary

617.401.7662 www.GrayAssociates.com 7
GRAY For more information please contact Bob Atkins. Email: [email protected]
Education Industry Inquiry Growth
Inquiry volume took another dip in July. § Inquiries for the first seven months of 2014 have declined approximately 6.2% year-over-year. § In June, the decline slowed to just 2.0% year-over-year. § In July, the industry recorded a 10% year-over-year decline.
2012
0.00
0.20
0.40
0.60
0.80
1.00
1.20
Jan Feb Mar Apr May Jun Jul Aug Sep Oct Nov Dec
Inquiries (Millions)
Education Industry Inquiries All Programs and Award Levels
2013
2014
-10% YOY

617.401.7662 www.GrayAssociates.com 8
GRAY For more information please contact Bob Atkins. Email: [email protected]
Internal Inquiry Share
Internal inquiries are gaining share.
§ From January through March internal inquiries were stable versus last year.
§ April, May, and June all reported year-over-year increases of greater than 20%.
§ In July, internal inquiry share jumped 81% year-over-year to almost 30% of our sample.
2012
0%
5%
10%
15%
20%
25%
30%
35%
Jan Feb Mar Apr May Jun Jul Aug Sep Oct Nov Dec
Internal Inquiry Share
Education Industry: Internal Inquiries All Programs and Award Levels
2013
2014
81% YOY

617.401.7662 www.GrayAssociates.com 9
GRAY For more information please contact Bob Atkins. Email: [email protected]
1. Applications are counted in the month in which the inquiry was received (i.e., an inquiry that is received in January and converts in March will be counted as a January inquiry). Typically, the application rate will rise for at least three months after the month in which the inquiries were received.
2.9%
2.6%
3.0%
2.8%
2.9%
3.5%
3.3%
3.1%
2.8%
2.9%
2.9%
2.9%
3.3%
3.0%
3.5%
3.3%
3.3%
3.0%
2.4%
0.00%
0.50%
1.00%
1.50%
2.00%
2.50%
3.00%
3.50%
4.00%
Jan Feb Mar Apr May Jun Jul Aug Sep Oct Nov Dec
App
licat
ion
Rat
e
Education Industry Conversion Rates 2013 2014
Inquiry to Application: Conversion Rates
Immature Months1
Inquiry-to-application conversion rates have strengthened in recent months. § The first four months of 2014 are mature and have outperformed 2013. § May 2014 is nearly mature and has already outperformed 2013 by 12.4%. § July is starting strong and if the trend from the rest of the year holds it should outperform 2013.

617.401.7662 www.GrayAssociates.com 10
GRAY For more information please contact Bob Atkins. Email: [email protected]
Education Industry Conversion Growth
Conversion volumes are improving. § April had the lowest year-over-year growth thus far of 5.6%. § May still has the opportunity to improve but is already up 8.2% over last year.
2012
- 5,000
10,000 15,000 20,000 25,000 30,000 35,000 40,000
Jan Feb Mar Apr May Jun Jul Aug Sep Oct Nov Dec
Conversions (Millions)
Education Industry Conversions All Programs and Award Levels 2013 2014
1. Applications are counted in the month in which the inquiry was received (i.e., an inquiry that is received in January and converts in March will be counted as a January inquiry). Typically, the application rate will rise for at least three months after the month in which the inquiries were received.
Immature Months1
617.401.7662 www.GrayAssociates.com 11
GRAY For more information please contact Bob Atkins. Email: [email protected]
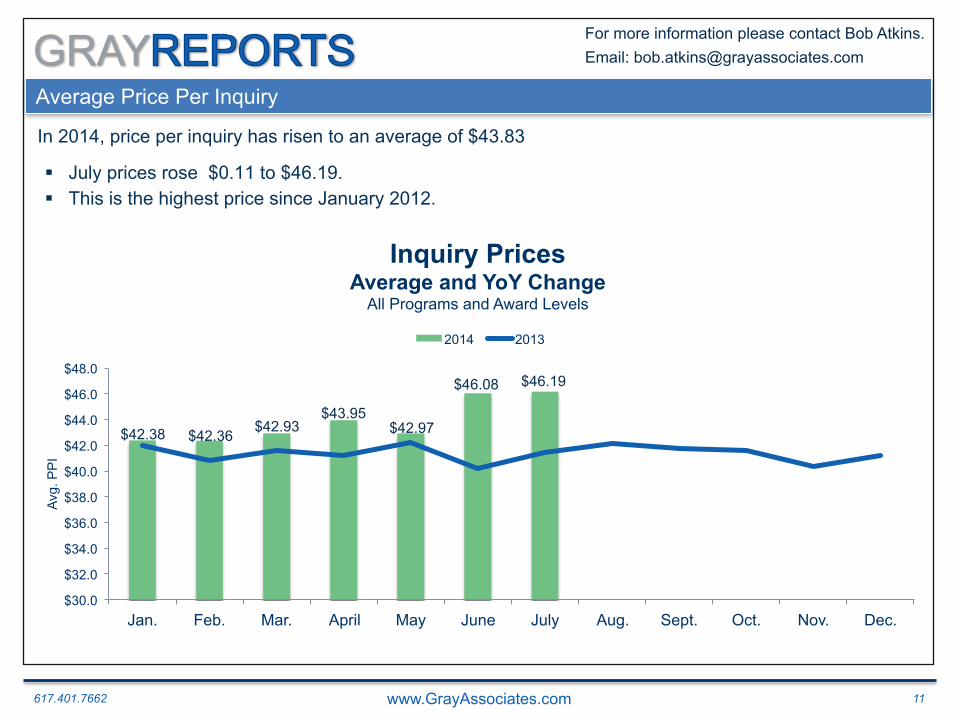
§ July prices rose $0.11 to $46.19. § This is the highest price since January 2012.
Average Price Per Inquiry
In 2014, price per inquiry has risen to an average of $43.83
$30.0
$32.0
$34.0
$36.0
$38.0
$40.0
$42.0
$44.0
$46.0
$48.0
Jan. Feb. Mar. April May June July Aug. Sept. Oct. Nov. Dec.
Avg.
PP
I
Inquiry Prices Average and YoY Change
All Programs and Award Levels
2014 2013
$42.38 $42.36 $42.93 $43.95
$42.97
$46.08 $46.19
617.401.7662 www.GrayAssociates.com 12
GRAY For more information please contact Bob Atkins. Email: [email protected]
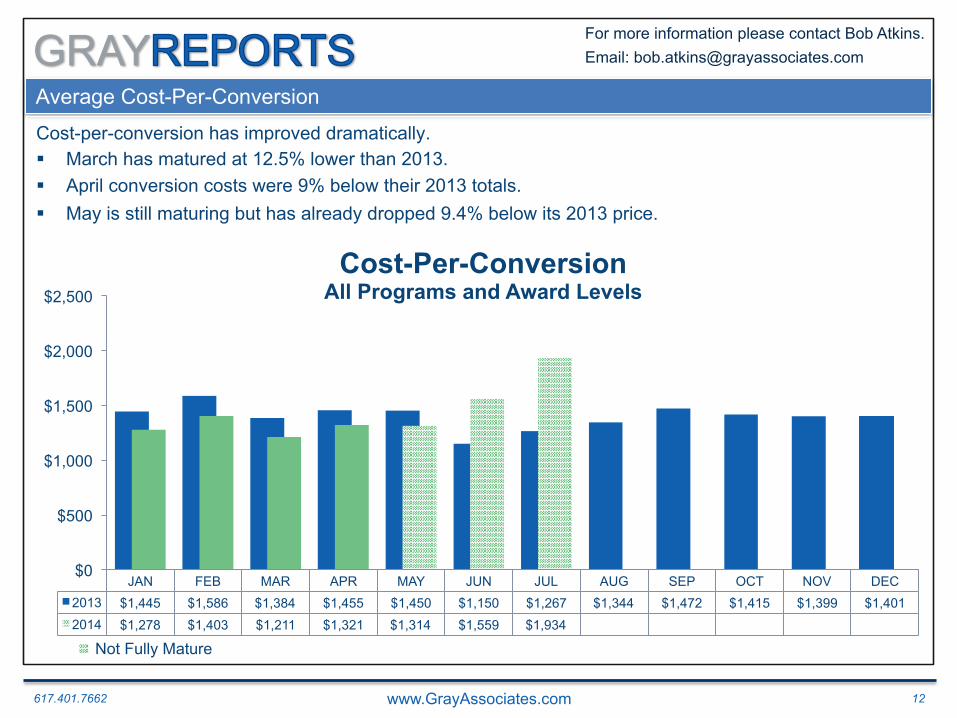
Average Cost-Per-Conversion
Cost-per-conversion has improved dramatically. § March has matured at 12.5% lower than 2013. § April conversion costs were 9% below their 2013 totals. § May is still maturing but has already dropped 9.4% below its 2013 price.
JAN FEB MAR APR MAY JUN JUL AUG SEP OCT NOV DEC 2013 $1,445 $1,586 $1,384 $1,455 $1,450 $1,150 $1,267 $1,344 $1,472 $1,415 $1,399 $1,401 2014 $1,278 $1,403 $1,211 $1,321 $1,314 $1,559 $1,934
$0
$500
$1,000
$1,500
$2,000
$2,500
Cost-Per-Conversion All Programs and Award Levels
Not Fully Mature
617.401.7662 www.GrayAssociates.com 13
GRAY For more information please contact Bob Atkins. Email: [email protected]
Agenda
1. Introduction
2. Demand: National Overview
3. Demand for On-Line Programs
4. Demand for On-Ground Programs
5. Medical Assisting: Preview of Upcoming Report
6. Summary
617.401.7662 www.GrayAssociates.com 14
GRAY For more information please contact Bob Atkins. Email: [email protected]
-
100,000
200,000
300,000
400,000
500,000
600,000
Jan Feb Mar Apr May Jun Jul Aug Sep Oct Nov Dec
Inquiries
Inquiries for On-Line Programs All Programs and Award Levels
2013
2014
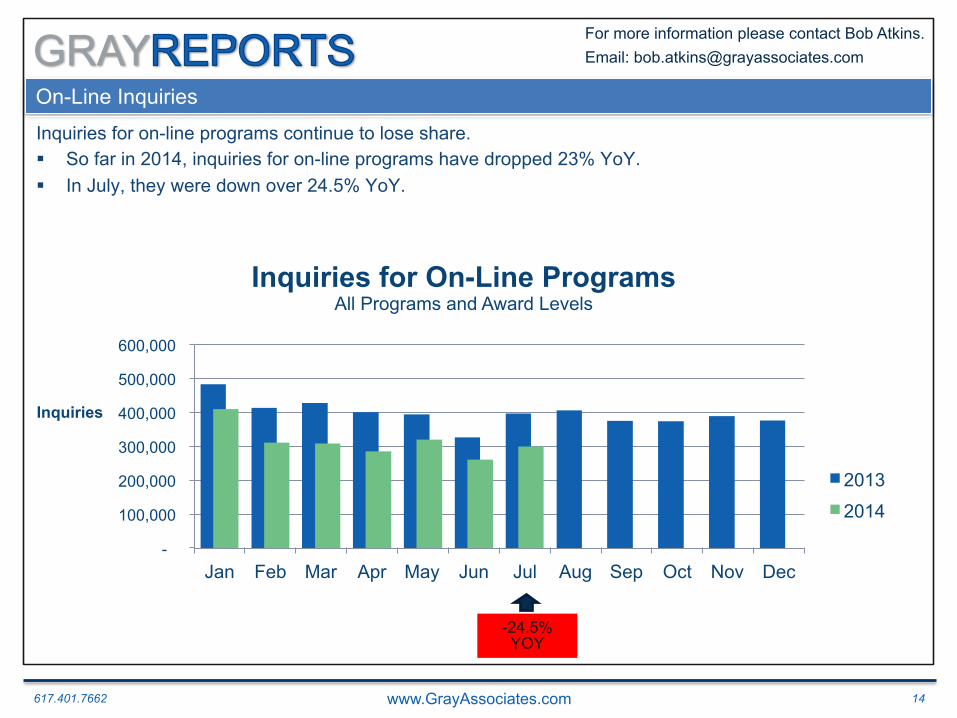
On-Line Inquiries Education Industry Inquiries: YOY Percent Change Inquiries for on-line programs continue to lose share. § So far in 2014, inquiries for on-line programs have dropped 23% YoY. § In July, they were down over 24.5% YoY.
-24.5% YOY

617.401.7662 www.GrayAssociates.com 15
GRAY For more information please contact Bob Atkins. Email: [email protected]
1.9%
1.9%
2.2%
2.2%
2.2%
3.7%
2.0%
2.2%
2.0%
2.3%
1.9%
2.0%
1.9%
1.8%
2.5%
2.7%
2.9%
2.3%
2.2%
0.00%
0.50%
1.00%
1.50%
2.00%
2.50%
3.00%
3.50%
4.00%
Jan Feb Mar Apr May Jun Jul Aug Sep Oct Nov Dec
App
licat
ion
Rat
e
On-Line Education Industry Conversion Rates 2013 2014
On-Line Inquiry to Application: Conversion Rates
Immature Months1
Conversion rates were poor in the first two months of Q1, but are improving. § Application rates improved in March, April, and May, which is not yet mature and will likely exceed 3%. § June does not appear likely to outperform 2013, but July is already ahead and has two more months
until maturity.
1. Applications are counted in the month in which the inquiry was received (i.e., an inquiry that is received in January and converts in March will be counted as a January inquiry). Typically, the application rate will rise for at least three months after the month in which the inquiries were received.
617.401.7662 www.GrayAssociates.com 16
GRAY For more information please contact Bob Atkins. Email: [email protected]
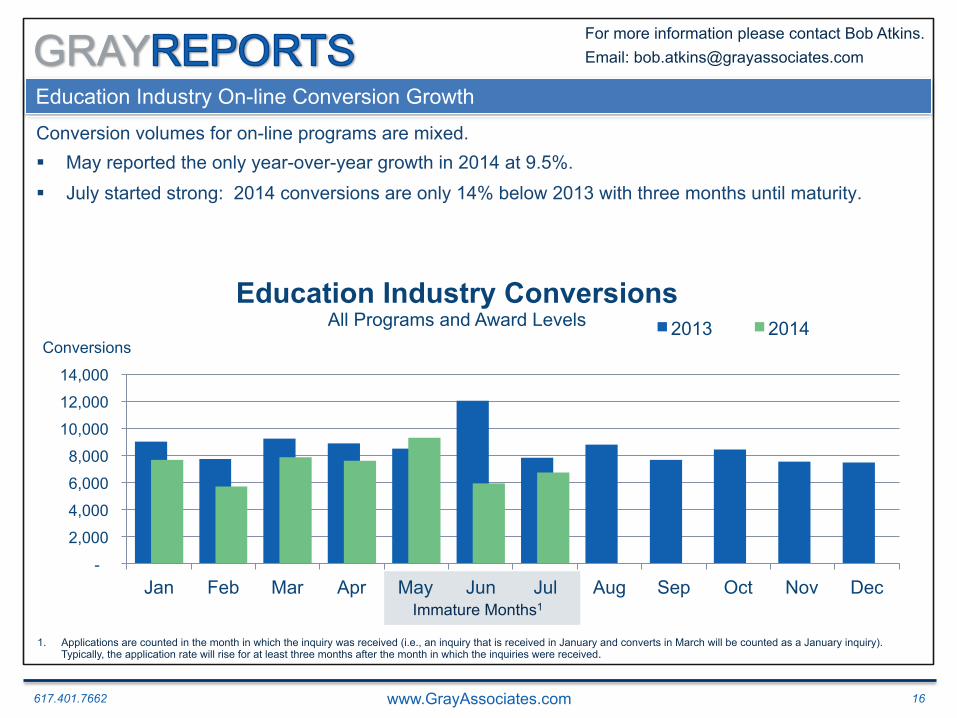
Education Industry On-line Conversion Growth
Conversion volumes for on-line programs are mixed. § May reported the only year-over-year growth in 2014 at 9.5%. § July started strong: 2014 conversions are only 14% below 2013 with three months until maturity.
2012
-
2,000
4,000
6,000
8,000
10,000
12,000
14,000
Jan Feb Mar Apr May Jun Jul Aug Sep Oct Nov Dec
Conversions
Education Industry Conversions All Programs and Award Levels 2013 2014
1. Applications are counted in the month in which the inquiry was received (i.e., an inquiry that is received in January and converts in March will be counted as a January inquiry). Typically, the application rate will rise for at least three months after the month in which the inquiries were received.
Immature Months1
617.401.7662 www.GrayAssociates.com 17
GRAY For more information please contact Bob Atkins. Email: [email protected]
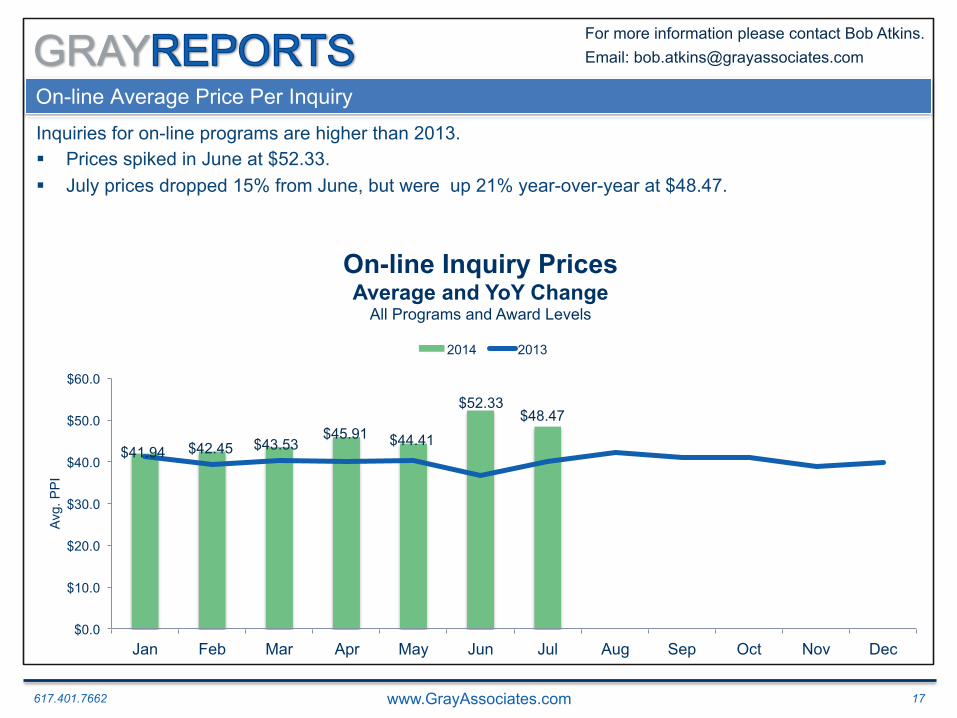
On-line Average Price Per Inquiry
Inquiries for on-line programs are higher than 2013. § Prices spiked in June at $52.33. § July prices dropped 15% from June, but were up 21% year-over-year at $48.47.
$0.0
$10.0
$20.0
$30.0
$40.0
$50.0
$60.0
Jan Feb Mar Apr May Jun Jul Aug Sep Oct Nov Dec
Avg.
PP
I
On-line Inquiry Prices Average and YoY Change
All Programs and Award Levels
2014 2013
$41.94 $42.45 $43.53 $45.91 $44.41
$52.33 $48.47
617.401.7662 www.GrayAssociates.com 18
GRAY For more information please contact Bob Atkins. Email: [email protected]
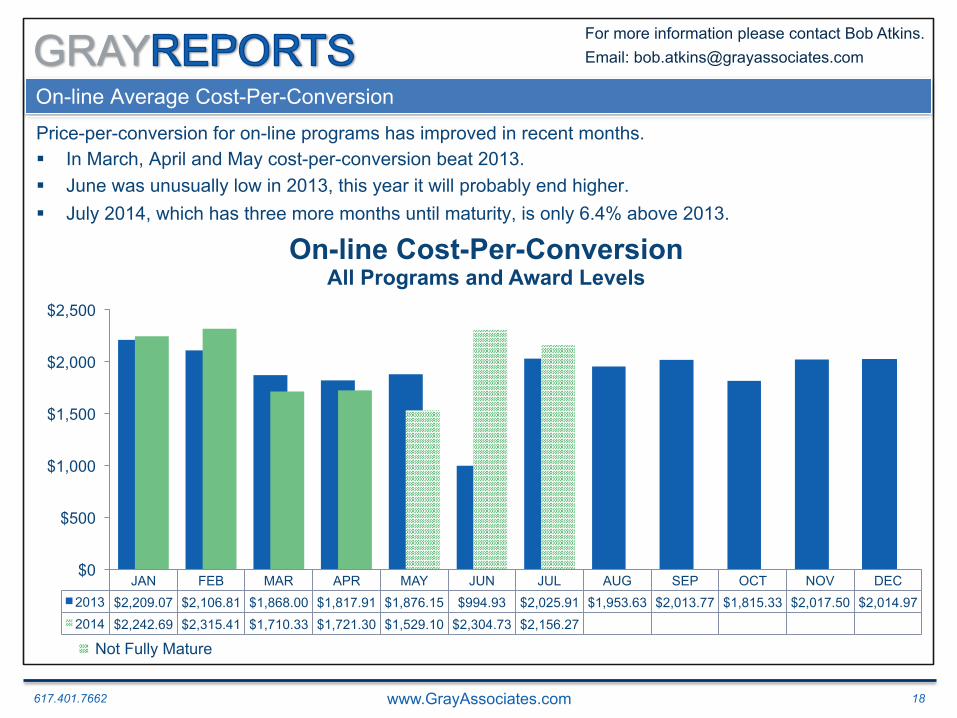
On-line Average Cost-Per-Conversion
Price-per-conversion for on-line programs has improved in recent months. § In March, April and May cost-per-conversion beat 2013. § June was unusually low in 2013, this year it will probably end higher. § July 2014, which has three more months until maturity, is only 6.4% above 2013.
JAN FEB MAR APR MAY JUN JUL AUG SEP OCT NOV DEC 2013 $2,209.07 $2,106.81 $1,868.00 $1,817.91 $1,876.15 $994.93 $2,025.91 $1,953.63 $2,013.77 $1,815.33 $2,017.50 $2,014.97 2014 $2,242.69 $2,315.41 $1,710.33 $1,721.30 $1,529.10 $2,304.73 $2,156.27
$0
$500
$1,000
$1,500
$2,000
$2,500
On-line Cost-Per-Conversion All Programs and Award Levels
Not Fully Mature
617.401.7662 www.GrayAssociates.com 19
GRAY For more information please contact Bob Atkins. Email: [email protected]
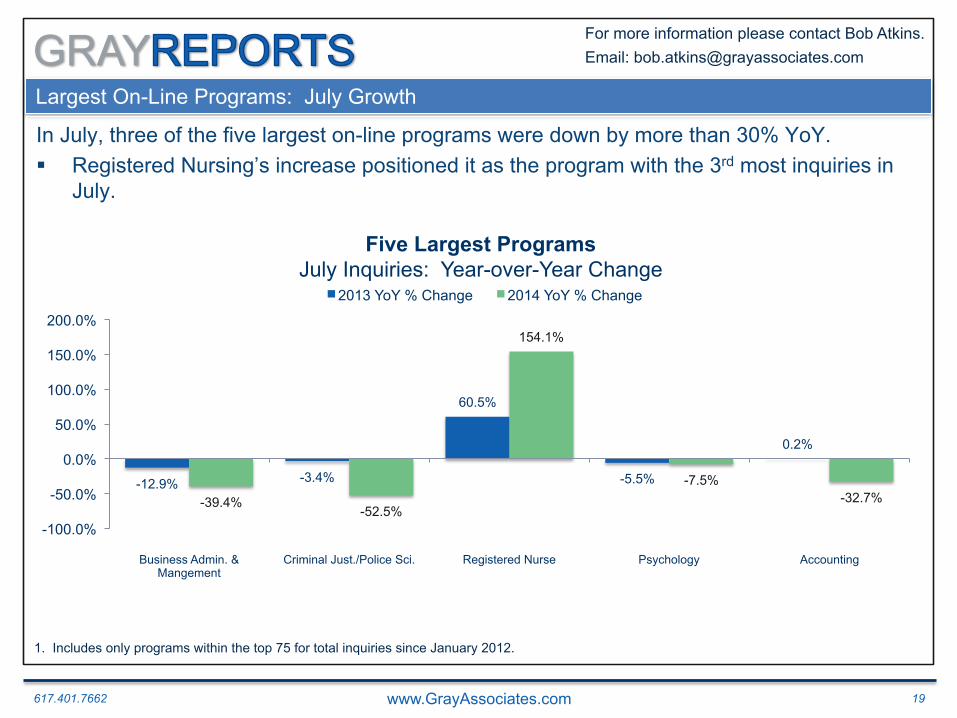
Largest On-Line Programs: July Growth
In July, three of the five largest on-line programs were down by more than 30% YoY. § Registered Nursing’s increase positioned it as the program with the 3rd most inquiries in
July.
-12.9% -3.4%
60.5%
-5.5%
0.2%
-39.4% -52.5%
154.1%
-7.5% -32.7%
-100.0%
-50.0%
0.0%
50.0%
100.0%
150.0%
200.0%
Business Admin. & Mangement
Criminal Just./Police Sci. Registered Nurse Psychology Accounting
Five Largest Programs July Inquiries: Year-over-Year Change
2013 YoY % Change 2014 YoY % Change
1. Includes only programs within the top 75 for total inquiries since January 2012.

617.401.7662 www.GrayAssociates.com 20
GRAY For more information please contact Bob Atkins. Email: [email protected]
Top 5 Fastest-Growing On-Line Programs in July
The five fastest-growing programs1 all grew over 140% year-over-year in July. § Three of the programs grew more than 500%. § Three healthcare programs were on the list of fastest growing programs in July. § Computer Systems, Networking and Telecommunications was the fastest growing program in July.
-88.9% -82.1% -88.7%
60.5%
-42.4%
760.7% 688.9%
537.7%
154.1% 141.5%
-100.0% 0.0%
100.0% 200.0% 300.0% 400.0% 500.0% 600.0% 700.0% 800.0% 900.0%
Comp. Systems Network & Telecom.
Health Prof. & Related Progs.
Health Information/ Med. Records
Registered Nursing Cognitive Science
Industry Inquiries Fastest Growing Programs – July 2014
2013 YoY % Change 2014 YoY % Change
1. Includes only programs within the top 75 for total inquiries since January 2012.

617.401.7662 www.GrayAssociates.com 21
GRAY For more information please contact Bob Atkins. Email: [email protected]
On-Line Program Fastest-Growing Cities of the Top 75
There was moderate growth in the fastest-growing cities1 for on-line programs. § Four of the top five cities are in California. § Columbus, OH is the only non-California city, but it declined 1.3% in July.
-56.5% -52.5% -48.8% -54.5%
-30.6%
12.7% 6.8% 5.5%
1.6%
-1.3%
-60.0%
-50.0%
-40.0%
-30.0%
-20.0%
-10.0%
0.0%
10.0%
20.0%
San Jose, CA Los Angeles, CA Riverside-San Bernardino, CA
Sacramento, CA Columbus, OH
Industry Inquiries 5 Highest Growth Markets – July 2014
2013 YoY % Change 2014 YoY % Change
1. Includes only the top 75 cities by inquiry volume since January 2012. Data includes a 15-mile radius from the center of the CBSA.
617.401.7662 www.GrayAssociates.com 22
GRAY For more information please contact Bob Atkins. Email: [email protected]
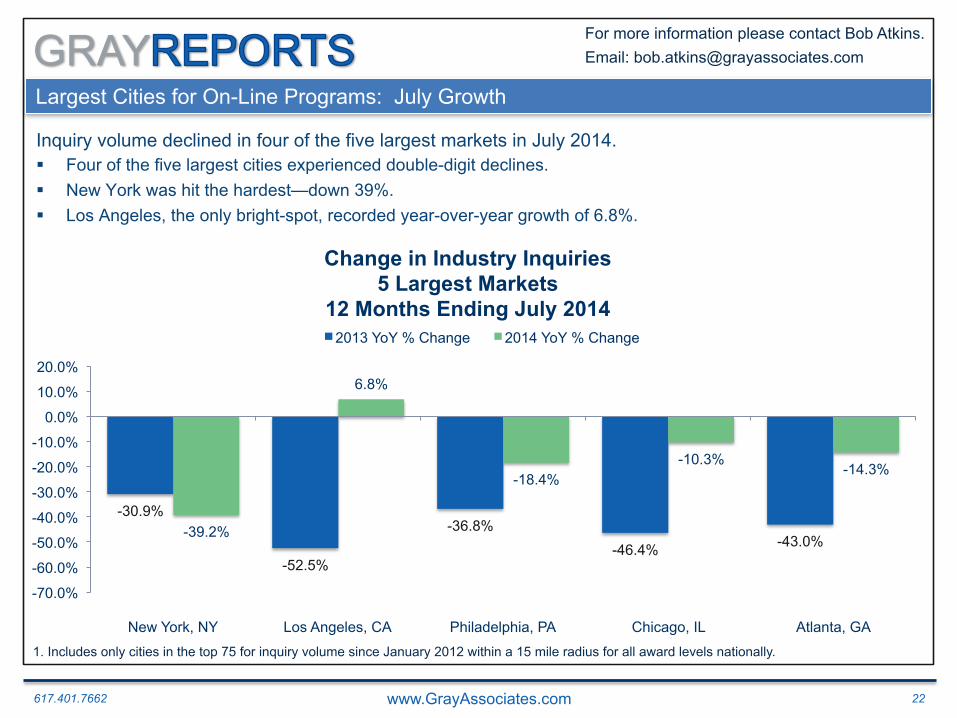
Largest Cities for On-Line Programs: July Growth
Inquiry volume declined in four of the five largest markets in July 2014. § Four of the five largest cities experienced double-digit declines. § New York was hit the hardest—down 39%. § Los Angeles, the only bright-spot, recorded year-over-year growth of 6.8%.
-30.9%
-52.5%
-36.8% -46.4% -43.0% -39.2%
6.8%
-18.4% -10.3%
-14.3%
-70.0%
-60.0%
-50.0%
-40.0%
-30.0%
-20.0%
-10.0%
0.0%
10.0%
20.0%
New York, NY Los Angeles, CA Philadelphia, PA Chicago, IL Atlanta, GA
Change in Industry Inquiries 5 Largest Markets
12 Months Ending July 2014 2013 YoY % Change 2014 YoY % Change
1. Includes only cities in the top 75 for inquiry volume since January 2012 within a 15 mile radius for all award levels nationally.
617.401.7662 www.GrayAssociates.com 23
GRAY For more information please contact Bob Atkins. Email: [email protected]
Agenda
1. Introduction
2. Demand: National Overview
3. Demand for On-Line Programs
4. Demand for On-Ground Programs
5. Medical Assisting: Preview of Upcoming Report
6. Summary
617.401.7662 www.GrayAssociates.com 24
GRAY For more information please contact Bob Atkins. Email: [email protected]
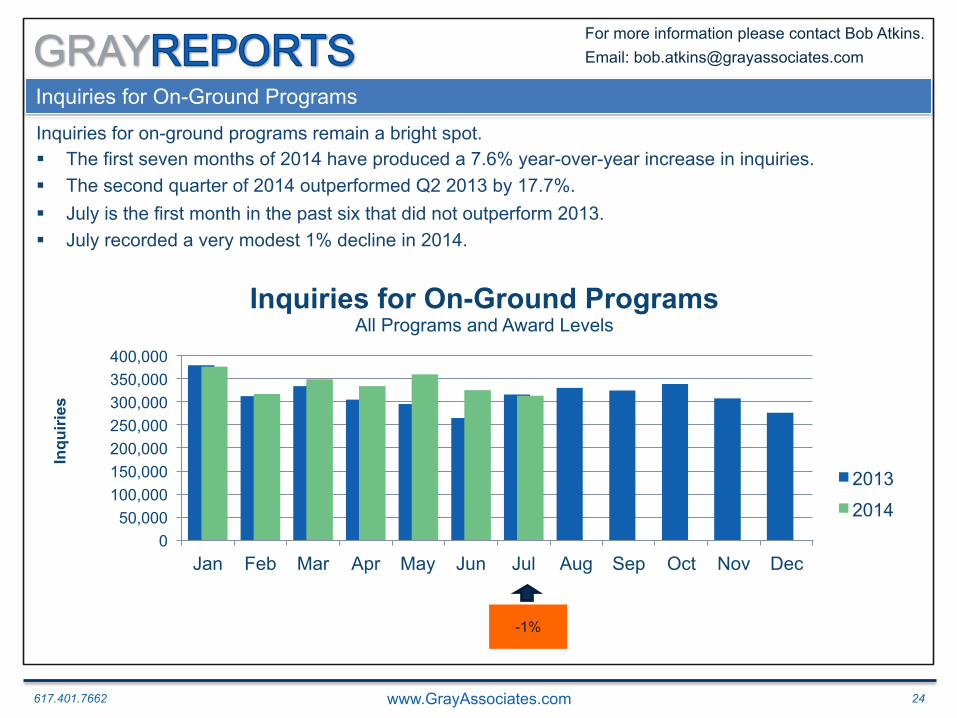
Inquiries for On-Ground Programs
Inquiries for on-ground programs remain a bright spot. § The first seven months of 2014 have produced a 7.6% year-over-year increase in inquiries. § The second quarter of 2014 outperformed Q2 2013 by 17.7%. § July is the first month in the past six that did not outperform 2013. § July recorded a very modest 1% decline in 2014.
2012
0 50,000
100,000 150,000 200,000 250,000 300,000 350,000 400,000
Jan Feb Mar Apr May Jun Jul Aug Sep Oct Nov Dec
Inqu
iries
Inquiries for On-Ground Programs All Programs and Award Levels
2013
2014
-1%
617.401.7662 www.GrayAssociates.com 25
GRAY For more information please contact Bob Atkins. Email: [email protected]
4.1%
3.6%
4.6%
4.2%
4.4%
4.1%
5.6%
4.0%
4.1%
4.1%
4.3%
4.8%
4.6%
4.2%
4.7%
4.1%
3.8%
3.4%
3.0%
0%
1%
2%
3%
4%
5%
6%
Jan Feb Mar Apr May Jun Jul Aug Sep Oct Nov Dec
Inquiry-to- Application
Conversion Rate
Education Industry Conversion Rates 2013 2014
On-Ground Inquiry to Application: Conversion Rates
Immature Months1
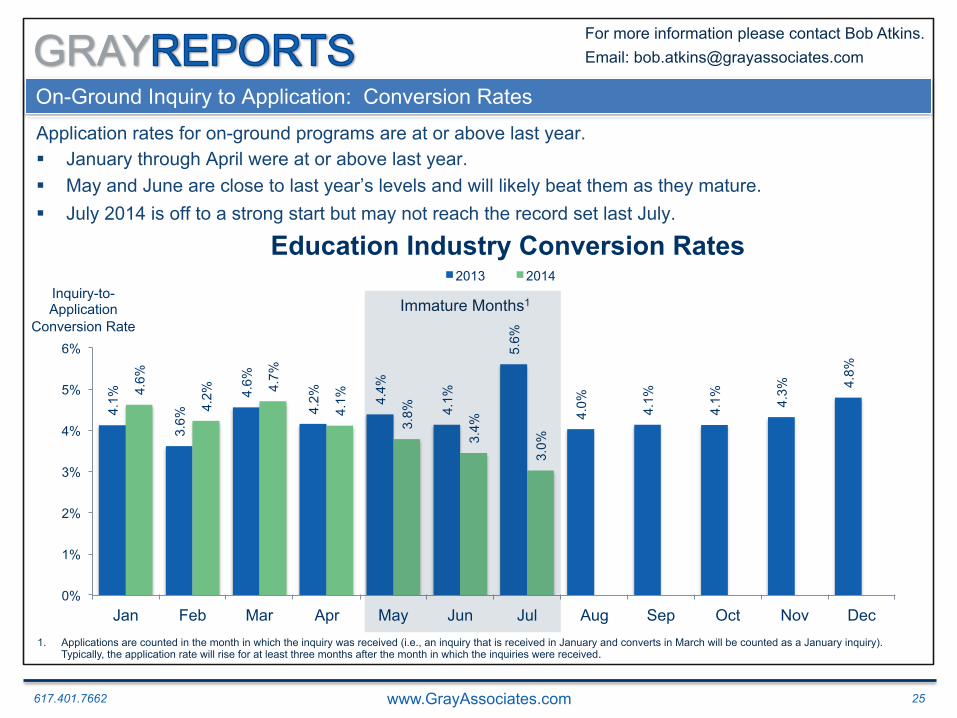
Application rates for on-ground programs are at or above last year. § January through April were at or above last year. § May and June are close to last year’s levels and will likely beat them as they mature. § July 2014 is off to a strong start but may not reach the record set last July.
1. Applications are counted in the month in which the inquiry was received (i.e., an inquiry that is received in January and converts in March will be counted as a January inquiry). Typically, the application rate will rise for at least three months after the month in which the inquiries were received.

617.401.7662 www.GrayAssociates.com 26
GRAY For more information please contact Bob Atkins. Email: [email protected]
Education Industry On-Ground Conversion Growth
Conversion volumes are improving. § Each mature month has reported growth of over 7.5%. § May and June are already ahead of 2013, and will continue to improve. § July 2013 set the record last year; July 2014 started strong, but has a long way to go.
2012
- 2,000 4,000 6,000 8,000
10,000 12,000 14,000 16,000 18,000 20,000
Jan Feb Mar Apr May Jun Jul Aug Sep Oct Nov Dec
Conversions
Education Industry Conversions All Programs and Award Levels 2013 2014
1. Applications are counted in the month in which the inquiry was received (i.e., an inquiry that is received in January and converts in March will be counted as a January inquiry). Typically, the application rate will rise for at least three months after the month in which the inquiries were received.
Immature Months1

617.401.7662 www.GrayAssociates.com 27
GRAY For more information please contact Bob Atkins. Email: [email protected]
On-Ground Average Price Per Inquiry
July of 2014 marks the first year-over-year increase in inquiry prices in 2014. § July is the first month since May of 2013 where on-ground inquiry prices increased above $40.00.
$39.25 $38.76 $39.67 $39.75 $38.60 $38.76 $41.99
$0.0
$10.0
$20.0
$30.0
$40.0
$50.0
Jan. Feb. March April May June July Aug. Sept. Oct. Nov. Dec.
Avg.
PP
I
On-Ground Inquiry Prices Average and YoY Change
All Programs and Award Levels 2014 2013
617.401.7662 www.GrayAssociates.com 28
GRAY For more information please contact Bob Atkins. Email: [email protected]
On-Ground Average Cost-Per-Conversion
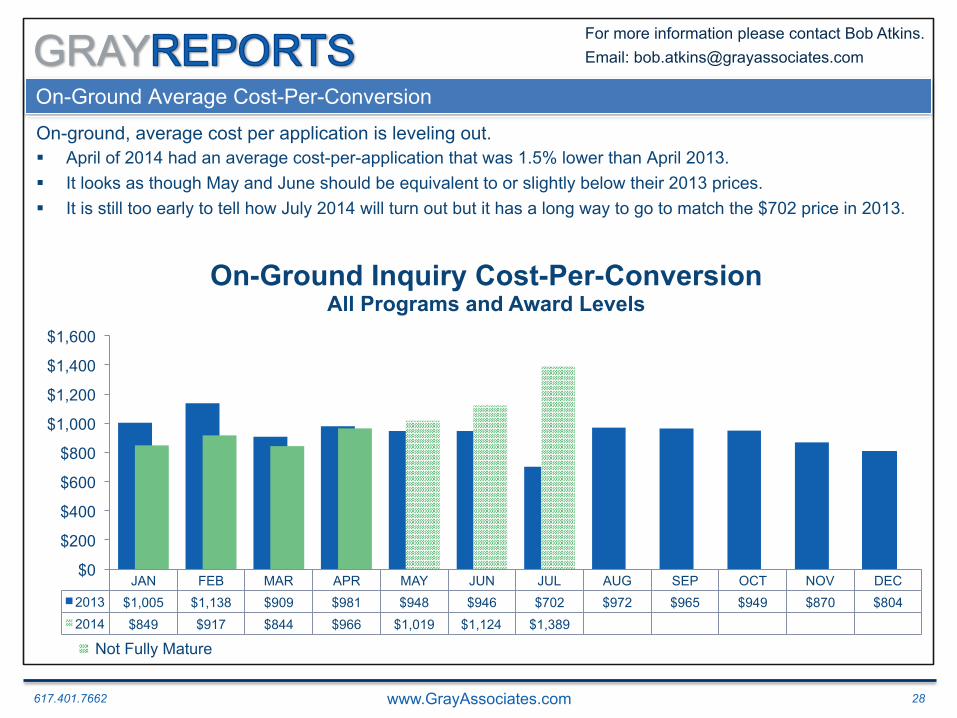
On-ground, average cost per application is leveling out. § April of 2014 had an average cost-per-application that was 1.5% lower than April 2013. § It looks as though May and June should be equivalent to or slightly below their 2013 prices. § It is still too early to tell how July 2014 will turn out but it has a long way to go to match the $702 price in 2013.
JAN FEB MAR APR MAY JUN JUL AUG SEP OCT NOV DEC 2013 $1,005 $1,138 $909 $981 $948 $946 $702 $972 $965 $949 $870 $804 2014 $849 $917 $844 $966 $1,019 $1,124 $1,389
$0
$200
$400
$600
$800
$1,000
$1,200
$1,400
$1,600
On-Ground Inquiry Cost-Per-Conversion All Programs and Award Levels
Not Fully Mature
617.401.7662 www.GrayAssociates.com 29
GRAY For more information please contact Bob Atkins. Email: [email protected]
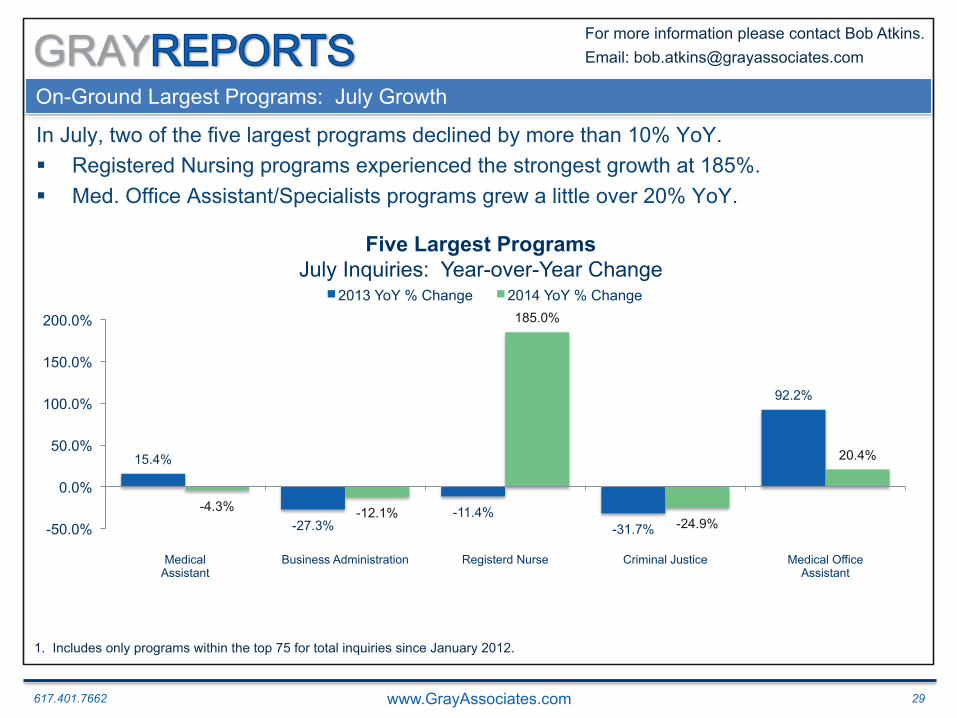
On-Ground Largest Programs: July Growth
In July, two of the five largest programs declined by more than 10% YoY. § Registered Nursing programs experienced the strongest growth at 185%. § Med. Office Assistant/Specialists programs grew a little over 20% YoY.
15.4%
-27.3% -11.4%
-31.7%
92.2%
-4.3% -12.1%
185.0%
-24.9%
20.4%
-50.0%
0.0%
50.0%
100.0%
150.0%
200.0%
Medical Assistant
Business Administration Registerd Nurse Criminal Justice Medical Office Assistant
Five Largest Programs July Inquiries: Year-over-Year Change
2013 YoY % Change 2014 YoY % Change
1. Includes only programs within the top 75 for total inquiries since January 2012.
617.401.7662 www.GrayAssociates.com 30
GRAY For more information please contact Bob Atkins. Email: [email protected]
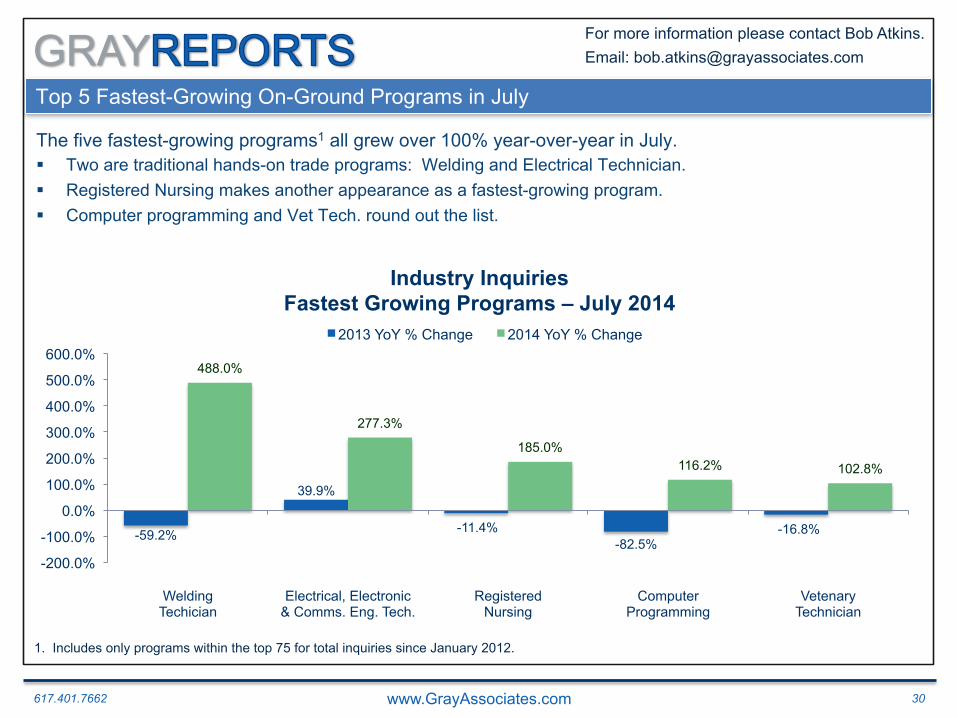
Top 5 Fastest-Growing On-Ground Programs in July
The five fastest-growing programs1 all grew over 100% year-over-year in July. § Two are traditional hands-on trade programs: Welding and Electrical Technician. § Registered Nursing makes another appearance as a fastest-growing program. § Computer programming and Vet Tech. round out the list.
-59.2%
39.9%
-11.4% -82.5%
-16.8%
488.0%
277.3%
185.0% 116.2% 102.8%
-200.0%
-100.0%
0.0%
100.0%
200.0%
300.0%
400.0%
500.0%
600.0%
Welding Techician
Electrical, Electronic & Comms. Eng. Tech.
Registered Nursing
Computer Programming
Vetenary Technician
Industry Inquiries Fastest Growing Programs – July 2014
2013 YoY % Change 2014 YoY % Change
1. Includes only programs within the top 75 for total inquiries since January 2012.

617.401.7662 www.GrayAssociates.com 31
GRAY For more information please contact Bob Atkins. Email: [email protected]
Fastest-Growing Cities for On-Ground Programs
Among the 75 largest cities, the fastest-growing cities1 are all up over 30%. § Two of the five largest markets were amongst the fastest-growing cities in July 2014. § The market share for the fastest-growing cities increased from 4.4% in 2013 to 6.3% in 2014.
-41.6%
9.8%
-28.1% -20.8% -9.0%
47.4% 44.0% 43.1% 40.7% 33.9%
-30.0%
-20.0%
-10.0%
0.0%
10.0%
20.0%
30.0%
40.0%
50.0%
60.0%
New York, NY Riverside-San Bernardino, CA
Bridgeport-Stamford, CT Hartford, CT Los Angeles, CA
Industry Inquiries 5 Highest Growth Markets – July 2014
2013 YoY % Change 2014 YoY % Change
1. Includes only the top 75 cities by inquiry volume since January 2012. Data includes a 15-mile radius from the center of the CBSA.
617.401.7662 www.GrayAssociates.com 32
GRAY For more information please contact Bob Atkins. Email: [email protected]
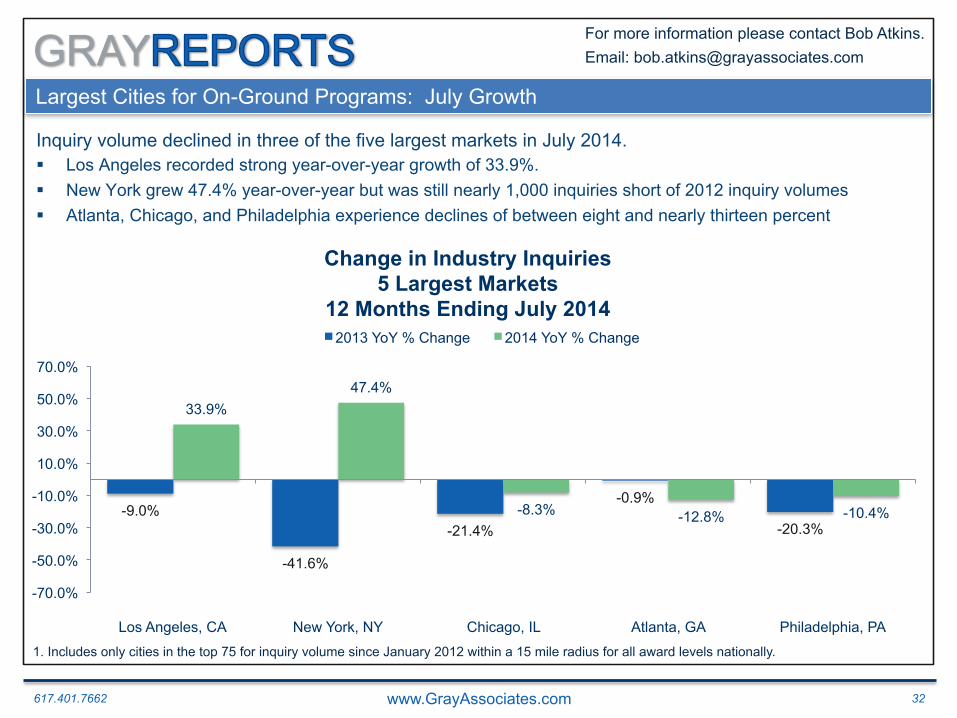
Largest Cities for On-Ground Programs: July Growth
Inquiry volume declined in three of the five largest markets in July 2014. § Los Angeles recorded strong year-over-year growth of 33.9%. § New York grew 47.4% year-over-year but was still nearly 1,000 inquiries short of 2012 inquiry volumes § Atlanta, Chicago, and Philadelphia experience declines of between eight and nearly thirteen percent
-9.0%
-41.6%
-21.4%
-0.9%
-20.3%
33.9% 47.4%
-8.3% -12.8% -10.4%
-70.0%
-50.0%
-30.0%
-10.0%
10.0%
30.0%
50.0%
70.0%
Los Angeles, CA New York, NY Chicago, IL Atlanta, GA Philadelphia, PA
Change in Industry Inquiries 5 Largest Markets
12 Months Ending July 2014 2013 YoY % Change 2014 YoY % Change
1. Includes only cities in the top 75 for inquiry volume since January 2012 within a 15 mile radius for all award levels nationally.
617.401.7662 www.GrayAssociates.com 33
GRAY For more information please contact Bob Atkins. Email: [email protected]
XXX Agenda
1. Introduction
2. Demand: National Overview
3. Demand for On-Line Programs
4. Demand for On-Ground Programs
5. Medical Assisting: Preview of Upcoming Report
6. Summary
617.401.7662 www.GrayAssociates.com 34
GRAY For more information please contact Bob Atkins. Email: [email protected]
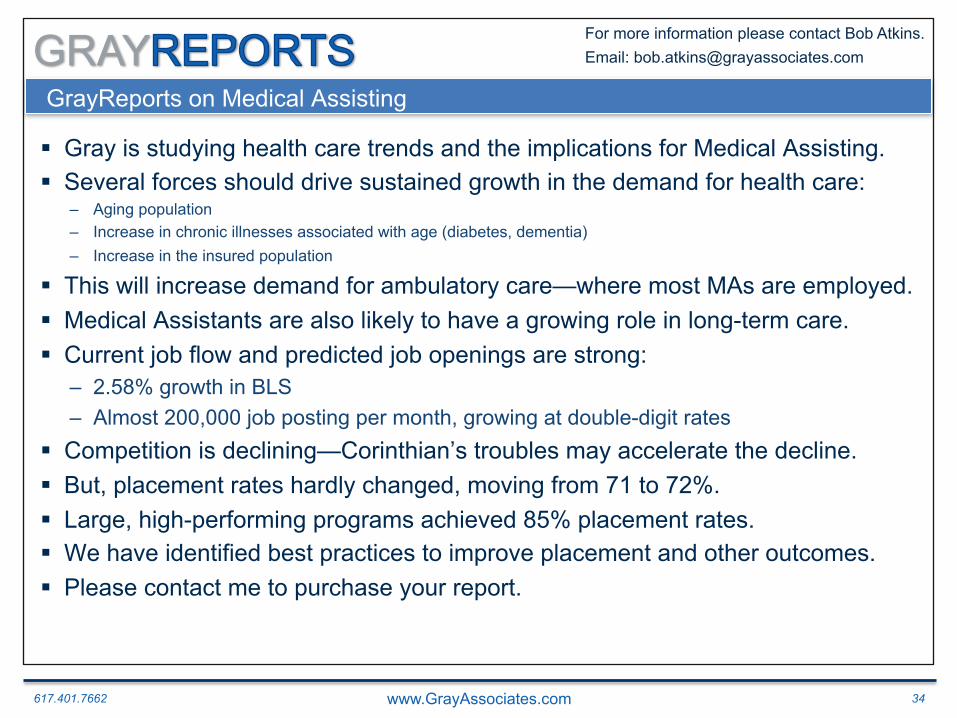
§ Gray is studying health care trends and the implications for Medical Assisting. § Several forces should drive sustained growth in the demand for health care:
– Aging population – Increase in chronic illnesses associated with age (diabetes, dementia) – Increase in the insured population
§ This will increase demand for ambulatory care—where most MAs are employed. § Medical Assistants are also likely to have a growing role in long-term care. § Current job flow and predicted job openings are strong:
– 2.58% growth in BLS – Almost 200,000 job posting per month, growing at double-digit rates
§ Competition is declining—Corinthian’s troubles may accelerate the decline. § But, placement rates hardly changed, moving from 71 to 72%. § Large, high-performing programs achieved 85% placement rates. § We have identified best practices to improve placement and other outcomes. § Please contact me to purchase your report.
GrayReports on Medical Assisting
617.401.7662 www.GrayAssociates.com 35
GRAY For more information please contact Bob Atkins. Email: [email protected]
XXX Agenda
1. Introduction
2. Demand: National Overview
3. Demand for On-Line Programs
4. Demand for On-Ground Programs
5. Medical Assisting: Preview of Upcoming Report
6. Summary

617.401.7662 www.GrayAssociates.com 36
GRAY For more information please contact Bob Atkins. Email: [email protected]
Key Findings
Inquiry quality is improving and shifting from on-line to on-ground programs.
§ The shift from PPI to internal inquiries is now apparent.
§ Overall inquiries are down 10%, conversions and prices are up.
§ Inquiries for on-line programs declined 25%, but conversion rates rose—a lot.
§ Inquiries and conversions for on-ground programs are healthy.
§ Medical Assisting is a very large and challenging program, but it can be fixed.
617.401.7662 www.GrayAssociates.com 37
GRAY For more information please contact Bob Atkins. Email: [email protected]
How do I get Information for My Locations and Programs?
Gray Reports is offered as an annual subscription. § Customized for your locations § Customized for your programs § Monthly PDF overview of inquiry, application, and pricing tends in your markets § On-line access to your market data by program, campus, veteran’s status, years since
high school and other factors
617.401.7662 www.GrayAssociates.com 38
GRAY For more information please contact Bob Atkins. Email: [email protected]
Questions and Contacts
Please feel free to contact me: Bob Atkins
CEO Gray Associates, Inc.
617-401-7662
For the presentation or a recording of the session, please visit: GrayAssociates.com