2014 INSURANCE REGULATION REPORT CARD
34
2014 INSURANCE REGULATION REPORT CARD By R.J. Lehman INTRODUCTION S ince it opened its doors two years ago, R Street has issued an annual Insurance Regulation Report Card. This is the third edition of our annual examination of which states do the best job of regulating the busi- ness of insurance. R Street is dedicated to the mantra: “Free markets. Real solutions.” Toward that end, the approach we apply is to test which state regulatory systems best embody the principles of limited, effective and efficient government. In this context, that means states should regulate only those market activities where government is best-positioned to act; that they should do so competently and with measur- able results; and that their activities should lay the minimum possible financial burden on policyholders, companies and ultimately, taxpayers. There are three fundamental questions this report seeks to answer: 1. How free are consumers to choose the insurance products they want? R STREET POLICY STUDY NO. 30 December 2014 CONTENTS Introduction 1 Insurance and Government Regulation 3 Methodology 4 Solvency Regulation 4 Financial Exams 4 Run-Offs 5 Holding Company Act 5 Fraud 5 Consumer Protection 7 Politicization 9 Fiscal Efficiency 11 Tax and Fee Burden 11 Regulatory Surplus 11 Insurance Market Performance 13 Residual Markets 13 Market Concentration 13 Loss Ratios 13 Auto Insurance Markets 15 Residual Auto Market 15 Auto Insurance Concentration 16 Auto Insurance Loss Ratios 16 Homeowners Insurance Markets 16 Residual Homeowners Market 16 Homeowners Insurance Concentration 18 Homeowners Insurance Loss Ratios 18 Workers’ Comp Markets 18 Residual Workers’ Comp Market 18 Workers’ Comp Concentration 20 Workers Comp Loss Ratios 20 Underwriting Freedom 20 Rate Regulation 20 Regulatory Clarity 21 Rating Restrictions 22 Credit Scoring 22 Territorial Rating 23 Personal Factors 23 Regulatory Modernization 25 Collateral Reform 25 IIPRC 25 SLIMPACT 25 E-Commerce 25 Grading and Results 25 About the Author 34 Table 1: Solvency Regulation 6 Table 2: Antifraud Regulation 8 Table 3: Consumer Protection 10 Table 4: Politicization 12 Table 5: Fiscal Efficiency 14 Table 6: Auto Insurance 17 Table 7: Homeowners Insurance 19 Table 8: Workers’ Comp 21 Table 9: Rate Regulation and Clarity 22 Table 10: Rating Restrictions 23 Table 11: Regulatory Modernization 24 Table 12: 50 States Ranked by Total Score 33 R STREET POLICY STUDY: 2014 2014 INSURANCE REGULATION REPORT CARD 1
Transcript of 2014 INSURANCE REGULATION REPORT CARD

2014 INSURANCE REGULATION REPORT CARD
By R.J. Lehman
INTRODUCTION
Since it opened its doors two years ago, R Street has issued an annual Insurance Regulation Report Card. This is the third edition of our annual examination of which states do the best job of regulating the busi-
ness of insurance. R Street is dedicated to the mantra: “Free markets. Real solutions.” Toward that end, the approach we apply is to test which state regulatory systems best embody the principles of limited, effective and efficient government. In this context, that means states should regulate only those market activities where government is best-positioned to act; that they should do so competently and with measur-able results; and that their activities should lay the minimum possible financial burden on policyholders, companies and ultimately, taxpayers.
There are three fundamental questions this report seeks to answer:
1. How free are consumers to choose the insurance products they want?
R STREET POLICY STUDY NO. 30 December 2014
CONTENTS
Introduction 1 Insurance and Government Regulation 3Methodology 4Solvency Regulation 4 Financial Exams 4 Run-Offs 5 Holding Company Act 5Fraud 5Consumer Protection 7Politicization 9Fiscal Efficiency 11 Tax and Fee Burden 11 Regulatory Surplus 11Insurance Market Performance 13 Residual Markets 13 Market Concentration 13 Loss Ratios 13Auto Insurance Markets 15 Residual Auto Market 15 Auto Insurance Concentration 16 Auto Insurance Loss Ratios 16Homeowners Insurance Markets 16 Residual Homeowners Market 16 Homeowners Insurance Concentration 18 Homeowners Insurance Loss Ratios 18Workers’ Comp Markets 18 Residual Workers’ Comp Market 18 Workers’ Comp Concentration 20 Workers Comp Loss Ratios 20Underwriting Freedom 20Rate Regulation 20Regulatory Clarity 21Rating Restrictions 22 Credit Scoring 22 Territorial Rating 23 Personal Factors 23Regulatory Modernization 25 Collateral Reform 25 IIPRC 25 SLIMPACT 25 E-Commerce 25Grading and Results 25About the Author 34
Table 1: Solvency Regulation 6Table 2: Antifraud Regulation 8Table 3: Consumer Protection 10Table 4: Politicization 12Table 5: Fiscal Efficiency 14Table 6: Auto Insurance 17Table 7: Homeowners Insurance 19 Table 8: Workers’ Comp 21Table 9: Rate Regulation and Clarity 22Table 10: Rating Restrictions 23Table 11: Regulatory Modernization 24Table 12: 50 States Ranked by Total Score 33
R STREET POLICY STUDY: 2014 2014 INSURANCE REGULATION REPORT CARD 1

2. How free are insurers to provide the insurance prod-ucts consumers want?
3. How effectively are states discharging their duties to monitor insurer solvency, police fraud and consumer abuse and foster competitive, private insurance mar-kets?
For this year’s report, we have adjusted the weightings of some categories and incorporated new data sets into our analysis. Most notably, we have added new sections analyz-ing the resources state insurance departments set aside to respond to consumer complaints, as well as states’ efforts to modernize their regulatory apparatus through such efforts as reform of reinsurance collateral rules and participation in the Interstate Insurance Product Regulation Commission. We also have refined our analysis of states’ fraud-fighting resources to better measure the degree to which they are prepared to respond to levels of suspected fraud reported in each state. Finally, both in order to more equitably bal-ance the 12 macro rating categories this report tracks, and to provide more intuitive final scores, we have weighted the categories so as to track with a scale of zero to 100.
Reviewing the data on insurance in 2014, we see mostly sta-ble trends in consumer and business freedom in the personal lines and workers’ comp markets, and in some states (nota-bly, Florida) real efforts were made to scale back, or other-wise place on more sound financial footing, residual insur-ance markets and state-run insurance entities. On the whole, however, relatively few state legislatures took up bills this year that would move the needle of business and consumer freedom appreciably. And finally, some states (notably, North Carolina) appear to be heading in the wrong direction, seeing growth in their residual market property insurance entities. Among the major events relevant to insurance regulation in 2014:
• In March, President Barack Obama signed into law the Homeowner Flood Insurance Affordability Act (also known as Grimm-Waters), which rolled back some reforms to the National Flood Insur-ance Program passed by Congress in 2012 as part of the Biggert-Waters Flood Insurance Reform Act. 1 R Street and the smartersafer.org coalition helped craft Biggert-Waters and opposed this bill.
• The U.S. Senate, in June, passed S. 2270, the Insurance Capital Standards Clarification Act, which amends the Dodd-Frank Act to clarify that insurers designated for supervision by the Federal Reserve
1. Clint Durrett, “Obama signs bill into law preventing flood insurance rate hikes,” WDSU, March 21, 2014. http://www.wdsu.com/news/local-news/new-orleans/obama-signs-bill-into-law-preventing-flood-insurance-rate-hikes/25093406
Board of Governors will not be subject to minimum leverage and minimum risk-based capital require-ments designed for banks. Among other tweaks, such insurers would be allowed to report their financials in accordance with Statutory Accounting Principles, rather than Generally Accepted Accounting Princi-ples.2 In September, the U.S. House passed the relat-ed, but not identical, H.R.5461. The measures had not yet been reconciled as of the time of this report.3
• Florida Gov. Rick Scott in June signed legislation creating a regulatory framework for private sector insurers to offer flood insurance coverage.4 The mea-sure was based, in part, on an R Street proposal.5
• Also in Florida, the Office of Insurance Regulation in July announced that assessments that had been levied on nearly every property insurance policy in the state since 2007 to support the state-sponsored Florida Hurricane Catastrophe Fund would be elimi-nated as of January 2015, 18 months ahead of sched-ule.6 Earlier in the year, the state Senate Community Affairs Committee and the Banking and Insurance Committee approved a measure to scale back the size of the Cat Fund, but it failed to move forward in the Senate Appropriations Committee.7
• In September, California Gov. Jerry Brown signed legislation establishing a regulatory framework, including basic insurance requirements, for trans-portation network companies.8 The measure was the result of a lengthy legislative debate and ultimately represented a workable compromise between the insurance and ride-sharing industries.
• Colorado Gov. John Hickenlooper signed a similar bill in June, allowing TNCs to continue operating in
2. U.S. Senate, “S.2270 - Insurance Capital Standards Clarification Act of 2014,” Congress.gov, Accessed Nov. 6, 2014. https://www.congress.gov/bill/113th-congress/senate-bill/2270
3. U.S. House of Representatives, “H.R.5461 - To clarify the application of certain leverage and risk-based requirements under the Dodd-Frank Wall Street Reform and Consumer Protection Act, to improve upon the definitions provided for points and fees in connection with a mortgage transaction, and for other purposes,” Congress.gov, Accessed Nov. 6, 2014.
4. Florida Senate, S.B. 542, June 13, 2014. http://www.flsenate.gov/Session/Bill/2014/0542
5. Christian Cámara, “A state approach to flood insurance reform in Florida,” R Street Institute, Nov. 5, 2014. http://www.rstreet.org/policy-study/a-state-approach-to-flood-insurance-reform-in-florida/
6. Press release, “Office Issues Orders Terminating Certain Cat Fund Emergency Assessments,” Florida Office of Insurance Regulation, July 22, 2014. http://www.floir.com/PressReleases/viewmediarelease.aspx?id=2069
7. Florida Senate, S.B. 482, May 2, 2014. http://www.flsenate.gov/Session/Bill/2014/0482
8.California Legislature, A.B. 2293, Sept. 17, 2014. http://www.leginfo.ca.gov/pub/13-14/bill/asm/ab_2251-2300/ab_2293_bill_20140922_status.html
R STREET POLICY STUDY: 2014 2014 INSURANCE REGULATION REPORT CARD 2

the state and requiring them to provide their drivers primary insurance coverage.9 The measure also calls on the Division of Insurance to study the market and make recommendations for ways insurers could bet-ter cover these emerging risks.
• In June, Connecticut Gov. Dannel Malloy signed legislation barring property insurers from requir-ing policyholders at heightened risk of windstorm damage to install storm shutters. The measure also extends the period for policyholders to bring post-claim suits against their insurers from 18 to 24 months.10
• In Hawaii, a number of bills gained traction that likely would have negative consequences for workers’ comp rates in the state. The state House committees on Finance; Consumer Protection & Commerce; and Labor & Public Employment all approved legisla-tion changing the process for approving independent medical examinations and permanent impairment rating examinations for workers’ compensation claims, raising concerns about added administra-tive costs and increased conflicts between employers and their employees.11 However, the measure didn’t move to the House floor. The state Senate Committee on Judiciary and Labor passed legislation penal-izing employers who do not pay temporary partial disability benefits within 14 calendar days, but the measure did not pass the Committee on Ways and Means.12 Finally, both chambers passed slightly vary-ing versions of legislation calling for annual updates to the state’s workers’ comp fee schedule in ways that would exceed the current statutory ceiling of 110 per-cent of the fees prescribed by Medicare. Ultimately, a conference committee was unable to reconcile differ-ence between the two versions.13
This introduction outlines the purpose of this annual study and a review of major developments of the past year in insur-ance regulation. Subsequent sections will offer explanations of our methodology and, finally, the state-by-state report card results.
9. Colorado General Assembly, SB14-125, June 5, 2014. http://www.leg.state.co.us/CLICS/CLICS2014A/csl.nsf/BillFoldersSenate?openFrameset
10. Connecticut General Assembly, H.B. 5502, Session Year 2014. http://www.cga.ct.gov/asp/cgabillstatus/cgabillstatus.asp?selBillType=Bill&bill_num=hb5502&which_year=2014&SUBMIT1.x=0&SUBMIT1.y=0
11. Hawaii State Legislature, HB1961 HD2, 27th Legislature, 2014. http://www.capitol.hawaii.gov/measure_indiv.aspx?billtype=HB&billnumber=1961&year=2014
12. Hawaii State Legislature, SB2127 SD1, 27th Legislature, 2014. http://www.capitol.hawaii.gov/measure_indiv.aspx?billtype=SB&billnumber=2127
13. Hawaii State Legislature, HB1974 HD2 SD1, 27th Legislature, 2014. http://www.capitol.hawaii.gov/measure_indiv.aspx?billtype=HB&billnumber=1974
We consider this annual report the R Street Institute’s flag-ship publication. As a state-regulated business, the insur-ance market offers a perfect illustration of how differing approaches across what U.S. Supreme Court Justice Louis Brandeis called the 50 different “laboratories of democra-cy” can result in very different outcomes for consumers, for industry and for taxpayers. We hope that an objective look at state regulation will encourage states to adopt policies that promote freer markets, more efficient government processes and a deeper commitment to both consumer choice and con-sumer protection.
INSURANCE AND GOVERNMENT REGULATION
The insurance market is both the largest and most significant portion of the financial services industry – and, arguably, the U.S. economy as a whole – to be regulated almost entirely at the state level. While state banking and securities regula-tors largely have been preempted by federal law in recent decades, Congress reserved to the states the duty of oversee-ing the “business of insurance” as part of 1945’s McCarran-Ferguson Act.
On balance, we believe states have done an effective job of encouraging competition and, at least since the broad adop-tion of risk-based capital requirements, of ensuring solvency. As a whole and in most individual states, U.S. personal lines and workers’ compensation markets are not overly concen-trated. Insolvencies are relatively rare and, through the run-off process and guaranty fund protections enacted in nearly every state, generally quite manageable.
However, there are certainly ways in which the thicket of state-by-state regulations leads to inefficiencies, as well as particular state policies that have the effect of discouraging capital formation, stifling competition and concentrating risk. Central among these are rate controls. While explicit price and wage controls largely have fallen by the wayside in most industries (outside of natural monopolies like utilities), pure rate regulation remains commonplace in insurance.
Some degree of rating and underwriting regulation persists in nearly every one of the 50 states. This is, to a large degree, a relic of an earlier time, when nearly all insurance rates and forms were established collectively by industry-owned rate bureaus. In that earlier era, individual insurers generally were too small and decentralized to be able to collect suffi-cient data to make credible actuarial projections. McCarran-Ferguson charged states with reviewing the rates submitted by these bureaus because of concerns of anticompetitive col-lusion.
With the notable exception of North Carolina, rate bureaus no longer play a central role in most personal lines markets, and many larger insurers now establish rates using their own
R STREET POLICY STUDY: 2014 2014 INSURANCE REGULATION REPORT CARD 3

proprietary formulas, rather than relying on rate bureau rec-ommendations.
In theory, there could be a justifiable role for states to exer-cise rate regulation to ensure that rates are sufficient. But such concerns are more appropriately handled by moni-toring firms’ risk-based capital, of which rates are just one of many considerations. Moreover, in practice, it is nearly unheard of for a regulator to reject a rate for being too low. While the general trend of insurance markets has been toward greater rate-making and underwriting freedom, cer-tain hot button issues – such as the use of consumer credit information – continue to evoke politically responses that perpetually threaten to undo past progress.
Regulation also may, in some cases, hinder the speed with which new products are brought to market. We believe inno-vative new products could be more widespread if more states were to free their insurance markets by embracing regula-tory modernization. An open and free insurance market maximizes the effectiveness of competition and best serves consumers.
METHODOLOGY
The report card represents our best attempt at an objective evaluation of the regulatory environments in each of the 50 states.
It tracks 12 broad categories, most consisting of several vari-ables, to measure how well states: monitor insurer solven-cy; police fraud; respond to consumer complaints; how effi-ciently they spend the insurance taxes and fees they collect; how competitive their home, auto and workers’ comp insur-ance markets are; the degree to which they permit insurers to adjust rates and employ rating criteria as they see fit; the transparency and politicization of insurance regulation in the states; and finally, states’ willingness to take part in cutting-edge regulatory modernization initiatives. For each of the 12 categories, we use the most recent year’s data available.
The report is not intended as a referendum on specific reg-ulators. Scoring an “F” does not mean that a state’s insur-ance commissioner is inadequate, nor is scoring an “A+” an endorsement of those who run the insurance department. Significant changes in the most heavily weighted variables most often would only be possible through action by state legislatures. Variables are weighted to provide balance between considering the rules a state adopts and the results it demonstrates, between the effectiveness of regulators in performing their core duties and the efficiency of a state in making use of its resources.
Because we are necessarily limited to those factors we can quantify for all 50 states, there are many important
considerations that our report card will not reflect. Among other variables, we lack good measures of how well states regulate insurance forms and the level of competition in local markets for insurance agents and brokers.
I. SOLVENCY REGULATION (7.5 PERCENT OF TOTAL SCORE)
There is no single duty more important for insurance regula-tors than monitoring the solvency of regulated insurers. Alas, the state-based system of solvency regulation has not always been held in particularly high esteem. A spate of liability insurer insolvencies in the late 1980s prompted a federal investigation that faulted the state regulatory system for fail-ing to provide adequate oversight of insurers’ underpricing, inadequate loss reserves and shaky reinsurance transactions.
Shortly after, the industry was hit again by another spate of insolvencies, this time in the life insurance sector, which was followed by a round of property insurer insolvencies follow-ing 1992’s Hurricane Andrew. In response to both the pub-lic criticism and the threat of preemption, state regulators moved in 1994 through the National Association of Insur-ance Commissioners to create and implement a risk-based capital regime of solvency regulation. That regime has held up remarkably well, although the failure of American Inter-national Group during the 2008 financial crisis prompted a reexamination of their oversight of complex insurance and financial services holding companies.
Financial Exams: The first metric we examine is how fre-quently each department examines the financial strength of companies domiciled within their borders. States vary great-ly in both size and number of domestic insurers. Under the state-based system of insurance regulation, each domiciliary state is charged with primary responsibility for monitoring their respective domestic insurers’ solvency.
Because insurance departments are funded primarily by fees paid by regulated insurers and insurance producers, those with an unusually large number of domestic companies also reap the windfall of unusually large resources. In fact, as will be discussed in greater detail later in this report, for most states, insurance regulation is a profit center.
States conduct two major types of examinations of compa-nies they regulate: financial exams, which look at a com-pany’s assets, liabilities, and policyholder surplus, and mar-ket conduct exams, which look into a company’s business practices and how well the company is treating consumers. Sometimes, states conduct joint financial/market conduct exams that look at both sets of factors simultaneously.
States are generally free to subject any company that oper-ates in their market to either type of exam. With financial
R STREET POLICY STUDY: 2014 RIDESCORE 2014; HIRED DRIVER RULES IN U.S. CITIES 4

exams, states overwhelmingly concentrate their attention on domestic insurers, and it is a regulatory rule of thumb that each domestic company should expect to be examined at least once every five years.
In this report, we attempt to gauge how well states are keep-ing up with their duties to examine the companies they regu-late. We did this by drawing on NAIC data on the number of financial exams and combined financial/market conduct exams the states reported completing for domestic compa-nies in each year from 2009 through 2013. We then compared those figures to the number of domestic companies listed as operating in the state for each of those five years, to calculate the proportion of domestic companies that were examined. Given the guidance that every company should be examined at least once every five years, our baseline expectation for the sum of those five years of exams is 100 percent. The good news is that 37 of the 50 states met that minimum standard, although that necessarily means that 13 states did not. The mean percentage of domestic insurers examined was 133.1 percent.
For scoring purposes, we deducted -5 points for any depart-ment that fell below the mean and -10 points for three depart-ments (Iowa, Minnesota and South Carolina) that fell more than a standard deviation below the mean. We awarded +5 points to two departments (Tennessee and Washington) that scored more than one standard deviation above the mean and awarded +10 point to two departments (Nevada and Ver-mont) that managed to score more than two standard devia-tions above the mean.
Run-Offs: Measuring the number of financial exams com-pleted offers a good quantitative assessment of how robust a state’s solvency regulation regime is, but there is a need for a qualitative assessment, as well. A state could examine every company every year, but if it doesn’t actually catch the problems that lead to insolvency, this would offer little ben-efit to policyholders.
The best measure we could find to assess the quality of sol-vency regulation is to look at regulatory run-offs, where an insurer has ceased writing new business and instead chosen to wind down its remaining obligations over time. While run-offs are often voluntary, a department may have to intervene by placing the financially troubled company into receiver-ship. If the company may be saved, a court can order it into a conservatory rehabilitation or supervisory rehabilitation, a reorganization process that can include allowing the compa-ny to resume writing new business. Where rehabilitation is deemed impossible, a liquidation order is signed, wherein a company’s assets will be sold off to make good on its remain-ing obligations, and guaranty fund coverage may be triggered to pay claims.
For the report card, we summed the total in-progress claims liability of insurers placed in run-off, supervision, conserva-tion, receivership and liquidation for each state, as of Dec. 31, 2013. The totals ranged from Pennsylvania’s roughly $26.5 billion to 12 states that had no in-progress claims liability at all. We scored states based on the proportion of total 2013 net written premiums to the outstanding run-off liabilities represented. States with a high proportion of runoff liabili-ties were downgraded.
We found a mean of 4.0 percent for all states, but a rela-tively high standard deviation of 10.2 percentage points. We awarded +5 points to each of the 12 states with no regula-tory run-off liabilities at all. We deducted -5 points from five departments (Arizona, California, Delaware, North Carolina and Rhode Island) that were above the mean; deducted -10 points from one state (Indiana) that was more than a stan-dard deviation above the mean; deducted -15 points from two states (Pennsylvania and Vermont) that were more than two standard deviations above the mean; and finally, deducted -20 points from one state (New Hampshire) that was more than three standard deviations above the mean.
Holding Company Act: As a final measure of solvency moni-toring, we deducted -5 points from each of the 12 states (Alas-ka, Arkansas, Michigan, Missouri, Montana, North Carolina, North Dakota, New Jersey, South Carolina, South Dakota, Utah and Washington) that, as of the time of this report, still had not adopted the NAIC’s 2010 amendments to its mod-el Holding Company Act and Regulation. The NAIC Act is intended to address some of the weaknesses in the regulation of insurance holding company systems discovered during the 2008 financial crisis. The amendments will be used by the NAIC as a state accreditation standard as of Jan. 1, 2016.
Taken together, states’ scores in the Solvency Regulation category range from a high of +10 (Nevada) to a low of -25 (New Hampshire.) Those raw scores are then translated into a weighted score of between 0 and 7.5, as the category repre-sents 7.5 percent of the total score.
II. FRAUD (7.5 PERCENT OF TOTAL SCORE)
After solvency regulation, perhaps the next most important duty of insurance regulators is to police fraud. Particularly in casualty lines of business like auto insurance and workers’ compensation, where claims are frequently tied to medical treatment, fraud is a costly problem that can impose signifi-cant burdens on consumers and force companies to with-draw from markets.
In 2007, the Insurance Information Institute estimated insurance fraud accounted for about 10 percent of the prop-erty/casualty industry’s incurred losses and loss adjustment
R STREET POLICY STUDY: 2014 2014 INSURANCE REGULATION REPORT CARD 5

TABLE 1: SOLVENCY REGULATION
StateExams Run-Offs
Model ActTotal Score
(%) Score (%) Score Raw Weighted
AK 142.9 0 0.0 5 -10 -5 4.3
AL 114.1 -5 0.1 0 0 -5 4.3
AR 78.4 -5 0.3 0 -10 -15 2.1
AZ 95.5 -5 13.0 -5 0 -10 3.2
CA 138.4 0 4.7 -5 0 -5 4.3
CO 86.9 -5 0.0 5 0 0 5.4
CT 101.9 -5 1.3 0 0 -5 4.3
DE 126.7 -5 9.9 -5 0 -10 3.2
FL 74.4 -5 2.2 0 0 -5 4.3
GA 97.5 -5 0.0 5 0 0 5.4
HI 157.8 0 0.2 0 0 0 5.4
IA 55.2 -10 0.0 5 0 -5 4.3
ID 133.2 0 0.2 0 0 0 5.4
IL 124.4 -5 3.9 0 0 -5 4.3
IN 115.0 -5 18.9 -10 0 -15 2.1
KS 113.7 -5 0.0 0 0 -5 4.3
KY 151.2 0 0.0 5 0 5 6.4
LA 93.8 -5 0.1 0 0 -5 4.3
MA 129.3 -5 0.8 0 0 -5 4.3
MD 154.7 0 1.0 0 0 0 5.4
ME 69.9 -5 0.0 5 0 0 5.4
MI 177.1 0 0.0 0 -10 -10 3.2
MN 39.4 -10 0.0 0 0 -10 3.2
MO 113.2 -5 1.1 0 -10 -15 2.1
MS 142.2 0 1.5 0 0 0 5.4
MT 105.2 -5 0.1 0 -10 -15 2.1
NC 121.0 -5 4.5 -5 -10 -20 1.1
ND 111.9 -5 0.0 5 -10 -10 3.2
NE 123.9 -5 1.3 0 0 -5 4.3
NH 104.2 -5 60.5 -20 0 -25 0.0
NJ 130.0 -5 0.0 5 -10 -10 3.2
NM 166.5 0 0.0 5 0 5 6.4
NV 401.5 10 0.8 0 0 10 7.5
NY 73.7 -5 3.1 0 0 -5 4.3
OH 108.8 -5 3.9 0 0 -5 4.3
OK 160.2 0 2.1 0 0 0 5.4
OR 178.4 0 0.0 5 0 5 6.4
PA 163.0 0 28.1 -15 0 -15 2.1
RI 101.1 -5 5.4 -5 0 -10 3.2
SC 54.4 -10 0.8 0 -10 -20 1.1
SD 89.4 -5 0.0 0 -10 -15 2.1
TN 262.8 5 0.0 0 0 5 6.4
TX 168.9 0 1.8 0 0 0 5.4
UT 110.9 -5 1.2 0 -10 -15 2.1
VA 197.2 0 0.5 0 0 0 5.4
VT 372.9 10 24.6 -15 0 -5 4.3
WA 200.2 5 0.1 0 -10 -5 4.3
WI 74.5 -5 -0.9 0 0 -5 4.3
WV 108.8 -5 0.0 5 0 0 5.4
WY 140.0 0 0.0 5 0 5 6.4
SOURCES: NAIC Insurance Department Resources Report, Sutherland Asbill & Brennan LLP
R STREET POLICY STUDY: 2014 2014 INSURANCE REGULATION REPORT CARD 6

expenses.14 A report last year from the Aite Group estimated the volume of property/casualty fraud in 2012 at $64 bil-lion, with auto insurance fraud representing $26 billion of that total.15 The National Insurance Crime Bureau report-ed receiving 116,171 questionable claims referred by NICB member companies in 2012, up 16 percent from the 100,201 reported in 2011.16
It is exceedingly difficult to assess how well states handle the challenge of policing insurance fraud. However, there is sig-nificant variation in the tools and resources that states have granted their insurance departments to tackle the problem, and it is those variations that we have chosen to measure as part of this report card.
Two points were assigned to each of the 41 states that main-tain a separate criminal fraud unit.
Two points were assigned to each of the 30 states where insurance fraud investigators are empowered as officers of the peace, meaning that they can make arrests for crimes they do not personally witness. (In Rhode Island, where powers vary depending on the investigator and type of crime, we awarded +1 point.)
One point was assigned to each of the 27 states in which there are no limits to the kinds of insurance fraud that can be investigated.
In addition, we looked at the total full-time equivalent staff and contract workers within each department who are ded-icated to antifraud enforcement. In last year’s report, we measured those staff as a percentage of total staff. However, in retrospect, that may not have been the most appropriate metric. States with high degrees of insurance fraud – such as those with high levels of organized crime, as well as the dozen states that employ a “no fault” system for auto insur-ance liability – are naturally going to have a disproportionate level of resources devoted to fraud-fighting. This year, we felt a better and more accurate measurement was to compare antifraud staffing against the number of questionable claims reported in each state, as measured by the NICB. 17
Among the 43 states that employ dedicated antifraud inspec-tors, we found a mean of 224.4 questionable claims per
14.Ralph Burnham, “Are Insurers Winning or Losing the Fraud Game,” Claims Journal, April 15, 2013. http://www.claimsjournal.com/magazines/idea-exchange/2013/04/15/226656.htm
15.Stephen Applebaum, “ The Escalating War on Insurance Fraud: P&C Carriers and Fraudsters Up Their Games,” Aite Group, April 3, 2013. http://www.aitegroup.com/report/escalating-war-insurance-fraud-pc-carriers-and-fraudsters-their-games#sthash.OWC5aXsc.dpuf
16.Press Release, “NICB: Questionable Claims in the United States,” National Insurance Crime Bureau, May 16, 2013. https://www.nicb.org/newsroom/news-releases/u-s--questionable-claims-report
17.Ibid.
inspector, with Illinois’ 3,538 questionable claims and only one inspector standing as a notable outlier. There were sev-en states – Maine, Michigan, Rhode Island, South Carolina, Vermont, Wisconsin and Wyoming – that do not employ any dedicated antifraud staff. Because the ratio in those states technically would be infinite (one cannot divide by 0), we opted to dock each of those seven -5 points off the top, and otherwise treat their questionable claims total as a proxy for the ratio (the same figure that would be produced if there were one inspector on staff.)
With that adjustment, the overall mean was 332.8 question-able claims per inspector, with a remarkably high standard deviation of 685.9. The seven states whose questionable claims per inspector were less than 33.3, or 10 percent of the mean, were awarded +10 points: Delaware, Idaho, Montana, New Hampshire, New Jersey, South Dakota and West Vir-ginia. Another seven states whose questionable claims were less than 66.6, or 20 of the mean, were awarded +5 points: Alaska, Arkansas, California, Florida, Minnesota, North Dakota and Utah.
Five states whose questionable claims ratios were greater than the mean saw -5 points deducted: Georgia, Massachu-setts, Mississippi, Rhode Island and Wisconsin. Finally, three states whose questionable claims ratio was greater than the mean by more than a standard deviation saw -10 points deducted: Illinois, Michigan and South Carolina.
Taken together, states’ scores in the Fraud category range from a high of +15 (New Jersey and South Dakota) to a low of -15 (Michigan.) Those raw scores are then translated into a weighted score of between 0 and 7.5, as the category rep-resents 7.5 percent of the total score.
III. CONSUMER PROTECTION (7.5 PERCENT OF TOTAL SCORE)
The effectiveness of state insurance regulators in ensuring that consumers are adequately protected from inappropriate market conduct by insurers or insurance producers – such as intentionally misleading marketing or claims denials made in bad faith – is one of the most difficult factors to measure. So difficult, in fact, that prior versions of this report listed it as among the variables for which we could not find any appropriate metrics.
This year’s edition is the first to attempt to quantify some baseline for a minimal expected and appropriate level of responsiveness to consumer complaints. We settled on a similar model to that used to judge the effectiveness of states’ antifraud efforts. Using the 2014 edition of the NAIC’s Insur-ance Department Resources Report, we were able to find data both on the number of consumer complaints filed in each state (ranging from 195 in North Dakota to 37,842 in
R STREET POLICY STUDY: 2014 2014 INSURANCE REGULATION REPORT CARD 7

TABLE 2: ANTIFRAUD REGULATION
0.1875 in
QCs Per Inspector
Fraud Unit Peace Power Limited Types
Total Score
Ratio Score Raw Weighted
AK 41.2 5 2 2 1 10 6.3
AL 286.8 0 2 2 1 5 5.0
AR 50.3 5 2 2 0 9 6.0
AZ 237.0 0 2 2 0 4 4.8
CA 58.5 5 2 2 1 10 6.3
CO 195.6 0 2 2 1 5 5.0
CT 207.6 0 2 2 1 5 5.0
DE 31.9 10 0 0 1 11 6.5
FL 55.4 5 2 2 1 10 6.3
GA 458.4 -5 2 2 0 -1 3.5
HI 79.5 0 2 2 1 5 5.0
IA 94.5 0 2 2 1 5 5.0
ID 32.5 10 2 0 1 13 7.0
IL 3,538.0 -10 2 0 1 -7 2.0
IN 128.0 0 0 0 1 1 4.0
KS 275.2 0 2 0 1 3 4.5
KY 106.4 0 2 2 1 5 5.0
LA 195.1 0 2 2 1 5 5.0
MA 335.1 -5 2 2 1 0 3.8
MD 171.8 0 2 0 1 3 4.5
ME* 172.0 -5 0 0 1 -4 2.8
MI* 3,134.0 -15 0 0 0 -15 0.0
MN 52.9 5 2 2 1 10 6.3
MO 105.7 0 0 0 1 1 4.0
MS 643.0 -5 2 2 1 0 3.8
MT 24.5 10 2 0 1 13 7.0
NC 183.6 0 2 2 1 5 5.0
ND 34.0 5 2 2 1 10 6.3
NE 87.0 0 2 2 0 4 4.8
NH 29.9 10 2 0 1 13 7.0
NJ 17.8 10 2 2 1 15 7.5
NM 108.6 0 2 2 1 5 5.0
NV 177.8 0 2 2 1 5 5.0
NY 161.8 0 2 2 1 5 5.0
OH 156.6 0 0 0 1 1 4.0
OK 113.8 0 2 2 1 5 5.0
OR 254.9 0 0 0 0 0 3.8
PA 257.9 0 2 2 0 4 4.8
RI* 587.0 -10 2 1 0 -7 2.0
SC* 1,979.0 -15 2 2 1 -10 1.3
SD 22.3 10 2 2 1 15 7.5
TN 169.2 0 2 0 1 3 4.5
TX 187.7 0 2 2 0 4 4.8
UT 33.4 5 2 2 0 9 6.0
VA 120.0 0 2 2 1 5 5.0
VT* 96.0 -5 2 0 1 -2 3.3
WA 115.9 0 2 2 1 5 5.0
WI* 933.0 -10 0 0 0 -10 1.3
WV 11.9 10 2 0 1 13 7.0
WY* 89.0 -5 0 0 0 -5 2.5
SOURCES: NAIC Insurance Department Resources Report, National Insurance Crime Bureau *State does not employ any dedi-cated antifraud investigators.
R STREET POLICY STUDY: 2014 2014 INSURANCE REGULATION REPORT CARD 8
New York) as well as the staffing resources each state devotes to respond to such inquiries (from just two full-time equiva-lent employees in Wyoming and Indiana to 80 in California.) We then calculated a ratio of each state’s number of con-sumer complaints to complaint investigators.
Nationwide, we found a median of 342.3 complaints per investigator and a standard deviation of 318. We awarded +10 points to the one state, North Dakota, whose ratio was less than 20 percent of the mean. Six other states – Alaska, Delaware, Idaho, Maine, Rhode Island and Vermont – whose complaint ratio was less than one-third of the mean were granted +5 points.
At the other end of the spectrum, we deducted -5 points from nine states whose ratio was greater than the mean: Arizona, California, Connecticut, Illinois, Minnesota, Oklahoma, Tex-as, Washington and Wisconsin. We deducted -10 points from three states (New York, Pennsylvania and South Carolina) whose ratio was greater than the mean by more than a stan-dard deviation and we deducted -20 points from two states (Indiana and North Carolina) whose ratio was greater than the mean by more than two standard deviations.
Finally, we also examined two other factors to determine how open and accessible states consumer response opera-tions were. We deducted -5 points from eight states that do not make consumer complaint data available online: Delaware, Iowa, Nebraska, New Mexico, Oklahoma, Rhode Island, South Dakota and Tennessee. We also deducted -5 points from five states that do not offer consumers the ability to file complaints online: Arizona, Hawaii, Massachusetts, Michigan and Missouri.
Taken together, states’ scores in the Consumer Protection category range from a high of +10 (North Dakota) to a low of -20 (Indiana and North Carolina). Those raw scores are then translated into a weighted score of between 0 and 7.5, as the category represents 7.5 percent of the total score.
IV. POLITICIZATION (7.5 PERCENT OF TOTAL SCORE)
Insurance regulation is a technical matter and, by and large, should be insulated from the political process and prevailing political concerns. It is necessary for insurance regulators to ensure that insurers and insurance producers deal with the public fairly and in good faith. It is necessary to apply risk-based capital rules to ensure insurance companies are responsibly and competently managing both their under-writing and their investment risks. Regulators also must be vigilant to stamp out fraud – whether by carriers, by agents and brokers or by insureds – wherever it rears its head.
None of these charges are inherently political in nature, and the introduction of political pressure to the process of insur-ance regulation inevitably leads to negative consequences. Insurance regulators are public servants, and thus it is nec-essary and valuable for the public to have oversight of their activities. But such oversight is properly exercised through elected governors and legislators. Trained, professional reg-ulators can much more effectively enforce the law unbidden by the shifting winds of political passions.
For this reason, we downgrade those states where property and casualty insurance is a hot button political issue, as well as those where legislation that would restrict insurance mar-ket freedom gained traction in 2014. Penalties were assessed in the following ways.
• The 11 states in which the insurance commis-sioner is an elected position automatically received a -10. Those states are California, Delaware, Geor-gia, Kansas, Louisiana, Mississippi, Montana, North Carolina, North Dakota, Oklahoma and Washington state. In Florida, where insurance producers are regulated by the elected chief financial officer and the Office of Insurance Regulation is incorporated as part of the CFO’s Department of Financial Services, we deducted -5 points.
• In states in which property and casualty insurance regulation was a major campaign topic of at least one statewide ballot between 2011 and 2014, a score of -5 was assigned. We have identified five races that meet these criteria:
1. Florida’s 2014 gubernatorial race between incumbent Rick Scott and former Gov. Charlie Crist, which focused heavily on property insur-ance issues.
2. Louisiana’s 2014 race for U.S. Senate between incumbent Mary Landrieu and U.S. Rep. Bill Cassidy, which focused significantly on both candidates attempting to claim credit for rolling back reforms to the National Flood Insurance Program.
3. California’s 2012 ballot initiative over whether drivers should be eligible to get auto insurance discounts on the basis of continuous coverage.
4. Massachusetts’ 2014 gubernatorial race between Charlie Baker and Martha Coakley, in which the Republican pledged to uphold outgoing Gov. Deval Patrick’s auto insurance deregulation,
R STREET POLICY STUDY: 2014 2014 INSURANCE REGULATION REPORT CARD 9

TABLE 3: CONSUMER PROTECTION
StateComplaint Ratio Online Complaints Total Score
Ratio Score Data Submission Raw Weighted
AK 81.7 5 0 0 5 6.3
AL 240.7 0 0 0 0 5.0
AR 120.8 0 0 0 0 5.0
AZ 607.0 -5 0 -5 -10 2.5
CA 457.0 -5 0 0 -5 3.8
CO 178.6 0 0 0 0 5.0
CT 377.8 -5 0 0 -5 3.8
DE 86.3 5 -5 0 0 5.0
FL 330.4 0 0 0 0 5.0
GA 327.4 0 0 0 0 5.0
HI 128.6 0 0 -5 -5 3.8
IA 316.2 0 -5 0 -5 3.8
ID 96.1 5 0 0 5 6.3
IL 490.5 -5 0 0 -5 3.8
IN 1757.0 -20 0 0 -20 0.0
KS 182.9 0 0 0 0 5.0
KY 305.6 0 0 0 0 5.0
LA 166.5 0 0 0 0 5.0
MA 176.1 0 0 -5 -5 3.8
MD 314.0 0 0 0 0 5.0
ME 78.1 5 0 0 5 6.3
MI 258.4 0 0 -5 -5 3.8
MN 379.3 -5 0 0 -5 3.8
MO 196.8 0 0 -5 -5 3.8
MS 156.0 0 0 0 0 5.0
MT 133.5 0 0 0 0 5.0
NC 1412.1 -20 0 0 -20 0.0
ND 65.0 10 0 0 10 7.5
NE 140.3 0 -5 0 -5 3.8
NH 315.3 0 0 0 0 5.0
NJ 290.2 0 0 0 0 5.0
NM 152.2 0 -5 0 -5 3.8
NV 339.3 0 0 0 0 5.0
NY 714.0 -10 0 0 -10 2.5
OH 186.1 0 0 0 0 5.0
OK 514.7 -5 -5 0 -10 2.5
OR 280.9 0 0 0 0 5.0
PA 941.3 -10 0 0 -10 2.5
RI 82.0 5 -5 0 0 5.0
SC 669.0 -10 0 0 -10 2.5
SD 224.0 0 -5 0 -5 3.8
TN 281.3 0 -5 0 -5 3.8
TX 413.9 -5 0 0 -5 3.8
UT 177.2 0 0 0 0 5.0
VA 213.5 0 0 0 0 5.0
VT 81.5 5 0 0 5 6.3
WA 630.0 -5 0 0 -5 3.8
WI 617.0 -5 0 0 -5 3.8
WV 249.0 0 0 0 0 5.0
WY 180.0 0 0 0 0 5.0
SOURCE: Insurance Department Resources Report
R STREET POLICY STUDY: 2014 2014 INSURANCE REGULATION REPORT CARD 10

which Coakley has spent years attempting to overturn.18
5. Michigan’s 2014 gubernatorial race between incumbent Rick Snyder and challenger Mark Schauer, in which Snyder pushed a plan to make significant changes to the state’s no-fault auto insurance system.19
• For each state bill introduced in 2014 that signifi-cantly restricts market freedom or adds significantly to the cost of doing business in property/casualty insurance markets, and that either passed at least one house of the state legislature or passed the insurance committees in both houses, -5 points were deducted. This year, we identified just two key pieces of legisla-tion, both outlined in the introductory section of the paper, that meet these criteria.
1. Connecticut storm shutters legislation
2. Hawaii workers’ comp bills
Taken together, 15 of the 50 states saw some points deduct-ed for politicization. California and Louisiana tied for worst score, with -15, while 35 states received a raw score of 0. Those raw scores are then translated into a weighted score of between 0 and 7.5, as the category represents 7.5 percent of the total score.
V. FISCAL EFFICIENCY (10 PERCENT OF TOTAL SCORE)
We feel it is important that state insurance regulators not only do their jobs well, but that they do them efficiently, with minimal cost to consumers, companies and taxpayers. Taxes and fees paid to support insurance regulation are passed on as part of the cost of insurance coverage.
States vary in how they allocate funding to their insurance departments. In 22 states, 100 percent of the department’s revenues come from regulatory fees and assessments. Fees and assessments account for more than 90 percent of the budget in 10 other states, and for more than 75 percent of the budget in an additional seven states. Other states draw on a combination of fees and assessments, fines and penalties, gen-eral funds and other sources. Georgia and Pennsylvania are the only states that do not directly draw any of their revenues from the fees and assessments they levy, in each case drawing the bulk of their operating funds from the state’s general fund.
18 .Boston Herald, “Attorney General Martha Coakley Slams Auto Insurance Policy,” Dec. 28, 2009. http://insurancenewsnet.com/oarticle/2009/12/28/attorney-general-martha-coakley-slams-auto-insurance-policy-a-150000.html#.VEaUDRaaVuM
19. On the Issues, “Rick Snyder on Local Issues,” http://www.ontheissues.org/gover-nor/Rick_Snyder_Local_Issues.htm Accessed Nov. 24, 2014.
Based on the NAIC’s Insurance Department Resources Report, the 50 states, Puerto Rico and the District of Colum-bia spent $1.32 billion on insurance regulation in 2013 but collected more than double that amount, $2.74 billion, in reg-ulatory fees and assessments from the insurance industry. State insurance departments also collected $168.0 million in fines and penalties and another $1.15 billion in miscella-neous revenues. States separately collected $16.39 billion in insurance premium taxes. Altogether, of the $20.45 billion states collected from the insurance industry last year, only 6.4 percent was spent on insurance regulation, down from 6.6 percent the prior year.
Using this data, we have constructed two variables to mea-sure departments’ budget efficiency and the financial burden states place on insurance products.
Tax and Fee Burden: First, we look at the total of premium taxes, fees and assessments, and fines and penalties collect-ed in each state, expressed as a percentage of the premiums written in the state. This is the tax and fee burden, and the results range from a low of 0.07 percent for Michigan to a high of roughly 2.63 percent for Tennessee. The mean was 1.230 percent with a standard deviation of 0.597 percent.
We awarded +5 points to 17 states that were below the mean and +10 points to eight states (Connecticut, Delaware, Flori-da, Illinois, Iowa, Michigan, Nebraska and Oregon) that were more than a standard deviation below the mean. Six states that were more than a standard deviation above the mean (Arizona, Mississippi, Louisiana, Montana, Nevada and New Mexico) had -5 points deducted. Tennessee and West Vir-ginia, which were more than two standard deviations above the mean, saw -10 deducted.
Regulatory Surplus: As mentioned above, total fees and assessments collected by state insurance departments were more than double the amount spent on insurance regula-tion. This figure does not include premium taxes, which are a form of sales tax, thus making it appropriate that they should go into a state’s general fund. It also does not include fines and penalties, which are meant to discourage bad behavior and to compensate victims of that behavior. Limiting the consideration just to those regulatory fees and assessments that are paid by insurers and insurance producers, states collect about $1.42 billion more in regulatory fees than they spend on regulation.
That excess amount, which we call “regulatory surplus,” is typically diverted to cover other shortfalls in state budgets. Sometimes, these programs have some tangential relation-ship to insurance, such as fire safety or public health pro-grams, but often, they do not. In essence, by collecting this regulatory surplus from insurance fees, states are laying a
R STREET POLICY STUDY: 2014 2014 INSURANCE REGULATION REPORT CARD 11

TABLE 4: POLITICIZATION
State Commissioner Election BillsTotal Score
Raw Weighted
AK 0 0 0 0 7.5
AL 0 0 0 0 7.5
AR 0 0 0 0 7.5
AZ 0 0 0 0 7.5
CA -10 -5 0 -15 0.0
CO 0 0 0 0 7.5
CT 0 0 -5 -5 5.0
DE -10 0 0 -10 2.5
FL -5 -5 0 -10 2.5
GA -10 0 0 -10 2.5
HI 0 0 -5 -5 5.0
IA 0 0 0 0 7.5
ID 0 0 0 0 7.5
IL 0 0 0 0 7.5
IN 0 0 0 0 7.5
KS -10 0 0 -10 2.5
KY 0 0 0 0 7.5
LA -10 -5 0 -15 0.0
MA 0 0 0 0 7.5
MD 0 0 0 0 7.5
ME 0 0 0 0 7.5
MI 0 -5 0 -5 5.0
MN 0 0 0 0 7.5
MO 0 0 0 0 7.5
MS -10 0 0 -10 2.5
MT -10 0 0 -10 2.5
NC -10 0 0 -10 2.5
ND -10 0 0 -10 2.5
NE 0 0 0 0 7.5
NH 0 0 0 0 7.5
NJ 0 0 0 0 7.5
NM 0 0 0 0 7.5
NV 0 0 0 0 7.5
NY 0 0 0 0 7.5
OH 0 0 0 0 7.5
OK -10 0 0 -10 2.5
OR 0 0 0 0 7.5
PA 0 0 0 0 7.5
RI 0 0 0 0 7.5
SC 0 0 0 0 7.5
SD 0 0 0 0 7.5
TN 0 0 0 0 7.5
TX 0 0 0 0 7.5
UT 0 0 0 0 7.5
VA 0 0 0 0 7.5
VT 0 0 0 0 7.5
WA -10 0 0 -10 2.5
WI 0 0 0 0 7.5
WV 0 0 0 0 7.5
WY 0 0 0 0 7.5SOURCE: R Street Institute
R STREET POLICY STUDY: 2014 2014 INSURANCE REGULATION REPORT CARD 12

stealth tax on insurance consumers to fund what should be general obligations.
Comparing insurance regulatory fees and assessments to the budgets states spend on insurance regulation, the mean among the 50 states was to collect fees equal to 193.9 of their budget, albeit with a large standard deviation of 151.1. For this variable, we deducted no points for the 11 states that did not have a regulatory surplus last year.
Twenty states with some regulatory surplus, but whose fees were less than the mean of 193.9 percent of their budget, saw -5 points deducted. We deducted -10 from 16 states whose regulatory surplus was greater than the mean, but by less than a standard deviation. Montana, whose regulatory sur-plus of 395.8 percent was more than a standard deviation greater than the mean, had -15 points deducted.
Finally, New York (554.0 percent) and Massachusetts (991.7 percent), were the two states whose regulatory surplus was more than two standard deviations greater than the mean, and thus were deducted -20 points.
Taken together, states’ scores in the Fiscal Efficiency catego-ry range from a high of +10 in Connecticut, Florida, Illinois and Michigan to a low of -20 in Montana, New York and West Virginia. Those raw scores are then translated into a weight-ed score of between 0 and 10, as the category represents 10 percent of the total score.
Insurance Market Performance
As in past editions of this report, we examined empirical data on the competitiveness of states’ auto, home and work-ers’ comp insurance markets. In examining these markets, there are three broad categories that we measure: the size of state residual markets, the concentration and market share of insurance groups within each market and the long-term loss ratios reported by companies operating in those markets.
Residual Markets: Residual automobile, homeowners and workers’ compensation insurance markets are intended to serve consumers for whom coverage in the private market cannot be found at a “reasonable” price.
Except in a handful of cases, residual market mechanisms do not generally have the explicit backing of state government treasuries. However, because no state has ever allowed its residual market to fail, there is typically an implicit assump-tion that states will stand behind the pool or chartered entity if it encounters catastrophic losses. Moreover, some pools and joint underwriting associations have statutory authority to assess private market carriers to cover shortfalls in operations.
Most residual insurance markets are very small. It’s unlikely,
for example, that a few involuntarily written auto insurance policies representing less than half of 1 percent of the market would have serious consequences for automobile insurance prices in any state or affect consumers more broadly.
But where residual markets grow large, it generally repre-sents evidence that regulatory restrictions have prevented insurers from meeting consumers’ needs by disallowing what would otherwise be market-clearing prices. Such large residual markets represent a state subsidy for policyhold-ers who take risks the market is unwilling to absorb without higher premiums or some other form of compensation.
We measured the size of residual markets for home, auto and workers’ comp insurance using 2013 data from the Automo-bile Insurance Plans Service Office, the Property Insurance Plans Service Office, NCCI Holdings and SNL Financial, or more recent figures, where they were available.
Market Concentration: “Free” markets are a theoretical abstraction. Competitive markets are a measurable reality.
For markets to serve consumers well, there must be a variety of competitors with products designed to fit different bud-gets and needs. A high degree of market concentration is not necessarily a sign that consumers are poorly served, but it can be an indication of unnecessarily high barriers to entry or other market dysfunction.
Using data supplied by SNL Financial, we calculated the con-centration of each state’s auto, homeowners and workers’ comp markets, as measured by the Herfindahl-Hirschman Index. The HHI, which is used by the Department of Jus-tice and Federal Trade Commission to assess the degree to which markets are subject to monopolistic concentration, is calculated by summing the squares of the market share totals of every firm in the market. In a market with 100 firms, each with 1 percent share, the HHI would be 100. In a firm with just one monopolistic firm, the HHI would be 10,000.
The DOJ and Federal Trade Commission generally consider markets in which the HHI is between 1,500 and 2,500 points to be moderately concentrated, while those in excess of 2,500 points are highly concentrated.
Loss Ratios: In addition to looking at market concentra-tions in the 50 states, we also used SNL Financial data to analyze loss ratios — a key profitability metric of home, auto and workers’ comp insurance markets. Excess profits indi-cate an insufficiently competitive market. Insufficient profits indicate one that isn’t charging enough to attract entrants or, in the extreme, to pay policyholder claims.
Over the long run, the property/casualty industry as a whole has tended to break even on its underwriting book of busi-
R STREET POLICY STUDY: 2014 2014 INSURANCE REGULATION REPORT CARD 13
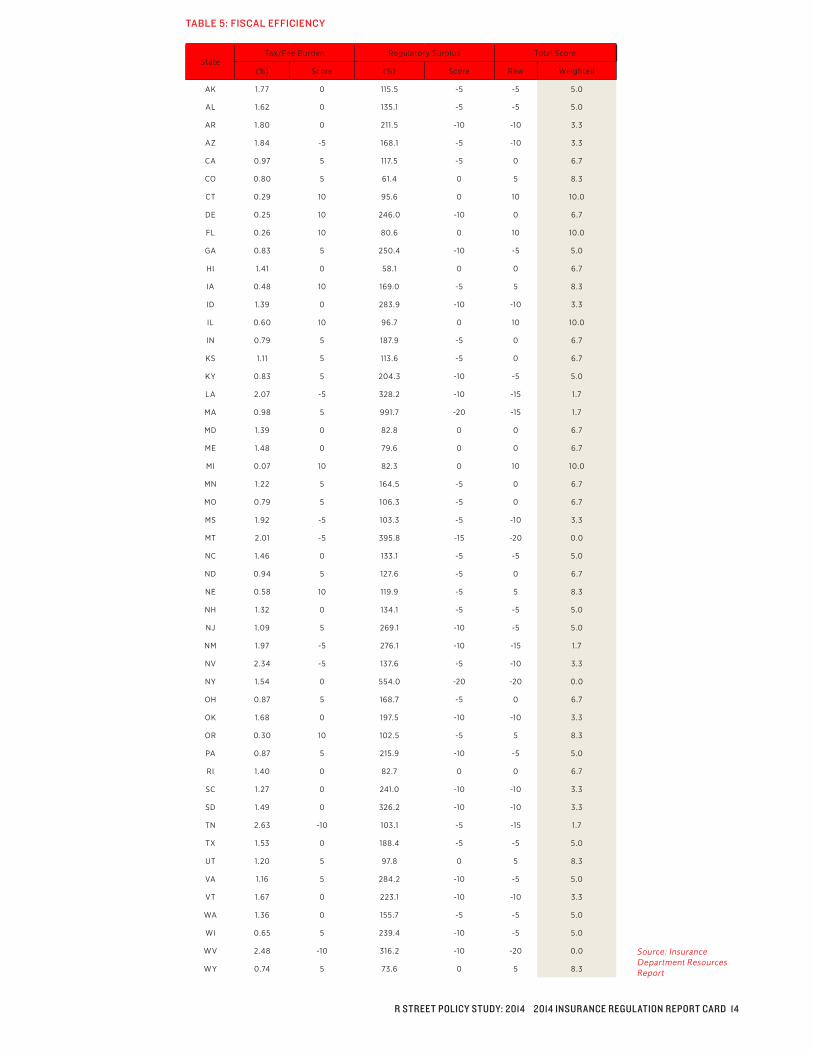
TABLE 5: FISCAL EFFICIENCY
StateTax/Fee Burden Regulatory Surplus Total Score
(%) Score (%) Score Raw Weighted
AK 1.77 0 115.5 -5 -5 5.0
AL 1.62 0 135.1 -5 -5 5.0
AR 1.80 0 211.5 -10 -10 3.3
AZ 1.84 -5 168.1 -5 -10 3.3
CA 0.97 5 117.5 -5 0 6.7
CO 0.80 5 61.4 0 5 8.3
CT 0.29 10 95.6 0 10 10.0
DE 0.25 10 246.0 -10 0 6.7
FL 0.26 10 80.6 0 10 10.0
GA 0.83 5 250.4 -10 -5 5.0
HI 1.41 0 58.1 0 0 6.7
IA 0.48 10 169.0 -5 5 8.3
ID 1.39 0 283.9 -10 -10 3.3
IL 0.60 10 96.7 0 10 10.0
IN 0.79 5 187.9 -5 0 6.7
KS 1.11 5 113.6 -5 0 6.7
KY 0.83 5 204.3 -10 -5 5.0
LA 2.07 -5 328.2 -10 -15 1.7
MA 0.98 5 991.7 -20 -15 1.7
MD 1.39 0 82.8 0 0 6.7
ME 1.48 0 79.6 0 0 6.7
MI 0.07 10 82.3 0 10 10.0
MN 1.22 5 164.5 -5 0 6.7
MO 0.79 5 106.3 -5 0 6.7
MS 1.92 -5 103.3 -5 -10 3.3
MT 2.01 -5 395.8 -15 -20 0.0
NC 1.46 0 133.1 -5 -5 5.0
ND 0.94 5 127.6 -5 0 6.7
NE 0.58 10 119.9 -5 5 8.3
NH 1.32 0 134.1 -5 -5 5.0
NJ 1.09 5 269.1 -10 -5 5.0
NM 1.97 -5 276.1 -10 -15 1.7
NV 2.34 -5 137.6 -5 -10 3.3
NY 1.54 0 554.0 -20 -20 0.0
OH 0.87 5 168.7 -5 0 6.7
OK 1.68 0 197.5 -10 -10 3.3
OR 0.30 10 102.5 -5 5 8.3
PA 0.87 5 215.9 -10 -5 5.0
RI 1.40 0 82.7 0 0 6.7
SC 1.27 0 241.0 -10 -10 3.3
SD 1.49 0 326.2 -10 -10 3.3
TN 2.63 -10 103.1 -5 -15 1.7
TX 1.53 0 188.4 -5 -5 5.0
UT 1.20 5 97.8 0 5 8.3
VA 1.16 5 284.2 -10 -5 5.0
VT 1.67 0 223.1 -10 -10 3.3
WA 1.36 0 155.7 -5 -5 5.0
WI 0.65 5 239.4 -10 -5 5.0
WV 2.48 -10 316.2 -10 -20 0.0
WY 0.74 5 73.6 0 5 8.3
Source: Insurance Department Resources Report
R STREET POLICY STUDY: 2014 2014 INSURANCE REGULATION REPORT CARD 14

ness. This has shifted somewhat over the decades. In the 1970s through the 1990s, when investment returns on fixed-income securities were strong due to relatively high bond yields, the industry’s “combined ratio” – that is, its losses and expenses expressed as a percentage of its underwriting income – tended to run slightly above 100, indicating under-writing losses. As interest rates have plummeted over the past decade, modest underwriting profits have become more common, as there hasn’t been enough investment income to make up the difference.
We looked at the loss ratios of the three key property/casu-alty segments in each of the 50 states. A company’s loss ratio includes its claims paid and the cost of adjusters, but excludes agent commissions and other marketing expenses the industry incurs. Because catastrophes can introduce out-sized losses in any given year, we relied on five-year averages. However, loss ratios are not simply a measure of the propen-sity of a state to experience large losses. Insurance regulators are charged with ensuring that rates are neither excessive nor insufficient (also, that they are not discriminatory). If insurers are charging appropriate amounts for the coverage they sell, rates should be relatively higher in riskier states and lower in less risky states, but loss ratios would remain stable either way.
VI. AUTO INSURANCE MARKETS (10 PERCENT OF TOTAL SCORE)
Residual Auto Market: In the business of insurance, there has perhaps been no greater victory of markets over com-mand-and-control regulation than the massive reduction in the size of state residual auto insurance markets over the past 30 years. Where these entities once insured as much as half or, in some states, more than half of all private passenger auto risks, as of 2013, they represent less than 1 percent of what is a $181.91 billion nationwide market.
The incredible shrinking of the residual auto market is due to two factors: regulatory liberalization and technological prog-ress. Where once, nearly all states required auto insurance rates be developed via collusive industry-run rate bureaus, today, only North Carolina maintains a pure rate bureau system. As companies became more free to develop their own rating factors and discounts, they also invested heavily in advanced computer models that take advantage of deep troves of data on consumers’ credit, driving history, occupa-tions, education levels and where, when and how they drive, to craft rates bespoke to individual drivers. More recently, advances in technologies known collectively as “telematics” has permitted some companies to begin offering rates that charge per-mile and take into account drivers’ real-time per-formance on the road to segment rates.
Today, 45 jurisdictions maintain assigned risk “Automobile
Insurance Plans” for applicants who can’t find coverage in the voluntary market. In an assigned risk AIP, residual mar-ket risks are shared equitably among all carriers licensed to write business in the state. Most are exceedingly small, although those in Rhode Island and Massachusetts account for about 2 percent of the market and AIPs account for about 1 percent of the market in California, Missouri, Tennes-see, Texas and Vermont. Thanks to auto insurance reforms signed in 2008 by outgoing Gov. Deval Patrick that phased out the Commonwealth Auto Reinsurers mechanism, Mas-sachusetts’ AIP now has less a third of the market share CAR had when the state initiated its “managed competition” pro-gram six years ago.
Four other states – Florida, Hawaii, Minnesota and New York – continue to operate joint underwriting authorities, with all except Florida (which now writes a negligible amount of premium) representing about 1 percent of the market. In addition, Maryland has a state fund mechanism, Maryland Automobile Insurance Fund, to provide automobile insur-ance to about the 2 percent of applicants who cannot obtain coverage in the voluntary market.
Two other states – New Hampshire and North Carolina – maintain automobile reinsurance facilities through which auto insurers provide liability coverage and service claims. Policies are initially written by private carriers, but an insur-er operating in those states then chooses whether it wishes to retain the risks or cede them to the reinsurance pool. Pre-miums ceded to New Hampshire’s reinsurance facility rep-resent only about 1 percent of the market, while the $904.2 million of earned premiums and “clean risk subsidies” ceded last year to the North Carolina Reinsurance Facility repre-sented about 19 percent of the premium written in the state.20
While not technically a residual market mechanism, we also included in this section the Michigan Catastrophic Claims Association. An outgrowth of Michigan’s unique law that every carrier must provide unlimited lifetime personal injury protection benefits, the MCCA is a state-backed reinsurance facility to which Michigan auto insurers cede the risk of PIP claims that exceed $500,000. Its $1.28 billion of ceded pre-mium last year represented about 17.5 percent of the premi-ums written in the state.21
For this metric, we deducted -1 point for every percentage point of market share (or, in the case of the reinsurance funds, ceded premiums as a percentage of total premiums) the residual mechanisms represented.
20.North Carolina Reinsurance Facility, “2014 Annual Report,” November 2014. http://www.ncrb.org/LinkClick.aspx?link=ncrf%2fannual+reports%2fNCRF+2014+Annual+Report+%28final%29+Hi-Res.pdf&tabid=252&portalid=5&mid=993
21.Michigan Catastrophic Claims Association, “Annual Statement of the Michigan Catastrophic Claims Association,” June 30, 2014. http://www.michigancatastrophic.com/LinkClick.aspx?fileticket=%2fS5H7wZ3C5Y%3d&tabid=2935
R STREET POLICY STUDY: 2014 2014 INSURANCE REGULATION REPORT CARD 15

Auto Insurance Concentration: On a nationwide basis, the auto insurance market last year had an HHI score of 735.23, while the mean HHI score of the 50 states was 1026.1. Under the metrics used by the DOJ and FTC, Louisiana and Alaska were the only states with auto insurance markets that would be considered moderately concentrated and no state would be considered highly concentrated.
We assigned +5 points to 20 states with an HHI below the mean of 1026.1, and +10 points to eight states (California, Connecticut, Maine, New Hampshire, North Dakota, Utah, Vermont and Washington) that were more than a standard deviation below the mean.
Six other states that were more than a standard deviation above the mean (Delaware, Hawaii, Illinois, Maryland, New York and West Virginia) got -5 points deducted and the two states that were more than two standard deviations above the mean (Louisiana and Alaska) got -10 points deducted.
Auto Insurance Loss Ratios: In the auto insurance market, the nationwide five-year average loss ratio was 66.0 and the mean of the 50 states was 63.8, with a standard deviation of 9.3. There were just two notable outliers on either end of the distribution. Hawaii saw -5 points deducted for its five-year loss ratio of 50.5, which was more than a standard devia-tion less than the mean. At the other end of the spectrum, -10 points were deducted for Michigan, whose five-year loss ratio of 122.8 was more than two standard deviations greater than the mean (in fact, it was a whopping six standard devia-tions above the mean.)
Taken together, states’ scores in the Auto Insurance cate-gory range from a high of +10 in five states (Connecticut, Maine, North Dakota, Utah and Washington) to a low of -22.5 in Michigan. Those raw scores are then translated into a weighted score of between 0 and 10, as the category repre-sents 10 percent of the total score.
VII. HOMEOWNERS INSURANCE MARKETS (10 PERCENT OF TOTAL SCORE)
Residual Homeowners Market: Similar to the residual auto insurance market, residual homeowners insurance mecha-nisms exist to serve insureds who cannot find coverage in the private voluntary market. Thirty states and the District of Columbia operate what are called Fair Access to Insurance Requirements plans, originally created primarily to serve urban consumers, particularly in areas where “redlining” practices made it difficult for homeowners to obtain coverage.
In addition, five states sponsor specialized pools for coastal windstorm risks, typically called “beach plans.” Mississippi, North Carolina and Texas operate both FAIR plans and wind pools, while Alabama and South Carolina only operate wind
pools. Florida and Louisiana sponsor state-run insurance companies that serve both the coastal and FAIR plan mar-kets, while California sponsors a privately financed, govern-ment-run pool solely to cover earthquake risk.
While most FAIR plans are quite small, excessive price con-trols in some states prompted significant growth of state-sponsored insurance mechanisms, particularly in the wake of the record 2004 and 2005 hurricane seasons. But thank-fully, that trend seems to be abating overall. According to the Property Insurance Plans Service Office, earned premiums of the nation’s residual property insurance markets fell to $3.1 billion in 2013, having previously peaked at $3.4 billion in 2011 and 2012.22 Expressed as a percentage of the total non-liability residential property insurance markets, residual markets constituted just 2.7 percent of the market in 2013, down from 3.2 percent in 2012 and 3.3 percent in 2011.
Much of that improvement is attributable to the continued shrinking of Florida’s Citizens Property Insurance Corp., which dropped from 14.3 percent of the market in 2011 to 11.3 percent of the market in 2013. Louisiana Citizens also has been rapidly shrinking, from 6.5 percent of the market in 2009 to 3.9 percent of the market in 2013. Massachusetts, which has the largest stand-alone FAIR plan in the nation, also has seen declining share for the state-sponsored entity, falling from 8.0 percent of the market in 2009 to 6.5 percent in 2013.
It isn’t all rosy news. North Carolina’s two residual market entities are once again growing rapidly. The state’s FAIR Plan has seen market share jump from 0.6 percent in 2011 to 1.4 percent in 2013. Meanwhile, its Beach Plan has exploded from 3.4 percent of the market in 2011 to 5.1 percent in 2013.
For this section, we relied on PIPSO data for FAIR and beach plans. In addition to those already named, the next largest FAIR plan is the Rhode Island Joint Reinsurance Associa-tion, with about 3.4 percent of the market, while significant beach plans include the Texas Windstorm Insurance Asso-ciation, with about 3.4 percent of the market, as well as those in Mississippi and Alabama, each with about 1.5 percent of the market.
In Florida’s case, to avoid double counting, we deducted the $390.9 million of premium ceded by Citizens to the Cat Fund,23 with the remaining $881.0 million of Cat Fund premiums accounting for about 10 percent of the market.24
In addition, we assigned a score for premiums written by
22.Property Insurance Plans Services Office Inc., “2013 FAIR and Beach Plan Under-writing Results and Market Penetration Report,” June 2014.
23.Citizens Property Insurance Corp. “2014 Operating Budget,” Board of Governors meeting, Dec. 13, 2013. https://www.citizensfla.com/shared/corpfinance/2014Budget.pdf
24.http://www.sbafla.com/fhcf/Portals/5/Reports/2012_2013_FHCF_AnnualReport.pdf
R STREET POLICY STUDY: 2014 2014 INSURANCE REGULATION REPORT CARD 16

TABLE 6: AUTO INSURANCE
StateResidual Market Concentration Loss Ratio Total Score
(%) Score HHI Score (%) (Score) Raw Weighted
AK 0 0 1699.8 -10 56.3 0 -10 3.8
AL 0 0 1140.9 0 63.8 0 0 6.9
AR 0 0 1050.1 0 63.0 0 0 6.9
AZ 0 0 867.2 5 62.1 0 5 8.5
CA 1 -1 755.3 10 61.5 0 9 9.7
CO 0 0 941.0 5 67.3 0 5 8.5
CT 0 0 765.8 10 63.7 0 10 10.0
DE 0 0 1256.7 -5 65.4 0 -5 5.4
FL 0 0 1067.5 0 67.1 0 0 6.9
GA 0 0 1027.2 0 65.6 0 0 6.9
HI 1 -1 1307.5 -5 50.5 -5 -11 3.5
IA 0 0 989.8 5 60.2 0 5 8.5
ID 0 0 837.7 5 55.9 0 5 8.5
IL 0 0 1273.7 -5 61.4 0 -5 5.4
IN 0 0 926.8 5 61.5 0 5 8.5
KS 0 0 953.0 5 63.0 0 5 8.5
KY 0 0 1122.5 0 68.8 0 0 6.9
LA 0 0 1541.4 -10 64.6 0 -10 3.8
MA 2 -2 1184.5 0 63.2 0 -2 6.3
MD 2 -2 1263.0 -5 65.2 0 -7 4.8
ME 0 0 720.7 10 55.5 0 10 10.0
MI 17.5 -17.5 1004.4 5 122.8 -10 -22.5 0.0
MN 1 -1 1052.9 0 60.4 0 -1 6.6
MO 1 -1 1033.7 0 63.3 0 -1 6.6
MS 0 0 1159.5 0 65.7 0 0 6.9
MT 0 0 1032.4 0 59.1 0 0 6.9
NC 19 -19 906.9 5 63.8 0 -14 2.6
ND 0 0 791.7 10 56.8 0 10 10.0
NE 0 0 1021.6 5 65.9 0 5 8.5
NH 1 -1 767.4 10 59.3 0 9 9.7
NJ 0 0 965.6 5 68.2 0 5 8.5
NM 0 0 1042.7 0 61.9 0 0 6.9
NV 0 0 855.6 5 62.6 0 5 8.5
NY 1 -1 1384.4 -5 67.5 0 -6 5.1
OH 0 0 848.1 5 60.1 0 5 8.5
OK 0 0 1013.9 5 69.0 0 5 8.5
OR 0 0 1021.2 5 62.2 0 5 8.5
PA 0 0 995.8 5 62.3 0 5 8.5
RI 2 -2 954.1 5 67.6 0 3 7.8
SC 0 0 1156.5 0 65.8 0 0 6.9
SD 0 0 838.7 5 67.3 0 5 8.5
TN 1 -1 1139.6 0 67.2 0 -1 6.6
TX 1 -1 885.2 5 63.3 0 4 8.2
UT 0 0 816.1 10 60.5 0 10 10.0
VA 0 0 1015.5 5 63.3 0 5 8.5
VT 1 -1 751.8 10 57.9 0 9 9.7
WA 0 0 695.5 10 61.3 0 10 10.0
WI 0 0 960.0 5 62.1 0 5 8.5
WV 0 0 1293.6 -5 55.6 0 -5 5.4
WY 0 0 1210.6 0 62.8 0 0 6.9Sources: SNL Financial, AIPSO
R STREET POLICY STUDY: 2014 2014 INSURANCE REGULATION REPORT CARD 17

the California Earthquake Authority and premiums ceded to the Florida Hurricane Catastrophe Fund, the only general purpose property reinsurer sponsored by a state entity. Less $98.2 million of premiums it ceded back to private reinsur-ance markets, the CEA’s $203.7 of 2013 net premiums would represent about 2.8 percent of the state’s homeowners mar-ket, were earthquake premiums to be included in the size of that market.25
We tallied the total market share of the FAIR plans, beach plans, earthquake pools and property reinsurance facilities for each state, deducting -1 point for each percentage point of market share controlled by the residual market mecha-nisms. Florida remained the state with the largest percent-age of residual market premium, at 21.3 percent, followed by Massachusetts, North Carolina, Louisiana and Texas. There were 34 states with essentially no residual market homeown-ers insurance premium.
Homeowners Insurance Concentration: On a nationwide basis, the homeowners insurance market last year had an HHI score of 689.7 and the mean of the 50 states was 1046.8, with a standard deviation of 296.5. Hawaii and Alaska were the only states with moderately concentrated homeowners insurance markets, as defined by DOJ and the FTC, and no state had a highly concentrated market.
We assigned +5 points to 17 states whose HHI scores were below the mean, and +10 points to eight states (Connecticut, Florida, Maine, Massachusetts, New Hampshire, New Jersey, Rhode Island and Vermont) that were more than a standard deviation below the mean. Illinois, which was more than a standard deviation above the mean, was deducted -5 points, and two states that were more than two standard deviations above the mean (Hawaii and Alaska) got -10 points.
Homeowners Insurance Loss Ratios: In the homeowners insurance market, the nationwide five-year average loss ratio was 61.8 and the mean of the 50 states was 63.6, with a stan-dard deviation of 18.9. We deducted -5 points from five states (California, Florida, Louisiana, North Dakota and Rhode Island) whose loss ratios were more than a standard devia-tion lower than the mean and -10 points for Hawaii, which was more than two standard deviations below the mean.
At the other end of the spectrum, we deducted -5 points from five states (Alabama, Colorado, Georgia, Nebraska and South Dakota) whose five-year loss ratios were more than a stan-dard deviation above the mean and -10 points from two states (Oklahoma and Tennessee) whose five-year averages were more than two standard deviations above the mean. Taken together, states’ scores in the Homeowners Insurance
25.California Earthquake Authority, “Balance Sheet,” June 30, 2014. http://earth-quakeauthority.com/UserFiles/File/Financial%20Statements/GASB%20BS%20%20IS%20June%202014.pdf
category range from a high of +10 in five states (Connecticut, Maine, New Hampshire, New Jersey and Vermont) to a low of -20 in Hawaii. Those raw scores are then translated into a weighted score of between 0 and 10, as the category repre-sents 10 percent of the total score.
VIII. WORKERS’ COMP MARKETS (7.5 PERCENT OF TOTAL SCORE)
In 48 states and the District of Columbia, all employers are required to compensate employees for workplace-related accidents and illnesses on a no-fault basis. (Texas and Okla-homa permit employers to opt out into the tort system on a voluntary basis.) As such, workers’ compensation insurance is one of the most crucial coverages offered in the commer-cial property/casualty market. Given its intimate link with labor issues and the broader economy, it also tends to be one of the most politically charged and heavily regulated.
While states tend to permit greater rate-making and under-writing freedom for most commercial insurance rates, given the presumption of competent parties with roughly equal bar-gaining power, workers’ comp rates are in many states just as regulated as the so-called “personal lines” of home and auto.
Residual Workers’ Comp Market: Four states – Ohio, North Dakota, Washington and Wyoming – operate monopolistic workers’ comp markets in which the state itself is the only available source of coverage, except for qualified self-insured plans. In addition, 21 states operate competitive workers’ comp funds that serve as a market of last resort, although in several of those states, it is the leading or even dominant provider. Other states offer varying forms of assigned risk, second injury and other forms of workers’ comp residual markets, with many of them administered by the National Council on Compensation Insurance.
The trend of recent years has been away from monopolistic state funds and toward privatization of competitive funds. Nevada had a state monopoly until 1999 and is now an NCCI state. Some states, such as Rhode Island and Maryland, have turned their state funds into mutual insurance companies that also remain markets of last resort. West Virginia main-tained a monopoly state fund until 2005, and its former state fund, Brickstreet Mutual, is now a completely private mutual insurance company.
Most recently, Arizona has joined the privatization move-ment. The state previously maintained a competitive state fund, SCF Arizona, but that entity this year was transitioned into a completely private mutual insurer, without any “ market of last resort” duties, known as CopperPoint Mutual Insurance Co.26
26.Angela Gonzales, “SCF Arizona changes name to CopperPoint Mutual Insurance
R STREET POLICY STUDY: 2014 2014 INSURANCE REGULATION REPORT CARD 18

TABLE 7: HOMEOWNERS INSURANCE
State
Residual Market Concentration Loss Ratio Total Score
(%) Score HHI Score (%) Score Raw Weighted
AK 0.0 0 2064.0 -10 51.5 0 -10 3.3
AL 1.5 -1 1340.0 0 88.9 -5 -6 4.7
AR 0.0 0 1175.8 0 76.4 0 0 6.7
AZ 0.0 0 949.9 5 77.0 0 5 8.3
CA 3.5 -3 965.5 5 41.9 -5 -3 5.7
CO 0.0 0 1035.4 5 100.8 -5 0 6.7
CT 0.3 0 595.0 10 60.6 0 10 10.0
DE 0.1 0 1177.3 0 47.5 0 0 6.7
FL 21.3 -21 507.4 10 33.1 -5 -16 1.3
GA 0.6 -1 1240.0 0 84.6 -5 -6 4.7
HI 0.0 0 1783.6 -10 19.7 -10 -20 0.0
IA 0.1 0 1182.9 0 72.4 0 0 6.7
ID 0.0 0 865.5 5 54.3 0 5 8.3
IL 0.1 0 1480.2 -5 74.5 0 -5 5.0
IN 0.1 0 1049.6 0 71.9 0 0 6.7
KS 0.3 0 1053.1 0 76.3 0 0 6.7
KY 0.5 0 1313.4 0 82.1 0 0 6.7
LA 3.9 -4 1145.0 0 32.1 -5 -9 3.7
MA 6.5 -7 571.1 10 46.5 0 3 7.7
MD 0.1 0 1049.6 0 64.8 0 0 6.7
ME 0.0 0 566.0 10 44.8 0 10 10.0
MI 0.8 -1 983.8 5 62.0 0 4 8.0
MN 0.2 0 1102.3 0 63.3 0 0 6.7
MO 0.1 0 1160.1 0 73.5 0 0 6.7
MS 2.3 -2 1335.2 0 59.7 0 -2 6.0
MT 0.0 0 1197.3 0 80.5 0 0 6.7
NC 6.5 -6 913.6 5 66.4 0 -1 6.3
ND 0.0 0 842.1 5 43.6 -5 0 6.7
NE 0.0 0 1171.9 0 83.4 -5 -5 5.0
NH 0.0 0 605.6 10 48.8 0 10 10.0
NJ 0.4 0 568.0 10 72.9 0 10 10.0
NM 0.7 -1 1216.0 0 59.0 0 -1 6.3
NV 0.0 0 1004.4 5 45.7 0 5 8.3
NY 0.5 -1 762.7 5 52.7 0 4 8.0
OH 0.7 -1 864.3 5 78.2 0 4 8.0
OK 0.0 0 1308.3 0 118.2 -10 -10 3.3
OR 0.1 0 1234.2 0 46.9 0 0 6.7
PA 0.2 0 1033.5 5 64.8 0 5 8.3
RI 3.4 -3 739.7 10 44.7 -5 2 7.3
SC 0.7 -1 912.4 5 52.3 0 4 8.0
SD 0.0 0 854.4 5 85.9 -5 0 6.7
TN 0.0 0 1259.1 0 105.4 -10 -10 3.3
TX 4.5 -5 1165.4 0 58.4 0 -5 5.0
UT 0.0 0 925.8 5 56.0 0 5 8.3
VA 0.6 -1 984.4 5 53.6 0 4 8.0
VT 0.0 0 662.3 10 48.1 0 10 10.0
WA 0.0 0 967.0 5 50.5 0 5 8.3
WI 0.1 0 920.9 5 63.2 0 5 8.3
WV 0.1 0 1216.4 0 66.4 0 0 6.7
WY 0.0 0 1319.9 0 73.6 0 0 6.7 Sources: SNL Financial, PIPSO, Florida SBA, CEA
R STREET POLICY STUDY: 2014 2014 INSURANCE REGULATION REPORT CARD 19

For this metric, using data provided by SNL Financial, NCCI and other plan administrators, we deducted -1 point for every five points of market share held by a state’s residual market entity, up to -20 points for the four monopolistic states.
Workers’ Comp Concentration: The concentrations of state workers’ comp markets vary much more widely than do those of home and auto insurance. Evidence of this can be seen in the fact that, while the nationwide HHI for last year was 287.9, indicating a very competitive market, the mean of the 46 state markets with open competition was 1258.6, with an enormous standard deviation of 1206.7.
We excluded from consideration the four states with monopo-listic state funds, assigning -10 each to Ohio, North Dakota, Washington and Wyoming. That score was also assigned to eight other states – Colorado, Idaho, Maine, Montana, Oregon, Rhode Island, Utah and West Virginia – whose HHI scores were greater than 2,500 and would thus qualify as “highly concentrated” under the standards used by the DOJ and FTC.
Three other states (Alaska, New York and Texas) with “mod-erately concentrated” markets, measured by HHI scores of between 1,500 and 2,500, were given scores of -5.
We awarded +5 points to 15 states whose HHI was below 629.3 (half of the mean) and +10 points to seven states (Geor-gia, Illinois, Indiana, Iowa, North Carolina, Pennsylvania and Tennessee) whose HHI was less than 419.5, or one-third of the mean.
Workers’ Comp Loss Ratios: In the workers’ comp market, the nationwide five-year average loss ratio was 69.5 and the mean of the 50 states was 67.8, with a standard deviation of 17.We deducted -5 points from three states (Nevada, Texas and West Virginia) whose five-year loss ratios were more than a standard deviation below the mean, and -10 points from two states (North Dakota and Wyoming) whose five-year aver-age was more than two standard deviations below the mean. At the other end of the distribution, -5 points were deducted from Delaware and Oregon, whose averages were more than a standard deviation greater than the mean, and -10 points were deducted from Ohio and Washington, which were more than two standard deviations greater than the mean.
Taken together, states’ scores in the Workers’ Comp category range from a high of +10 in North Carolina and Tennessee to a low of -40 in the four monopolistic states (North Dakota, Ohio, Washington and Wyoming.) Those raw scores are then translated into a weighted score of between 0 and 7.5, as the category represents 7.5 percent of the total score.
Co.,” Phoenix Business Journal, Dec. 4, 2013. http://www.bizjournals.com/phoenix/news/2013/12/04/scf-arizona-changes-name-to.html
UNDERWRITING FREEDOM
We should admit our biases upfront: when it comes to the design and pricing of insurance products, we believe mar-kets regulate themselves. States impose a variety of schemes to impose controls on how quickly or how sharply premi-um rates can rise, as well as rules about what are or are not appropriate rating and underwriting factors. But ultimately, it is not possible to force an insurer to sell coverage at levels below what they deem to be acceptable risk-adjusted returns.
Leaving the futility of rate controls to the side, it is important to note that not all rate regulation systems are created equal. Based on a synthesis of both statutory rules compiled by the NAIC, and analysis of how certain states apply the rules on the books, we have classified rate regulation systems into six categories, from most to least restrictive and distortionary.
IX. RATE REGULATION (10 PERCENT OF TOTAL SCORE)
Below-Risk Rates: (-20 points) Just one state, Florida, is clas-sified as practicing “below-risk rates.” The reason for this is that rates set by the state-run Citizens Property Insurance Corp., which were rolled back and frozen in 2007 and have been permitted to rise just 10 percent annually since 2010, effectively act as the ceiling on rates that private insurers can charge in the residential property insurance market. Citizens is required by law to accept any applicant who can produce a quote from even one insurer who charges at least 15 per-cent more for a similar policy. Thus, private companies are effectively limited in their ability to charge rates to 15 percent more than the rates of a government agency that is, by design, charging far less than actuaries recommend.
No Flexibility: (-15 points) There are two states that, for dif-fering reasons, we place in the category of “no flexibility” – North Carolina and California. North Carolina relies on one of the oldest rate-making systems in the country, one that was still common nationwide just a few decades ago, in that it asks insurers in the auto and homeowners insurance mar-kets to submit rate filings en masse through a rate bureau, with those filings given a summary “thumbs up” or “thumbs down by the insurance commissioner. While insurers are allowed to deviate downward from the filed rates, they may not exceed them. They also have little to no flexibility in terms of deviating from standardized product designs, mean-ing that North Carolina consumers largely have no access to the same innovative new products available in neighbor-ing states. California, by contrast, regulates according to the dictates of the 26-year-old referendum Proposition 103, which mandates certain rating factors, proscribes others and includes a de facto ban on any factor not contemplated when the proposition was passed.
Low Flexibility: (-10 points) Most of the four states falling into
R STREET POLICY STUDY: 2014 2014 INSURANCE REGULATION REPORT CARD 20

TABLE 8: WORKERS’ COMP
StateResidual Market Concentration Loss Ratio Total Score
(%) Score HHI Score (%) Score Raw Weighted
AK 12.8 -3 1559.1 -5 58.7 0 -8 4.9
AL 3.7 -1 484.3 5 63.4 0 4 6.6
AR 8.4 -2 535.4 5 52.3 0 3 6.5
AZ 5.9 -1 1205.7 0 76.8 0 -1 5.8
CA 10.8 -2 485.1 5 69.5 0 3 6.4
CO 58.8 -12 3573.1 -10 74.3 0 -22 2.7
CT 5.9 -1 757.1 0 77.8 0 -1 5.8
DE 0.6 0 602.0 5 90.1 -5 0 6.0
FL 0.8 0 486.3 5 56.3 0 5 6.7
GA 4.2 -1 391.1 10 62.3 0 9 7.4
HI 23.0 -5 1219.2 0 58.3 0 -5 5.3
IA 6.1 -1 395.8 10 75.1 0 9 7.3
ID 60.3 -12 3767.0 -10 75.4 0 -22 2.7
IL 4.4 -1 365.4 10 76.3 0 9 7.4
IN 3.0 -1 347.7 10 65.6 0 9 7.4
KS 9.1 -2 527.1 5 62.4 0 3 6.5
KY 29.3 -6 1120.7 0 72.4 0 -6 5.1
LA 22.8 -5 897.1 0 66.6 0 -5 5.3
MA 13.4 -3 769.2 0 65.1 0 -3 5.6
MD 24.6 -5 970.1 0 80.1 0 -5 5.3
ME 62.6 -13 4044.5 -10 69.5 0 -23 2.6
MI 0.0 0 562.1 5 57.5 0 5 6.8
MN 12.3 -2 435.3 5 68.6 0 3 6.4
MO 20.2 -4 773.1 0 62.1 0 -4 5.4
MS 6.0 -1 483.7 5 62.7 0 4 6.6
MT 60.9 -12 3867.8 -10 72.6 0 -22 2.7
NC 1.1 0 382.2 10 70.7 0 10 7.5
ND 100.0 -20 N/A -10 17.6 -10 -40 0.0
NE 0.0 0 507.0 5 65.6 0 5 6.8
NH 9.7 -2 678.6 0 62.1 0 -2 5.7
NJ 0.8 0 969.3 0 74.4 0 0 6.0
NM 5.9 -1 1437.9 0 71.2 0 -1 5.8
NV 7.4 -1 520.0 5 44.5 -5 -1 5.8
NY 44.0 -9 2153.8 -5 80.8 0 -14 3.9
OH 100.0 -20 N/A -10 112.9 -10 -40 0.0
OK 30.5 -6 1210.5 0 80.7 0 -6 5.1
OR 67.6 -14 4721.4 -10 96.0 -5 -29 1.7
PA 8.5 -2 379.6 10 68.1 0 8 7.2
RI 61.3 -12 3883.0 -10 65.7 0 -22 2.7
SC 4.8 -1 440.2 5 64.0 0 4 6.6
SD 5.4 -1 490.8 5 59.9 0 4 6.6
TN 0.0 0 401.2 10 64.2 0 10 7.5
TX 38.6 -8 1726.2 -5 50.1 -5 -18 3.3
UT 50.9 -10 2744.6 -10 64.4 0 -20 3.0
VA 6.7 -1 433.0 5 63.1 0 4 6.5
VT 9.0 -2 822.2 0 65.0 0 -2 5.7
WA 100.0 -20 N/A -10 128.0 -10 -40 0.0
WI 0.0 0 439.9 5 74.8 0 5 6.8
WV 4.8 -1 2927.8 -10 50.3 -5 -16 3.6
WY 100.0 -20 N/A -10 26.2 -10 -40 0.0
Sources: SNL Financial, NCCI Holdings, Miscellaneous funds
the “low-flexibility” (Alabama, Connecticut, New York and Washington) category have prior approval rating systems, in which the regulator must explicitly approve each rate or rating change before an insurer is permitted to deploy it in the market.
Below-Average Flexibility: (-5 points) States with more flex-ible prior approval systems or with relatively inflexible file-and-use systems were categorized as below average. The 14 states that fall into this category have rules for rate changes that are relatively transparent and predictable, but nonethe-less, unnecessarily stringent. No state with a prior approval system for property/casualty insurance scored better than this category’s -5 points.
Moderate Flexibility: (0 points) The baseline rating of 0 points was reserved for 15 states that maintain convention-ally administered file-and-use and flex rating systems. These systems generally allow the market to set rates, but reserves additional scrutiny for larger rate changes.
Above-Average Flexibility: (5 points) Some states maintain use-and-file or file-and-use systems that are only lightly administered. Insurance commissioners retain the author-ity to disapprove rates or delay their implementation, but typically only exercise that authority in particularly extreme cases. States included in this category were Arizona, Ken-tucky, Maryland, Oklahoma, South Carolina, Utah, Virginia and Wisconsin.
High Flexibility: (10 points) A handful of states (Missouri, Ohio, Tennessee, Vermont and Wyoming) have use-and-file systems where interventions to disallow a filed rate are limited to cases either where the rating system may have a discriminatory impact, or where it is likely to prove inad-equate and endanger the company’s solvency. These states were judged to have high flexibility and received +10 points.
No File: (20 points) Illinois is unique in that insurers general-ly do not have to file rates at all, although they must keep doc-umentation of their rates available for regulators to review. This system’s nearly pure free market in insurance rates was awarded with 20 points.
Taken together, states’ scores in the Rate Regulation category range from a high of +20 in Illinois to a low of -20 in Florida. Those raw scores are then translated into a weighted score of between 0 and 10, as the category represents 10 percent of the total score.
X. REGULATORY CLARITY (7.5 PERCENT OF TOTAL SCORE)
Rule of law requires that regulations be clear and consis-tently applied. Neither companies nor consumers can abide
R STREET POLICY STUDY: 2014 2014 INSURANCE REGULATION REPORT CARD 21

by the rules if they cannot anticipate how they will be applied and interpreted. By and large, insurers give state insurance departments good marks on this front, finding most states to be forthright and transparent in their dealings.
However, some states have become notorious for what the industry commonly calls “desk drawer rules,” in which regu-lators’ interpretation of ambiguities in the statutory code or inconsistent application of legal provisions creates a lack of clarity.
Where we received reports from more than one source of a state using “desk drawer rules,” we assigned a score of -10. Those states were: Alabama, Arkansas, California, Connecti-cut, Delaware, Florida, Georgia, Maryland, Massachusetts, Mississippi, New Hampshire and New York.
However, we also assigned +10 points to any state that at least two sources identified as being notably transparent in their rule-making and implementation process. Those states were: Illinois, Louisiana, North Carolina, Ohio, South Carolina and Vermont.
Those raw scores are then translated into a weighted score of between 0 and 7.5, as the category represents 7.5 percent of the total score.
XI. RATING RESTRICTIONS (7.5 PERCENT OF TOTAL SCORE)
Credit Scoring: The evolution of credit-based insurance scoring arguably has been the biggest factor in massive depopulation of state residual auto insurance markets. In the past, auto insurers had only a limited number of rat-ing factors on which to base their underwriting and rate-setting decisions, and only a limited number of consumers could qualify for preferred standard rates. The discovery of actuarially credible variables tied to credit information has allowed insurers to construct tremendously innovative pro-prietary rating models that can assign a proper rate to virtu-ally any potential insured.
However, the use of credit in insurance has periodically prov-en to be politically controversial. Despite studies by, among others, the Federal Trade Commission and the Texas Depart-ment of Insurance demonstrating conclusively that credit factors are predictive of future claims,27 some politicians and much of the general public have remained skeptical.
Responding to concerns about the disparate impact cred-it-based insurance scoring could have on certain protected
27.Federal Trade Commission, “Credit-Based Insurance Scores: Impacts on Consum-ers of Automobile Insurance,” July 2007. http://www.ftc.gov/sites/default/files/documents/reports/credit-based-insurance-scores-impacts-consumers-automobile-insurance-report-congress-federal-trade/p044804facta_report_credit-based_insur-ance_scores.pdf
TABLE 9: RATE REGULATION AND CLARITY
StateRate Regulation Clarity
Score Weighted Score Weighted
AK 0 5.0 0 3.8
AL -10 2.5 -10 0.0
AR 0 5.0 -10 0.0
AZ 5 6.3 0 3.8
CA -15 1.3 -10 0.0
CO -5 3.8 0 3.8
CT -10 2.5 -10 0.0
DE 0 5.0 -10 0.0
FL -20 0.0 -10 0.0
GA 0 5.0 -10 0.0
HI -5 3.8 0 3.8
IA -5 3.8 0 3.8
ID 0 5.0 0 3.8
IL 20 10.0 10 7.5
IN 0 5.0 0 3.8
KS -5 3.8 0 3.8
KY 5 6.3 0 3.8
LA -5 3.8 10 7.5
MA -5 3.8 -10 0.0
MD 5 6.3 -10 0.0
ME 0 5.0 0 3.8
MI -5 3.8 0 3.8
MN 0 5.0 0 3.8
MO 10 7.5 0 3.8
MS -5 3.8 -10 0.0
MT 0 5.0 0 3.8
NC -15 1.3 10 7.5
ND -5 3.8 0 3.8
NE 0 5.0 0 3.8
NH 0 5.0 -10 0.0
NJ -5 3.8 0 3.8
NM 0 5.0 0 3.8
NV -5 3.8 0 3.8
NY -10 2.5 -10 0.0
OH 10 7.5 10 7.5
OK 5 6.3 0 3.8
OR -5 3.8 0 3.8
PA 0 5.0 0 3.8
RI 0 5.0 0 3.8
SC 5 6.3 10 7.5
SD 0 5.0 0 3.8
TN 10 7.5 0 3.8
TX -5 3.8 0 3.8
UT 5 6.3 0 3.8
VA 5 6.3 0 3.8
VT 10 7.5 10 7.5
WA -10 2.5 0 3.8
WI 5 6.3 0 3.8
WV -5 3.8 0 3.8
WY 10 7.5 0 3.8
Source: R Street Institute, Insurance Information Institute
R STREET POLICY STUDY: 2014 2014 INSURANCE REGULATION REPORT CARD 22

TABLE 10: RATING RESTRICTIONS
State Credit Territory PersonalTotal Scores
Raw Weighted
AK 0 0 0 0 7.5
AL 0 0 0 0 7.5
AR 0 0 0 0 7.5
AZ 0 0 0 0 7.5
CA -10 -10 -10 -30 0
CO 0 -10 0 -10 5
CT 0 -10 0 -10 5
DE 0 0 0 0 7.5
FL 0 -10 0 -10 5
GA 0 0 0 0 7.5
HI -10 0 -10 -20 2.5
IA 0 0 0 0 7.5
ID 0 0 0 0 7.5
IL 0 0 0 0 7.5
IN 0 0 0 0 7.5
KS 0 0 0 0 7.5
KY 0 0 0 0 7.5
LA 0 0 0 0 7.5
MA -10 0 -10 -20 2.5
MD -10 -10 0 -20 2.5
ME 0 0 0 0 7.5
MI 0 0 -10 -10 5
MN 0 0 0 0 7.5
MO 0 -10 0 -10 5
MS 0 0 0 0 7.5
MT 0 0 -10 -10 5
NC 0 0 -10 -10 5
ND 0 0 0 0 7.5
NE 0 0 0 0 7.5
NH 0 -10 0 -10 5
NJ 0 -10 0 -10 5
NM 0 0 0 0 7.5
NV 0 0 0 0 7.5
NY 0 0 0 0 7.5
OH 0 0 0 0 7.5
OK 0 0 0 0 7.5
OR 0 0 0 0 7.5
PA 0 0 -10 -10 5
RI 0 0 0 0 7.5
SC 0 0 0 0 7.5
SD 0 -10 0 -10 5
TN 0 0 0 0 7.5
TX 0 0 0 0 7.5
UT 0 0 0 0 7.5
VA 0 0 0 0 7.5
VT 0 0 0 0 7.5
WA -10 0 0 -10 5
WI 0 0 0 0 7.5
WV 0 0 0 0 7.5
WY 0 0 0 0 7.5 Sources: R Street Institute, NCOIL, Insurance Information Institute
populations, roughly half the states have passed a model reg-ulation promulgated by the National Conference of Insur-ance Legislators that bars insurers from using credit scores as the sole factor in determining insurance rates. While rea-sonable and well-meaning, such regulations are also large-ly irrelevant, as no insurers use credit scores as their only underwriting variable.
However, a few states have moved beyond the NCOIL mod-el to explicitly ban credit scoring in personal insurance. Hawaii explicitly bans the use of credit in auto insurance underwriting and rate-making, while California and Mas-sachusetts disallow its use under their current regulatory regimes. Maryland has banned its use in homeowners insur-ance, while Washington state significantly proscribes its con-sideration in cancellations and nonrenewals. We deducted -10 points for each of the five states with restrictive credit-scoring rules.
Territorial Rating: Where a piece of property is located, or where a car is garaged and driven, can have a large impact on the likelihood that it will experience claims-generating losses. States generally recognize this reality, and permit insurers to consider location as a factor in their underwrit-ing and rate-setting decisions.
Like the use of credit, most states generally prohibit insurers from making territory the sole factor in determining wheth-er and at what price to insure cars and homes. However, in some states, regulators enforce restrictions on the use of ter-ritory that are much more stringent than the norm. For nine of those states (California, Colorado, Connecticut, Florida, Maryland, Missouri, New Hampshire, New Jersey and South Dakota), we have deducted -10 points.
Personal Factors: The states of California, Hawaii, Massa-chusetts and North Carolina prohibit the use of age or gen-der as underwriting variables, regardless of actuarial validity. Pennsylvania also prohibits consideration of gender, while Michigan and Montana prohibit consideration of either gen-der or marital status. We have deducted -10 points from each of these seven states.
Taken together, states’ scores in the Rating Restrictions cat-egory range from the 34 states that do not apply any notable restrictions on the use of credit, territory or personal factors in underwriting and rate-setting, to a low of -30 in California. Those raw scores are then translated into a weighted score of between 0 and 7.5, as the category represents 7.5 percent of the total score.
R STREET POLICY STUDY: 2014 2014 INSURANCE REGULATION REPORT CARD 23

TABLE 11: REGULATORY MODERNIZATION
State Collateral IIPRC SLIMPACT e-Policies e-Info e-ProofTotal Score
Raw Weighted
AK 0 0 0 5 0 5 10 2.1
AL 10 0 10 0 0 5 25 5.4
AR 0 0 0 0 5 5 10 2.1
AZ 0 0 0 5 5 5 15 3.2
CA 0 -10 0 0 5 5 0 0.0
CO 10 0 0 5 0 5 20 4.3
CT 10 -10 0 0 0 0 0 0.0
DE 0 -10 0 0 5 5 0 0.0
FL 10 -5 0 5 5 5 20 4.3
GA 10 0 0 5 0 5 20 4.3
HI 10 0 0 0 0 5 15 3.2
IA 10 0 0 5 5 5 25 5.4
ID 0 0 0 0 5 5 10 2.1
IL 0 0 0 5 0 5 10 2.1
IN 10 0 10 5 5 5 35 7.5
KS 0 0 10 5 5 5 25 5.4
KY 0 0 10 0 5 5 20 4.3
LA 10 0 0 0 0 5 15 3.2
MA 10 0 0 0 0 0 10 2.1
MD 10 0 0 0 0 5 15 3.2
ME 10 0 0 0 0 5 15 3.2
MI 0 0 0 5 0 0 5 1.1
MN 0 0 0 5 5 5 15 3.2
MO 10 0 0 5 5 5 25 5.4
MS 0 0 0 0 0 5 5 1.1
MT 0 0 0 0 0 0 0 0.0
NC 0 0 0 0 5 0 5 1.1
ND 0 -10 10 0 0 5 5 1.1
NE 0 0 0 0 0 5 5 1.1
NH 10 0 0 0 0 0 10 2.1
NJ 10 0 0 0 0 0 10 2.1
NM 10 0 10 0 0 0 20 4.3
NV 0 0 0 0 0 0 0 0.0
NY 10 0 0 0 0 0 10 2.1
OH 10 0 0 5 0 0 15 3.2
OK 0 0 0 5 0 5 10 2.1
OR 0 0 0 0 5 5 10 2.1
PA 0 0 0 5 5 5 15 3.2
RI 10 0 10 0 0 5 25 5.4
SC 0 0 0 0 0 5 5 1.1
SD 0 -10 0 5 5 5 5 1.1
TN 0 0 10 0 5 5 20 4.3
TX 0 0 0 5 5 5 15 3.2
UT 0 0 0 0 5 5 10 2.1
VA 10 0 0 5 5 5 25 5.4
VT 10 0 10 0 0 0 20 4.3
WA 0 0 0 0 0 5 5 1.1
WI 0 0 0 5 5 5 15 3.2
WV 0 0 0 0 5 0 5 1.1
WY 0 0 0 5 5 5 15 3.2
Sources: NAIC, IIPRC, Wiley Rein, NAPSLO, PCI
R STREET POLICY STUDY: 2014 2014 INSURANCE REGULATION REPORT CARD 24

XII. REGULATORY MODERNIZATION (7.5 PERCENT OF TOTAL SCORE)
Our final rating variable looks at states’ willingness to mod-ernize what can be, in some cases, fairly sclerotic regulatory systems, join select multi-state compacts and acknowledge the need to more readily accommodate modern digital com-munication.
Collateral Reform: Historically, firms operating in the global reinsurance market who wished to do business in the United States had two options. One was to establish a licensed and authorized operating unit, domiciled onshore and regulated by a state insurance department. The other was to write cov-erage “cross-border,” with the terms of coverage bound in the reinsurer’s own home jurisdiction.
However, the latter option came with a significant catch. Due in part to concerns that cross-border obligations could be difficult to enforce in U.S. courts; in part to a lack of trust in the prudential regulation of foreign jurisdictions; in part to protectionist pressures of U.S. domiciled reinsurers; and in part to pressure from domestic primary insurers who wanted a leg up in their negotiations with reinsurance partners; U.S. regulators historically have required that primary insurers could only receive credit for reinsurance provided by unau-thorized reinsurers if the reinsurance liabilities are collater-alized at 100 percent.
After years of debate, and state-level experiments in Florida and New York to allow for reduced collateral requirements, the NAIC in 2011 passed changes to its Credit for Reinsur-ance Model Act and Regulation to allow financially strong reinsurers from acknowledged jurisdictions to post reduced collateral. We awarded +10 points to each of 21 states that have adopted rules based on the model regulation, as of the time of this writing.
Interstate Insurance Product Regulation Commission: Launched in May 2006, the IIPRC has looked to address con-cerns that the state-based regulatory system made it oner-ous to bring new life insurance products to market, in ways that hindered the industry’s ability to compete with similar products from the banking and securities sectors. The com-pact offers insurers a single filing point for new life, annui-ties, disability and long-term-care insurance products. Once approved by the commission, the product becomes eligible for sale in any signatory state.
There are now 44 signatory states to the compact, repre-senting roughly 70 percent of U.S. life insurance premiums. Because the overwhelming majority of states are now mem-bers, we deducted -10 points from the five states (California, Connecticut, Delaware, North Dakota and South Dakota) that have yet to join the compact, and -5 points from Florida, which passed a non-standard version of the compact.
SLIMPACT: A more recent effort at interstate compact, the Surplus Lines Insurance Multi-State Compliance Compact follows in the wake of provisions included in 2010’s Dodd-Frank Wall Street Reform and Consumer Protection Act granting tax and regulatory authority over most aspects of multi-state surplus lines contracts to the home state of the insured. The compact, which will become active when it is joined by a tenth state, sets out a uniform system for report-ing, paying, collecting and allocating premium taxes among compact members.
We assigned +10 points to each of the nine states that have joined SLIMPACT: Alabama, Indiana, Kansas, Kentucky, New Mexico, North Dakota , Rhode Island, Tennessee and Vermont.
E-Commerce: After a somewhat sluggish start, state insur-ance departments are beginning to update rules to recog-nize the central role Internet and wireless communications play in modern commerce. In recognition of these trends, we awarded:
• +5 points to each of the 18 states that allow con-sumers to access their insurance policies and other documents online.
• +5 points to each of the 24 states that allow insur-ers to provide all notifications over the Internet to consumers who consent.
• +5 points to each of the 37 states that allow drivers to show electronic proof of insurance during traffic stops.
Taken together, states’ scores in the Regulatory Moderniza-tion category range from a high of +35 in Indiana to a low of 0, shared by five states: California, Connecticut, Delaware, Montana and Nevada. Those raw scores are then translated into a weighted score of between 0 and 7.5, as the category represents 7.5 percent of the total score.
GRADING AND RESULTS
We calculated scores for every state by adding the weighted results from all 12 variables and calculating a standard devia-tion from the mean. The mean was 61.0 and the standard deviation was 8.0. States were graded as follows:
More than one standard deviation above the mean: A rangeAbove the mean by less than one standard deviation: B rangeBelow the mean by less than one standard deviation: C rangeBelow the mean by more than one standard deviation: D rangeBelow the mean by more than two standard deviations: FWe awarded pluses and minuses to recognize states at the top and bottom end of each grade range.
R STREET POLICY STUDY: 2014 2014 INSURANCE REGULATION REPORT CARD 25

Vermont had the best property/casualty insurance regula-tory environment in the United States this year, earning an ‘A+’ for the second straight year. Two states, California and North Carolina, received failing grades, falling more than two standard deviations below the mean.
A capsule summary of results for each of the 50 states fol-lows:
ALABAMA
2013 Grade 2014 Grade
C C+
Score Rank
60.4 30
Strengths: Low politicization, auto insurance market, few rating restrictions, regulatory modernization
Weaknesses: Rate regulation, desk drawer rules
ALASKA
2013 Grade 2014 Grade
C C+
Score Rank
59.8 31
Strengths: Antifraud, consumer protection, low politicization
Weaknesses: Little regulatory modernization
ARIZONA
2013 Grade 2014 Grade
B B
Score Rank
64.7 20
Strengths:Low politicization, auto insurance market,
home insurance market, workers’ comp market, rate freedom, few rating restrictions
Weaknesses: Consumer protection
ARKANSAS
2013 Grade 2014 Grade
B C
Score Rank
58.6 34
Strengths:Antifraud, auto insurance market, home insur-
ance market, low politicization, few rating restrictions
Weaknesses: Solvency regulation, fiscal efficiency, desk drawer rules, little regulatory modernization
CALIFORNIA
2013 Grade 2014 Grade
D F
Score Rank
44.2 50
Strengths: Antifraud, fiscal efficiency, auto insurance market, workers’ comp market
Weaknesses:High politicization, rate regulation, desk
drawer rules, rating restrictions, little regula-tory modernization
COLORADO
2013 Grade 2014 Grade
C B
Score Rank
66.0 15
Strengths:Solvency regulation, low politicization, fiscal
efficiency, auto insurance market, home insur-ance market
Weaknesses: Workers’ comp market
CONNECTICUT
2013 Grade 2014 Grade
B B-
Score Rank
61.4 27
Strengths: Fiscal efficiency, auto insurance market, home insurance market, workers’ comp market
Weaknesses: Rate regulation, desk drawer rules, little regu-latory modernization
R STREET POLICY STUDY: 2014 2014 INSURANCE REGULATION REPORT CARD 26
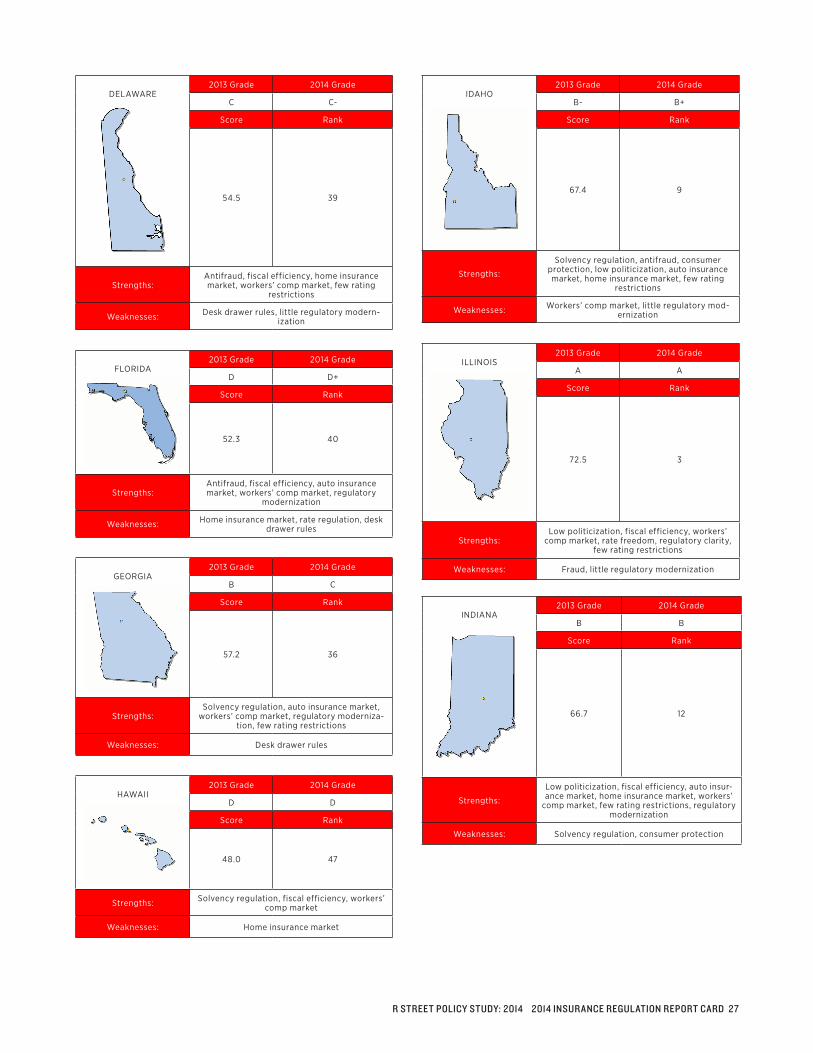
DELAWARE
2013 Grade 2014 Grade
C C-
Score Rank
54.5 39
Strengths:Antifraud, fiscal efficiency, home insurance market, workers’ comp market, few rating
restrictions
Weaknesses: Desk drawer rules, little regulatory modern-ization
FLORIDA
2013 Grade 2014 Grade
D D+
Score Rank
52.3 40
Strengths:Antifraud, fiscal efficiency, auto insurance market, workers’ comp market, regulatory
modernization
Weaknesses: Home insurance market, rate regulation, desk drawer rules
GEORGIA
2013 Grade 2014 Grade
B C
Score Rank
57.2 36
Strengths:Solvency regulation, auto insurance market,
workers’ comp market, regulatory moderniza-tion, few rating restrictions
Weaknesses: Desk drawer rules
HAWAII
2013 Grade 2014 Grade
D D
Score Rank
48.0 47
Strengths: Solvency regulation, fiscal efficiency, workers’ comp market
Weaknesses: Home insurance market
IDAHO
2013 Grade 2014 Grade
B- B+
Score Rank
67.4 9
Strengths:
Solvency regulation, antifraud, consumer protection, low politicization, auto insurance market, home insurance market, few rating
restrictions
Weaknesses: Workers’ comp market, little regulatory mod-ernization
ILLINOIS
2013 Grade 2014 Grade
A A
Score Rank
72.5 3
Strengths:Low politicization, fiscal efficiency, workers’
comp market, rate freedom, regulatory clarity, few rating restrictions
Weaknesses: Fraud, little regulatory modernization
INDIANA
2013 Grade 2014 Grade
B B
Score Rank
66.7 12
Strengths:
Low politicization, fiscal efficiency, auto insur-ance market, home insurance market, workers’
comp market, few rating restrictions, regulatory modernization
Weaknesses: Solvency regulation, consumer protection
R STREET POLICY STUDY: 2014 2014 INSURANCE REGULATION REPORT CARD 27

IOWA
2013 Grade 2014 Grade
B A
Score Rank
71.9 4
Strengths:
Low politicization, fiscal efficiency, auto insur-ance market, home insurance market, workers’ comp market, few rating restrictions, regula-
tory modernization
Weaknesses: None
KANSAS
2013 Grade 2014 Grade
B B
Score Rank
65.2 18
Strengths:Fiscal efficiency, auto insurance market, home insurance market, few rating restrictions, regu-
latory modernization
Weaknesses: Politicization
KENTUCKY
2013 Grade 2014 Grade
B A-
Score Rank
69.5 8
Strengths:Solvency regulation, low politicization, rate
regulation, regulatory clarity, few rating restrictions, regulatory modernization
Weaknesses: Workers’ comp market
LOUISIANA
2013 Grade 2014 Grade
C D
Score Rank
50.8 43
Strengths: Regulatory clarity, workers’ comp market, regulatory clarity, few rating restrictions
Weaknesses: Politicization, fiscal efficiency
MAINE
2013 Grade 2014 Grade
C A-
Score Rank
70.8 21
Strengths:
Solvency regulation, consumer protection, low politicization, fiscal efficiency, auto insurance
market, home insurance market, few rating restrictions
Weaknesses: None
MARYLAND
2013 Grade 2014 Grade
C C
Score Rank
57.9 35
Strengths:Solvency regulation, low politicization, fiscal efficiency, home insurance market, workers’
comp market,
Weaknesses: Desk drawer rules
MASSACHUSETTS
2013 Grade 2014 Grade
C- D
Score Rank
49.1 45
Strengths: Low politicization, home insurance market, workers’ comp market
Weaknesses: Fiscal efficiency, desk drawer rules, little regu-latory modernization
MICHIGAN
2013 Grade 2014 Grade
C D
Score Rank
50.5 44
Strengths: Fiscal efficiency, home insurance market, workers’ comp market
Weaknesses: Fraud, auto insurance market, little regulatory modernization
R STREET POLICY STUDY: 2014 2014 INSURANCE REGULATION REPORT CARD 28

MINNESOTA
2013 Grade 2014 Grade
A- B
Score Rank
66.7 11
Strengths: Antifraud, low politicization, fiscal efficiency, home insurance market, few rating restrictions
Weaknesses: None
MISSISSIPPI
2013 Grade 2014 Grade
C D+
Score Rank
51.9 41
Strengths: Solvency regulation, auto insurance market, workers’ comp market, few rating restrictions
Weaknesses: Desk drawer rules, little regulatory modern-ization
MISSOURI
2013 Grade 2014 Grade
A- B
Score Rank
64.5 21
Strengths:Low politicization, fiscal efficiency, home
insurance market, workers’ comp market, rate freedom, regulatory modernization
Weaknesses: Solvency regulation
MONTANA
2013 Grade 2014 Grade
D+ D-
Score Rank
46.7 48
Strengths: Antifraud, auto insurance market, home insur-ance market,
Weaknesses: Solvency regulation, fiscal efficiency, workers’ comp market, little regulatory modernization
NEBRASKA
2013 Grade 2014 Grade
B+ B
Score Rank
66.4 13
Strengths:Low politicization, fiscal efficiency, auto insur-ance market, workers’ comp market, few rating
restrictions
Weaknesses: Little regulatory modernization
NEVADA
2013 Grade 2014 Grade
B B
Score Rank
66.0 17
Strengths:Solvency regulation, low politicization, auto insurance market, home insurance market,
workers’ comp market, few rating restrictions
Weaknesses: Little regulatory modernization
NEW HAMPSHIRE
2013 Grade 2014 Grade
B B
Score Rank
62.0 26
Strengths:Antifraud, low politicization, auto insurance
market, home insurance market, workers’ comp market
Weaknesses: Solvency regulation, desk drawer rules, little regulatory modernization
R STREET POLICY STUDY: 2014 2014 INSURANCE REGULATION REPORT CARD 29

NEW JERSEY
2013 Grade 2014 Grade
B B+
Score Rank
67.4 10
Strengths:Antifraud, low politicization, auto insurance
market, home insurance market, workers’ comp market
Weaknesses: Little regulatory modernization
NEW MEXICO
2013 Grade 2014 Grade
C B
Score Rank
64.0 23
Strengths:Solvency regulation, low politicization, auto
insurance market, workers’ comp market, few rating restrictions
Weaknesses: Fiscal efficiency
NEW YORK
2013 Grade 2014 Grade
F D
Score Rank
48.4 46
Strengths: Low politicization, home insurance market, few rating restrictions
Weaknesses: Fiscal efficiency, desk drawer rules, little regu-latory modernization
NORTH CAROLINA
2013 Grade 2014 Grade
C F
Score Rank
44.9 49
Strengths: Workers’ comp market, regulatory clarity
Weaknesses:Solvency regulation, consumer protection, auto insurance market, rate regulation, little regula-
tory modernization
NORTH DAKOTA
2013 Grade 2014 Grade
D C+
Score Rank
59.1 33
Strengths:Antifraud, consumer protection, fiscal effi-
ciency, auto insurance market, home insurance market, few rating restrictions
Weaknesses: Workers’ comp market, little regulatory mod-ernization
OHIO
2013 Grade 2014 Grade
C+ A-
Score Rank
69.7 7
Strengths:Low politicization, fiscal efficiency, auto insur-ance market, home insurance market, rate free-dom, regulatory clarity, few rating restrictions
Weaknesses: Workers’ comp market
OKLAHOMA
2013 Grade 2014 Grade
C C
Score Rank
55.3 38
Strengths: Solvency regulation, auto insurance market, few rating restrictions
Weaknesses: Home insurance market, little regulatory mod-ernization
OREGON
2013 Grade 2014 Grade
C B
Score Rank
65.1 19
Strengths:
Solvency regulation, low politicization, auto insurance market, home insurance market,
workers’ comp market, rate freedom, few rat-ing restrictions
Weaknesses: Consumer protection
R STREET POLICY STUDY: 2014 2014 INSURANCE REGULATION REPORT CARD 30

PENNSYLVANIA
2013 Grade 2014 Grade
B B-
Score Rank
62.9 25
Strengths: Low politicization, auto insurance market, home insurance market, workers’ comp market
Weaknesses: Solvency regulation
RHODE ISLAND
2013 Grade 2014 Grade
C B
Score Rank
63.9 24
Strengths:Low politicization, fiscal efficiency, auto insur-ance markets, home insurance market, few rat-
ing restrictions, regulatory modernization
Weaknesses: Antifraud
SOUTH CAROLINA
2013 Grade 2014 Grade
A C+
Score Rank
59.6 32
Strengths:Low politicization, auto insurance market,
home insurance market, workers’ comp market, regulatory clarity, few rating restrictions
Weaknesses: Solvency regulation, fraud, little regulatory modernization
SOUTH DAKOTA
2013 Grade 2014 Grade
B C+
Score Rank
60.9 29
Strengths:Antifraud, low politicization, auto insurance
market, home insurance market, workers’ comp market
Weaknesses: Solvency regulation, little regulatory modern-ization
TENNESSEE
2013 Grade 2014 Grade
A B
Score Rank
64.4 22
Strengths:Solvency regulation, low politicization, work-
ers’ comp market, rate freedom, few rating restrictions
Weaknesses: Fiscal efficiency
TEXAS
2013 Grade 2014 Grade
D B-
Score Rank
61.3 28
Strengths: Solvency regulation, low politicization, auto insurance market, few rating restrictions
Weaknesses: None
UTAH
2013 Grade 2014 Grade
B A-
Score Rank
69.9 6
Strengths:
Antifraud, low politicization, fiscal efficiency, auto insurance market, home insurance market,
few rating restrictions, regulatory modernization
Weaknesses: Solvency regulation, little regulatory modernization
VERMONT
2013 Grade 2014 Grade
A+ A+
Score Rank
76.9 1
Strengths:
Consumer protection, low politicization, auto insurance market, home insurance market,
workers’ comp market, rate freedom, regula-tory clarity, few rating restrictions
Weaknesses: Fiscal efficiency
R STREET POLICY STUDY: 2014 2014 INSURANCE REGULATION REPORT CARD 31

VIRGINIA
2013 Grade 2014 Grade
A+ A
Score Rank
73.9 2
Strengths:
Solvency regulation, low politicization, auto insurance market, home insurance market,
workers’ comp market, few rating restrictions, regulatory modernization
Weaknesses: None
WASHINGTON
2013 Grade 2013 Grade
D D+
Score Rank
51.3 42
Strengths: Auto insurance market, home insurance market
Weaknesses: Workers’ comp market, little regulatory mod-ernization
WEST VIRGINIA
2013 Grade 2013 Grade
D C
Score Rank
56.8 37
Strengths:Solvency regulation, antifraud, low politici-zation, home insurance market, few rating
restrictions
Weaknesses: Fiscal efficiency, little regulatory moderniza-tion
WISCONSIN
2013 Grade 2013 Grade
B+ B
Score Rank
66.3 14
Strengths:Low politicization, auto insurance market,
home insurance market, workers’ comp market, few rating restrictions
Weaknesses: Fraud
WYOMING
2013 Grade 2013 Grade
C B
Score Rank
65.3 17
Strengths:
Solvency regulation, low politicization, fis-cal efficiency, auto insurance market, home insurance market, rate freedom, few rating
restrictions
Weaknesses: Workers’ comp market
In conclusion, we are hopeful that R Street’s third annual insurance regulation report card proves helpful and infor-mative for consumers, lawmakers, regulators, the insurance industry, and the general public. We welcome comments and constructive criticism as look forward to steadily improve the report next year and in the years ahead.
R STREET POLICY STUDY: 2014 2014 INSURANCE REGULATION REPORT CARD 32

TABLE 12: 50 STATES RANKED BY TOTAL SCORE
State Solv Fraud Cons Polit Fisc Auto Home WC Rate Clar Rest Mod Total Grade
VT 4.3 3.3 6.3 7.5 3.3 9.7 10 5.7 7.5 7.5 7.5 4.3 76.9 A+
VA 5.4 5.0 5.0 7.5 5.0 8.5 8 6.5 6.3 3.8 7.5 5.4 73.9 A
IL 4.3 2.0 3.8 7.5 10.0 5.4 5 7.4 10 7.5 7.5 2.1 72.5 A
IA 4.3 5.0 3.8 7.5 8.3 8.5 6.7 7.3 3.8 3.8 7.5 5.4 71.9 A
ME 5.4 2.8 6.3 7.5 6.7 10 10 2.6 5 3.8 7.5 3.2 70.8 A-
UT 2.1 6.0 5.0 7.5 8.3 10 8.3 3 6.3 3.8 7.5 2.1 69.9 A-
OH 4.3 4.0 5.0 7.5 6.7 8.5 8 0 7.5 7.5 7.5 3.2 69.7 A-
KY 6.4 5.0 5.0 7.5 5.0 6.9 6.7 5.1 6.3 3.8 7.5 4.3 69.5 A-
ID 5.4 7.0 6.3 7.5 3.3 8.5 8.3 2.7 5 3.8 7.5 2.1 67.4 B+
NJ 3.2 7.5 5.0 7.5 5.0 8.5 10 6 3.8 3.8 5 2.1 67.4 B+
MN 3.2 6.3 3.8 7.5 6.7 6.6 6.7 6.4 5 3.8 7.5 3.2 66.7 B
IN 2.1 4.0 0.0 7.5 6.7 8.5 6.7 7.4 5 3.8 7.5 7.5 66.7 B
NE 4.3 4.8 3.8 7.5 8.3 8.5 5 6.8 5 3.8 7.5 1.1 66.4 B
WI 4.3 1.3 3.8 7.5 5.0 8.5 8.3 6.8 6.3 3.8 7.5 3.2 66.3 B
CO 5.4 5.0 5.0 7.5 8.3 8.5 6.7 2.7 3.8 3.8 5 4.3 66.0 B
NV 7.5 5.0 5.0 7.5 3.3 8.5 8.3 5.8 3.8 3.8 7.5 0 66.0 B
WY 6.4 2.5 5.0 7.5 8.3 6.9 6.7 0 7.5 3.8 7.5 3.2 65.3 B
KS 4.3 4.5 5.0 2.5 6.7 8.5 6.7 6.5 3.8 3.8 7.5 5.4 65.2 B
OR 6.4 3.8 5.0 7.5 8.3 8.5 6.7 1.7 3.8 3.8 7.5 2.1 65.1 B
AZ 3.2 4.8 2.5 7.5 3.3 8.5 8.3 5.8 6.3 3.8 7.5 3.2 64.7 B
MO 2.1 4.0 3.8 7.5 6.7 6.6 6.7 5.4 7.5 3.8 5 5.4 64.5 B
TN 6.4 4.5 3.8 7.5 1.7 6.6 3.3 7.5 7.5 3.8 7.5 4.3 64.4 B
NM 6.4 5.0 3.8 7.5 1.7 6.9 6.3 5.8 5 3.8 7.5 4.3 64.0 B
RI 3.2 2.0 5.0 7.5 6.7 7.8 7.3 2.7 5 3.8 7.5 5.4 63.9 B
PA 2.1 4.8 2.5 7.5 5.0 8.5 8.3 7.2 5 3.8 5 3.2 62.9 B-
NH 0.0 7.0 5.0 7.5 5.0 9.7 10 5.7 5 0 5 2.1 62.0 B-
CT 4.3 5.0 3.8 5.0 10.0 10 10 5.8 2.5 0 5 0 61.4 B-
TX 5.4 4.8 3.8 7.5 5.0 8.2 5 3.3 3.8 3.8 7.5 3.2 61.3 B-
SD 2.1 7.5 3.8 7.5 3.3 8.5 6.7 6.6 5 3.8 5 1.1 60.9 C+
AL 4.3 5.0 5.0 7.5 5.0 6.9 4.7 6.6 2.5 0 7.5 5.4 60.4 C+
AK 4.3 6.3 6.3 7.5 5.0 3.8 3.3 4.9 5 3.8 7.5 2.1 59.8 C+
SC 1.1 1.3 2.5 7.5 3.3 6.9 8 6.6 6.3 7.5 7.5 1.1 59.6 C+
ND 3.2 6.3 7.5 2.5 6.7 10 6.7 0 3.8 3.8 7.5 1.1 59.1 C+
AR 2.1 6.0 5.0 7.5 3.3 6.9 6.7 6.5 5 0 7.5 2.1 58.6 C
MD 5.4 4.5 5.0 7.5 6.7 4.8 6.7 5.3 6.3 0 2.5 3.2 57.9 C
GA 5.4 3.5 5.0 2.5 5.0 6.9 4.7 7.4 5 0 7.5 4.3 57.2 C
WV 5.4 7.0 5.0 7.5 0.0 5.4 6.7 3.6 3.8 3.8 7.5 1.1 56.8 C
OK 5.4 5.0 2.5 2.5 3.3 8.5 3.3 5.1 6.3 3.8 7.5 2.1 55.3 C
DE 3.2 6.5 5.0 2.5 6.7 5.4 6.7 6 5 0 7.5 0 54.5 C-
FL 4.3 6.3 5.0 2.5 10.0 6.9 1.3 6.7 0 0 5 4.3 52.3 D+
MS 5.4 3.8 5.0 2.5 3.3 6.9 6 6.6 3.8 0 7.5 1.1 51.9 D+
WA 4.3 5.0 3.8 2.5 5.0 10 8.3 0 2.5 3.8 5 1.1 51.3 D+
LA 4.3 5.0 5.0 0.0 1.7 3.8 3.7 5.3 3.8 7.5 7.5 3.2 50.8 D
MI 3.2 0.0 3.8 5.0 10.0 0 8 6.8 3.8 3.8 5 1.1 50.5 D
MA 4.3 3.8 3.8 7.5 1.7 6.3 7.7 5.6 3.8 0 2.5 2.1 49.1 D
NY 4.3 5.0 2.5 7.5 0.0 5.1 8 3.9 2.5 0 7.5 2.1 48.4 D
HI 5.4 5.0 3.8 5.0 6.7 3.5 0 5.3 3.8 3.8 2.5 3.2 48.0 D
MT 2.1 7.0 5.0 2.5 0.0 6.9 6.7 2.7 5 3.8 5 0 46.7 D-
NC 1.1 5.0 0.0 2.5 5.0 2.6 6.3 7.5 1.3 7.5 5 1.1 44.9 F
CA 4.3 6.3 3.8 0.0 6.7 9.7 5.7 6.4 1.3 0 0 0 44.2 F
R STREET POLICY STUDY: 2014 2014 INSURANCE REGULATION REPORT CARD 33

ABOUT THE AUTHOR
R.J. Lehmann is senior fellow, editor-in-chief and co-founder of the R Street Institute. He is author of the R Street policy papers: “Gov-ernment sources of systemic insurable risk,” “The value of conser-vation compliance to hunters and anglers,” “Reforming Michigan’s auto insurance market,” “Medical cost containment in the Wisconsin workers’ compensation market” and the 2012 and 2013 editions of R Street’s Insurance Regulation Report Card. He is also author of the James Madison Institute’s “Ten reforms to fix Florida’s property insurance marketplace — without raising rates” and co-author of the John Locke Foundation’s “Spotlight on NC’s auto insurance system: Seven things to understand.”
Prior to joining R Street, he was an award-winning business journal-ist who spent nine years covering the insurance, banking and securi-ties industries. He served as deputy director of the Heartland Insti-tute’s Center on Finance, Insurance and Real Estate. He previously was senior industry editor with SNL Financial, leading the news ser-vice’s coverage of the Dodd-Frank Act, the Patient Protection and Affordable Care Act and legislative and regulatory developments at both the state and federal level. Prior to that, he spent six years with the A.M. Best Co. as manager of their Washington bureau.
He is a three-time award winner from the American Society of Business Publication Editors and was the youngest-ever winner of a first place prize from the New Jersey Press Association. He also is the former public affairs director of the Independent Institute in Oakland, Calif., and the former state chapters coordinator of the Republican Liberty Caucus.
His writings have appeared in the San Francisco Chronicle, Wall Street Journal, Roll Call, CQ, The Hill, Townhall.com, American Spec-tator, Orlando Sentinel, Travel Weekly and Folio magazine, among other publications.
R STREET POLICY STUDY: 2014 2014 INSURANCE REGULATION REPORT CARD 34