Key Highlights from the SGS Malaysia Client Info Day April 2014
1
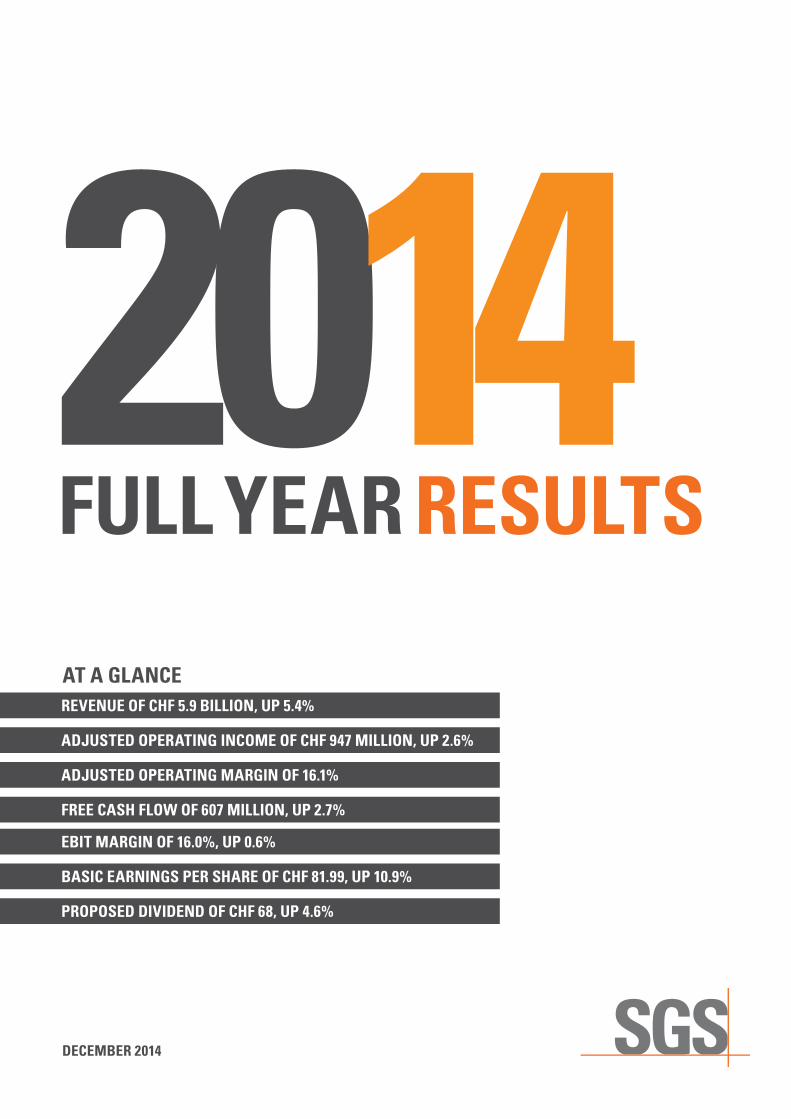
DECEMBER 2014
2014FULL YEAR RESULTS
REVENUE OF CHF 5.9 BILLION, UP 5.4%
ADJUSTED OPERATING INCOME OF CHF 947 MILLION, UP 2.6%
ADJUSTED OPERATING MARGIN OF 16.1%
FREE CASH FLOW OF 607 MILLION, UP 2.7%
BASIC EARNINGS PER SHARE OF CHF 81.99, UP 10.9%
PROPOSED DIVIDEND OF CHF 68, UP 4.6%
AT A GLANCE
EBIT MARGIN OF 16.0%, UP 0.6%
2
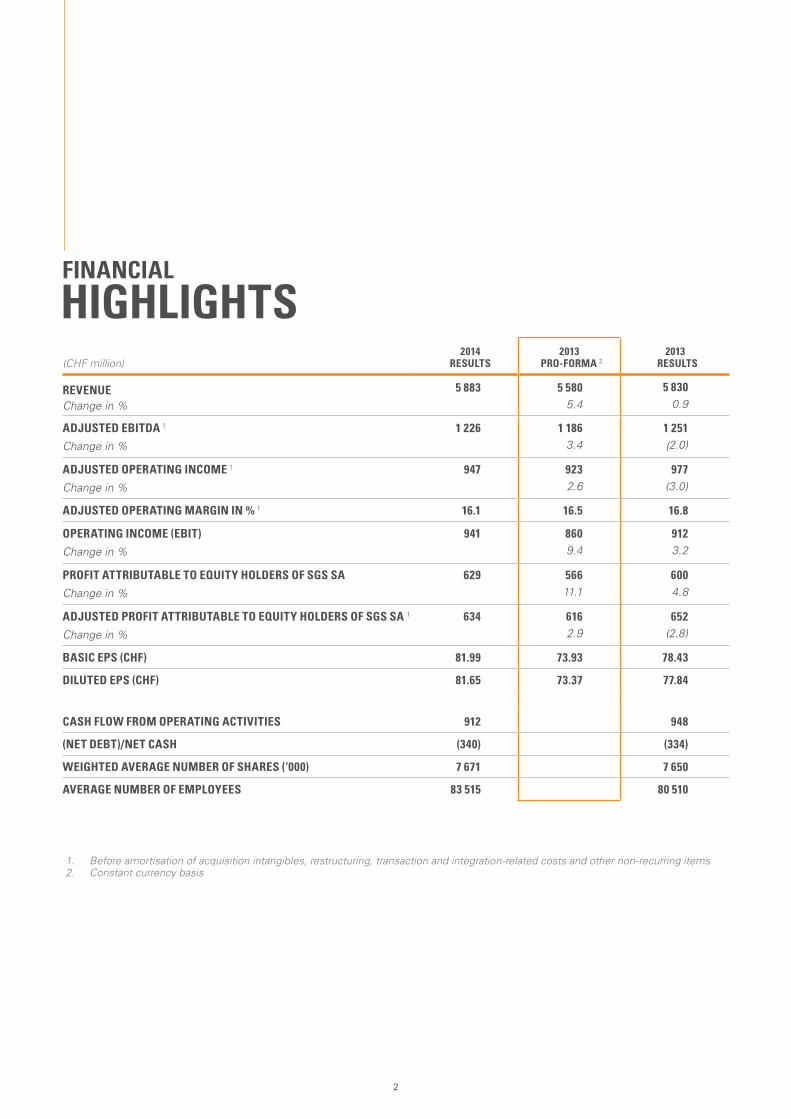
FINANCIAL
HIGHLIGHTS(CHF million)
2014 RESULTS
2013 PRO-FORMA 2
2013 RESULTS
REVENUE Change in %
5 883 5 580 5.4
5 830 0.9
ADJUSTED EBITDA 1 Change in %
1 226 1 186 3.4
1 251 (2.0)
ADJUSTED OPERATING INCOME 1 Change in %
947 923 2.6
977 (3.0)
ADJUSTED OPERATING MARGIN IN % 1 16.1 16.5 16.8
OPERATING INCOME (EBIT) Change in %
941 860 9.4
912 3.2
PROFIT ATTRIBUTABLE TO EQUITY HOLDERS OF SGS SA Change in %
629 566 11.1
600 4.8
ADJUSTED PROFIT ATTRIBUTABLE TO EQUITY HOLDERS OF SGS SA 1 Change in %
634 616 2.9
652 (2.8)
BASIC EPS (CHF) 81.99 73.93 78.43
DILUTED EPS (CHF) 81.65 73.37 77.84
CASH FLOW FROM OPERATING ACTIVITIES 912 948
(NET DEBT)/NET CASH (340) (334)
WEIGHTED AVERAGE NUMBER OF SHARES (‘000) 7 671 7 650
AVERAGE NUMBER OF EMPLOYEES 83 515 80 510
1. Before amortisation of acquisition intangibles, restructuring, transaction and integration-related costs and other non-recurring items2. Constant currency basis
3
OVERVIEW
The SGS Group finished 2014 strongly delivering revenue growth of 5.4% over prior year (constant currency basis) to CHF 5.9 billion, supported by solid organic revenue growth of 4.0% and an additional 1.4% contributed by recently acquired companies. Due to the continued appreciation of the Swiss Franc against most currencies in which SGS operates around the world, Group revenue for the year increased 0.9% on a reported basis.
Organic revenue growth exhibited resilience during the year with Oil, Gas & Chemicals Services, Agricultural Services, Consumer Testing Services, and Systems & Services Certification Services producing high single-digit growth. The downturn in the global mining industry continued to impact Minerals Services and to a lesser extent, Environmental Services. Organic growth was achieved across all regions, despite the difficult market conditions experienced in Europe.
Acquisitions added 1.4% to Group revenue in 2014 including three new companies acquired in Automotive Services, three in Environmental Services, three in Consumer Testing Services and one in Industrial Services.
The Group reported an adjusted EBITDA of CHF 1,226 million, up 3.4% (constant currency basis) over prior year and an adjusted operating income of CHF 947 million, up 2.6% (constant currency basis) over prior year and resulting in a solid margin of 16.1%. This margin is slightly below prior year mainly due to the slowdown in Minerals Services. In response to the prolonged downturn in the mining sector worldwide, restructuring measures were taken resulting in one-off expenses of CHF 11 million, while restructuring carried out in 2013 produced a positive effect, mainly in Industrial Services. EBIT reached CHF 941 million and represented an operating income margin of 16.0% versus 15.4% last year (constant currency basis).
SGS and the Republic of Paraguay have amicably settled a long standing dispute associated with unpaid inspection services provided in the late nineties. As a consequence of this settlement, SGS received a payment which contributed a net amount of CHF 32 million (0.5% to the operating income margin).
Net financial expenses for the year remained stable at CHF 41 million. The overall effective tax rate for the period was 26.0%, slightly below prior year.
Profit Attributable to Equity Holders reached CHF 629 million for the period, up 11.1% over prior year on a constant currency basis.
Operating cash flows remained very strong at CHF 912 million for the year, below the CHF 948 million in prior year, and corresponding to 15.5% of Group revenue versus 16.3% in prior year. This inflow was used primarily to fund net investments in fixed assets of CHF 292 million. The decrease in operating cash flow mainly relates to increased working capital requirements resulting from project related activities.
The Group paid a total cash consideration of CHF 108 million for acquisitions completed during the year, in addition to a dividend of CHF 499 million leading to a Group net debt position at 31 December 2014 of CHF 340 million compared to CHF 334 million in December 2013.
ACQUISITIONS
During the year the Group completed ten acquisitions, adding CHF 36 million to revenue and CHF 7 million to the Operating Income. On an annualised basis, these acquisitions amount to CHF 79 million in revenue and CHF 15 million in operating income.
The Group continued to focus on small to medium size companies to expand into new markets and create a more diverse service offering. In North America, the Group acquired three companies, two in Automotive Services and one in Environmental Services. In Europe, six companies were acquired across Industrial Services, Environmental Services, Consumer Testing Services and Automotive Services and finally, one new company in Japan for Consumer Testing Services.
DISTRIBUTION TO SHAREHOLDERS
The SGS Board of Directors will recommend to the Annual General Meeting, to be held on 12 March 2015, the approval of a dividend of CHF 68 per share. This proposed dividend represents a 4.6% increase in distribution in comparison to the dividend approved in March 2014.
MANAGEMENT
Carla De Geyseleer joined SGS as the new Chief Financial Officer in November 2014, taking over from Geraldine Matchett.
SIGNIFICANT SHAREHOLDERS
As at 31 December 2014, Serena Sàrl held 15.00% (2013: 15.00%), Mr. August von Finck and members of his family acting in concert held 14.97% (2013: 14.97%), the Bank of New York Mellon Corporation held 3.43% (2013: 3.18%) and BlackRock Inc. held 3.0% (2013: nil) of the share capital and voting rights of the Company.
At the same date, SGS Group held 1.88% of the share capital of the Company (2013: 2.19%).
OUTLOOK
Notwithstanding the recent strengthening of the Swiss Franc, SGS intends to continue its strategy of profitable growth.
Excluding the potential negative impact of continuing low pricing levels for oil and of reduced fisheries activities in Latin America, the Group intends to grow its top line between 4% to 6% on a currency equivalent basis. Margins are expected to hold at 2014 levels.
While it is difficult to set exact expectations for the Swiss Franc against our main trading currencies for 2015, we have simulated our 2014 results on the assumption that January 15, 2015 forex closing rates1 applied to the whole of 2014. The result is a reduction of approximately CHF 600 million in 2014 reported revenues (down to approximately CHF 5.3 billion) and of approximately CHF 100 million in Adjusted Operating Income (down to approximately CHF 850 million).
Furthermore, SGS has limited cost exposure to the Swiss Franc and would not expect the recent forex moves to have other material impact on its earnings.
21 January 2015
Sergio Marchionne Chairman of the Board
Christopher Kirk Chief Executive Officer
1. EUR at 1.0289, USD at 0.8791, CNY at 0.1421, AUD at 0.7270 and CAD at 0.7429
4
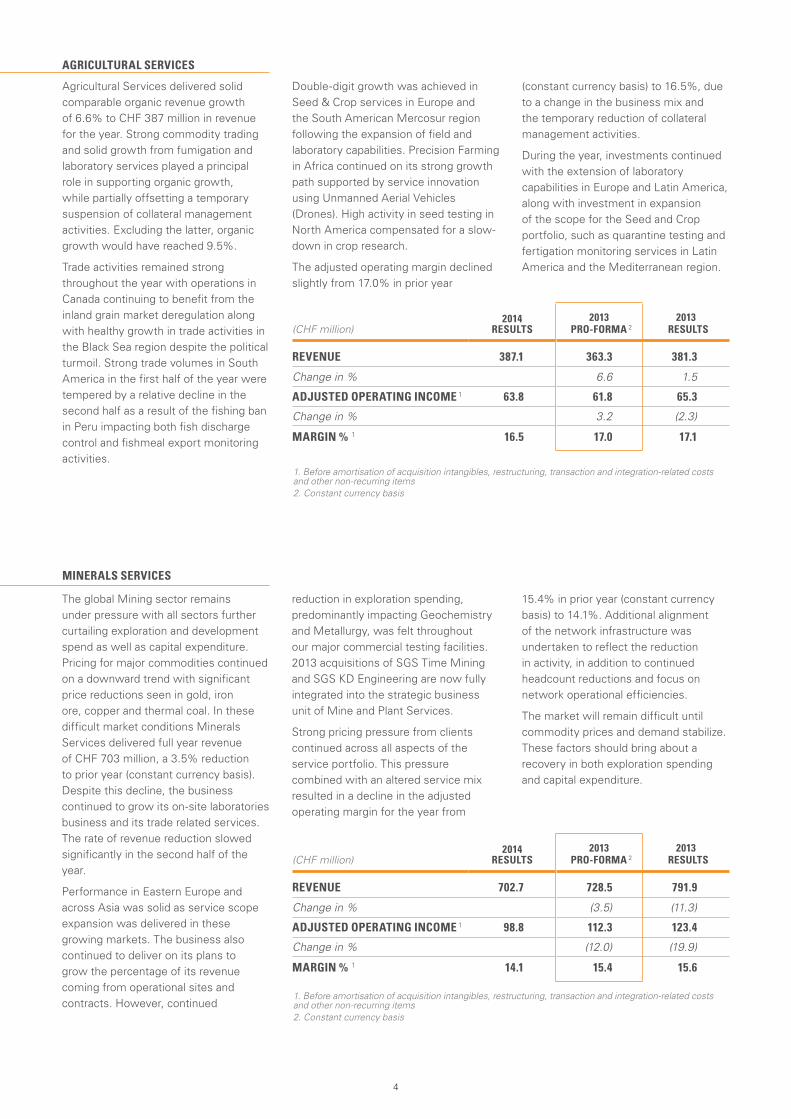
Agricultural Services delivered solid comparable organic revenue growth of 6.6% to CHF 387 million in revenue for the year. Strong commodity trading and solid growth from fumigation and laboratory services played a principal role in supporting organic growth, while partially offsetting a temporary suspension of collateral management activities. Excluding the latter, organic growth would have reached 9.5%.
Trade activities remained strong throughout the year with operations in Canada continuing to benefit from the inland grain market deregulation along with healthy growth in trade activities in the Black Sea region despite the political turmoil. Strong trade volumes in South America in the first half of the year were tempered by a relative decline in the second half as a result of the fishing ban in Peru impacting both fish discharge control and fishmeal export monitoring activities.
Double-digit growth was achieved in Seed & Crop services in Europe and the South American Mercosur region following the expansion of field and laboratory capabilities. Precision Farming in Africa continued on its strong growth path supported by service innovation using Unmanned Aerial Vehicles (Drones). High activity in seed testing in North America compensated for a slow-down in crop research.
The adjusted operating margin declined slightly from 17.0% in prior year
(constant currency basis) to 16.5%, due to a change in the business mix and the temporary reduction of collateral management activities.
During the year, investments continued with the extension of laboratory capabilities in Europe and Latin America, along with investment in expansion of the scope for the Seed and Crop portfolio, such as quarantine testing and fertigation monitoring services in Latin America and the Mediterranean region.
AGRICULTURAL SERVICES
MINERALS SERVICES
The global Mining sector remains under pressure with all sectors further curtailing exploration and development spend as well as capital expenditure. Pricing for major commodities continued on a downward trend with significant price reductions seen in gold, iron ore, copper and thermal coal. In these difficult market conditions Minerals Services delivered full year revenue of CHF 703 million, a 3.5% reduction to prior year (constant currency basis). Despite this decline, the business continued to grow its on-site laboratories business and its trade related services. The rate of revenue reduction slowed significantly in the second half of the year.
Performance in Eastern Europe and across Asia was solid as service scope expansion was delivered in these growing markets. The business also continued to deliver on its plans to grow the percentage of its revenue coming from operational sites and contracts. However, continued
reduction in exploration spending, predominantly impacting Geochemistry and Metallurgy, was felt throughout our major commercial testing facilities. 2013 acquisitions of SGS Time Mining and SGS KD Engineering are now fully integrated into the strategic business unit of Mine and Plant Services.
Strong pricing pressure from clients continued across all aspects of the service portfolio. This pressure combined with an altered service mix resulted in a decline in the adjusted operating margin for the year from
15.4% in prior year (constant currency basis) to 14.1%. Additional alignment of the network infrastructure was undertaken to reflect the reduction in activity, in addition to continued headcount reductions and focus on network operational efficiencies.
The market will remain difficult until commodity prices and demand stabilize. These factors should bring about a recovery in both exploration spending and capital expenditure.
1. Before amortisation of acquisition intangibles, restructuring, transaction and integration-related costs and other non-recurring items2. Constant currency basis
(CHF million)2014
RESULTS2013
PRO-FORMA 2 2013
RESULTS
REVENUE 387.1 363.3 381.3
Change in % 6.6 1.5
ADJUSTED OPERATING INCOME 1 63.8 61.8 65.3
Change in % 3.2 (2.3)
MARGIN % 1 16.5 17.0 17.1
1. Before amortisation of acquisition intangibles, restructuring, transaction and integration-related costs and other non-recurring items2. Constant currency basis
(CHF million)2014
RESULTS2013
PRO-FORMA 2 2013
RESULTS
REVENUE 702.7 728.5 791.9
Change in % (3.5) (11.3)
ADJUSTED OPERATING INCOME 1 98.8 112.3 123.4
Change in % (12.0) (19.9)
MARGIN % 1 14.1 15.4 15.6
5
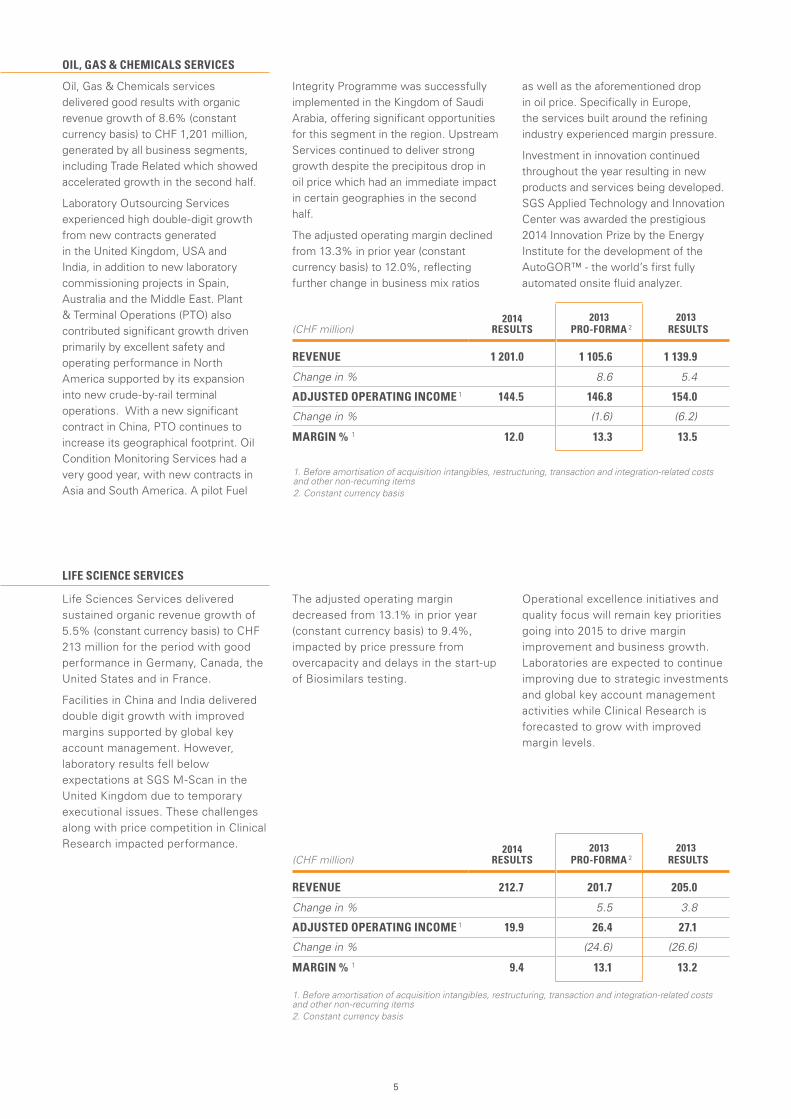
Oil, Gas & Chemicals services delivered good results with organic revenue growth of 8.6% (constant currency basis) to CHF 1,201 million, generated by all business segments, including Trade Related which showed accelerated growth in the second half.
Laboratory Outsourcing Services experienced high double-digit growth from new contracts generated in the United Kingdom, USA and India, in addition to new laboratory commissioning projects in Spain, Australia and the Middle East. Plant & Terminal Operations (PTO) also contributed significant growth driven primarily by excellent safety and operating performance in North America supported by its expansion into new crude-by-rail terminal operations. With a new significant contract in China, PTO continues to increase its geographical footprint. Oil Condition Monitoring Services had a very good year, with new contracts in Asia and South America. A pilot Fuel
Integrity Programme was successfully implemented in the Kingdom of Saudi Arabia, offering significant opportunities for this segment in the region. Upstream Services continued to deliver strong growth despite the precipitous drop in oil price which had an immediate impact in certain geographies in the second half.
The adjusted operating margin declined from 13.3% in prior year (constant currency basis) to 12.0%, reflecting further change in business mix ratios
as well as the aforementioned drop in oil price. Specifically in Europe, the services built around the refining industry experienced margin pressure.
Investment in innovation continued throughout the year resulting in new products and services being developed. SGS Applied Technology and Innovation Center was awarded the prestigious 2014 Innovation Prize by the Energy Institute for the development of the AutoGOR™ - the world’s first fully automated onsite fluid analyzer.
OIL, GAS & CHEMICALS SERVICES
Life Sciences Services delivered sustained organic revenue growth of 5.5% (constant currency basis) to CHF 213 million for the period with good performance in Germany, Canada, the United States and in France.
Facilities in China and India delivered double digit growth with improved margins supported by global key account management. However, laboratory results fell below expectations at SGS M-Scan in the United Kingdom due to temporary executional issues. These challenges along with price competition in Clinical Research impacted performance.
The adjusted operating margin decreased from 13.1% in prior year (constant currency basis) to 9.4%, impacted by price pressure from overcapacity and delays in the start-up of Biosimilars testing.
Operational excellence initiatives and quality focus will remain key priorities going into 2015 to drive margin improvement and business growth. Laboratories are expected to continue improving due to strategic investments and global key account management activities while Clinical Research is forecasted to grow with improved margin levels.
LIFE SCIENCE SERVICES
1. Before amortisation of acquisition intangibles, restructuring, transaction and integration-related costs and other non-recurring items2. Constant currency basis
1. Before amortisation of acquisition intangibles, restructuring, transaction and integration-related costs and other non-recurring items2. Constant currency basis
(CHF million)2014
RESULTS2013
PRO-FORMA 2 2013
RESULTS
REVENUE 212.7 201.7 205.0
Change in % 5.5 3.8
ADJUSTED OPERATING INCOME 1 19.9 26.4 27.1
Change in % (24.6) (26.6)
MARGIN % 1 9.4 13.1 13.2
(CHF million)2014
RESULTS2013
PRO-FORMA 22013
RESULTS
REVENUE 1 201.0 1 105.6 1 139.9
Change in % 8.6 5.4
ADJUSTED OPERATING INCOME 1 144.5 146.8 154.0
Change in % (1.6) (6.2)
MARGIN % 1 12.0 13.3 13.5
6
CONSUMER TESTING SERVICES
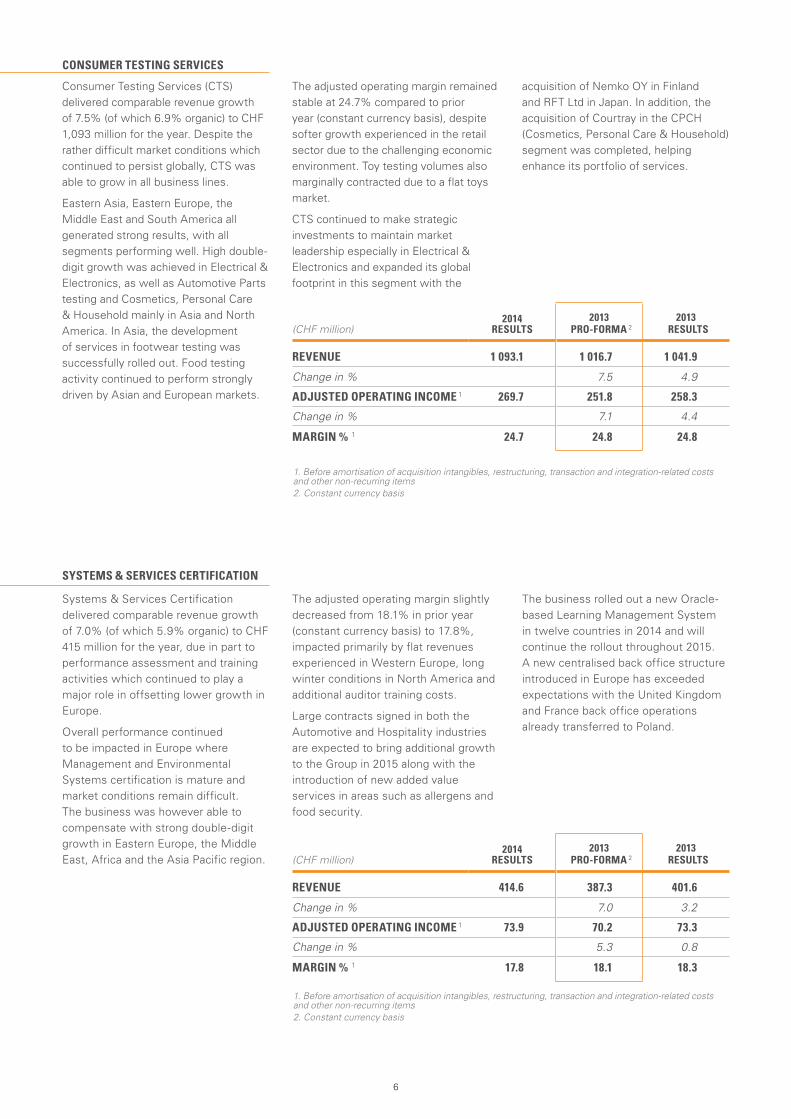
Consumer Testing Services (CTS) delivered comparable revenue growth of 7.5% (of which 6.9% organic) to CHF 1,093 million for the year. Despite the rather difficult market conditions which continued to persist globally, CTS was able to grow in all business lines.
Eastern Asia, Eastern Europe, the Middle East and South America all generated strong results, with all segments performing well. High double-digit growth was achieved in Electrical & Electronics, as well as Automotive Parts testing and Cosmetics, Personal Care & Household mainly in Asia and North America. In Asia, the development of services in footwear testing was successfully rolled out. Food testing activity continued to perform strongly driven by Asian and European markets.
The adjusted operating margin remained stable at 24.7% compared to prior year (constant currency basis), despite softer growth experienced in the retail sector due to the challenging economic environment. Toy testing volumes also marginally contracted due to a flat toys market.
CTS continued to make strategic investments to maintain market leadership especially in Electrical & Electronics and expanded its global footprint in this segment with the
acquisition of Nemko OY in Finland and RFT Ltd in Japan. In addition, the acquisition of Courtray in the CPCH (Cosmetics, Personal Care & Household) segment was completed, helping enhance its portfolio of services.
Systems & Services Certification delivered comparable revenue growth of 7.0% (of which 5.9% organic) to CHF 415 million for the year, due in part to performance assessment and training activities which continued to play a major role in offsetting lower growth in Europe.
Overall performance continued to be impacted in Europe where Management and Environmental Systems certification is mature and market conditions remain difficult. The business was however able to compensate with strong double-digit growth in Eastern Europe, the Middle East, Africa and the Asia Pacific region.
The adjusted operating margin slightly decreased from 18.1% in prior year (constant currency basis) to 17.8%, impacted primarily by flat revenues experienced in Western Europe, long winter conditions in North America and additional auditor training costs.
Large contracts signed in both the Automotive and Hospitality industries are expected to bring additional growth to the Group in 2015 along with the introduction of new added value services in areas such as allergens and food security.
The business rolled out a new Oracle-based Learning Management System in twelve countries in 2014 and will continue the rollout throughout 2015. A new centralised back office structure introduced in Europe has exceeded expectations with the United Kingdom and France back office operations already transferred to Poland.
SYSTEMS & SERVICES CERTIFICATION
1. Before amortisation of acquisition intangibles, restructuring, transaction and integration-related costs and other non-recurring items2. Constant currency basis
1. Before amortisation of acquisition intangibles, restructuring, transaction and integration-related costs and other non-recurring items2. Constant currency basis
(CHF million)2014
RESULTS2013
PRO-FORMA 22013
RESULTS
REVENUE 414.6 387.3 401.6
Change in % 7.0 3.2
ADJUSTED OPERATING INCOME 1 73.9 70.2 73.3
Change in % 5.3 0.8
MARGIN % 1 17.8 18.1 18.3
(CHF million)2014
RESULTS2013
PRO-FORMA 2 2013
RESULTS
REVENUE 1 093.1 1 016.7 1 041.9
Change in % 7.5 4.9
ADJUSTED OPERATING INCOME 1 269.7 251.8 258.3
Change in % 7.1 4.4
MARGIN % 1 24.7 24.8 24.8
7
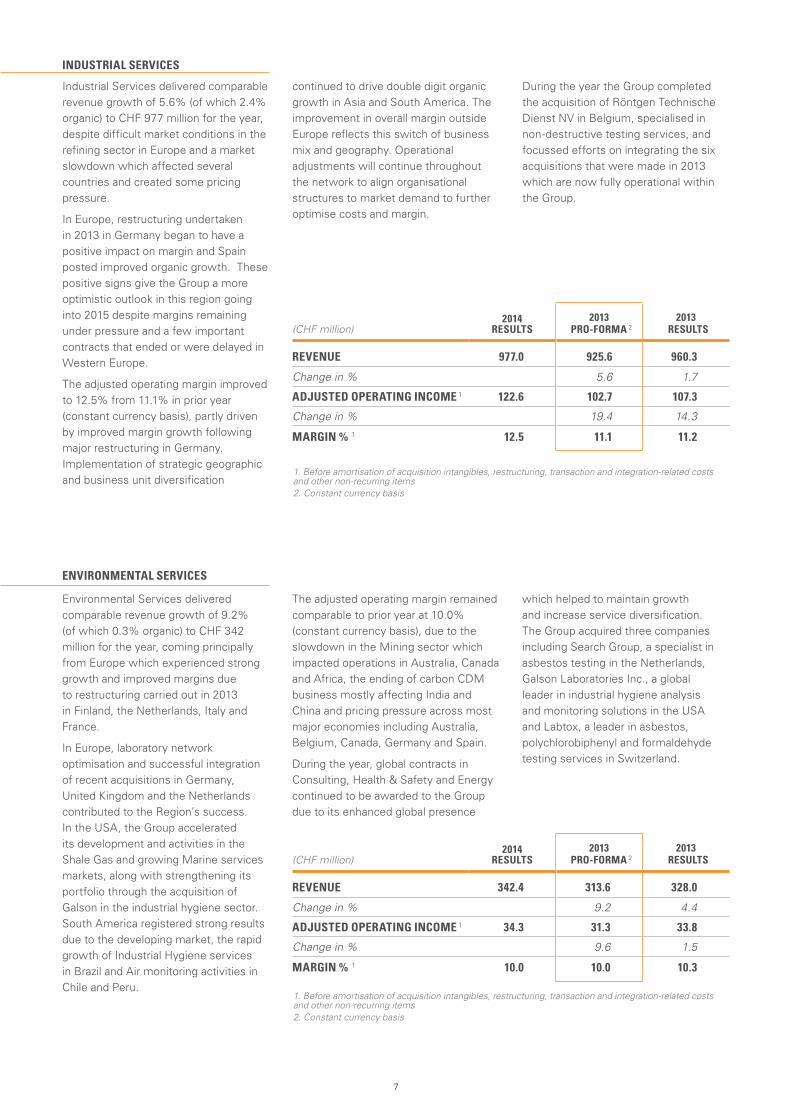
Industrial Services delivered comparable revenue growth of 5.6% (of which 2.4% organic) to CHF 977 million for the year, despite difficult market conditions in the refining sector in Europe and a market slowdown which affected several countries and created some pricing pressure.
In Europe, restructuring undertaken in 2013 in Germany began to have a positive impact on margin and Spain posted improved organic growth. These positive signs give the Group a more optimistic outlook in this region going into 2015 despite margins remaining under pressure and a few important contracts that ended or were delayed in Western Europe.
The adjusted operating margin improved to 12.5% from 11.1% in prior year (constant currency basis), partly driven by improved margin growth following major restructuring in Germany. Implementation of strategic geographic and business unit diversification
continued to drive double digit organic growth in Asia and South America. The improvement in overall margin outside Europe reflects this switch of business mix and geography. Operational adjustments will continue throughout the network to align organisational structures to market demand to further optimise costs and margin.
During the year the Group completed the acquisition of Röntgen Technische Dienst NV in Belgium, specialised in non-destructive testing services, and focussed efforts on integrating the six acquisitions that were made in 2013 which are now fully operational within the Group.
INDUSTRIAL SERVICES
ENVIRONMENTAL SERVICES
Environmental Services delivered comparable revenue growth of 9.2% (of which 0.3% organic) to CHF 342 million for the year, coming principally from Europe which experienced strong growth and improved margins due to restructuring carried out in 2013 in Finland, the Netherlands, Italy and France.
In Europe, laboratory network optimisation and successful integration of recent acquisitions in Germany, United Kingdom and the Netherlands contributed to the Region’s success. In the USA, the Group accelerated its development and activities in the Shale Gas and growing Marine services markets, along with strengthening its portfolio through the acquisition of Galson in the industrial hygiene sector. South America registered strong results due to the developing market, the rapid growth of Industrial Hygiene services in Brazil and Air monitoring activities in Chile and Peru.
The adjusted operating margin remained comparable to prior year at 10.0% (constant currency basis), due to the slowdown in the Mining sector which impacted operations in Australia, Canada and Africa, the ending of carbon CDM business mostly affecting India and China and pricing pressure across most major economies including Australia, Belgium, Canada, Germany and Spain.
During the year, global contracts in Consulting, Health & Safety and Energy continued to be awarded to the Group due to its enhanced global presence
which helped to maintain growth and increase service diversification. The Group acquired three companies including Search Group, a specialist in asbestos testing in the Netherlands, Galson Laboratories Inc., a global leader in industrial hygiene analysis and monitoring solutions in the USA and Labtox, a leader in asbestos, polychlorobiphenyl and formaldehyde testing services in Switzerland.
(CHF million)2014
RESULTS2013
PRO-FORMA 2 2013
RESULTS
REVENUE 342.4 313.6 328.0
Change in % 9.2 4.4
ADJUSTED OPERATING INCOME 1 34.3 31.3 33.8
Change in % 9.6 1.5
MARGIN % 1 10.0 10.0 10.3
1. Before amortisation of acquisition intangibles, restructuring, transaction and integration-related costs and other non-recurring items2. Constant currency basis
1. Before amortisation of acquisition intangibles, restructuring, transaction and integration-related costs and other non-recurring items2. Constant currency basis
(CHF million)2014
RESULTS2013
PRO-FORMA 2 2013
RESULTS
REVENUE 977.0 925.6 960.3
Change in % 5.6 1.7
ADJUSTED OPERATING INCOME 1 122.6 102.7 107.3
Change in % 19.4 14.3
MARGIN % 1 12.5 11.1 11.2
8
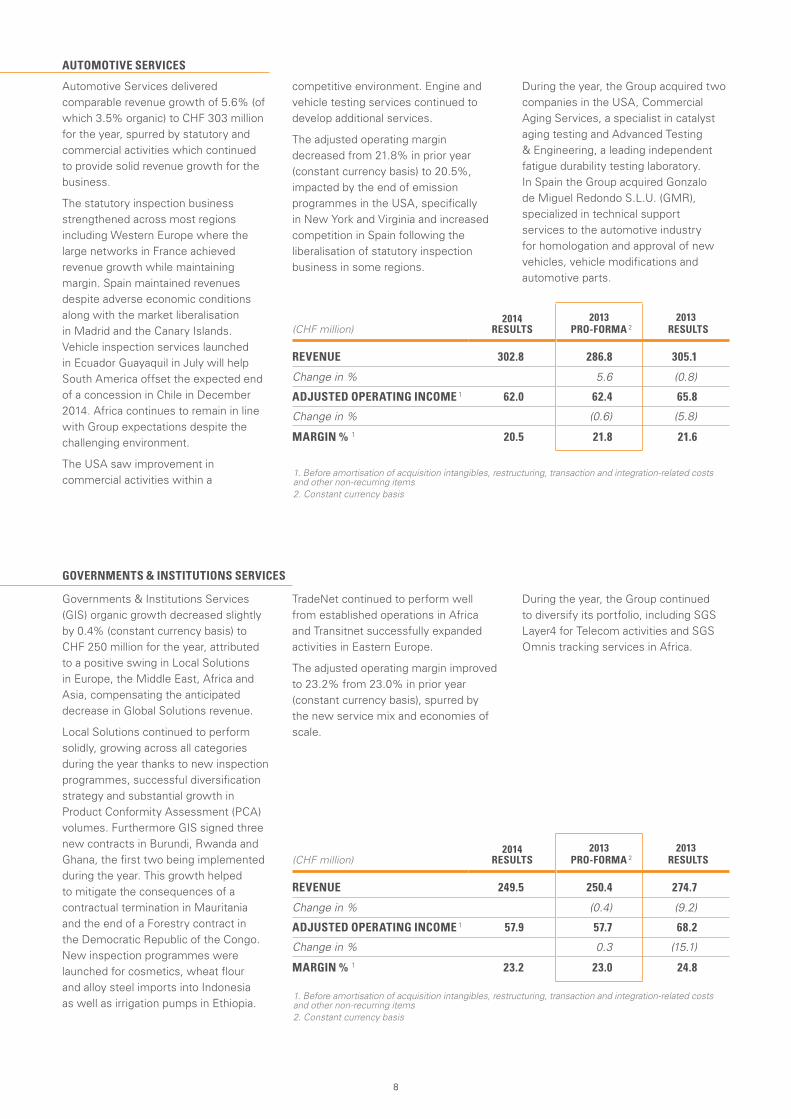
Governments & Institutions Services (GIS) organic growth decreased slightly by 0.4% (constant currency basis) to CHF 250 million for the year, attributed to a positive swing in Local Solutions in Europe, the Middle East, Africa and Asia, compensating the anticipated decrease in Global Solutions revenue.
Local Solutions continued to perform solidly, growing across all categories during the year thanks to new inspection programmes, successful diversification strategy and substantial growth in Product Conformity Assessment (PCA) volumes. Furthermore GIS signed three new contracts in Burundi, Rwanda and Ghana, the first two being implemented during the year. This growth helped to mitigate the consequences of a contractual termination in Mauritania and the end of a Forestry contract in the Democratic Republic of the Congo. New inspection programmes were launched for cosmetics, wheat flour and alloy steel imports into Indonesia as well as irrigation pumps in Ethiopia.
TradeNet continued to perform well from established operations in Africa and Transitnet successfully expanded activities in Eastern Europe.
The adjusted operating margin improved to 23.2% from 23.0% in prior year (constant currency basis), spurred by the new service mix and economies of scale.
During the year, the Group continued to diversify its portfolio, including SGS Layer4 for Telecom activities and SGS Omnis tracking services in Africa.
Automotive Services delivered comparable revenue growth of 5.6% (of which 3.5% organic) to CHF 303 million for the year, spurred by statutory and commercial activities which continued to provide solid revenue growth for the business.
The statutory inspection business strengthened across most regions including Western Europe where the large networks in France achieved revenue growth while maintaining margin. Spain maintained revenues despite adverse economic conditions along with the market liberalisation in Madrid and the Canary Islands. Vehicle inspection services launched in Ecuador Guayaquil in July will help South America offset the expected end of a concession in Chile in December 2014. Africa continues to remain in line with Group expectations despite the challenging environment.
The USA saw improvement in commercial activities within a
competitive environment. Engine and vehicle testing services continued to develop additional services.
The adjusted operating margin decreased from 21.8% in prior year (constant currency basis) to 20.5%, impacted by the end of emission programmes in the USA, specifically in New York and Virginia and increased competition in Spain following the liberalisation of statutory inspection business in some regions.
During the year, the Group acquired two companies in the USA, Commercial Aging Services, a specialist in catalyst aging testing and Advanced Testing & Engineering, a leading independent fatigue durability testing laboratory. In Spain the Group acquired Gonzalo de Miguel Redondo S.L.U. (GMR), specialized in technical support services to the automotive industry for homologation and approval of new vehicles, vehicle modifications and automotive parts.
AUTOMOTIVE SERVICES
GOVERNMENTS & INSTITUTIONS SERVICES
1. Before amortisation of acquisition intangibles, restructuring, transaction and integration-related costs and other non-recurring items2. Constant currency basis
1. Before amortisation of acquisition intangibles, restructuring, transaction and integration-related costs and other non-recurring items2. Constant currency basis
(CHF million)2014
RESULTS2013
PRO-FORMA 2 2013
RESULTS
REVENUE 249.5 250.4 274.7
Change in % (0.4) (9.2)
ADJUSTED OPERATING INCOME 1 57.9 57.7 68.2
Change in % 0.3 (15.1)
MARGIN % 1 23.2 23.0 24.8
(CHF million)2014
RESULTS2013
PRO-FORMA 2 2013
RESULTS
REVENUE 302.8 286.8 305.1
Change in % 5.6 (0.8)
ADJUSTED OPERATING INCOME 1 62.0 62.4 65.8
Change in % (0.6) (5.8)
MARGIN % 1 20.5 21.8 21.6

10
CONDENSED FINANCIAL STATEMENTSFOR THE PERIOD ENDED 31 DECEMBER 2014
(CHF million)NOTES 2014
RESULTS 2013
RESULTS
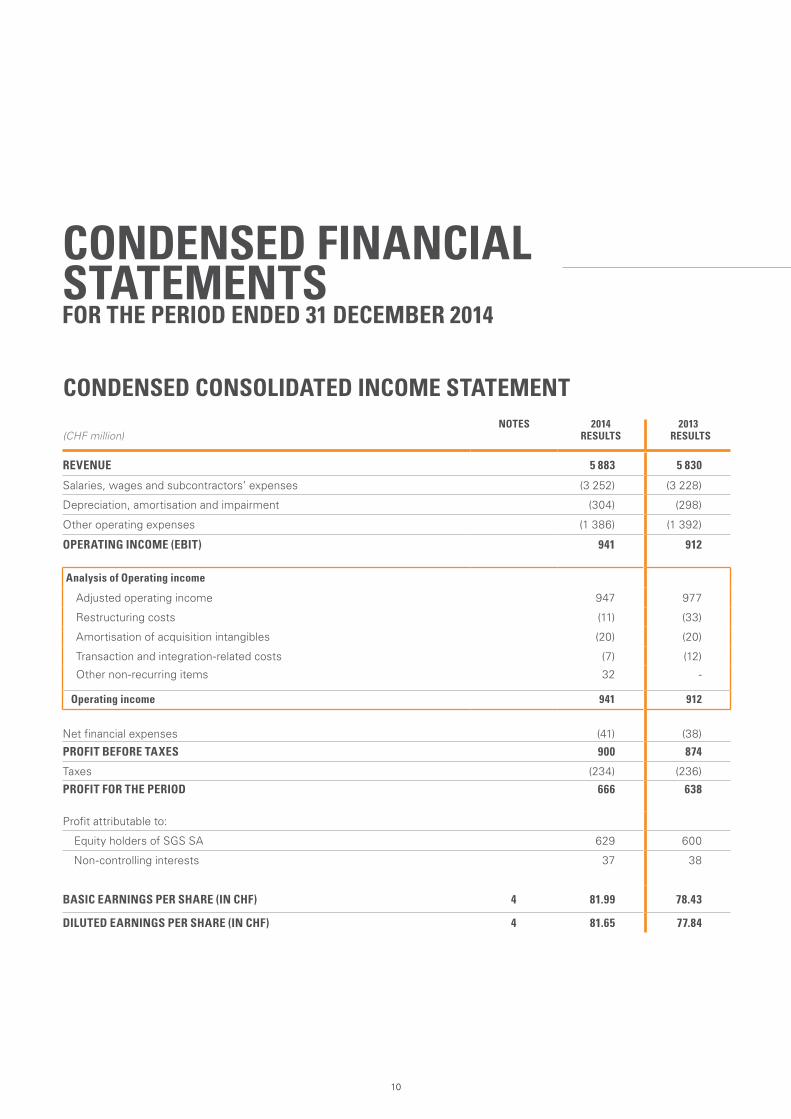
REVENUE 5 883 5 830
Salaries, wages and subcontractors’ expenses (3 252) (3 228)
Depreciation, amortisation and impairment (304) (298)
Other operating expenses (1 386) (1 392)
OPERATING INCOME (EBIT) 941 912
Analysis of Operating income
Adjusted operating income 947 977
Restructuring costs (11) (33)
Amortisation of acquisition intangibles (20) (20)
Transaction and integration-related costs (7) (12)
Other non-recurring items 32 -
Operating income 941 912
Net financial expenses (41) (38)
PROFIT BEFORE TAXES 900 874
Taxes (234) (236)
PROFIT FOR THE PERIOD 666 638
Profit attributable to:
Equity holders of SGS SA 629 600
Non-controlling interests 37 38
BASIC EARNINGS PER SHARE (IN CHF) 4 81.99 78.43
DILUTED EARNINGS PER SHARE (IN CHF) 4 81.65 77.84
CONDENSED CONSOLIDATED INCOME STATEMENT
11
CONDENSED CONSOLIDATED BALANCE SHEET (CHF million)
2014 RESULTS
2013 RESULTS
NON-CURRENT ASSETS
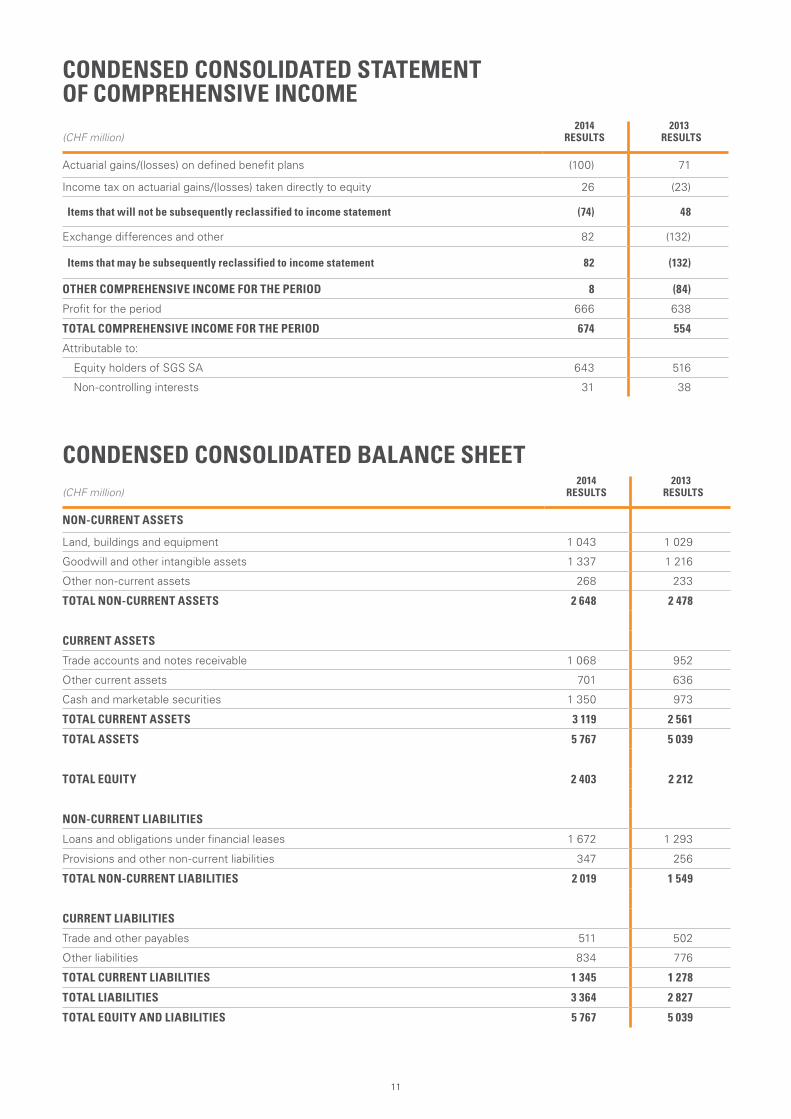
Land, buildings and equipment 1 043 1 029
Goodwill and other intangible assets 1 337 1 216
Other non-current assets 268 233
TOTAL NON-CURRENT ASSETS 2 648 2 478
CURRENT ASSETS
Trade accounts and notes receivable 1 068 952
Other current assets 701 636
Cash and marketable securities 1 350 973
TOTAL CURRENT ASSETS 3 119 2 561
TOTAL ASSETS 5 767 5 039
TOTAL EQUITY 2 403 2 212
NON-CURRENT LIABILITIES
Loans and obligations under financial leases 1 672 1 293
Provisions and other non-current liabilities 347 256
TOTAL NON-CURRENT LIABILITIES 2 019 1 549
CURRENT LIABILITIES
Trade and other payables 511 502
Other liabilities 834 776
TOTAL CURRENT LIABILITIES 1 345 1 278
TOTAL LIABILITIES 3 364 2 827
TOTAL EQUITY AND LIABILITIES 5 767 5 039
CONDENSED CONSOLIDATED STATEMENT OF COMPREHENSIVE INCOME
(CHF million)2014
RESULTS2013
RESULTS
Actuarial gains/(losses) on defined benefit plans (100) 71
Income tax on actuarial gains/(losses) taken directly to equity 26 (23)
Items that will not be subsequently reclassified to income statement (74) 48
Exchange differences and other 82 (132)
Items that may be subsequently reclassified to income statement 82 (132)
OTHER COMPREHENSIVE INCOME FOR THE PERIOD 8 (84)
Profit for the period 666 638
TOTAL COMPREHENSIVE INCOME FOR THE PERIOD 674 554
Attributable to:
Equity holders of SGS SA 643 516
Non-controlling interests 31 38
12
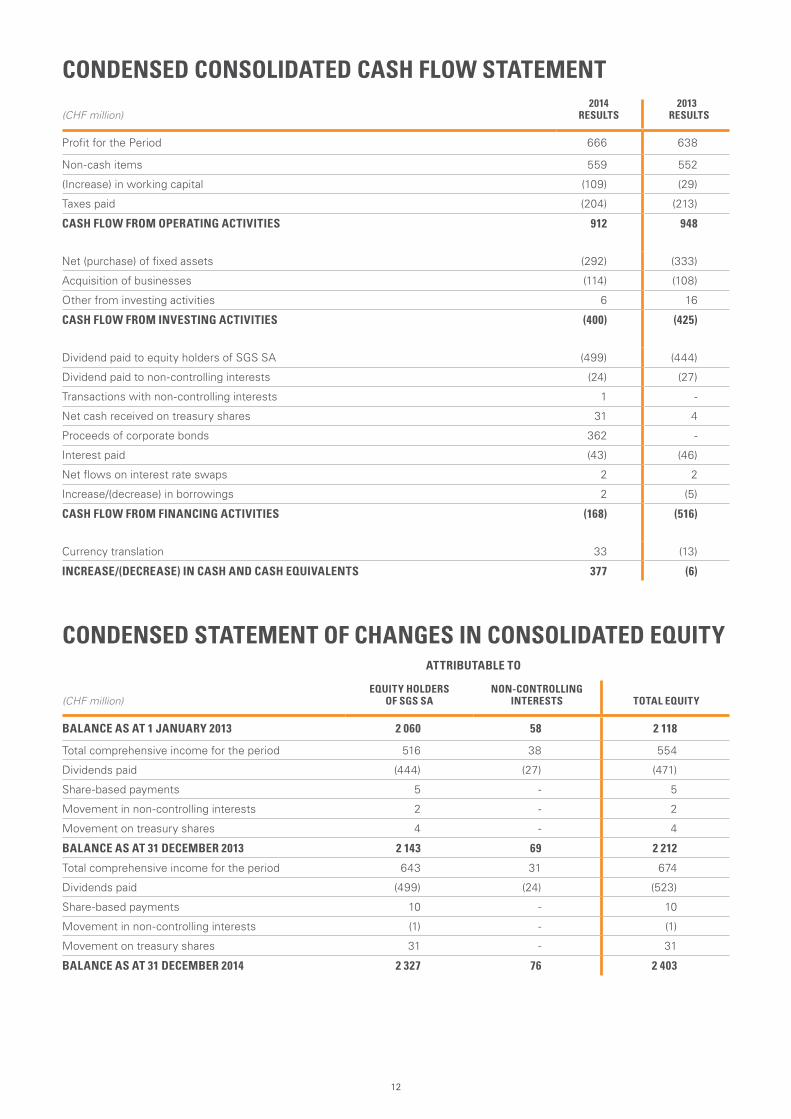
CONDENSED CONSOLIDATED CASH FLOW STATEMENT
CONDENSED STATEMENT OF CHANGES IN CONSOLIDATED EQUITY
(CHF million)2014
RESULTS2013
RESULTS
Profit for the Period 666 638
Non-cash items 559 552
(Increase) in working capital (109) (29)
Taxes paid (204) (213)
CASH FLOW FROM OPERATING ACTIVITIES 912 948
Net (purchase) of fixed assets (292) (333)
Acquisition of businesses (114) (108)
Other from investing activities 6 16
CASH FLOW FROM INVESTING ACTIVITIES (400) (425)
Dividend paid to equity holders of SGS SA (499) (444)
Dividend paid to non-controlling interests (24) (27)
Transactions with non-controlling interests 1 -
Net cash received on treasury shares 31 4
Proceeds of corporate bonds 362 -
Interest paid (43) (46)
Net flows on interest rate swaps 2 2
Increase/(decrease) in borrowings 2 (5)
CASH FLOW FROM FINANCING ACTIVITIES (168) (516)
Currency translation 33 (13)
INCREASE/(DECREASE) IN CASH AND CASH EQUIVALENTS 377 (6)
ATTRIBUTABLE TO
(CHF million)
EQUITY HOLDERS OF SGS SA
NON-CONTROLLING INTERESTS TOTAL EQUITY
BALANCE AS AT 1 JANUARY 2013 2 060 58 2 118
Total comprehensive income for the period 516 38 554
Dividends paid (444) (27) (471)
Share-based payments 5 - 5
Movement in non-controlling interests 2 - 2
Movement on treasury shares 4 - 4
BALANCE AS AT 31 DECEMBER 2013 2 143 69 2 212
Total comprehensive income for the period 643 31 674
Dividends paid (499) (24) (523)
Share-based payments 10 - 10
Movement in non-controlling interests (1) - (1)
Movement on treasury shares 31 - 31
BALANCE AS AT 31 DECEMBER 2014 2 327 76 2 403
13
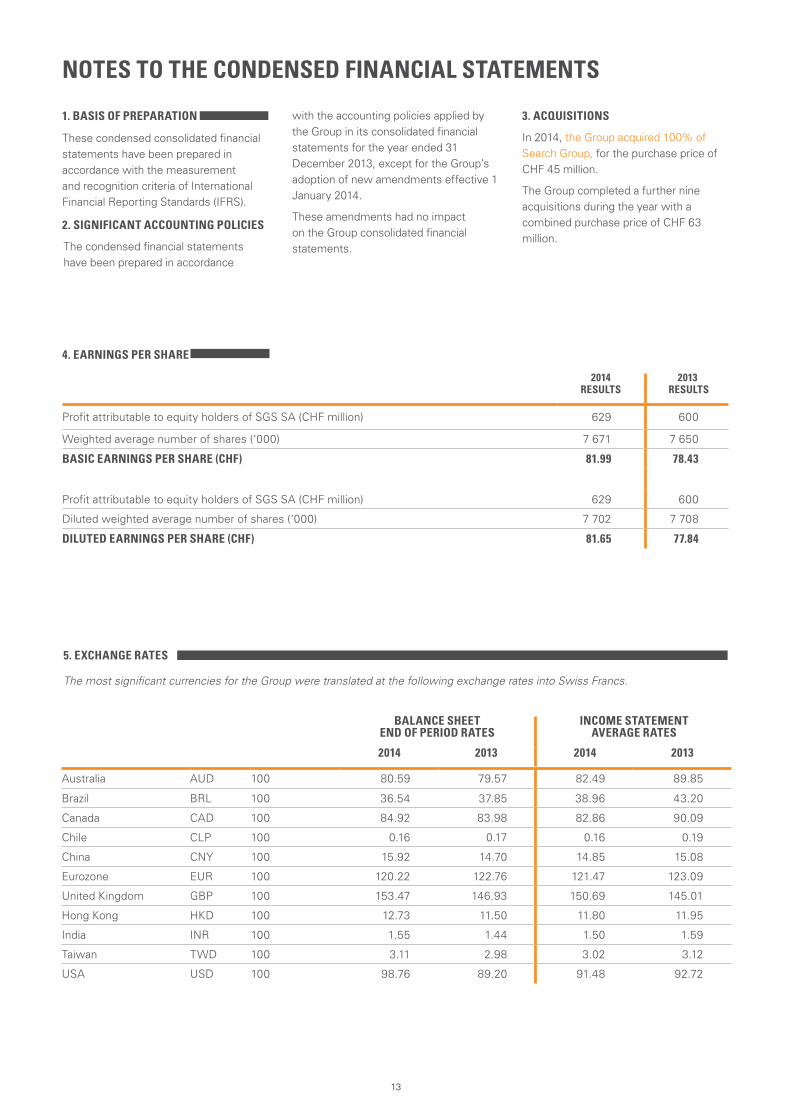
1. BASIS OF PREPARATION
These condensed consolidated financial statements have been prepared in accordance with the measurement and recognition criteria of International Financial Reporting Standards (IFRS).
2. SIGNIFICANT ACCOUNTING POLICIES
The condensed financial statements have been prepared in accordance
with the accounting policies applied by the Group in its consolidated financial statements for the year ended 31 December 2013, except for the Group’s adoption of new amendments effective 1 January 2014.
These amendments had no impact on the Group consolidated financial statements.
3. ACQUISITIONS
In 2014, the Group acquired 100% of Search Group, for the purchase price of CHF 45 million.
The Group completed a further nine acquisitions during the year with a combined purchase price of CHF 63 million.
NOTES TO THE CONDENSED FINANCIAL STATEMENTS
4. EARNINGS PER SHARE
2014 RESULTS
2013 RESULTS
Profit attributable to equity holders of SGS SA (CHF million) 629 600
Weighted average number of shares (‘000) 7 671 7 650
BASIC EARNINGS PER SHARE (CHF) 81.99 78.43
Profit attributable to equity holders of SGS SA (CHF million) 629 600
Diluted weighted average number of shares (‘000) 7 702 7 708
DILUTED EARNINGS PER SHARE (CHF) 81.65 77.84
BALANCE SHEET END OF PERIOD RATES
INCOME STATEMENT AVERAGE RATES
2014 2013 2014 2013
Australia AUD 100 80.59 79.57 82.49 89.85
Brazil BRL 100 36.54 37.85 38.96 43.20
Canada CAD 100 84.92 83.98 82.86 90.09
Chile CLP 100 0.16 0.17 0.16 0.19
China CNY 100 15.92 14.70 14.85 15.08
Eurozone EUR 100 120.22 122.76 121.47 123.09
United Kingdom GBP 100 153.47 146.93 150.69 145.01
Hong Kong HKD 100 12.73 11.50 11.80 11.95
India INR 100 1.55 1.44 1.50 1.59
Taiwan TWD 100 3.11 2.98 3.02 3.12
USA USD 100 98.76 89.20 91.48 92.72
5. EXCHANGE RATES
The most significant currencies for the Group were translated at the following exchange rates into Swiss Francs.

14
15
SHAREHOLDER
INFORMATION
DISCLAIMER
This PDF version is an exact copy of the document provided to SGS shareholders.
Except where you are a shareholder, this material is provided for information purposes only and is not, in particular, intended to confer any legal rights on you.
This document does not constitute an invitation to invest in SGS shares. Any decisions you make in reliance on this information are solely your responsibility.
This document is given as of the dates specified, is not updated and any forward looking statements are made subject to the following reservations:
This document contains certain forward looking statements that are neither historical facts nor guarantees of future performance. Because these statements involve risks and uncertainties that are beyond control or estimation of SGS, there are important factors that could cause actual results to differ materially from those expressed
or implied by these forward looking statements. These statements speak only as of the date of this document. Except as required by any applicable law or regulation, SGS expressly disclaims any obligation to release publicly any updates or revisions to any forward looking statements contained herein to reflect any change in SGS group’s expectations with regard thereto or any change in events or conditions on which any such statements are based.
The English version is binding.
SGS SA CORPORATE OFFICE
1 place des Alpes P.O. Box 2152 CH – 1211 Geneva 1 t +41 (0)22 739 91 11 f +41 (0)22 739 98 86 e [email protected] www.sgs.com
2015 HALF YEAR RESULTS
Friday, 17 July 2015
ANNUAL GENERAL MEETING OF SHAREHOLDERS
Thursday, 12 March 2015
Geneva, Switzerland
DIVIDEND PAYMENT DATE
Wednesday, 18 March 2015
INVESTOR DAYS
Thursday - Friday 29-30 October 2015
STOCK EXCHANGE LISTING
SIX Swiss Exchange, SGSN
STOCK EXCHANGE TRADING
SIX Swiss Exchange
COMMON STOCK SYMBOLS
Bloomberg: Registered Share: SGSN.VX
Reuters: Registered Share: SGSN.VX
Telekurs: Registered Share: SGSN
ISIN: Registered Share: CH0002497458
Swiss security number: 249745
CORPORATE DEVELOPMENT, COMMUNICATIONS & INVESTOR RELATIONS
Jean-Luc de Buman SGS SA 1 place des Alpes P.O. Box 2152 CH – 1211 Geneva 1 t +41 (0)22 739 93 31 f +41 (0)22 739 92 00 www.sgs.com
WWW.SGS.COM
© S
GS
SA
201
5. A
LL R
IGH
TS R
ES
ER
VE
D.