2014 European Private Equity Activity - Invest Europe · 2014 European Private Equity Activity 2...
76
2014 European Private Equity Activity Statistics on Fundraising, Investments & Divestments
-
Upload
nguyenhuong -
Category
Documents
-
view
214 -
download
0
Transcript of 2014 European Private Equity Activity - Invest Europe · 2014 European Private Equity Activity 2...
2014 European
Private Equity Activity
Statistics on Fundraising,
Investments & Divestments
2014 European Private Equity Activity 2
Disclaimer
The information contained in this report has been produced by the
EVCA, based on PEREP_Analytics data and third party information.
While the EVCA has made every effort to ensure the reliability of
the data included in this report, EVCA cannot guarantee the
accuracy of the information collected and presented. Therefore,
the EVCA cannot accept responsibility for any decision made or
action taken based upon this report or the information provided
herein.
This presentation is for the exclusive use of the persons to whom it
is addressed and is intended for general information purposes only.
It is not intended to constitute legal or other professional advice
and should not be treated as such. Appropriate legal advice must be
sought before making any decision, taking any action or refraining
from taking any action in reliance on the information contained in
this presentation. The EVCA does not assume any responsibility for
any person’s reliance upon the information contained herein.
In furnishing this presentation, the EVCA undertakes no obligation
to provide any additional information or to update this presentation
or any additional information or to correct any inaccuracies which
may become apparent.
Unless otherwise specified, this presentation is confidential and
may not be distributed, published, reproduced or disclosed to any
other person or used for any other purpose, without the written
permission of the EVCA.
Copyright information
No part of this publication may be reproduced by any process
except in accordance with the provisions of the Copyright Act 1968.
Copyright enquiries should be directed to the EVCA.
Tel: + 32 2 715 00 20.
© Copyright EVCA May 2015
Version
Presentation as of 05/05/2015
The EVCA is the voice of European private equity.
Our membership covers all private equity activity, from early-stage venture capital through to large
private equity firms and funds investing in infrastructure. Our members also include institutional
investors, such as pension funds and insurance companies, who are a key source of long-term financing
in Europe and who invest in private equity, venture capital and infrastructure funds. We represent 650
member firms and 500 affiliate members.
The EVCA shapes the future direction of the industry, while promoting it to stakeholders such as
entrepreneurs, business owners and employee representatives.
We explain private equity to the public and help shape public policy, so that our members can conduct
their business effectively.
The EVCA is the guardian of the industry’s professional standards, demanding accountability, good
governance and transparency from our members and spreading best practice through our training
courses.
We have the facts when it comes to European private equity, thanks to our trusted and authoritative
research and analysis.
The EVCA has 25 dedicated staff working in Brussels to make sure that our industry is understood and
heard.
2014 European Private Equity Activity 3
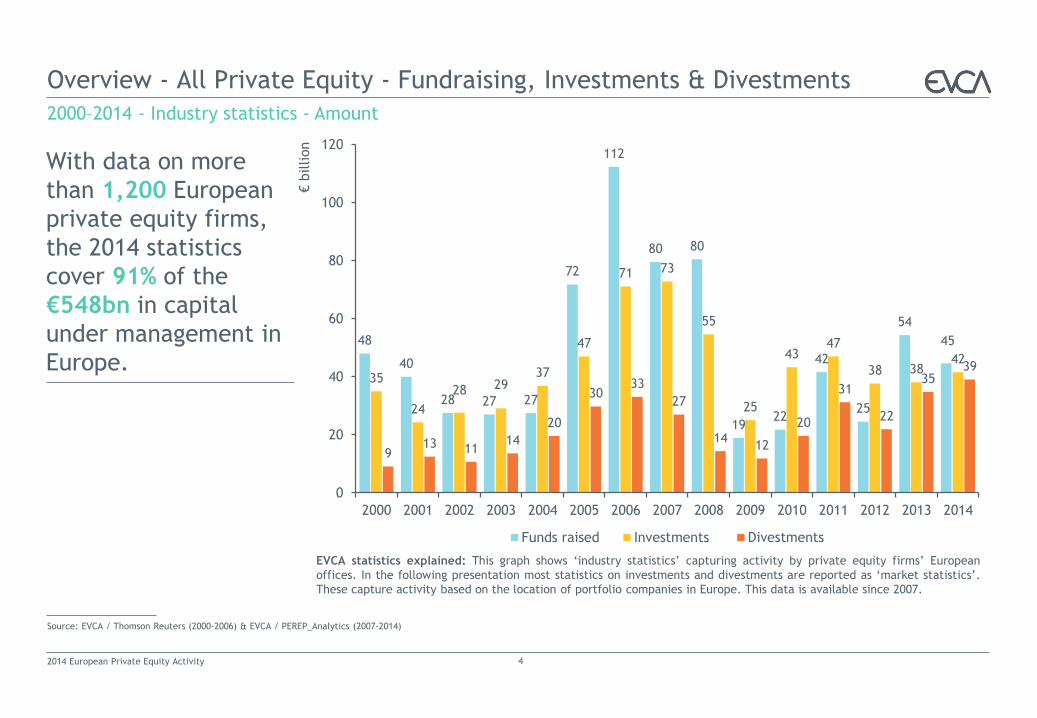
Overview - All Private Equity - Fundraising, Investments & Divestments
2000–2014 - Industry statistics - Amount
Source: EVCA / Thomson Reuters (2000-2006) & EVCA / PEREP_Analytics (2007-2014)
4
With data on more
than 1,200 European
private equity firms,
the 2014 statistics
cover 91% of the
€548bn in capital
under management in
Europe.
EVCA statistics explained: This graph shows ‘industry statistics’ capturing activity by private equity firms’ European
offices. In the following presentation most statistics on investments and divestments are reported as ‘market statistics’.
These capture activity based on the location of portfolio companies in Europe. This data is available since 2007.
48
40
28 27 27
72
112
80 80
19 22
42
25
54
45
35
24
28 29 37
47
71 73
55
25
43 47
38 38 42
9 13 11
14
20
30 33
27
14 12
20
31
22
35 39
0
20
40
60
80
100
120
2000 2001 2002 2003 2004 2005 2006 2007 2008 2009 2010 2011 2012 2013 2014
€ b
illion
Funds raised Investments Divestments
2014 European Private Equity Activity
3 Divestments
Divestments statistics explained 60
Glossary 62
At a glance 63
By initial investment stage 64
By exit route 65
By sector 69
By region 72
Acknowledgements 73
About PEREP_Analytics and EVCA Research 75
2 Investments
Investments statistics explained 26
Glossary 28
At a glance 29
By investment stage 30
Annual trends 31
Quarterly trends 34
By geography 38
Investments as % of GDP
Industry statistics 43
Market statistics 48
By sector 52
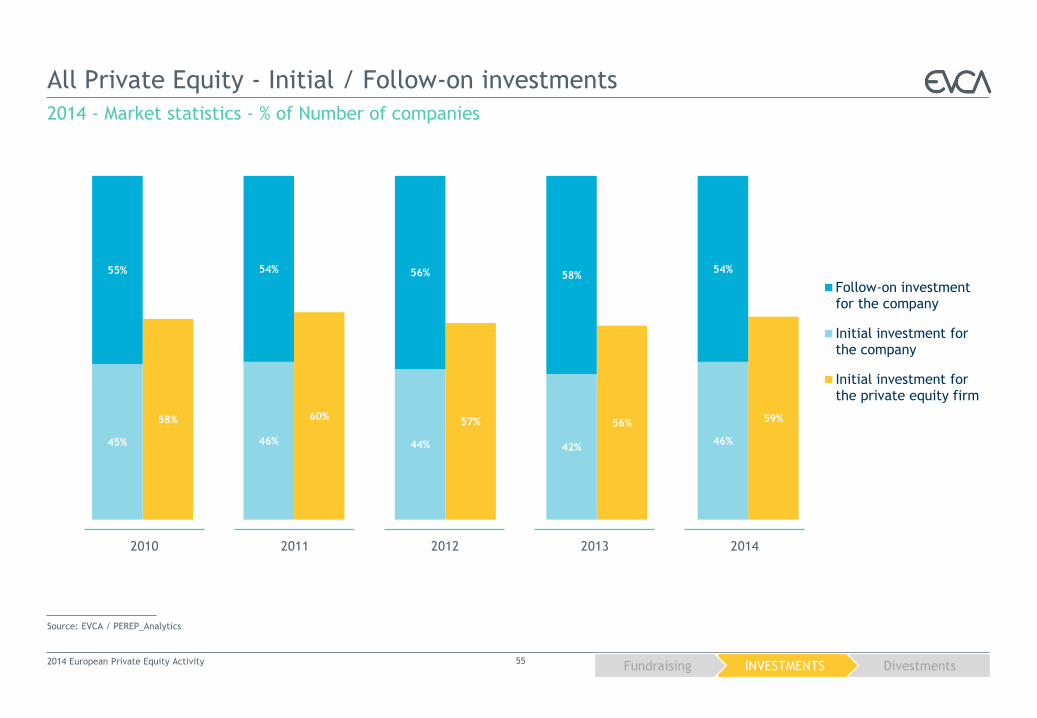
Initial / follow-on 55
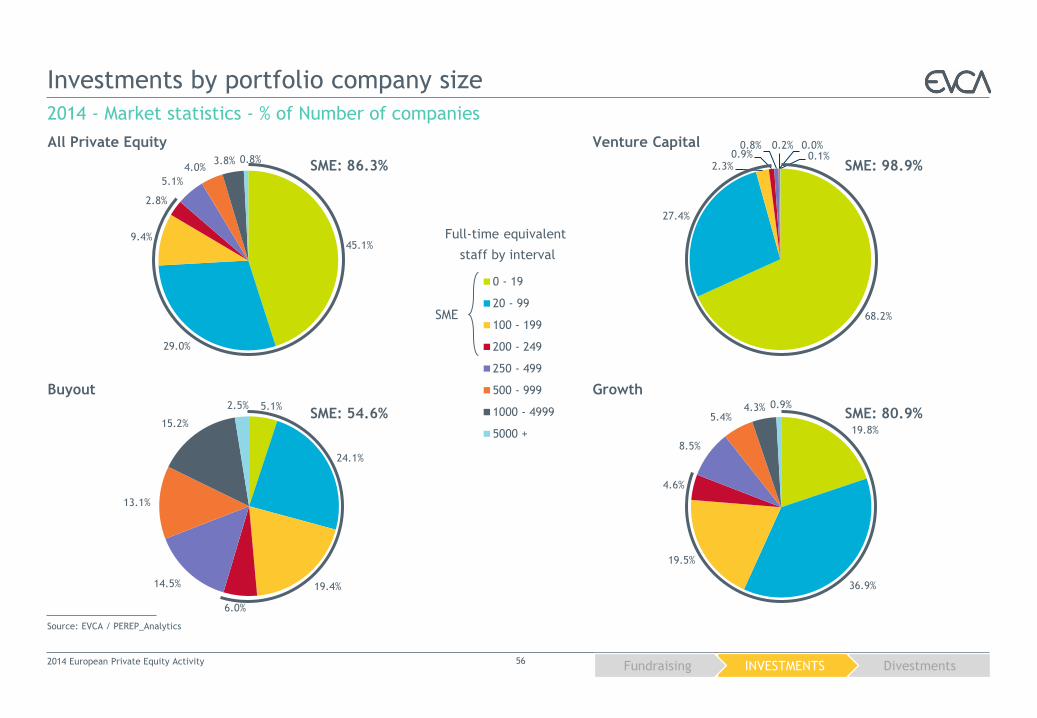
By portfolio company size 56
What’s inside?
2014 European Private Equity Activity 5
Executive Summary 6
1 Fundraising
Fundraising statistics explained 7
Glossary 8
At a glance 9
Incremental fundraising
By fund stage focus 10
Concentration of capital 12
By region of management 13
Investors by type 14
Investors by geography 20
Final closing
By fund stage focus 23
Concentration of capital 25
Executive Summary
2014 European Private Equity Activity 6
Fundraising Investments Divestments
In 2014 total fundraising reached €44.6bn
– the second highest level for Europe in
the past five years.
The number of funds (298) reached the
highest level since 2011 and increased in all
market segments compared to 2013. The
total amount decreased by 18%.
40% of institutional investors came from
outside Europe. Pension funds provided
more than one third of the capital raised.
Funds of funds contributed 12%, followed by
government agencies (11%) and insurance
companies (10%).
Venture capital fundraising decreased by
12% to €4.1bn. Fundraising for early-stage
focused funds increased by 32% reaching its
highest level in the past six years.
Buyout fundraising volume reduced by 23%
to €35.1bn due to a lower share coming
from funds that raised more than €1bn.
With €1.8bn Growth fundraising reached its
highest level in three years, an increase of
nearly 70% compared to 2013.
2 The total amount of equity investments in
European companies increased by 14% to
€41.5bn. The number of companies
increased by 8% to over 5,500 to a five-
year high. More than 80% of them are
SMEs.
Venture capital investments increased by 6%
to €3.6bn. More than 3,200 companies were
venture-backed. Start-up stage investments
made up the majority of venture capital
activity both by amount and number of
companies.
More than 900 companies received buyout
investments with an equity amount of
€31.3bn. The amount and number of
companies increased 12% and 13%
respectively. The majority of equity was
invested in small and mid market
transactions.
Growth investments grew 56% by amount to
€5.6bn. The related number of 1,270
companies receiving this investment
increased by 13% and is the highest to date.
3 More than 2,400 European companies
were exited, representing former equity
investments (divestments at cost) of
€37.8bn. This amount is the highest to
date for European private equity.
The most prominent exit routes by amount
were trade sale (26%), sale to another
private equity firm (24%) and sale of quoted
equity (10%). Almost 40% of all the divested
companies followed these exit routes.
The strength of public markets continued in
2014 and was reflected by another increase
in the sale of quoted equity on flotation
(IPO). Exits at the event of an IPO increased
from 23 to 51 companies. The related
amount divested at cost increased by over
50% to €3.3bn.
Divestments from venture capital
investments by equity amount at cost
decreased by 16% to €1.9bn. Buyout related
exits at cost increased by 12% to €32.8bn.
For growth investments the total amount
divested at cost increased by 16% to €2.2bn.
1
Fundraising
1 Fundraising statistics explained
Direct private equity investment funds that primarily focus on investments in
Europe are monitored.
Funds raised are recorded in the country of the advisory team that is
raising/managing the fund (‘industry statistics’).
The funds included in the statistics are: private equity funds making direct
private equity investments, mezzanine private equity funds, co-investment
funds and rescue/turnaround funds.
The following funds are excluded from the statistics: infrastructure funds,
real estate funds, distressed debt funds, primary funds of funds, secondary
funds of funds.
2014 European Private Equity Activity 7
For more data visit www.evca.eu/research
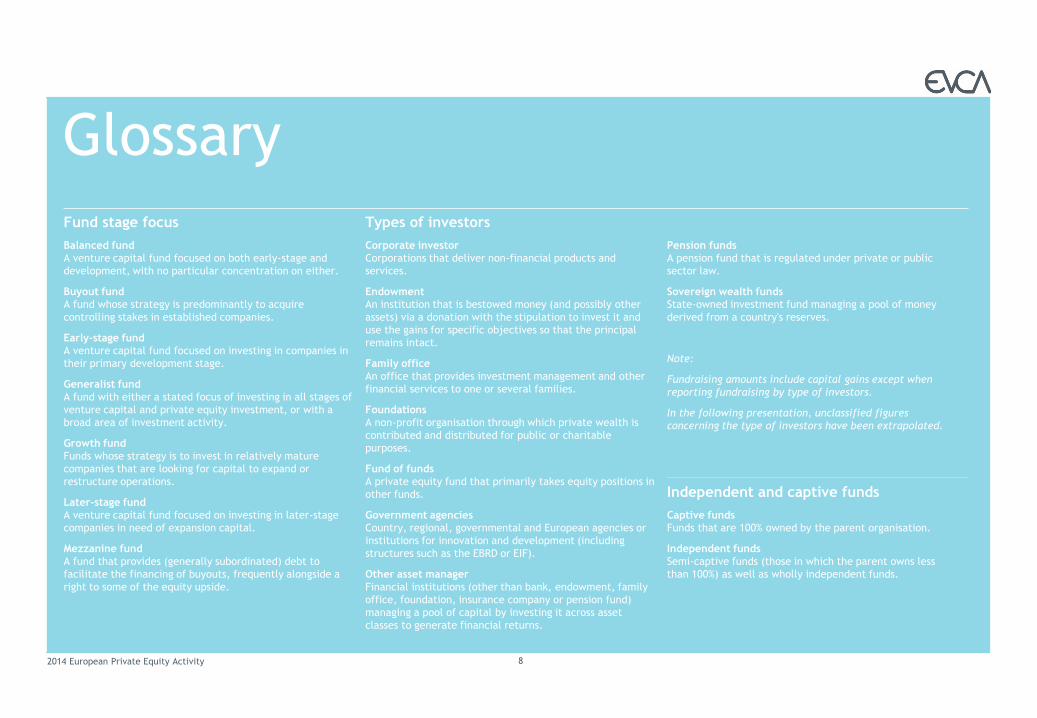
Glossary
Fund stage focus
Balanced fund
A venture capital fund focused on both early-stage and
development, with no particular concentration on either.
Buyout fund
A fund whose strategy is predominantly to acquire
controlling stakes in established companies.
Early-stage fund
A venture capital fund focused on investing in companies in
their primary development stage.
Generalist fund
A fund with either a stated focus of investing in all stages of
venture capital and private equity investment, or with a
broad area of investment activity.
Growth fund
Funds whose strategy is to invest in relatively mature
companies that are looking for capital to expand or
restructure operations.
Later-stage fund
A venture capital fund focused on investing in later-stage
companies in need of expansion capital.
Mezzanine fund
A fund that provides (generally subordinated) debt to
facilitate the financing of buyouts, frequently alongside a
right to some of the equity upside.
Types of investors
Corporate investor
Corporations that deliver non-financial products and
services.
Endowment
An institution that is bestowed money (and possibly other
assets) via a donation with the stipulation to invest it and
use the gains for specific objectives so that the principal
remains intact.
Family office
An office that provides investment management and other
financial services to one or several families.
Foundations
A non-profit organisation through which private wealth is
contributed and distributed for public or charitable
purposes.
Fund of funds
A private equity fund that primarily takes equity positions in
other funds.
Government agencies
Country, regional, governmental and European agencies or
institutions for innovation and development (including
structures such as the EBRD or EIF).
Other asset manager
Financial institutions (other than bank, endowment, family
office, foundation, insurance company or pension fund)
managing a pool of capital by investing it across asset
classes to generate financial returns.
Pension funds
A pension fund that is regulated under private or public
sector law.
Sovereign wealth funds
State-owned investment fund managing a pool of money
derived from a country's reserves.
Note:
Fundraising amounts include capital gains except when
reporting fundraising by type of investors.
In the following presentation, unclassified figures
concerning the type of investors have been extrapolated.
Independent and captive funds
Captive funds
Funds that are 100% owned by the parent organisation.
Independent funds
Semi-captive funds (those in which the parent owns less
than 100%) as well as wholly independent funds.
2014 European Private Equity Activity 8
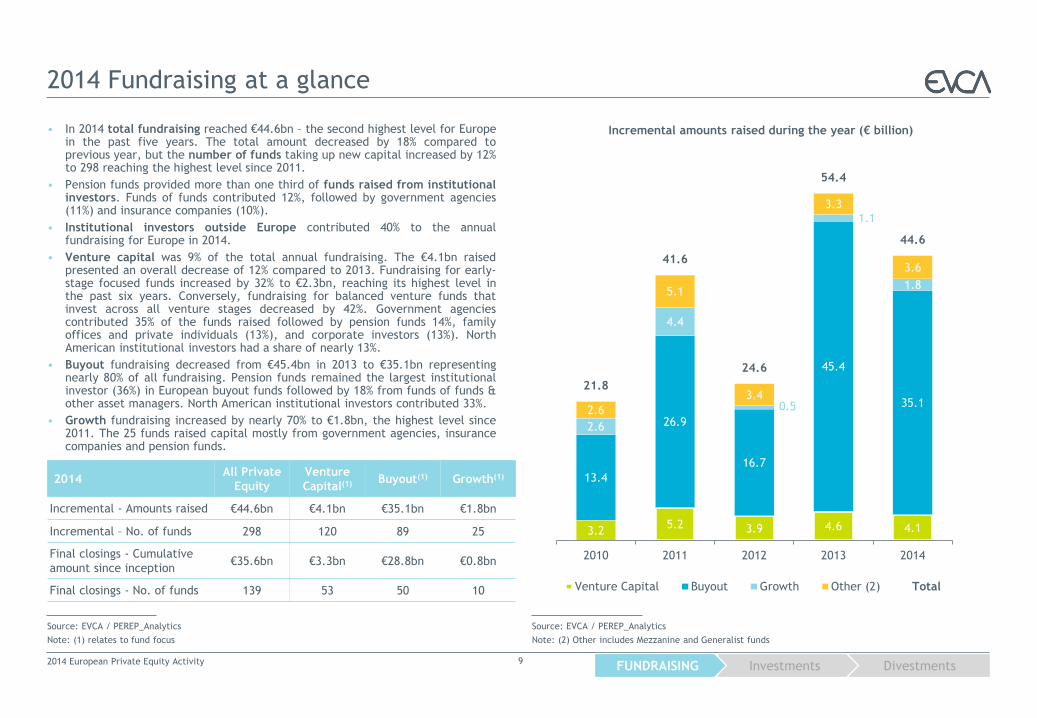
2014 Fundraising at a glance
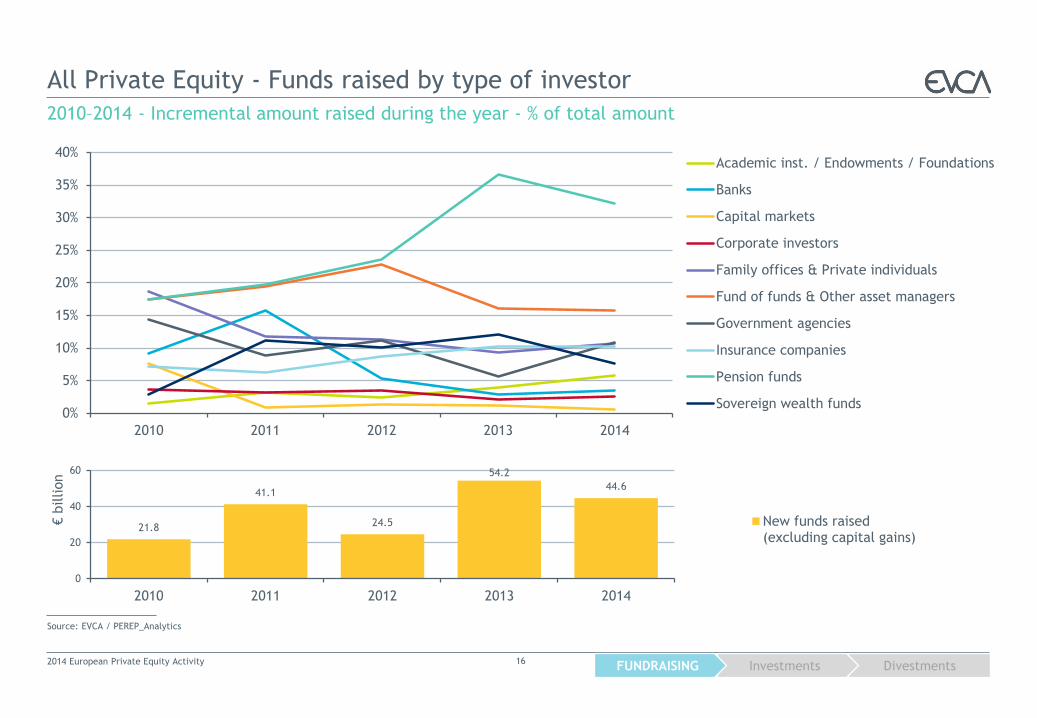
• In 2014 total fundraising reached €44.6bn – the second highest level for Europe in the past five years. The total amount decreased by 18% compared to previous year, but the number of funds taking up new capital increased by 12% to 298 reaching the highest level since 2011.
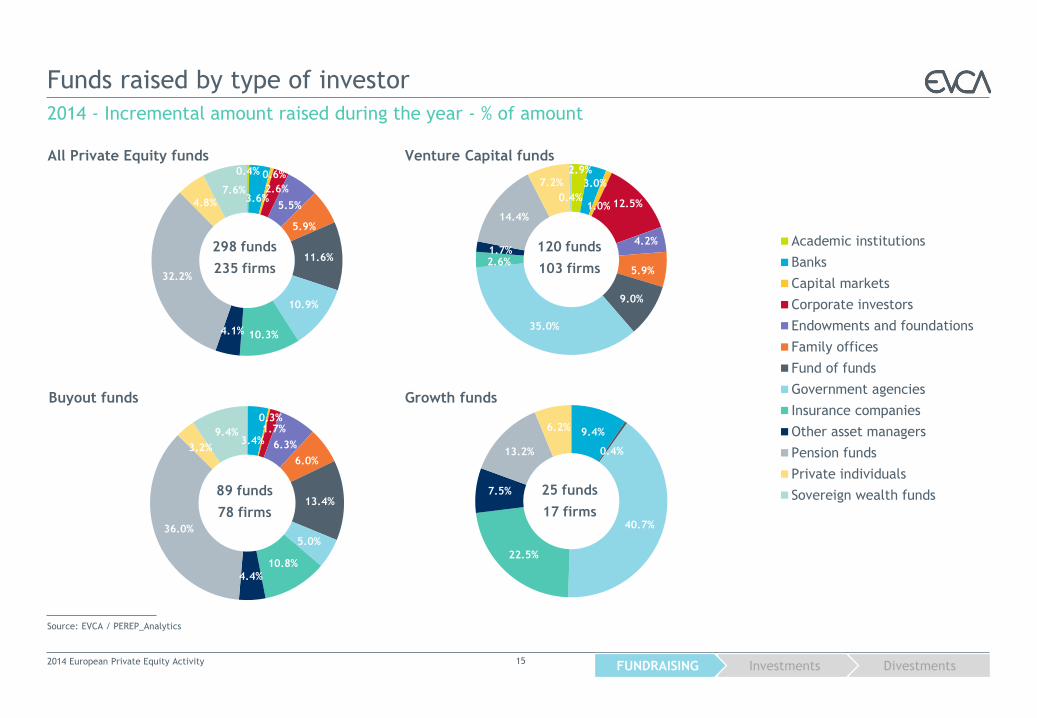
• Pension funds provided more than one third of funds raised from institutional investors. Funds of funds contributed 12%, followed by government agencies (11%) and insurance companies (10%).
• Institutional investors outside Europe contributed 40% to the annual fundraising for Europe in 2014.
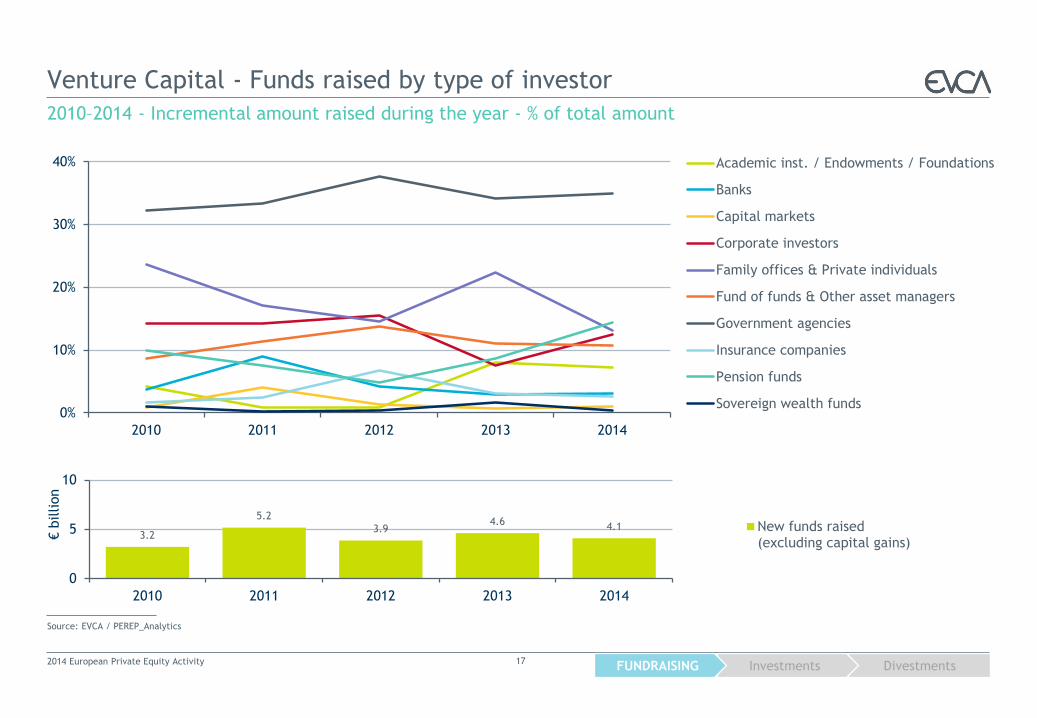
• Venture capital was 9% of the total annual fundraising. The €4.1bn raised presented an overall decrease of 12% compared to 2013. Fundraising for early-stage focused funds increased by 32% to €2.3bn, reaching its highest level in the past six years. Conversely, fundraising for balanced venture funds that invest across all venture stages decreased by 42%. Government agencies contributed 35% of the funds raised followed by pension funds 14%, family offices and private individuals (13%), and corporate investors (13%). North American institutional investors had a share of nearly 13%.
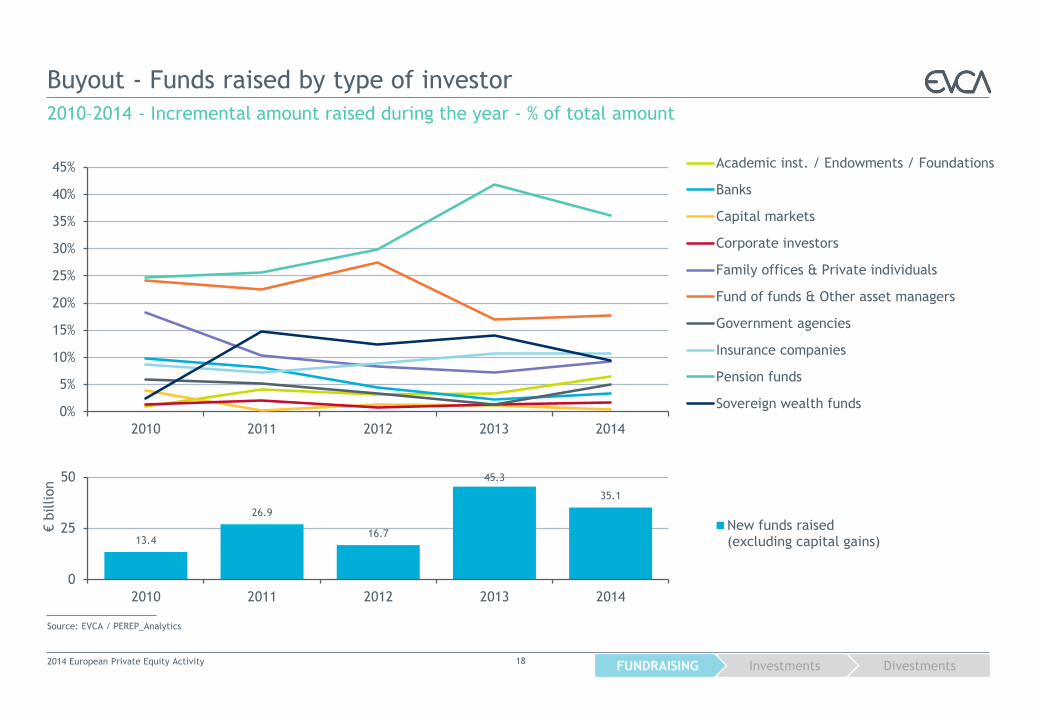
• Buyout fundraising decreased from €45.4bn in 2013 to €35.1bn representing nearly 80% of all fundraising. Pension funds remained the largest institutional investor (36%) in European buyout funds followed by 18% from funds of funds & other asset managers. North American institutional investors contributed 33%.
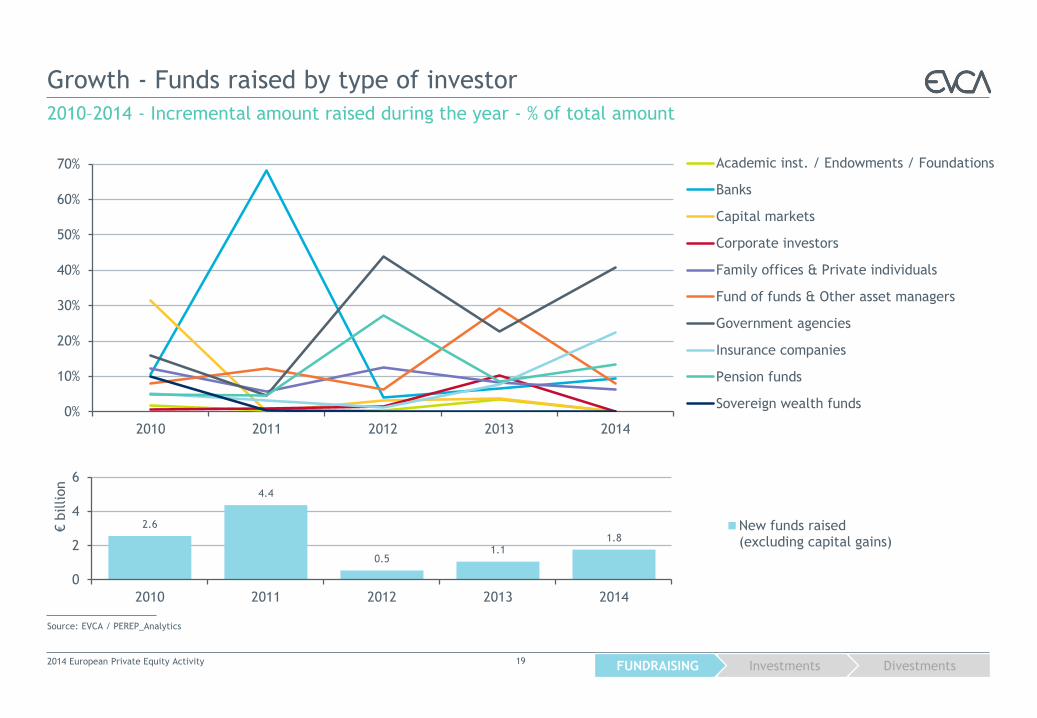
• Growth fundraising increased by nearly 70% to €1.8bn, the highest level since 2011. The 25 funds raised capital mostly from government agencies, insurance companies and pension funds.
2014 European Private Equity Activity 9
Source: EVCA / PEREP_Analytics
Note: (1) relates to fund focus
Source: EVCA / PEREP_Analytics
Note: (2) Other includes Mezzanine and Generalist funds
2014 All Private
Equity
Venture
Capital(1) Buyout(1) Growth(1)
Incremental - Amounts raised €44.6bn €4.1bn €35.1bn €1.8bn
Incremental – No. of funds 298 120 89 25
Final closings - Cumulative
amount since inception €35.6bn €3.3bn €28.8bn €0.8bn
Final closings - No. of funds 139 53 50 10
Incremental amounts raised during the year (€ billion)
Divestments Investments FUNDRAISING
3.2 5.2 3.9 4.6 4.1
13.4
26.9
16.7
45.4
35.1
2.6
4.4
0.5
1.1
1.8
2.6
5.1
3.4
3.3
3.6
21.8
41.6
24.6
54.4
44.6
2010 2011 2012 2013 2014
Venture Capital Buyout Growth Other (2) Total
Divestments Investments FUNDRAISING
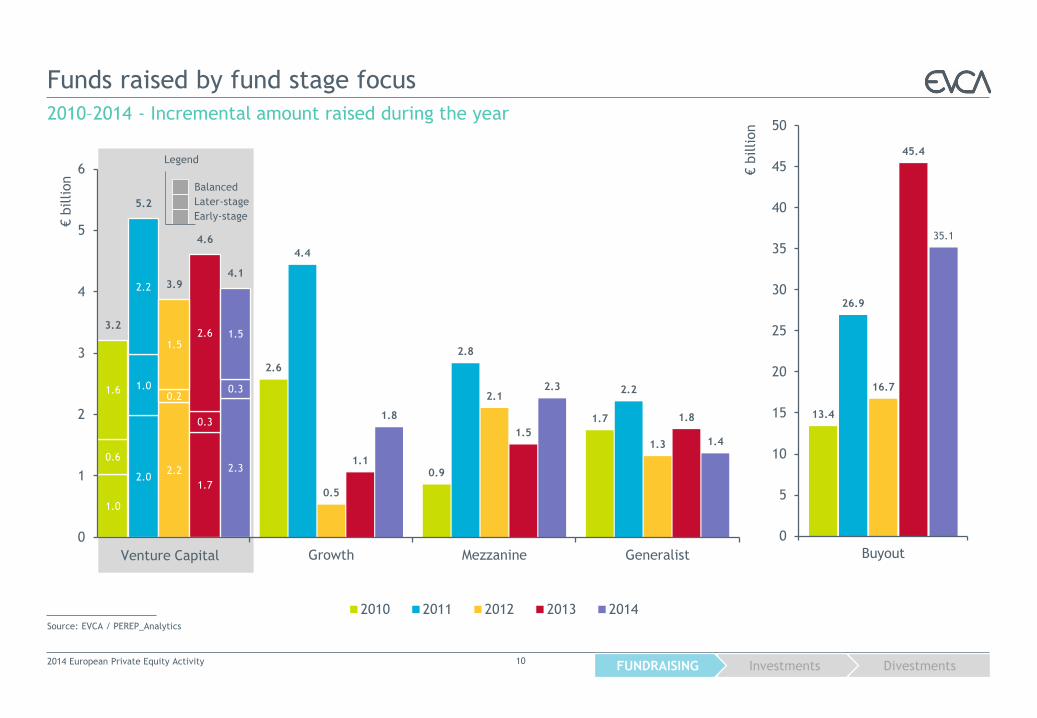
Funds raised by fund stage focus
2014 European Private Equity Activity 10
2010–2014 - Incremental amount raised during the year
Source: EVCA / PEREP_Analytics
Venture Capital
Balanced
Later-stage
Early-stage
Legend
1.0
2.0 2.2
1.7
2.3 0.6
1.0 0.2
0.3
0.3 1.6
2.2
1.5 2.6 1.5
3.2
5.2
3.9
4.6
4.1
0
1
2
3
4
5
6
€ b
illion
2.6
0.9
1.7
4.4
2.8
2.2
0.5
2.1
1.3
1.1
1.5
1.8 1.8
2.3
1.4
Growth Mezzanine Generalist
2010 2011 2012 2013 2014
13.4
26.9
16.7
45.4
35.1
0
5
10
15
20
25
30
35
40
45
50
Buyout
€ b
illion
Divestments Investments FUNDRAISING
Funds raised by fund stage focus
2014 European Private Equity Activity 11
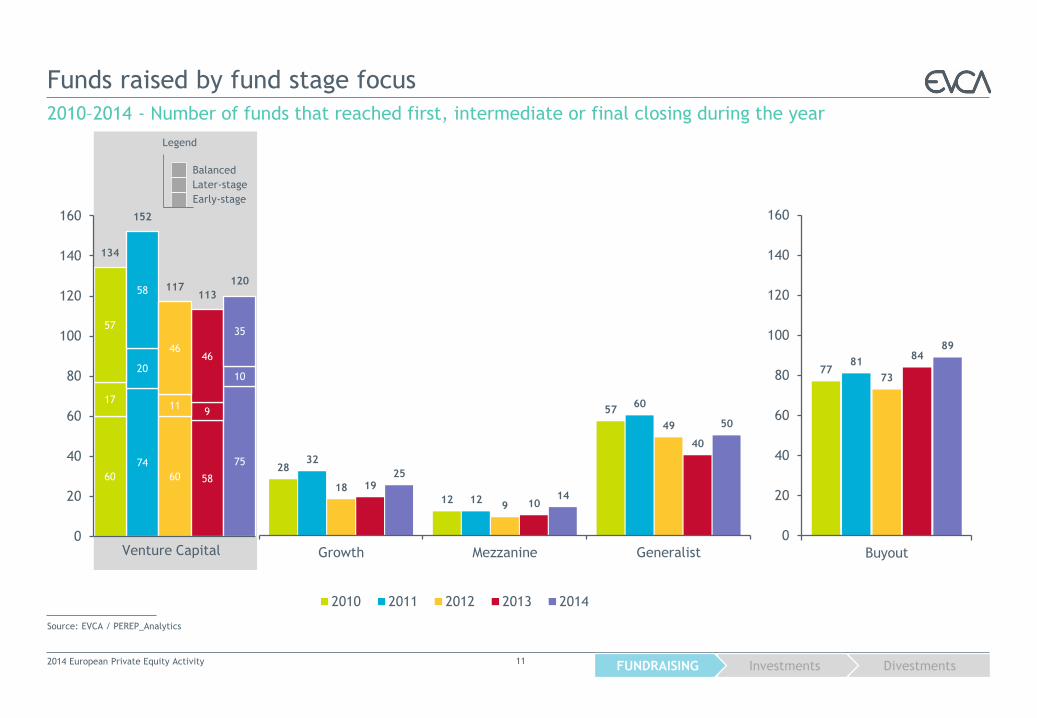
2010–2014 - Number of funds that reached first, intermediate or final closing during the year
Source: EVCA / PEREP_Analytics
Venture Capital
Balanced
Later-stage
Early-stage
Legend
60
74
60 58
75
17
20
11 9
10
57
58
46 46
35
134
152
117 113
120
0
20
40
60
80
100
120
140
160
28
12
57
32
12
60
18
9
49
19
10
40
25
14
50
Growth Mezzanine Generalist
2010 2011 2012 2013 2014
77 81
73
84 89
0
20
40
60
80
100
120
140
160
Buyout
Divestments Investments FUNDRAISING
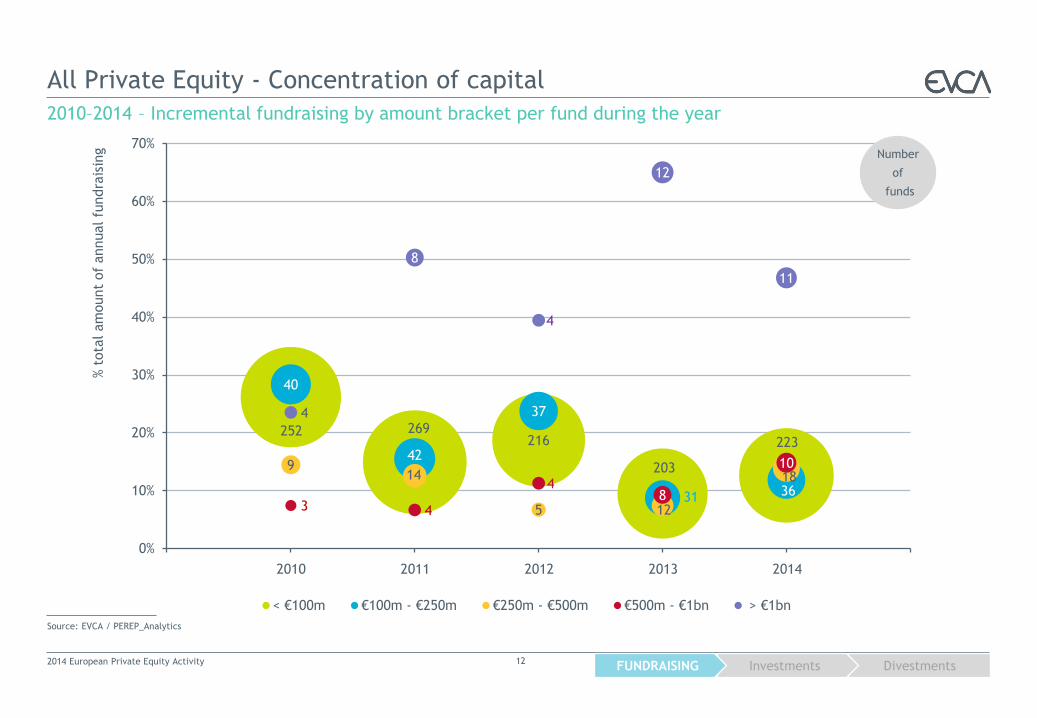
252 269 216
203
223
40
42
37
31 36
9 14
5 12
18
3 4
4 8
10
4
8
4
12
11
0%
10%
20%
30%
40%
50%
60%
70%
< €100m €100m - €250m €250m - €500m €500m - €1bn > €1bn
All Private Equity - Concentration of capital
2010–2014 – Incremental fundraising by amount bracket per fund during the year
Source: EVCA / PEREP_Analytics
2014 2010 2011 2012
Number
of
funds
% t
ota
l am
ount
of
annual fu
ndra
isin
g
2014 European Private Equity Activity 12
2013
Divestments Investments FUNDRAISING
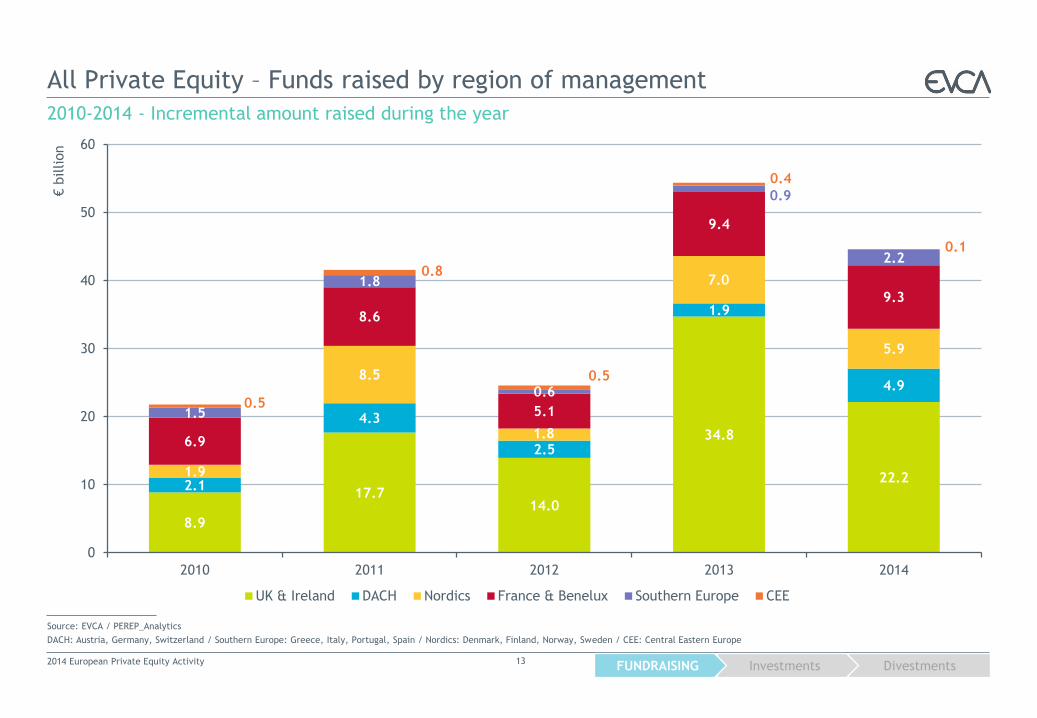
All Private Equity – Funds raised by region of management
2010-2014 - Incremental amount raised during the year
Source: EVCA / PEREP_Analytics
DACH: Austria, Germany, Switzerland / Southern Europe: Greece, Italy, Portugal, Spain / Nordics: Denmark, Finland, Norway, Sweden / CEE: Central Eastern Europe
2014 European Private Equity Activity 13
8.9
17.7 14.0
34.8
22.2 2.1
4.3
2.5
1.9
4.9
1.9
8.5
1.8
7.0
5.9
6.9
8.6
5.1
9.4
9.3
1.5
1.8
0.6
0.9
2.2
0.5
0.8
0.5
0.4
0.1
0
10
20
30
40
50
60
2010 2011 2012 2013 2014
€ b
illion
UK & Ireland DACH Nordics France & Benelux Southern Europe CEE
Divestments Investments FUNDRAISING
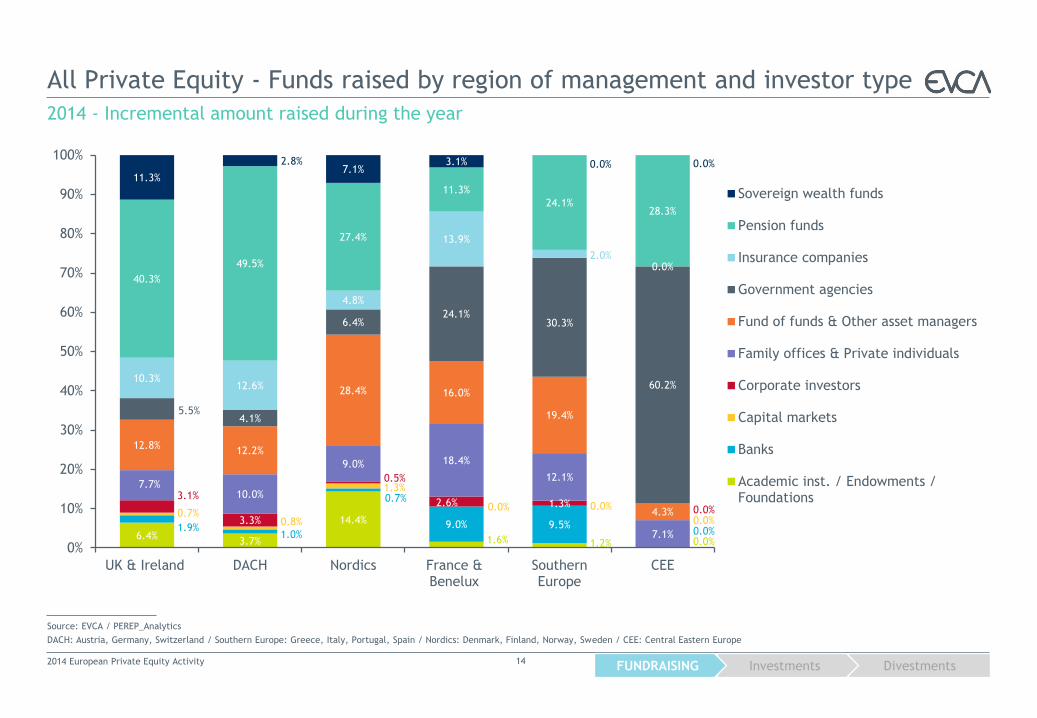
6.4% 3.7%
14.4%
1.6% 1.2% 0.0%
1.9% 1.0%
0.7%
9.0% 9.5% 0.0%
0.7% 0.8%
1.3%
0.0% 0.0%
0.0%
3.1%
3.3%
0.5%
2.6% 1.3% 0.0%
7.7% 10.0%
9.0% 18.4%
12.1%
7.1%
12.8% 12.2%
28.4% 16.0%
19.4%
4.3%
5.5% 4.1%
6.4% 24.1%
30.3%
60.2% 10.3%
12.6%
4.8%
13.9%
2.0% 0.0%
40.3%
49.5%
27.4%
11.3%
24.1% 28.3%
11.3%
2.8% 7.1%
3.1% 0.0% 0.0%
0%
10%
20%
30%
40%
50%
60%
70%
80%
90%
100%
UK & Ireland DACH Nordics France &Benelux
SouthernEurope
CEE
Sovereign wealth funds
Pension funds
Insurance companies
Government agencies
Fund of funds & Other asset managers
Family offices & Private individuals
Corporate investors
Capital markets
Banks
Academic inst. / Endowments /Foundations
All Private Equity - Funds raised by region of management and investor type
2014 - Incremental amount raised during the year
Source: EVCA / PEREP_Analytics
DACH: Austria, Germany, Switzerland / Southern Europe: Greece, Italy, Portugal, Spain / Nordics: Denmark, Finland, Norway, Sweden / CEE: Central Eastern Europe
2014 European Private Equity Activity 14
Divestments Investments FUNDRAISING
9.4%
0.4%
40.7%
22.5%
7.5%
13.2%
6.2%
3.4%
0.3% 1.7%
6.3%
6.0%
13.4%
5.0%
10.8%
4.4%
36.0%
3.2%
9.4%
2.9%
3.0%
1.0% 12.5%
4.2%
5.9%
9.0%
35.0%
2.6% 1.7%
14.4%
7.2%
0.4%
0.4%
3.6%
0.6%
2.6%
5.5%
5.9%
11.6%
10.9%
10.3% 4.1%
32.2%
4.8%
7.6%
Funds raised by type of investor
2014 European Private Equity Activity 15
2014 - Incremental amount raised during the year - % of amount
Source: EVCA / PEREP_Analytics
All Private Equity funds
Buyout funds
Venture Capital funds
Growth funds
298 funds
235 firms
120 funds
103 firms
25 funds
17 firms
89 funds
78 firms
Banks2.7%
Capital markets1.2%
Corporate investors2.0%
Endowments and foundations
3.7%Family offices
3.6%Fund of funds11.5%
Government agencies5.9%
Insurance companies10.8%
Other asset managers4.7%
Pension funds37.4%
Private individuals5.1%
Academic institutions
Banks
Capital markets
Corporate investors
Endowments and foundations
Family offices
Fund of funds
Government agencies
Insurance companies
Other asset managers
Pension funds
Private individuals
Sovereign wealth funds
Divestments Investments FUNDRAISING
21.8
41.1
24.5
54.2
44.6
0
20
40
60
2010 2011 2012 2013 2014
€ b
illion
New funds raised(excluding capital gains)
0%
5%
10%
15%
20%
25%
30%
35%
40%
2010 2011 2012 2013 2014
0%5%
10%15%20%25%30%35%40%
Academic inst. / Endowments / Foundations
Banks
Capital markets
Corporate investors
Family offices & Private individuals
Fund of funds & Other asset managers
Government agencies
Insurance companies
Pension funds
Sovereign wealth funds
All Private Equity - Funds raised by type of investor
2010–2014 - Incremental amount raised during the year - % of total amount
Source: EVCA / PEREP_Analytics
2014 European Private Equity Activity 16
Divestments Investments FUNDRAISING
3.2
5.2
3.9 4.6
4.1
0
5
10
2010 2011 2012 2013 2014
€ b
illion
New funds raised(excluding capital gains)
0%
10%
20%
30%
40%
2010 2011 2012 2013 2014
Venture Capital - Funds raised by type of investor
2010–2014 - Incremental amount raised during the year - % of total amount
Source: EVCA / PEREP_Analytics
2014 European Private Equity Activity 17
0%5%
10%15%20%25%30%35%40%
Academic inst. / Endowments / Foundations
Banks
Capital markets
Corporate investors
Family offices & Private individuals
Fund of funds & Other asset managers
Government agencies
Insurance companies
Pension funds
Sovereign wealth funds
Divestments Investments FUNDRAISING
13.4
26.9
16.7
45.3
35.1
0
25
50
2010 2011 2012 2013 2014
€ b
illion
New funds raised(excluding capital gains)
0%
5%
10%
15%
20%
25%
30%
35%
40%
45%
2010 2011 2012 2013 2014
Buyout - Funds raised by type of investor
2010–2014 - Incremental amount raised during the year - % of total amount
Source: EVCA / PEREP_Analytics
2014 European Private Equity Activity 18
0%5%
10%15%20%25%30%35%40%
Academic inst. / Endowments / Foundations
Banks
Capital markets
Corporate investors
Family offices & Private individuals
Fund of funds & Other asset managers
Government agencies
Insurance companies
Pension funds
Sovereign wealth funds
Divestments Investments FUNDRAISING
2.6
4.4
0.5 1.1
1.8
0
2
4
6
2010 2011 2012 2013 2014
€ b
illion
New funds raised(excluding capital gains)
0%
10%
20%
30%
40%
50%
60%
70%
2010 2011 2012 2013 2014
Growth - Funds raised by type of investor
2010–2014 - Incremental amount raised during the year - % of total amount
Source: EVCA / PEREP_Analytics
2014 European Private Equity Activity 19
0%5%
10%15%20%25%30%35%40%
Academic inst. / Endowments / Foundations
Banks
Capital markets
Corporate investors
Family offices & Private individuals
Fund of funds & Other asset managers
Government agencies
Insurance companies
Pension funds
Sovereign wealth funds

Divestments Investments FUNDRAISING
All Private Equity - Fundraising geographic breakdown
2014 (2013) - Source of funds - % of total amount
Source: EVCA / PEREP_Analytics
10.4% (11.1%)
24.3% (14.2%)
0.2% (0.2%)
Rest of world
2.0% (3.8%)
Australia
Asia
10.6% (15.5%)
North America
27.7% (35.7%)
Unclassified Europe
4.8% (7.2%)
9.2% (5.8%)
2.3% (1.5%)
8.6% (5.2%)
2014 European Private Equity Activity 20
Divestments Investments FUNDRAISING
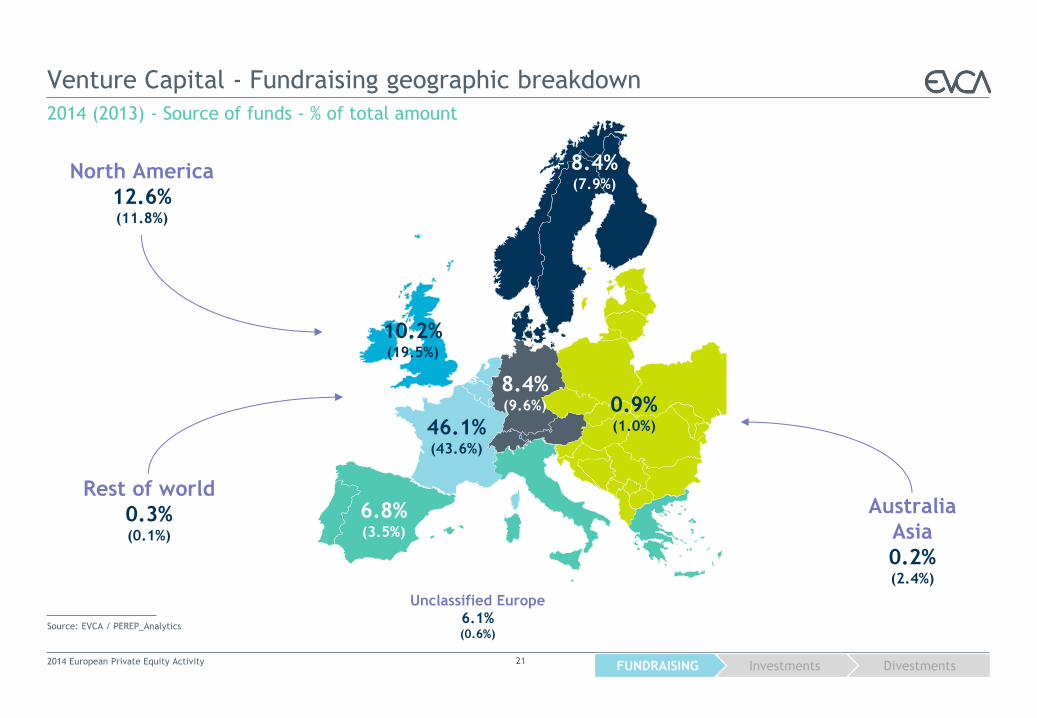
Venture Capital - Fundraising geographic breakdown
2014 (2013) - Source of funds - % of total amount
Source: EVCA / PEREP_Analytics
10.2% (19.5%)
46.1% (43.6%)
0.9% (1.0%)
Rest of world
0.3% (0.1%)
Australia
Asia
0.2% (2.4%)
North America
12.6% (11.8%)
8.4% (9.6%)
6.8% (3.5%)
8.4% (7.9%)
Unclassified Europe
6.1% (0.6%)
2014 European Private Equity Activity 21
Divestments Investments FUNDRAISING
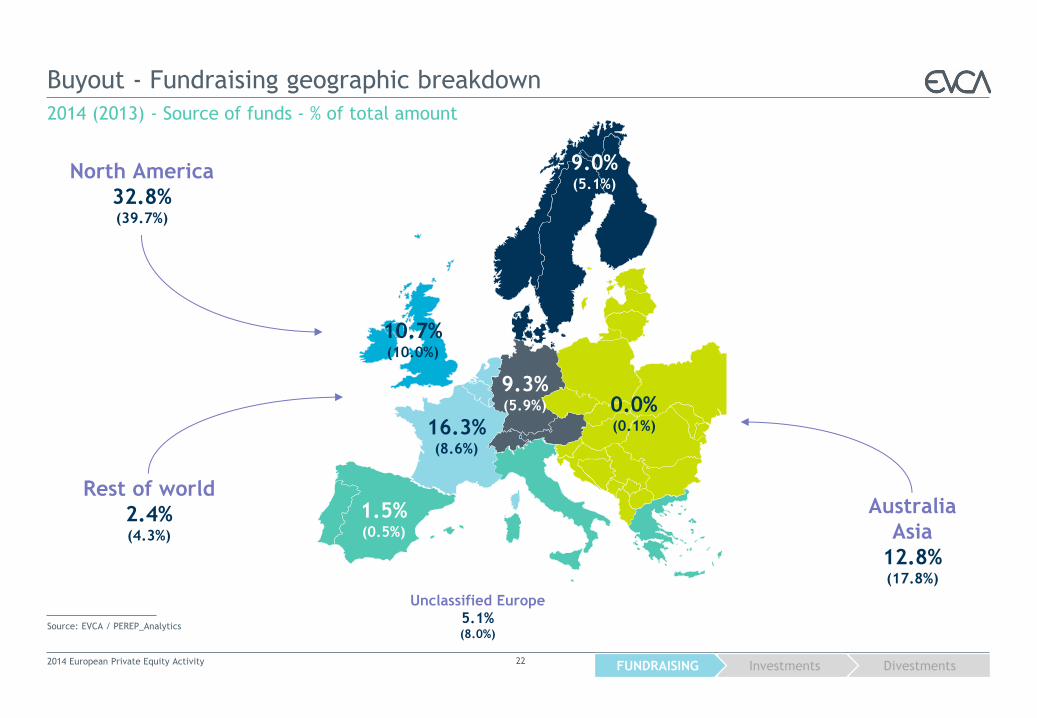
Buyout - Fundraising geographic breakdown
2014 (2013) - Source of funds - % of total amount
Source: EVCA / PEREP_Analytics
10.7% (10.0%)
16.3% (8.6%)
0.0% (0.1%)
Rest of world
2.4% (4.3%)
Australia
Asia
12.8% (17.8%)
North America
32.8% (39.7%)
9.3% (5.9%)
1.5% (0.5%)
9.0% (5.1%)
Unclassified Europe
5.1% (8.0%)
2014 European Private Equity Activity 22
Divestments Investments FUNDRAISING
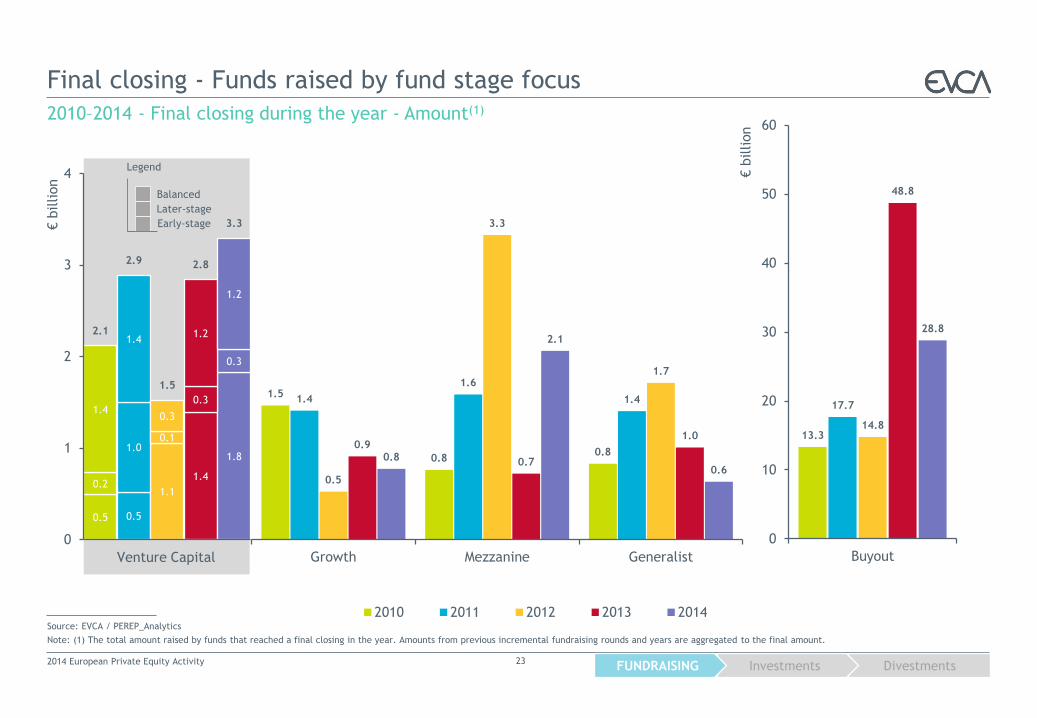
0.5 0.5
1.1
1.4
1.8
0.2
1.0 0.1
0.3
0.3
1.4
1.4
0.3
1.2
1.2
2.1
2.9
1.5
2.8
3.3
0
1
2
3
4
€ b
illion
Venture Capital
Balanced
Later-stage
Early-stage
Legend
Final closing - Funds raised by fund stage focus
2010–2014 - Final closing during the year - Amount(1)
Source: EVCA / PEREP_Analytics
Note: (1) The total amount raised by funds that reached a final closing in the year. Amounts from previous incremental fundraising rounds and years are aggregated to the final amount.
2014 European Private Equity Activity 23
1.5
0.8 0.8
1.4
1.6
1.4
0.5
3.3
1.7
0.9
0.7
1.0
0.8
2.1
0.6
Growth Mezzanine Generalist
2010 2011 2012 2013 2014
13.3
17.7
14.8
48.8
28.8
0
10
20
30
40
50
60
Buyout
€ b
illion
Divestments Investments FUNDRAISING
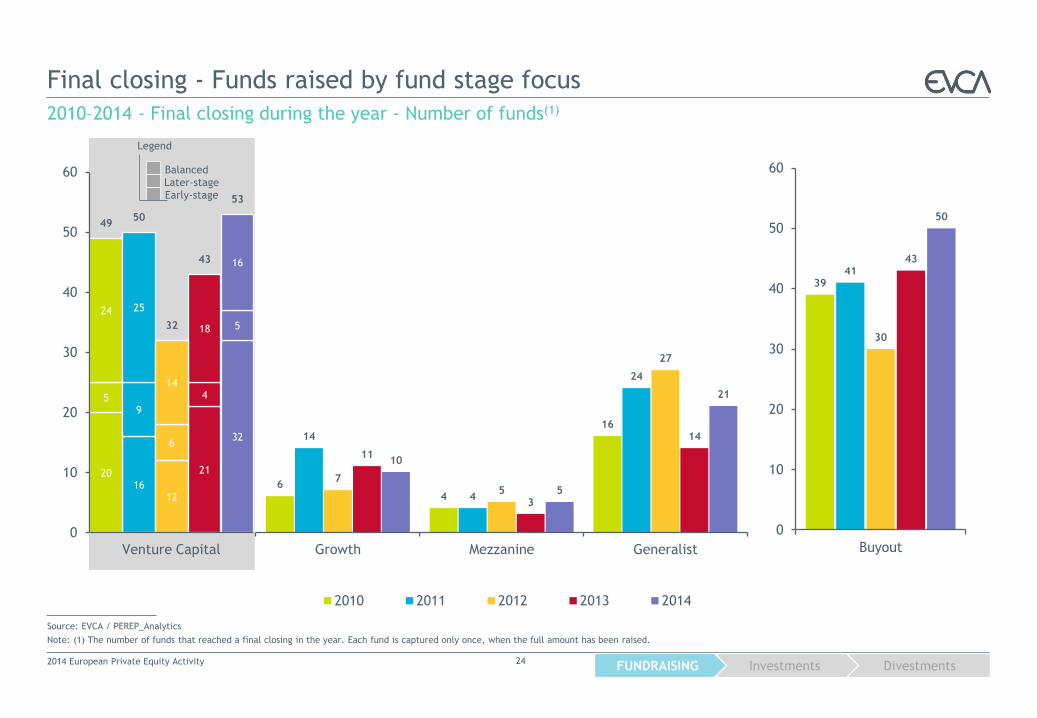
39 41
30
43
50
0
10
20
30
40
50
60
Buyout
20 16
12
21
32
5 9
6
4
5
24 25
14
18
16
49 50
32
43
53
0
10
20
30
40
50
60
Venture Capital
Balanced
Later-stage
Early-stage
Legend
Final closing - Funds raised by fund stage focus
2010–2014 - Final closing during the year - Number of funds(1)
Source: EVCA / PEREP_Analytics
Note: (1) The number of funds that reached a final closing in the year. Each fund is captured only once, when the full amount has been raised.
2014 European Private Equity Activity 24
6 4
16 14
4
24
7 5
27
11
3
14
10
5
21
Growth Mezzanine Generalist
2010 2011 2012 2013 2014
Divestments Investments FUNDRAISING
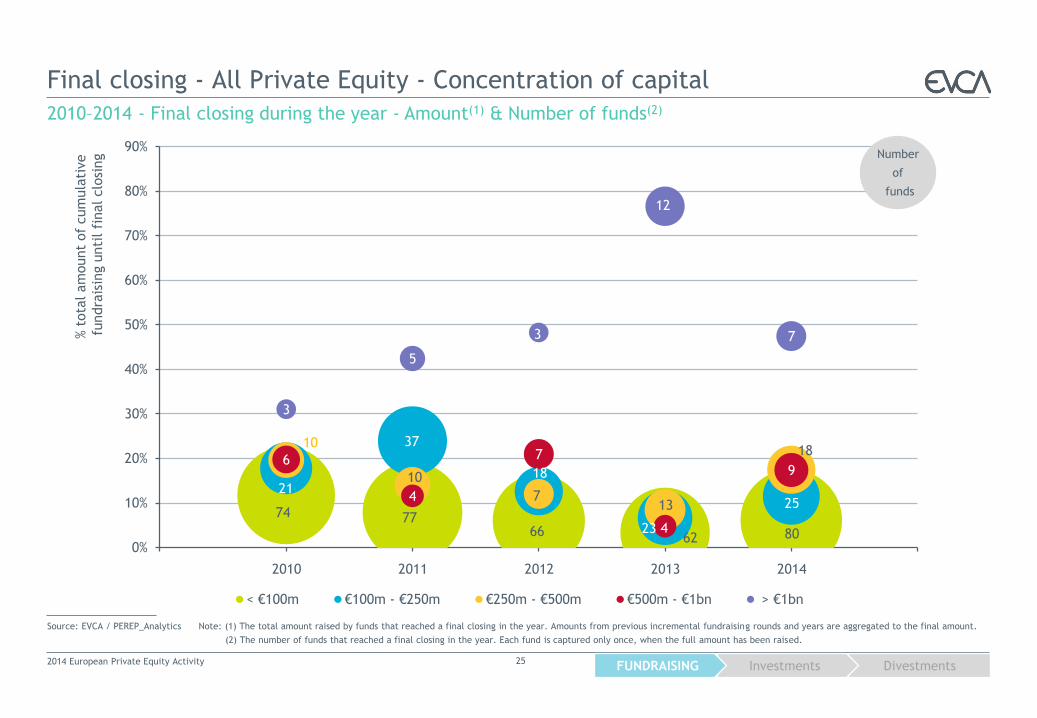
Final closing - All Private Equity - Concentration of capital
2010–2014 - Final closing during the year - Amount(1) & Number of funds(2)
Source: EVCA / PEREP_Analytics Note: (1) The total amount raised by funds that reached a final closing in the year. Amounts from previous incremental fundraising rounds and years are aggregated to the final amount.
(2) The number of funds that reached a final closing in the year. Each fund is captured only once, when the full amount has been raised.
% t
ota
l am
ount
of
cum
ula
tive
fundra
isin
g u
nti
l fi
nal clo
sing
2014 European Private Equity Activity 25
74 77 66 62 80
21
37
18
23
25
10
10
7 13
18 6
4
7
4
9
3
5
3
12
7
0%
10%
20%
30%
40%
50%
60%
70%
80%
90%
< €100m €100m - €250m €250m - €500m €500m - €1bn > €1bn
2014 2010 2011 2012 2013
Number
of
funds
Investments
2 Investments statistics explained
Industry statistics are an aggregation of figures according to the country of
the private equity firm’s office in charge of the investment. At European level,
this relates to investments made by European private equity firms regardless
of the location of the portfolio company.
Market statistics are an aggregation of figures according to the location of the
portfolio company. At European level, this relates to investments in European
companies regardless of the location of the private equity firm.
Equity value: The amount of capital invested to acquire shares in an
enterprise. The equity value includes equity, quasi-equity, mezzanine,
unsecured debt and secured debt provided by the private equity firm.
The funds included in the statistics are: private equity funds making direct
private equity investments, mezzanine private equity funds, co-investment
funds and rescue/turnaround funds.
The following funds are excluded from the statistics: infrastructure funds,
real estate funds, distressed debt funds, primary funds of funds, secondary
funds of funds.
2014 European Private Equity Activity 26
For more data visit www.evca.eu/research
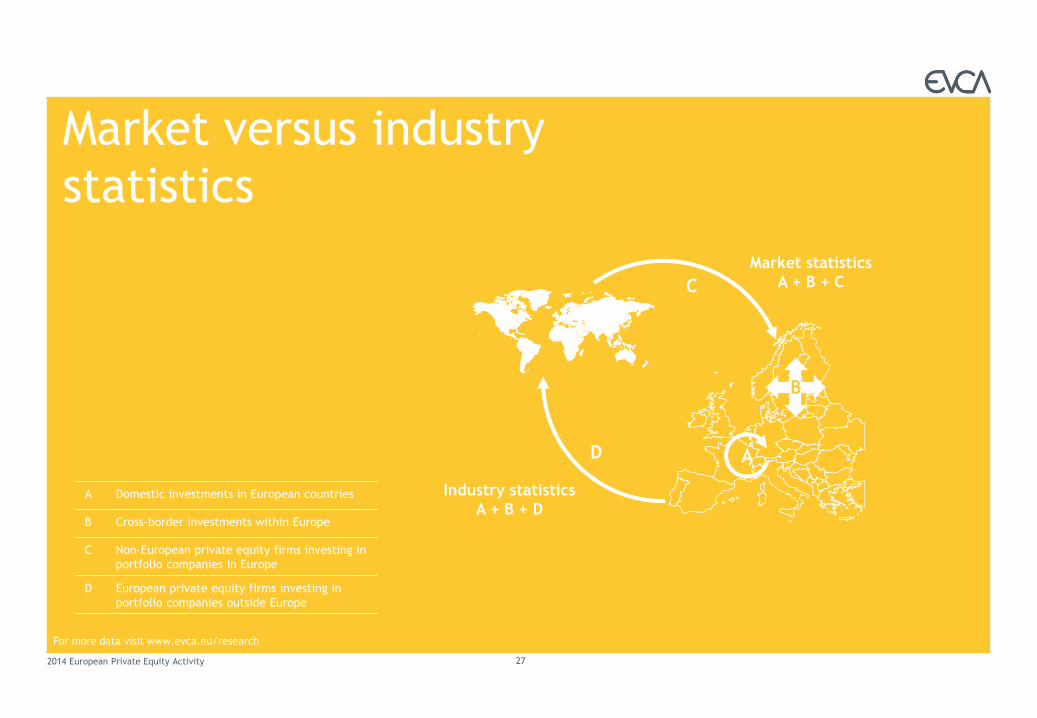
Market versus industry
statistics
2014 European Private Equity Activity 27
For more data visit www.evca.eu/research
B
C
D A
Market statistics
A + B + C
Industry statistics
A + B + D A Domestic investments in European countries
B Cross-border investments within Europe
C Non-European private equity firms investing in
portfolio companies in Europe
D European private equity firms investing in
portfolio companies outside Europe
Glossary
Venture Capital
Seed
Financing provided to research, assess and develop an initial concept before
a business has reached the start-up phase.
Start-up
Financing provided to companies for product development and initial
marketing. Companies may be in the process of being set up or may have
been in business for a short time, but have not sold their product
commercially.
Later-stage venture
Financing provided for the expansion of an operating company, which may or
may not be breaking even or trading profitably. Later-stage venture tends to
finance companies already backed by venture capital firms.
Growth
A type of private equity investment – most often a minority investment but
not necessarily – in relatively mature companies that are looking for capital
to expand operations, restructure operations or enter new markets.
Buyout
Financing provided to acquire a company. It may use a significant amount of
borrowed money to meet the cost of acquisition.
Rescue/Turnaround
Financing made available to an existing business, which has experienced
trading difficulties, with a view to re-establishing prosperity.
Replacement capital
The purchase of a minority stake of existing shares in a company from
another private equity firm or from another shareholder or shareholders.
2014 European Private Equity Activity 28
Divestments INVESTMENTS Fundraising
2014 Investments at a glance
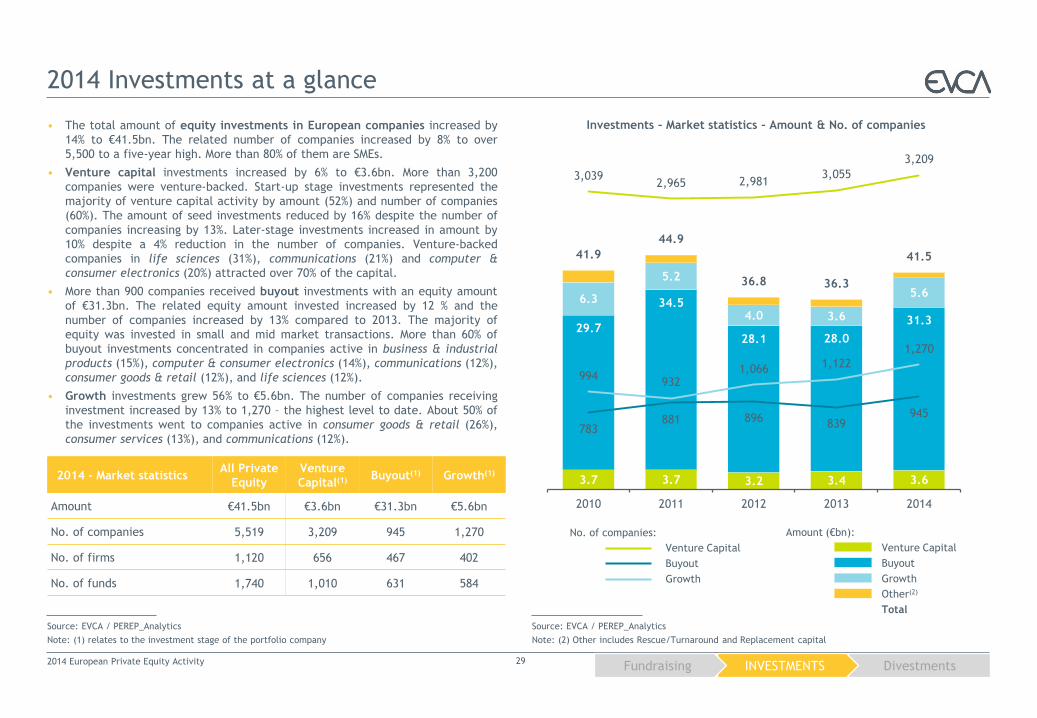
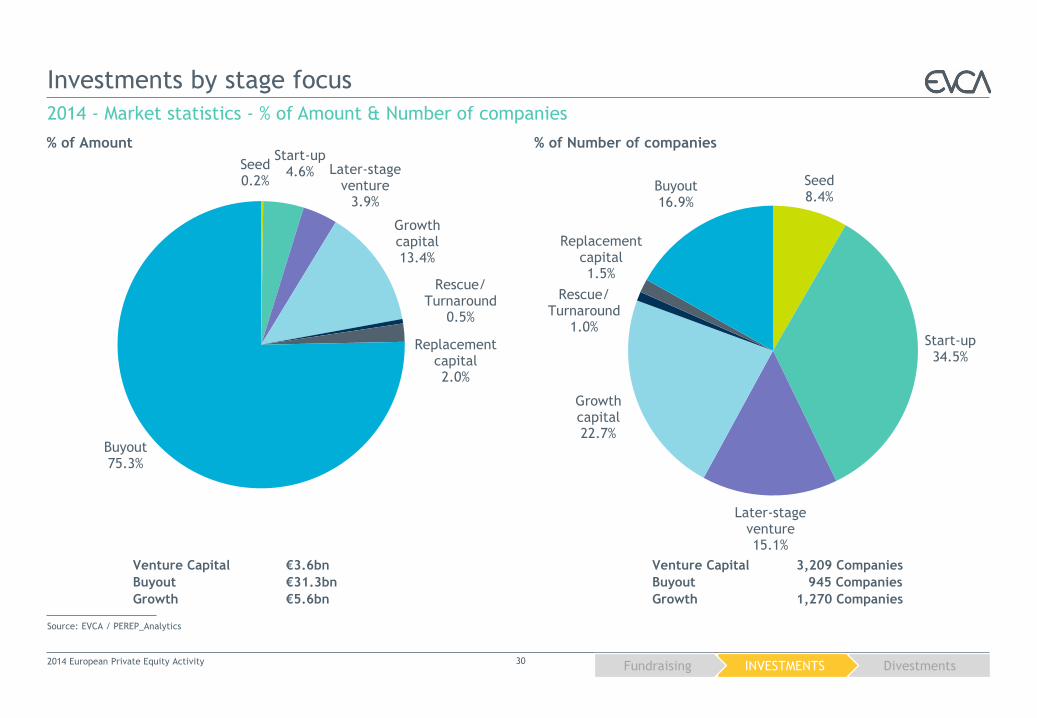
• The total amount of equity investments in European companies increased by
14% to €41.5bn. The related number of companies increased by 8% to over
5,500 to a five-year high. More than 80% of them are SMEs.
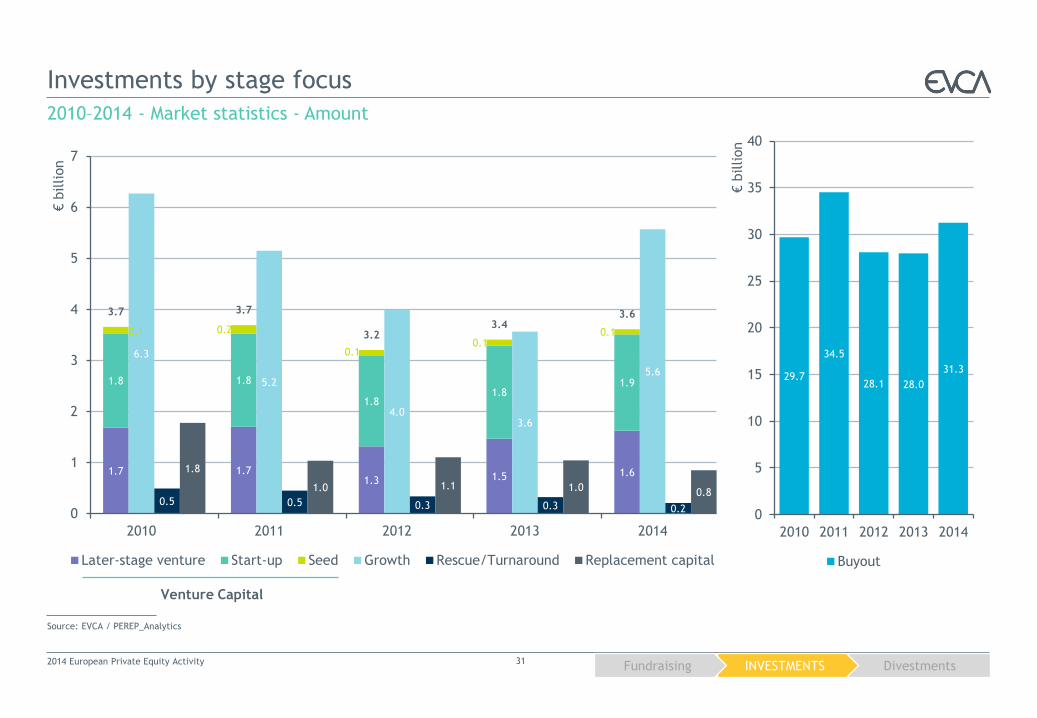
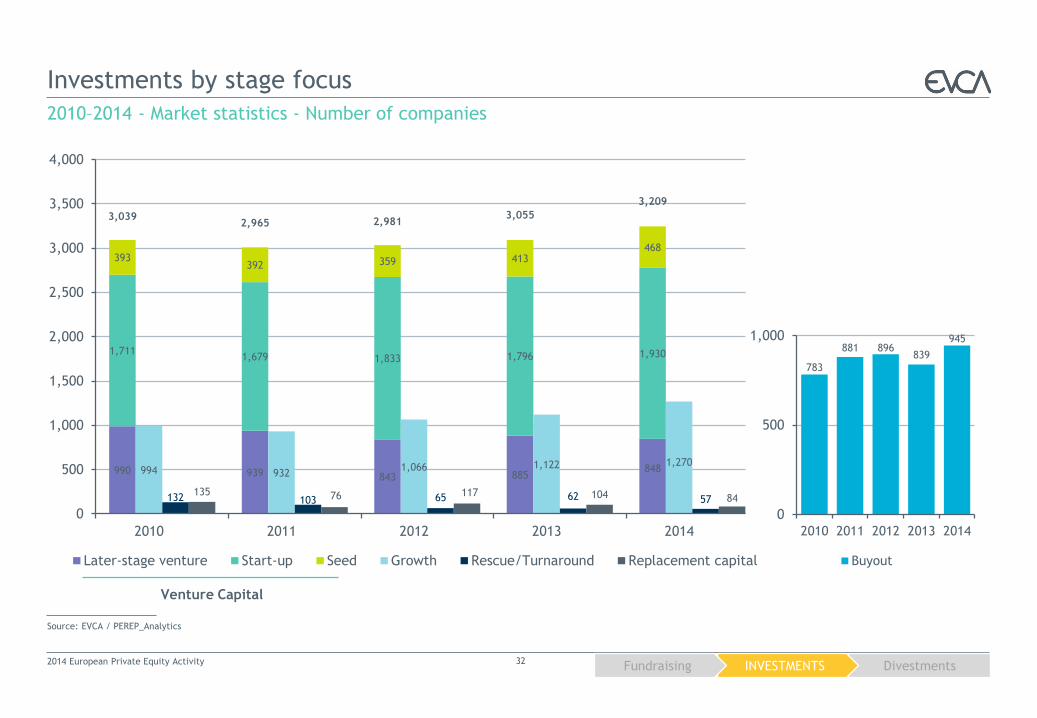
• Venture capital investments increased by 6% to €3.6bn. More than 3,200
companies were venture-backed. Start-up stage investments represented the
majority of venture capital activity by amount (52%) and number of companies
(60%). The amount of seed investments reduced by 16% despite the number of
companies increasing by 13%. Later-stage investments increased in amount by
10% despite a 4% reduction in the number of companies. Venture-backed
companies in life sciences (31%), communications (21%) and computer &
consumer electronics (20%) attracted over 70% of the capital.
• More than 900 companies received buyout investments with an equity amount
of €31.3bn. The related equity amount invested increased by 12 % and the
number of companies increased by 13% compared to 2013. The majority of
equity was invested in small and mid market transactions. More than 60% of
buyout investments concentrated in companies active in business & industrial
products (15%), computer & consumer electronics (14%), communications (12%),
consumer goods & retail (12%), and life sciences (12%).
• Growth investments grew 56% to €5.6bn. The number of companies receiving
investment increased by 13% to 1,270 – the highest level to date. About 50% of
the investments went to companies active in consumer goods & retail (26%),
consumer services (13%), and communications (12%).
2014 - Market statistics All Private
Equity
Venture
Capital(1) Buyout(1) Growth(1)
Amount €41.5bn €3.6bn €31.3bn €5.6bn
No. of companies 5,519 3,209 945 1,270
No. of firms 1,120 656 467 402
No. of funds 1,740 1,010 631 584
Investments – Market statistics – Amount & No. of companies
2014 European Private Equity Activity 29
Source: EVCA / PEREP_Analytics
Note: (1) relates to the investment stage of the portfolio company
Source: EVCA / PEREP_Analytics
Note: (2) Other includes Rescue/Turnaround and Replacement capital
No. of companies:
Venture Capital
Buyout
Growth
Amount (€bn):
Venture Capital
Buyout
Growth
Other(2)
Total
3.7 3.7 3.2 3.4 3.6
29.7
34.5
28.1 28.0
31.3
6.3
5.2
4.0 3.6
5.6
41.9
44.9
36.8 36.3
41.5
783 881 896 839
945
994 932
1,066 1,122
1,270
3,039 2,965 2,981
3,055
3,209
2010 2011 2012 2013 2014
Divestments INVESTMENTS Fundraising
Seed 8.4%
Start-up 34.5%
Later-stage venture 15.1%
Growth capital 22.7%
Rescue/ Turnaround
1.0%
Replacement capital 1.5%
Buyout 16.9%
Seed 0.2%
Start-up 4.6% Later-stage
venture 3.9%
Growth capital 13.4%
Rescue/ Turnaround
0.5%
Replacement capital 2.0%
Buyout 75.3%
Investments by stage focus
2014 - Market statistics - % of Amount & Number of companies
Source: EVCA / PEREP_Analytics
% of Amount % of Number of companies
Venture Capital €3.6bn
Buyout €31.3bn
Growth €5.6bn
Venture Capital 3,209 Companies
Buyout 945 Companies
Growth 1,270 Companies
2014 European Private Equity Activity 30
Divestments INVESTMENTS Fundraising
29.7
34.5
28.1 28.0
31.3
0
5
10
15
20
25
30
35
40
2010 2011 2012 2013 2014
€ b
illion
Buyout
1.7 1.7 1.3 1.5 1.6
1.8 1.8
1.8 1.8
1.9
0.1 0.2
0.1 0.1
0.1
6.3
5.2
4.0 3.6
5.6
0.5 0.5 0.3 0.3 0.2
1.8
1.0 1.1 1.0 0.8
3.7 3.7
3.2 3.4
3.6
0
1
2
3
4
5
6
7
2010 2011 2012 2013 2014
€ b
illion
Later-stage venture Start-up Seed Growth Rescue/Turnaround Replacement capital
Investments by stage focus
2010–2014 - Market statistics - Amount
Source: EVCA / PEREP_Analytics
Venture Capital
2014 European Private Equity Activity 31
Divestments INVESTMENTS Fundraising
783
881 896 839
945
0
500
1,000
2010 2011 2012 2013 2014
Buyout
990 939 843 885 848
1,711 1,679 1,833 1,796 1,930
393 392 359 413
468
994 932 1,066 1,122 1,270
132 103 65 62 57 135 76 117 104 84
3,039 2,965 2,981
3,055
3,209
0
500
1,000
1,500
2,000
2,500
3,000
3,500
4,000
2010 2011 2012 2013 2014
Later-stage venture Start-up Seed Growth Rescue/Turnaround Replacement capital
Investments by stage focus
2010–2014 - Market statistics - Number of companies
Source: EVCA / PEREP_Analytics
2014 European Private Equity Activity 32
Venture Capital
Divestments INVESTMENTS Fundraising
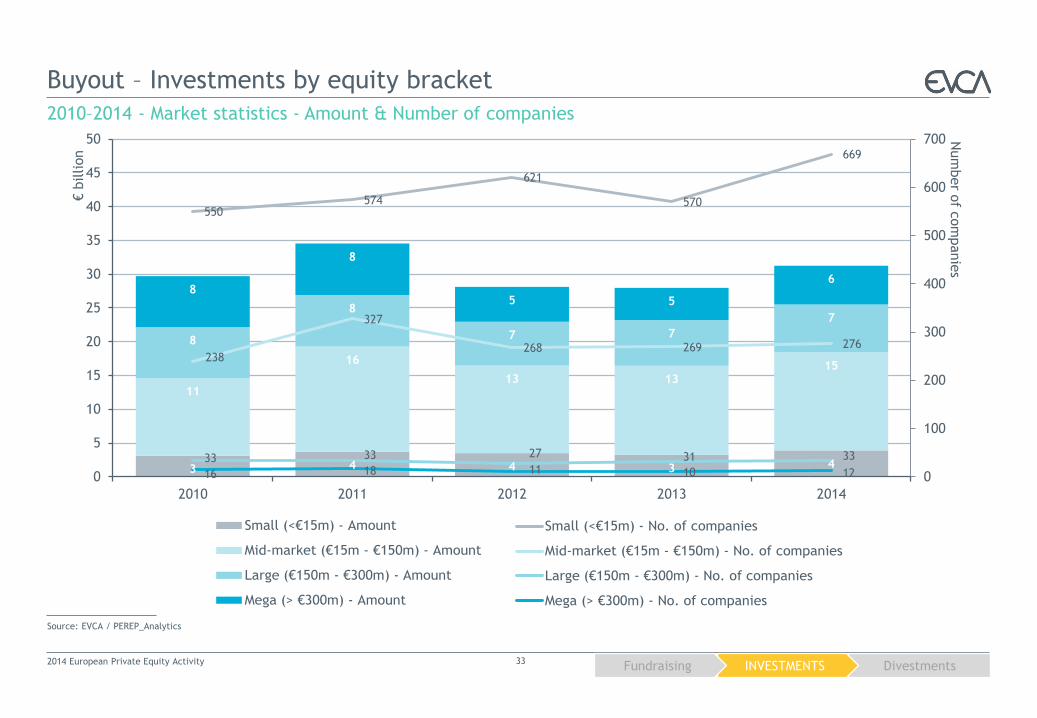
Buyout – Investments by equity bracket
2010–2014 - Market statistics - Amount & Number of companies
Source: EVCA / PEREP_Analytics
2014 European Private Equity Activity 33
6 52
3 4 4 3
24
18
6
1116
13 13
12
7
2
88
7 7
15
9
2
88
5 5
886816
493550 574
621547
438378
128
238
327268 263
50 29 8 33 33 27 3230 18 4 16 18 11 10 0
100
200
300
400
500
600
700
800
900
0
10
20
30
40
50
60
2007 2008 2009 2010 2011 2012 2013
Num
ber o
f com
panie
s
€billion
Small (<€15m) - Amount
Mid-market (€15m - €150m) - Amount
Large (€150m - €300m) - Amount
Mega (> €300m) - Amount
Small (<€15m) - No. of companies
Mid-market (€15m - €150m) - No. of companies
Large (€150m - €300m) - No. of companies
Mega (> €300m) - No. of companies
3 4 4 3 4
11
16
13 13 15
8
8
7 7
7
8
8
5 5
6
550 574
621
570
669
238
327
268 269 276
33 33 27 31 33
16 18 11 10 12 0
100
200
300
400
500
600
700
0
5
10
15
20
25
30
35
40
45
50
2010 2011 2012 2013 2014
Num
ber o
f com
panie
s € b
illion
Divestments INVESTMENTS Fundraising
0
2
4
6
8
10
12
Q1 Q2 Q3 Q4 Q1 Q2 Q3 Q4 Q1 Q2 Q3 Q4 Q1 Q2 Q3 Q4 Q1 Q2 Q3 Q4
€ b
illion
Venture Capital Buyout Growth
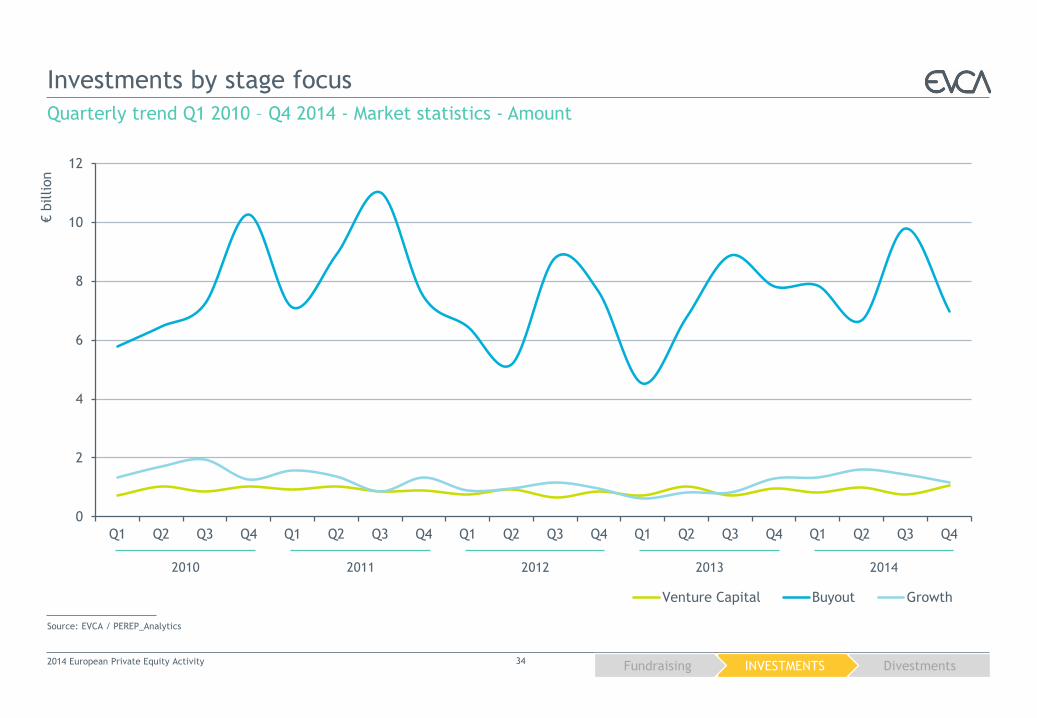
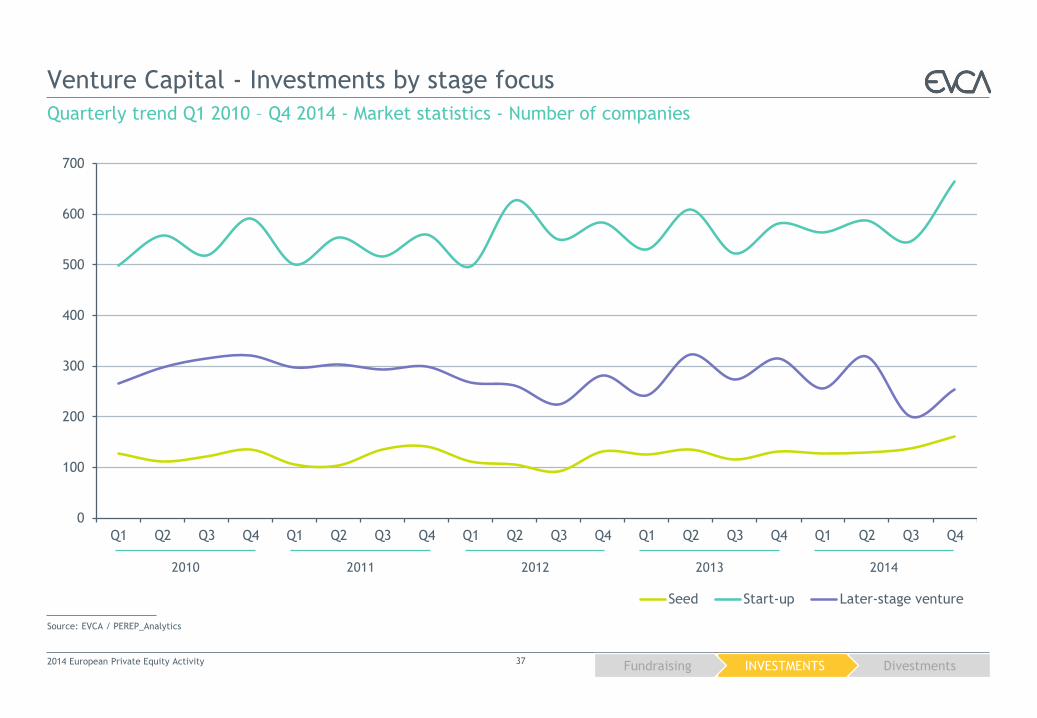
Investments by stage focus
2014 European Private Equity Activity 34
Quarterly trend Q1 2010 – Q4 2014 - Market statistics - Amount
Source: EVCA / PEREP_Analytics
2013 2010 2011 2014 2012
Divestments INVESTMENTS Fundraising
0
200
400
600
800
1,000
1,200
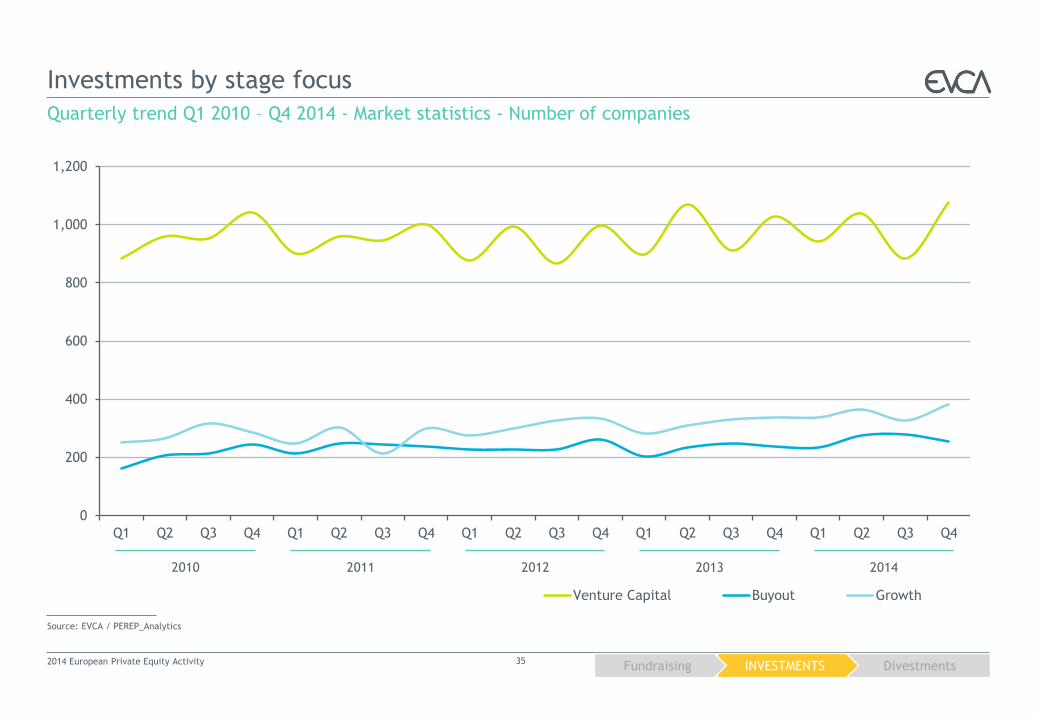
Q1 Q2 Q3 Q4 Q1 Q2 Q3 Q4 Q1 Q2 Q3 Q4 Q1 Q2 Q3 Q4 Q1 Q2 Q3 Q4
Venture Capital Buyout Growth
Investments by stage focus
Quarterly trend Q1 2010 – Q4 2014 - Market statistics - Number of companies
Source: EVCA / PEREP_Analytics
35 2014 European Private Equity Activity
2013 2010 2011 2014 2012
Divestments INVESTMENTS Fundraising
0.0
0.1
0.2
0.3
0.4
0.5
0.6
0.7
Q1 Q2 Q3 Q4 Q1 Q2 Q3 Q4 Q1 Q2 Q3 Q4 Q1 Q2 Q3 Q4 Q1 Q2 Q3 Q4
€ b
illion
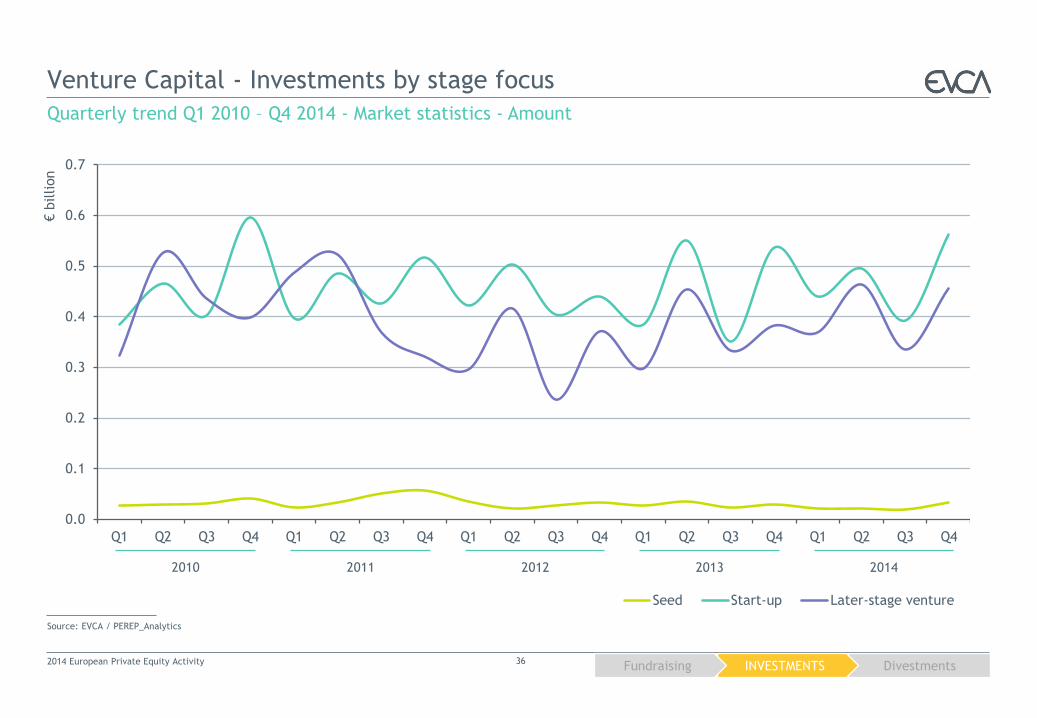
Seed Start-up Later-stage venture
Quarterly trend Q1 2010 – Q4 2014 - Market statistics - Amount
Venture Capital - Investments by stage focus
Source: EVCA / PEREP_Analytics
36 2014 European Private Equity Activity
2013 2010 2011 2014 2012
Divestments INVESTMENTS Fundraising
0
100
200
300
400
500
600
700
Q1 Q2 Q3 Q4 Q1 Q2 Q3 Q4 Q1 Q2 Q3 Q4 Q1 Q2 Q3 Q4 Q1 Q2 Q3 Q4
Seed Start-up Later-stage venture
Venture Capital - Investments by stage focus
Quarterly trend Q1 2010 – Q4 2014 - Market statistics - Number of companies
Source: EVCA / PEREP_Analytics
2014 European Private Equity Activity 37
2013 2010 2011 2014 2012
Divestments INVESTMENTS Fundraising
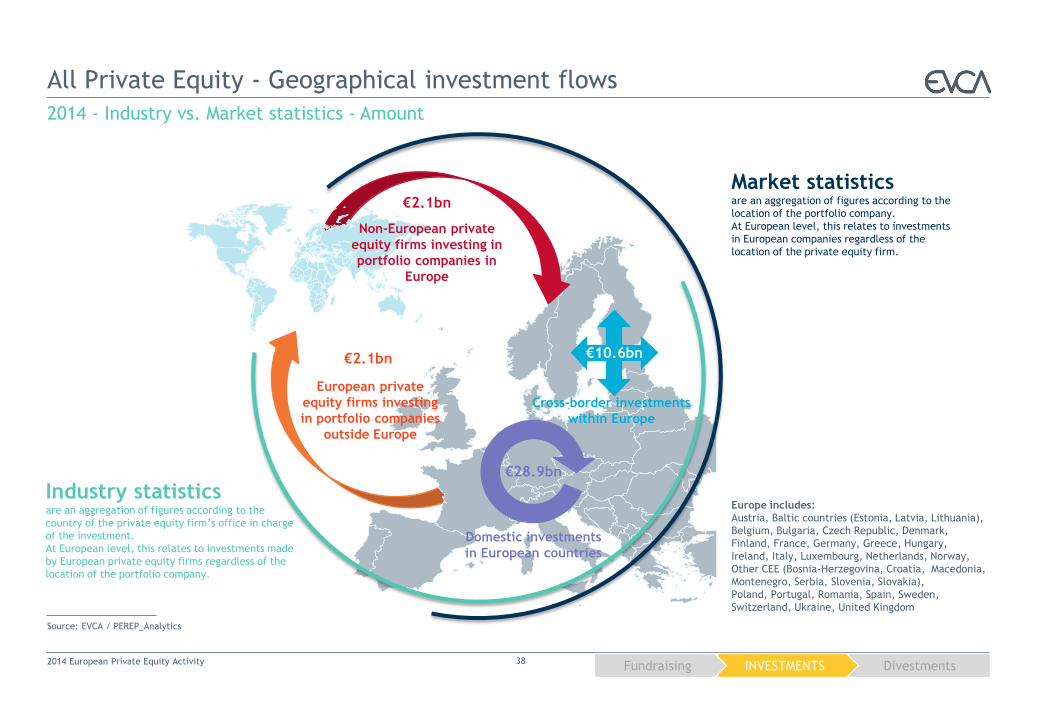
All Private Equity - Geographical investment flows
2014 - Industry vs. Market statistics - Amount
Source: EVCA / PEREP_Analytics
€10.6bn
€28.9bn
€2.1bn
€2.1bn
European private
equity firms investing
in portfolio companies
outside Europe
Cross-border investments
within Europe
Domestic investments
in European countries
Market statistics are an aggregation of figures according to the
location of the portfolio company.
At European level, this relates to investments
in European companies regardless of the
location of the private equity firm.
Industry statistics are an aggregation of figures according to the
country of the private equity firm’s office in charge
of the investment.
At European level, this relates to investments made
by European private equity firms regardless of the
location of the portfolio company.
Non-European private
equity firms investing in
portfolio companies in
Europe
Europe includes:
Austria, Baltic countries (Estonia, Latvia, Lithuania),
Belgium, Bulgaria, Czech Republic, Denmark,
Finland, France, Germany, Greece, Hungary,
Ireland, Italy, Luxembourg, Netherlands, Norway,
Other CEE (Bosnia-Herzegovina, Croatia, Macedonia,
Montenegro, Serbia, Slovenia, Slovakia),
Poland, Portugal, Romania, Spain, Sweden,
Switzerland, Ukraine, United Kingdom
2014 European Private Equity Activity 38
Divestments INVESTMENTS Fundraising
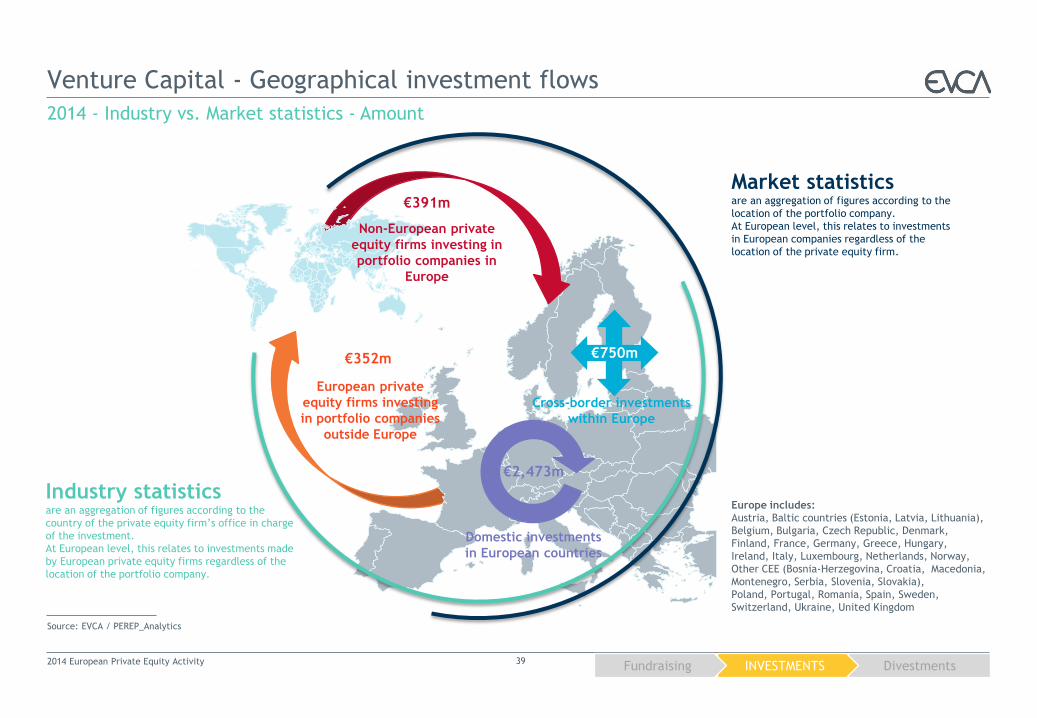
Venture Capital - Geographical investment flows
2014 - Industry vs. Market statistics - Amount
Source: EVCA / PEREP_Analytics
€750m
€2,473m
€391m
€352m
European private
equity firms investing
in portfolio companies
outside Europe
Cross-border investments
within Europe
Domestic investments
in European countries
Non-European private
equity firms investing in
portfolio companies in
Europe
Market statistics are an aggregation of figures according to the
location of the portfolio company.
At European level, this relates to investments
in European companies regardless of the
location of the private equity firm.
Industry statistics are an aggregation of figures according to the
country of the private equity firm’s office in charge
of the investment.
At European level, this relates to investments made
by European private equity firms regardless of the
location of the portfolio company.
2014 European Private Equity Activity 39
Europe includes:
Austria, Baltic countries (Estonia, Latvia, Lithuania),
Belgium, Bulgaria, Czech Republic, Denmark,
Finland, France, Germany, Greece, Hungary,
Ireland, Italy, Luxembourg, Netherlands, Norway,
Other CEE (Bosnia-Herzegovina, Croatia, Macedonia,
Montenegro, Serbia, Slovenia, Slovakia),
Poland, Portugal, Romania, Spain, Sweden,
Switzerland, Ukraine, United Kingdom
Divestments INVESTMENTS Fundraising
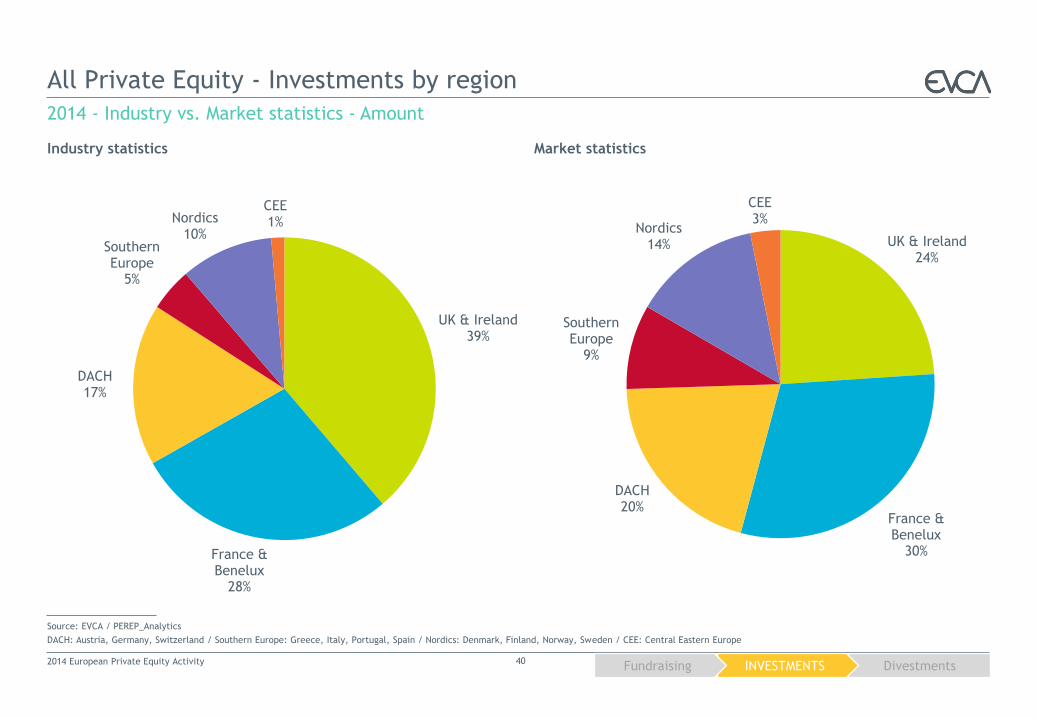
UK & Ireland 24%
France & Benelux
30%
DACH 20%
Southern Europe
9%
Nordics 14%
CEE 3%
UK & Ireland 39%
France & Benelux
28%
DACH 17%
Southern Europe
5%
Nordics 10%
CEE 1%
All Private Equity - Investments by region
2014 - Industry vs. Market statistics - Amount
Source: EVCA / PEREP_Analytics
DACH: Austria, Germany, Switzerland / Southern Europe: Greece, Italy, Portugal, Spain / Nordics: Denmark, Finland, Norway, Sweden / CEE: Central Eastern Europe
Industry statistics Market statistics
2014 European Private Equity Activity 40
Divestments INVESTMENTS Fundraising
7.3
9.7
6.3
2.4
4.5
0.9
0
1
2
3
4
5
6
7
8
9
10
€ b
illion
Buyout
0.5 0.4
0.3
0.1
0.3
0.0
0.4 0.5
0.5
0.1
0.3
0.0
0.0 0.0 0.0
0.0
0.0
0.0
1.5
1.7
0.8
1.0
0.4 0.2
0.1 0.0
0.0 0.0 0.0 0.0
0.1
0.2
0.4
0.1 0.1 0.0
0.9 0.9 0.9
0.2
0.6
0.1
0.0
0.2
0.4
0.6
0.8
1.0
1.2
1.4
1.6
1.8
UK & Ireland France & Benelux DACH Southern Europe Nordics CEE
€ b
illion
Later-stage venture Start-up Seed Growth Rescue/Turnaround Replacement capital
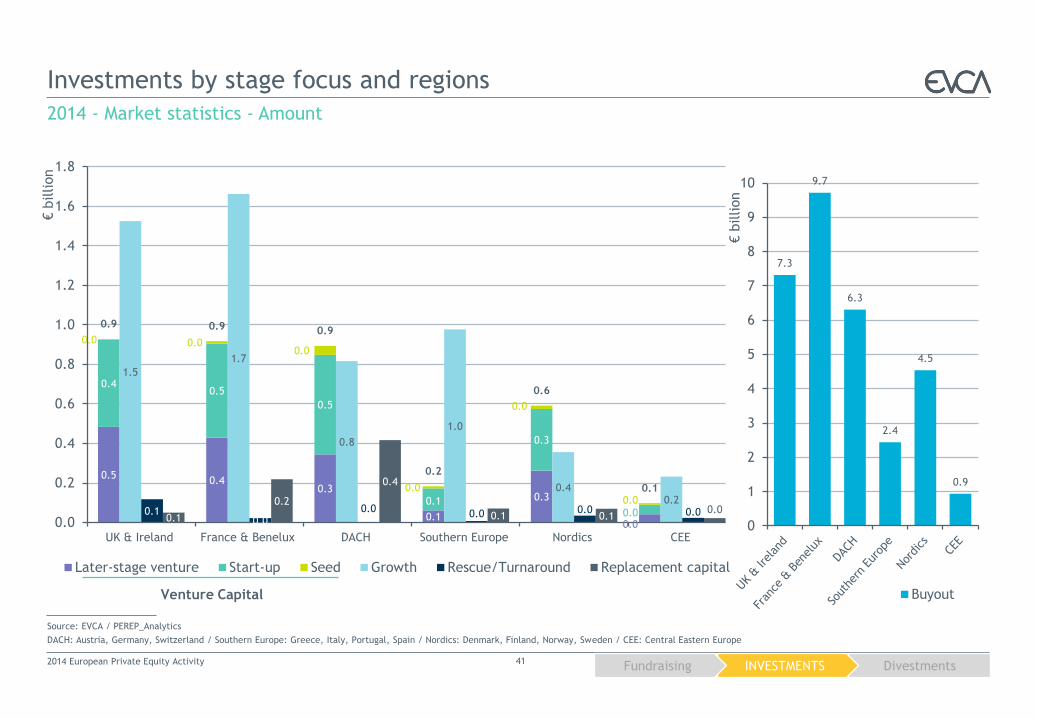
Investments by stage focus and regions
2014 - Market statistics - Amount
Source: EVCA / PEREP_Analytics
DACH: Austria, Germany, Switzerland / Southern Europe: Greece, Italy, Portugal, Spain / Nordics: Denmark, Finland, Norway, Sweden / CEE: Central Eastern Europe
2014 European Private Equity Activity 41
Venture Capital
Divestments INVESTMENTS Fundraising
186
350
152
94
133
30
0
100
200
300
400
Buyout
148
241
171
42
184
62
268
433 537
149
437
106
17
59
217
40
90
45
141
401
516
91 76 45 8 14 13
2 16 4 7
39 15 10 11 2
427
729
911
230
702
210
0
100
200
300
400
500
600
700
800
900
1,000
UK & Ireland France & Benelux DACH SouthernEurope
Nordics CEE
Later-stage venture Start-up Seed Growth Rescue/Turnaround Replacement capital
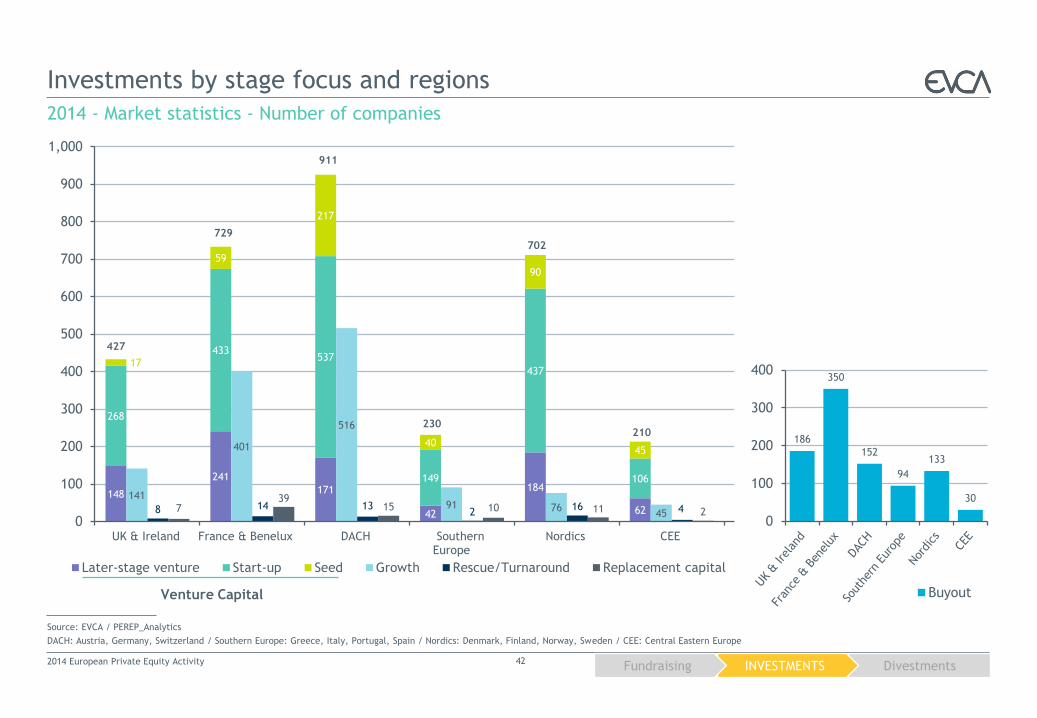
Investments by stage focus and regions
2014 - Market statistics - Number of companies
Source: EVCA / PEREP_Analytics
DACH: Austria, Germany, Switzerland / Southern Europe: Greece, Italy, Portugal, Spain / Nordics: Denmark, Finland, Norway, Sweden / CEE: Central Eastern Europe
2014 European Private Equity Activity 42
Venture Capital
Divestments INVESTMENTS Fundraising
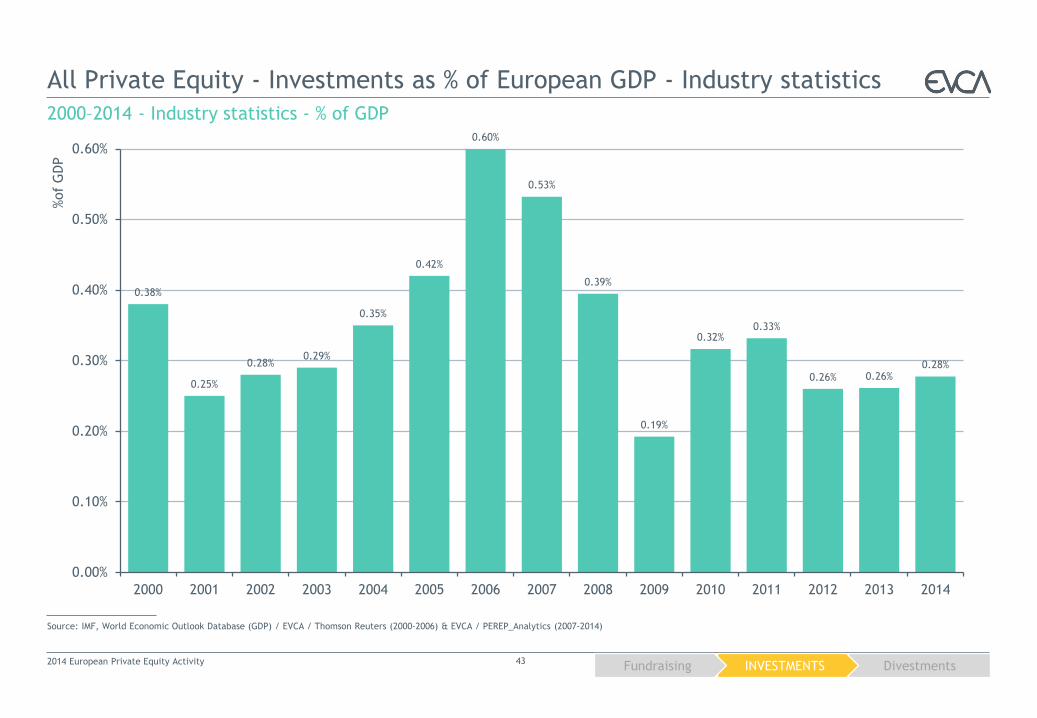
0.38%
0.25%
0.28% 0.29%
0.35%
0.42%
0.60%
0.53%
0.39%
0.19%
0.32% 0.33%
0.26% 0.26% 0.28%
0.00%
0.10%
0.20%
0.30%
0.40%
0.50%
0.60%
2000 2001 2002 2003 2004 2005 2006 2007 2008 2009 2010 2011 2012 2013 2014
%of
GD
P
All Private Equity - Investments as % of European GDP - Industry statistics
2000–2014 - Industry statistics - % of GDP
Source: IMF, World Economic Outlook Database (GDP) / EVCA / Thomson Reuters (2000-2006) & EVCA / PEREP_Analytics (2007-2014)
2014 European Private Equity Activity 43
Divestments INVESTMENTS Fundraising
0.7
20%
0.4
23%
0.3
72%
0.3
41%
0.2
88%
0.2
78%
0.2
78%
0.2
58%
0.2
31%
0.2
01%
0.1
64%
0.1
42%
0.1
40%
0.0
97%
0.0
90%
0.0
82%
0.0
74%
0.0
45%
0.0
32%
0.0
30%
0.0
29%
0.0
26%
0.0
09%
0.0
04%
0.0
03%
0.0
00%
0.000%
0.200%
0.400%
0.600%
0.800%
1.000%
% o
f G
DP
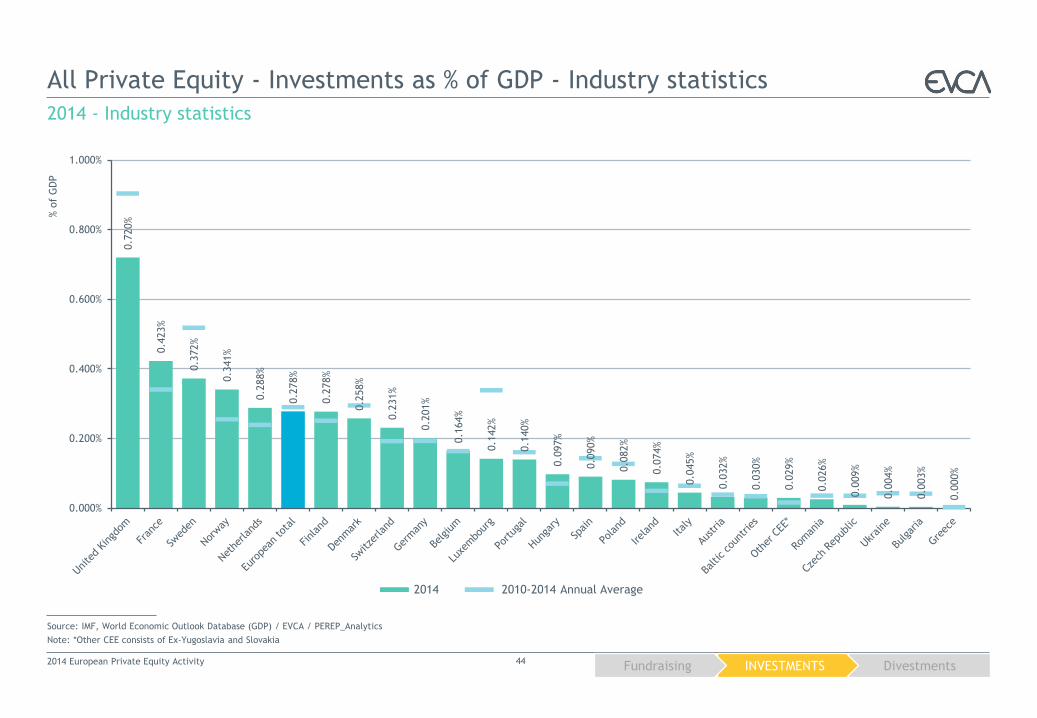
All Private Equity - Investments as % of GDP - Industry statistics
2014 - Industry statistics
Source: IMF, World Economic Outlook Database (GDP) / EVCA / PEREP_Analytics
Note: *Other CEE consists of Ex-Yugoslavia and Slovakia
2014 European Private Equity Activity 44
2014 2010-2014 Annual Average
Divestments INVESTMENTS Fundraising
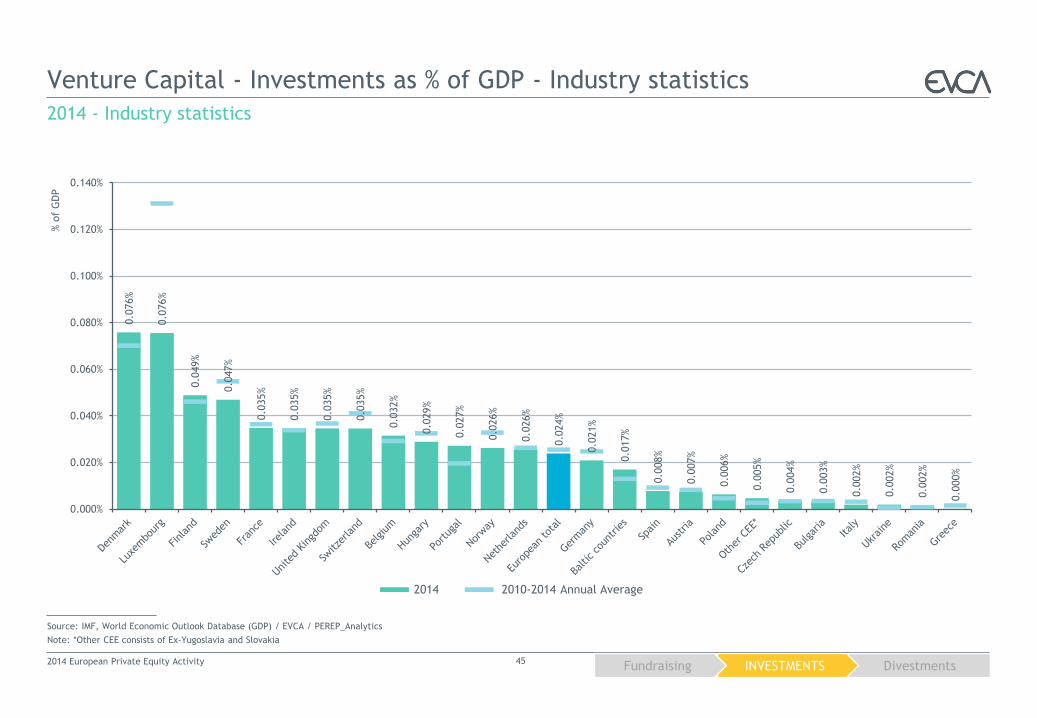
0.0
76%
0.0
76%
0.0
49%
0.0
47%
0.0
35%
0.0
35%
0.0
35%
0.0
35%
0.0
32%
0.0
29%
0.0
27%
0.0
26%
0.0
26%
0.0
24%
0.0
21%
0.0
17%
0.0
08%
0.0
07%
0.0
06%
0.0
05%
0.0
04%
0.0
03%
0.0
02%
0.0
02%
0.0
02%
0.0
00%
0.000%
0.020%
0.040%
0.060%
0.080%
0.100%
0.120%
0.140%
% o
f G
DP
Venture Capital - Investments as % of GDP - Industry statistics
2014 - Industry statistics
Source: IMF, World Economic Outlook Database (GDP) / EVCA / PEREP_Analytics
Note: *Other CEE consists of Ex-Yugoslavia and Slovakia
2014 European Private Equity Activity 45
2014 2010-2014 Annual Average
Divestments INVESTMENTS Fundraising
0.5
86%
0.3
19%
0.2
89%
0.2
49%
0.2
12%
0.2
11%
0.1
84%
0.1
66%
0.1
65%
0.1
42%
0.0
72%
0.0
71%
0.0
69%
0.0
64%
0.0
58%
0.0
26%
0.0
16%
0.0
15%
0.0
09%
0.0
06%
0.0
04%
0.0
02%
0.0
02%
0.0
00%
0.0
00%
0.0
00%
0.000%
0.100%
0.200%
0.300%
0.400%
0.500%
0.600%
0.700%
0.800%
% o
f G
DP
Buyout - Investments as % of GDP - Industry statistics
2014 - Industry statistics
Source: IMF, World Economic Outlook Database (GDP) / EVCA / PEREP_Analytics
Note: *Other CEE consists of Ex-Yugoslavia and Slovakia
2014 European Private Equity Activity 46
2014 2010-2014 Annual Average
Divestments INVESTMENTS Fundraising
0.0
87%
0.0
64%
0.0
63%
0.0
61%
0.0
56%
0.0
41%
0.0
37%
0.0
35%
0.0
28%
0.0
27%
0.0
27%
0.0
21%
0.0
17%
0.0
15%
0.0
11%
0.0
11%
0.0
10%
0.0
09%
0.0
08%
0.0
08%
0.0
07%
0.0
05%
0.0
03%
0.0
02%
0.0
00%
0.0
00%
0.000%
0.010%
0.020%
0.030%
0.040%
0.050%
0.060%
0.070%
0.080%
0.090%
0.100%
% o
f G
DP
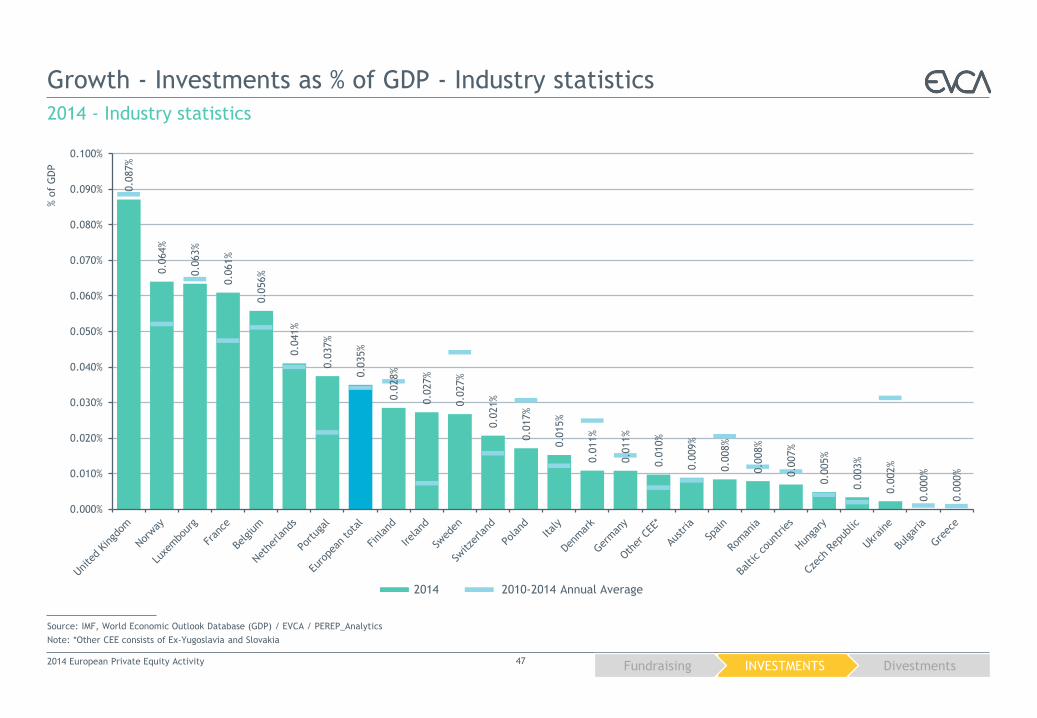
Growth - Investments as % of GDP - Industry statistics
2014 - Industry statistics
Source: IMF, World Economic Outlook Database (GDP) / EVCA / PEREP_Analytics
Note: *Other CEE consists of Ex-Yugoslavia and Slovakia
2014 European Private Equity Activity 47
2014 2010-2014 Annual Average
Divestments INVESTMENTS Fundraising
0.5
86%
0.4
87%
0.4
80%
0.4
25%
0.3
93%
0.3
50%
0.3
31%
0.2
77%
0.2
74%
0.2
47%
0.2
39%
0.1
93%
0.1
84%
0.1
84%
0.1
64%
0.1
53%
0.1
51%
0.1
41%
0.1
13%
0.0
88%
0.0
61%
0.0
60%
0.0
52%
0.0
06%
0.0
04%
0.0
00%
0.000%
0.100%
0.200%
0.300%
0.400%
0.500%
0.600%
0.700%
% o
f G
DP
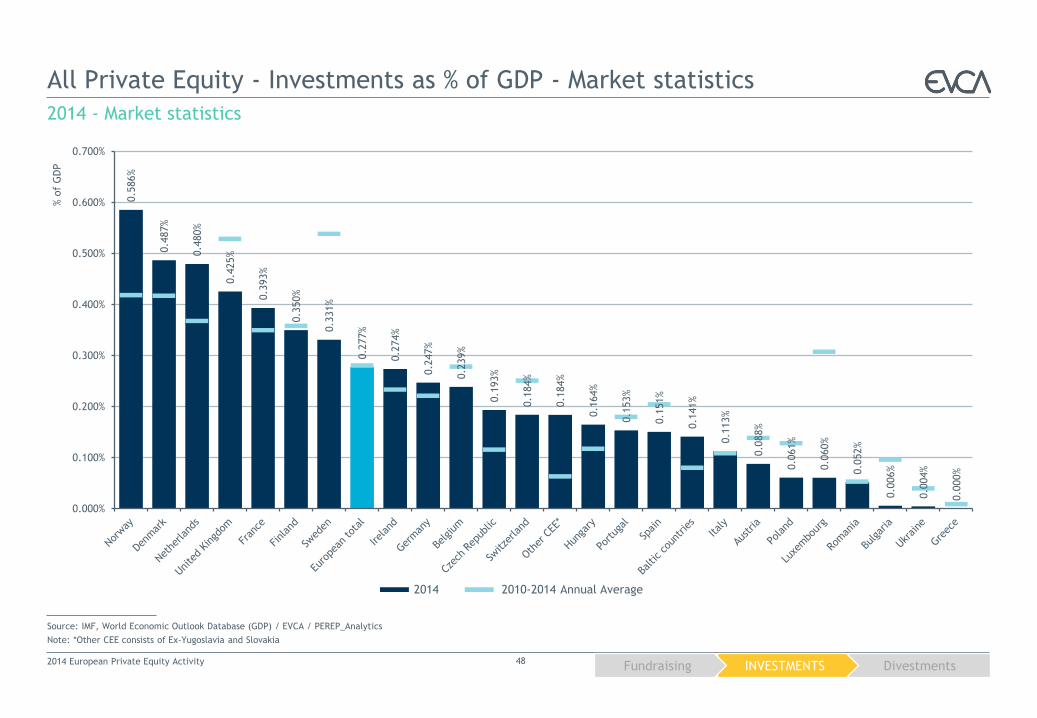
All Private Equity - Investments as % of GDP - Market statistics
2014 - Market statistics
Source: IMF, World Economic Outlook Database (GDP) / EVCA / PEREP_Analytics
Note: *Other CEE consists of Ex-Yugoslavia and Slovakia
2014 European Private Equity Activity 48
2014 2010-2014 Annual Average
Divestments INVESTMENTS Fundraising
0.0
66%
0.0
60%
0.0
49%
0.0
38%
0.0
31%
0.0
31%
0.0
31%
0.0
29%
0.0
29%
0.0
28%
0.0
26%
0.0
26%
0.0
24%
0.0
23%
0.0
22%
0.0
19%
0.0
09%
0.0
09%
0.0
06%
0.0
06%
0.0
05%
0.0
04%
0.0
04%
0.0
02%
0.0
02%
0.0
00%
0.000%
0.010%
0.020%
0.030%
0.040%
0.050%
0.060%
0.070%
% o
f G
DP
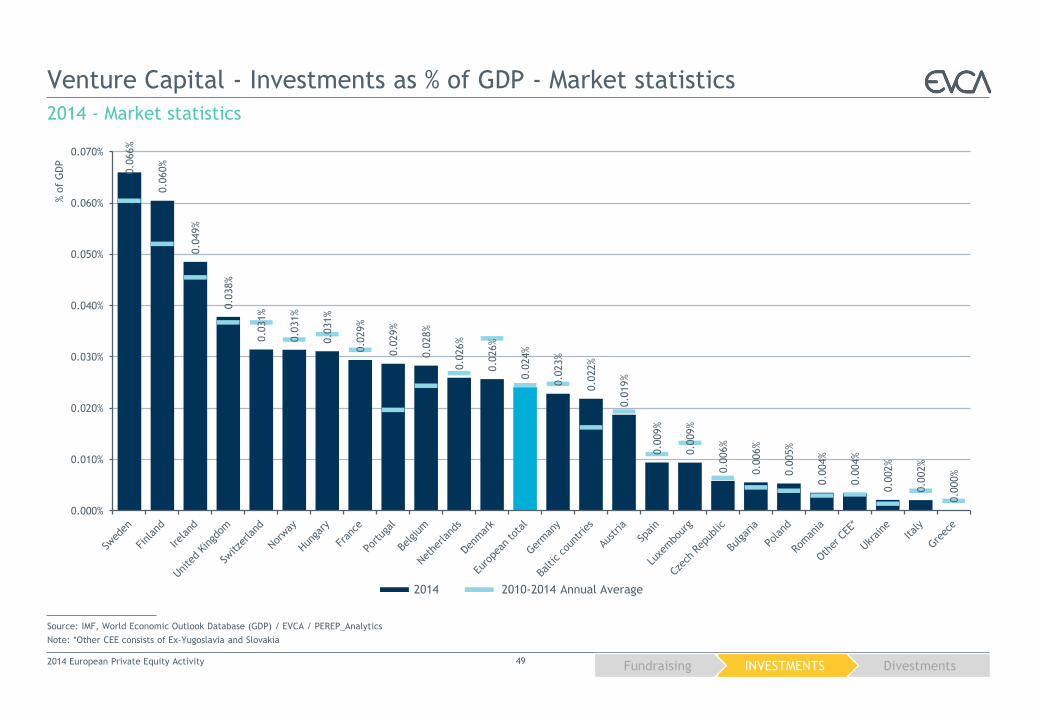
Venture Capital - Investments as % of GDP - Market statistics
2014 - Market statistics
Source: IMF, World Economic Outlook Database (GDP) / EVCA / PEREP_Analytics
Note: *Other CEE consists of Ex-Yugoslavia and Slovakia
2014 European Private Equity Activity 49
2014 2010-2014 Annual Average
Divestments INVESTMENTS Fundraising
0.4
97%
0.4
36%
0.3
89%
0.3
16%
0.3
06%
0.2
54%
0.2
40%
0.2
09%
0.1
95%
0.1
68%
0.1
65%
0.1
60%
0.1
52%
0.1
07%
0.0
96%
0.0
88%
0.0
80%
0.0
78%
0.0
54%
0.0
39%
0.0
33%
0.0
12%
0.0
10%
0.0
00%
0.0
00%
0.0
00%
0.000%
0.100%
0.200%
0.300%
0.400%
0.500%
0.600%
% o
f G
DP
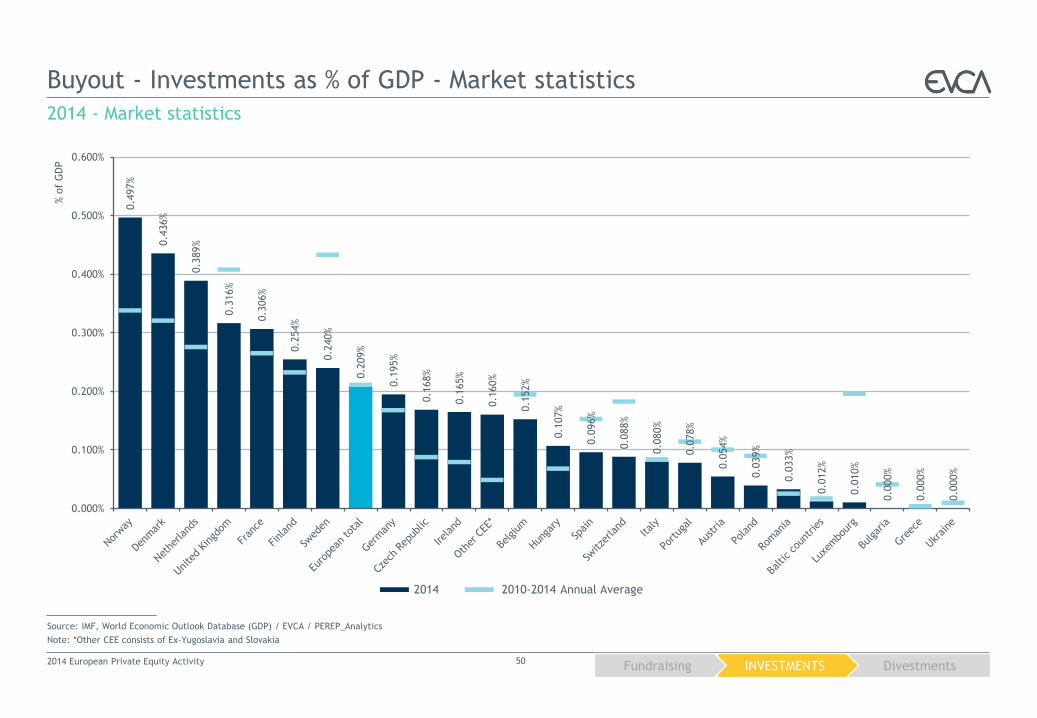
Buyout - Investments as % of GDP - Market statistics
2014 - Market statistics
Source: IMF, World Economic Outlook Database (GDP) / EVCA / PEREP_Analytics
Note: *Other CEE consists of Ex-Yugoslavia and Slovakia
2014 European Private Equity Activity 50
2014 2010-2014 Annual Average
Divestments INVESTMENTS Fundraising
0.0
82%
0.0
64%
0.0
60%
0.0
54%
0.0
52%
0.0
50%
0.0
47%
0.0
44%
0.0
41%
0.0
40%
0.0
37%
0.0
30%
0.0
27%
0.0
24%
0.0
21%
0.0
20%
0.0
20%
0.0
19%
0.0
16%
0.0
15%
0.0
14%
0.0
11%
0.0
09%
0.0
02%
0.0
00%
0.0
00%
0.000%
0.020%
0.040%
0.060%
0.080%
0.100%
0.120%
% o
f G
DP
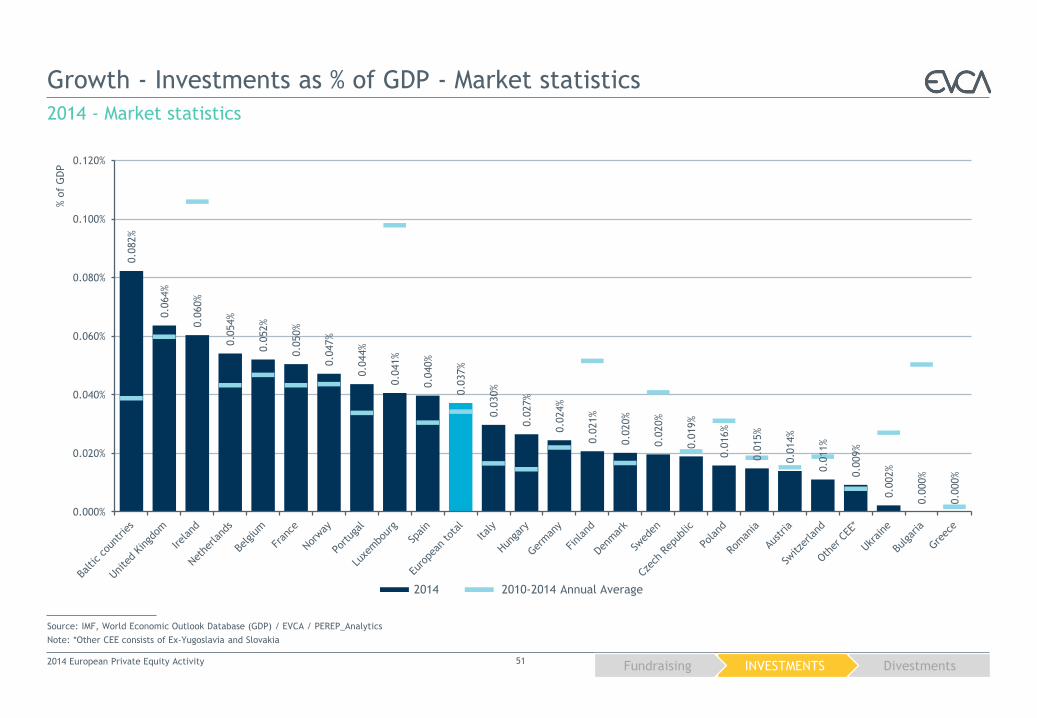
Growth - Investments as % of GDP - Market statistics
2014 - Market statistics
Source: IMF, World Economic Outlook Database (GDP) / EVCA / PEREP_Analytics
Note: *Other CEE consists of Ex-Yugoslavia and Slovakia
2014 European Private Equity Activity 51
2014 2010-2014 Annual Average
Divestments INVESTMENTS Fundraising
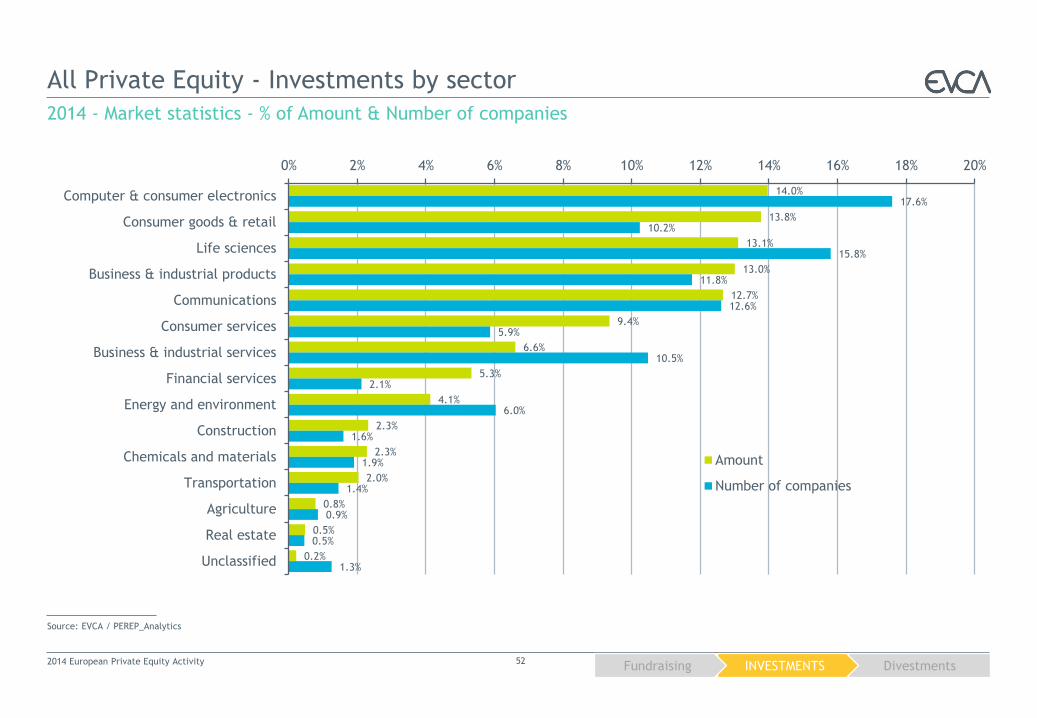
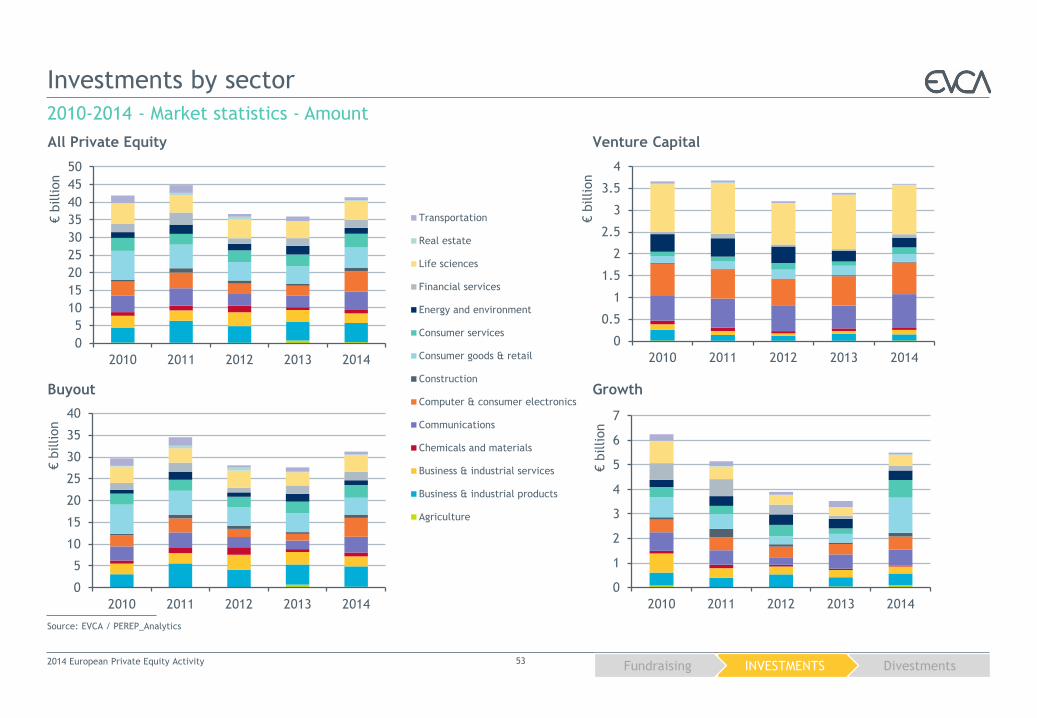
14.0%
13.8%
13.1%
13.0%
12.7%
9.4%
6.6%
5.3%
4.1%
2.3%
2.3%
2.0%
0.8%
0.5%
0.2%
17.6%
10.2%
15.8%
11.8%
12.6%
5.9%
10.5%
2.1%
6.0%
1.6%
1.9%
1.4%
0.9%
0.5%
1.3%
0% 2% 4% 6% 8% 10% 12% 14% 16% 18% 20%
Computer & consumer electronics
Consumer goods & retail
Life sciences
Business & industrial products
Communications
Consumer services
Business & industrial services
Financial services
Energy and environment
Construction
Chemicals and materials
Transportation
Agriculture
Real estate
Unclassified
Amount
Number of companies
All Private Equity - Investments by sector
2014 - Market statistics - % of Amount & Number of companies
Source: EVCA / PEREP_Analytics
2014 European Private Equity Activity 52
Divestments INVESTMENTS Fundraising
0
1
2
3
4
5
6
7
2010 2011 2012 2013 2014€ b
illion
0
5
10
15
20
25
30
35
40
2010 2011 2012 2013 2014
€ b
illion
0
0.5
1
1.5
2
2.5
3
3.5
4
2010 2011 2012 2013 2014
€ b
illion
0
5
10
15
20
25
30
35
40
45
50
2010 2011 2012 2013 2014
€ b
illion
Investments by sector
2010-2014 - Market statistics - Amount
Source: EVCA / PEREP_Analytics
Venture Capital
Growth
All Private Equity
Buyout
2014 European Private Equity Activity 53
0
10
20
30
40
50
60
70
80
2007 2008 2009 2010 2011 2012 2013
€billion
Transportation
Real estate
Life sciences
Financial services
Energy and environment
Consumer services
Consumer goods & retail
Construction
Computer & consumer electronics
Communications
Chemicals and materials
Business & industrial services
Business & industrial products
Agriculture
Divestments INVESTMENTS Fundraising
0
200
400
600
800
1,000
1,200
1,400
2010 2011 2012 2013 2014
0
200
400
600
800
1,000
2010 2011 2012 2013 2014
0
500
1,000
1,500
2,000
2,500
3,000
3,500
2010 2011 2012 2013 20140
1,000
2,000
3,000
4,000
5,000
6,000
2010 2011 2012 2013 2014
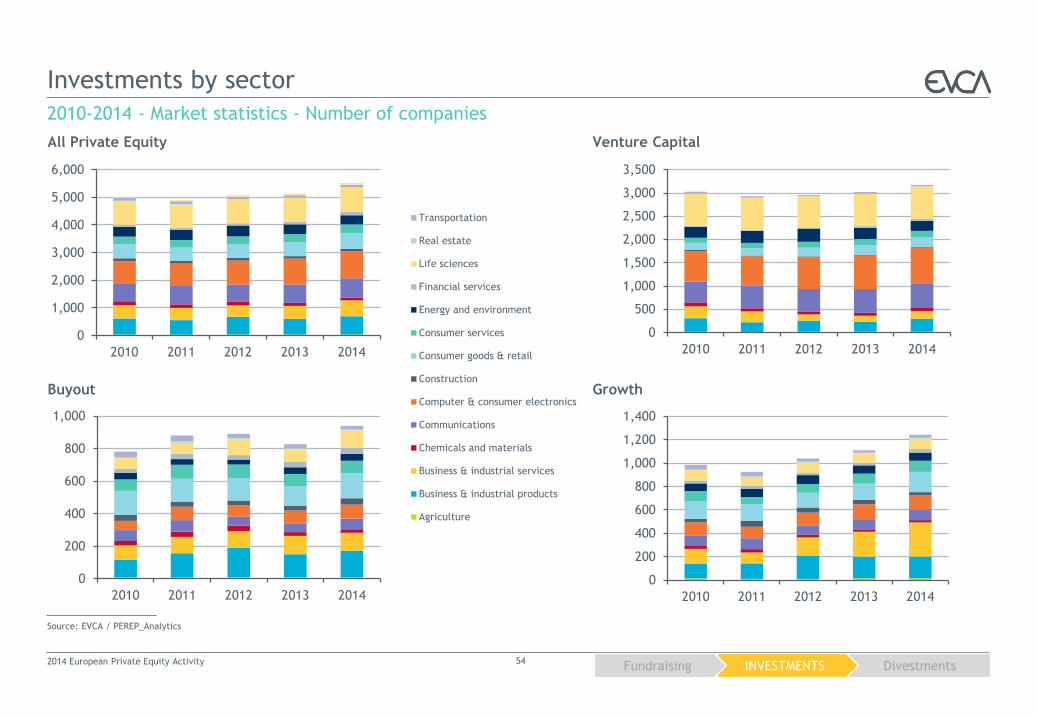
Investments by sector
2010-2014 - Market statistics - Number of companies
Source: EVCA / PEREP_Analytics
Venture Capital
Growth
All Private Equity
Buyout
2014 European Private Equity Activity 54
0
10
20
30
40
50
60
70
80
2007 2008 2009 2010 2011 2012 2013
€billion
Transportation
Real estate
Life sciences
Financial services
Energy and environment
Consumer services
Consumer goods & retail
Construction
Computer & consumer electronics
Communications
Chemicals and materials
Business & industrial services
Business & industrial products
Agriculture
Divestments INVESTMENTS Fundraising
All Private Equity - Initial / Follow-on investments
2014 - Market statistics - % of Number of companies
Source: EVCA / PEREP_Analytics
2014 European Private Equity Activity 55
2013 2010 2011 2014 2012
58% 60% 57% 56% 59%
45% 46% 44% 42% 46%
55% 54% 56% 58% 54%
Follow-on investmentfor the company
Initial investment forthe company
Initial investment forthe private equity firm
Divestments INVESTMENTS Fundraising
19.8%
36.9%
19.5%
4.6%
8.5%
5.4% 4.3% 0.9% 5.1%
24.1%
19.4%
6.0%
14.5%
13.1%
15.2%
2.5%
68.2%
27.4%
2.3% 0.9%
0.8% 0.2% 0.0% 0.1%
45.1%
29.0%
9.4%
2.8%
5.1%
4.0% 3.8% 0.8%
Investments by portfolio company size
Source: EVCA / PEREP_Analytics
2014 - Market statistics - % of Number of companies
Venture Capital
Growth
All Private Equity
Buyout
2014 European Private Equity Activity 56
44.1%
31.6%
9.1%
2.5%
4.5%
3.6%3.7%0.9%
0 - 19
20 - 99
100 - 199
200 - 249
250 - 499
500 - 999
1000 - 4999
5000 +
SME: 86.3% SME: 98.9%
SME: 54.6% SME: 80.9%
SME
Full-time equivalent
staff by interval
Divestments INVESTMENTS Fundraising
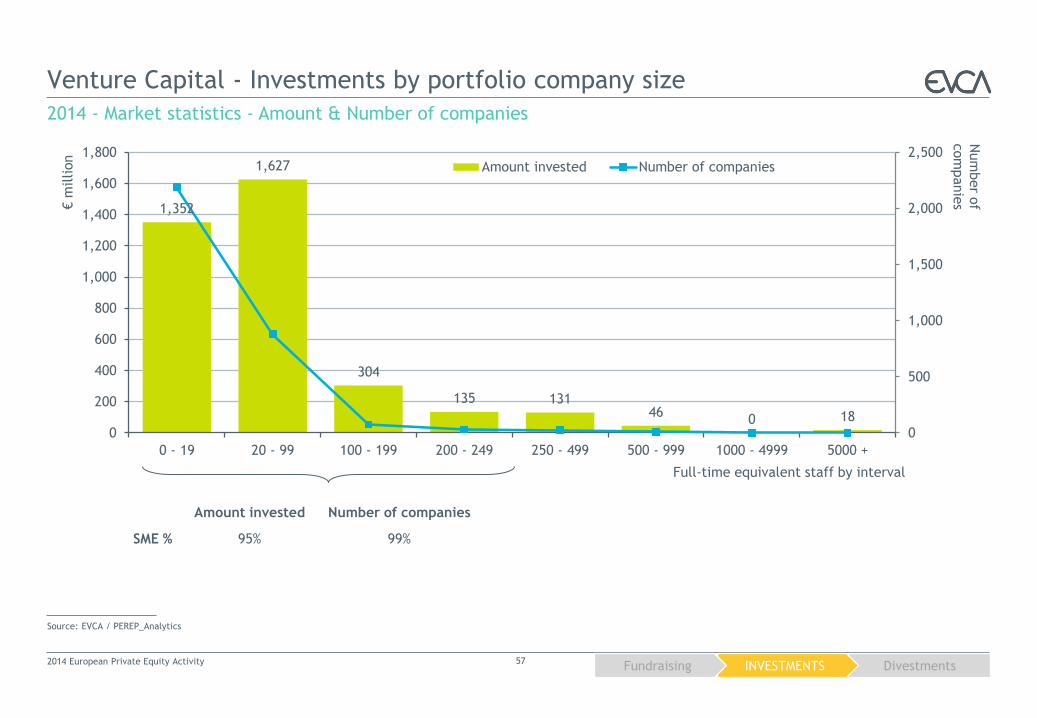
1,352
1,627
304
135 131 46
0 18 0
500
1,000
1,500
2,000
2,500
0
200
400
600
800
1,000
1,200
1,400
1,600
1,800
0 - 19 20 - 99 100 - 199 200 - 249 250 - 499 500 - 999 1000 - 4999 5000 +
Num
ber o
f com
panie
s € m
illion
Amount invested Number of companies
Venture Capital - Investments by portfolio company size
2014 - Market statistics - Amount & Number of companies
Source: EVCA / PEREP_Analytics
Full-time equivalent staff by interval
Amount invested Number of companies
SME % 95% 99%
2014 European Private Equity Activity 57
Divestments INVESTMENTS Fundraising
0.1
1.8
2.7
1.3
4.9 5.5
11.9
2.9
0
50
100
150
200
250
0
2
4
6
8
10
12
14
0 - 19 20 - 99 100 - 199 200 - 249 250 - 499 500 - 999 1000 - 4999 5000 +
Num
ber o
f com
panie
s
€ b
illion
Amount invested Number of companies
Buyout - Investments by portfolio company size
2014 - Market statistics - Amount & Number of companies
Source: EVCA / PEREP_Analytics
2014 European Private Equity Activity 58
Amount invested Number of companies
SME % 19% 55%
Full-time equivalent staff by interval
Divestments INVESTMENTS Fundraising
0.1
1.5
1.2
0.2
0.6 0.6
1.2
0.1
0
50
100
150
200
250
300
350
400
450
500
0.0
0.2
0.4
0.6
0.8
1.0
1.2
1.4
1.6
0 - 19 20 - 99 100 - 199 200 - 249 250 - 499 500 - 999 1000 - 4999 5000 +
Num
ber o
f com
panie
s
€ b
illion
Amount invested Number of companies
Growth - Investments by portfolio company size
2014 - Market statistics - Amount & Number of companies
Source: EVCA / PEREP_Analytics
2014 European Private Equity Activity 59
Amount invested Number of companies
SME % 55% 81%
Full-time equivalent staff by interval
Divestments
3 Divestments statistics explained
Industry statistics are an aggregation of figures according to the country of
the private equity firm’s office in charge of the divestment. At European
level, this relates to divestments made by European private equity firms
regardless of the location of the portfolio company.
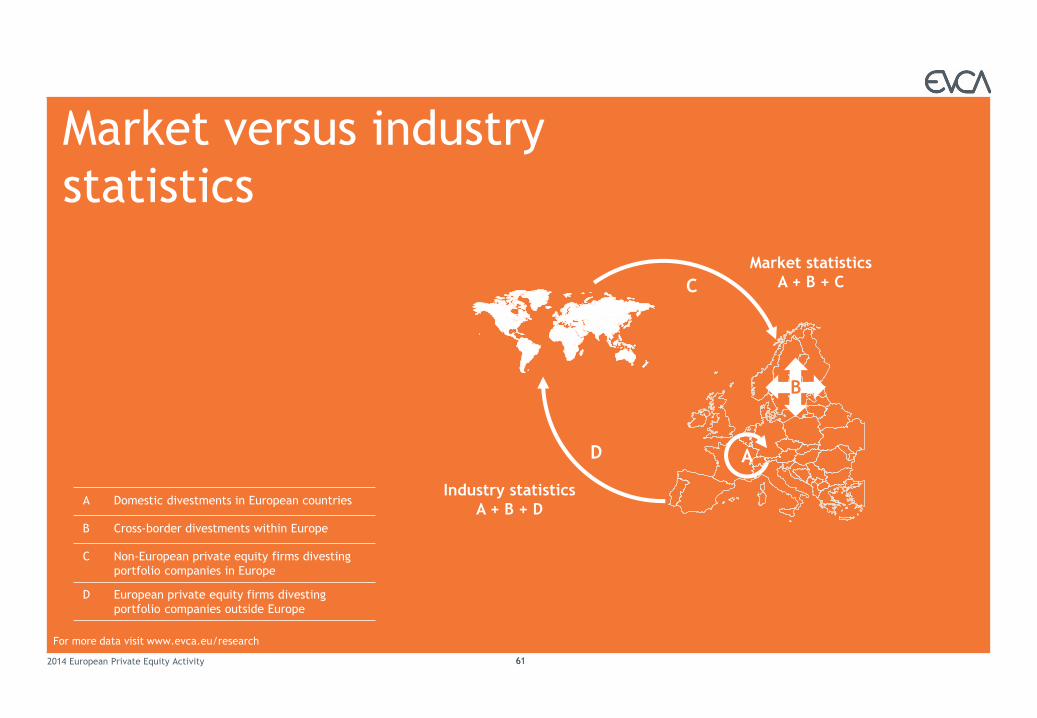
Market statistics are an aggregation of figures according to the location of the
portfolio company. At European level, this relates to divestments of European
companies regardless of the location of the private equity firm.
Divestment amounts (including write-offs) are recorded at cost (i.e. the total
amount divested is equal to the total amount invested before).
The funds included in the statistics are: private equity funds making direct
private equity investments, mezzanine private equity funds, co-investment
funds and rescue/turnaround funds.
The following funds are excluded from the statistics: infrastructure funds,
real estate funds, distressed debt funds, primary funds of funds, secondary
funds of funds.
2014 European Private Equity Activity 60
For more data visit www.evca.eu/research
Market versus industry
statistics
2014 European Private Equity Activity 61
For more data visit www.evca.eu/research
61
B
C
D
Market statistics
A + B + C
Industry statistics
A + B + D
A
A Domestic divestments in European countries
B Cross-border divestments within Europe
C Non-European private equity firms divesting
portfolio companies in Europe
D European private equity firms divesting
portfolio companies outside Europe
Glossary
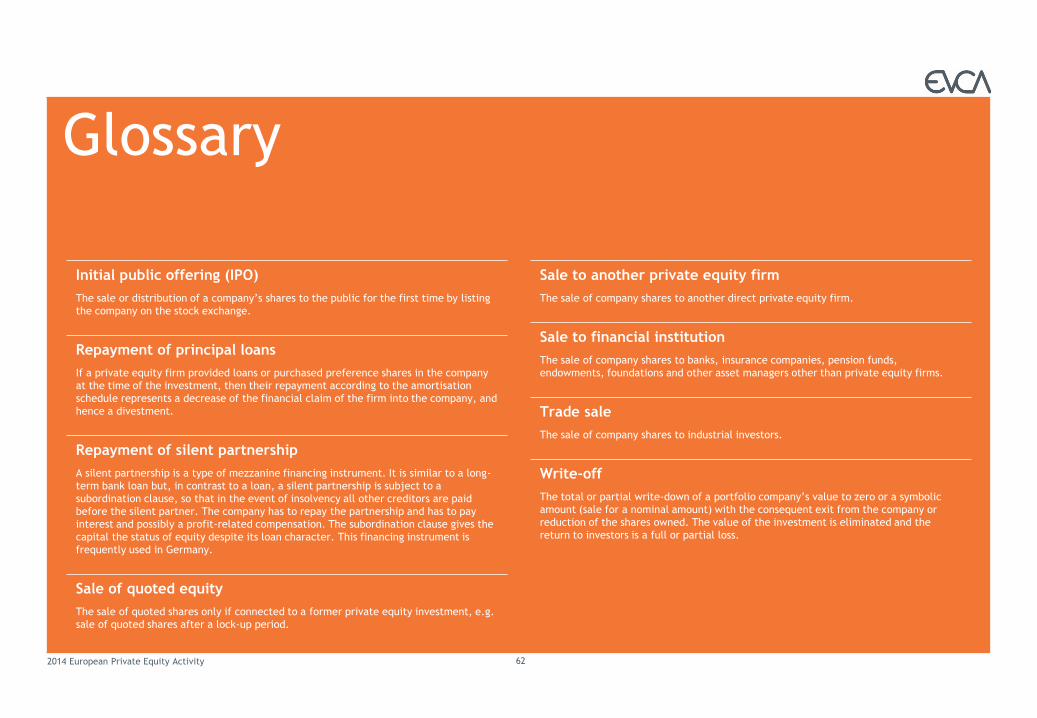
Sale to another private equity firm
The sale of company shares to another direct private equity firm.
Sale to financial institution
The sale of company shares to banks, insurance companies, pension funds,
endowments, foundations and other asset managers other than private equity firms.
Trade sale
The sale of company shares to industrial investors.
Write-off
The total or partial write-down of a portfolio company’s value to zero or a symbolic
amount (sale for a nominal amount) with the consequent exit from the company or
reduction of the shares owned. The value of the investment is eliminated and the
return to investors is a full or partial loss.
Initial public offering (IPO)
The sale or distribution of a company’s shares to the public for the first time by listing
the company on the stock exchange.
Repayment of principal loans
If a private equity firm provided loans or purchased preference shares in the company
at the time of the investment, then their repayment according to the amortisation
schedule represents a decrease of the financial claim of the firm into the company, and
hence a divestment.
Repayment of silent partnership
A silent partnership is a type of mezzanine financing instrument. It is similar to a long-
term bank loan but, in contrast to a loan, a silent partnership is subject to a
subordination clause, so that in the event of insolvency all other creditors are paid
before the silent partner. The company has to repay the partnership and has to pay
interest and possibly a profit-related compensation. The subordination clause gives the
capital the status of equity despite its loan character. This financing instrument is
frequently used in Germany.
Sale of quoted equity
The sale of quoted shares only if connected to a former private equity investment, e.g.
sale of quoted shares after a lock-up period.
2014 European Private Equity Activity 62
DIVESTMENTS Investments Fundraising
2014 Divestments at a glance
2014 European Private Equity Activity 63
Source: EVCA/PEREP Analytics
Note: (1) relates to the investment stage
Source: EVCA/PEREP Analytics
Divestments – Market statistics – % total amount divested at cost
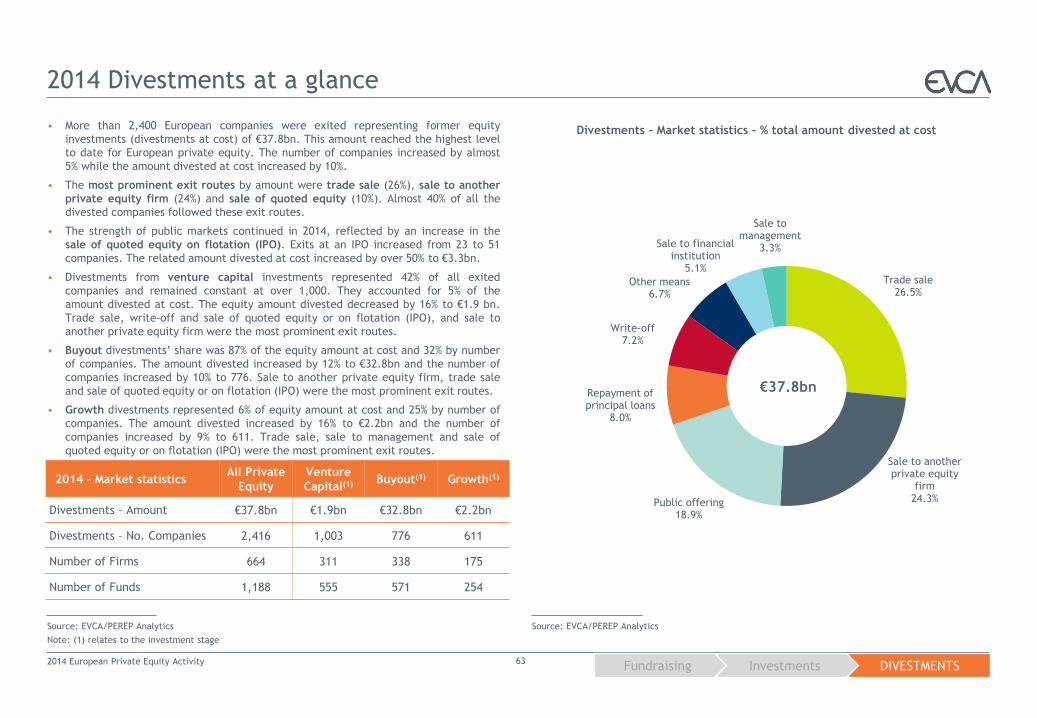
2014 - Market statistics All Private
Equity
Venture
Capital(1) Buyout(1) Growth(1)
Divestments – Amount €37.8bn €1.9bn €32.8bn €2.2bn
Divestments – No. Companies 2,416 1,003 776 611
Number of Firms 664 311 338 175
Number of Funds 1,188 555 571 254
• More than 2,400 European companies were exited representing former equity
investments (divestments at cost) of €37.8bn. This amount reached the highest level
to date for European private equity. The number of companies increased by almost
5% while the amount divested at cost increased by 10%.
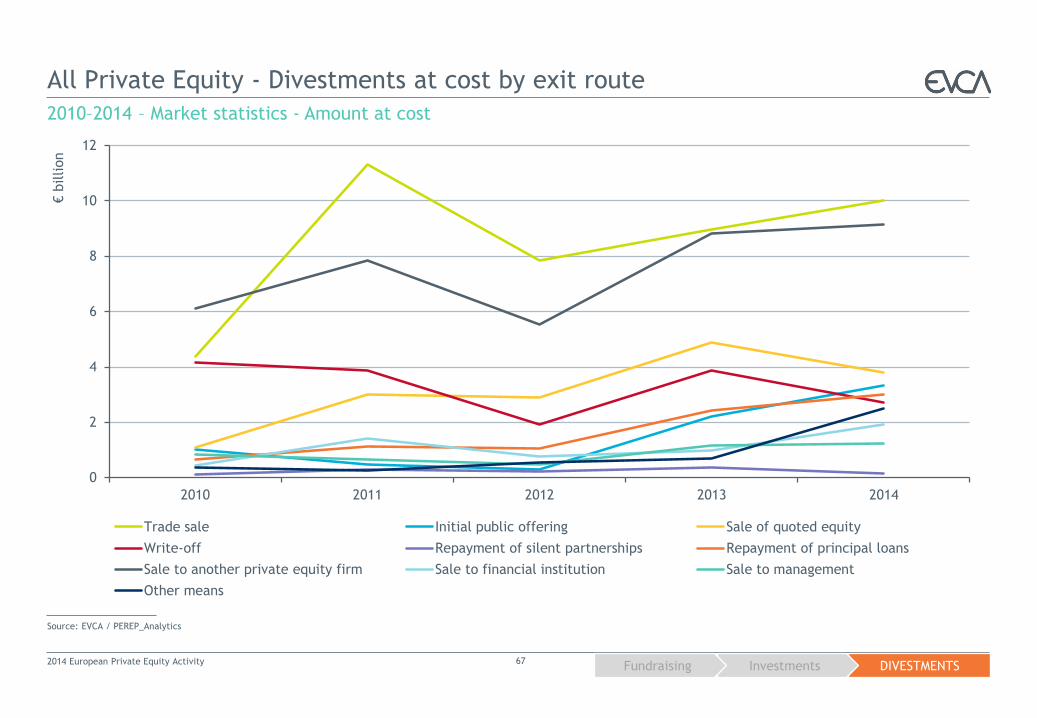
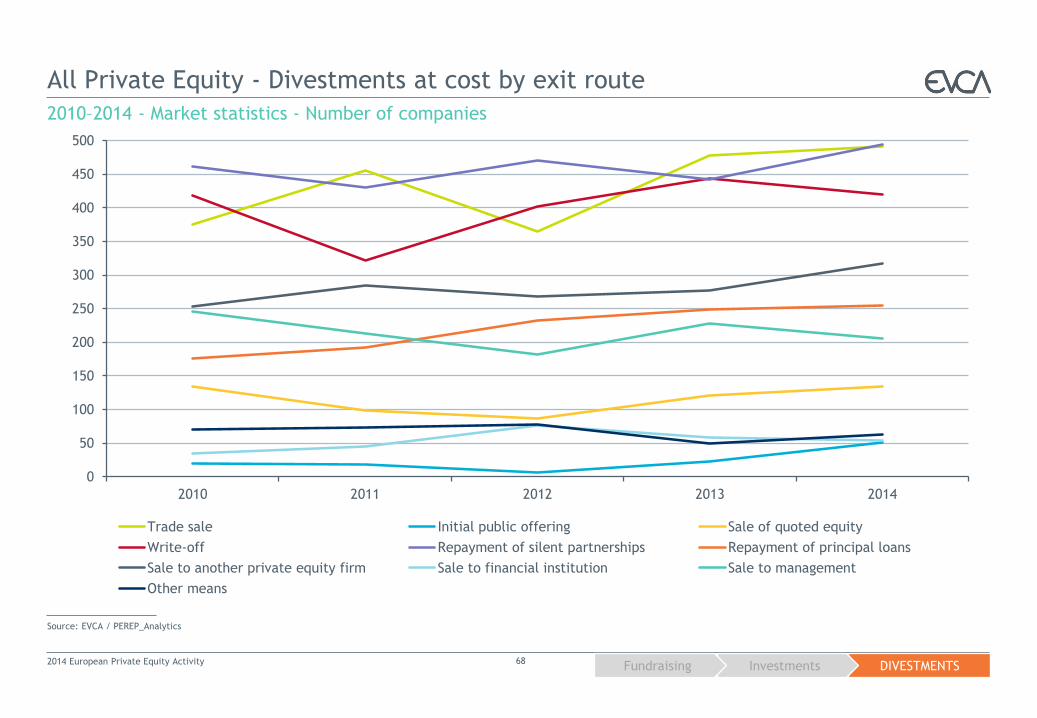
• The most prominent exit routes by amount were trade sale (26%), sale to another
private equity firm (24%) and sale of quoted equity (10%). Almost 40% of all the
divested companies followed these exit routes.
• The strength of public markets continued in 2014, reflected by an increase in the
sale of quoted equity on flotation (IPO). Exits at an IPO increased from 23 to 51
companies. The related amount divested at cost increased by over 50% to €3.3bn.
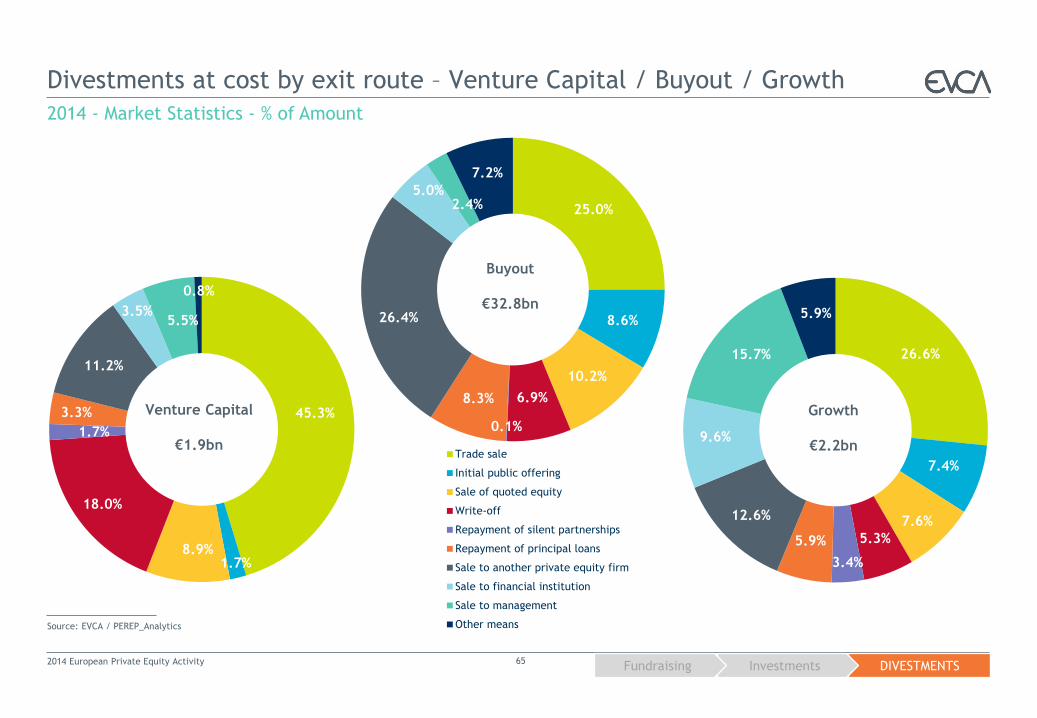
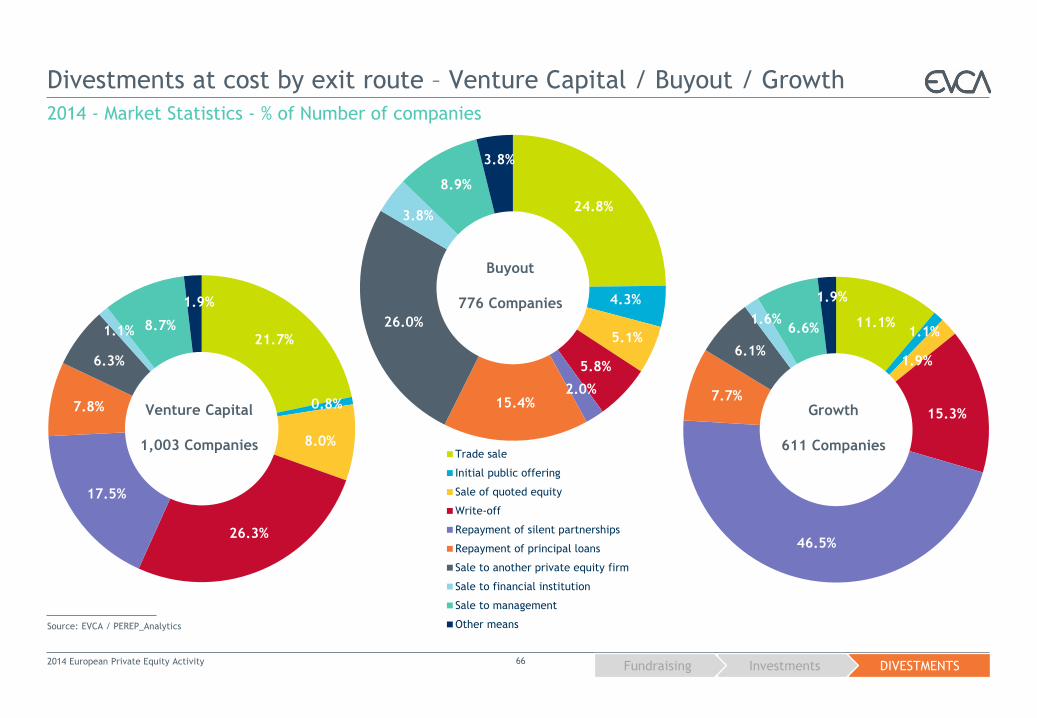
• Divestments from venture capital investments represented 42% of all exited
companies and remained constant at over 1,000. They accounted for 5% of the
amount divested at cost. The equity amount divested decreased by 16% to €1.9 bn.
Trade sale, write-off and sale of quoted equity or on flotation (IPO), and sale to
another private equity firm were the most prominent exit routes.
• Buyout divestments’ share was 87% of the equity amount at cost and 32% by number
of companies. The amount divested increased by 12% to €32.8bn and the number of
companies increased by 10% to 776. Sale to another private equity firm, trade sale
and sale of quoted equity or on flotation (IPO) were the most prominent exit routes.
• Growth divestments represented 6% of equity amount at cost and 25% by number of
companies. The amount divested increased by 16% to €2.2bn and the number of
companies increased by 9% to 611. Trade sale, sale to management and sale of
quoted equity or on flotation (IPO) were the most prominent exit routes.
€37.8bn
Trade sale 26.5%
Sale to another private equity
firm 24.3% Public offering
18.9%
Repayment of principal loans
8.0%
Write-off 7.2%
Other means 6.7%
Sale to financial institution
5.1%
Sale to management
3.3%
DIVESTMENTS Investments Fundraising
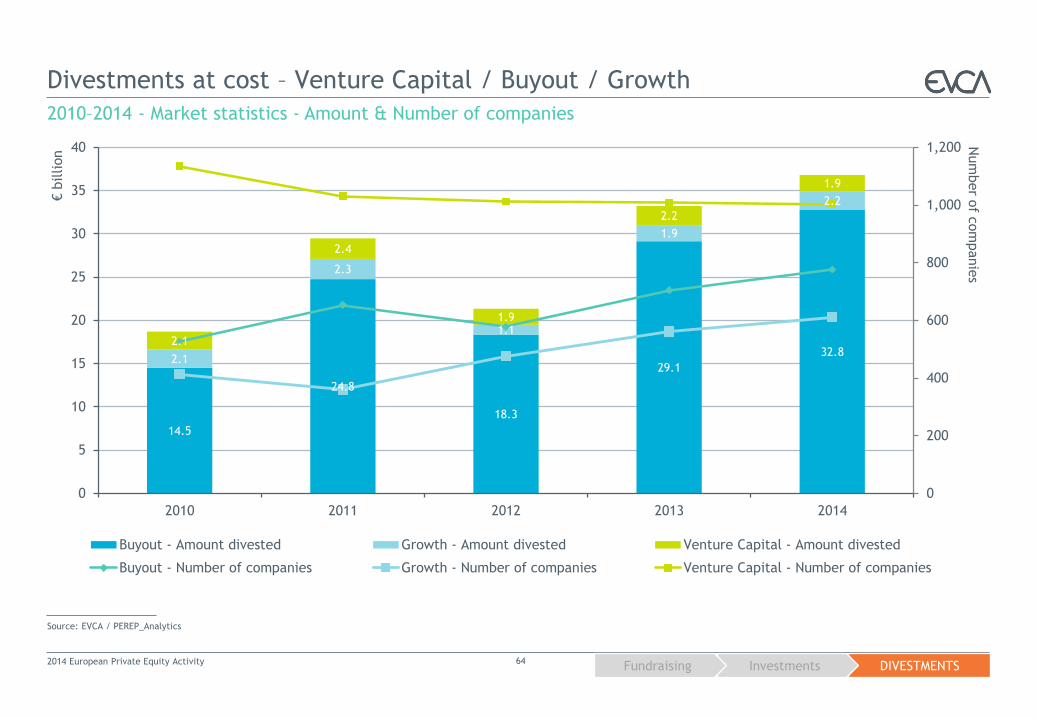
14.5
24.8
18.3
29.1
32.8 2.1
2.3
1.1
1.9
2.2
2.1
2.4
1.9
2.2
1.9
0
200
400
600
800
1,000
1,200
0
5
10
15
20
25
30
35
40
2010 2011 2012 2013 2014
Num
ber o
f com
panie
s € b
illion
Buyout - Amount divested Growth - Amount divested Venture Capital - Amount divested
Buyout - Number of companies Growth - Number of companies Venture Capital - Number of companies
Divestments at cost – Venture Capital / Buyout / Growth
2010–2014 - Market statistics - Amount & Number of companies
2014 European Private Equity Activity 64
Source: EVCA / PEREP_Analytics
DIVESTMENTS Investments Fundraising
26.6%
7.4%
7.6%
5.3%
3.4%
5.9%
12.6%
9.6%
15.7%
5.9%
25.0%
8.6%
10.2%
6.9%
0.1%
8.3%
26.4%
5.0% 2.4%
7.2%
45.3%
1.7% 8.9%
18.0%
1.7%
3.3%
11.2%
3.5% 5.5%
0.8%
Divestments at cost by exit route – Venture Capital / Buyout / Growth
2014 - Market Statistics - % of Amount
Source: EVCA / PEREP_Analytics
Buyout
€32.8bn
Growth
€2.2bn
36.7%
0.3%
4.7%
24.4%
2.1%1.6%
16.8%
4.7%4.4%
4.1%
Trade sale
Initial public offering
Sale of quoted equity
Write-off
Repayment of silent partnerships
Repayment of principal loans
Sale to another private equity firm
Sale to financial institution
Sale to management
Other means
Venture Capital
€1.9bn
2014 European Private Equity Activity 65
DIVESTMENTS Investments Fundraising
11.1% 1.1%
1.9%
15.3%
46.5%
7.7%
6.1%
1.6% 6.6%
1.9%
24.8%
4.3%
5.1%
5.8%
2.0% 15.4%
26.0%
3.8%
8.9%
3.8%
21.7%
0.8%
8.0%
26.3%
17.5%
7.8%
6.3%
1.1% 8.7%
1.9%
Divestments at cost by exit route – Venture Capital / Buyout / Growth
2014 - Market Statistics - % of Number of companies
Source: EVCA / PEREP_Analytics
Buyout
776 Companies
Venture Capital
1,003 Companies
Growth
611 Companies
36.7%
0.3%
4.7%
24.4%
2.1%1.6%
16.8%
4.7%4.4%
4.1%
Trade sale
Initial public offering
Sale of quoted equity
Write-off
Repayment of silent partnerships
Repayment of principal loans
Sale to another private equity firm
Sale to financial institution
Sale to management
Other means
2014 European Private Equity Activity 66
DIVESTMENTS Investments Fundraising
0
2
4
6
8
10
12
2010 2011 2012 2013 2014
€ b
illion
Trade sale Initial public offering Sale of quoted equity
Write-off Repayment of silent partnerships Repayment of principal loans
Sale to another private equity firm Sale to financial institution Sale to management
Other means
All Private Equity - Divestments at cost by exit route
2010–2014 – Market statistics - Amount at cost
Source: EVCA / PEREP_Analytics
2014 European Private Equity Activity 67
DIVESTMENTS Investments Fundraising
0
50
100
150
200
250
300
350
400
450
500
2010 2011 2012 2013 2014
Trade sale Initial public offering Sale of quoted equity
Write-off Repayment of silent partnerships Repayment of principal loans
Sale to another private equity firm Sale to financial institution Sale to management
Other means
All Private Equity - Divestments at cost by exit route
2010–2014 - Market statistics - Number of companies
Source: EVCA / PEREP_Analytics
2014 European Private Equity Activity 68
DIVESTMENTS Investments Fundraising
5.6 5.4
4.4 4.4
2.6 2.5
2.2 2.1
1.8
1.3
1.0 0.9
0.6
0.1 0.0
185
268 235
380
209
50
273
20
130
39 56
87
50
16 12 0
50
100
150
200
250
300
350
400
0
1
2
3
4
5
6 Num
ber o
f com
panie
s exite
d
€ b
illion
Amount at cost
Number of companies exited
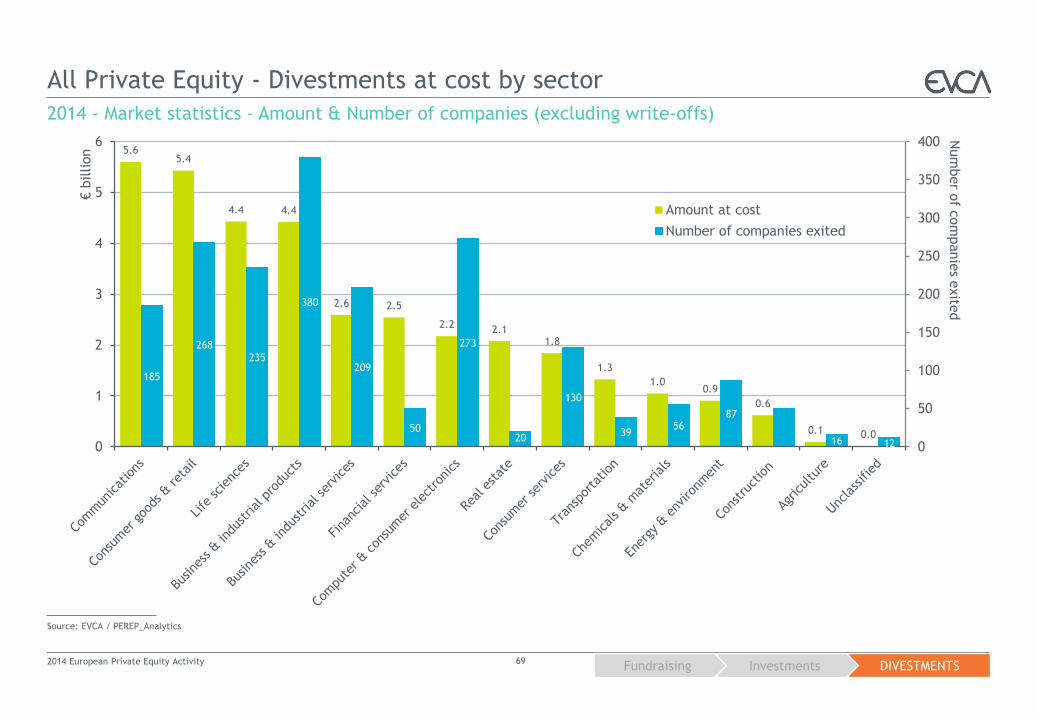
All Private Equity - Divestments at cost by sector
2014 - Market statistics - Amount & Number of companies (excluding write-offs)
Source: EVCA / PEREP_Analytics
2014 European Private Equity Activity 69
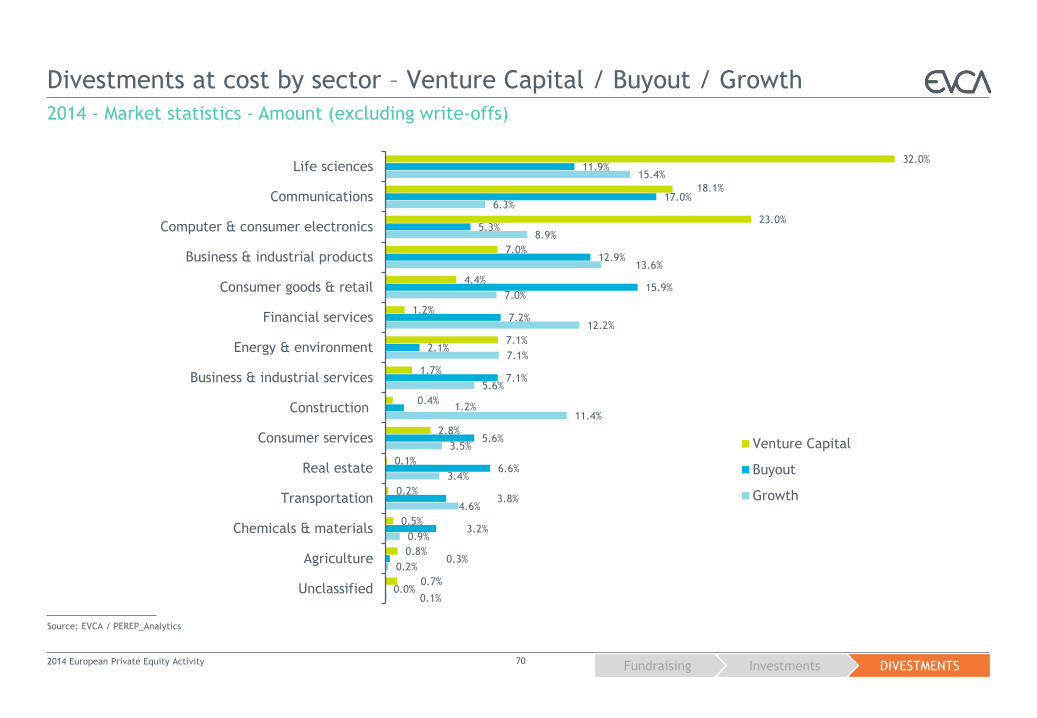
DIVESTMENTS Investments Fundraising
32.0%
18.1%
23.0%
7.0%
4.4%
1.2%
7.1%
1.7%
0.4%
2.8%
0.1%
0.2%
0.5%
0.8%
0.7%
11.9%
17.0%
5.3%
12.9%
15.9%
7.2%
2.1%
7.1%
1.2%
5.6%
6.6%
3.8%
3.2%
0.3%
0.0%
15.4%
6.3%
8.9%
13.6%
7.0%
12.2%
7.1%
5.6%
11.4%
3.5%
3.4%
4.6%
0.9%
0.2%
0.1%
Life sciences
Communications
Computer & consumer electronics
Business & industrial products
Consumer goods & retail
Financial services
Energy & environment
Business & industrial services
Construction
Consumer services
Real estate
Transportation
Chemicals & materials
Agriculture
Unclassified
Venture Capital
Buyout
Growth
Divestments at cost by sector – Venture Capital / Buyout / Growth
2014 - Market statistics - Amount (excluding write-offs)
Source: EVCA / PEREP_Analytics
2014 European Private Equity Activity 70
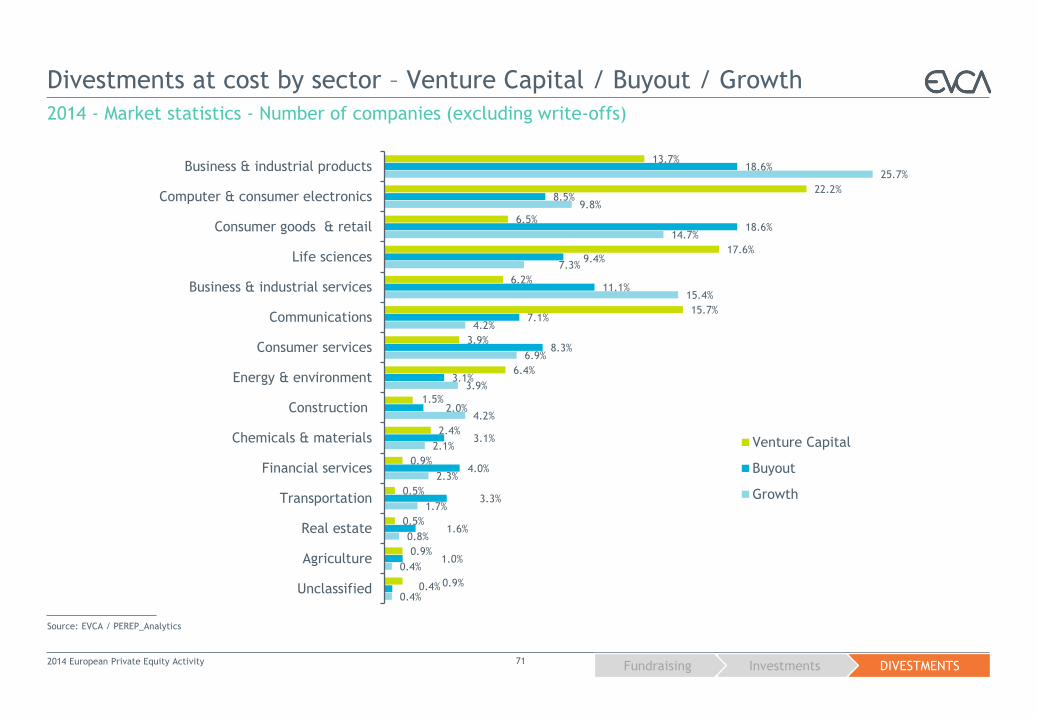
DIVESTMENTS Investments Fundraising
13.7%
22.2%
6.5%
17.6%
6.2%
15.7%
3.9%
6.4%
1.5%
2.4%
0.9%
0.5%
0.5%
0.9%
0.9%
18.6%
8.5%
18.6%
9.4%
11.1%
7.1%
8.3%
3.1%
2.0%
3.1%
4.0%
3.3%
1.6%
1.0%
0.4%
25.7%
9.8%
14.7%
7.3%
15.4%
4.2%
6.9%
3.9%
4.2%
2.1%
2.3%
1.7%
0.8%
0.4%
0.4%
Business & industrial products
Computer & consumer electronics
Consumer goods & retail
Life sciences
Business & industrial services
Communications
Consumer services
Energy & environment
Construction
Chemicals & materials
Financial services
Transportation
Real estate
Agriculture
Unclassified
Venture Capital
Buyout
Growth
Divestments at cost by sector – Venture Capital / Buyout / Growth
2014 - Market statistics - Number of companies (excluding write-offs)
Source: EVCA / PEREP_Analytics
2014 European Private Equity Activity 71
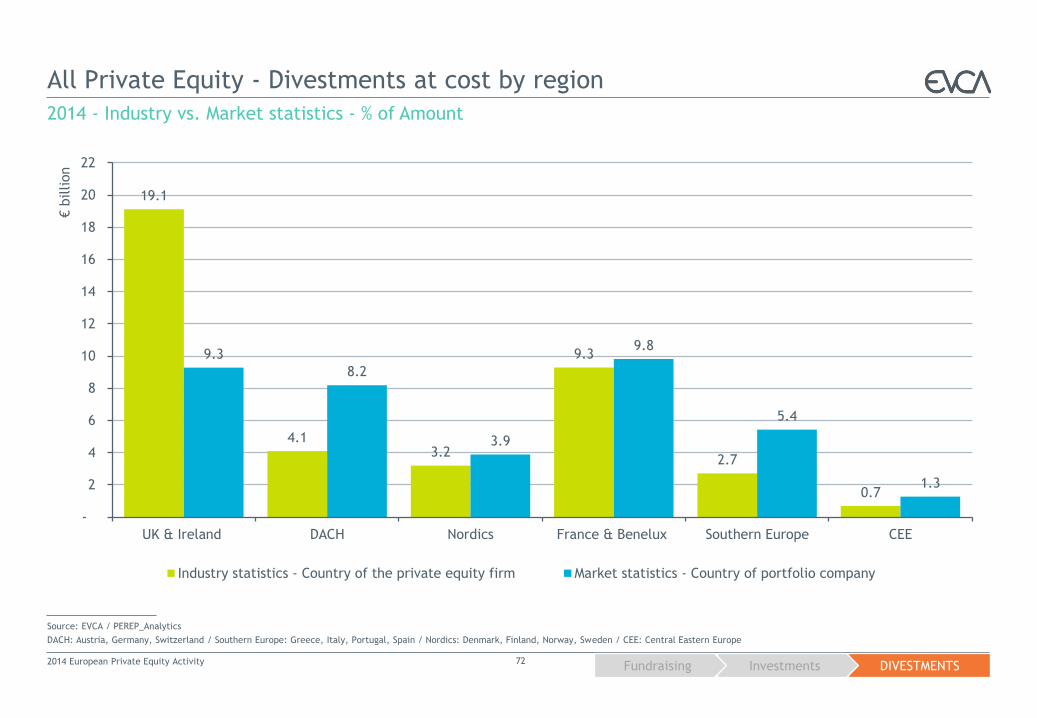
DIVESTMENTS Investments Fundraising
19.1
4.1 3.2
9.3
2.7
0.7
9.3
8.2
3.9
9.8
5.4
1.3
-
2
4
6
8
10
12
14
16
18
20
22
UK & Ireland DACH Nordics France & Benelux Southern Europe CEE
€ b
illion
Industry statistics - Country of the private equity firm Market statistics - Country of portfolio company
All Private Equity - Divestments at cost by region
2014 - Industry vs. Market statistics - % of Amount
2014 European Private Equity Activity 72
Source: EVCA / PEREP_Analytics
DACH: Austria, Germany, Switzerland / Southern Europe: Greece, Italy, Portugal, Spain / Nordics: Denmark, Finland, Norway, Sweden / CEE: Central Eastern Europe
Acknowledgements
2014 European Private Equity Activity 73
Acknowledgements
We are grateful for the generous support of General Partners representing private equity
and venture capital firms across Europe who provided us with their activity data. The
following comprehensive and verified pan-European statistics would not be possible
without their on-going commitment.
We also thank all the regional and national private equity associations that collect their
activity data via PEREP_Analytics, the pan-European statistics platform. We thank the
following associations for their participation to make PEREP_Analytics the most
comprehensive private equity database on private equity in Europe:
2014 European Private Equity Activity 74
APCRI - Portugal
AVCO - Austria
BVA - Belgium
BVK - Germany
CVCA - Croatia
CVCA - The Czech Republic
DVCA - Denmark
EstVCA - Estonia
FVCA – Finland
HVCA - Hungary
IVCA - Ireland
LTVCA - Lithuania
NVCA - Norway
NVP - The Netherlands
PSIK - Poland
SECA - Switzerland
SEEPEA - South Eastern Europe
SLOVCA - Slovakia
SVCA - Sweden
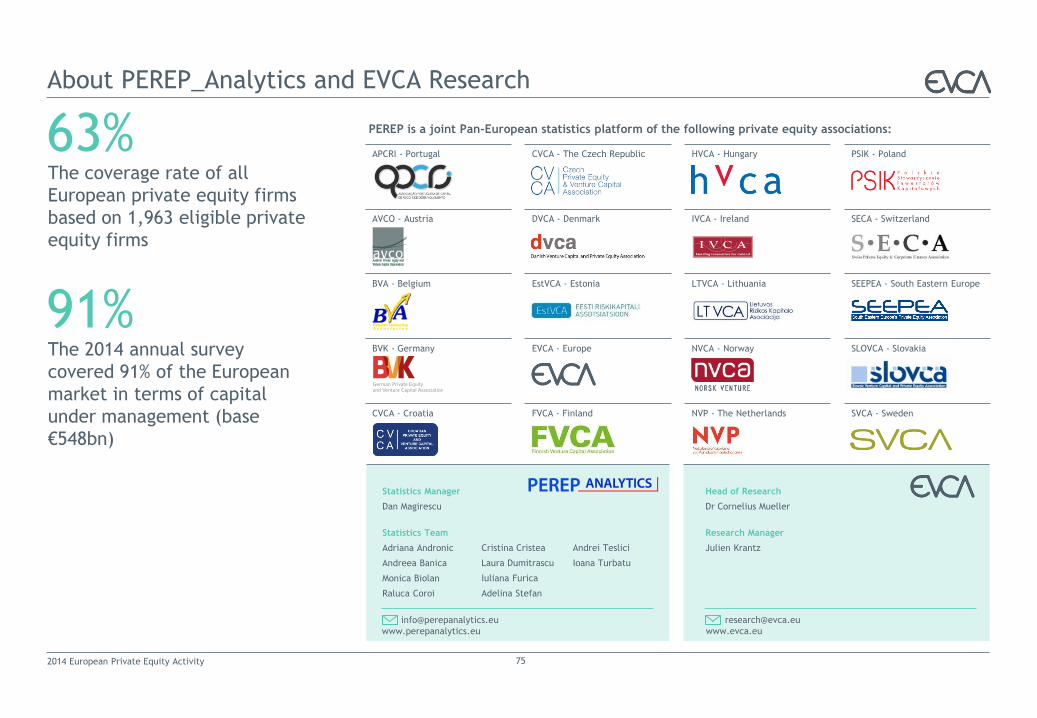
CVCA - The Czech Republic
DVCA - Denmark
EstVCA - Estonia
EVCA - Europe
FVCA - Finland
APCRI - Portugal
AVCO - Austria
BVA - Belgium
BVK - Germany
CVCA - Croatia
PSIK - Poland
SECA - Switzerland
SEEPEA - South Eastern Europe
SLOVCA - Slovakia
SVCA - Sweden
About PEREP_Analytics and EVCA Research
PEREP is a joint Pan-European statistics platform of the following private equity associations:
2014 European Private Equity Activity 75
HVCA - Hungary
IVCA - Ireland
LTVCA - Lithuania
NVCA - Norway
NVP - The Netherlands
Statistics Manager
Dan Magirescu
Statistics Team
Adriana Andronic
Andreea Banica
Monica Biolan
Raluca Coroi
Head of Research
Dr Cornelius Mueller
Research Manager
Julien Krantz Cristina Cristea
Laura Dumitrascu
Iuliana Furica
Adelina Stefan
www.perepanalytics.eu
www.evca.eu
Andrei Teslici
Ioana Turbatu
The coverage rate of all
European private equity firms
based on 1,963 eligible private
equity firms
63%
The 2014 annual survey
covered 91% of the European
market in terms of capital
under management (base
€548bn)
91%
European Private Equity and Venture Capital Association
Bastion Tower
Place du Champ de Mars 5
B – 1050 Brussels – Belgium
www.evca.eu
Tel: +32 2 715 00 20


![Private equity funds in norway activity report h1 2013[1]](https://static.fdocuments.us/doc/165x107/568bdc1a1a28ab2034b0f746/private-equity-funds-in-norway-activity-report-h1-20131.jpg)