2014 data show crop data
31
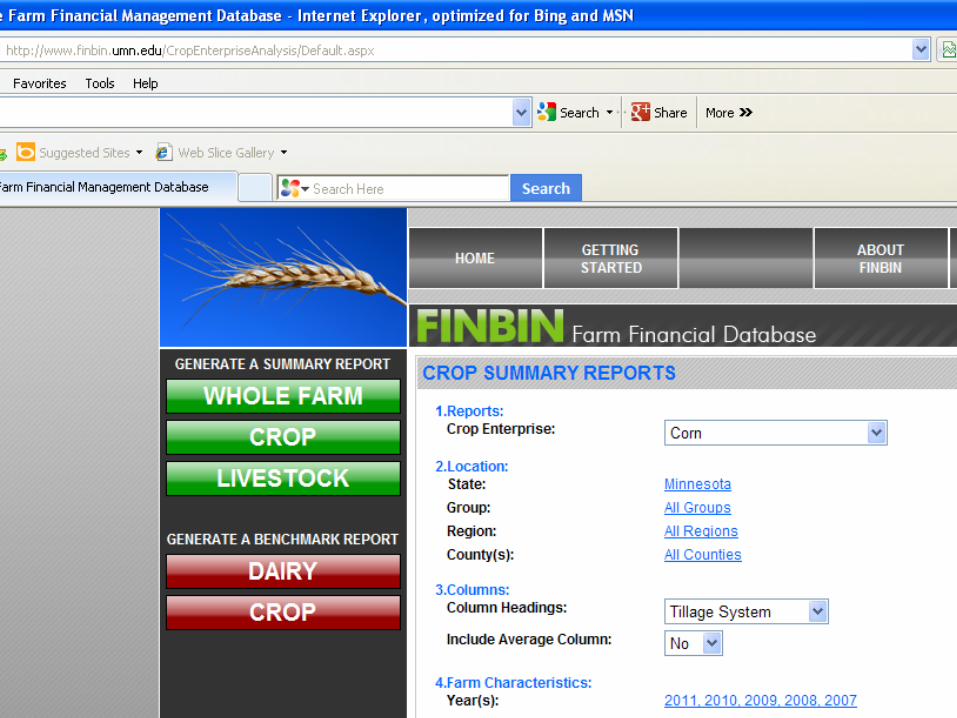
Crop Enterprise Information
Transcript of 2014 data show crop data

Crop Enterprise Information

Corn Oats Soybeans S. Wheat Barley0
5
10
156
.13
3.5
3
13
.34
7.7
6.8
1
4.02 3.61
11.38
6.31 6.2820132014
Do
llars
Average Actual Sales Price for Various Crops
Northern Minnesota
Pg 27

Corn Oats Soybeans S. Wheat Barley0.00
7.00
14.00
4.023.61
11.38
6.31 6.283.49 3.29
9.78
5.56 5.28
Ave Sales Assigned Value
Average Actual Sales Price & Assigned Value for Various Crops
Pg 33
Northern Minnesota

Corn Soybeans Corn Silage Alf Hay0
8
16
24
32
40
48
4.01
12.59
39.66
147.35
3.49
9.78
35.02
174.36
20132013
Do
llar
s
Average Value per Unit…Crop Enterprise tables (Cash Rent)
Northern Minnesota

Net Return for Various Crops (Cash Rented)
Corn Soybeans Corn Silage Alf. Hay-100
-50
0
50
100
150
200
250
300
-70.24
91.91 104.71
189.3
-89.53
12.61
-38.39
265.4
2013
2014
Do
llars
Northern Minnesota

Machinery Cost per Acre
Crop 2010 2011 2012 2013 2014
Alfalfa Hay $122.97
$134.95
$150.94
$145.46
$190.49
Corn $118.92
$142.37
$154.11
$152.35
$162.84
Corn Silage $146.13
$184.16
$185.94
$178.58
$229.01
Soybeans $70.06 $87.20 $88.40 $85.28 $87.39
Spring Wheat
$73.46 $84.21 $94.18 $87.97 $86.33
Machinery Cost per Acre Pg 28
Machinery Cost includes: Fuel & Oil, Custom Hire, Mach. Leases, Interest on Mach. debt, and Mach. Depreciation. Northern Minnesota
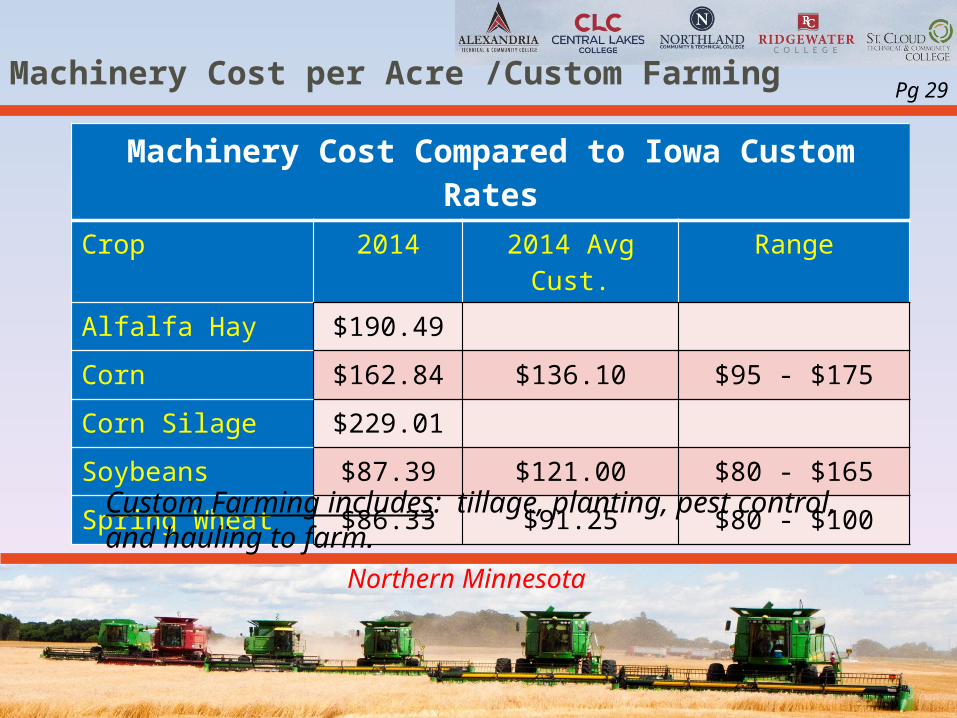
Machinery Cost Compared to Iowa Custom Rates
Crop 2014 2014 Avg Cust.
Range
Alfalfa Hay $190.49
Corn $162.84 $136.10 $95 - $175
Corn Silage $229.01
Soybeans $87.39 $121.00 $80 - $165
Spring Wheat $86.33 $91.25 $80 - $100
Machinery Cost per Acre /Custom FarmingPg 29
Custom Farming includes: tillage, planting, pest control, and hauling to farm.
Northern Minnesota
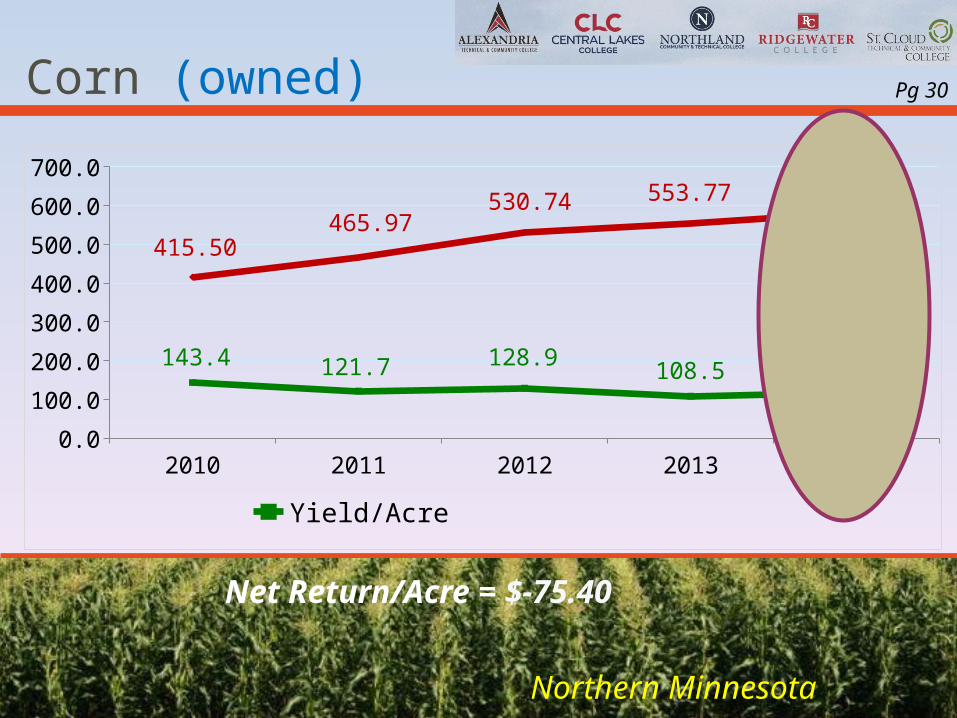
Corn (owned) Pg 30
Net Return/Acre = $-75.40
2010 2011 2012 2013 20140.0
100.0
200.0
300.0
400.0
500.0
600.0
700.0
143.4 121.7 128.9 108.5 118.8
415.50465.97
530.74 553.77 581.67
Yield/Acre Direct & Overhead Exp/Acre
Northern Minnesota

Corn Yields & Net Return per Acre (owned)Owned Acres Yield Net
Return
2005 118 bu. -$ 8.74
2006 111 bu. $28.92 2007 107 bu. $99.77 2008 123 bu. $37.37 2009 126 bu. $17.84 2010 143 bu. $249.14 2011 122 bu. $248.53 2012 129 bu. $320.53 2013 109 bu. $-44.10 2014 119 bu. $-75.40
Northern Minnesota
Pg 30
5 year Avg. = $139.74
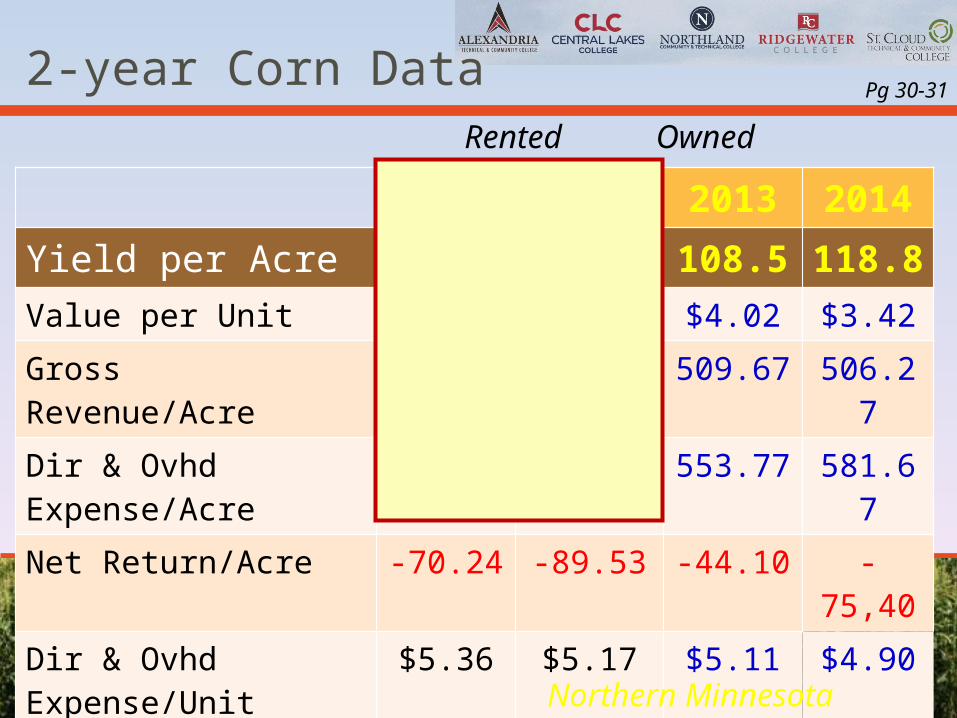
2-year Corn Data
2013 2014 2013 2014
Yield per Acre 105.4 118.2 108.5 118.8
Value per Unit $4.01 $3.49 $4.02 $3.42
Gross Revenue/Acre 494.27 521.63 509.67 506.27
Dir & Ovhd Expense/Acre
564.51 611.16 553.77 581.67
Net Return/Acre -70.24 -89.53 -44.10 -75,40
Dir & Ovhd Expense/Unit
$5.36 $5.17 $5.11 $4.90
Rented Owned
Pg 30-31
Northern Minnesota
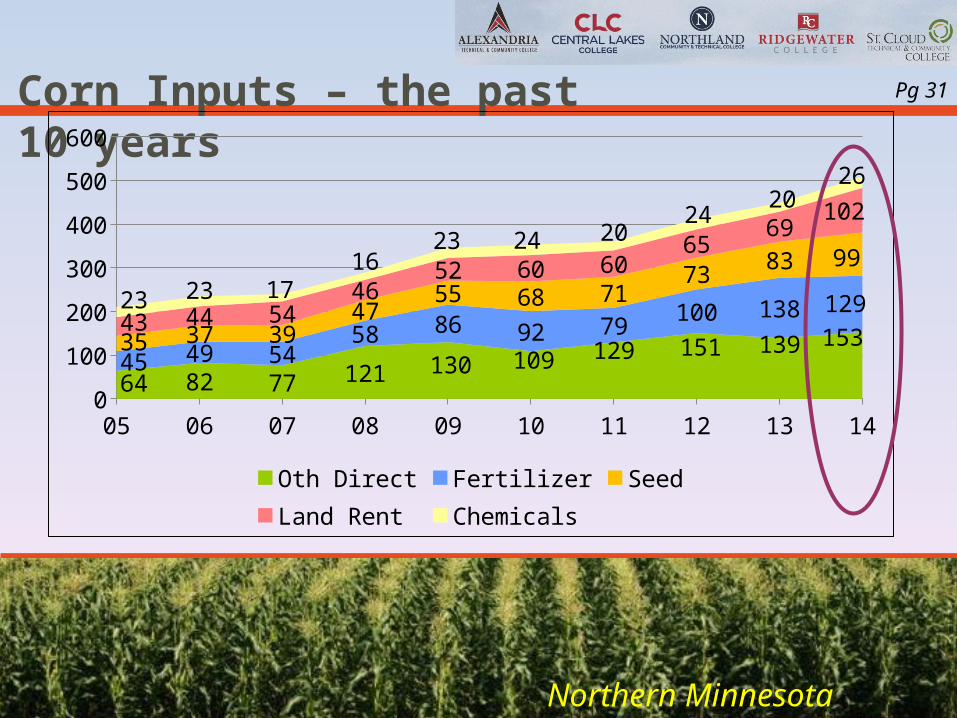
Corn Inputs – the past 10 years
05 06 07 08 09 10 11 12 13 140
100
200
300
400
500
600
64 82 77 121 130 109 129 151 139 15345 49 54
58 86 92 79100 138 129
35 37 3947
55 68 7173
83 99
43 44 5446
52 60 6065
69102
23 23 1716
23 24 2024
2026
Oth Direct Fertilizer Seed Land Rent Chemicals
Northern Minnesota
Pg 31

Costs of Production per Bushel for Corn (Cash Rent)
Direct Ex-pense
Dir & Ovhd Exp
Dir & Ovhd less Gov &
Oth Inc
Total with Lbr & Mgt
Average 4.31 5.17 4.24 4.6
High 3.53 4.28 2.97 3.3
0.501.502.503.504.505.50
Northern Minnesota
Pg 31

Soybeans (owned) Pg 32
2010 2011 2012 2013 2014
227.84259.44 285.21 288.53 289.37
35.2 31.537.8
33.4 33.0
Direct & Overhead Exp/Acre Yield/Acre
Net Return/Acre = $52.87
Northern Minnesota

2-year Soybean Data
2013 2014 2013 2014
Yield per Acre 30.60 32.83 33.36 33.02
Value per Unit $12.59 $9.78 $12.52 $9.73
Gross Revenue/Acre 402.48 342.20 428.34 342.25
Dir & Ovhd Expense/Acre
310.57 329.59 288.53 289.37
Net Return/Acre 91.91 12.61 139.81 52.87
Dir & Ovhd Expense/Unit
$10.15 $10.04 $8.65 $8.76
Rented Owned
Northern Minnesota
Pg 32-33

Soybean Inputs – the past 10 years
05 06 07 08 09 10 11 12 13 140
50
100
150
200
250
300
39 41 46 46 50 49 54 61 66 8112 10 13 23 21 21 27
40 35 3148 50 55
74 63 6378
79 79 6229 30
3438 48 50
5158 61 64
17 17 13
28 22 16
1918 19 21
Land Rent Fertilizer Oth Direct Seed Chemicals
Northern Minnesota
Pg 33

Corn Silage (owned) Pg 36
2010 2011 2012 2013 2014
380.24458.64 495.91 504.52
576.47
18.4 15.2 15.111.7
14.3
Direct & Overhead Exp/Acre Yield/Acre
Net Return/Acre = $9.68
Northern Minnesota
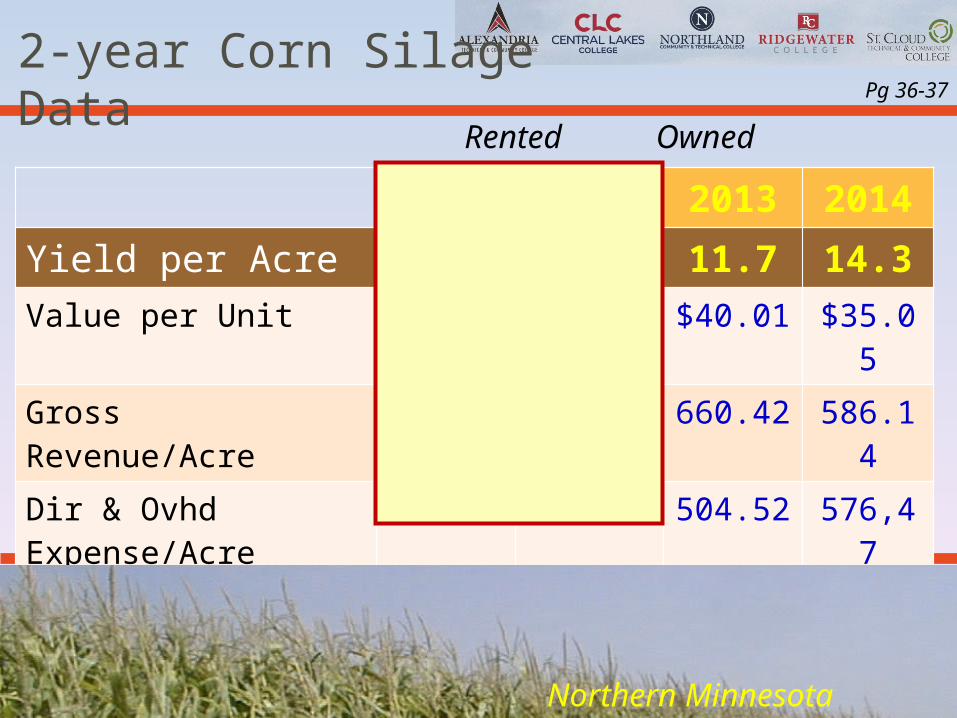
2-year Corn Silage Data
2013 2014 2013 2014
Yield per Acre 11.7 13.4 11.7 14.3Value per Unit $39.66 $35.02 $40.01 $35.05
Gross Revenue/Acre 661.38 575.04 660.42 586.14
Dir & Ovhd Expense/Acre
556.67 613.43 504.52 576,47
Net Return/Acre 104.71 -38.39 155.90 9.68
Dir & Ovhd Expense/Unit
$47.68 $45.86 $43.05 $40.28
Rented Owned
Pg 36-37
Northern Minnesota
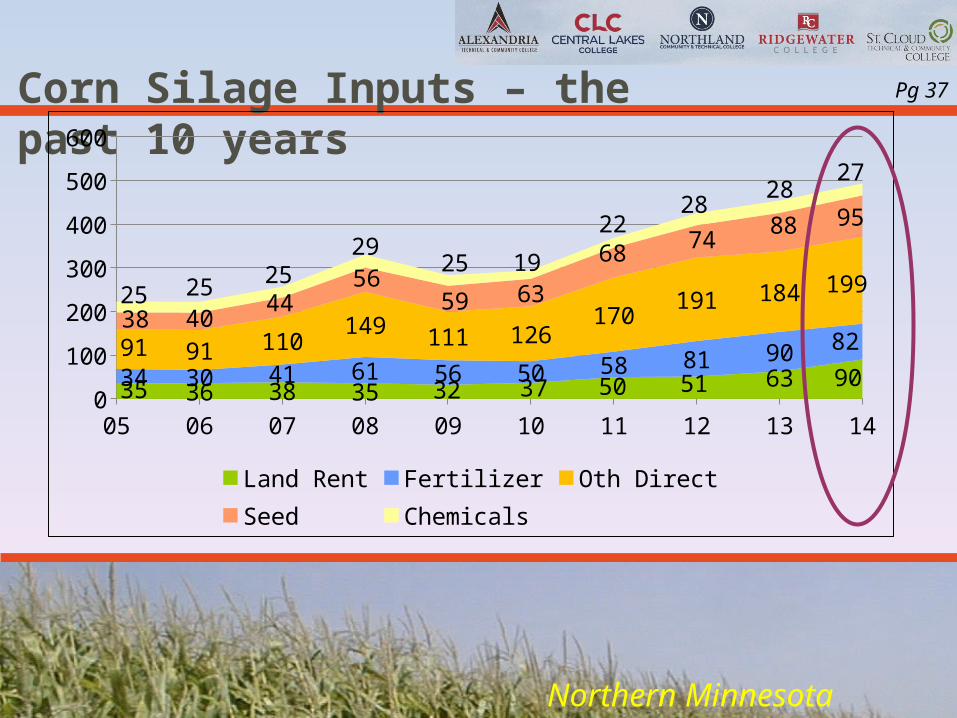
Corn Silage Inputs – the past 10 years
05 06 07 08 09 10 11 12 13 140
100
200
300
400
500
600
35 36 38 35 32 37 50 51 63 9034 30 41 61 56 50 58 81 90 8291 91 110149 111 126
170191 184 199
38 4044
5659 63
6874
88 95
25 2525
2925 19
2228
2827
Land Rent Fertilizer Oth Direct Seed Chemicals
Pg 37
Northern Minnesota

Corn Silage – Assigned value per Ton (cash rent)
2005 2006 2007 2008 2009 2010 2011 2012 2013 20140
10
20
30
40
50
60
20 2126 28 27
3038
49
4035
Northern Minnesota

Alfalfa Hay (owned) Pg 38
2010 2011 2012 2013 2014
233 248302 302
380
3.6 3.6 3.3 3.34.0
Direct & Overhead Exp/Acre Yield/Acre
Net Return/Acre = $337.71
Northern Minnesota

2-year Alfalfa Hay Data
2013 2014 2013 2014
Yield per Acre 3.50 3.69 3.30 4.04Value per Unit 147.45 174.36 153.38 176.49
Gross Revenue/Acre 524.28 646.88 520.81 717.56
Dir & Ovhd Expense/Acre
334.98 381.48 302.28 379.84
Net Return/Acre 189.30 265.40 218.54 337.71
Dir & Ovhd Expense/Unit
95.83 103.40 $91.64 $94.13
Rented Owned
Pg 38-39
Northern Minnesota

05 06 07 08 09 10 11 12 13 140
50
100
150
200
250
300
32 33 35 35 38 36 45 55 6484
17 17 18 25 26 24 3144 49
3967 69 72
95 79 85114
121127
148
1 1 22 4 2
33
46
Land Rent Fertilizer Oth Direct Chemicals
Alfalfa Hay Inputs – the past 10 years
Pg 39
Northern Minnesota

Spring Wheat (owned)
Pg 34
2010 2011 2012 2013 2014
307.94251.76 266.18
329.01 320.4
46.2 52.462.4 66.5 60.2
Direct & Overhead Exp/Acre Yield/Acre
Net Return/Acre = $32.83
Northern Minnesota
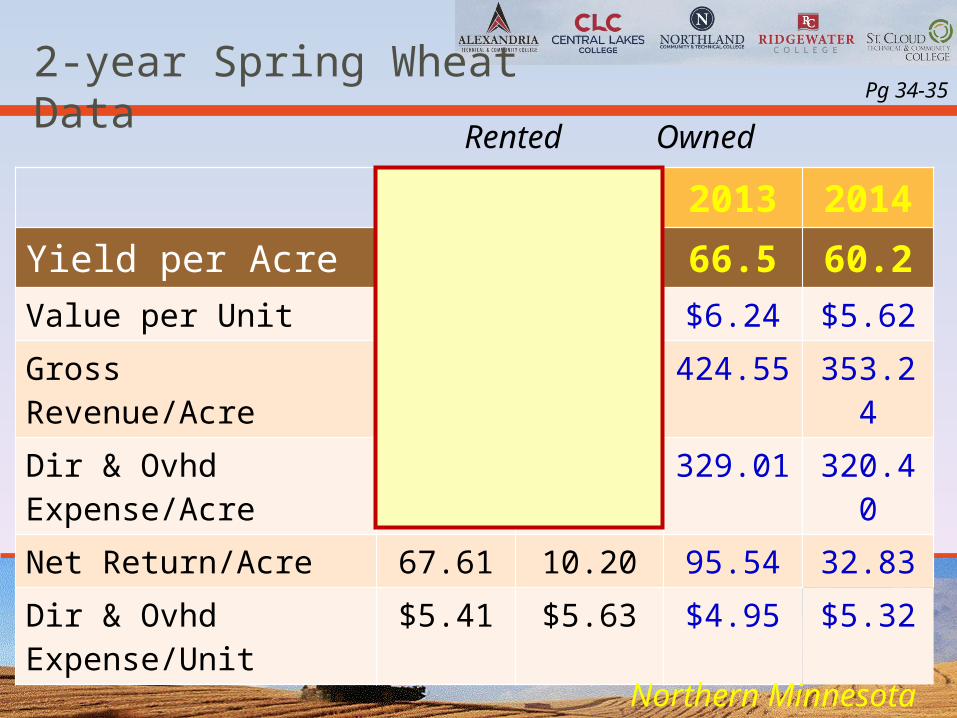
2-year Spring Wheat Data
2013 2014 2013 2014
Yield per Acre 65.7 62.4 66.5 60.2Value per Unit $6.32 $5.56 $6.24 $5.62
Gross Revenue/Acre 422.88 361.53 424.55 353.24
Dir & Ovhd Expense/Acre
355.27 351.33 329.01 320.40
Net Return/Acre 67.61 10.20 95.54 32.83
Dir & Ovhd Expense/Unit
$5.41 $5.63 $4.95 $5.32
Rented Owned
Pg 34-35
Northern Minnesota

05 06 07 08 09 10 11 12 13 140
20406080
100120140160180
39 44 4972
9067
90104 102 95
12 13 16
2820
17
2525 25
23
2017
23
2725
25
2929 30
29
Fertilizer Seed Chemicals
Spring Wheat Inputs – the past 10 years
Northern Minnesota
Pg 35

Net Return for Various Crops (Irrigated)
Corn Soybeans Corn Silage Alf. Hay-100.00
0.00
100.00
200.00
300.00
400.00
500.00
31.35 49.95
221.38
426.10
-79.26
79.37
181.74
478.01
Do
llar
s
Northern Minnesota
Pg 46-47

Net Return for Various Crops & Assigned Value (Organic)
Corn Soybeans Barley Corn Silage Alf. Hay-200.00
-100.00
0.00
100.00
200.00
300.00
400.00 358.22
273.51
64.71
-118.12
181.99
11.38 27.10 10.0161.91
167.74
Net Return
Value
Do
llar
s
Northern Minnesota
Pg 44-45


Break for the next presenter
Crop Enterprise Information