2014 ANNUAL REPORT - Tod's Spa€¦ · 2014 Annual Report 4Table of contents ... Distribution...
160
2014 ANNUAL REPORT
Transcript of 2014 ANNUAL REPORT - Tod's Spa€¦ · 2014 Annual Report 4Table of contents ... Distribution...
2014 ANNUAL REPORT
2014 Annual Report
4 Table of contents
TABLE OF CONTENTS
Letter to our Shareholders . . . . . . . . . . . . . . . . . . . . . . . . . . . . . . . . . . . . . . . . . . . . . . . . . . . . . . . . . . . . . . . . . 9Company’s data . . . . . . . . . . . . . . . . . . . . . . . . . . . . . . . . . . . . . . . . . . . . . . . . . . . . . . . . . . . . . . . . . . . . . . . . . . . 10Corporate Governance bodies . . . . . . . . . . . . . . . . . . . . . . . . . . . . . . . . . . . . . . . . . . . . . . . . . . . . . . . . . . . . . . 11TOD’S Group . . . . . . . . . . . . . . . . . . . . . . . . . . . . . . . . . . . . . . . . . . . . . . . . . . . . . . . . . . . . . . . . . . . . . . . . . . . . 12Group’s organizational chart . . . . . . . . . . . . . . . . . . . . . . . . . . . . . . . . . . . . . . . . . . . . . . . . . . . . . . . . . . . . . . . . 13Distribution network as of December 31st, 2014 . . . . . . . . . . . . . . . . . . . . . . . . . . . . . . . . . . . . . . . . . . . . . . . . 14Key consolidated financial figures . . . . . . . . . . . . . . . . . . . . . . . . . . . . . . . . . . . . . . . . . . . . . . . . . . . . . . . . . . . . 15Highlights of results . . . . . . . . . . . . . . . . . . . . . . . . . . . . . . . . . . . . . . . . . . . . . . . . . . . . . . . . . . . . . . . . . . . . . . . 16
TOD'S Group - Consolidated Financial Statements as at December 31st 2014Report on operations
Introduction . . . . . . . . . . . . . . . . . . . . . . . . . . . . . . . . . . . . . . . . . . . . . . . . . . . . . . . . . . . . . . . . . . . . . . . . . . . . . 29Group’s activity . . . . . . . . . . . . . . . . . . . . . . . . . . . . . . . . . . . . . . . . . . . . . . . . . . . . . . . . . . . . . . . . . . . . . . . . . . . 29Group’s brands . . . . . . . . . . . . . . . . . . . . . . . . . . . . . . . . . . . . . . . . . . . . . . . . . . . . . . . . . . . . . . . . . . . . . . . . . . . 30TOD’S Group for Social Commitment and the Environment . . . . . . . . . . . . . . . . . . . . . . . . . . . . . . . . . . . . . . . 31Main events and operations during the period . . . . . . . . . . . . . . . . . . . . . . . . . . . . . . . . . . . . . . . . . . . . . . . . . . 34The Group’s results in 2014 . . . . . . . . . . . . . . . . . . . . . . . . . . . . . . . . . . . . . . . . . . . . . . . . . . . . . . . . . . . . . . . . . 35Research and development . . . . . . . . . . . . . . . . . . . . . . . . . . . . . . . . . . . . . . . . . . . . . . . . . . . . . . . . . . . . . . . . . 42Reconciliation of the result for the period and net equity of the Group with the analogousvalues of the Parent Company . . . . . . . . . . . . . . . . . . . . . . . . . . . . . . . . . . . . . . . . . . . . . . . . . . . . . . . . . . . . . . . 42Corporate Governance . . . . . . . . . . . . . . . . . . . . . . . . . . . . . . . . . . . . . . . . . . . . . . . . . . . . . . . . . . . . . . . . . . . . 42Significant events occurred after the end of the period . . . . . . . . . . . . . . . . . . . . . . . . . . . . . . . . . . . . . . . . . . . 44Business outlook . . . . . . . . . . . . . . . . . . . . . . . . . . . . . . . . . . . . . . . . . . . . . . . . . . . . . . . . . . . . . . . . . . . . . . . . . 44Approval of Financial Statement . . . . . . . . . . . . . . . . . . . . . . . . . . . . . . . . . . . . . . . . . . . . . . . . . . . . . . . . . . . . . . 44
Financial Statements Consolidated Income Statement . . . . . . . . . . . . . . . . . . . . . . . . . . . . . . . . . . . . . . . . . . . . . . . . . . . . . . . . . . . . . . 46Consolidated Statement of Comprehensive Income . . . . . . . . . . . . . . . . . . . . . . . . . . . . . . . . . . . . . . . . . . . . . . 47Consolidated Statement of Financial Position . . . . . . . . . . . . . . . . . . . . . . . . . . . . . . . . . . . . . . . . . . . . . . . . . . . 48Consolidated Statement of Cash Flows . . . . . . . . . . . . . . . . . . . . . . . . . . . . . . . . . . . . . . . . . . . . . . . . . . . . . . . . 50Consolidated Statement of Changes in Equity . . . . . . . . . . . . . . . . . . . . . . . . . . . . . . . . . . . . . . . . . . . . . . . . . . . 51
Notes to the Consolidated Financial Statements 1. General notes . . . . . . . . . . . . . . . . . . . . . . . . . . . . . . . . . . . . . . . . . . . . . . . . . . . . . . . . . . . . . . . . . . . . . . . . 542. Basis of preparation . . . . . . . . . . . . . . . . . . . . . . . . . . . . . . . . . . . . . . . . . . . . . . . . . . . . . . . . . . . . . . . . . . . 543. Evaluation methods and accounting standards . . . . . . . . . . . . . . . . . . . . . . . . . . . . . . . . . . . . . . . . . . . . . . . 554. Scope of Consolidation . . . . . . . . . . . . . . . . . . . . . . . . . . . . . . . . . . . . . . . . . . . . . . . . . . . . . . . . . . . . . . . . . 665. Segment reporting . . . . . . . . . . . . . . . . . . . . . . . . . . . . . . . . . . . . . . . . . . . . . . . . . . . . . . . . . . . . . . . . . . . . 676. Management of financial risks (IFRS 7) . . . . . . . . . . . . . . . . . . . . . . . . . . . . . . . . . . . . . . . . . . . . . . . . . . . . . 697. Intangible fixed assets . . . . . . . . . . . . . . . . . . . . . . . . . . . . . . . . . . . . . . . . . . . . . . . . . . . . . . . . . . . . . . . . . . 728. Tangible fixed assets . . . . . . . . . . . . . . . . . . . . . . . . . . . . . . . . . . . . . . . . . . . . . . . . . . . . . . . . . . . . . . . . . . . . 749. Impairment losses . . . . . . . . . . . . . . . . . . . . . . . . . . . . . . . . . . . . . . . . . . . . . . . . . . . . . . . . . . . . . . . . . . . . . 7410. Investment property . . . . . . . . . . . . . . . . . . . . . . . . . . . . . . . . . . . . . . . . . . . . . . . . . . . . . . . . . . . . . . . . . . . 7511. Deferred tax assets and liabilities . . . . . . . . . . . . . . . . . . . . . . . . . . . . . . . . . . . . . . . . . . . . . . . . . . . . . . . . . 7612. Other non current assets . . . . . . . . . . . . . . . . . . . . . . . . . . . . . . . . . . . . . . . . . . . . . . . . . . . . . . . . . . . . . . . 7713. Inventories . . . . . . . . . . . . . . . . . . . . . . . . . . . . . . . . . . . . . . . . . . . . . . . . . . . . . . . . . . . . . . . . . . . . . . . . . . 7714. Trade receivables and other current assets . . . . . . . . . . . . . . . . . . . . . . . . . . . . . . . . . . . . . . . . . . . . . . . . . 7715. Derivative financial instruments. . . . . . . . . . . . . . . . . . . . . . . . . . . . . . . . . . . . . . . . . . . . . . . . . . . . . . . . . . . 7816. Cash and cash equivalents . . . . . . . . . . . . . . . . . . . . . . . . . . . . . . . . . . . . . . . . . . . . . . . . . . . . . . . . . . . . . . 7917. Assets available for sale . . . . . . . . . . . . . . . . . . . . . . . . . . . . . . . . . . . . . . . . . . . . . . . . . . . . . . . . . . . . . . . . 7918. Equity . . . . . . . . . . . . . . . . . . . . . . . . . . . . . . . . . . . . . . . . . . . . . . . . . . . . . . . . . . . . . . . . . . . . . . . . . . . . . . . 8019. Provisions and potential liabilities and assets . . . . . . . . . . . . . . . . . . . . . . . . . . . . . . . . . . . . . . . . . . . . . . . . 8120. Employee Benefits . . . . . . . . . . . . . . . . . . . . . . . . . . . . . . . . . . . . . . . . . . . . . . . . . . . . . . . . . . . . . . . . . . . . . 8321. Financial liabilities . . . . . . . . . . . . . . . . . . . . . . . . . . . . . . . . . . . . . . . . . . . . . . . . . . . . . . . . . . . . . . . . . . . . . 8422. Other non current liabilities . . . . . . . . . . . . . . . . . . . . . . . . . . . . . . . . . . . . . . . . . . . . . . . . . . . . . . . . . . . . . 8523. Trade payables and other current liabilities . . . . . . . . . . . . . . . . . . . . . . . . . . . . . . . . . . . . . . . . . . . . . . . . . 8624. Revenues . . . . . . . . . . . . . . . . . . . . . . . . . . . . . . . . . . . . . . . . . . . . . . . . . . . . . . . . . . . . . . . . . . . . . . . . . . . . 8625. Personnel costs . . . . . . . . . . . . . . . . . . . . . . . . . . . . . . . . . . . . . . . . . . . . . . . . . . . . . . . . . . . . . . . . . . . . . . . 8626. Financial income and expenses . . . . . . . . . . . . . . . . . . . . . . . . . . . . . . . . . . . . . . . . . . . . . . . . . . . . . . . . . . . 8727. Income taxes . . . . . . . . . . . . . . . . . . . . . . . . . . . . . . . . . . . . . . . . . . . . . . . . . . . . . . . . . . . . . . . . . . . . . . . . . 8728. Earnings per share . . . . . . . . . . . . . . . . . . . . . . . . . . . . . . . . . . . . . . . . . . . . . . . . . . . . . . . . . . . . . . . . . . . . . 8729. Transaction with related parties . . . . . . . . . . . . . . . . . . . . . . . . . . . . . . . . . . . . . . . . . . . . . . . . . . . . . . . . . . 8830. Events and significant non-recurring transactions . . . . . . . . . . . . . . . . . . . . . . . . . . . . . . . . . . . . . . . . . . . . 9131. Significant events occurred after the end of the period . . . . . . . . . . . . . . . . . . . . . . . . . . . . . . . . . . . . . . . 91
Report of Independent Auditors . . . . . . . . . . . . . . . . . . . . . . . . . . . . . . . . . . . . . . . . . . . . . . . . . . . . . . . . . . . . . . . . . 93
TOD'S S.p.A. – Annual Report as of December 31st, 2014Report on operations
Introduction . . . . . . . . . . . . . . . . . . . . . . . . . . . . . . . . . . . . . . . . . . . . . . . . . . . . . . . . . . . . . . . . . . . . . . . . . . . . . . 99Operating performances . . . . . . . . . . . . . . . . . . . . . . . . . . . . . . . . . . . . . . . . . . . . . . . . . . . . . . . . . . . . . . . . . . . 99Research and development . . . . . . . . . . . . . . . . . . . . . . . . . . . . . . . . . . . . . . . . . . . . . . . . . . . . . . . . . . . . . . . . . 103Information on Share Capital . . . . . . . . . . . . . . . . . . . . . . . . . . . . . . . . . . . . . . . . . . . . . . . . . . . . . . . . . . . . . . . . 103Corporate Governance . . . . . . . . . . . . . . . . . . . . . . . . . . . . . . . . . . . . . . . . . . . . . . . . . . . . . . . . . . . . . . . . . . . . 103Management and coordination activities . . . . . . . . . . . . . . . . . . . . . . . . . . . . . . . . . . . . . . . . . . . . . . . . . . . . . . . 105Significant events occurring after the end of the fiscal year . . . . . . . . . . . . . . . . . . . . . . . . . . . . . . . . . . . . . . . . 106Business outlook . . . . . . . . . . . . . . . . . . . . . . . . . . . . . . . . . . . . . . . . . . . . . . . . . . . . . . . . . . . . . . . . . . . . . . . . . 106Motion for allocation of the profit for the year . . . . . . . . . . . . . . . . . . . . . . . . . . . . . . . . . . . . . . . . . . . . . . . . . . 106
Financial Statements Income Statement . . . . . . . . . . . . . . . . . . . . . . . . . . . . . . . . . . . . . . . . . . . . . . . . . . . . . . . . . . . . . . . . . . . . . . . . 108Statement of Comphehensive Income . . . . . . . . . . . . . . . . . . . . . . . . . . . . . . . . . . . . . . . . . . . . . . . . . . . . . . . . . 109Statement of Financial Position . . . . . . . . . . . . . . . . . . . . . . . . . . . . . . . . . . . . . . . . . . . . . . . . . . . . . . . . . . . . . . . 110Statement of Cash Flows . . . . . . . . . . . . . . . . . . . . . . . . . . . . . . . . . . . . . . . . . . . . . . . . . . . . . . . . . . . . . . . . . . . 112Statement of Changes in Equity . . . . . . . . . . . . . . . . . . . . . . . . . . . . . . . . . . . . . . . . . . . . . . . . . . . . . . . . . . . . . . 113
Notes to the separate financial statements 1. General notes . . . . . . . . . . . . . . . . . . . . . . . . . . . . . . . . . . . . . . . . . . . . . . . . . . . . . . . . . . . . . . . . . . . . . . . . . . 1162. Basis of preparation . . . . . . . . . . . . . . . . . . . . . . . . . . . . . . . . . . . . . . . . . . . . . . . . . . . . . . . . . . . . . . . . . . . . . . 1163. Evaluation methods and accounting standards . . . . . . . . . . . . . . . . . . . . . . . . . . . . . . . . . . . . . . . . . . . . . . . . . 1164. Management of financial risks . . . . . . . . . . . . . . . . . . . . . . . . . . . . . . . . . . . . . . . . . . . . . . . . . . . . . . . . . . . . . . 1265. Intangible fixed assets . . . . . . . . . . . . . . . . . . . . . . . . . . . . . . . . . . . . . . . . . . . . . . . . . . . . . . . . . . . . . . . . . . . . 1296. Tangible fixed assets . . . . . . . . . . . . . . . . . . . . . . . . . . . . . . . . . . . . . . . . . . . . . . . . . . . . . . . . . . . . . . . . . . . . . 1307. Impairment losses . . . . . . . . . . . . . . . . . . . . . . . . . . . . . . . . . . . . . . . . . . . . . . . . . . . . . . . . . . . . . . . . . . . . . . . 1318. Investment property . . . . . . . . . . . . . . . . . . . . . . . . . . . . . . . . . . . . . . . . . . . . . . . . . . . . . . . . . . . . . . . . . . . . . 1329. Investments in subsidiaries, joint ventures and associated companies . . . . . . . . . . . . . . . . . . . . . . . . . . . . . . . 13210. Deferred taxes . . . . . . . . . . . . . . . . . . . . . . . . . . . . . . . . . . . . . . . . . . . . . . . . . . . . . . . . . . . . . . . . . . . . . . . . 13311. Other non current assets . . . . . . . . . . . . . . . . . . . . . . . . . . . . . . . . . . . . . . . . . . . . . . . . . . . . . . . . . . . . . . . . 13412. Inventories . . . . . . . . . . . . . . . . . . . . . . . . . . . . . . . . . . . . . . . . . . . . . . . . . . . . . . . . . . . . . . . . . . . . . . . . . . . 13413. Trade receivables and other current assets . . . . . . . . . . . . . . . . . . . . . . . . . . . . . . . . . . . . . . . . . . . . . . . . . . 13414. Derivative financial instruments . . . . . . . . . . . . . . . . . . . . . . . . . . . . . . . . . . . . . . . . . . . . . . . . . . . . . . . . . . . 13515. Cash and cash equivalents . . . . . . . . . . . . . . . . . . . . . . . . . . . . . . . . . . . . . . . . . . . . . . . . . . . . . . . . . . . . . . . 13616. Shareholders’ equity . . . . . . . . . . . . . . . . . . . . . . . . . . . . . . . . . . . . . . . . . . . . . . . . . . . . . . . . . . . . . . . . . . . . 13617. Provisions and contingent liabilities and assets . . . . . . . . . . . . . . . . . . . . . . . . . . . . . . . . . . . . . . . . . . . . . . . 13818. Employee benefits . . . . . . . . . . . . . . . . . . . . . . . . . . . . . . . . . . . . . . . . . . . . . . . . . . . . . . . . . . . . . . . . . . . . . . 13919. Financial liabilities . . . . . . . . . . . . . . . . . . . . . . . . . . . . . . . . . . . . . . . . . . . . . . . . . . . . . . . . . . . . . . . . . . . . . . . 14020. Other non current liabilities . . . . . . . . . . . . . . . . . . . . . . . . . . . . . . . . . . . . . . . . . . . . . . . . . . . . . . . . . . . . . . 14121. Trade payables and other current liabilities . . . . . . . . . . . . . . . . . . . . . . . . . . . . . . . . . . . . . . . . . . . . . . . . . . 14122. Revenues . . . . . . . . . . . . . . . . . . . . . . . . . . . . . . . . . . . . . . . . . . . . . . . . . . . . . . . . . . . . . . . . . . . . . . . . . . . . . 14123. Personnel costs . . . . . . . . . . . . . . . . . . . . . . . . . . . . . . . . . . . . . . . . . . . . . . . . . . . . . . . . . . . . . . . . . . . . . . . . 14224. Financial income and expenses . . . . . . . . . . . . . . . . . . . . . . . . . . . . . . . . . . . . . . . . . . . . . . . . . . . . . . . . . . . . 14225. Income from subsidiaries . . . . . . . . . . . . . . . . . . . . . . . . . . . . . . . . . . . . . . . . . . . . . . . . . . . . . . . . . . . . . . . . . 14226. Income taxes . . . . . . . . . . . . . . . . . . . . . . . . . . . . . . . . . . . . . . . . . . . . . . . . . . . . . . . . . . . . . . . . . . . . . . . . . . 14327. Earnings per share . . . . . . . . . . . . . . . . . . . . . . . . . . . . . . . . . . . . . . . . . . . . . . . . . . . . . . . . . . . . . . . . . . . . . . 14328. Transactions with related parties . . . . . . . . . . . . . . . . . . . . . . . . . . . . . . . . . . . . . . . . . . . . . . . . . . . . . . . . . . 14429. Events and significant non-recurring transactions . . . . . . . . . . . . . . . . . . . . . . . . . . . . . . . . . . . . . . . . . . . . . . 14830. Independent Auditors compensation . . . . . . . . . . . . . . . . . . . . . . . . . . . . . . . . . . . . . . . . . . . . . . . . . . . . . . . 14831. Significant events occurring after the end of the fiscal year . . . . . . . . . . . . . . . . . . . . . . . . . . . . . . . . . . . . . 148 32. Certification of the Separate Financial Statements of TOD’S S.p.A. and the Consolidated Financial
Statements of the TOD’S Group pursuant to Article 81-ter of Consob Regulation no. 11971 of May 14th, 1999, as amended . . . . . . . . . . . . . . . . . . . . . . . . . . . . . . . . . . . . . . . . . . . . . . . . . . . . . . . . . . . . . 149
Report of the Board of Statutory Auditors . . . . . . . . . . . . . . . . . . . . . . . . . . . . . . . . . . . . . . . . . . . . . . . . . . . . . . . . . 151Report of Independent Auditors . . . . . . . . . . . . . . . . . . . . . . . . . . . . . . . . . . . . . . . . . . . . . . . . . . . . . . . . . . . . . . . . . . 155
2014 Annual Report
5 Table of contents


2014 Annual report
DIEGO DELLA VALLEChairman and Chief Executive Officer
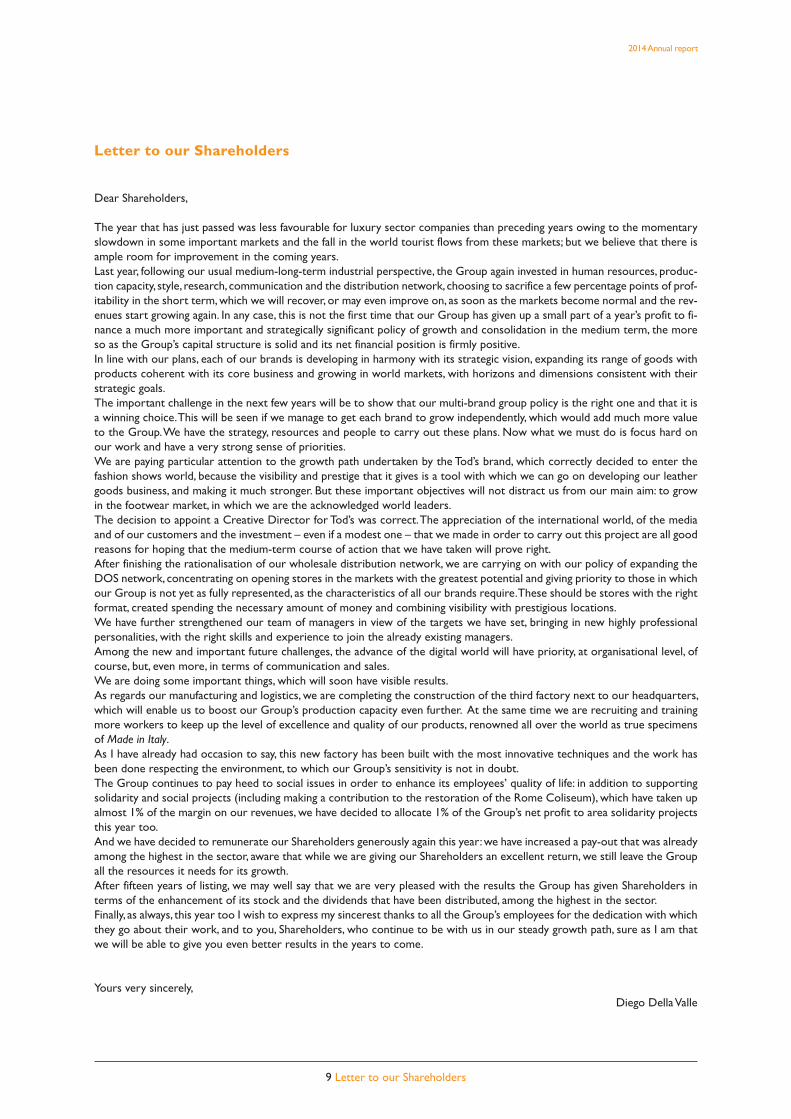
Letter to our Shareholders
Dear Shareholders,
The year that has just passed was less favourable for luxury sector companies than preceding years owing to the momentary
slowdown in some important markets and the fall in the world tourist flows from these markets; but we believe that there is
ample room for improvement in the coming years.
Last year, following our usual medium-long-term industrial perspective, the Group again invested in human resources, produc-
tion capacity, style, research, communication and the distribution network, choosing to sacrifice a few percentage points of prof-
itability in the short term, which we will recover, or may even improve on, as soon as the markets become normal and the rev-
enues start growing again. In any case, this is not the first time that our Group has given up a small part of a year’s profit to fi-
nance a much more important and strategically significant policy of growth and consolidation in the medium term, the more
so as the Group’s capital structure is solid and its net financial position is firmly positive.
In line with our plans, each of our brands is developing in harmony with its strategic vision, expanding its range of goods with
products coherent with its core business and growing in world markets, with horizons and dimensions consistent with their
strategic goals.
The important challenge in the next few years will be to show that our multi-brand group policy is the right one and that it is
a winning choice. This will be seen if we manage to get each brand to grow independently, which would add much more value
to the Group. We have the strategy, resources and people to carry out these plans. Now what we must do is focus hard on
our work and have a very strong sense of priorities.
We are paying particular attention to the growth path undertaken by the Tod’s brand, which correctly decided to enter the
fashion shows world, because the visibility and prestige that it gives is a tool with which we can go on developing our leather
goods business, and making it much stronger. But these important objectives will not distract us from our main aim: to grow
in the footwear market, in which we are the acknowledged world leaders.
The decision to appoint a Creative Director for Tod’s was correct. The appreciation of the international world, of the media
and of our customers and the investment – even if a modest one – that we made in order to carry out this project are all good
reasons for hoping that the medium-term course of action that we have taken will prove right.
After finishing the rationalisation of our wholesale distribution network, we are carrying on with our policy of expanding the
DOS network, concentrating on opening stores in the markets with the greatest potential and giving priority to those in which
our Group is not yet as fully represented, as the characteristics of all our brands require. These should be stores with the right
format, created spending the necessary amount of money and combining visibility with prestigious locations.
We have further strengthened our team of managers in view of the targets we have set, bringing in new highly professional
personalities, with the right skills and experience to join the already existing managers.
Among the new and important future challenges, the advance of the digital world will have priority, at organisational level, of
course, but, even more, in terms of communication and sales.
We are doing some important things, which will soon have visible results.
As regards our manufacturing and logistics, we are completing the construction of the third factory next to our headquarters,
which will enable us to boost our Group’s production capacity even further. At the same time we are recruiting and training
more workers to keep up the level of excellence and quality of our products, renowned all over the world as true specimens
of Made in Italy.As I have already had occasion to say, this new factory has been built with the most innovative techniques and the work has
been done respecting the environment, to which our Group’s sensitivity is not in doubt.
The Group continues to pay heed to social issues in order to enhance its employees’ quality of life: in addition to supporting
solidarity and social projects (including making a contribution to the restoration of the Rome Coliseum), which have taken up
almost 1% of the margin on our revenues, we have decided to allocate 1% of the Group’s net profit to area solidarity projects
this year too.
And we have decided to remunerate our Shareholders generously again this year: we have increased a pay-out that was already
among the highest in the sector, aware that while we are giving our Shareholders an excellent return, we still leave the Group
all the resources it needs for its growth.
After fifteen years of listing, we may well say that we are very pleased with the results the Group has given Shareholders in
terms of the enhancement of its stock and the dividends that have been distributed, among the highest in the sector.
Finally, as always, this year too I wish to express my sincerest thanks to all the Group’s employees for the dedication with which
they go about their work, and to you, Shareholders, who continue to be with us in our steady growth path, sure as I am that
we will be able to give you even better results in the years to come.
Yours very sincerely,
Diego Della Valle
2014 Annual report
9 Letter to our Shareholders
2014 Annual Report
10 Company’s data
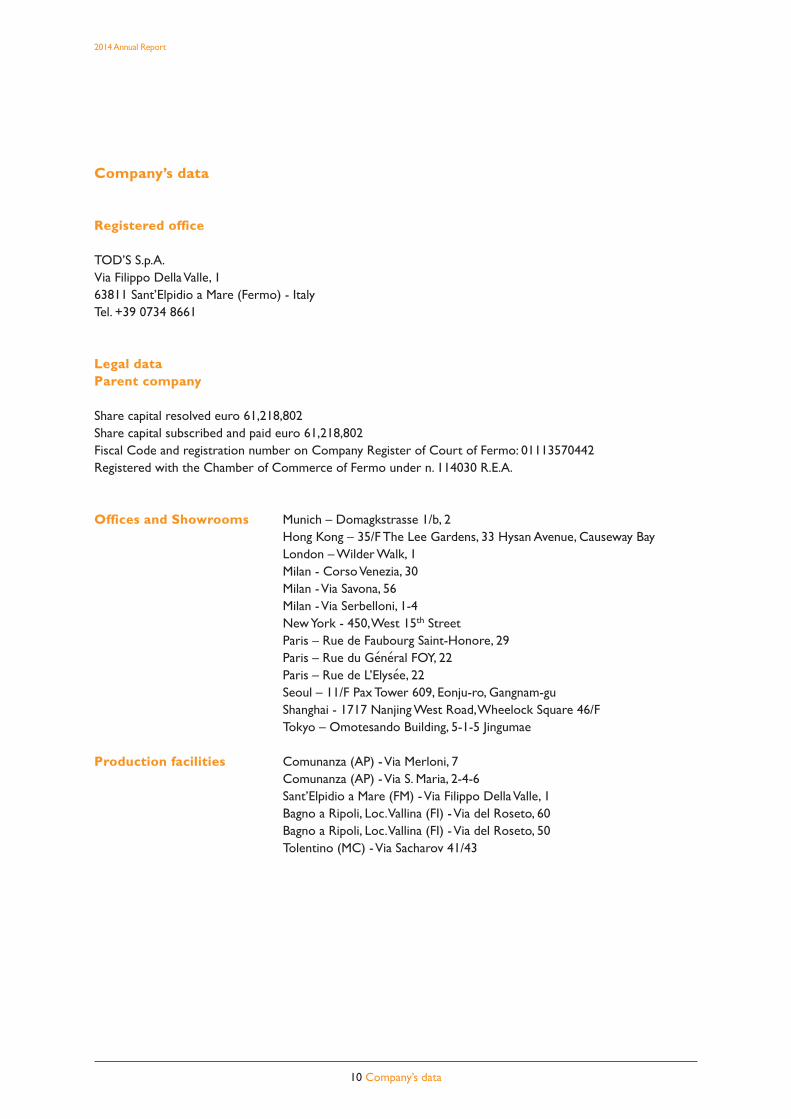
Company’s data
Registered office
TOD’S S.p.A.Via Filippo Della Valle, 163811 Sant’Elpidio a Mare (Fermo) - ItalyTel. +39 0734 8661
Legal data Parent company
Share capital resolved euro 61,218,802Share capital subscribed and paid euro 61,218,802Fiscal Code and registration number on Company Register of Court of Fermo: 01113570442Registered with the Chamber of Commerce of Fermo under n. 114030 R.E.A.
Offices and Showrooms Munich – Domagkstrasse 1/b, 2Hong Kong – 35/F The Lee Gardens, 33 Hysan Avenue, Causeway Bay London – Wilder Walk, 1Milan - Corso Venezia, 30Milan - Via Savona, 56Milan - Via Serbelloni, 1-4New York - 450, West 15th StreetParis – Rue de Faubourg Saint-Honore, 29Paris – Rue du General FOY, 22Paris – Rue de L’Elysee, 22Seoul – 11/F Pax Tower 609, Eonju-ro, Gangnam-guShanghai - 1717 Nanjing West Road, Wheelock Square 46/FTokyo – Omotesando Building, 5-1-5 Jingumae
Production facilities Comunanza (AP) - Via Merloni, 7Comunanza (AP) - Via S. Maria, 2-4-6Sant’Elpidio a Mare (FM) - Via Filippo Della Valle, 1Bagno a Ripoli, Loc. Vallina (FI) - Via del Roseto, 60Bagno a Ripoli, Loc. Vallina (FI) - Via del Roseto, 50Tolentino (MC) - Via Sacharov 41/43
2014 Annual Report
11 Corporate Governance bodies
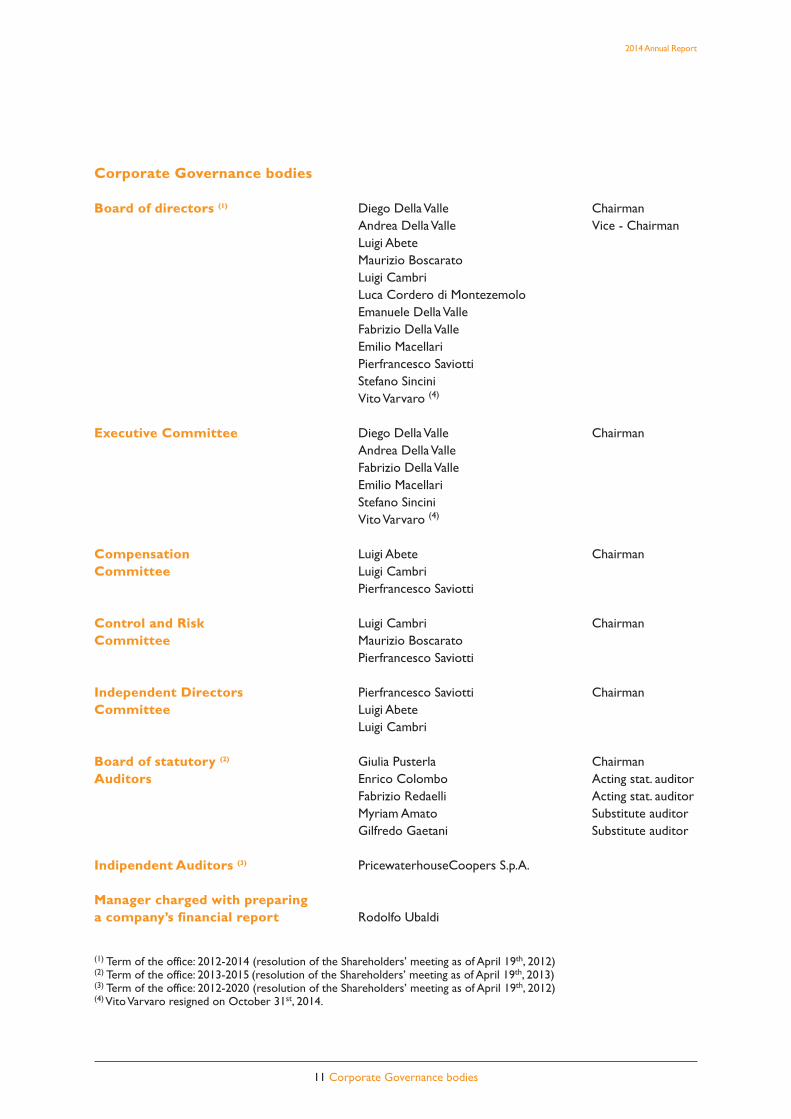
Corporate Governance bodies
Board of directors (1) Diego Della Valle ChairmanAndrea Della Valle Vice - ChairmanLuigi AbeteMaurizio BoscaratoLuigi CambriLuca Cordero di MontezemoloEmanuele Della ValleFabrizio Della ValleEmilio MacellariPierfrancesco SaviottiStefano SinciniVito Varvaro (4)
Executive Committee Diego Della Valle ChairmanAndrea Della ValleFabrizio Della ValleEmilio MacellariStefano SinciniVito Varvaro (4)
Compensation Luigi Abete ChairmanCommittee Luigi Cambri
Pierfrancesco Saviotti
Control and Risk Luigi Cambri ChairmanCommittee Maurizio Boscarato
Pierfrancesco Saviotti
Independent Directors Pierfrancesco Saviotti ChairmanCommittee Luigi Abete
Luigi Cambri
Board of statutory (2) Giulia Pusterla ChairmanAuditors Enrico Colombo Acting stat. auditor
Fabrizio Redaelli Acting stat. auditorMyriam Amato Substitute auditorGilfredo Gaetani Substitute auditor
Indipendent Auditors (3) PricewaterhouseCoopers S.p.A.
Manager charged with preparinga company’s financial report Rodolfo Ubaldi
(1) Term of the office: 2012-2014 (resolution of the Shareholders’ meeting as of April 19th, 2012)(2) Term of the office: 2013-2015 (resolution of the Shareholders’ meeting as of April 19th, 2013)(3) Term of the office: 2012-2020 (resolution of the Shareholders’ meeting as of April 19th, 2012)(4) Vito Varvaro resigned on October 31st, 2014.

2014 Annual Report
12 Composition of the Group
TOD’S Group
TOD’S S.p.A.Parent Company, owner of TOD’S, HOGAN and FAY brands and licensee of ROGER VIVIER brand
Del.Com. S.r.l.Sub-holding for operation of national subsi-diaries and DOS in Italy
TOD’S International B.V.Sub-holding for operation of internationalsubsidiaries and DOS in The Netherlands
An.Del. Usa Inc.Sub-holding for operation of subsidiaries inthe United States
Del.Pav S.r.l.Company that operates DOS in Italy
Filangieri 29 S.r.l.Company that operates DOS in Italy
Gen.del. SACompany that operates DOS in Switzerland
TOD’S Belgique S.p.r.l.Company that operates DOS in Belgium
TOD’S Deutschland GmbhCompany that distributes and promotesproducts in Germany and manages DOS in Germany
TOD’S Espana SLCompany that distributes and promotesproducts in Spain and manages DOS in Spain
TOD’S France SasCompany that distributes and promotesproducts in France and manages DOSinFrance
TOD’S Luxembourg S.A.Company that operates DOS inLuxembourg
TOD’S Hong Kong LtdCompany that distributes and promotesproducts branded TOD’S and HOGAN inFar East and South Pacific and managesDOS in Hong Kong. Sub-holding for opera-tion of international subsidiaries in Asia
TOD’S Japan KKCompany that operates DOS in Japan
TOD’S Korea Inc.Company that distributes and promotesproducts branded TOD’S in Korea and operates DOS branded TOD’S in Korea
TOD’S Macao LtdCompany that operates DOS in Macao
TOD’S Retail India Private LtdCompany that operates DOS in India.
TOD’S (Shanghai) Trading Co. LtdCompany that operates DOS branded TOD’S and HOGAN in China
TOD’S Singapore Pte LtdCompany that operates DOS branded TOD’S in Singapore
TOD’S UK LtdCompany that distributes and promotesproducts in Great Britain and manages DOS in Great Britain
Webcover LtdCompany that operates DOS in GreatBritain
Cal.Del. Usa Inc.Company that operates DOS in California(USA)
Deva Inc.Company that distributes and promotesproducts in North America, and managesDOS in the State of NY (USA)
Flor. Del. Usa Inc.Company that operates DOS in Florida(USA)
Hono. Del. Inc.Company that operates DOS in Hawaii(USA)
Il. Del. Usa Inc.Company that operates DOS in Illinois(USA)
Neva. Del. Inc.Company that operates DOS in Nevada(USA)
Or. Del. Usa Inc.Company that operates DOS in California(USA)
TOD’S Tex. Del. Usa Inc.Company that operates DOS in Texas(USA)
Holpaf B.V.Real estate company that operates oneDOS in Japan
Alban.Del Sh.p.k.Production company
Sandel SANot operating company
Un.Del. KftProduction company.
Re.Se.Del. S.r.l.Company for services
TOD’S Brasil LtdaCompany that operates DOS in Brazil
Partecipazioni Internazionali S.r.l.Sub-holding for operation of internationalsubsidiaries and DOS in Italy
Roger Vivier Hong Kong LtdCompany that distributes and promotesproducts branded ROGER VIVIER in FarEast and South Pacific and manages DOS inHong Kong. Sub-holding for operation ofsubsidiaries in Asia
Roger Vivier Singapore Pte LtdCompany that operates DOS in Singapore
Roger Vivier (Shanghai) Trading Co. LtdCompany that operates DOS in China
Roger Vivier UK LtdCompany that operates DOS in Great Britain
TOD’S Georgia Inc.Not operating company
Roger Vivier France SasCompany that operates DOS in France
Roger Vivier Korea Inc.Company that operates DOS in Korea
Roger Vivier Switzerland S.A.Not operating company
Roger Vivier Macau Ltd.Not operating company
Roger Vivier Japan KKCompany that operates DOS in Japan
TOD’S Danmark APSNot operating company
2014 Annual Report
13 Composition of the Group
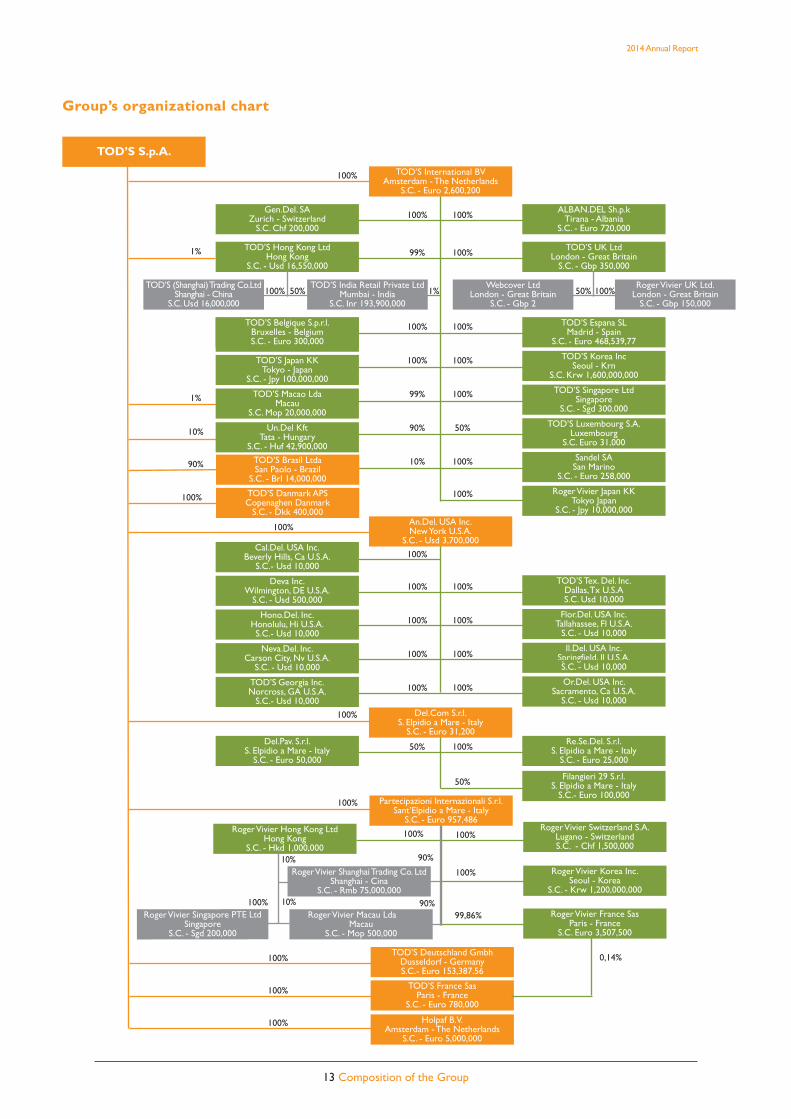
Group’s organizational chart
TOD’S S.p.A.
Gen.Del. SAZurich - Switzerland
S.C. Chf 200,000
TOD’S Belgique S.p.r.l.Bruxelles - BelgiumS.C. - Euro 300,000
TOD’S Japan KKTokyo - Japan
S.C. - Jpy 100,000,000
TOD’S Macao LdaMacau
S.C. Mop 20,000,000
Un.Del KftTata - Hungary
S.C. - Huf 42,900,000
Cal.Del. USA Inc.Beverly Hills, Ca U.S.A.
S.C.- Usd 10,000
Deva Inc.Wilmington, DE U.S.A.
S.C. - Usd 500,000
Hono.Del. Inc.Honolulu, Hi U.S.A.S.C.- Usd 10,000
Neva.Del. Inc.Carson City, Nv U.S.A.
S.C. - Usd 10,000
Del.Pav. S.r.l.S. Elpidio a Mare - Italy
S.C. - Euro 50,000
TOD’S Espana SLMadrid - Spain
S.C. - Euro 468,539,77
TOD’S Korea Inc Seoul - Krn
S.C. Krw 1,600,000,000
TOD’S Singapore LtdSingapore
S.C. - Sgd 300,000
TOD’S Luxembourg S.A.Luxembourg
S.C. Euro 31,000
Sandel SASan Marino
S.C. - Euro 258,000
Roger Vivier Japan KKTokyo Japan
S.C. - Jpy 10,000,000
TOD’S Tex. Del. Inc.Dallas, Tx U.S.AS.C. Usd 10,000
Flor.Del. USA Inc.Tallahassee, Fl U.S.A.
S.C. - Usd 10,000
Il.Del. USA Inc.Springfield, Il U.S.A.S.C. - Usd 10,000
Or.Del. USA Inc. Sacramento, Ca U.S.A.
S.C. - Usd 10,000
Re.Se.Del. S.r.l.S. Elpidio a Mare - Italy
S.C. - Euro 25,000
Filangieri 29 S.r.l.S. Elpidio a Mare - Italy
S.C.- Euro 100,000
TOD’S International BVAmsterdam - The Netherlands
S.C. - Euro 2,600,200
TOD’S Deutschland GmbhDusseldorf - GermanyS.C.- Euro 153,387.56
Holpaf B.V.Amsterdam - The Netherlands
S.C. - Euro 5,000,000
ALBAN.DEL Sh.p.kTirana - Albania
S.C. - Euro 720,000
TOD’S India Retail Private LtdMumbai - India
S.C. Inr 193,900,000
An.Del. USA Inc.New York U.S.A.
S.C. - Usd 3,700,000
Del.Com S.r.l.S. Elpidio a Mare - Italy
S.C. - Euro 31,200
100%
99%
100%
100%
99%
90%
10%
1%
1%
10%
90%
100%
100%
100%
100%
TOD’S Georgia Inc.Norcross, GA U.S.A.
S.C.- Usd 10,000100% 100%
50%
100%
100%
100%
100%
100%
50%
100%
100%
100%
100%
100%
100%
50%
100%
100%
TOD’S France SasParis - France
S.C. - Euro 780,000
Roger Vivier Hong Kong LtdHong Kong
S.C. - Hkd 1,000,000
Roger Vivier Shanghai Trading Co. LtdShanghai - Cina
S.C. - Rmb 75,000,000
Roger Vivier Singapore PTE LtdSingapore
S.C. - Sgd 200,000
Roger Vivier Macau LdaMacau
S.C. - Mop 500,000
100%
100%
Partecipazioni Internazionali S.r.l.Sant’Elpidio a Mare - Italy
S.C. - Euro 957,486
100%
100%
100%
TOD’S (Shanghai) Trading Co.LtdShanghai - China
S.C. Usd 16,000,000
TOD’S UK LtdLondon - Great Britain
S.C. - Gbp 350,000
TOD’S Hong Kong LtdHong Kong
S.C. - Usd 16,550,000
100% 50% 1%Webcover Ltd
London - Great BritainS.C. - Gbp 2
50%
100%
TOD’S Brasil LtdaSan Paolo - Brazil
S.C. - Brl 14,000,000
100% TOD’S Danmark APSCopenaghen Danmark
S.C. - Dkk 400,000
Roger Vivier UK Ltd.London - Great Britain
S.C. - Gbp 150,000100%
100%
90%10%
10%
100%
100% 90%
Roger Vivier Switzerland S.A.Lugano - SwitzerlandS.C. - Chf 1,500,000
Roger Vivier Korea Inc.Seoul - Korea
S.C. - Krw 1,200,000,000
99,86% Roger Vivier France SasParis - France
S.C. Euro 3,507,500
0,14%
2014 Annual Report
14 Distribution network
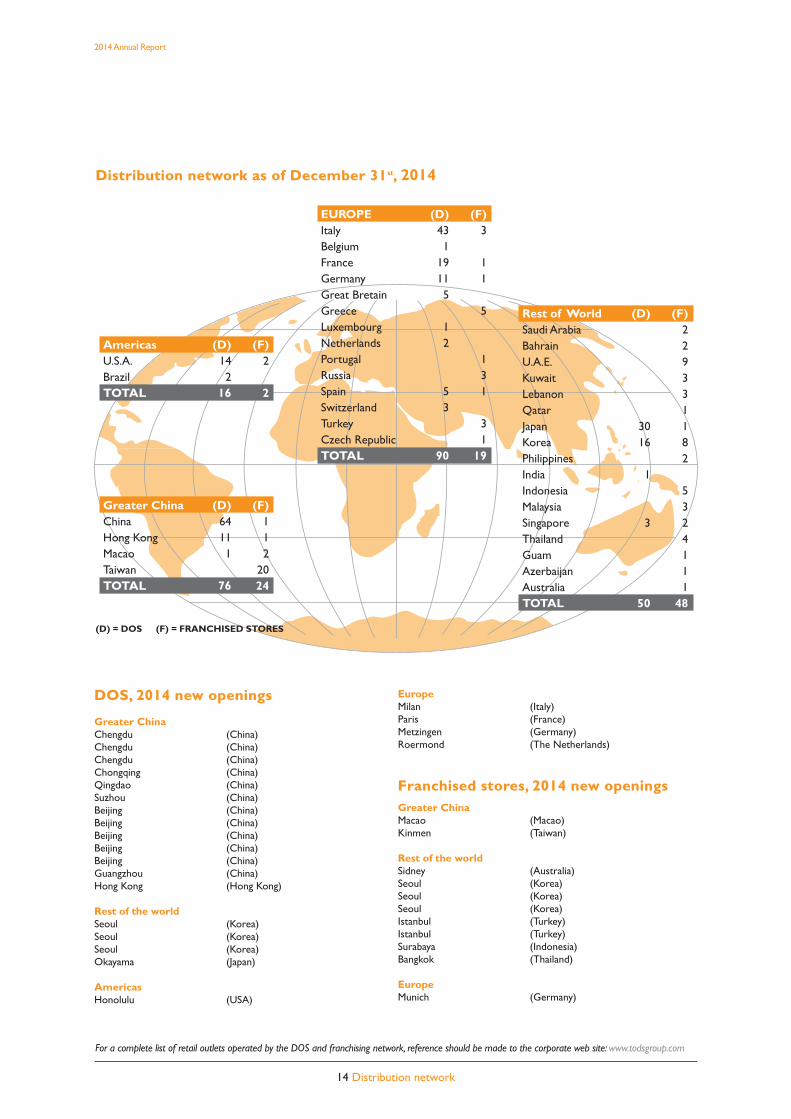
DOS, 2014 new openings
Greater ChinaChengdu (China)Chengdu (China)Chengdu (China)Chongqing (China)Qingdao (China)Suzhou (China)Beijing (China)Beijing (China)Beijing (China)Beijing (China)Beijing (China)Guangzhou (China)Hong Kong (Hong Kong)
Rest of the worldSeoul (Korea) Seoul (Korea) Seoul (Korea) Okayama (Japan)
AmericasHonolulu (USA)
EuropeMilan (Italy)Paris (France) Metzingen (Germany) Roermond (The Netherlands)
Franchised stores, 2014 new openingsGreater ChinaMacao (Macao)Kinmen (Taiwan)
Rest of the worldSidney (Australia)Seoul (Korea)Seoul (Korea)Seoul (Korea)Istanbul (Turkey)Istanbul (Turkey)Surabaya (Indonesia)Bangkok (Thailand)
EuropeMunich (Germany)
For a complete list of retail outlets operated by the DOS and franchising network, reference should be made to the corporate web site: www.todsgroup.com
EUROPE (D) (F)Italy 43 3Belgium 1France 19 1Germany 11 1Great Bretain 5Greece 5Luxembourg 1Netherlands 2Portugal 1Russia 3Spain 5 1Switzerland 3Turkey 3Czech Republic 1TOTAL 90 19
Greater China (D) (F)China 64 1Hong Kong 11 1Macao 1 2Taiwan 20TOTAL 76 24
Rest of World (D) (F)Saudi Arabia 2Bahrain 2U.A.E. 9Kuwait 3Lebanon 3Qatar 1Japan 30 1Korea 16 8Philippines 2India 1Indonesia 5Malaysia 3Singapore 3 2Thailand 4Guam 1Azerbaijan 1Australia 1TOTAL 50 48
Americas (D) (F)U.S.A. 14 2Brazil 2TOTAL 16 2
(D) = DOS (F) = FRANCHISED STORES
Distribution network as of December 31st, 2014

2014 Annual Report
15 Key consolidated financial figures
Key consolidated financial figures
P&L key figures (euro mn)
FY 14 FY 13 FY 12
Revenues 965.5 967.5 963.1
EBITDA 193.5 20.0% 236.3 24.4% 250.2 26.0%
EBIT 148.2 15.3% 193.2 20.0% 208.8 21.7%
Profit before tax 144.4 15.0% 191.2 19.8% 207.7 21.6%
Profit for the period 96.8 10.0% 134.0 13.9% 145.7 15.1%
Key Balance Sheet figures (euro mn)
Dec. 31st, 14 Dec. 31st, 13 Dec. 31st, 12
Net working capital (*) 418.7 437.4 410.5
Net fixed capital 411.4 388.7 393.2
Shareholders’ equity 814.6 801.1 763.1
Net financial position 130.0 181.1 103.7
Capital expenditures 64.5 51.4 49.9
(*) Current Assets - Current Liabilities
Financial key figures (euro mn)
Dec. 31st, 14 Dec. 31st, 13 Dec. 31st, 12
Free cash flow (52.1) 65.8 (16.7)
Self financing 141. 1 172.9 180.4
Cash flow from operation 90.4 206.9 111.3
2014 Revenues - % by brand
2014 Revenues - % by region
2014 Revenues - % by product
TOD’S 58.9%
HOGAN 22.0%
FAY 5.9%
ROGERVIVIER 13.1%
Amer.9.0%
GreaterChina23.4%
RoW12.5%
Italy32.2%
Leathergoods16.1%
Appar.6.8%
Shoes77.0%
Other0.1%
Other0.1%
Europe22.9%

2014 Annual Report
16 Highlights of results
Highlights of results
Revenues: 2014 revenues of 965.5 million euros, in line with2013. The DOS network had sales of 616 million euros (-0.3%).
EBITDA: this totalled 193.5 million euros (236.3 millioneuros in 2013). The ratio of EBITDA to sales is 20.0%.
EBIT: this totalled 148.2 million euros (193.2 million eurosin 2013), The ratio of EBITDA to sales is 15.3%.
Net profit: consolidated net profit for FY 2014 was 96.8million euros, representing 10% of consolidated sales.
Net financial position (NFP): the Group had 165.9million euros in liquid assets at December 31st, 2014 (228.2million euros in 2013). The net financial position at the samedate was 130 million euros (181.1 million euros in 2013).
Capital expenditure: amount to 64.5 million euros capitalexpenditures occurred in 2014, were 51.4 million euros in2013.
Distribution network: a total of 22 new DOS wereopened during the financial year. At December 31st, 2014 thesingle brand distribution network comprised 232 DOS and93 franchised stores.
Revenues (euro mn)
FY 14 FY 14 FY 13 FY 12comp. ex.rates basis
965.5970.8 967.5 963.1
EBITDA (euro mn)
FY 14 FY 14 FY 13 FY 12comp. ex.rates basis
193.5197.5
236.3250.2
EBIT (euro mn)
FY 14 FY 14 FY 13 FY 12comp. ex.rates basis
148.2152.1
193.2
208.8
NFP (milioni di euro)
Free Cash FY 14 FY 13 FY 12Flow (*)
130.0
30.8
181.1
103.7
(*) gross of dividends
2014 Annual Report
17 Highlights of results
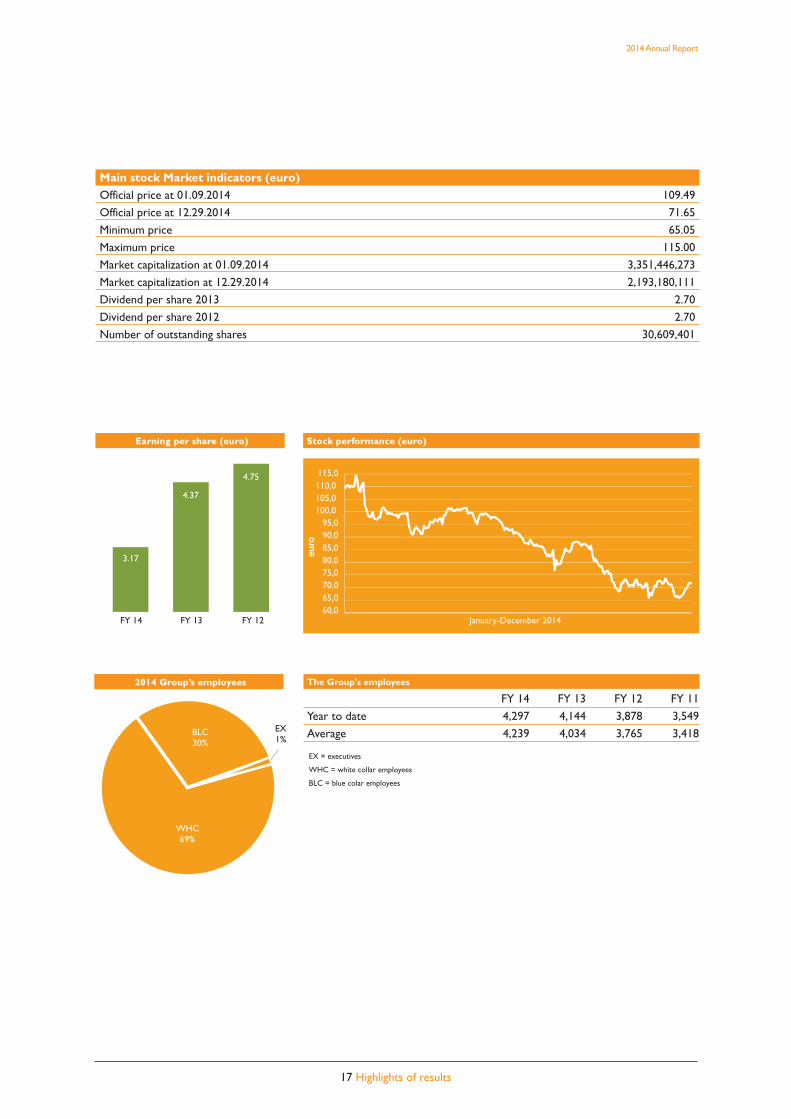
The Group's employees
FY 14 FY 13 FY 12 FY 11
Year to date 4,297 4,144 3,878 3,549
Average 4,239 4,034 3,765 3,418
EX = executives
WHC = white collar employees
BLC = blue colar employees
Earning per share (euro) Stock performance (euro)
2014 Group’s employees
BLC30%
WHC69%
EX1%
Main stock Market indicators (euro)Official price at 01.09.2014 109.49
Official price at 12.29.2014 71.65
Minimum price 65.05
Maximum price 115.00
Market capitalization at 01.09.2014 3,351,446,273
Market capitalization at 12.29.2014 2,193,180,111
Dividend per share 2013 2.70
Dividend per share 2012 2.70
Number of outstanding shares 30,609,401
115,0110,0105,0100,0
95,090,085,080,075,070,065,060,0
January-December 2014
4.37
3.17
4.75
FY 14 FY 13 FY 12

[THIS PAGE HAS BEEN INTENTIONALLY LEFT BLANK]
18 2014 Annual Report


TOD’S GROUP – CONSOLIDATED FINANCIAL STATEMENTSAS AT DECEMBER 31ST, 2014

REPORT ON OPERATIONS

Group2014 Annual Report
29 Report on operations
Introduction
The Report of the Board of Directors on Operations is based on the TOD’S Group Consolidated FinancialStatements as of December 31st, 2014, prepared in accordance with IAS/IFRS (International Accounting Standards– IAS, and International Financial Reporting Standards –IFRS) issued by the IASB and approved by the EuropeanUnion at the same date. IAS/IFRS refers also to all revised International Accounting Standards (IAS) and all interpre-tative documents issued by the IFRIC (International Financial Reporting Interpretations Committee), previously nomi-nated Standing Interpretations Committee (SIC).The Consolidated Financial Statements have been prepared on the assumption that the Group can operate as agoing concern. The Group believes that there are no asset, liability, financial or organizational indicators of mate-rial uncertainties, as defined in paragraph 25 of IAS 1 on business continuity.The Report on Operations must be read together with the Financial Statements and Notes to the FinancialStatements, which are an integral part of the Consolidated Annual Report. The Report on Operations also includesthe additional information required by CONSOB, pursuant to the orders issued in implementation of Article 9 ofLegislative Decree 38/2005 (Resolutions 15519 and 15520 of July 27th, 2006 and memorandum DEM/6064293 ofJuly 28th, 2006, as well as all subsequent notices containing provisions regarding financial disclosures.In order to strip the effects of changes in exchange rates with respect to the average values for the previous yearfrom the results for the 2014 financial year, the typical economic reference indicators (Revenues, EBITDA and EBIT)have been recalculated by applying the average exchange rates for 2013, rendering them fully comparable withthose for the previous reference period. Note that on the one hand, these principles for measurement of busi-ness performance represent a key to interpretation of results not envisaged in IFRSs and, on the other hand, mustnot be considered as substitutes for what is set out in those standards.
Group’s activity
The TOD’S Group operates in the luxury sector under its proprietary brands (TOD’S, HOGAN, and FAY) and li-censed brands (ROGER VIVIER). It actively creates, produces and distributes shoes, leather goods and accessories,and apparel. The firm’s mission is to offer global customers top-quality products that satisfy their functional re-quirements and aspirations.
Organizational structure of the Group.The Group’s organizational configuration rotates around TOD’S S.p.A.that is at the heart of the Group’s organization, its parent company that owns the TOD’S, HOGAN, and FAY brands,holds the licenses of the ROGER VIVIER, and manages the Group’s production and distribution. Through a seriesof sub-holdings, the organization is rounded out by a series of commercial companies that are delegated completeresponsibility for retail distribution through the DOS network. Certain of them, strategically located on interna-tional markets, are assigned major roles in product distribution, marketing and promotion, and public relationsprocesses along the “value chain”, while simultaneously guaranteeing the uniform image that Group brands musthave worldwide.
Development of production. The Group’s production structure is based on complete control of the produc-tion process, from creation of the collections to production and then distribution of the products. This approachis considered key to assuring the prestige of its brands.Shoes and leather goods are produced in Group-owned plants, with partial outsourcing to specialized workshops.All of these outsourcers are located in areas with a strong tradition of shoe and leather good production. Thispreference reflects the fact that an extremely high standard of professional quality is required to make these items,with a significantly high level of added value contributed to the final product by manual work.The Group relies exclusively on selected specialized outsourcers, which enables it to exploit their respective spe-cializations in crafting the individual products sold as part of the apparel line.
Distribution structure. The prestige of the Group’s brands and the high degree of specialization necessary to

30 Report on operations
Group2014 Annual Report
offer the respective products to customers entails distribution through a network of similarly specialized stores.Accordingly, the Group relies principally on three channels: DOS (directly operated stores), franchised retail out-lets, and a series of selected, independent multibrand stores.The Group’s strategy is focused on development of the DOS and franchising networks, given that these channelsoffer greater control and more faithful transmission of the individual brands. It is also clear that, in particular mar-ket situations, distribution through independent multibrand stores is more efficient. This channel is of key impor-tance to the Group.
Group’s brands
The TOD’S brand is known for shoes and luxury leather goods, with styles that have became icons of modern liv-ing; TOD’S is known in the luxury goods sector as a symbol of the perfect combination of tradition, quality andmodernity. Each product is hand-crafted with highly-skilled techniques, intended, after laborious reworking, to be-come an exclusive, recognisable, modern and practical object. Some styles, like the Driving Shoe and the D bag,are cherished by celebrities and ordinary people worldwide, and have become icons and forerunners of a new con-cept of elegance, for both women and men.
Begun in the 80s with shoe collections for women, men and children, the HOGAN brand now also crafts var-ious leather goods items. The Hogan brand is distinctive for high quality, functionality and design. Every prod-uct stems from a highly skilled design technique and is created using quality materials with a particular pas-sion for details and a search for perfection. HOGAN products are the highest expression of a “new luxury”lifestyle. Hogan is meant for someone who cherishes the type of luxury associated with product excellence,innovative original design and consummate practicality. The Traditional and the Interactive shoe styles endureas continuing “best sellers”.
FAY is a brand created in the mid 80s with a product range of high quality casual wear. The brand is known forits quality craftsmanship, for the excellence of its materials, a meticulous attention to craft details and its highfunctionality without sacrificing style and quality. FAY products are wearable everywhere: from the stadium tothe office, in urban areas and in the countryside. The line, which has seasonal men’s, women’s and junior’s col-lections, focuses on classic evergreen styles, continuously modified and refreshed with innovative and recognis-ably eye-catching design.
Group2014 Annual Report
31 Report on operations
The Faberge of shoes, and creator of the first stiletto heel in the 1950's, ROGER VIVIER designed extravagant andluxuriously decorated shoes that he described as being “sculptures.” The artistic heritage and excellent tradition-al roots of the Vivier fashion house have been revived. Under the management of Creative Director Bruno Frisoni,Vivier’s work and vision endure and new chapters are added to this unique life story every year, which goes be-yond expertise in the craft of shoe making to include handbags, small leather goods, jewellery and sunglasses.
TOD’S Group for Social Commitment and the Environment
Passion, creativity, craftsmanship, tradition, promotion of “Made in Italy” quality, solidarity: these are the key valuesthat inspire the TOD'S Group (“TOD'S”) when it makes its business decisions, and when it defines its commit-ment to social responsibility. In 2014, TOD'S remained focused on social responsibility and the environment withnew initiatives and projects whose implementation mark continuity with what has been done over the years. Thefollowing paragraphs analyse certain of the aspects that have characterised TOD'S commitment to social respon-sibility, particularly in regard to what it actually accomplished in 2014.
The Human Capital
Welfare Project. Confirming the attention dedicated by TOD'S to its employees' well-being, and to establish andmaintain relationships based on trust and mutual respect, various measures were pursued and undertaken duringthe year. Responding positively to its employees' needs, TOD'S has provided them with important services sincethe 1990's, such as a gym and day care centre for children. The costs for both of these services are covered en-tirely by the Group. It also provides a cafeteria, an auditorium and a multimedia library.The Welfare project, which was put in hand at the end of 2012 to respond to the primary needs of the employ-ees’ immediate families, was further boosted during 2014. In fact, as part of the initiatives to provide economicsupport to the families of the Group's Italian employees, TOD’S extended the annual contribution of Euro 1,400distributed since 2008 and the full refund of the cost incurred by its employees' families to buy school books fortheir school-age children, up through university study. TOD’S also offered, once again, a significant health care pro-tection by taking out a new insurance policy to the benefit of its Italian employees and their relatives. By this pol-icy, the medical services provided by the scheme were further expanded with respect to these already stipulatedin 2013: not only does the scheme now pay the entire cost of major surgery and dentistry but also takes in diag-nostic and prevention services (such as specialist examinations, diagnostic tests and the prevention of children’sdiseases) with the aim of making an increasingly greater contribution to the enhancement of the quality of life ofthe Group’s employees and their households.
China-Italy exchange programme. By operating in an international context, TOD'S has the mission of spreading itsown values worldwide: creativity, craftsmanship, tradition and promotion of “Made in Italy” quality.Aware of the importance of engaging its own employees in promoting “Made in Italy” quality, in 2014 TOD’S im-plemented the cultural exchange programme between Italy and China, one of the Group's most important mar-kets. As part of this programme, in 2014 several Chinese store managers to be selected on the basis of companyseniority and merit were given the opportunity to become familiar with and understand the Italian lifestyle andapproach to life, through an international exchange programme. This initiative allowed them to live in Italy for threemonths. They were flanked by a boutique tutor and an office tutor, who helped them discover Italian taste and style,both on the job at the store and after working hours.The project represented a major opportunity, not only for the foreign employees, but also for Italian staff, whowas able to interact with their Chinese colleagues, in view of mutual exchange of different cultures, personal and

32 Report on operations
Group2014 Annual Report
professional experiences, while sharing the values represented by TOD'S. Cultural interchange will be promotedagain next year, confirming a constant commitment on the part of TOD’S to the creation of a group of increas-ingly tightly knit and internationally-minded people.With this in view, another project has been launched in 2014 addressed at all the store managers in the Group’sdistribution network. They will spend a week visiting the offices in Milan and production sites at the Italian head-quarters.
Commitment to training. The realisation of a durable, top-quality product depends on the talent of the peoplewho create it and perform all the steps in its production process. Customers' perception of the quality and crafts-manship of products depends in turn on the capacity of boutique professionals to transmit these essential valuesof the Group. This is why TOD'S supports the creativity and work of those who express their personal talent everyday, with specific training activities that target the needs of their different professional roles. Consequently, the Group continued planning and scheduling in-service training programmes again in 2014. Variousprofessionals from different corporate functions were involved: the aim was to increase the expertise and abilityof the resources in all the phases of the value creation phases. The training programme focused mainly on the de-velopment of soft skills, with the aim of training professionals with transversal skills and the ability to communi-cate efficaciously and manage human resources efficiently and responsibly. The persons in the positions involvedin the selling process, such as store managers, assistant store managers and sales assistants, also attended specifictraining sessions in order to develop the social skills necessary in the international environment in which theGroup operates, such as the capacity to use a communication style appropriate to their knowledge of the cultur-al diversities, behaviours, traditions and expectations of the global customers typical of today’s multicultural con-text, in order to lead customers positively towards a buying experience that enables them to appreciate the veryhigh quality of the product to the full, with the assistance of attentive and thoughtful service. The professionals inthe manufacturing process, in their turn, attended training sessions to develop the soft skills that not only help toraise productivity and efficiency but improve the working environment and interpersonal relationships, such as thecapacity to involve and communicate, manage human resources, delegate and acquire leadership qualities.Furthermore, language courses were provided at all professional levels in 2014, with modules aimed at meetingthe specific training requirements of the staff involved in the same. TOD'S believes that language skills are essen-tial in a Group whose daily operations are conducted at an international level.Collaboration continued with institutions such as the Bocconi University in Milan and the Istituto Adriano Olivettiin Ancona (ISTAO), for the conception of training programmes of mutual interest. In 2014 TOD’S launched, onceagain, the project of “Fabbrica del Talento” (Talent Factory), within which twenty young people were given thepossibility to receive six months of training, aimed at training professionals with specific skills that are hard to findon the market, and which TOD'S needs to operate its own activities. The impact of this project was very favourableindeed: it ended with TOD’S S.p.A. recruitment of about 70% of the young people who took part in these train-ing sessions during 2014.
Contribution to the Italian economic system
The TOD'S Group confirmed its commitment to support our country’s needs in 2014 too: in fact, the Shareholders'Meeting, called to allocate the 2013 Group net profit, confirmed, in line with the previous year, to allocate someof that money, and specifically 1% of net profit, to support programmes that assist the least fortunate members ofthe local communities in the areas where the Group operates. In this way the Group continued to provide eco-nomic support to a series of voluntary associations that assist young people join the work force, economically dis-advantaged persons and senior citizens, as well as promote the education and training of young people.With this solidarity project, the Shareholders’ Meeting aimed to redistribute a portion of the profits recorded byTOD’S S.p.A. at local level, in those areas where it recruits skilled craftsmen, thereby reinforcing its already strongties with them.

Collaboration
The TOD'S Group wants to help promote the image of Italy around the world, by giving special support to majorinitiatives to protect and promote Italian heritage. Its aim is to consolidate the great reputation of Italy and main-tain and promote tourism, which also positively impacts the economy.As previously reported, the Group made an agreement to cooperate with the Italian Ministry of Cultural Affairsand the Rome Special Archaeological Service in 2011, promising to cover the full cost of a series of restorationprojects on the Colosseum for a total amount of Euro 25 million. This initiative was undertaken to confirm theGroup's desire to protect and promote Italian culture, but was also inspired by the certainty that investing in “Madein Italy” products, in the skills, traditions and culture of Italy was the best way to make it more competitive. In 2014the project saw the progress of work on the first of the three planned phases of activities. This first phase involvesrestoration of the north facade and south facade of the Colosseum, and the installation of gates around the perime-ter of the first tier of the building.Pursuing the same intention to promote Italian culture and Italian-made products, the TOD'S Group confirmed itssupport for the Teatro alla Scala, as Permanent Founding Member of the Teatro alla Scala Foundation. It also con-tinued its support for the research and proposal activity of the Padiglione di Arte Contemporanea (PAC –Contemporary Art Pavilion) in Milan, which TOD'S uses to present its own collections. Founded in 1954, PAC rep-resents one of the first examples in Italy of an exhibition space designed for contemporary art that serves as akey link to the international community. It can host unique exhibitions of worldwide importance, with an averageof 20,000 visitors to each of its exhibits.Finally, in 2014 the TOD'S Group continued to lease spaces of Villa Necchi in Milan for the presentation of its col-lections in 2014. By doing so, it confirmed its commitment to support the mission of the Fondo Ambiente Italiano(FAI). This national, non-profit foundation has been operating with passion and enthusiasm since 1975 to preserve,restore and provide public access to major sites of artistic and natural interest in Italy, by promoting institutionaland public awareness of the need to protect it.
The Quality of the Product
Commitment to quality in all phases of production. Quality and tradition are the principles that guide thebusiness, from the conceptual phase of a product to the manufacturing phase, distribution and sale to end cus-tomers. TOD'S continuously monitors maintenance of the product standards applicable to all phases of theprocess. To do so, it uses specialised staff both at its own plants and at the workshops and plants of Group out-sourcers, to verify that only its own materials, machinery and techniques are used, and to control the quality ofraw materials, the process and the finished product. In this perspective, TOD'S works mainly with suppliers withwhich it has established long-term relationships. The Group has always considered the establishment and mainte-nance of long-term relationships with its outsourcers to be essential, where those relationships are based on ashared commitment to high product quality, the excellence of Italian-made products and the fight against coun-terfeit goods.
The Environment
Environmental focus. TOD'S dedicates major attention to environmental issues, although its own activities havea limited direct environmental impact. One of the Group's stated priorities is to reduce the consumption of en-ergy at its production and commercial facilities. The Group conducts precise analyses of its consumption of elec-tricity and fuels. It defines an annual programme of energy savings measures to be implemented, relying in part onaudits performed by specialised outsourcers. During 2014 the parent company TOD’S S.p.A. started to use a newsystem at its head office for the accurate monitoring of energy consumption in its departments in order to makeconsumption more efficient through conscious use of energy.
33 Report on operations
Group2014 Annual Report

34 Report on operations
Group2014 Annual Report
Continuing the work done in previous years, TOD'S created and implemented programmes to reduce its energyconsumption in 2014 too, by using new resources to “compress” its environmental impact.In the area of energy savings, and thus simultaneous reduction of greenhouse gas emissions, TOD'S has imple-mented design changes at its own headquarters buildings in Italy to realise passive energy savings. These pro-grammes have been implemented by using renewable energy sources to satisfy part of the Group's energy needs.This has involved using geothermal plants to improve the efficiency of air conditioning systems and photovoltaicpanels to generate electricity. In 2014 measures to raise energy performance were also adopted in theMontecosaro and Tolentino factories in the Marche Region: the roofs were changed and this improved insulation,with benefits in terms of the reduction of consumption and consequent emissions. These planning criteria werefully implemented in the construction of the new building, which is currently being erected, at the Italian head-quarters. This new building has a covered space measuring about 10,500 square metres on several levels. Its struc-ture and plant reflect all the new design philosophies that guide the realisation of buildings offering passive ener-gy savings, and thus consuming a low level of energy – in terms of both thermal and electric energy (“envelope”insulation, photovoltaic and geothermal plants for heating and cooling the building, recovery of rainwater, and light-ing with new LED technologies). The “motor equipment” will be equipped with inverter technology (previouslyexperimented on production lines). This makes it possible to modulate the function of these devices according toreal needs, and thus permitting further reductions in energy consumption.To improve the energy efficiency of retail store spaces, the concept stores are designed by specifying the use ofLED technology to light interior spaces and displays in the sales areas. For more responsible use of resources,wood is obtained by recycling furniture and decoration scrap material.
The Code of Ethics
The TOD'S Code of Ethics, adopted by the Group in 2008, is the tool that allows the Group to operate and main-tain relationships with its stakeholders on the basis of principles that characterise its identity and nature. Honesty,fairness, confidentiality, transparency and reliability in relationships with all stakeholders are the complete, funda-mental principles of the Group, and thus adopted in the Code. The Code of Ethics has been lastly updated in 2013,at the same time with the updating of its organizational model ex Legislative Decree 231/2001 by introducing ref-erences to bribery between private parties, wrongful inducement to give or promise benefits, and employment ofcitizens who do not have proper authorisation to work in the places where they are employed.The principles embodied in the Code of Ethics and Legislative Decree 231/2001 Compliance Programme are dis-seminated and implemented in practice through the organisation of specific training activities.
Main events and operations during the period
The volatility in the global luxury goods markets heightened progressively at the end of the year. The first signs ofweakness in this market had already started to be seen in 2013. This challenging scenario, which affected the re-sults of the leading brands in this sector, in Pacific Asia above all, also suffered from substantial exchange rate fluc-tuations. The latter adversely affected sales at first (a negative effect of euro 5.2 million on the Group’s revenuesin 2014), but above all entailed significant developments in tourist flows and a reduced spending capacity of someimportant international shoppers (Russian, Brazilian, Japanese and Indian tourists).Following our industrial mid-term perspective, the Group, according to schedule, put in hand all the planned in-vestments in human resources, production capacity, style, research and communication in order to strengthen andenhance its brands’ image and appeal.Substantial funds were allocated to boosting the distribution structure by targeted expansion of the internation-al DOS network, giving priority to more responsive markets (in 2014 twenty-two new directly operated storeswere opened) and expanding production, using resources to increase production capacity by setting up new fac-tories at the Group’s headquarters. With a view to its strategic development, on July 23rd, 2014 the parent com-pany TOD’S S.p.A. entered into a loan agreement with two leading banks, which was aimed at setting aside funds

to a maximum amount of euro 400 million intended to support the Group’s development and related investmentsin the medium term.As regards the business, the sales figures for the DOS network were stable on the whole, also thanks to the con-tribution from the abovementioned new openings, the exception being the Greater China network, strongly af-fected by the corruption crackdown policy adopted by the Chinese authorities which produced a generalised fallin the purchase of luxury goods in the Mainland China, as well as in the neighbouring areas of Hong Kong andMacau, throughout 2014. On the other hand, Group sales performance in the Greater China was affected by ex-traordinary events, the latest of which were the anti-government street demonstrations in Hong Kong which paral-ysed this key luxury sector market for weeks.Sales results in the Americas fell slightly under the effect of the extremely bad weather at the beginning of the yearand the closure of two important Group stores for renovations for a number of months, including the TOD’S flag-ship store in Madison Avenue, New York.Still as regards the international market, the results of sales in Europe and the Rest of the World were excellent,showing an increase of 6.1% and 13.6% respectively, at constant rates. In the Rest of the World area, the per-formances of the Japanese and South Korean markets were particularly impressive, with double-digit growth rates.As regards the brands, HOGAN continued to grow in international markets, to which the brand developmentstrategy is addressed at present: in the foreign markets in which the brand is present, sales recorded double-dig-it growth rates as a whole compared to 2013. The performances of the ROGER VIVIER brand continued to be ex-cellent: consolidated sales increased by 11.6% compared to 2013, confirming the great appeal that the brand hasfor global customers, who see ROGER VIVIER as one of the most prestigious maisons in the most exclusive luxu-ry segment.As regards social responsibility, the parent company TOD’S S.p.A. continued its commitment to financial supportprojects for the families of the Group’s Italian employees: the measures contained in the so-called Welfare planhave been extended to the current financial year. Moreover, also in the field of social commitment, the Board ofDirectors of TOD’S S.p.A., which has been granted delegated powers for this purpose, is engaged in selecting sol-idarity initiatives to which it can allocate the reserve fund, equal to about euro 1.3 million, specially set aside bythe Shareholders’ Meeting on April 17th, 2014.
The Group’s results in 2014
Consolidated sales were 965.5 million euros, broadly aligned with 2013 turnover when it was 967.5 million euros.The impact of currency fluctuations was negative: at constant exchange rates, sales revenue would increase to 971million euros, showing a growth of +0.4% in respect to 2013. Operating margins, EBITDA and EBIT, were 193.5million euros and 148.2 million euros respectively (while at a constant exchange rate would have been 197.5 and152.1 million euros, representing respectively 20.3% and 15.7% of consolidated sales). Consolidated net profit was 96.8 million euros, decreased by 37.2 million euros in respect to 134 million euros ofthe previous year 2013.
35 Report on operations
Group2014 Annual Report
36 Report on operations
Group2014 Annual Report
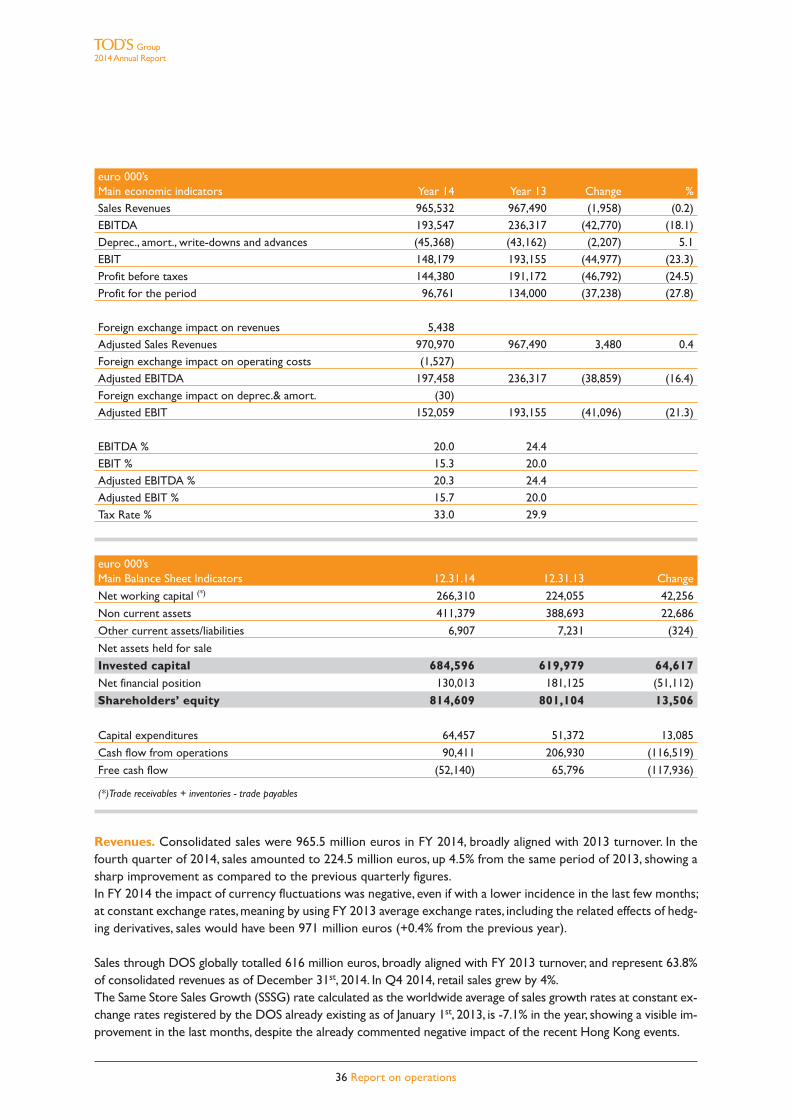
euro 000’sMain economic indicators Year 14 Year 13 Change %Sales Revenues 965,532 967,490 (1,958) (0.2)EBITDA 193,547 236,317 (42,770) (18.1)Deprec., amort., write-downs and advances (45,368) (43,162) (2,207) 5.1EBIT 148,179 193,155 (44,977) (23.3)Profit before taxes 144,380 191,172 (46,792) (24.5)Profit for the period 96,761 134,000 (37,238) (27.8)
Foreign exchange impact on revenues 5,438Adjusted Sales Revenues 970,970 967,490 3,480 0.4Foreign exchange impact on operating costs (1,527)Adjusted EBITDA 197,458 236,317 (38,859) (16.4)Foreign exchange impact on deprec.& amort. (30)Adjusted EBIT 152,059 193,155 (41,096) (21.3)
EBITDA % 20.0 24.4EBIT % 15.3 20.0Adjusted EBITDA % 20.3 24.4Adjusted EBIT % 15.7 20.0Tax Rate % 33.0 29.9
euro 000’sMain Balance Sheet Indicators 12.31.14 12.31.13 Change
Net working capital (*) 266,310 224,055 42,256
Non current assets 411,379 388,693 22,686
Other current assets/liabilities 6,907 7,231 (324)
Net assets held for sale
Invested capital 684,596 619,979 64,617Net financial position 130,013 181,125 (51,112)
Shareholders’ equity 814,609 801,104 13,506
Capital expenditures 64,457 51,372 13,085
Cash flow from operations 90,411 206,930 (116,519)
Free cash flow (52,140) 65,796 (117,936)
(*)Trade receivables + inventories - trade payables
Revenues. Consolidated sales were 965.5 million euros in FY 2014, broadly aligned with 2013 turnover. In thefourth quarter of 2014, sales amounted to 224.5 million euros, up 4.5% from the same period of 2013, showing asharp improvement as compared to the previous quarterly figures.In FY 2014 the impact of currency fluctuations was negative, even if with a lower incidence in the last few months;at constant exchange rates, meaning by using FY 2013 average exchange rates, including the related effects of hedg-ing derivatives, sales would have been 971 million euros (+0.4% from the previous year).
Sales through DOS globally totalled 616 million euros, broadly aligned with FY 2013 turnover, and represent 63.8%of consolidated revenues as of December 31st, 2014. In Q4 2014, retail sales grew by 4%. The Same Store Sales Growth (SSSG) rate calculated as the worldwide average of sales growth rates at constant ex-change rates registered by the DOS already existing as of January 1st, 2013, is -7.1% in the year, showing a visible im-provement in the last months, despite the already commented negative impact of the recent Hong Kong events.
Group2014 Annual Report
37 Report on operations
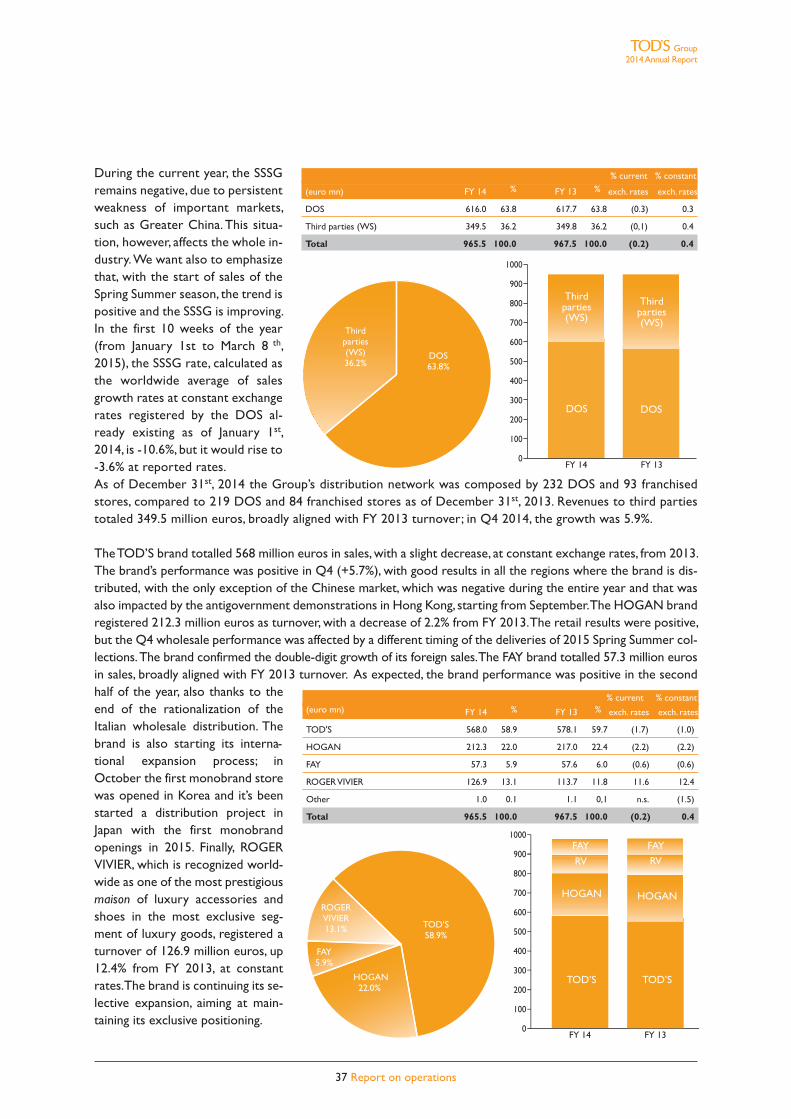
During the current year, the SSSGremains negative, due to persistentweakness of important markets,such as Greater China. This situa-tion, however, affects the whole in-dustry. We want also to emphasizethat, with the start of sales of theSpring Summer season, the trend ispositive and the SSSG is improving.In the first 10 weeks of the year(from January 1st to March 8 th,2015), the SSSG rate, calculated asthe worldwide average of salesgrowth rates at constant exchangerates registered by the DOS al-ready existing as of January 1st,2014, is -10.6%, but it would rise to-3.6% at reported rates.As of December 31st, 2014 the Group’s distribution network was composed by 232 DOS and 93 franchisedstores, compared to 219 DOS and 84 franchised stores as of December 31st, 2013. Revenues to third partiestotaled 349.5 million euros, broadly aligned with FY 2013 turnover; in Q4 2014, the growth was 5.9%.
The TOD’S brand totalled 568 million euros in sales, with a slight decrease, at constant exchange rates, from 2013.The brand’s performance was positive in Q4 (+5.7%), with good results in all the regions where the brand is dis-tributed, with the only exception of the Chinese market, which was negative during the entire year and that wasalso impacted by the antigovernment demonstrations in Hong Kong, starting from September.The HOGAN brandregistered 212.3 million euros as turnover, with a decrease of 2.2% from FY 2013. The retail results were positive,but the Q4 wholesale performance was affected by a different timing of the deliveries of 2015 Spring Summer col-lections. The brand confirmed the double-digit growth of its foreign sales. The FAY brand totalled 57.3 million eurosin sales, broadly aligned with FY 2013 turnover. As expected, the brand performance was positive in the secondhalf of the year, also thanks to theend of the rationalization of theItalian wholesale distribution. Thebrand is also starting its interna-tional expansion process; inOctober the first monobrand storewas opened in Korea and it’s beenstarted a distribution project inJapan with the first monobrandopenings in 2015. Finally, ROGERVIVIER, which is recognized world-wide as one of the most prestigiousmaison of luxury accessories andshoes in the most exclusive seg-ment of luxury goods, registered aturnover of 126.9 million euros, up12.4% from FY 2013, at constantrates. The brand is continuing its se-lective expansion, aiming at main-taining its exclusive positioning.
100
200
300
400
500
600
700
900
FY 14 FY 13
800
1000
0
Thirdparties(WS) 36.2%
Third parties(WS)
DOS DOS
Third parties(WS)
DOS 63.8%
100
200
300
400
500
600
700
900
FY 14 FY 13
800
1000
0
TOD’S58.9%
HOGAN22.0%
FAY5.9%
ROGERVIVIER13.1%
RV
HOGAN
TOD’S
FAYFAY
HOGAN
TOD’S
RV
% current % constant(euro mn) FY 14 % FY 13 % exch. rates exch. rates
TOD'S 568.0 58.9 578.1 59.7 (1.7) (1.0)
HOGAN 212.3 22.0 217.0 22.4 (2.2) (2.2)
FAY 57.3 5.9 57.6 6.0 (0.6) (0.6)
ROGER VIVIER 126.9 13.1 113.7 11.8 11.6 12.4
Other 1.0 0.1 1.1 0,1 n.s. (1.5)
Total 965.5 100.0 967.5 100.0 (0.2) 0.4
% current % constant
(euro mn) FY 14 % FY 13 % exch. rates exch. rates
DOS 616.0 63.8 617.7 63.8 (0.3) 0.3
Third parties (WS) 349.5 36.2 349.8 36.2 (0,1) 0.4
Total 965.5 100.0 967.5 100.0 (0.2) 0.4

38 Report on operations
Group2014 Annual Report
The Group has further strength-ened its leadership in the corebusiness of shoes. Sales of thisproduct category totaled 743.5million euros, slightly higher thanin FY 2013, at constant exchangerates, showing an acceleration inQ4 (+5.7%). Revenues of leathergoods and accessories totaled155.6 million euros, down 2.1%from FY 2013, at constant ex-change rates.Visible improvement of their per-formance in the fourth quarter.Finally, sales of apparel were 65.4million euros, with a slight de-crease from FY 2013, but with agrowth in Q4 2014 (+4.0%); thiscategory broadly reflects the per-formance of the FAY brand.
Sales in Italy were 311.1 million euros, down 3.7% from FY 2013. In line with management expectations, do-mestic sales grew in the secondhalf of 2014, also thanks to the endof the rationalization of the Italianwholesale distribution, started in2012. In the rest of Europe, salestotalled 221.3 million euros, up6.5% from FY 2013, driven byGermany, UK and Spain. TheGroup’s sales in the Americas to-talled 87.3 million euros, down1.8% from FY 2013, at constant ex-change rates. The bad weatherconditions at the beginning of theyear and the temporary closing, forrefurbishment, of two importantboutiques, including the New YorkMadison Avenue flagship store, af-fected the performance in the firstpart of the year, sales grew in Q4.
The Group’s sales in GreaterChina were 225.7 million euros,down 4.4% from FY 2013, at constant exchange rates. This market was the only negative region in the fourthquarter, affected by the already commented weak consumer environment in mainland China and, starting fromSeptember, also by the impact of the antigovernment demonstrations in Hong Kong. Finally, in the area “Rest ofthe World” sales totalled 120.1 million euros, up 13.6% from FY 2013, at constant exchange rates, driven by theoutstanding results of Korea, Japan and Singapore.
100
200
300
400
500
600
700
900
FY 14 FY 13
800
1000
0
Apparel
Leathergoods
Shoes
Apparel
Leathergoods
Shoes
Apparel6,8%
Shoes77,0%
Leathergoods.16,1%
100
200
300
400
500
600
700
900
FY 14 FY 13
800
1000
0
GreaterChina23.4%
RoW12.5%
Italy32.2%
Americas9.0%
Americas
Greater China
Europe
ItalyEurope22.9%
RoW
Americas
Greater China
Europe
Italy
RoW
% current %constant(euro mn) FY 14 % FY 13 % exch rates %exch rates
Shoes 743.5 77.0 739.7 76.5 0.5 1.0
Leather goods 155.6 16.1 160.9 16.6 (3.3) (2.1)
Appare 65.4 6.8 65.8 6.8 (0.7) (0.6)
Other 1.0 0.1 1.1 0.1 n.s. (1.7)
Total 967.5 100.0 963.1 100.0 (0.2) 0.4
% current %constant(euro mn) FY 14 % FY 13 % exch rates %exch rates
Italy 311.1 32.2 323.0 33.4 (3.7) (3.7)
Europe 221.3 22.9 207.8 21.5 6.5 6.1
Americas 87.3 9.0 90.3 9.3 (3.3) (1.8)
Greater China 225.7 23.4 237.5 24.5 (5.0) (4.4)
RoW 120.1 12.5 108.9 11.3 10.3 13.6
Total 965.5 100.0 967.5 100.0 (0.2) 0.4

Group2014 Annual Report
39 Report on operations
Operating results. The Group EBITDA for the 2014 financial yearamounted to 193.5 million euros (236.3 million euros in 2013), represent-ing 20% of consolidated sales (24.4% in 2013).At constant exchange rates, with the application of the average cross ratesfor the previous year, the EBITDA would have amounted to around 197.5million euros.After having achieved excellent profits at the gross margin level, whichwere the result of the well- established position of the Group’s brands atthe high end of the luxury brands sector, with a slight reduction attributa-ble to a different composition of revenues, operating margins were signifi-cantly affected, compared to 2013, by the rising operating costs linked toi) the international expansion strategy of the DOS network (the numberof DOS increased up to 13 in the year); ii) greater communication invest-ments in support of the brands; and a consequent higher impact on revenues due to the various components ofthe cost structure.More specifically, the costs of using third party assets (rents and royalties for the exploitation of the licences)amounted to 109.7 million euros, showing a growth of 7.9 million euros with respect to the same item in 2013(equivalent to 101.8 million euros). The incidence on sales revenues in-creased from 10.5% in 2013 to 11.4% in the current financial year. Thisgrowth can be mainly attributed to the expansion in sales by the direct dis-tribution network on the Asian markets, where the retail distribution mod-el is mainly based on variable rents indexed to turnover.
Increased even the personnel costs: the figure for the 2014 financial yearamounted to 160.4 million euros in respect to 151.7 million euros of theyear 2013, an increase of 8.7 million euros in absolute terms.These costs accounted for 16.6% of Group sales revenues, in respect to15.7% of the year 2013. The main reason for the increase is the significantgrowth in personnel numbers, due to the expansion of the direct distribu-tion network and the reinforcement of the operating functions at corpo-rate level. On December 31st, 2014, the total Group workforce was 4,297employees, an increase of 153 with respect to the figure at the beginning of the year (4,144).
The costs of depreciation, amortisation and write downs of fixed assets in 2014 amounted to a total of 43.9 mil-lion euros, in respect to 39.3 million euros of 2013. This item includes an amount of euro 1.9 million relating tothe write-down of assets which were decommissioned from the production process of the parent company andfrom the Group’s mono-brand stores. As of December 31st, 2014 depre-ciation and amortisations accounted for 4.3% of Group sales revenues,substantially in line with the figure for the previous year (4.1%).
Net of further provisions amounting to a total of 1.4 million euros, the netoperating result for the year (EBIT) therefore amounted to 148.2 millioneuros (in respect to 193.2 million euros of the year 2013), changed by 45million euros and represents 15.3% of consolidated sales (2013: 20%). Atconstant exchange rates, the EBIT for the period would have been equiva-lent to 152.1 million euros.
EBITDA (euro mn)
FY 14 FY 14 FY 13comp. ex.rate basis
197,5 193,5
236,3
GROUP’S EMPLOYEES
FY 14 FY 13 FY 12 FY 11
4,297 4,144
3,8783,549
EBIT (euro mn)
FY 14 FY 14 FY 13comp. ex.rate basis
152,1
193,2
148,2
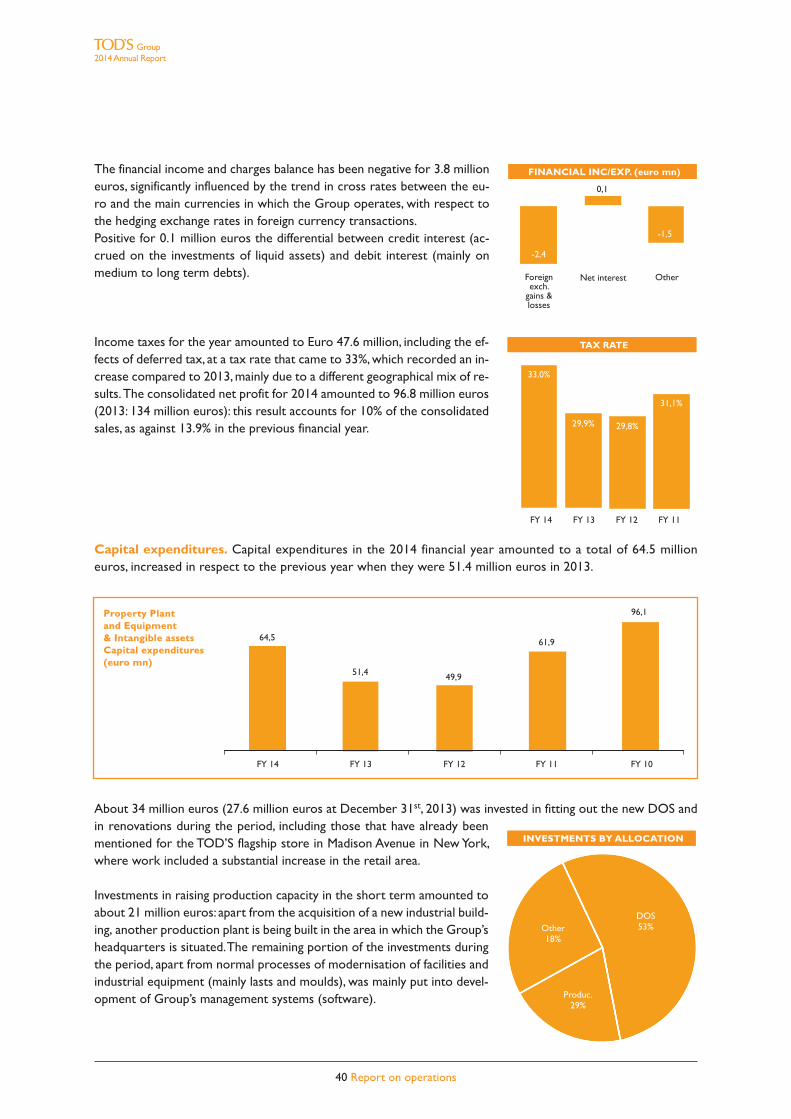
40 Report on operations
Group2014 Annual Report
The financial income and charges balance has been negative for 3.8 millioneuros, significantly influenced by the trend in cross rates between the eu-ro and the main currencies in which the Group operates, with respect tothe hedging exchange rates in foreign currency transactions. Positive for 0.1 million euros the differential between credit interest (ac-crued on the investments of liquid assets) and debit interest (mainly onmedium to long term debts).
Income taxes for the year amounted to Euro 47.6 million, including the ef-fects of deferred tax, at a tax rate that came to 33%, which recorded an in-crease compared to 2013, mainly due to a different geographical mix of re-sults. The consolidated net profit for 2014 amounted to 96.8 million euros(2013: 134 million euros): this result accounts for 10% of the consolidatedsales, as against 13.9% in the previous financial year.
Capital expenditures. Capital expenditures in the 2014 financial year amounted to a total of 64.5 millioneuros, increased in respect to the previous year when they were 51.4 million euros in 2013.
About 34 million euros (27.6 million euros at December 31st, 2013) was invested in fitting out the new DOS andin renovations during the period, including those that have already beenmentioned for the TOD’S flagship store in Madison Avenue in New York,where work included a substantial increase in the retail area.
Investments in raising production capacity in the short term amounted toabout 21 million euros: apart from the acquisition of a new industrial build-ing, another production plant is being built in the area in which the Group’sheadquarters is situated. The remaining portion of the investments duringthe period, apart from normal processes of modernisation of facilities andindustrial equipment (mainly lasts and moulds), was mainly put into devel-opment of Group’s management systems (software).
INVESTMENTS BY ALLOCATION
DOS53%
Produc.29%
Other18%
FINANCIAL INC/EXP. (euro mn)
-2,4
0,1
Foreignexch.
gains &losses
Net interest Other
-1,5
TAX RATE
FY 14 FY 13 FY 12 FY 11
33,0%
29,9% 29,8%
31,1%
FY 14 FY 13 FY 12 FY 11 FY 10
64,5
51,4 49,9
61,9
96,1Property Plant and Equipment & Intangible assetsCapital expenditures(euro mn)
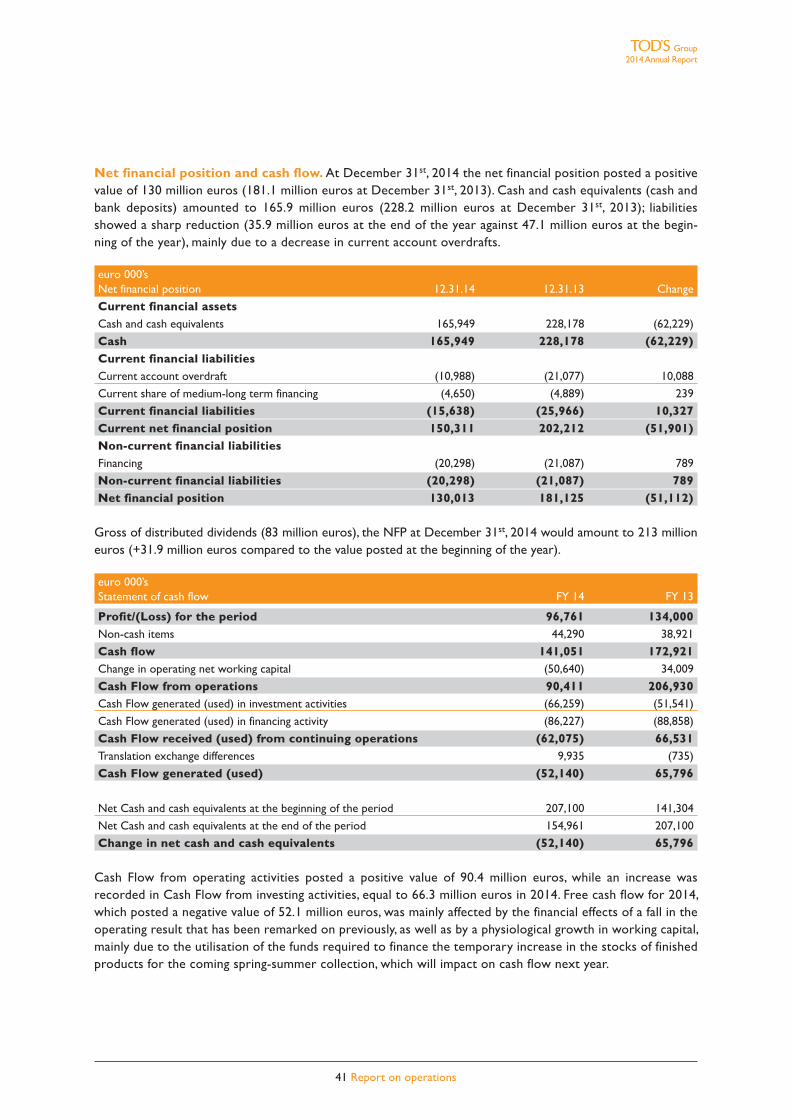
Group2014 Annual Report
41 Report on operations
Net financial position and cash flow. At December 31st, 2014 the net financial position posted a positivevalue of 130 million euros (181.1 million euros at December 31st, 2013). Cash and cash equivalents (cash andbank deposits) amounted to 165.9 million euros (228.2 million euros at December 31st, 2013); liabilitiesshowed a sharp reduction (35.9 million euros at the end of the year against 47.1 million euros at the begin-ning of the year), mainly due to a decrease in current account overdrafts.
euro 000’sNet financial position 12.31.14 12.31.13 Change
Current financial assetsCash and cash equivalents 165,949 228,178 (62,229)
Cash 165,949 228,178 (62,229)Current financial liabilitiesCurrent account overdraft (10,988) (21,077) 10,088
Current share of medium-long term financing (4,650) (4,889) 239
Current financial liabilities (15,638) (25,966) 10,327Current net financial position 150,311 202,212 (51,901)Non-current financial liabilitiesFinancing (20,298) (21,087) 789
Non-current financial liabilities (20,298) (21,087) 789Net financial position 130,013 181,125 (51,112)
Gross of distributed dividends (83 million euros), the NFP at December 31st, 2014 would amount to 213 millioneuros (+31.9 million euros compared to the value posted at the beginning of the year).
euro 000’sStatement of cash flow FY 14 FY 13
Profit/(Loss) for the period 96,761 134,000Non-cash items 44,290 38,921
Cash flow 141,051 172,921Change in operating net working capital (50,640) 34,009
Cash Flow from operations 90,411 206,930Cash Flow generated (used) in investment activities (66,259) (51,541)
Cash Flow generated (used) in financing activity (86,227) (88,858)
Cash Flow received (used) from continuing operations (62,075) 66,531Translation exchange differences 9,935 (735)
Cash Flow generated (used) (52,140) 65,796
Net Cash and cash equivalents at the beginning of the period 207,100 141,304
Net Cash and cash equivalents at the end of the period 154,961 207,100
Change in net cash and cash equivalents (52,140) 65,796
Cash Flow from operating activities posted a positive value of 90.4 million euros, while an increase wasrecorded in Cash Flow from investing activities, equal to 66.3 million euros in 2014. Free cash flow for 2014,which posted a negative value of 52.1 million euros, was mainly affected by the financial effects of a fall in theoperating result that has been remarked on previously, as well as by a physiological growth in working capital,mainly due to the utilisation of the funds required to finance the temporary increase in the stocks of finishedproducts for the coming spring-summer collection, which will impact on cash flow next year.

42 Report on operations
Group2014 Annual Report
Research and development
Given the particular nature of the Group’s production, research and development activity consists of continuoustechnical/stylistic revision of models and constant improvement of the materials used to realise the product.Since this activity is exclusively ordinary, the associated costs are charged entirely to income in the year that theyare incurred, and thus recognised as normal production costs.Research and development costs, as defined above, have assumed major importance due to operating realisationof projects connected with expansion of the existing product line with new types of merchandise that comple-ment current ones. These will increase the number of brands offered and stimulate increased sales to end cus-tomers.
Reconciliation of the result for the period and net equity of the Group with the analogousvalues of the Parent Company
The following table illustrates the reconciliation of the result for the period and net equity of the Group with the anal-ogous values of the Parent Company, in accordance with CONSOB memorandum DEM/6064293 dated July 28th, 2006.
euro 000’s 12.31.14 12.31.13Net Profit Share equity Net Profit Share equity
Parent Company 78,414 644,223 101,502 660,112Difference between book value of consolidated
Companies and net equity method valutation 30,144 246,387 61,873 188,539
Goodwill from Business combination Parent Company (13,685) (13,685)
Goodwill from Business combination Group 12,232 12,232
Others (*) (11,445) (79,628) (29,595) (51,742)
Minority interest (353) 5,078 220 5,648
Group 96,761 814,609 134,000 801,104
(*) Mainly dividends and intercompany profits.
Corporate Governance
The Corporate Governance system.The Corporate Governance system of the parent company TOD’S S.p.A. is based on the traditional system, or“Latin model.” The corporate bodies are:- the Shareholders’ Meeting, which has the prerogative of resolving at its ordinary and extraordinary meetings
on the matters reserved to it by law or the articles of association;- the Board of Directors, which is vested with full, unlimited authority for ordinary and extraordinary manage-
ment of the Company, with the right to perform all those acts that it deems appropriate to implement and re-alise the corporate purpose, excluding only those reserved by law to the Shareholders' Meeting;
- the Board of Statutory Auditors, which is delegated by law to monitor i) compliance with the law, memoran-dum of association and compliance with the principles of proper management; ii) the adequacy of the organi-sational structure of the Company for matters falling under its purview, its internal control system, risks andadministrative and accounting system, as well as the adequacy of the latter in fairly reporting operating per-formance; iii) the adequacy of directives issued to TOD’S Group companies in regard to the information thatthey must provide in compliance with disclosure obligations; iv) the procedures for effective implementationof the corporate governance rules set out in the Corporate Governance Code adopted by the Group;Legislative Decree 39/2010 delegates the Board of Statutory Auditors the task of monitoring the process offinancial disclosure and the effectiveness of the risk control, internal audit, if applicable, and management sys-
tems, as well as independent audits and certification of the annual accounts and consolidated accounts, and theindependence of the audit firm retained to do so;
The Manager in charge of preparing the company financial documents forms part of the corporate governancebodies.The Board of Directors has set up several internal committees: the Executive Committee, the Internal Controland Risk, the Compensation Committee and the Independent Directors Committee. The last named committeehas the role and significant responsibilities that the Regulation of Related Party Transactions, adopted by CON-SOB with Resolution no. 17221 of March 12th, 2010, subsequently amended, assigns to the committee comprisedexclusively of independent directors.The adopted corporate governance system is substantially based on the Corporate Governance Code of ListedItalian Companies approved by Corporate Governance Committee of Borsa Italiana S.p.A., to which the Companyagreed with the resolution of the Board of Directors of April 19th, 2012 and it is based on the reference systemsrepresented by international best practice.
Disclosure pursuant to Article 123-bis of Legislative Decree 58/1998At its meeting on March 12th 2015, the Board of Directors of the parent company TOD’S S.p.A. approved the an-nual Report on Corporate Governance and Shareholdings for the year 2014, which provides, among others, thedisclosures mandated pursuant to Article 123-bis (1) of the Consolidated Law on Finance (T.U.F.). That report al-so analytically illustrates the corporate governance system of TOD’S S.p.A., and it includes not only the informa-tion required under Article 123-bis (2) T.U.F., but also a comprehensive examination of the status of implementa-tion of the corporate governance principles recommended by the Corporate Governance Code in accordancewith the “comply or explain” rule.The reader is referred to the Annual Corporate Governance and Shareholdings Report, which is available to thepublic together with this Report on Operations and accounting documentation. It may be consulted in the cor-porate section of the www.todsgroup.com website.
Disclosure pursuant to Article 123-ter of Legislative Decree 58/1998 (ConsolidatedLaw on Finance)On March 12th, 2015, the Board of Directors of Tod’s S.p.A. approved, in compliance with Article 123-ter ofLegislative Decree 58 of February 24, 1998 (the “Consolidated Law on Finance” or “T.U.F.”), as amended, and Article84-ter of Consob Resolution no. 11971/99 (the “Issuers Regulation”), as amended, the Remuneration Report. TheReport is composed of two sections:(i) the first is the policy of Tod’s S.p.A. in regard to remuneration of the members of the Board of Directors, theGeneral Manager, and the executives with strategic responsibilities in regard to the 2015 financial year, as well asthe procedures used for adoption and implementation of this policy;(ii) the other is aimed at representing each of the items that compose remuneration, and describing the compen-sation paid in 2014 to members of the Board of Directors and Board of Statutory Auditors, the General Managerand the executives with strategic responsibilities;it will be submitted to the Shareholders’ Meeting called for April 22nd, 2015, which will be asked to resolve in favourof or against the first section with a non-binding resolution.The Remuneration Report is available at the registered office of the Company and on the corporate websitewww.todsgroup.com.
Disclosure of Significant Companies outside the EUTOD’S S.p.A., the parent company, directly or indirectly controls 10 companies that are incorporated and regu-lated pursuant to the laws of countries that do not belong to the European Union (“Significant Companies out-side the EU,” as defined by Consob Resolution no. 16191/2007, as amended).In reference to these companies, note that:- all of them prepare accounts used to prepare the consolidated financial statements. The balance sheet and in-
come statement of these entities are provided to shareholders of TOD’S S.p.A. at the times and in the ways
43 Report on operations
Group2014 Annual Report

44 Report on operations
Group2014 Annual Report
envisaged by applicable regulations;- TOD’S S.p.A. has acquired the bylaws and composition and powers of the corporate bodies;- the Significant Companies outside the EU: i) provide the parent company’s independent auditor with informa-
tion that the latter needs to audit the annual and interim accounts of the parent; ii) have an administrative andaccounting system that is adequate for providing the management, Board of Statutory Auditors and inde-pendent auditor of the parent company with the operating, financial position and earnings figures necessaryfor preparing the consolidated financial statements.
In order to satisfy its own statutory obligations, the Board of Statutory Auditors of TOD’S S.p.A. has audited theadequacy of the administrative and accounting system regularly to provide the management and independent au-ditor of TOD’S S.p.A. with the operating, financial position and earnings figures necessary for preparation of theconsolidated financial statements and the effective flow of information through meetings with the independent au-ditor and with the Financial Reporting Manager.
Disclosure pursuant to Consob Resolution no. 17221 of March 12th, 2010 (Related PartiesRegulation)In 2014 the Group did not conclude highly significant transactions with related parties or related party transac-tions that had a material impact on the assets, liabilities or net income of the Group, and there were no modifi-cations or developments in the transactions described in the 2013 Annual Report that had the same effects.All information regarding existing relations with related parties in 2014 are set out in the supplementary notes.
Significant events occurred after the end of the period
No significant events occurred after the end of the period.
Business outlook
In the year 2014 the Group recorded a temporary slowdown in operating profits, due to our strategic decisionto continue to invest in production capacity, communication, research and, especially, in the retail distribution net-work, despite a particularly challenging environment, characterized by weak consumer spending in major marketsfor luxury goods.Aware of the financial and patrimonial solidity, the Group continued to focus on the mid/long-term view, to pre-serve the quality, the awareness and prestige of the brands.Concerning the current year, even in an uncertain and demanding macro-economic environment, which continuesto be characterized by an high volatility of the markets, the confirmation of expectations for the beginning of thesummer collection, already in the stores, the enthusiasm shown by the press for the fall winter collections, andthe positive trend of the current sale campaign, indicate that the Group return to growth in revenue and profits.
Approval of Financial Statement
The consolidated financial statements of the TOD’S Group were approved by the Board of Directors on March12th, 2015.
Milan, March 12th, 2015The Chairman of the Board of Directors
Diego Della Valle
FINANCIAL STATEMENTS

46 Financial Statements
Group2014 Annual Report
Consolidated Income Statement
euro 000’sNote Year 14 Year 13
RevenuesSales revenues 24 965,532 967,490
Other income 24 10,476 15,630
Total revenues and income 976,008 983,120Operating CostsChange in inventories of work in process and finished goods 31,944 16,549
Cost of raw materials, supplies and materials for consumption (278,912) (267,948)
Costs for services (231,436) (211,761)
Costs of use of third party assets 19 (109,665) (101,778)
Personnel costs 25 (160,386) (151,665)
Other operating charges (34,005) (30,200)
Total operating costs (782,461) (746,803)EBITDA 193,547 236,317Amortisation, depreciation and write-downsAmortisation of intangible assets 7 (8,792) (8,889)
Depreciation of property, plant and equipment 8 (32,791) (30,395)
Other adjustments 9 (2,339)
Total amortisation, depreciation and write-downs (43,922) (39,284)Provisions 14-19 (1,447) (3,878)
EBIT 148,179 193,155Financial income and chargesFinancial income 26 23,403 18,201
Financial expenses 26 (27,202) (20,184)
Total financial income (expenses) (3,799) (1,983)Income (losses) from equity investments - -
Profit before taxes  144,380 191,172Income taxes 11-27 (47,619) (57,172)
Profit/(loss) for the period  96,761 134,000Non-controlling interests  353 (220)
Profit/(loss) of the Group  97,114 133,780
EPS (in euro) 28 3.17 4.37
EPS diluted (in euro) 28 3.17 4.37

Consolidated Statement of Comprehensive Income
euro 000’sNote Year 14 Year 13
Profit (loss) for the period (A)  96,761 134,000Other comprehensive income that will be reclassified subsequently to profit and loss:Gain/(Losses) on derivative financial instruments (cash flow hedge) (7,795) (3,717)
Gain/(Losses) on currency translation of foreign subsidiaries 10,020 (8,428)Total other comprehensive income that will be reclassified subsequently to profit and loss (B) 2,225 (12,145)Other comprehensive income that will not be reclassified subsequently to profit and loss:Cumulated actuarial gains/(losses) on defined benefit plans (1,183) 623Total other comprehensive income that will not be reclassified subsequently to profit and loss (C) (1,183) 623Total Comprehensive Income (A) + (B) + (C) 97,803 122,478
Of which
Attributable to Shareholders of the Parent company 98,118 122,253
Attributable to non-controlling interests (314) 225
47 Financial Statements
Group2014 Annual Report
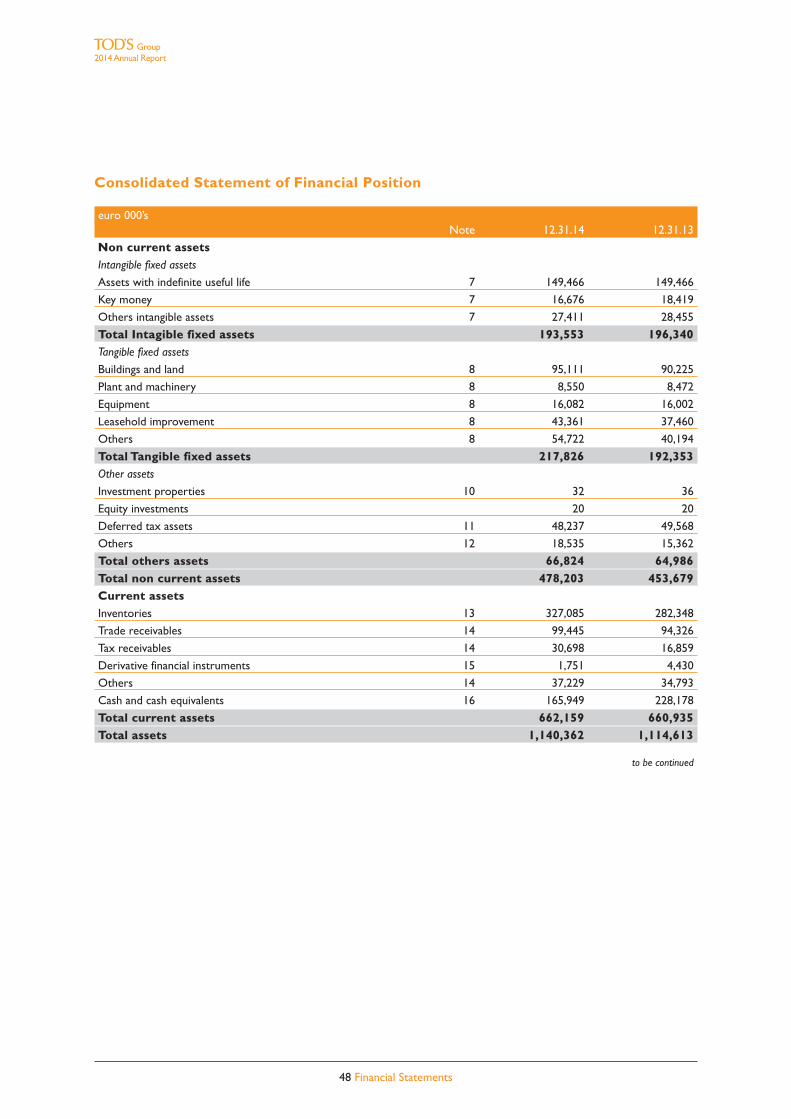
48 Financial Statements
Group2014 Annual Report
Consolidated Statement of Financial Position
euro 000’sNote 12.31.14 12.31.13
Non current assets Intangible fixed assets
Assets with indefinite useful life 7 149,466 149,466
Key money 7 16,676 18,419
Others intangible assets 7 27,411 28,455
Total Intagible fixed assets 193,553 196,340Tangible fixed assets
Buildings and land 8 95,111 90,225
Plant and machinery 8 8,550 8,472
Equipment 8 16,082 16,002
Leasehold improvement 8 43,361 37,460
Others 8 54,722 40,194
Total Tangible fixed assets 217,826 192,353Other assets
Investment properties 10 32 36
Equity investments 20 20
Deferred tax assets 11 48,237 49,568
Others 12 18,535 15,362
Total others assets 66,824 64,986Total non current assets 478,203 453,679Current assetsInventories 13 327,085 282,348
Trade receivables 14 99,445 94,326
Tax receivables 14 30,698 16,859
Derivative financial instruments 15 1,751 4,430
Others 14 37,229 34,793
Cash and cash equivalents 16 165,949 228,178
Total current assets 662,159 660,935Total assets 1,140,362 1,114,613
to be continued

continuing
euro 000’sNote 12.31.14 12.31.13
EquityShare capital 18 61,219 61,219
Capital reserves 18 214,055 214,055
Treasury stock 18
Hedging and translation 18 (8,747) (10,902)
Retained earnings 18 445,889 397,304
Profit/(loss) attributable to the Group 18 97,114 133,780
Total Equity attributable to the Group 809,531 795,456Non-controlling interestsShare capital and reserves 5,431 5,428
Profit/(loss) attributable to non-controlling interests (353) 220
Total Equity attributable to non-controlling interests 5,078 5,648Total Equity 814,609 801,104Non-current liabilitiesProvisions for risks 19 3,417 3,651
Deferred tax liabilities 11 29,360 35,254
Employee benefits 20 12,582 11,134
Others 22 16,619 18,835
Bank borrowings 21 20,298 21,087
Total non-current liabilities  82,276 89,961Current liabilitiesTrade payables 23 160,220 152,619
Tax payables 23 9,015 7,809
Derivative financial instruments 15 17,258 1,876
Others 23 41,345 35,278
Bank 21 15,638 25,966
Total current liabilities 243,477 223,547Total Equity and liabilities 1,140,362 1,114,613
Group2014 Annual Report
49 Financial Statements

50 Financial Statements
Group2014 Annual Report
Consolidated Statement of Cash Flows
euro 000’sNote Year 14 Year 13
Profit/(Loss) for the period 96,761 134,000Non-cash adjustments:Amortizat., deprec., revaluat., and write-downs 7-8-9-13-14 41,910 42,256
Change in reserve for employee 20 261 (272)
Change in deferred tax assets/liabilities 11 (287) (1,148)
Other non monetary expenses/(income) 19-15-18 2,405 (1,915)
Cash flow (A) 141,051 172,921Change in current assets and liabilities:Trade receivables 14 (4,613) 34,687
Other current assets 14 (2,436) 1,758
Inventories 13 (43,232) (19,210)
Tax receivables 14 (13,840) (774)
Trade payables 23 7,601 13,383
Other current liabilities 23 4,674 4,512
Tax payables 23 1,206 (347)
Change in operating working capital (B) (50,640) 34,009Cash flow from operations (C) = (A)+(B) 90,411 206,930Net investments in intangible and tangible assets 7-8 (63,086) (49,582)
(Increase) decrease of equity investments
Other changes in fixed assets
Reduction (increase) of other non-current assets 12 (3,173) (1,959)
Cash flow generated (used) in investing activities (D) (66,259) (51,541)Dividends paid 18 (82,902) (83,014)
Others change in Equity 18
Changes in long term loans/other non-current liabilities 21-22 (3,325) (5,844)
Capital increase 18
Changes in non controlling-interests
Cash flow generated (used) in financing (E) (86,227) (88,858)Translation differences (F)  9,935 (735)
Cash flow from continuing operations (G)=(C)+(D)+(E)+(F) (52,140) 65,796Cash flow from assets held for sale (H)
Cash flow generated (used) (I)=(G)+(H) (52,140) 65,796
Net cash and cash equivalents at the beginning of the period 207,100 141,304
Net cash and cash equivalents at the end of the period 154,961 207,100
Change in net cash and cash equivalents (52,140) 65,796
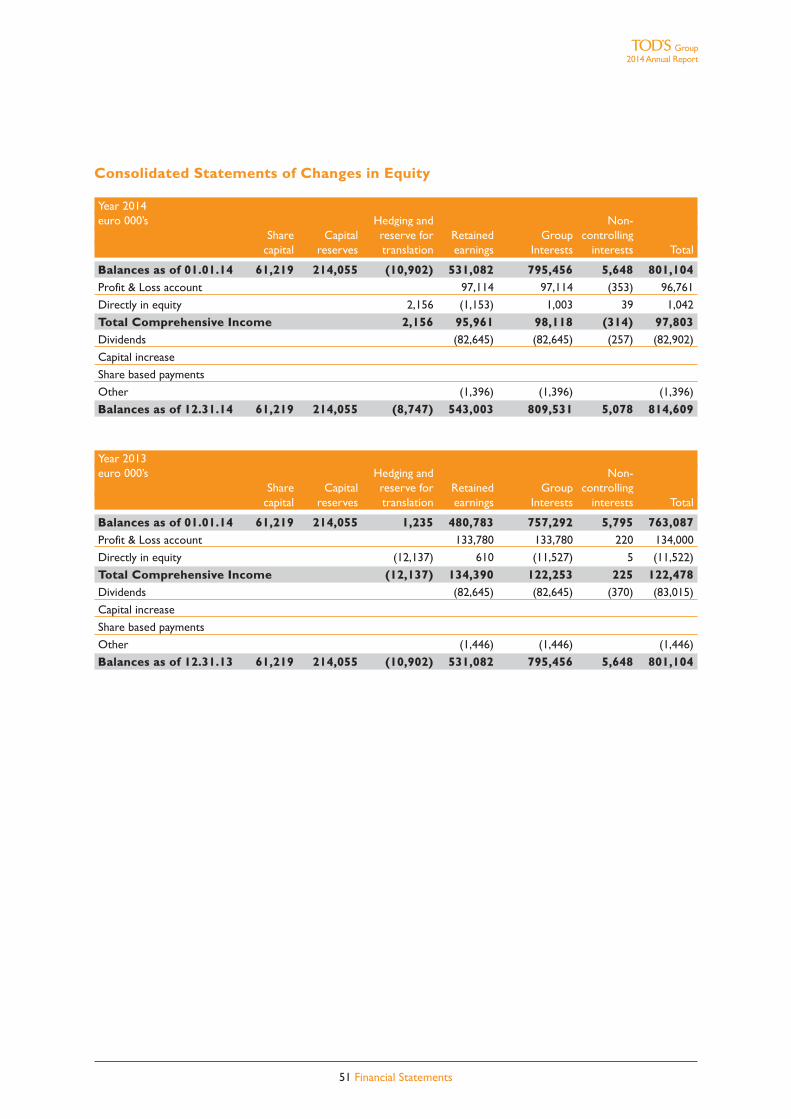
Consolidated Statements of Changes in Equity
Year 2014euro 000’s Hedging and Non-
Share Capital reserve for Retained Group controllingcapital reserves translation earnings Interests interests Total
Balances as of 01.01.14 61,219 214,055 (10,902) 531,082 795,456 5,648 801,104Profit & Loss account 97,114 97,114 (353) 96,761
Directly in equity 2,156 (1,153) 1,003 39 1,042
Total Comprehensive Income 2,156 95,961 98,118 (314) 97,803Dividends (82,645) (82,645) (257) (82,902)
Capital increase
Share based payments
Other (1,396) (1,396) (1,396)
Balances as of 12.31.14 61,219 214,055 (8,747) 543,003 809,531 5,078 814,609
Year 2013euro 000’s Hedging and Non-
Share Capital reserve for Retained Group controllingcapital reserves translation earnings Interests interests Total
Balances as of 01.01.14 61,219 214,055 1,235 480,783 757,292 5,795 763,087Profit & Loss account 133,780 133,780 220 134,000
Directly in equity (12,137) 610 (11,527) 5 (11,522)
Total Comprehensive Income (12,137) 134,390 122,253 225 122,478Dividends (82,645) (82,645) (370) (83,015)
Capital increase
Share based payments
Other (1,446) (1,446) (1,446)
Balances as of 12.31.13 61,219 214,055 (10,902) 531,082 795,456 5,648 801,104
51 Financial Statements
Group2014 Annual Report

[THIS PAGE HAS BEEN INTENTIONALLY LEFT BLANK]
52 2014 Annual Report

NOTES TO THE CONSOLIDATED FINANCIAL STATEMENTS
54 Notes to the Consolidated Financial Statements
Group2014 Annual Report
1. General notes
The TOD’S Group operates in the luxury sector under its proprietary brands (TOD’S, HOGAN, and FAY) and li-censed brands (ROGER VIVIER). It actively creates, produces and distributes shoes, leather goods and accessories,and apparel. The firm’s mission is to offer global customers top- quality products that satisfy their functional re-quirements and aspirations.The parent company TOD’S S.p.A., registered office in Sant’Elpidio a Mare (Fermo) at Via Filippo Della Valle 1, islisted on Mercato Telematico Azionario (MTA) of Borsa Italiana S.p.A.At December 31st, 2014 TOD’S S.p.A. share capital is owned by DI.VI. FINANZIARIA of DIEGO DELLA VALLE &C. S.r.l. for 54.37%.The consolidated financial statements has been prepared by the Board of Directors of TOD’S S.p.A. on March12th, 2015 and it is subject to PricewaterhouseCoopers S.p.A. audit.
2. Basis of preparation
The Consolidated Financial Statements as of December 31st, 2014 were prepared in accordance with IAS/IFRS(International Accounting Standards – IAS -, and International Financial Reporting Standards – IFRS) issued by IASB,based on the text published on the Gazzetta Ufficiale of European Union (G.U.C.E.). IAS/IFRS refers also to all re-vised International Accounting Standards (IAS) and all interpretative documents issued by the IFRIC (InternationalFinancial Reporting Interpretations Committee), previously nominated Standing Interpretations Committee (SIC).The Notes have been supplemented by the additional information required by CONSOB and its implementingmeasures of Article 9 of Legislative Decree 38/2005 (Resolutions 15519 and 15520 of July 27th, 2006 and memo-randum DEM/6064293 of July 28th, 2006, pursuant to Article 114(5) of the Consolidated Law on Finance-TUF),Article 78 of the Issuer Regulation, the EC document of November 2003 and, when applicable, the Italian CivilCode. Consistently with the financial statements for the previous year, certain information is provided in theReport by the Board of Directors on Operations.The consolidated financial statements has been prepared on the going concern basis, and it includes the statementof financial position, the income statement, statement of comprehensive income, the statement of cash flows andthe statement of changes in equity of TOD’S S.p.A. and its Italian and foreign subsidiaries, which are jointly referredto as the TOD’S Group. The consolidated financial statements is prepared in euro currency, on the basis of draftFinancial Statements as of December 31st, 2014 (January 1st – December 31st) approved by the respective boardsof directors or, if there was no board of directors, by the sole directors, of the legal entities included in the con-solidation scope. Because the closing date of its fiscal year does not coincide with the reference date of the con-solidated financial statements, Tod’s India Retail Pte. Ltd was included on the basis of interim financial statementsfor twelve months, referring to the date of the consolidated financial statements.For presentation of its operating income, the Group adopted the presentation of the profit and loss by nature.The format of representing revenues and costs by nature is followed, indicating the EBITDA and EBIT results asin the past, since they are considered representative indicators of company performance. In addition, it has beenprepared the statement of comprehensive income which include transactions that are outside the income state-ment but they produce their effects directly to equity. Transactions represented in the statement of comprehen-sive income are net of tax effects, if applicable.The statement of financial position shows current items, for which it is supposed that they will be realized or closedduring the normal operating cycle, separately from non-current items (both assets and liabilities).The financial statements schemes, joined with both report on operations and supplementary notes, are consid-ered to be those that provide the best organized representation of the Group’s financial position and income. Ifit proves necessary or appropriate to amend items in the financial statements as a result of the application of anew accounting standard, a change in the nature of a transaction or an accounts review, in order to provide reli-able and more relevant information for the users of the financial statements, the comparative data will be reclas-sified accordingly in order to improve the comparability of the information between one financial year and another.In this case, if the changes are significant, they will be suitably disclosed in the notes to the financial statements.

3. Evaluation methods and accounting standards
The accounting standards and principles of consolidation applied to the preparation of these ConsolidatedFinancial Statements are consistent with those applied to the preparation of the Consolidated Financial Statementsat December 31st, 2013, except for the information reported below in relation to any amendments, interpreta-tions and new accounting standards applicable from January 1st, 2014.
Accounting standards, amendments and interpretations endorsed by the European Union, which will beapplicable from January 1st, 2014 and which were first adopted in the TOD’S Group’s consolidated fi-nancial statements at December 31st, 2014
• IFRS 10 – Consolidated Financial Statements. This standard introduces a new principle of control and estab-lishes control as the basis for determining which entities must be consolidated. This standard sets out threeelements of control: the power over an investee, the exposure to variable returns from its involvement withthe investee and the connection between power and returns, i.e. the ability to exercise power over the in-vestee to affect variable returns. IFRS 10 replaces SIC-12 “Consolidation - Special Purpose Entities”, as wellas any relevant provisions under IAS 27 “Consolidated and Separate Financial Statements”. The IASB requiredan entity to apply this standard retrospectively for periods beginning on January 1st, 2013. The competent bod-ies of the European Union have completed the process for endorsement of this standard and have postponedthe related date of first-time adoption to January 1st, 2014, with early application permitted. The new standardhas had no impact on the Group.
• IAS 27 Revised – Separate Financial Statements. This standard was amended in 2011, as a result of the issue ofIFRS 10. The scope of application of IAS 27 is limited to separate financial statements only. This standard pre-scribes the accounting for investments in subsidiaries, joint ventures and associates in separate financial state-ments. The IASB required an entity to apply this standard retrospectively for periods beginning on January 1st,2013. The competent bodies of the European Union have completed the process for endorsement of this stan-dard and have postponed the related date of first-time adoption to January 1st, 2014, with early application per-mitted. The new standard has had no impact on the Group.
• IFRS 11 – Joint Arrangements. This standard replaces IAS 31 – Interests in Joint Ventures and SIC-13 – JointlyControlled Entities – Non-Monetary Contributions by Venturers. Specifically, this standard classifies jointarrangements into two types: joint operations and joint ventures. According to IFRS 11, joint ventures mustbe accounted for using the equity method. Therefore, the method of proportionate consolidation providedfor in IAS 31 for this type of joint arrangement is no longer permitted as an alternative valuation method. TheIASB required an entity to apply this standard retrospectively for periods beginning on January 1st, 2013. Thecompetent bodies of the European Union have completed the process for endorsement of this standard andhave postponed the related date of first-time adoption to January 1st, 2014, with early application permitted.The new standard has had no impact on the Group.
• IAS 28 Revised – Investments in Associates and Joint Ventures. This standard was amended in 2011, as a resultof the issue of IFRS 10 and IFRS 11. This standard prescribes the accounting for investments in associates andjoint ventures and sets out the requirements for the application of the equity method. The IASB required anentity to apply this standard retrospectively for periods beginning on January 1st, 2013. The competent bod-ies of the European Union have completed the process for endorsement of this standard and have postponedthe related date of first-time adoption to January 1st, 2014, with early application permitted. The new standardhas had no impact on the Group.
• IFRS 12 – Disclosure of Interests in Other Entities. This standard sets out any and all disclosure requirementslaid down in consolidated financial statements, in relation to subsidiaries, joint arrangements, associates andunconsolidated structured entities. The disclosure is more extensive than that currently required by IAS 27,IAS 28 and IAS 31 in force. The IASB required an entity to apply this standard retrospectively for periods be-ginning on January 1st, 2013. The competent bodies of the European Union have completed the process forendorsement of this standard and have postponed the related date of first-time adoption to January 1st, 2014,
Group2014 Annual Report
55 Notes to the Consolidated Financial Statements

56 Notes to the Consolidated Financial Statements
Group2014 Annual Report
with early application permitted. The effects of the adoption of the new standard are limited to the disclosurerelating to interests in other entities to be provided in the explanatory notes to the annual consolidated fi-nancial statements.
• Amendments to IFRS 10, IFRS 12 and IAS 27 “Investment Entities”. This standard was issued in October 2012.The amendment provides an exception to the consolidation of subsidiaries for any entities that qualify as “in-vestment entities”, except when subsidiaries provide services that relate to the investment activities carriedout by said entities. Unconsolidated subsidiaries must be valued according to IAS 39. Instead, a parent entityof an “investment entity”, which is not an “investment entity” itself, must consolidate all entities that it con-trols (including those controlled through an investment entity). These amendments are required to be appliedretrospectively from January 1st, 2014 and have had no impact on the Group.
• Amendments to IAS 32 – Financial Instruments. These amendments set out the requirements for offsettingthe financial instruments referred to in IAS 32. They are applicable retrospectively from January 1st, 2014 andhave had no significant impact on the Group.
• Amendments to IAS 36 – Impairment of Assets. The amendments were issued in May 2013 in relation to therecoverable amount disclosures for non-financial assets. Specifically, they clarify the disclosures required in thecase of impairment or reversals of non-financial assets at fair value, less costs of disposal. They are applicableretrospectively from January 1st, 2014. The effects of the adoption of the new standard are limited to the dis-closure relating to interests in other entities to be provided in the explanatory notes to the annual consoli-dated financial statements.
• Amendments to IAS 39 – Financial Instruments: Recognition and Measurement. These amendments were is-sued in June 2013 in relation to the novation of derivatives recognised according to hedge accounting. Underthe amendments there would be no need to discontinue hedge accounting if a hedging derivative was novat-ed with a central counterparty (CCP), as a consequence of laws or regulations. The amendments are applica-ble from January 1st, 2014 and have had no significant impact on the Group.
Accounting standards, amendments and interpretations endorsed by the European Union, which will beapplicable from January 1st, 2015 and which have not been adopted early by the TOD’S Group.
• IFRIC 21 – Levies. This interpretation was published on May 20th, 2013 and provides guidance on when torecognise a liability for a levy imposed by a government, both for levies that are accounted for in accordancewith IAS 37 - Provisions, Contingent Liabilities and Contingent Assets and those where the timing and amountof the levy is certain. Specifically, this interpretation states that a liability must be recognised at the time of theoccurrence of the event, which is normally specified in the legislation introducing a new duty/tax generatingthe obligation, even if the obligation is measured on past performances. The interpretation should have beenapplied retrospectively, subject to prior endorsement, for periods beginning on January 1st, 2014. The processfor endorsement that was completed with the publication in the Official Journal on June 14th, 2014 delayedits application on the part of the European Union and will be applicable for periods beginning on or after June17th, 2014 (for the Group, from January 1st, 2015).
• “Annual Improvements to IFRSs: 2010-2012 Cycle” - This document, which was published on December 2013,was aimed at adopting the proposed amendments to the standards within the annual improvements process.The main amendments involve the IAS/IFRS and the issues reported below: IFRS 2 Share-based Payment -Definition of vesting conditions; IFRS 3 Business Combinations – Accounting for contingent consideration; IFRS8 Operating Segments - Aggregation of operating segments; IFRS 8 Operating Segments - Reconciliation ofthe total of the reportable segments’ assets to the entity’s assets; IFRS 13 Fair Value Measurement - Short-term receivables and payables; IAS 16 Property, Plant and Equipment and IAS 38 Intangible Assets - Revaluationmethod: proportionate restatement of accumulated depreciation; IAS 24 Related Party Disclosures - Key man-agement personnel. The process for endorsement by the European Union was completed with the publica-tion in the Official Journal on January 9th, 2015. The amendments will be applicable for periods beginning onor after July 1st, 2014 (for the Group, from January 1st, 2015).
• “Annual Improvements to IFRSs: 2011-2013 Cycle” – This document, which was published in December 2013,

was aimed at adopting the proposed amendments to the standards within the annual improvements process.The main amendments involve the IAS/IFRS and the issues reported below: IFRS 1 First-time Adoption ofInternational Financial Reporting Standards – Meaning of “effective IFRSs; IFRS 3 – Business Combinations -Scope exception for joint ventures; IFRS 13 Fair Value Measurement - Scope of paragraph 52 (portfolio ex-ception); IAS 40 Investment Property - Interrelationship between IFRS 3 and IAS 40. The process for en-dorsement by the European Union was completed with the publication in the Official Journal on December19th, 2014. The amendments will be applicable for periods beginning on or after July 1st, 2014 (for the Group,from January 1st, 2015).
• IAS 19 – Employee contributions to defined benefit plans. On November 21st, 2013, the IASB published someminor amendments to IAS 19 – Employee benefits, concerning the accounting for contributions to definedbenefit plans from employees or third parties in specific cases, to be recognised as a reduction in the servicecost for the period. The process for endorsement by the European Union was completed with the publica-tion in the Official Journal on January 9th, 2015. These amendments will be applicable retrospectively for peri-ods beginning on or after July 1st, 2014 (for the Group, from January 1st, 2015).
Accounting standards, amendments and interpretations published by the IASB but not yet endorsed bythe European Union.
• IFRS 14 – Regulatory Deferral Accounts. On January 30th, 2014 the IASB published the document as the firststep in the wider rate-regulated activities project, which was started by the IASB in September 2012. IFRS 14allows entities, but only those which are first-time adopters of IFRS, to continue to recognise the amounts ofassets/liabilities subject to rate regulation according to the accounting standards previously adopted. In orderto enhance comparability with entities that already apply IFRS and do not recognise these amounts separate-ly, the standard requires the effect of rate-regulated activities to be presented separately from other items inthe statement of financial position, the income statement and the statement of comprehensive income.
• Amendments to IFRS 11: Accounting for Acquisitions of Interests in Joint Operations (issued on May 6th, 2014).• IFRS 15 – Revenue from Contracts with Customers. On May 28th, 2014 the IASB published a document which
requires an entity to recognise revenue at the time the control of goods or services is transferred to the cus-tomer in an amount that reflects the consideration to which the entity expects to be entitled in exchange forthese goods or services. The new revenue recognition model sets out a process in five steps. The new stan-dard also requires additional disclosures regarding the nature, amount, timing and uncertainty of the revenueand cash flows arising from these contracts with customers.
• Amendments to IAS 16 and IAS 38: Clarification of Acceptable Methods of Depreciation and Amortisation (is-sued on May 12th, 2014).
• Amendments to IAS 16 and IAS 41: Bearer Plants (issued on June 30th, 2014).• IFRS 9 – Financial Instruments. On July 24th, 2014 the IASB published the final document constituting the con-
clusion of the process, divided into three phases: Classification and Measurement, Impairment and GeneralHedge Accounting, entirely revising IAS 39. The document introduces new requirements for classifying andmeasuring financial assets and liabilities. Specifically, as regards financial assets, the new standard adopts a sin-gle approach based on how the financial instruments are managed and on the contractual cash flow charac-teristics of the financial assets themselves in order to determine the related valuation method, aiming at even-tually replacing the various rules laid down under IAS 39. As regards financial liabilities, the main amendmentconcerns the method of accounting for fair value changes in a financial liability designated as at fair valuethrough profit or loss, which are due to own credit of the financial liability itself. According to the new stan-dard, these changes must be recognised in other comprehensive income, without affecting profit or loss. Themain development relating to hedge accounting are:
- Changes in the type of transactions that qualify for hedge accounting; specifically, a more extensive range ofrisks has been introduced for non-financial assets/liabilities that qualify for hedge accounting;
- A change in the method of accounting for forward contracts and options included in a hedge accounting re-lationship, in order to reduce profit or loss volatility;
- Changes in the effectiveness test by replacing the current methods based on the 80-125% range with the prin-
Group2014 Annual Report
57 Notes to the Consolidated Financial Statements
58 Notes to the Consolidated Financial Statements
Group2014 Annual Report
ciple of the “economic relationship” between the hedged item and the hedging instrument; furthermore, en-tities are no longer required to perform an assessment of the retrospective effectiveness of the hedging re-lationship;
- A greater flexibility of the accounting methods is offset by improved disclosures on the risk management ac-tivities carried out by entities.The new document includes a single model for the impairment of financial assets based on expected losses.
• Amendments to IAS 27: Equity Method in Separate Financial Statements (issued on 12 August 2014).• Amendments to IFRS 10 and IAS 28: Sale or Contribution of Asset between an Investor and its Associate or
Joint Venture (issued on September 11th, 2014).• Annual Improvements to IFRSs: 2012-2014 Cycle (issued on September 25th, 2014). • Amendments to IAS 1: Disclosure Initiative (issued on December 18th, 2014).• Amendments to IFRS 10, IFRS 12 and IAS 28: Investment Entities: Applying the Consolidation Exception (is-
sued on December 18th, 2014).
3.1 Use of estimates. Preparation of the financial statements and notes in conformity with IFRS requires thatmanagement make judgments, estimates and assumptions which impact on the values reported for assets and li-abilities, as well as disclosures relating to contingent assets and liabilities at the balance sheet date. Estimates andassumptions are based on historical data and other elements deemed significant, as at the end of the accountingperiod of reference.
3.2 Consolidation principles. A subsidiary is an investee over which the TOD’S Group has control when itis exposed, or has rights, to variable returns from its involvement with the investee and has the ability to affectthose returns through its power over the investee, as defined by IFRS 10 – Consolidated Financial Statements.The financial statements of subsidiaries are included in the consolidated financial statements from the date whencontrol is acquired until such control terminates.Acquisitions of subsidiaries are recognized according to the acquisition method. The considerations transferred in abusiness combination is represented by the aggregate sum, at the acquisition date, of the fair values of the acquired as-sets, the liabilities incurred or assumed, and the equity interest issued in exchange for control of the acquired entity.The identifiable assets, liabilities, and potential liabilities of the acquired entity that satisfy the recognition criteriaenvisaged in IFRS 3 are recognised at their fair value on the acquisition date, with the exception of non-currentassets (or groups available to sale) that are classified as held for sale in accordance with IFRS 5.Goodwill is measured as the excess of the aggregate of the consideration transferred, the amount of any non-con-trolling interests over the net amounts of the identifiable assets acquired and liabilities assumed pursuant to theacquisition. Should the aforesaid difference be negative, the excess is immediately booked in the income statement.Once control of an entity has been acquired, the transactions where the controlling entity acquires or transfersadditional non-controlling interests without altering control over the subsidiary are transactions with sharehold-ers and are thus recognised in equity.Subsidiaries are consolidated according to the line-by-line method from the date on which control is transferredto the Group. They are deconsolidated starting on the date when such control ceases. The scope of consolidationand the related changes respect to the previous year are represented in the Note 4.Intercompany transactions and the profits and losses generated by transactions between consolidated enterpris-es are eliminated from both the balance sheet and the profit and loss account. Unrealised losses arising from in-tercompany transactions are considered when the transaction entails an impairment in the value of the transferredasset. When necessary, the balance sheets and profit and loss accounts of the subsidiaries are adjusted in order tobring the applied accounting policies in line with those used by the Group.
3.3 Non-controlling interests. Non-controlling interests are indicated under shareholders’ equity as “Non-controlling interests”. The non-controlling interests in the acquired business is initially determined in an amountequal to their share of the fair value of the assets, liabilities, and potential liabilities recorded on the date of theoriginal acquisition date and subsequently adjusted according to the changes in shareholders’ equity. Likewise, thisaccount reflects the changes in non-controlling interests and any losses allocable to them.

3.4 Transactions in foreign currency. i. Functional and reporting currency. All accounts recognised on the financial statements of the subsidiariesare measured by using the currency of the principal economic environment in which the entity operates (i.e. itsfunctional currency). The Consolidated Financial Statements are stated in euro (rounded to the nearest thousand),since this is the currency in which most Group transactions are executed.
ii. Transactions in foreign currency. The financial statements of the individual Group entities are prepared inthe functional currency of each individual company. When the individual financial statements are prepared, the for-eign currency transactions of Group companies are translated into the functional currency (currency of the pri-mary economic environment in which each entity operates) by applying the exchange rate in effect at the date ofthe transaction. Monetary assets and liabilities denominated in foreign currencies at the date of the financial state-ments are translated by using the exchange rate in effect at the closing date. Non-monetary assets and liabilitiesare valued at their historic cost in foreign currency and translated by using the exchange rate in effect at the trans-action date.The foreign exchange differences arising upon settlement of these transactions or translation of cash assets andliabilities are recognized on the profit and loss account.
iii. Presentation of financial statements drafted in foreign currency. In order to present the financial state-ments of consolidated entities that are expressed in a functional currency different from the consolidation cur-rency, the balance sheet items are translated using the exchange rates in effect at the end of the period, while itemson the profit and loss account are translated using the average exchange rate for the period. The difference be-tween the result for the period resulting from translation at the average exchange rates and the result of transla-tion at the end of period rates, on the one hand, and the impact on assets and liabilities of changes in the exchangerate relationships between the beginning and end of the period, on the other hand, are recognized under share-holders’ equity in a special “Translation reserve” through the recognition in the other comprehensive income.The translation differences recognized under shareholders’ equity are transferred to the profit and loss accountat the time of disposal or liquidation of the controlled entity.The rates applied to translation, compared with those used in the previous year, are indicated in the following table:
Year 2014 Year 2013Exch. rate as Average Exch. rate as Average of year end exch. rate of year end exch. rate
U.S. dollar 1.214 1.327 1.379 1.328
British pound 0.779 0.806 0.834 0.849
Swiss franc 1.202 1.215 1.228 1.231
Hong Kong dollar 9.417 10.288 10.693 10.298
Japanese yen 145.230 140.306 144.720 129.371
Hungarian forint 315.540 308.654 297.040 296.890
Singapor dollar 1.606 1.681 1.741 1.661
Korean won 1,324.800 1,397.390 1,450.930 1,453.385
Macao pataca 9.701 10.597 11.015 10.607
Chinese renmimbi 7.536 8.173 8.349 8.163
Indian rupee 76.719 80.969 85.366 77.392
Albanian lek 140.095 139.958 140.533 140.290
Brazilian real 3.221 3.119 3.258 2.850
3.5 Derivative financial instruments.The fundamental characteristics of the derivative financial instruments are set out in the paragraph on Derivativefinancial instruments. The TOD’S Group uses derivatives to hedge foreign currency risks arising from its opera-tions and to hedge risks associated with changes in interest rates on loans, with no speculative or trading pur-poses consistently with the treasury management strategy policies recommended by the Board of Directors.
Group2014 Annual Report
59 Notes to the Consolidated Financial Statements

60 Notes to the Consolidated Financial Statements
Group2014 Annual Report
As derivatives transactions are carried out to hedge risks arising from changes in expected cash flows (forecasttransactions), they are accounted for according to cash flow hedge rules until the transaction is reported in thefinancial statements; subsequently, derivatives are treated according to fair value hedge rules since they may be de-scribed as instruments to hedge changes in the value of assets/liabilities recognised in the financial statements.According to hedge accounting rules, derivatives are recognised in the balance sheet at fair value; how fair valuechanges are reported differs according to the type of hedge on the measurement date:
- any changes in the fair value of derivatives that hedge forecast transactions (i.e. cash flow hedge) are recog-nised directly in the appropriate equity reserve, except for the portion of the change related to the ineffec-tive part of the hedge, which is recognised under financial income and charges in the income statement; thedifferences in fair value already directly recognised in the appropriate equity reserve are fully recognised inthe income statement, as an adjustment to operating margins, when the assets/liabilities relating to the hedgeditems are recognised. As regards derivatives used to hedge risks associated with changes in interest rates onloans, the fair value differences already recognised in the equity reserve are, on the other hand, allocated toadjusting the amounts of financial income and costs when the positive or negative differentials are settled;
- any differences in the fair value of derivatives that hedge assets and liabilities reported in the financial state-ments (i.e. fair value hedge) are fully recognised under financial income and charges in the income statement.Additionally, the carrying amount of the hedged item (asset/liability) is adjusted by the change in its value thatis attributable to the hedged risk, against an entry under financial income and charges.
3.6 Intangible fixed assets.i. Goodwill. All business combinations are recognized by applying the acquisition method. Goodwill is meas-ured at the acquisition date as the excess of the assets and liabilities recognised in accordance with IFRS 3 andthe fair value of consideration transferred including the amount of any non-controlling interests recognised. Foracquisitions prior to January 1st, 2004, the date of transition to IAS/IFRS, goodwill retained the values recognizedon the basis of the previous Italian GAAP, net of accumulated amortization up to the transition date.Goodwill is recognized on the financial statements at its cost adjusted for impairment losses. It is not subject toamortization, but the adequacy of the values is annually subjected to the impairment test, in accordance with therules set forth in the section Impairment losses.
ii. Trademarks. These are recognized according to the value of their cost and/or acquisition, net of accumu-lated amortization at the date of transition to IAS/IFRS. TOD’S, HOGAN and FAY trademarks are classified as in-tangible fixed assets with an indefinite useful life and thus are not amortized, insofar as:• they play a primary role in the Group’s strategy and are an essential driver thereof;• the corporate structure, construed as organized property, plant, and equipment, and organization itself in a
figurative sense, is closely correlated with and dependent on dissemination and development of the trademarkson the markets;
• the trademarks are proprietary, properly registered, and constantly protected pursuant to law, with optionsfor renewal of legal protection, upon expiration of the registration periods, that are not burdensome, easilyimplemented, and without external impediments;
• the products sold by the Group with these trademarks are not subject to particular technological obsoles-cence, which is characteristic of the luxury market in which the Group operates; on the contrary, they areconsistently perceived by the market as being innovative in the national and/or international context charac-teristic of each trademark, they are distinguished by market positioning and notoriety that ensures their dom-inance of the respective market segments, being constantly associated and compared with benchmark brands;
• in the relative competitive context, it can be affirmed that the investments made for maintenance of the trade-marks are proportionately modest with respect to the large forecast cash flows.
The adequacy of the values is annually subjected to the impairment test, in accordance with the rules set forth inthe section Impairment losses.
iii. Key Money. Key money, represents the amounts paid for this purpose by the Group to take over certain leas-es of commercial spaces where some DOS operate. They are recognized at cost, which consider the cost net ofcumulated depreciations and impairment losses.
iv. Research and development costs The research costs for a project are charged fully to the profit and lossaccount of the period in which they are incurred.The development costs of an activity are instead capitalized if the technical and commercial feasibility of the rel-ative activity and economic return on the investment are certain and definite, and the Group has the intention andresources necessary to complete the development.The capitalized costs include the costs for materials, labor, and an adequate portion of overhead costs. They arerecognized at cost, net of accumulated amortization and depreciation (see below) and impairment losses.
v. Other intangible fixed assets. These are identifiable non-monetary intangible assets under the control of thecompany and capable of causing the Group to realize future economic benefits. They are initially recognized at theirpurchase cost, including expenses that are directly attributable to them during preparation of the asset for its in-tended purpose or production, if the conditions for capitalization of expenses incurred for internally generatedexpenses are satisfied. The cost method is used for determining the value reported on subsequent statements, which entails posting theasset at its cost net of accumulated amortization and write-downs for impairment losses.
vi. Subsequent capitalization. The costs incurred for these intangible fixed assets after purchase are capital-ized only to the extent that they increase the future economic benefits of the specific asset they refer to. All theother costs are charged to the profit and loss account in the fiscal year in which they are incurred.
vii. Amortization. Intangible fixed assets (excluding those with an indefinite useful life) are amortized on a straight-line basis over the period of their estimated useful life, starting from the time the assets are available for use.
3.7 Tangible assetsi. Property, plant and equipment owned by the company. They are first recognized at their purchase costor at the cost recalculated at the date of transition to IFRS, including any directly attributable ancillary expenses.Following first-time recognition, these assets are reported net of their accumulated depreciation and impairmentlosses (i.e. in accordance with the cost model).For those assets whose depreciation must be calculated using the component approach, the portions of cost al-locable to the individual significant components characterized by a different useful life are determined. In this case,the value of land and buildings is kept separate, with only buildings being depreciated.
ii. Leasing. Lease agreements in which the Group assumes all the risks and benefits deriving from ownershipof the asset are classified as finance leasing. The assets (real estate, plant, and machinery) possessed pursuant tothese agreements are recorded under property, plant, and equipment at the lesser of their fair value on the datethe agreement was made, and the current value of the minimum payments owed for leasing, net of accumulateddepreciation and any impairment losses (according to the rules described in the section Impairment losses). A fi-nancial payable for the same amount is recognized instead under liabilities, while the component of interest ex-penses for finance leasing payments is reported on the profit and loss account according to the effective interestmethod.
iii. Subsequent capitalizations. The costs incurred for property, plant, and equipment after purchase are capi-talized only to the extent that they increase the future economic benefits of the asset. All the other costs arecharged to the profit and loss account in the fiscal year in which they are incurred.
iv. Investment property. Investment property are originally recognized at cost, and then recognized at their costas adjusted for accumulated depreciation and impairment losses.Depreciation is calculated on a systematic, straight-line basis according to the estimated useful life of the buildings.
Group2014 Annual Report
61 Notes to the Consolidated Financial Statements
62 Notes to the Consolidated Financial Statements
Group2014 Annual Report
v. Depreciation. Property, plant, and equipment were systematically depreciated at a steady rate according tothe depreciation schedules defined on the basis of their estimated useful life. Land is not depreciated. The princi-pal depreciation rates applied are as follows:
% depreciation
Industrial buildings 2.5% - 3%
Machinery and plant 12.5%
Equipments 25%
Forms and punches, cliches, molds and stamp 25%
Furniture and furnishings 12%
Office machines 20%
Cars and transport vehicles 20% - 25%
The photovoltaic plant recognised by the parent company is depreciated over a period of 20 years.The costs for leasehold improvements, which mainly include the costs incurred for set up and modernization ofthe DOS network and all the other real estate that is not owned but used by the Group (and thus instrumentalto its activity) are depreciated according to the term of the lease agreement or the useful life of the asset, if thisis shorter.
3.8 Impairment losses. In the presence of indicators, events, or changes in circumstances that presume theexistence of impairment losses, IAS 36 envisages subjecting intangible fixed assets and property, plant and equip-ment to the impairment test in order to assure that assets with a value higher than the recoverable value are notrecognized on the financial statements. This test is performed at least once annually for non-current assets withan indefinite life in the same way as that used for non-current assets that have not yet been placed in service.Confirmation of the recoverability of the values recognized on the balance sheet is obtained by comparing thebook value at the reference date and the fair value less costs to sale (if available) or value in use. The value in useof a tangible or intangible fixed asset is determined according to the estimated future financial flows expected fromthe asset, as actualized through use of a discount rate net of taxes, which reflects the current market value of thecurrent value of the cash and risks related to Group’s activity.If it is not possible to estimate an independent financial flow for an individual asset, the cash generating unit towhich the asset belongs and with which it is possible to associate future cash flows that can be objectively deter-mined and independent from those generated by other operating units is identified. Identification of the cash gen-erating units was carried out consistently with the organizational and operating architecture of the Group.If the impairment test reveals an impairment loss for an asset, its book value is reduced to the recoverable valueby posting a charge on the profit and loss account, unless the asset is revalued. In that case, the write-down is rec-ognized in the revaluation reserve.When the reasons for a write-down cease to exist, the book value of the asset (or the cash generating unit), withthe exception of goodwill, is increased to the new value resulting from the estimate of its recoverable value, butnot beyond the net book value that the asset would have had if the impairment loss had not been charged. Therestored value is recognized immediately on the profit and loss account, unless the asset is revalued, in which casethe restored value is recognized in the revaluation reserve.
3.9 Financial assets. These are recognized and cancelled on the balance sheet according to the trading dateand are initially valued at fair value which generally correspond to the cost, including costs directly related withthe acquisition.At the subsequent financial statement dates, the financial assets that the Group intends and is able to hold untilmaturity (securities held to maturity) are recognized at the amortized cost according to the effective interestmethod, net of impairment losses.Financial assets other than those held to maturity are classified as held for trading or available for sale, and arerecognized at their fair value at the end of each period. When the financial assets are held for trading, the profitsand losses deriving from changes in the fair value are recognized in the profit and loss account for the period. In

the case of financial assets available for sale, the profits and losses deriving from changes in the fair value are rec-ognized directly in shareholders’ equity until they are sold or have sustained a loss in value. At that time, the ag-gregate profits or losses that were previously recognized in shareholders’ equity are recognized on the profit andloss account of the period.
3.10 Inventories. These are recognized at the lower of purchase cost and their assumed disposal value. The netdisposal value represents the best estimate of the net sales price that can be realized through ordinary businessprocesses, net of any production costs not yet incurred and direct sales costs.The cost of inventories is based on the weighted average cost method. The production cost is determined by in-cluding all costs that are directly allocable to the products, regarding – for work in progress and/or semi-finishedproducts – the specific stage of the process that has been reached. The values that are thus obtained do not dif-fer appreciably from the current production costs referring to the same classes of assets.A special depreciation reserve is set aside for the portion of inventories that are no longer considered econom-ically useable, or with a presumed disposal value that is less than the cost recognized on the financial statements.
3.11 Trade receivables and other receivables. These are initially recognised at fair value, including trans-action costs, and subsequently measured at amortized cost. The measurement considers the recoverable amountof the assets through the recognition of a specific allowance for doubtful accounts determined as follows:• receivables under litigation, with certain and precise evidence documenting the impossibility of collecting them,
have been analytically identified and then written down;• for other bad debts, prudent allowances for write-downs have been set aside, estimated on the basis of in-
formation updated at the date of this document.
3.12 Cash and cash equivalents. This includes cash on hand, bank demand deposits, and financial investmentswith a maturity of no more than three months. These assets are highly liquid, easily convertible into cash, and sub-ject to a negligible risk of change in value.
3.13 Assets and liabilities held for sale. Non-current assets (or disposal groups) are classified as held forsale when their carrying amount is recovered through a sale transaction rather than through continuing use. Theyare not depreciated and are measured at the lower of carrying amount and fair value, less costs to sell. Assets heldfor sale and related liabilities are presented separately from other assets and liabilities in the statement of finan-cial position.
3.14 Benefits for employees. Employee benefits include (i) short-term employee benefits such as wages,salaries and related social security contributions, accrued but not yet paid, paid annual leave and paid sick leave,etc.; (ii) post-employment benefits, such as pensions or retirement benefits; (iii) other long-term benefits; and(iv) termination benefits.Short-term benefits are recognised periodically on an accruals basis and are made up of liabilities to employeesthat have not been settled by the reporting date.Post-employment benefits are divided into two categories:
i. Defined contribution plans. Payments for any defined contribution plans are recognised in the income state-ment in the period in which they are due.
ii. Defined benefit plans. The costs of defined benefit plans are calculated using the Projected Unit CreditMethod, carrying out the actuarial measurements at the end of each financial year. Past service costs are recognisedimmediately to the extent that these benefits have already accrued; otherwise they are amortised on a straight-linebasis within the average period within which the benefits are expected to accrue. The financial costs that have ac-crued on the basis of the annual discounting rate are recognised in the income statement immediately. Actuarialgains and losses are now recognised through other changes in comprehensive income under the specific equity item.
63 Notes to the Consolidated Financial Statements
Group2014 Annual Report
Liabilities for post-employment benefits recognised in the financial statements represent the present value of lia-bilities for defined benefit plans. On the other hand, there are no other long- term employee benefits or termi-nation benefits in the financial statements.
iii. Share based payments. The payments based on shares are assessed at their fair value on the assignmentdate. This value is recognized on the profit and loss account on a straight-line basis throughout the period of ac-crual of the rights. This allocation is made on the basis of a management estimate of the stock options that willactually accrue in favor of vested employees, considering the conditions for use thereof not based on their mar-ket value.The fair value is determined by using the binomial method. No share based payments result in the current con-solidated financial statements.
3.15 Payables.i. Bank overdrafts and financing. Interest-bearing financing and bank overdrafts are initially recognized at fairvalue, net of transaction costs, and subsequently valued at the amortized cost, using the effective interest method.
ii. Trade payables and other payables. These are measured at fair value which generally correspond to theirnominal value.
3.16 Provision for risks. These are certain or probable liabilities that have not been determined at the date theyoccurred and in the amount of the economic resources to be used for fulfilling the obligation, but which can nonethe-less be reliably estimated. They are recognized on the balance sheet in the event of an existing obligation, legal orconstructive, resulting from a past event, and it is likely that the Group will be asked to satisfy the obligation.If the effect is significant, and the date of the presumed discharge of the obligation can be estimated with sufficientreliability, the provisions are recognized on the balance sheet discounting future cash flows.The provisions that can be reasonably expected to be discharged twelve months after the reference date are classi-fied on the financial statements under non-current liabilities. Instead, the provisions for which the use of resourcescapable of generating economic benefits is expected to take place in less than twelve months after the reference dateare recognized as current liabilities.
3.17 Share capital.i. Share capital. The total value of shares issued by the parent company is recognized entirely under share-holders’ equity, as they are the instruments representing its capital.
ii. Treasury stock. The consideration paid for buy-back of share capital (treasury stock), including the expens-es directly related to the transaction, is subtracted from shareholders’ equity. In particular, the par value of the sharesreduces the share capital, while the excess value is recognized as an adjustment to additional paid-in capital.
3.18 Dividends. The allocation of dividends to persons possessing instruments representing share capital afterthe reference date of the financial statement is not recognized under financial liabilities on the same reference date.
3.19 Revenues recognition. Revenues are recognized on the profit and loss account when the significant risksand benefits connected with ownership of the transferred assets are transferred to the buyer. In reference to themain transactions realized by the Group, revenues are recognized on the basis of the following principles:
i. Sales of goods - retail. The Group operates in the retail channel through its DOS network. Revenues arerecognised when the goods are delivered to customers. Sales are usually collected in the form of cash or throughcredit cards.
ii. Sales of goods - wholesale. The Group distributes products on the wholesale market. These revenues arerecognised when the goods are shipped and considering the estimated effects of returns at the end of the year.
64 Notes to the Consolidated Financial Statements
Group2014 Annual Report
iii. Provision of services. This income is recognised in proportion to the percentage of completion for the serv-ice provided on the reference date.
iv. Royalties. These are recognised on the financial statements on accrual basis.
3.20 Financial income and expenses. These include all financial items recognized on the profit and loss ac-count for the period, including interest expenses accrued on financial payables calculated by using the effective in-terest method (mainly current account overdrafts, medium- long term financing), foreign exchange gains and loss-es, gains and losses on derivative financial instruments (according to the previously defined accounting principles),received dividends, the portion of interest expenses deriving from accounting treatment of assets held under fi-nance leasing (IAS 17) and employee reserves (IAS 19).Interest income and expenses are recognized on the profit and loss account for the period in which they are re-alized/incurred, with the exception of capitalized expenses (IAS 23).Dividend income contributes to the result for the period in which the Group accrues the right to receive the pay-ment.
3.21 Income taxes. The income taxes for the period include determination both of current taxes and deferredtaxes. They are recognized entirely on the profit and loss account and included in the result for the period, unlessthey are generated by transactions recognized directly to shareholders’ equity during the current or another pe-riod. In this case, the relative deferred tax liabilities are also recognized under shareholders’ equity.Current taxes on taxable income for the period represent the tax burden determined by using the tax rates ineffect at the reference date, and any adjustments to the tax payables calculated during previous periods. Deferredtax liabilities refer to the temporary differences between the book values of assets and liabilities on the balancesheets of consolidated companies and the associated values relevant for determination of taxable income.The tax liability of all temporary taxable differences, with the exception of liabilities deriving from initial recogni-tion of an asset or liability in a transaction other than a business combination that, at the time of the transaction,does not influence either the income (loss) reported on the financial statements or taxable income (tax loss).Deferred tax assets and liabilities are only offset if there is a legally enforceable right to set off the related currenttaxes and if the deferred tax assets and liabilities consist of income tax levied by the same tax authority.Deferred tax assets that derive from temporary deductible differences are recognized on the financial statementsonly to the extent that it is likely that taxable income will be realized for which the temporary deductible differ-ence can be used. No recognition is envisaged if the difference between the carrying amount and the tax base re-sults from a business combinations, or from the initial posting of an asset or liability in a transaction, other than abusiness combination.The tax benefits resulting from tax losses are recognised in the financial statements in the period when those ben-efits are accrued, if it is likely that the Group’s entity which recognised the tax loss will have sufficient taxable in-come before the right to use that benefit expires. The taxes in question (deferred tax assets and liabilities) are de-termined on the basis of a forecast of the assumed percentage weight of the taxes on the income of the fiscal yearsin which the taxes will occur, taking into account the specific nature of taxability and deductibility. The effect ofchange in tax rates is recognized on the profit and loss account of the fiscal year in which this change takes place.Tax provisions that could be generated from transfers of non-distributable profits from subsidiaries are recognisedonly when there is a real intention to transfer such profits.
3.22 Statement of cash flows. The statement of cash flows is drafted using the indirect method. The net fi-nancial flows of operating activity are determined by adjusting the result for the period of the effects deriving fromchange to net operating working capital, non-monetary items, and all the other effects connected with investmentand financing activities.Cash flows from investing and financing activities are represented net of exchange rate differences, which are rep-resented in a separate line of the statement of cash flows. Net cash and cash equivalents are made up cash andcash equivalents net of bank overdrafts.
65 Notes to the Consolidated Financial Statements
Group2014 Annual Report
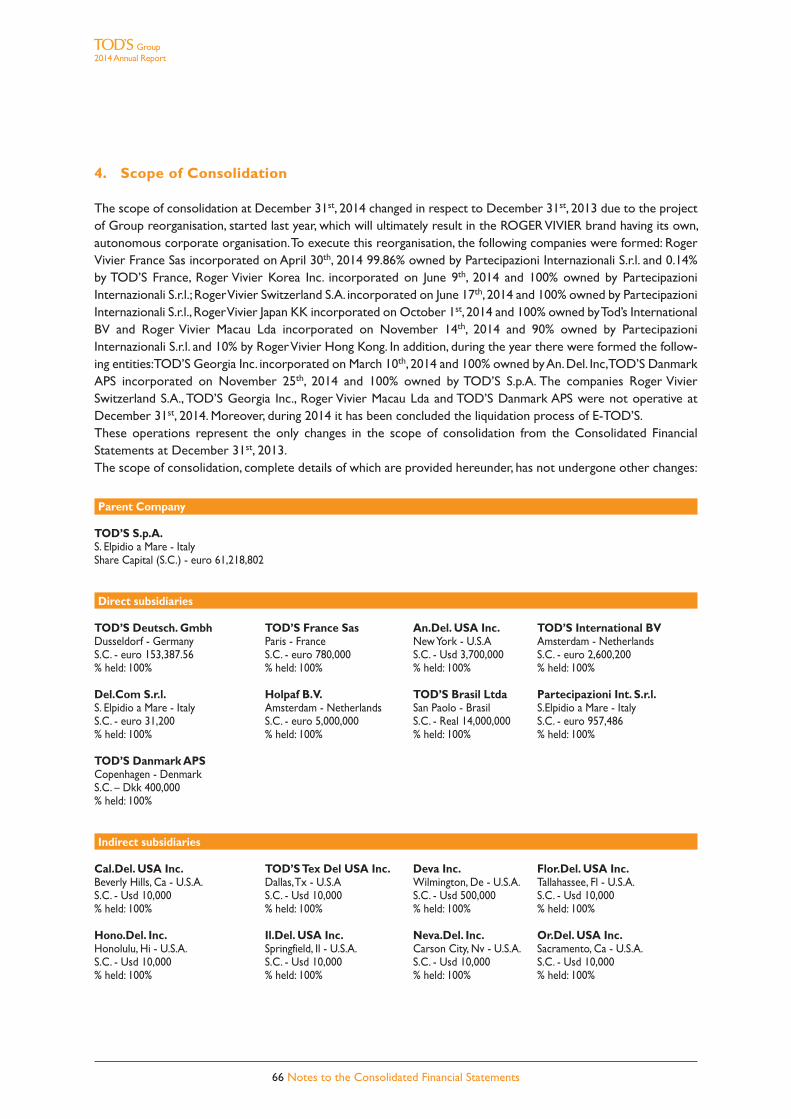
4. Scope of Consolidation
The scope of consolidation at December 31st, 2014 changed in respect to December 31st, 2013 due to the projectof Group reorganisation, started last year, which will ultimately result in the ROGER VIVIER brand having its own,autonomous corporate organisation. To execute this reorganisation, the following companies were formed: RogerVivier France Sas incorporated on April 30th, 2014 99.86% owned by Partecipazioni Internazionali S.r.l. and 0.14%by TOD’S France, Roger Vivier Korea Inc. incorporated on June 9th, 2014 and 100% owned by PartecipazioniInternazionali S.r.l.; Roger Vivier Switzerland S.A. incorporated on June 17th, 2014 and 100% owned by PartecipazioniInternazionali S.r.l., Roger Vivier Japan KK incorporated on October 1st, 2014 and 100% owned by Tod’s InternationalBV and Roger Vivier Macau Lda incorporated on November 14th, 2014 and 90% owned by PartecipazioniInternazionali S.r.l. and 10% by Roger Vivier Hong Kong. In addition, during the year there were formed the follow-ing entities: TOD’S Georgia Inc. incorporated on March 10th, 2014 and 100% owned by An. Del. Inc, TOD’S DanmarkAPS incorporated on November 25th, 2014 and 100% owned by TOD’S S.p.A. The companies Roger VivierSwitzerland S.A., TOD’S Georgia Inc., Roger Vivier Macau Lda and TOD’S Danmark APS were not operative atDecember 31st, 2014. Moreover, during 2014 it has been concluded the liquidation process of E-TOD’S.These operations represent the only changes in the scope of consolidation from the Consolidated FinancialStatements at December 31st, 2013.The scope of consolidation, complete details of which are provided hereunder, has not undergone other changes:
Parent Company
TOD’S S.p.A.S. Elpidio a Mare - ItalyShare Capital (S.C.) - euro 61,218,802
Direct subsidiaries
TOD’S Deutsch. Gmbh TOD’S France Sas An.Del. USA Inc. TOD’S International BVDusseldorf - Germany Paris - France New York - U.S.A Amsterdam - NetherlandsS.C. - euro 153,387.56 S.C. - euro 780,000 S.C. - Usd 3,700,000 S.C. - euro 2,600,200% held: 100% % held: 100% % held: 100% % held: 100%
Del.Com S.r.l. Holpaf B.V. TOD’S Brasil Ltda Partecipazioni Int. S.r.l.S. Elpidio a Mare - Italy Amsterdam - Netherlands San Paolo - Brasil S.Elpidio a Mare - ItalyS.C. - euro 31,200 S.C. - euro 5,000,000 S.C. - Real 14,000,000 S.C. - euro 957,486% held: 100% % held: 100% % held: 100% % held: 100%
TOD’S Danmark APSCopenhagen - DenmarkS.C. – Dkk 400,000% held: 100%
Indirect subsidiaries
Cal.Del. USA Inc. TOD’S Tex Del USA Inc. Deva Inc. Flor.Del. USA Inc.Beverly Hills, Ca - U.S.A. Dallas, Tx - U.S.A Wilmington, De - U.S.A. Tallahassee, Fl - U.S.A.S.C. - Usd 10,000 S.C. - Usd 10,000 S.C. - Usd 500,000 S.C. - Usd 10,000% held: 100% % held: 100% % held: 100% % held: 100%
Hono.Del. Inc. Il.Del. USA Inc. Neva.Del. Inc. Or.Del. USA Inc. Honolulu, Hi - U.S.A. Springfield, Il - U.S.A. Carson City, Nv - U.S.A. Sacramento, Ca - U.S.A.S.C. - Usd 10,000 S.C. - Usd 10,000 S.C. - Usd 10,000 S.C. - Usd 10,000% held: 100% % held: 100% % held: 100% % held: 100%
66 Notes to the Consolidated Financial Statements
Group2014 Annual Report

Indirect subsidiaries (continue)
Gen.Del SA Sandel SA TOD’S Belgique S.p.r.l. Roger Vivier UK LtdGeneva - Switzerland San Marino Bruxelles - Belgium London – Great BritainS.C. - Chf 200,000 S.C. - euro 258,000 S.C. - euro 300,000 S.C. – Gbp 150,000% held: 100% % held: 100% % held: 100% % held: 100%
TOD’S Espana SL TOD’S Hong Kong Ltd TOD’S Japan KK Alban.Del Sh.p.k.Madrid - Spain Hong Kong Tokyo - Japan Tirana - AlbaniaS.C. - euro 468,539.77 S.C. - Usd 16,550,000 S.C. - Jpy 100,000,000 S.C. - euro 720,000% held: 100% % held: 100% % held: 100% % held: 100%
TOD’S Singapore Pte Ltd Un.Del Kft TOD’S UK Ltd Webcover LtdSingapore Tata - Hungary London - Great Britain London - Great BritainS.C. - Sgd 300,000 S.C. - Huf 42,900,000 S.C. - Gbp 350,000.00 S.C.- Gbp 2% held: 100% % held: 100% % held: 100% % held: 50%
TOD’S Luxembourg SA TOD’S Korea Inc. TOD’S Macao Ltd TOD’S (Shanghai) Tr. Co.Luxembourg Seoul - Korea Macao Shanghai - ChinaS.C. - euro 31,000.00 S.C. - Won 1,600,000,000 S.C. - Mop 20,000,000 S.C. - Usd 16,000,000% held: 50% % held: 100% % held: 100% % held: 100%
TOD’S India Retail Pte Ltd Re.Se.Del. S.r.l. Del.Pav. S.r.l. Filangieri 29 S.r.l.Mumbai - India S. Elpidio a Mare - Italy S. Elpidio a Mare - Italy Napoli - ItalyS.C. - Inr 193,900,000 S.C. - euro 25,000.00 S.C. - euro 50,000 S.C. - euro 100,000% held: 51% % held: 100% % held: 50% % held: 50%
Roger Vivier Hong Roger Vivier Sing. Roger Vivier (Shan.) Roger Vivier SwitzerlandKong Ltd PTE Ltd Tr.Co. Lugano – SwitzerlandHong Kong Singapore Shanghai - China S.C. – Chf 1,500,000S.C. - Hkd 1,000,000 S.C. - Sgd 200,000 S.C. - Rmb 75,000,000 % held: 100%% held: 100% % held: 100% % held: 100%
TOD’S Georgia Inc. Roger Vivier France Sas Roger Vivier Korea Inc. Roger Vivier Japan KKNorcross, GA – USA Paris – France Seoul – Korea Tokyo – JapanS.C. – Usd 10,000 S.C. – euro 3,507,500 S.C. – Won 1,200,000,000 S.C. – Jpy 10,000,000% held: 100% % held: 100% % held: 100% % held: 100%
Roger Vivier Macao LdaMacaoS.C. – Mop 500,000 % held: 100%
It is assumed that the Group controls those companies in which it does not own more than 50% of the capital,and thus disposes of the same percentage of voting power at the Shareholders’ Meeting, where the Group is ex-posed, or has rights, to variable returns from its involvement with the investee and has the ability to affect thosereturns through its power over the investee, as defined by IFRS 10 – Consolidated Financial Statements.
5. Segment reporting
The search for higher levels of operating efficiency has identified as key element for maximising profitability viathe sharing of a significant portion of service activities (first and foremost production), both at the central and pe-ripheral levels; on the contrary, segmentation of the business appears uneconomical, under current circumstances.At the operating level, the Group’s organisation is based on an articulated matrix structure according to the dif-ferent functions/activities in the value chain, alternatively according to brand, product, channel and geographicalarea. The overall organisation envisages a unified strategic vision of the business.This type of organisation is reflected in the ways in which management monitors and strategically focuses theGroup’s activities.In order to have a more detailed examination, the Report of the Board of Directors, to which reference is made,
67 Notes to the Consolidated Financial Statements
Group2014 Annual Report
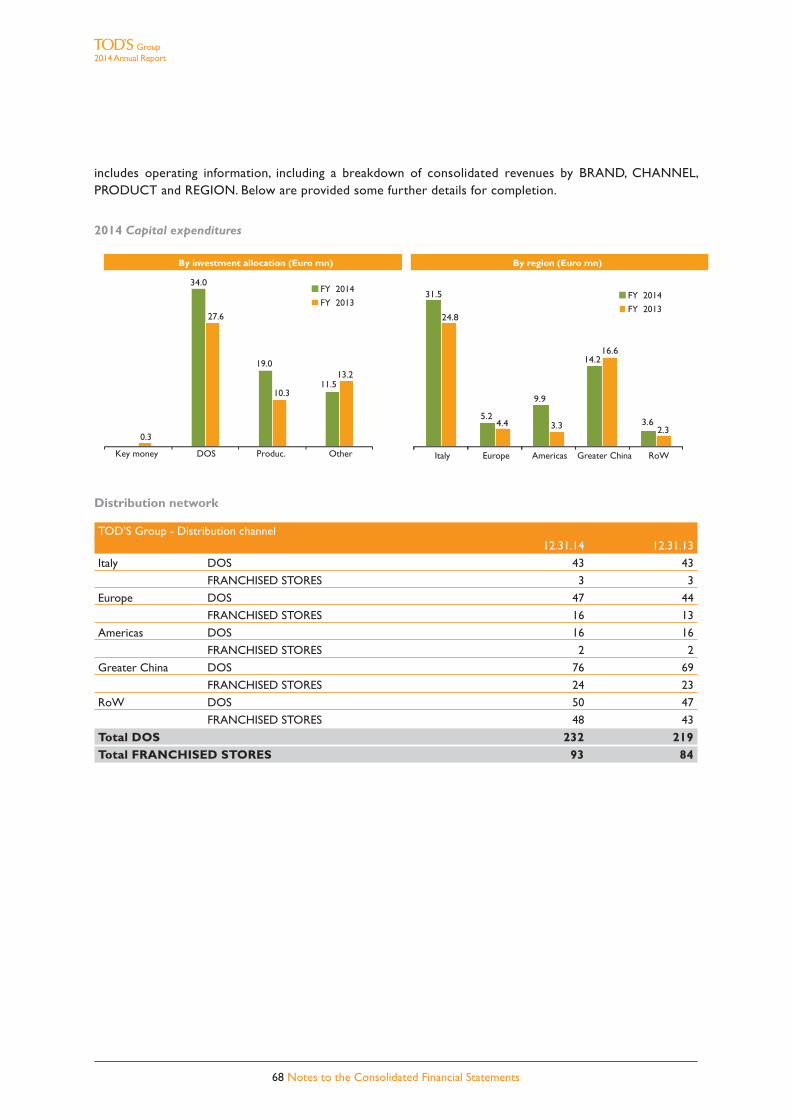
includes operating information, including a breakdown of consolidated revenues by BRAND, CHANNEL,PRODUCT and REGION. Below are provided some further details for completion.
2014 Capital expenditures
Distribution network
TOD’S Group - Distribution channel12.31.14 12.31.13
Italy DOS 43 43
FRANCHISED STORES 3 3
Europe DOS 47 44
FRANCHISED STORES 16 13
Americas DOS 16 16
FRANCHISED STORES 2 2
Greater China DOS 76 69
FRANCHISED STORES 24 23
RoW DOS 50 47
FRANCHISED STORES 48 43
Total DOS 232 219Total FRANCHISED STORES 93 84
68 Notes to the Consolidated Financial Statements
Group2014 Annual Report
By investment allocation (Euro mn) By region (Euro mn)
FY 2014
FY 2013FY 2014
FY 2013
34.0
19.0
11.5
27.6
10.3
13.2
Key money DOS Produc. Other Italy Europe Americas Greater China RoW
31.5
24.8
5.24.4
9.9
3.3
14.216.6
3.62.3
0.3
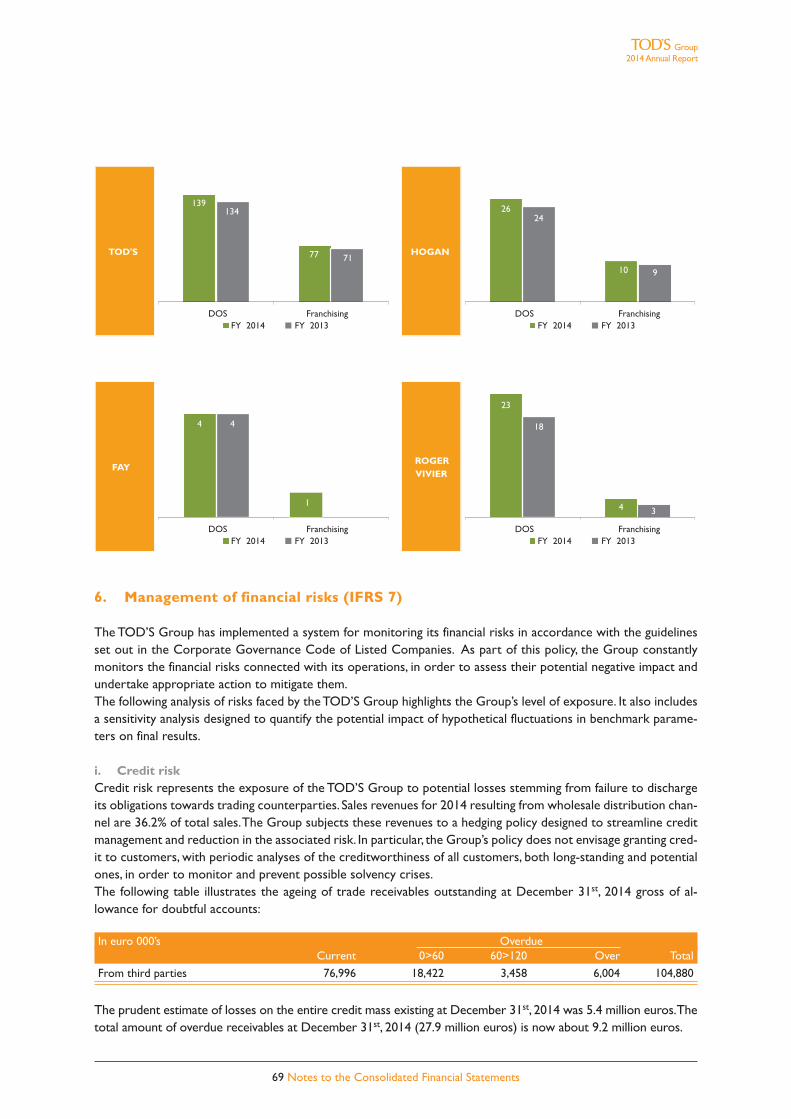
69 Notes to the Consolidated Financial Statements
Group2014 Annual Report
6. Management of financial risks (IFRS 7)
The TOD’S Group has implemented a system for monitoring its financial risks in accordance with the guidelinesset out in the Corporate Governance Code of Listed Companies. As part of this policy, the Group constantlymonitors the financial risks connected with its operations, in order to assess their potential negative impact andundertake appropriate action to mitigate them.The following analysis of risks faced by the TOD’S Group highlights the Group’s level of exposure. It also includesa sensitivity analysis designed to quantify the potential impact of hypothetical fluctuations in benchmark parame-ters on final results.
i. Credit riskCredit risk represents the exposure of the TOD’S Group to potential losses stemming from failure to dischargeits obligations towards trading counterparties. Sales revenues for 2014 resulting from wholesale distribution chan-nel are 36.2% of total sales. The Group subjects these revenues to a hedging policy designed to streamline creditmanagement and reduction in the associated risk. In particular, the Group’s policy does not envisage granting cred-it to customers, with periodic analyses of the creditworthiness of all customers, both long-standing and potentialones, in order to monitor and prevent possible solvency crises.The following table illustrates the ageing of trade receivables outstanding at December 31st, 2014 gross of al-lowance for doubtful accounts:
In euro 000’s OverdueCurrent 0>60 60>120 Over Total
From third parties 76,996 18,422 3,458 6,004 104,880
The prudent estimate of losses on the entire credit mass existing at December 31st, 2014 was 5.4 million euros. Thetotal amount of overdue receivables at December 31st, 2014 (27.9 million euros) is now about 9.2 million euros.
3
FAYROGER VIVIER
TOD'S HOGAN
139
77
134
71
DOS FranchisingFY 2014 FY 2013
26
10
24
9
DOS FranchisingFY 2014 FY 2013
4 4
2
DOS FranchisingFY 2014 FY 2013
23
4
18
DOS FranchisingFY 2014 FY 2013
1

70 Notes to the Consolidated Financial Statements
Group2014 Annual Report
ii. Liquidity riskLiquidity risk is the risk that the Group will not dispose of the funds necessary to meet its short- term commit-ments and financial requirements. The principal factors that determine the Group’s degree of liquidity are the re-sources generated or used by operating and investment activities and, on the other hand, the due dates or renewaldates of its payables or the liquidity of its financial investments and market conditions. In the specific case, theGroup’s profitability, and its current and historic capacity to generate cash and its relatively insignificant exposureto the banking system are factors that lead to the conclusion that it faces no liquidity risk over the foreseeable fu-ture. Also at December 31st, 2014 financial resources were far higher than the Group’s debt exposure: net finan-cial position was 130 million euros, comprised by 165.9 million euros in assets and 35.9 million euros in liabilities,including 20.3 million euros in medium-long term liabilities. The Group’s policy for financial assets is to keep all ofits available liquidity invested in demand bank deposits without recourse to financial instruments, even on the mon-ey market, and dividing the deposits amongst a reasonable number of bank counterparties, prudently selectingthem according to the return on deposits and their solidity. Finally, it should be noted that on July 23rd, 2014 theparent company TOD’S S.p.A. entered into a loan agreement with two leading banks, which was aimed at settingaside funds for a maximum amount of 400 million euros intended to support the Group’s future development(Note 21). At December 31st, 2014 no amount had yet been paid out.
iii. Market riskIFRS 7 includes in this category all risks that are directly or indirectly connected with the fluctuation in prices onphysical and financial markets to which the company is exposed:– exchange rate risk;– interest rate risk;– commodity risk, connected with the volatility of prices for the raw materials used in the production process.The TOD’S Group is exposed to exchange rate and interest rate risk, since there is no physical market subject toactual fluctuations in the purchase prices for raw materials used in the production process.The following paragraphs analyse the individual risks, using sensitivity analysis as necessary to highlight the poten-tial risk on final results stemming from hypothetical fluctuations in benchmark parameters. As envisaged by IFRS7, these analyses are based on simplified scenarios applied to the final results for the periods referred to. By theirvery nature, they cannot be considered indicators of the actual effects of future changes in benchmark parame-ters of a different asset and liability structure and financial position different market conditions, nor can they re-flect the interrelations and complexity of the reference markets.
Exchange rate risk. Due to its commercial operations, the Group is exposed to fluctuations in the exchangerates for currencies in which some of its commercial transactions are denominated (particularly USD, GBP, CHFand Far East countries), against a cost structure that is concentrated principally in the eurozone. The TOD’S Grouprealises greater revenues than costs in all these currencies; therefore, changes in the exchange rate between theeuro and the aforementioned currencies can impact the Group’s results.Moreover, due to the geographical composition of the Group structure, which is formed by subsidiaries with dif-ferent currencies, the Group is exposed to exchange rate risk related to intercompany financial flows (mainly div-idends, loans, transactions on share capital).Finally, the Group is exposed to “translation risk”. This risk stems from the fact that the assets and liabilities ofconsolidated companies whose functional currency is different from the euro can have different countervalues ineuros according to changes in foreign exchange rates. The measured amount of this risk is recognised in the “trans-lation reserve” in equity.The Group monitors the changes in the exposure. No hedges of this risk existed at the reporting date. Governanceof individual foreign currency operations by the Group’s subsidiaries is highly simplified by the fact that they arewholly owned by the parent company.The Group’s risk management policy, in connection to the exchange rate risk on commercial transactions, aims toensure that the average countervalue in euros of receipts on transactions denominated in foreign currencies foreach collection (Spring/Summer and Fall/Winter) is equal to or greater than what would be obtained by applyingthe pre-set target exchange rates. The Group pursues these aims by entering into forward contracts for each in-

71 Notes to the Consolidated Financial Statements
Group2014 Annual Report
dividual currency to hedge a specific percentage of the expected revenue (and cost) volumes in the individual cur-rencies other than the functional currency. These positions are not hedged for speculative or trading purposes,consistently with the strategic policies adopted for prudent management of cash flows. Consequently, the Groupmight forego opportunities to realise certain gains, but it avoids running the risks of speculation.The Group defines its exchange risk a priori according to the budget for the reference period and then graduallyhedges this risk upon acquisition of orders, in the amount according to which they correspond to budget forecasts.The process of hedging exchange rate risk inside the Group is broken down into a series of activities that can begrouped into the following distinct phases.The process of hedging exchange rate risk inside the Group is broken down into a series of activities that can begrouped into the following distinct phases:• definition of operating limits;• identification and quantification of exposure;• implementation of hedges;• monitoring of positions and alert procedures.
In connection with the exchange rate risk on financial intercompany transactions, the Group monitors the riskunderlying outstanding liabilities (loans) and forecast liabilities (dividends and capital increases), in view of guaran-teeing that no material operating and financial impact for the entities involved results from these transactions inrelation to fluctuations in exchange rates. These goals are pursued by the Group through monitoring the foreignexchange rate trends related to outstanding or expected capital transactions and entering into forward contractsif they will have material contingent effects. These forward contracts are made to hedge the individual transac-tions, and not for speculation or trading. This is consistent with the strategic policies focused on prudent man-agement of cash flows. The breakdown of forward currency contracts (for sale and purchase) made by the Groupis illustrated in Note 15.The balance sheet accounts denominated in foreign currency were identified for the sensitivity analysis. In orderto determine the potential impact on final results, the potential effects of fluctuations in the exchange rate for theeuro against the principal currencies to which the Group is exposed were analysed. The following table illustratesthe sensitivity to reasonably likely changes in exchange rates on pre-tax profit (due to changes in the value of cur-rent assets and liabilities denominated in foreign currency for expected transactions) and Group equity (due tochanges in the fair value of foreign exchange risk hedge instruments on forecast transactions):
euro Impact on pre-tax profit 5% Impact on pre-tax profit 5% writedown of the foreign currency revaluation of the foreign currency
Currency Country FY 2014 FY 2013 FY 2014 FY 2013
CAD Canada (48,030.8) (38,319.9) 53,086.7 42,353.6
CHF Switzerland 2,245.4 8,224.7 (2,481.8) (9,090.4)
GBP UK 3,499.3 171.6 (3,867.6) (189.6)
HKD Hong Kong 234,718.0 (158,560.7) (259,425.2) 175,251.3
JPY Japan (118,692.6) (94,597.8) 131,186.5 104,555.5
KRW South Korea 69.9 (14.1) (77.2) 15.6
RMB China (1,223,525.8) 27,244.9 1,352,317.9 (30,112.7)
SGD Singapore (11,807.0) (12,769.1) 13,049.8 14,113.2
USD USA 51,689.1 150,540.5 (57,130.0) (166,386.9)
EUR Europe (78,172.5) (60,880.3) 86,401.2 67,288.8
Other n.a. (1,679.7) (23,858.7) 1,856.5 26,370.1
Total (1,189,686.7) (202,818.9) 1,314,916.9 224,168.5
euro 000’s Revaluation/Writedown Impact on Impact onforeign currency pre-tax profit Shareholders' equity
5% 1,314.9 (4,890.3)FY 2014
-5% (1,189.7) 5,405.1
72 Notes to the Consolidated Financial Statements
Group2014 Annual Report
The impact on equity showed in the previous table is related to the cash flow hedge reserve gross of tax effects.The analysis did not include assets, liabilities and future commercial flows that were hedged, since fluctuations inexchange rates impact income in an amount equal to what is recognised in the fair value of adopted hedging in-struments.
Interest rate risk. The TOD’S Group is exposed to interest rate fluctuations, limited to its variable-rate debt in-struments. Interest rate risk is managed in conformity to long-established practice with the aim of cutting downthe risk of interest rate volatility, at the same time pursuing the goal of reducing the financial costs involved to aminimum. As the amounts concerned are not significant (Note 21), there were no hedges of interest rates on ex-isting financial liabilities as of December 31st, 2014.At December 31st, 2014 there were, however, two derivative contracts in being (interest rate swaps - IRSs), whichwere entered into on July 23rd, 2014, to hedge the risk of possible changes in the interest rates on the financingtransaction that has already been mentioned, for a maximum amount of 400 million euros (Note 21). These de-rivatives protect the Group from the risk of a generalised rise in interest rates, swapping the variable rate on theloan (3-month EURIBOR + 110 basis points) for a contractually fixed rate (0.748% quarterly settled). Consideringthat no amounts had yet been paid out as at December 31st, 2014 in relation to the loan underlying the above-mentioned hedging transactions, it should be noted that the effects arising from the IRSs in 2014 have been rec-ognized under an equity reserve for cash flow hedge (Note 15).The sensitivity analysis carried out on interest rates has shown in addition that a hypothetically unfavourablechange of 10% in short-term interest rates applicable to the adjustable rate financial liabilities existing at December31st, 2014 would have a net pre-tax impact of about 16 thousand euros in additional expenses (FY 2013: 31 thou-sand euros).Finally, the financial liabilities (Notes A1 and A2) issued by the subsidiary Holpaf B.V. (Note 21) are subject to afixed rate of 2.94% and 3.239%, respectively.
iv. Categories of measurement at fair valueIn accordance with IFRS 7, the financial instruments carried at fair value have been classified according to a hier-archy of levels that reflects the materiality of the inputs used to estimate their fair value. The following levels havebeen defined:Level 1 – quoted prices obtained on an active market for the measured assets or liabilities;Level 2 – inputs other than the quoted prices indicated hereinabove, which are observable either directly (prices)or indirectly (derived from prices) on the market;Level 3 – inputs that are not based on observable market data.The fair value of derivative financial instruments existing at December 31st, 2014 (Note 15) has been classified asLevel 2. There are no other financial instruments measured at fair value. It is reasonable to deem that the fair val-ue of financial assets and liabilities measured at amortised cost, given their nature, does not differ significantly fromtheir carrying amounts.
7. Intangible fixed assets
7.1 Intangible assets with undefined useful life. Assets with indefinite useful life amount to 149,466thousand euros, and are constituted as follows:
euro 000’s12.31.14 12.31.13
Trademarks 137,235 137,235
Goodwill  12,232 12,232
Total 149,466 149,466
73 Notes to the Consolidated Financial Statements
Group2014 Annual Report
Trademarks. This item includes the values of the Group three own brands (TOD’S, HOGAN and FAY).
euro 000’s12.31.14 12.31.13
TOD’S 3,741 3,741
HOGAN 80,309 80,309
FAY 53,185 53,185
Total 137,235 137,235
Goodwill.They are related to acquisitions of controlled companies and they have been determined in accordancewith the acquisition method (IFRS 3).
7.2 Key money and Other intangible assets with definite useful lifeThe following table details the movements of these assets in the current and previous fiscal year.
euro 000’s Other Intangible assetsKey Other Other
money trademarks Software assets Total
Balance as of 01.01.13 20,557 3,532 7,622 17,263 28,417Translation differences (4) (8) (8)
Increases 300 1,184 4,644 690 6,518
Decreases (17) (17)
Impairment losses (Note 9)
Other changes
Amortization for the period (2,434) (601) (3,257) (2,596) (6,455)
Balance as of 12.31.13 18,419 4,115 9,009 15,332 28,455Translation differences 8 15 33 48
Increases 400 1,056 3,027 1,609 5,691
Decreases (136) (5) (141)
Impairment losses (Note 9)
Other changes
Amortization for the period (2,150) (689) (3,528) (2,425) (6,642)
Balance as of 12.31.14 16,676 4,346 8,522 14,543 27,411
Key money, represent the amounts paid for this purpose by the Group to take over certain leases of commercialspaces where some DOS operate.The increase of Other trademarks relates to long-term charges with a defined useful life incurred to protect thebrands owned by the Group which are classified as assets with an undefined useful life.The increase of Software mainly relates to resources designated by the parent company for the development ofIT systems.The increase recorded in Other Assets is mainly due to long-term investments made for the network of cornersand franchise stores.The item Other assets includes 11,209 thousand euros for the value of the intangible asset recognised in relationto the agreement made with the Ministry of Cultural Affairs (“Ministero per i Beni e le Attivita Culturali”) and theSpecial Archaeological Service of Rome (“Soprintendenza speciale per i beni archeologici di Roma”), with whichthe parent company has undertaken to finance the entire cost of restoration work on the Coliseum. The assetwas formerly recognised in the balance sheet for an amount equal to the discounted value of the financial outlaysthat are reasonably foreseeable on the basis of the multi-year plan for restoration work available at the momentof the initial recognition, and amortised over the useful life determined according to the provisions of the agree-ment. The accrual for amortisation allocable to the financial year is about 1.6 million euros.

74 Notes to the Consolidated Financial Statements
Group2014 Annual Report
8. Tangible fixed assets
At December 31st, 2014 the net residual value of Group’s tangible fixed assets was a 217.8 million euros (FY 2013:192.3 million euros).
euro 000’s Land Plantand and Leasehold
building machin. Equip. improv. Others Total
Balance as of 01.01.13 104,334 8,222 15,060 35,428 31,678 194,722Translation differences (13,449) 4 (29) (674) (610) (14,758)
Increases 906 1,612 8,214 14,067 19,754 44,554
Decreases (13) (601) (296) (863) (1,773)
Impairment losses
Other changes
Amortization for the period (1,567) (1,353) (6,642) (11,065) (9,765) (30,392)
Balance as of 12.31.13 90,225 8,472 16,002 37,460 40,194 192,353Translation differences (169) (2) 117 1,677 1,840 3,462
Increases 6,714 1,546 8,093 16,263 25,750 58,366
Decreases (15) (249) (437) (528) (1,230)
Impairment losses (642) (704) (993) (2,339)
Other changes
Amortization for the period (1,659) (1,452) (7,239) (10,897) (11,541) (32,788)
Balance as of 12.31.14 95,111 8,550 16,082 43,361 54,722 217,826
Tand and Buildings mainly include the real estate assets consisting of the Parent Company’s operating headquar-ters and the building located in Omotesando in Tokyo, the location of the subsidiary TOD’S Japan’s administrativeoffices and of the most important TOD’S flagship store in Japan. The increase in the value of Land and Buildings ismainly due to the acquisition of a new industrial building near the Group’s headquarters under two finance leaseagreements.The increase in Equipment is due to the investments, made mainly by the parent company, in the framework of thenormal processes of modernisation of industrial facilities and equipment (mainly lasts and moulds). The increase inLeasehold Improvements and Others mainly consist of the costs incurred for fitting out and renovating directly op-erated stores, of which the enlargement and renovation of the TOD’S flagship store in Madison Avenue in New Yorkis the most important. The increase in Others also includes a cost of 7.6 million euros incurred for the current con-struction of a new production plant within the area in which the Group headquarters is located. Depreciation fromcontinuing use of the fixed assets during the year amount to 32.8 million euros, while write-downs recognizedthrough profit and loss amount to 2.3 million euros, of which 1.9 million euros are referred to assets that were dis-posed of in the year and 0.4 million euros are referred to write-downs for impairment (Note 9).
9. Impairment losses
The recoverability of the residual value of intangible assets with an indefinite useful life was determined to ensurethat assets with a value higher than the recoverable value were not recognised on the financial statements, whichrefers to their “value in use”. The criterion used to determine “value in use” is based on the provisions of IAS 36,and is based on the current value of expected future cash flows (Discounted cash-flow analysis - DCF), which ispresumed to derive from the continual use and disposal of an asset at the end of its useful life, discounted at a netdiscounting rate that reflects current market rates for borrowing money and the specific risk associated with theindividual cash generating unit.In application of the method prescribed by IAS 36, the TOD’S Group has identified the cash generating units (CGU)that represent the smallest, identifiable group of assets that can generate cash flows and which are fully inde-
75 Notes to the Consolidated Financial Statements
Group2014 Annual Report
pendent on the consolidated financial statements. The organisational structure and type of business was consid-ered in determining the CGU. The TOD’S Group subsequently identified only one CGU, at a Group level, and ithas been tested the net invested capital of the Group. This approach is based on the unified view of the business(also see Note 5 Segment reporting), organised as a matrix structure, which may be alternatively broken down bybrand, product, channel and region, according to the different functions/activities on the value chain, where thetransverse nature of many central and peripheral service activities (especially the supply chain, sales and distribu-tion, finance and administration, legal, human resources and information technology), ensure maximisation of thelevels of profitability. The recoverability of the amounts recognised on the financial statements was verified by com-paring the net book value of the net invested capital with the recoverable value (value in use). The value in use isrepresented by the discounted value of future cash flows that are expected from continuous use of the assets as-sociated with the cash generating unit and by the terminal value attributable to them.The discounted cash flow analysis was carried out by using the FY 2015 budget as its basis. That budget was pre-pared and approved by the Board of Directors of the parent company TOD’S S.p.A. on the assumption that theGroup would be a going concern for the foreseeable future. The Board of Directors first assessed the methodsand assumptions used in developing the model. In particular:i. Medium-term budget data are forecast over a time horizon of four additional years using a 5% mean sales growthrate, a constant EBITDA margin and a constant 33% tax rate. Assumptions regarding the medium-term sales growthrate are made on the basis of reasonable growth estimates which also take into account the growth trends in theluxury sector as a whole in the foreseeable future;ii. The terminal value was determined as perpetuity, using, for future forecasts, a prudential long term growth ratein line with the macro-economics estimates performed by the International Monetary Fund.iii. To determine the “value in use,” a WACC, net of taxes, of 8.59% was used (the WACC rate used at December31st, 2013 was 9.25%), determined by referring to the discounting rates used by a series of international analystsin financial reports on the Group, including a specific beta attributable to it.An expected overall cash flow figure far higher than the total amount of net invested capital (cover) emerged fromthe analyses of the recoverability of the Group’s intangible assets with an indefinite useful life (of which 137.2 mil-lion euros are made up of the owned trademarks and 12.2 million euros are made up of goodwill from businesscombination).The sensitivity analysis performed on the impairment test in accordance with IAS 36, in order to reveal the effectsproduced on the “value in use” by a reasonable change in the basic assumptions (WACC, growth rates, EBITDAmargin) and determination of the terminal value (disposal value of Group assets), did not reveal an appreciable im-pact on determination of the “value in use” and cover. Given the significant value assumed by the cover, it wouldbe necessary to make unrealistic base assumptions to render the “value in use” equal to the book value of Groupassets (the breakeven hypothesis).Furthermore, in accordance with IAS 36, the recoverable value of the individual brands has been estimated by ap-plying the royalties method and using the same assumptions as those specified above in terms of growth rates, taxrate, WACC and terminal value. The analysis conducted did not show up any evidence of impairment, as the re-coverable value of the brands is higher than their net carrying amount.Finally, the Group conducted an analysis to assess the recoverability of the tangible and intangible fixed assets at-tributable to the individual directly operated stores (DOS). Impairment indicators emerged from this analysis forsome DOS whose assets were therefore written down by a total of 0.4 million euros, as the recovery of their val-ue by means of future cash flows is not reasonably foreseeable as matters stand.
10. Investment property
This account refers to a property owned by the Group as an investment property and leased to third parties.
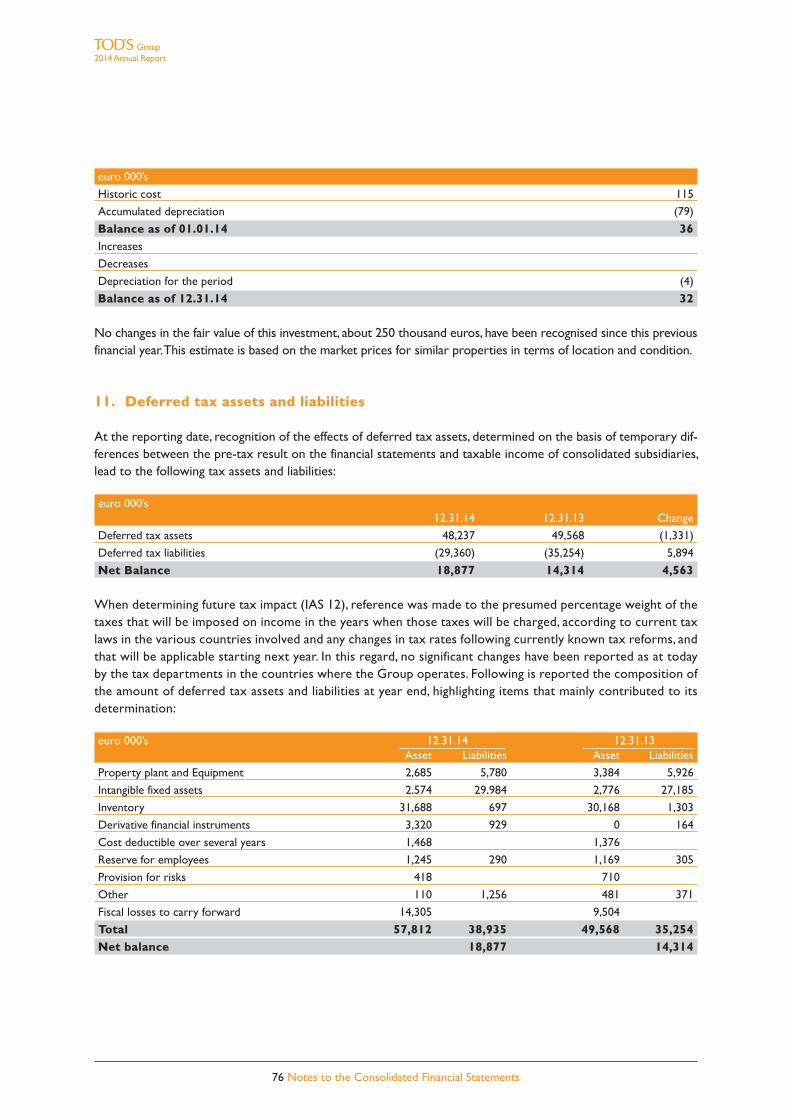
76 Notes to the Consolidated Financial Statements
Group2014 Annual Report
euro 000’s
Historic cost 115
Accumulated depreciation (79)
Balance as of 01.01.14 36Increases
Decreases
Depreciation for the period (4)
Balance as of 12.31.14 32
No changes in the fair value of this investment, about 250 thousand euros, have been recognised since this previousfinancial year. This estimate is based on the market prices for similar properties in terms of location and condition.
11. Deferred tax assets and liabilities
At the reporting date, recognition of the effects of deferred tax assets, determined on the basis of temporary dif-ferences between the pre-tax result on the financial statements and taxable income of consolidated subsidiaries,lead to the following tax assets and liabilities:
euro 000’s12.31.14 12.31.13 Change
Deferred tax assets 48,237 49,568 (1,331)
Deferred tax liabilities (29,360) (35,254) 5,894
Net Balance 18,877 14,314 4,563
When determining future tax impact (IAS 12), reference was made to the presumed percentage weight of thetaxes that will be imposed on income in the years when those taxes will be charged, according to current taxlaws in the various countries involved and any changes in tax rates following currently known tax reforms, andthat will be applicable starting next year. In this regard, no significant changes have been reported as at todayby the tax departments in the countries where the Group operates. Following is reported the composition ofthe amount of deferred tax assets and liabilities at year end, highlighting items that mainly contributed to itsdetermination:
euro 000’s 12.31.14 12.31.13Asset Liabilities Asset Liabilities
Property plant and Equipment 2,685 5,780 3,384 5,926
Intangible fixed assets 2,574 29,984 2,776 27,185
Inventory 31,688 697 30,168 1,303
Derivative financial instruments 3,320 929 0 164
Cost deductible over several years 1,468 1,376
Reserve for employees 1,245 290 1,169 305
Provision for risks 418 710
Other 110 1,256 481 371
Fiscal losses to carry forward 14,305 9,504
Total 57,812 38,935 49,568 35,254 Net balance 18,877 14,314

77 Notes to the Consolidated Financial Statements
Group2014 Annual Report
Deferred tax assets, recognised by certain subsidiaries as losses that can be carried forward pursuant to local taxlaws, and not yet used by the Group at December 31st, 2014, totalled 14.3 million euros (FY 2013: 9.5 million eu-ros). The expiry of the right of use of fiscal losses will start mainly from the year 2017. New deferred tax assetsfor 5.7 million euros were recognised on the 2014 financial statements for losses that can be carried forward, whi-le, during the year, deferred tax assets for 0.5 million euros have been used on previous year fiscal losses.
12. Other non current assets
Other non-current assets mainly relate to security deposits paid to third parties by Group subsidiaries in con-nection with operating leases.
13. Inventories
They totalled 327,085 thousand euros at December 31st, 2014, and include:
euro 000’s12.31.14 12.31.13 Change
Raw materials 64,661 54,880 9,781
Semi-finished products 9,480 8,198 1,281
Finished products 271,157 238,625 32,533
Advances 1 363 (363)
Write-down (18,213) (19,718) 1,505
Total 327,085 282,348 44,737
The allowance for inventory write-downs reasonably reflects the technical and stylistic obsolescence of theGroup’s inventories at December 31st, 2014. In the course of the year the provision existing at the beginning ofthe year was used for 3.5 million euros (2.6 million euros in 2013), while the provision set aside in the year amount-ed to 1.6 million euros (5.1 million euros in 2013).
14. Trade receivables and other current assets
14.1 Trade receivables. They represent Group’s exposure in consequence of its wholesale distributionactivity.
euro 000’s12.31.14 12.31.13 Change
Trade receivables 104,880 100,267 4,613
Allowances for doubtful accounts (5,435) (5,941) 507
Net trade receivables 99,445 94,326 5,119
The allowances for doubtful accounts represent the reasonable estimate of impairment due to the specific andgeneric risk of not being able to collect the trade receivables recognised on the financial statements. The amountaccrued for FY 2014 totalled 800 thousand euros. The following schedule shows the changes during the year inthe allowances for doubtful accounts:
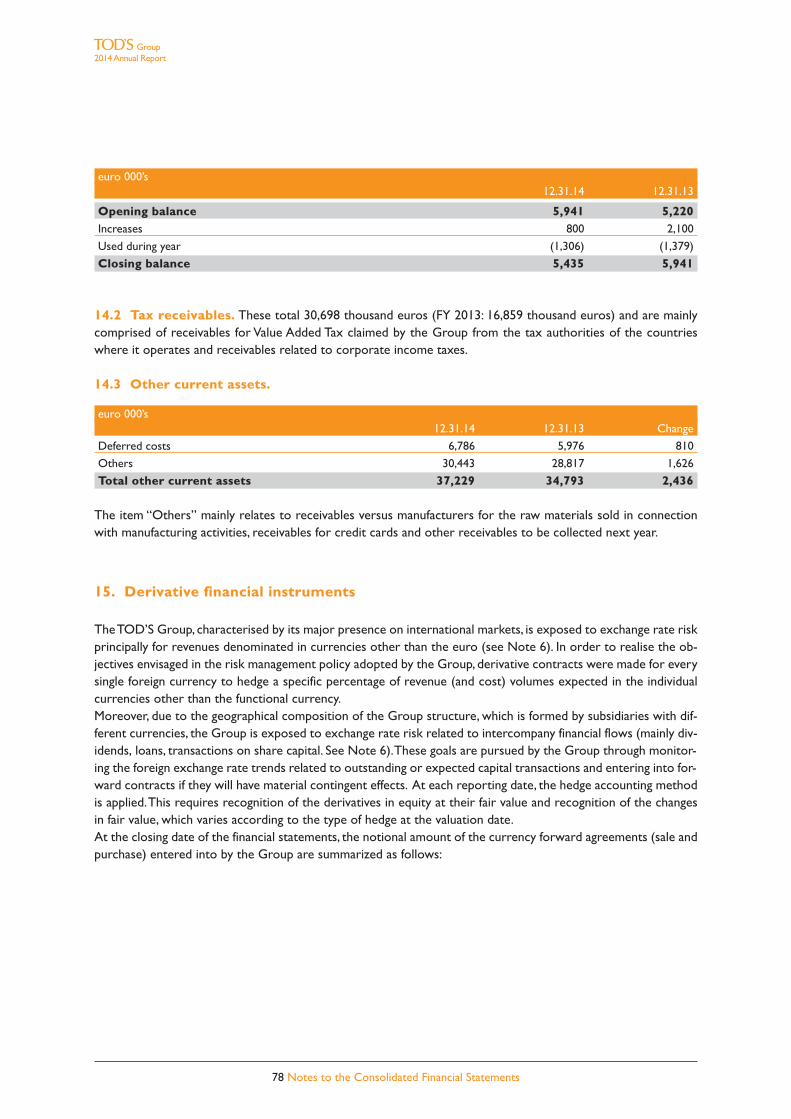
78 Notes to the Consolidated Financial Statements
Group2014 Annual Report
euro 000’s12.31.14 12.31.13
Opening balance  5,941 5,220Increases 800 2,100
Used during year (1,306) (1,379)
Closing balance  5,435 5,941
14.2 Tax receivables. These total 30,698 thousand euros (FY 2013: 16,859 thousand euros) and are mainlycomprised of receivables for Value Added Tax claimed by the Group from the tax authorities of the countrieswhere it operates and receivables related to corporate income taxes.
14.3 Other current assets.
euro 000’s12.31.14 12.31.13 Change
Deferred costs 6,786 5,976 810
Others 30,443 28,817 1,626
Total other current assets 37,229 34,793 2,436
The item “Others” mainly relates to receivables versus manufacturers for the raw materials sold in connectionwith manufacturing activities, receivables for credit cards and other receivables to be collected next year.
15. Derivative financial instruments
The TOD’S Group, characterised by its major presence on international markets, is exposed to exchange rate riskprincipally for revenues denominated in currencies other than the euro (see Note 6). In order to realise the ob-jectives envisaged in the risk management policy adopted by the Group, derivative contracts were made for everysingle foreign currency to hedge a specific percentage of revenue (and cost) volumes expected in the individualcurrencies other than the functional currency.Moreover, due to the geographical composition of the Group structure, which is formed by subsidiaries with dif-ferent currencies, the Group is exposed to exchange rate risk related to intercompany financial flows (mainly div-idends, loans, transactions on share capital. See Note 6). These goals are pursued by the Group through monitor-ing the foreign exchange rate trends related to outstanding or expected capital transactions and entering into for-ward contracts if they will have material contingent effects. At each reporting date, the hedge accounting methodis applied. This requires recognition of the derivatives in equity at their fair value and recognition of the changesin fair value, which varies according to the type of hedge at the valuation date.At the closing date of the financial statements, the notional amount of the currency forward agreements (sale andpurchase) entered into by the Group are summarized as follows:
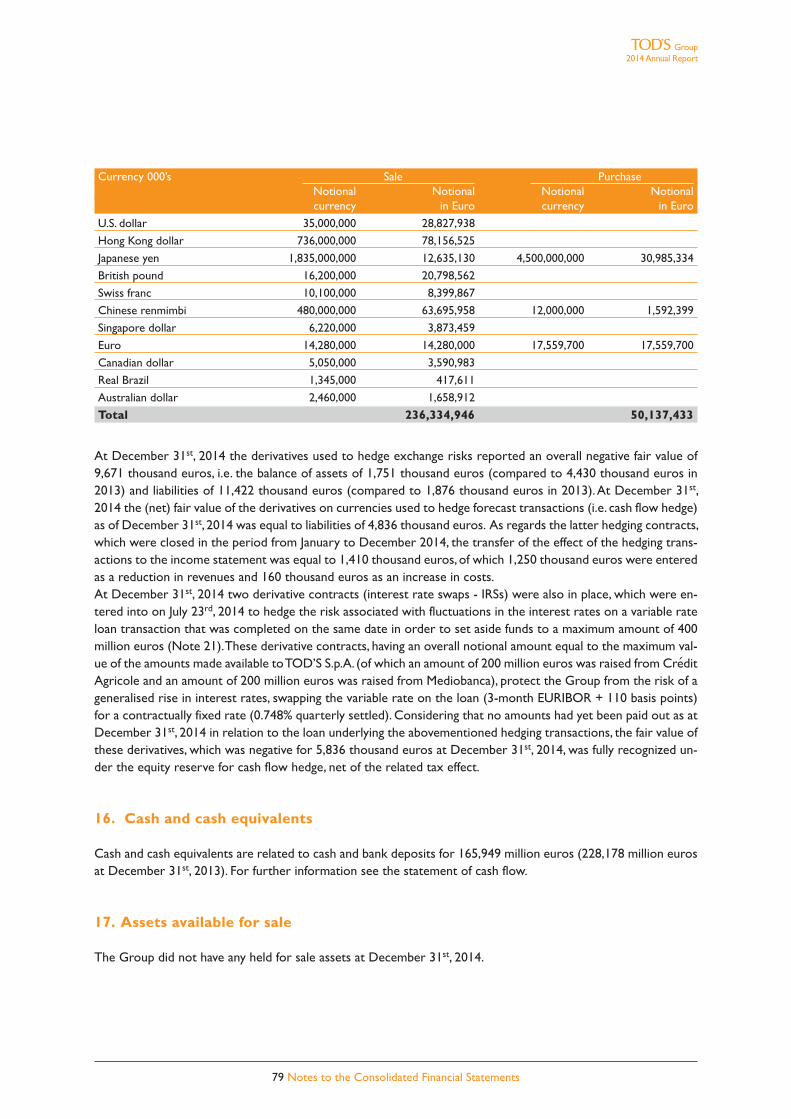
79 Notes to the Consolidated Financial Statements
Group2014 Annual Report
Currency 000’s Sale PurchaseNotional Notional Notional Notionalcurrency in Euro currency in Euro
U.S. dollar 35,000,000 28,827,938
Hong Kong dollar 736,000,000 78,156,525
Japanese yen 1,835,000,000 12,635,130 4,500,000,000 30,985,334
British pound 16,200,000 20,798,562
Swiss franc 10,100,000 8,399,867
Chinese renmimbi 480,000,000 63,695,958 12,000,000 1,592,399
Singapore dollar 6,220,000 3,873,459
Euro 14,280,000 14,280,000 17,559,700 17,559,700
Canadian dollar 5,050,000 3,590,983
Real Brazil 1,345,000 417,611
Australian dollar 2,460,000 1,658,912
Total 236,334,946 50,137,433
At December 31st, 2014 the derivatives used to hedge exchange risks reported an overall negative fair value of9,671 thousand euros, i.e. the balance of assets of 1,751 thousand euros (compared to 4,430 thousand euros in2013) and liabilities of 11,422 thousand euros (compared to 1,876 thousand euros in 2013). At December 31st,2014 the (net) fair value of the derivatives on currencies used to hedge forecast transactions (i.e. cash flow hedge)as of December 31st, 2014 was equal to liabilities of 4,836 thousand euros. As regards the latter hedging contracts,which were closed in the period from January to December 2014, the transfer of the effect of the hedging trans-actions to the income statement was equal to 1,410 thousand euros, of which 1,250 thousand euros were enteredas a reduction in revenues and 160 thousand euros as an increase in costs.At December 31st, 2014 two derivative contracts (interest rate swaps - IRSs) were also in place, which were en-tered into on July 23rd, 2014 to hedge the risk associated with fluctuations in the interest rates on a variable rateloan transaction that was completed on the same date in order to set aside funds to a maximum amount of 400million euros (Note 21). These derivative contracts, having an overall notional amount equal to the maximum val-ue of the amounts made available to TOD’S S.p.A. (of which an amount of 200 million euros was raised from CreditAgricole and an amount of 200 million euros was raised from Mediobanca), protect the Group from the risk of ageneralised rise in interest rates, swapping the variable rate on the loan (3-month EURIBOR + 110 basis points)for a contractually fixed rate (0.748% quarterly settled). Considering that no amounts had yet been paid out as atDecember 31st, 2014 in relation to the loan underlying the abovementioned hedging transactions, the fair value ofthese derivatives, which was negative for 5,836 thousand euros at December 31st, 2014, was fully recognized un-der the equity reserve for cash flow hedge, net of the related tax effect.
16. Cash and cash equivalents
Cash and cash equivalents are related to cash and bank deposits for 165,949 million euros (228,178 million eurosat December 31st, 2013). For further information see the statement of cash flow.
17. Assets available for sale
The Group did not have any held for sale assets at December 31st, 2014.
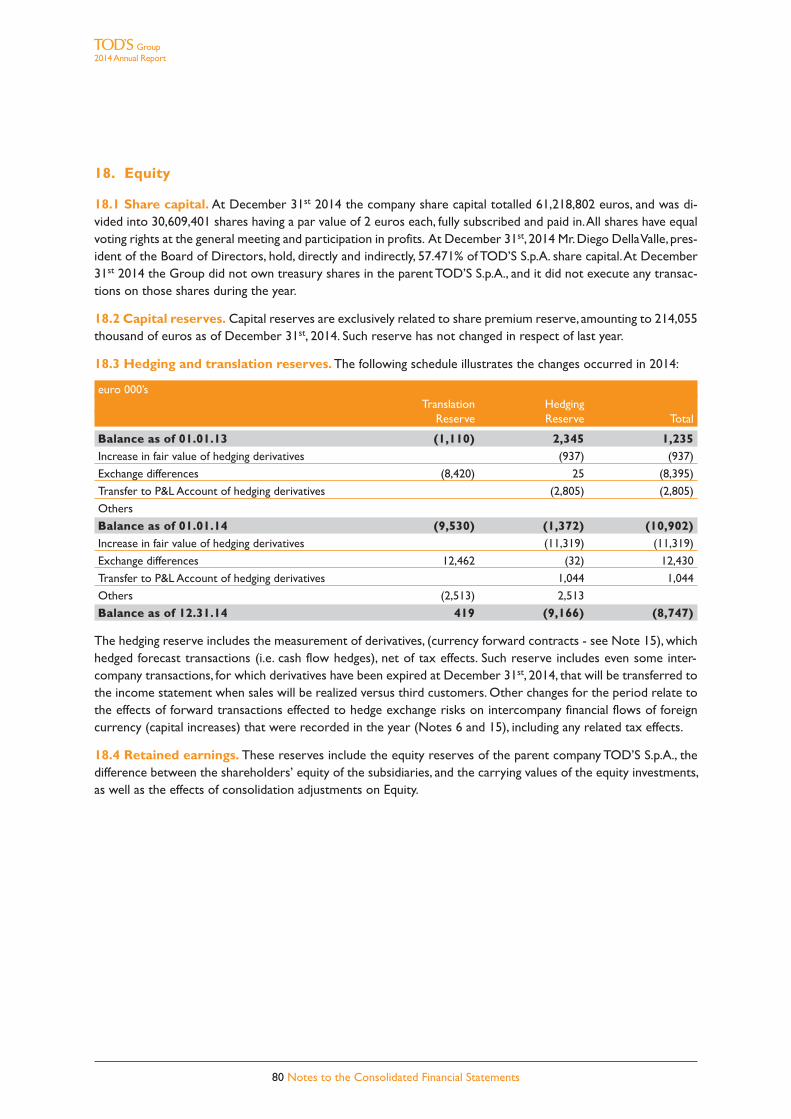
80 Notes to the Consolidated Financial Statements
Group2014 Annual Report
18. Equity
18.1 Share capital. At December 31st 2014 the company share capital totalled 61,218,802 euros, and was di-vided into 30,609,401 shares having a par value of 2 euros each, fully subscribed and paid in. All shares have equalvoting rights at the general meeting and participation in profits. At December 31st, 2014 Mr. Diego Della Valle, pres-ident of the Board of Directors, hold, directly and indirectly, 57.471% of TOD’S S.p.A. share capital. At December31st 2014 the Group did not own treasury shares in the parent TOD’S S.p.A., and it did not execute any transac-tions on those shares during the year.
18.2 Capital reserves. Capital reserves are exclusively related to share premium reserve, amounting to 214,055thousand of euros as of December 31st, 2014. Such reserve has not changed in respect of last year.
18.3 Hedging and translation reserves. The following schedule illustrates the changes occurred in 2014:
euro 000’sTranslation Hedging
Reserve Reserve Total
Balance as of 01.01.13 (1,110) 2,345 1,235Increase in fair value of hedging derivatives (937) (937)
Exchange differences (8,420) 25 (8,395)
Transfer to P&L Account of hedging derivatives (2,805) (2,805)
Others
Balance as of 01.01.14 (9,530) (1,372) (10,902)Increase in fair value of hedging derivatives (11,319) (11,319)
Exchange differences 12,462 (32) 12,430
Transfer to P&L Account of hedging derivatives 1,044 1,044
Others (2,513) 2,513
Balance as of 12.31.14  419 (9,166) (8,747)
The hedging reserve includes the measurement of derivatives, (currency forward contracts - see Note 15), whichhedged forecast transactions (i.e. cash flow hedges), net of tax effects. Such reserve includes even some inter-company transactions, for which derivatives have been expired at December 31st, 2014, that will be transferred tothe income statement when sales will be realized versus third customers. Other changes for the period relate tothe effects of forward transactions effected to hedge exchange risks on intercompany financial flows of foreigncurrency (capital increases) that were recorded in the year (Notes 6 and 15), including any related tax effects.
18.4 Retained earnings. These reserves include the equity reserves of the parent company TOD’S S.p.A., thedifference between the shareholders’ equity of the subsidiaries, and the carrying values of the equity investments,as well as the effects of consolidation adjustments on Equity.

81 Notes to the Consolidated Financial Statements
Group2014 Annual Report
euro 000’sRetained Profit (Loss)earnings of the period Total
Balance as of 01.01.13 335,322 145,461 480,783Allocation of 2012 result 62,816 (62,816)
Dividends (82,645) (82,645)
Profit for the period 133,780 133,780
Other changes (836) (836)
Balance as of 01.01.14 397,302 133,780 531,082Allocation of 2013 result 51,135 (51,135)
Dividends (82,645) (82,645)
Profit for the period 97,114 97,114
Other changes (2,549) (2,549)
Balance as of 12.31.14 445,889 97,114 543,003
During the year, part of the net income for 2013 was distributed in the form of a dividend of 2.70 euros per shareresolved by the Shareholders’ Meeting of the parent company TOD’S S.p.A. on April 17th, 2014. Other changes arerelated to the use of the specific reserve for promoting territorial solidarity projects and to the recognition of thecumulated actuarial gains/(losses) of the period (IAS19).
18.5 Dividends. In execution of a resolution by the Shareholders' Meeting of April 17th, 2014, the parent companyTOD’S S.p.A. paid the shareholders dividends in May for the net income realised in 2013. The aggregate amountof the dividends paid is 82,645,382.70 euros, at the rate of 2.70 euros for each of the 30,609,401 sharesrepresenting the share capital at the coupon detachment date (May 19th, 2014). Moreover, other Group companiesdistributed dividends of 257 thousand euros to their own non-controlling interests.The Board of Directors of the parent company TOD’S S.p.A. has proposed that the net profit for 2014 bedistributed with payment of a dividend of 2 euros per share. The dividend is subject to approval by the annualShareholders’ Meeting, and was not included among the liabilities reported on this balance sheet. The proposeddividend, totalling 61,218,802 euros on the basis of the currently outstanding shares, is payable to all shareholdersentered on the register of shareholders at the coupon detachment date.
19. Provisions and potential liabilities and assets
19.1 Provisions for risks. They include 3,417 thousand euros (3,651 thousand euros in 2013) as the prudentestimate of liabilities that the Group might incur on pending lawsuits. Accruals for the year totalled 647 thousandeuros (1,778 thousand euros in 2013).
19.2 Contingent liabilities and other commitments.i. Guarantees granted to third parties.At December 31st, 2014 the Group had provided guarantees amount-ing to 13,904 thousand euros (compared to 15,737 thousand euros in 2013) against the contract commitmentsundertaken by some Group companies. The guarantees mainly consist of a surety of 10,912 thousand euros issuedagainst the commitment to finance the Coliseum restoration works, the financial liability of which has been recog-nised in full in the accounts (Note 7 and 22), and a surety of 1,300 thousand euros issued to the Teatro alla ScalaFoundation, in connection with obtaining the status of Permanent Founding Member, now cancelled as the com-mitments concerned have been fulfilled.
ii. Guarantees received from third parties. Guarantees received by the TOD’S Group from banks as securi-ty for contractual commitments totalled 14,547 thousand euros (13,702 thousand euros in 2013).
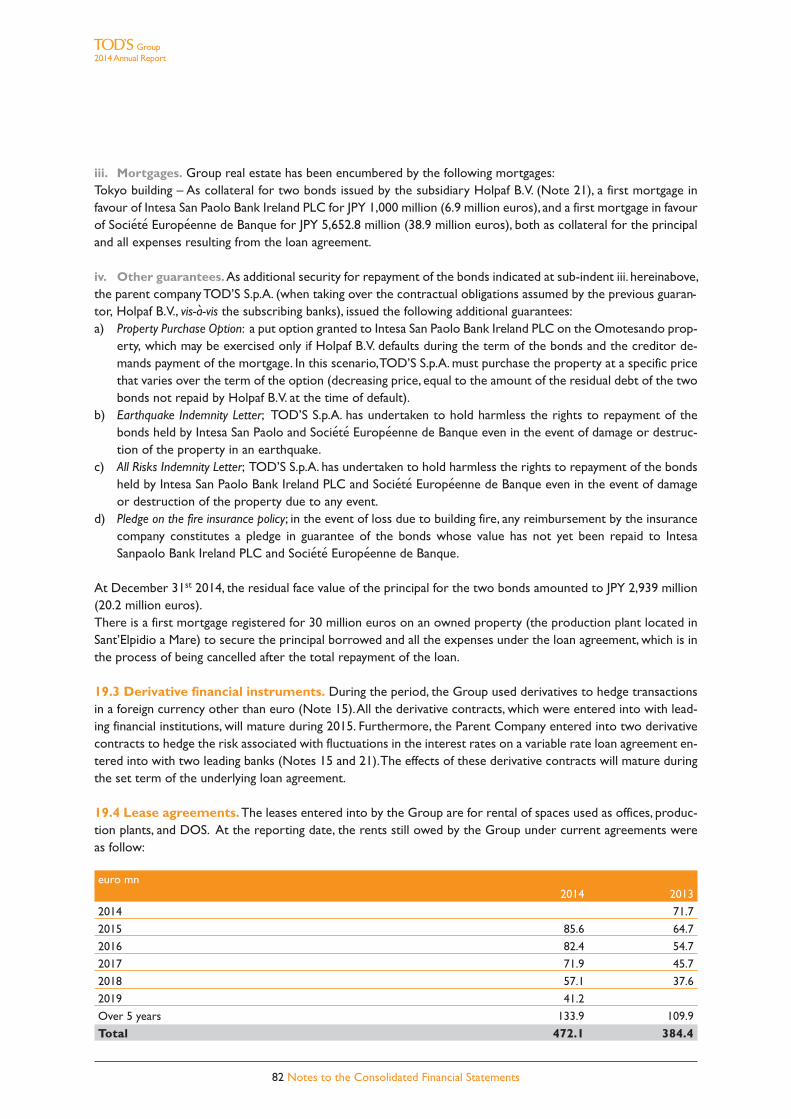
82 Notes to the Consolidated Financial Statements
Group2014 Annual Report
iii. Mortgages. Group real estate has been encumbered by the following mortgages:Tokyo building – As collateral for two bonds issued by the subsidiary Holpaf B.V. (Note 21), a first mortgage infavour of Intesa San Paolo Bank Ireland PLC for JPY 1,000 million (6.9 million euros), and a first mortgage in favourof Societe Europeenne de Banque for JPY 5,652.8 million (38.9 million euros), both as collateral for the principaland all expenses resulting from the loan agreement.
iv. Other guarantees.As additional security for repayment of the bonds indicated at sub-indent iii. hereinabove,the parent company TOD’S S.p.A. (when taking over the contractual obligations assumed by the previous guaran-tor, Holpaf B.V., vis-a-vis the subscribing banks), issued the following additional guarantees:a) Property Purchase Option: a put option granted to Intesa San Paolo Bank Ireland PLC on the Omotesando prop-
erty, which may be exercised only if Holpaf B.V. defaults during the term of the bonds and the creditor de-mands payment of the mortgage. In this scenario, TOD’S S.p.A. must purchase the property at a specific pricethat varies over the term of the option (decreasing price, equal to the amount of the residual debt of the twobonds not repaid by Holpaf B.V. at the time of default).
b) Earthquake Indemnity Letter; TOD’S S.p.A. has undertaken to hold harmless the rights to repayment of thebonds held by Intesa San Paolo and Societe Europeenne de Banque even in the event of damage or destruc-tion of the property in an earthquake.
c) All Risks Indemnity Letter; TOD’S S.p.A. has undertaken to hold harmless the rights to repayment of the bondsheld by Intesa San Paolo Bank Ireland PLC and Societe Europeenne de Banque even in the event of damageor destruction of the property due to any event.
d) Pledge on the fire insurance policy; in the event of loss due to building fire, any reimbursement by the insurancecompany constitutes a pledge in guarantee of the bonds whose value has not yet been repaid to IntesaSanpaolo Bank Ireland PLC and Societe Europeenne de Banque.
At December 31st 2014, the residual face value of the principal for the two bonds amounted to JPY 2,939 million(20.2 million euros).There is a first mortgage registered for 30 million euros on an owned property (the production plant located inSant’Elpidio a Mare) to secure the principal borrowed and all the expenses under the loan agreement, which is inthe process of being cancelled after the total repayment of the loan.
19.3 Derivative financial instruments. During the period, the Group used derivatives to hedge transactionsin a foreign currency other than euro (Note 15). All the derivative contracts, which were entered into with lead-ing financial institutions, will mature during 2015. Furthermore, the Parent Company entered into two derivativecontracts to hedge the risk associated with fluctuations in the interest rates on a variable rate loan agreement en-tered into with two leading banks (Notes 15 and 21). The effects of these derivative contracts will mature duringthe set term of the underlying loan agreement.
19.4 Lease agreements.The leases entered into by the Group are for rental of spaces used as offices, produc-tion plants, and DOS. At the reporting date, the rents still owed by the Group under current agreements wereas follow:
euro mn2014 2013
2014 71.7
2015 85.6 64.7
2016 82.4 54.7
2017 71.9 45.7
2018 57.1 37.6
2019 41.2
Over 5 years 133.9 109.9
Total 472.1 384.4

83 Notes to the Consolidated Financial Statements
Group2014 Annual Report
Operating lease instalments, included in the Costs of use of third party assets, totalled 96.2 million euros in theyear 2014.
20. Employee Benefits
20.1 Defined contribution plans. The Group has a defined contribution retirement plan (employee sev-erance indemnities – TFR) in favor of employees at Group’s Italian companies with more than 50 employees(see the following section in this regard) and the Japanese and Korean subsidiaries. At December 31st, 2014,the liability accrued vis-a-vis employees was 2,570 thousand euros (December 31st, 2013: 2,290 thousand euros),and relating only to the two Asian companies, since the amounts accrued in favour of Italian employees haveall been transferred to funds outside the Group. The amount charged to profit and loss for the period totals699 thousand euros.
20.2 Defined benefit plans. Following the statutory amendments introduced beginning January 1st, 2007, em-ployee severance indemnities, a deferred payment plan in favour of all employees of the Group’s Italian companies,were classified as a defined benefits plan (IAS 19) only for firms with less than 50 employees, for which the Group’sobligation is not related with payment of the contributions accrued on the paid compensation, but extends untilthe end of the employment relationship, or, for companies with more than 50 employees, for the liability accrueduntil 2007(1). For these types of plans, the principle requires that the accrued amount be projected into the fu-ture in order to determine the amount to be paid upon termination of the employment relationship, with an ac-tuarial assessment that accounts for the rate of rotation of employees, expected evolution of compensation, andother factors.The main actuarial assumptions used for the valuation are summarized below:
• Discounting rate: 1.49%
It is related to the average yield curve from IBOXX Eurozone Corporates AA of December 2014.
• Inflation rate: 0.6% for the year 2015, 1.2% for the year 2016, 1.50% for the year 2017 and 2018, 2% forthe year 2019 on;
• TFR incremental rate: 1.950% for the year 2015, 2.4% for the year 2016, 2.625% for the year 2017 and2018, 3% for the year 2019 on.
The table below shows the variation of the liability occurred in 2014:
euro 000’sYear 2014 Year 2013
Opening balance  8,844 9,640Current benefits 95 98
Financial expenses 290 118
Benefits paid (455) (419)
Actuarial gains/(losses)  1,259 (623)
Other  (21) 29
Closing balance 10,012 8,844
(1) The statutory amendment envisaged that for firms with more than 50 employees, the employee severance indemnities accrued from 1st
January 2007 had to be allocated to supplemental retirement plans (pension funds) or, alternatively, to a Treasury Fund set up at the INPS (ItalianNational Social Security Institute). Since all obligations of firms towards their employees ceased starting on 1st January 2007, all accruedemployee severance indemnities are covered by the rules governing defined contribution plans for the liability accrued from such date.

84 Notes to the Consolidated Financial Statements
Group2014 Annual Report
21. Financial liabilities
The Group’s financial liabilities at December 31st, 2014 are broken down as follows:
euro 000’s12.31.14 12.31.13 Change
Current account overdraft 10,988 21,077 (10,088)
Financing and other financial liabilities - short term 4,650 4,889 (239)
Total financial liabilities short-term 15,638 25,966 (10,327)Financing and other financial liabilities - long term 20,298 21,087 (789)
Total financial liabilities 35,936 47,053 (11,117)Total Financing - and other financial liabilities (short/long term) 24,948 25,976 (1,028)
Financing and other financial liabilities. At December 31st, 2014 financing and other financial liabilities wererepresented by the following medium-long term position:
Currency 000’s Res. Debt Res. DebtType Counterpart Currency Maturity in currency in Euro
Leasing Medioleasing S.p.A. Eur 2023/2024 3,418 3,418
Notes A-1 Intesa SanPaolo Jpy 2017 394,349 2,715
Notes A-2 Societe Eurepeenne de Banque Jpy 2021 2,545,075 17,524
Total financing 23,658Other financial liabilities Inr n.a. 98,965 1,290
Total financing and other financial liabilities 24,948
Leasing are related to two financial lease agreements to which TOD’S S.p.A. got in on March 2014 in order to pur-chase a new industrial building located next to the Group headquarter. The financial liabilities indicated as NotesA-1 and A-2 represent two amortised, non-convertible fixed-rate (respectively 2.94% and 3.239%) bonds denom-inated in JPY, issued in 2006 by the subsidiary Holpaf B.V. to refinance the debt assumed for purchase of the landand construction of the building in Omotesando. The two bonds were fully subscribed by banks, and specificallyby Intesa San Paolo (Notes A-1) and Societe Europeenne de Banque (Notes A-2).The debt referred to at Notes A-1 and A-2 includes the residual debt for principal (Note A-1: 2,715 thousand eu-ros, and Note A-2: 17,524 thousand euros) and the interest accrued for the year, 30 thousand euros and 207 thou-sand euros, respectively, and the effect of fair value measurement upon initial recognition, for 14 thousand eurosand 386 thousand euros, respectively, which are measured at amortized cost.For an analysis of the guarantees securing the two bonds, please see the section Provisions, contingent liabilitiesand assets (Note 19).The following table illustrates the repayment schedule for the aggregate amount of loans.
euro 000’sLeasing Notes A1 Notes A2 Total
2015 219 849 2,291 3,360
2016 228 879 2,139 3,246
2017 238 987 2,196 3,421
2018 248 - 2,254 2,503
2019 259 - 2,315 2,574
Over 5 years 2,225 - 6,330 8,555
Total 3,418 2,715 17,524 23,658
The breakdown by currency of the balance of total financial liabilities (bank overdrafts and financing) at the re-porting date is as follows:

85 Notes to the Consolidated Financial Statements
Group2014 Annual Report
Financial liabilities by currency 12.31.14Currency 000’s Local Currency Euro
Jpy 1,590,326 10,950
Inr 2,738 36
Eur 2 2
Total bank overdrafts 10,988Jpy 2,939,424 20,240
Inr 98,965 1,290
Eur 3,418 3,418
Total financial and financial liabilities 24,948Total financial liabilities 35,936
Financial liabilities by currency 12.31.14Currency 000’s Local Currency Euro
Jpy 3,048,285 21,064
Eur 13 13
Total bank overdrafts 21,077Jpy 3,348,938 23,141
Inr 86,057 1,014
Eur 1,821 1,821
Total financing and financial liabilities 25,976Total financial liabilities 47,053
For interest rate sensitivity analysis (IFRS 7), see Note 6.Finally, it should be noted that on July 23rd, 2014 the parent company TOD’S S.p.A. entered into a variable rateloan agreement with two leading banks, which was aimed at setting aside funds for a maximum amount of 400 mil-lion euros. The funds will remain available for a period of eighteen months from the date of the execution of theagreement, during which the company may require the disbursement of the loan in one or more than one trancheat the terms and conditions laid down therein, which provide for the application of a variable interest rate (3-month EURIBOR + 110 basis points) on the sums paid out. To hedge the risk arising from interest rate fluctua-tions, the company has entered into two hedging derivative contracts (Note 15), swapping the variable rate set asper contract for a fixed rate of 0.748% quarterly settled. At December 31st, 2014 no amount had yet been paidout in relation to this loan.
22. Other non current liabilities
The balance for this item, 16,619 thousand euros, refers mainly to the liability recognised in relation to the agree-ment made for financing of restoration work on the Coliseum (Note 7) for 12,877 million euros (16,682 millioneuros at December 31st, 2013). This liability was recognised at the discounted value of the financial outlays thatare reasonably foreseeable on the basis of the multi-year plan for restoration work.

86 Notes to the Consolidated Financial Statements
Group2014 Annual Report
23. Trade payables and other current liabilities
euro 000’s12.31.14 12.31.13 Change
Trade payables 160,220 152,619 7,601
Tax payables 9,015 7,809 1,206
Other liabilitiesPayables due to employees 10,429 9,784 645
Social security institutions 6,442 6,173 270
Other 24,473 19,321 5,152
Total other liabilities 41,345 35,278 6,067
The payables to employees consist of amounts accrued in favour of employees (including the portion of unusedholiday leave) and not paid at the reporting date.“Other” mainly includes advances from customers, the current portion of the returns estimates at the end of theyear, deferred revenues and other current liabilities.
24. Revenues
Revenues of the Group during the year are 965,5 million euros (967.5 million euros in 2013), substantially in linewith the previous year. For further comments on consolidated revenues see the report on operations.The item “Other income” amounts to 10.5 million euros (15.6 million euros in 2013) and it mainly includes activeroyalties and insurance reimbursements.
25. Personnel costs
The personnel costs incurred by the Group in FY 2014 as compared with those for FY 2013 are illustrated as follows:
euro 000’s % on revenuesYear 2014 Year 2013 Change 2014 2013
Wages and salaries 122,801 116,088 6,713 12.7 12.0
Social security contributions 32,411 30,544 1,867 3.4 3.2
Employee sev. Indem. (service cost) 5,174 5,033 141 0.5 0.5
Total 160,386 151,665 8,722 16.6 15.7
The following table illustrates the breakdown of Group’s employees by category:
12.31.14 12.31.13 Aver. 14 Aver. 13
Executives 50 52 50 50
White-collar Employees 2,981 2,825 2,935 2,728
Blue-collar Employees 1,266 1,267 1,254 1,256
Total 4,297 4,144 4,239 4,034

87 Notes to the Consolidated Financial Statements
Group2014 Annual Report
26. Financial income and expenses
The breakdown of financial income and expenses in fiscal 2014 is as follows:
euro 000’sYear 14 Year 13 Change
IncomeInterest income on current account 905 1,880 (975)
Foreign exchange gains 22,318 15,999 6,319
Other 179 322 (143)
Total income 23,403 18,201 5,201ExpensesInterest on medium-long term financing (590) (730) 140
Interest on short term borrowings (169) (329) 160
Foreign exchange losses (24,719) (18,417) (6,302)
Other (1,724) (708) (1,016)
Total expenses (27,202) (20,184) (7,018)Total net income and expenses (3,799) (1,983) (1,816)
27. Income taxes
Tax expenses allocable to FY 2014, including deferred taxes, totalled 47.6 million euros, and are broken down in-to current and deferred taxes as follows:
euro 000’sYear 14 Year 13
Current taxes 47,822 59,893
Deferred taxes (203) (2,721)
Total 47,619 57,172Tax rate (33.0%) (29.9%)
The parent company’s theoretical tax rate for FY 2014 (impact of theoretical tax on pre-tax profit) was 34.2%, de-termined by applying the IRES and IRAP tax rates applicable to 2014 taxable income as reported on the financialstatements, while the theoretical tax rate for FY 2014 of other Group companies operating outside Italy variesfrom country to country according to local law. The following schedule reconciles theoretical taxes, calculated byusing the theoretical tax rate of the parent company, and the taxes actually charged to income:
Euro mnTaxes Rate %
Theoretical income taxes at the rate of parent company 49.4 34.2Tax effect of non-deductible or partially deductible costs 2.7 1.9
Effect connected with the different rates of the foreign subsidiaries (4.5) (3.1)
Effective income taxes 47.6 33.0
28. Earnings per share
The calculation of base and diluted earnings per share is based on the following:

i. Reference Profit
euro 000’s For continuing and discontinued operations Year 14 Year 13
Profit used to determine basic earning per share 97,114 133,780
Dilution effects
Profit used to determine diluted earning per share 97,114 133,780
euro 000’s For continuing operations Year 14 Year 13
Profit for the year 97,114 133,780
Income (Loss) from discontinued operations
Profit used to determine basic earning per share 97,114 133,780Dilution effects
Profit used to determine diluted earning per share 97,114 133,780
In both fiscal 2014 and 2013, there were no dilutions of net consolidated earnings, partly as a result of activitiesthat were discontinued during the periods in question.
ii. Reference number of shares
Year 14 Year 13
Weighted average number of shares to determine basic earning per share 30,609,401 30,609,401
Share Options
Weighted average number of shares to determine diluted earning per share 30.609.401 30.609.401
iii. Base earnings per share. Calculation of the base earning per share for fiscal year 2014 is based on the netconsolidated income allocable to holders of ordinary shares of the parent company TOD’S S.p.A., totalling 97,114thousand euros (133,780 thousand euros in 2013), and on the average number of ordinary shares outstandingduring the same period, totalling 30,609,401 (unchanged respect to year 2013).
iv. Diluted earnings per share. Calculation of the diluted earnings per share for the period January-December2014 coincides with calculation of earnings per share, due to the fact that there are no items which producedilution effects.
29. Transactions with related parties
The Group's related parties transactions were executed in compliance with the procedural sequence and im-plementing procedures set out in the Related Parties Transactions Procedure approved by the TOD'S S.p.A.Board of Directors in implementation of the Related Parties Regulation adopted by CONSOB with Resolutionno. 17221 of March 12th 2010, as subsequently amended. In accordance with market best practices, significantrelated party transactions are subject to an in-depth review involving, inter alia:(i) complete, prompt transmission of material information to the delegated Board of Directors committees (theControl and Risk Committee and the Independent Directors Committee, each within the ambit of their dele-gated responsibilities, where the majority or all members of these committees are independent directors), whoin the performance of their functions also avail themselves of the assistance of independent experts;(ii) the issuance of an opinion (either binding or non-binding, as applicable) before approval of the transactionby the Board of Directors (or, if appropriate, by the body delegated to resolve on the transaction). All transac-tions – which are connected with the normal operations of TOD’S Group companies – were executed solely
88 Notes to the Consolidated Financial Statements
Group2014 Annual Report

on behalf of the Group by applying contractual conditions consistent with those that can theoretically be ob-tained on an arm’s length basis.
Most significant transactions concluded during the periodDuring the year 2014 no further transactions with related parties have been concluded except for the ones com-mented in the following paragraph.
Related party transactions at December 31st 2014In continuation of contractual relationships already existing in 2013, the TOD’S Group continued to maintain a se-ries of contractual relationship with related parties (directors/controlling or significant shareholders) in 2014. Theprincipal object of the transactions was the sale of products, lease of sales spaces, show rooms and offices, use ofthe ROGER VIVIER brand license and the provision of advertising services.
i. Commercial transactions with related parties - Revenues
euro 000’sSales of Rendering Operating Other
products of services Royalties lease operations
Year 2014Parent Company (*) 11,921 51 10
Directors
Exec. with strat. respons.
Total 11,921 51 - - 10
Year 2013Parent Company (*) 9,313 60 14 4
Directors
Exec. with strat. respons.
Total 9,313 60 - 14 4
89 Notes to the Consolidated Financial Statements
Group2014 Annual Report
(*) Companies directly or indirectly controlled by Chairman of the Board of Directors Diego Della Valle.
ii. Commercial transactions with related parties - Costs
euro 000’sCost of Rendering Operating Other
products of services Royalties lease operations
Year 2014Parent Company (*) 642 51 9,257 4,361 18
Directors
Exec. with strat. respons.
Total 642 51 9,257 4,361 18
Year 2013Parent Company (*) 651 145 8,533 4,129 5
Directors
Exec. with strat. respons.
Total 651 145 8,533 4,129 5(*) Companies directly or indirectly controlled by Chairman of the Board of Directors Diego Della Valle.

90 Notes to the Consolidated Financial Statements
Group2014 Annual Report
iii. Commercial transactions with related parties - Receivables and payables
Receivables and payables 12.31.14 12.31.13euro 000’s Receivables Payables Receivables Payables
Parent Company (*) 2,992 5,012 2,331 4,178
Directors
Exec. with strat. respons.
Total 2,992 5,012 2,331 4,178
(*) Companies directly or indirectly controlled by Chairman of the Board of Directors Diego Della Valle.
Given the insignificance of these amounts, they have not been separately listed in the accounts following CON-SOB resolution n. 15519 dated July 27th, 2006.Transactions between Group companies included in the scope of consolidation have been eliminated from theconsolidated financial statements. Consequently, they have not been highlighted in these notes.
Compensation of Directors, Statutory Auditors, and General ManagersThe following table illustrates the compensation accrued in the year 2014 by each of the Directors, StatutoryAuditors, Executives with Strategic Responsibilities of TOD’S S.p.A. (including for the activities that they per-formed at subsidiaries) for any reason and in any form:
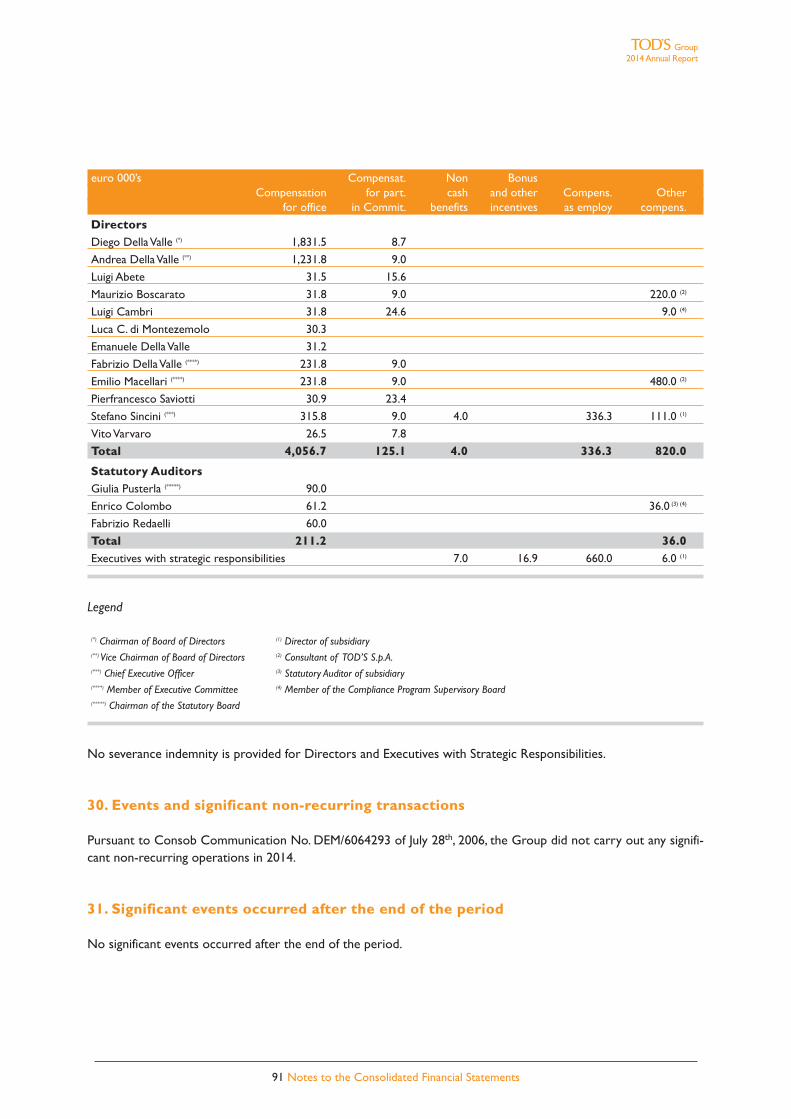
91 Notes to the Consolidated Financial Statements
Group2014 Annual Report
euro 000’s Compensat. Non BonusCompensation for part. cash and other Compens. Other
for office in Commit. benefits incentives as employ compens.
DirectorsDiego Della Valle (*) 1,831.5 8.7
Andrea Della Valle (**) 1,231.8 9.0
Luigi Abete 31.5 15.6
Maurizio Boscarato 31.8 9.0 220.0 (2)
Luigi Cambri 31.8 24.6 9.0 (4)
Luca C. di Montezemolo 30.3
Emanuele Della Valle 31.2
Fabrizio Della Valle (****) 231.8 9.0
Emilio Macellari (****) 231.8 9.0 480.0 (2)
Pierfrancesco Saviotti 30.9 23.4
Stefano Sincini (***) 315.8 9.0 4.0 336.3 111.0 (1)
Vito Varvaro 26.5 7.8
Total 4,056.7 125.1 4.0 336.3 820.0
Statutory AuditorsGiulia Pusterla (*****) 90.0
Enrico Colombo 61.2 36.0 (3) (4)
Fabrizio Redaelli 60.0
Total 211.2 36.0Executives with strategic responsibilities 7.0 16.9 660.0 6.0 (1)
Legend
(*) Chairman of Board of Directors (1) Director of subsidiary (**) Vice Chairman of Board of Directors (2) Consultant of TOD’S S.p.A.(***) Chief Executive Officer (3) Statutory Auditor of subsidiary (****) Member of Executive Committee (4) Member of the Compliance Program Supervisory Board(*****) Chairman of the Statutory Board
No severance indemnity is provided for Directors and Executives with Strategic Responsibilities.
30. Events and significant non-recurring transactions
Pursuant to Consob Communication No. DEM/6064293 of July 28th, 2006, the Group did not carry out any signifi-cant non-recurring operations in 2014.
31. Significant events occurred after the end of the period
No significant events occurred after the end of the period.
[THIS PAGE HAS BEEN INTENTIONALLY LEFT BLANK]
92 2013 Annual Report

Group2014 Annual Report
REPORT OF INDEPENDENT AUDITORS
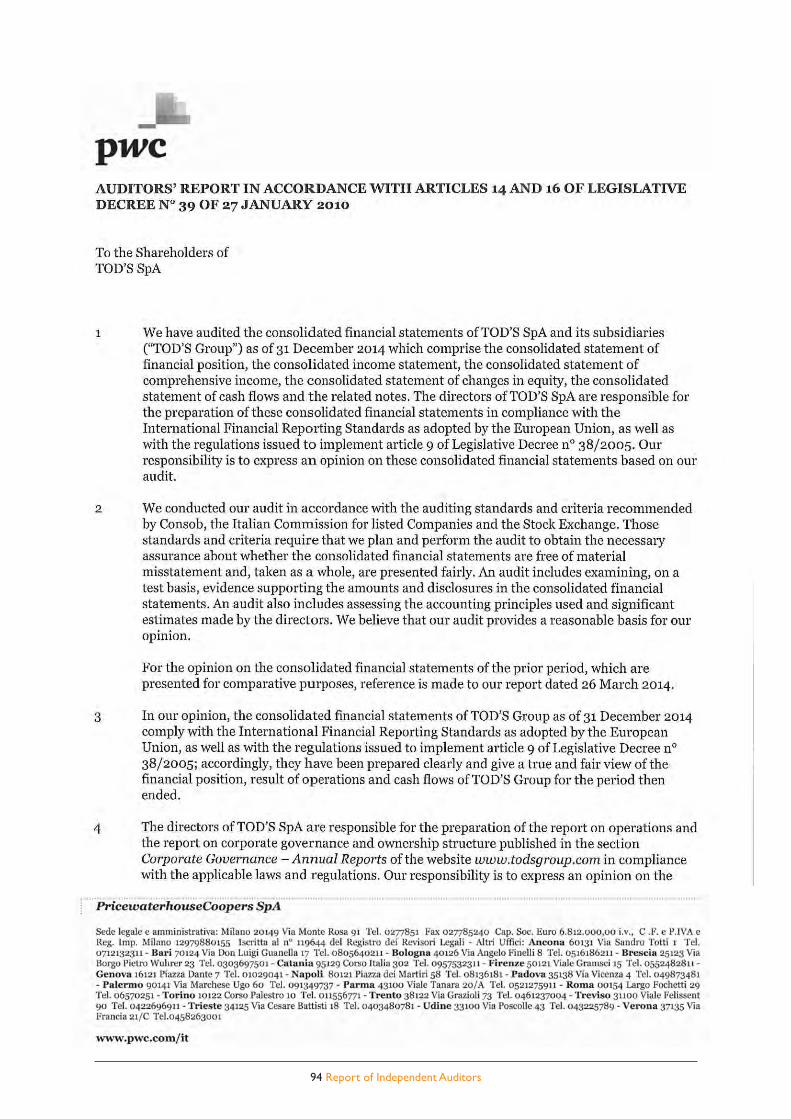
94 Report of Independent Auditors

95 Report of Independent Auditors
96 2014 Annual Report
[THIS PAGE HAS BEEN INTENTIONALLY LEFT BLANK]
TOD'S S.p.A. - ANNUAL REPORT AS AT DECEMBER 31ST, 2014
REPORT ON OPERATIONS

99 Report on operations
Introduction
The Report by the Board of Directors on Operations is based on the Separate Financial Statements of TOD’SS.p.A. at December 31st, 2014, prepared in accordance with IAS/IFRS (International Accounting Standards – IAS,and International Financial Reporting Standards – IFRSs) issued by the IASB and approved by the European Unionat the same date, on the assumption of the company's status as a going concern. IAS/IFRS refers also to all revisedInternational Accounting Standards (IAS) and all interpretative documents issued by the IFRIC (International FinancialReporting Interpretations Committee), previously nominated Standing Interpretations Committee (SIC). The Report onOperations must be read together with the Financial Statements and Notes to the Financial Statements, whichare integral parts of the 2014 separate annual report. These documents include the additional information requiredby CONSOB, with the measures issued in implementation of Article 9 of Legislative Decree 38/2005 (resolutions15519 and 15520 of July 27th, 2006 and DEM/6064293 memorandum of July 28th, 2006), as well as all subsequentnotices containing provisions regarding financial disclosures.The Separate Financial Statements have been prepared on a going concern basis. The company believes that thereare no asset, liability, financial or organizational indicators of material uncertainties, as defined in paragraph 25 ofIAS 1 on business continuity.Separate Financial Statements is approved by the Board of Directors of TOD’S S.p.A. in March 12th, 2015.In order to strip the effects of changes in exchange rates with respect to the average values for the previous yearfrom the results for the 2014 financial year, the typical economic reference indicators (Revenues, EBITDA and EBIT)have been recalculated by applying the average exchange rates for 2013, rendering them fully comparable withthose for the previous reference period. Note that on the one hand, these principles for measurement of busi-ness performance represent a key to interpretation of results not envisaged in IFRSs and on the other hand, mustnot be considered as substitutes for what is set out in those standards.
Operating performances
The volatility in the global luxury goods markets heightened progressively at the end of the year. The first signs ofweakness in this market had already started to be seen in 2013. Following our industrial mid-term perspective,the Company, according to schedule, put in hand all the planned investments in human resources, production ca-pacity, style, research and communication in order to strengthen and enhance its brands’ image and appeal. Witha view to its strategic development, on July 23rd, 2014 the Company entered into a loan agreement with two lead-ing banks, which was aimed at setting aside funds to a maximum amount of 400 million euros intended to supportthe development and related investments in the medium term.Sales during the year amounted, therefore, to 672.3 million euros: cross rates being constant, i.e. using the sameaverage rates as in 2013, revenues would have amounted to 676.2 million euros. At December 31st, 2013 saleshad been equal to 652.4 million euros.EBITDA and EBIT for the year amounted to 138.5 million euros and 117 million euros. Gross and net operatingmargins would increase up to 142.9 million euros and 121.5 million euros, respectively, exchange rates being con-stant, accounting for 21.1% and 18% of revenues. The net profit for the year came to 78.4 million euros.
S.p.A.2014 Annual Report

100 Report on operations
S.p.A.2014 Annual Report
euro 000’sMain economic indicators Year 14 Year13 Change %
Sales revenues 672,280 652,366 19,914 3.1
EBITDA 138,477 145,707 (7,230) (5.0)
Deprec., amort., write-downs and advances (21,437) (19,987) (1,450) 7.3
EBIT 117,040 125,720 (8,680) (6.9)
Profit before taxes 117,177 143,162 (25,985) (18.2)
Profit for the year 78,414 101,502 (23,088) (22.7)
Freign exchange impact on revenues 3,958
Adjusted sales revenues 676,238 652,366 23,872 3.7
Impact on operating cost 473
Adjusted EBITDA 142,908 145,707 (2,799) (1.9)
Adjusted EBIT 121,497 125,720 (4,223) (3.4)
EBITDA % 20.6 22.3
EBIT % 17.4 19.3
Adjusted EBITDA % 21.1 22.3
Adjusted EBIT % 18.0 19.3
euro 000’sMain Balance Sheet Indicators 12.31.14 12.31.13 Change
Net working capital (*) 229,508 186,600 42,908
Intangible and tangible fixes assets 266,260 256,148 10,112
Other current assets/liabilities 115,433 117,016 (1,583)
Invested capital 611,201 559,764 51,437)Net financial position 33,022 100,348 (67,326)
Shareholders' equity 644,223 660,112 (15,889)
Capital expenditures 29,202 22,098 7,104
Cash flow from operations 62,337 158,382 (96,045)
Free cash flow (65,729) 39,406 (105,135)
(*) Trade receivables + inventories - trade payables
Revenues. Revenues rose overall by 3.1% in the period compared with 2013, driven particularly by brilliantperformances in the Rest of the World, European and American markets. The domestic market confirmed itsweakness, which affected the results of brands HOGAN and FAY, more exposed to Italy, while sales of theTOD’S and ROGER VIVIER brands rose substantially compared with the previous year. All product categoriesregistered positive growth rates; leather goods stood out with a rise in double-digit figures.

101 Report on operations
euro 000’sFY 14 % FY 13 % Change %
BrandTOD'S 356,984 53.1 335,146 51.4 21,838 6.5
HOGAN 181,547 27.0 188,381 28.9 (6,834) (3.6)
FAY 52,439 7.8 53,136 8.1 (697) (1.3)
ROGER VIVIER 75,319 11.2 70,440 10.8 4,879 6.9
Other 5,991 0.9 5,263 0.8 728 13.8
Total 672,280 100.0 652,366 100.0 19,914 3.1
ProductShoes 504,614 75.1 497,188 76.2 7,426 1.5
Leather goods 101,772 15.1 92,020 14.1 9,752 10.6
Apparel 59,890 8.9 58,073 8.9 1,817 3.1
Other 6,004 0.9 5,085 0.8 919 18.1
Total 672,280 100.0 652,366 100.0 19,914 3.1
RegionItaly 276,179 41.1 284,744 43.6 (8,565) (3.0)
Europe 168,215 25.0 152,051 23.3 16,164 10.6
Americas 51,386 7.6 46,114 7.1 5,272 11.4
Greater China 137,963 20.5 140,100 21.5 (2,137) (1.5)
RoW 38,537 5.7 29,357 4.5 9,180 31.3
Total 672,280 100.0 652,366 100.0 19,914 3.1
In 2014, revenues from the TOD’S brand came to 357 million euros, recording an increase of 6.5%. The HOGANand FAY brands recorded a slight decline of 3.6% and 1.3%, respectively, compared to 2013, which, as reportedabove, was mainly caused by the weakness of the domestic market.The ROGER VIVIER brand, which retained its status as one of the most exclusive luxury accessories and footwearbrands at global level, achieved revenues of 75.3 million euros (70.4 million euros in 2013), recording a growth rateof 6.9% compared to 2013.As regards product categories, sales data confirm the Company’s indisputable leadership in its footwear core busi-ness, the revenues of which amounted to 504.6 million euros in 2014 (compared to 497.2 million euros atDecember 31st, 2013), accounting for 75.1% of turnover. There were excellent double-digit figure growth rates inrevenues from leather goods and accessories, which came to 101.8 million euros (92 million euros at December31st, 2013), accounting for 15.1% of total turnover. Sales of clothing came to 60 million euros (58.1 million euros),recording an increase of 3.1% compared to 2013.The trend of revenues by geographical area is a reflection of the strategy decision to place the focus on growthon international markets, giving priority to the more responsive markets.Sales data were positive in all world markets except for Greater China, which was penalised by weak consump-tion of luxury goods in mainland China and the anti-government demonstrations in Hong Kong. In Europe, rev-enues turned in brilliant double-digit figure increases (10.6%), reporting revenues of 168.2 million euros (152.1 mil-lion euros in 2013). The same trend was observed in the American markets, which recorded a double-digit growthrate of 11.4% compared to 2013. A significant growth was recorded in the area of the “Rest of the world”, whichreported revenues of 38.5 million euros (29.3 million euros in 2013), showing an increase of 31.3% compared tothe previous year.In Italy revenues amounted to 276.2 million euros in 2014. The proportion of sales in the domestic market fell fur-ther, accounting for 41.1% of total revenues in 2014 compared to 43.6% in the previous year.
Operating results. EBITDA in 2014 totalled 138.5 million euros, equivalent to 20.6% of net sales. In 2013EBITDA amounted to 145.7 million euros, with a margin of 22.3%.This result was negatively impacted by the changes in exchange rates. On a like-for-like cross-rate basis, i.e. using
S.p.A.2014 Annual Report

102 Report on operations
S.p.A.2014 Annual Report
the same average exchange rates as in 2013, EBITDA would amount to 142.9 million euros, and be equivalent to21.1% of revenue.Personnel expenses registered a further growth in respect of 2013 related to the reinforcement of corporate lev-el operating functions in support of business development.Amortisation, depreciation expenses and write offs of fixed assets totalled 18.5 million euros in 2014 (16.8 mil-lion euros in 2013), and represent 2.7% of sales revenues. Net of 2.9 million euros for provisions, EBIT of the year2014 amounted to 117 million euros. At December 31st EBIT was equivalent to 17.4% of Company’s sales rev-enues. On a comparable exchange rate basis, EBIT would have amounted to 121.5 million euros, equivalent to 18%of sales revenues.In 2013 operating income was 125.7 million euros, or 19.3% of sales revenues.The net financial income for the year was 0.1 million euros, mainly related to the changes in the exchange ratesfor the euro and the main currencies used by the Company, in respect to the exchange rates used in hedging offoreign currency transactions.A total of 0.1 million euros were received as dividends in 2014 from subsidiaries.Net of the tax effect for current and deferred income taxes, totaling 38.8 million euros (FY 2013: 41.7 million eu-ros), for a tax rate of 33.1% as opposed to 29.1% in 2013, the profit for the year amounted to 78.4 million euros,compared with 101.5 million euros of the previous year. The profit at December 31st, 2014 was equivalent to 11.7%of revenue.
Capital expenditures. Capital expenditures made in the 2014 financial year amounted to 29.2 million euros, asagainst the 22.1 million euros in 2013.Around 6.8 million euros of operating resources were set aside for the supply of additional industrial equipmentfor the creation of the collections (lasts and moulds). A significant quota of investments, 3 million euros in theyear, was also allocated to the development of the company information systems, while 1 million euros were in-vested in safeguarding the company trademarks, which are one of its most strategic assets.
Net financial position (NFP). Net financial position at December 31st, 2014 totalled 33 million euros in re-spect to the beginning of the year when it was 100.3 million euros. Gross of dividends paid in 2014 for 82.6 mil-lion euros, the net financial position would be 115.6 million euros.
euro 000’sNet financial position 12.31.14 12.31.13 Change
Current financial assetsCash and cash equivalents 36,440 102,169 (65,729)
Cash and cash equivalents 36,440 102,169 (65,729)Current financial liabilitiesCurrent account overdraft
Current share of medium-long term financing (219) (1,821) 1,602
Current financial liabilities (219) (1,821) 1,602Current net financial position 36,221 100,348 (64,127)Non-current financial liabilitiesMedium-long term financing (3,199) (3,199)
Non-current financial liabilities (3,199) (3,199)Net financial position 33,022 100,348 (67,326)
Self-funding amounted to 106.5 million euros during the year (121.5 million euros in 2013). Increased the cash flowused for investing activities, amounting to 45.8 million euros for the year 2014. The free cash flow of the year 2014,negative for 65.7 million euros, was impacted mainly by the financial effects generated by the reduction of the op-erating result, already commented above, and by the physiological growth of operating working capital, mainly re-
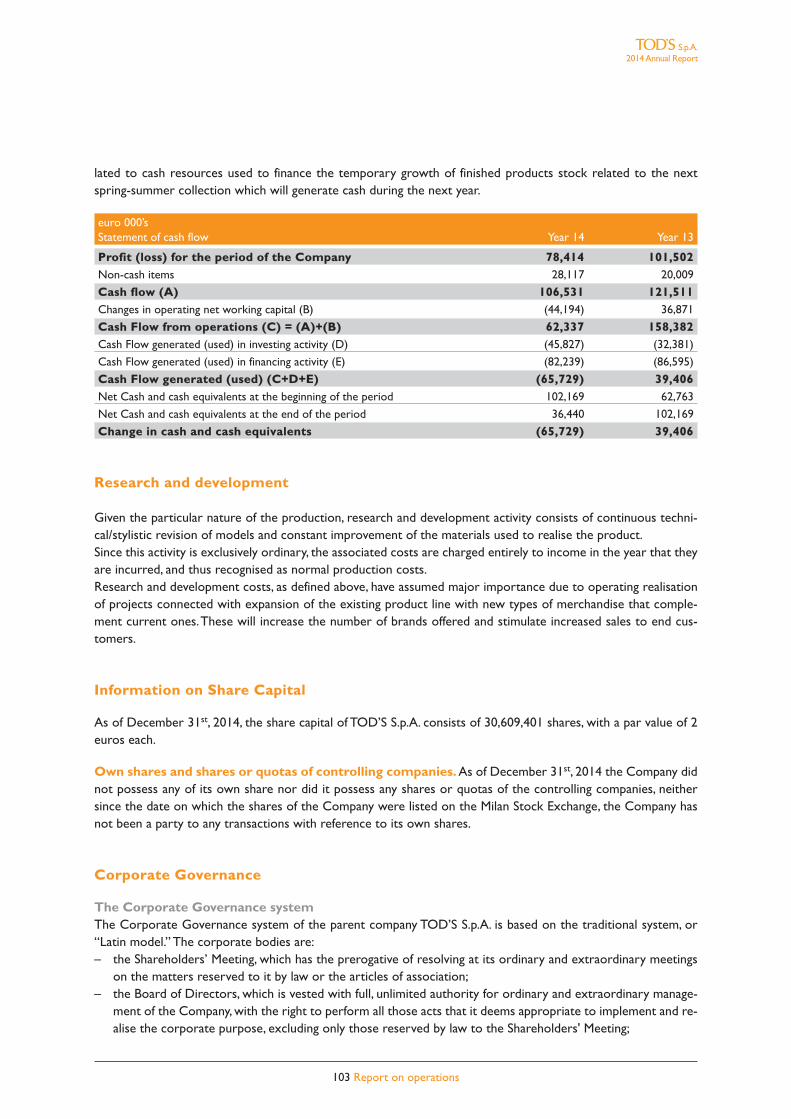
103 Report on operations
lated to cash resources used to finance the temporary growth of finished products stock related to the nextspring-summer collection which will generate cash during the next year.
euro 000’sStatement of cash flow Year 14 Year 13
Profit (loss) for the period of the Company 78,414 101,502Non-cash items 28,117 20,009
Cash flow (A) 106,531 121,511Changes in operating net working capital (B) (44,194) 36,871
Cash Flow from operations (C) = (A)+(B) 62,337 158,382Cash Flow generated (used) in investing activity (D) (45,827) (32,381)
Cash Flow generated (used) in financing activity (E) (82,239) (86,595)
Cash Flow generated (used) (C+D+E) (65,729) 39,406Net Cash and cash equivalents at the beginning of the period 102,169 62,763
Net Cash and cash equivalents at the end of the period 36,440 102,169
Change in cash and cash equivalents (65,729) 39,406
Research and development
Given the particular nature of the production, research and development activity consists of continuous techni-cal/stylistic revision of models and constant improvement of the materials used to realise the product.Since this activity is exclusively ordinary, the associated costs are charged entirely to income in the year that theyare incurred, and thus recognised as normal production costs.Research and development costs, as defined above, have assumed major importance due to operating realisationof projects connected with expansion of the existing product line with new types of merchandise that comple-ment current ones. These will increase the number of brands offered and stimulate increased sales to end cus-tomers.
Information on Share Capital
As of December 31st, 2014, the share capital of TOD’S S.p.A. consists of 30,609,401 shares, with a par value of 2euros each.
Own shares and shares or quotas of controlling companies. As of December 31st, 2014 the Company didnot possess any of its own share nor did it possess any shares or quotas of the controlling companies, neithersince the date on which the shares of the Company were listed on the Milan Stock Exchange, the Company hasnot been a party to any transactions with reference to its own shares.
Corporate Governance
The Corporate Governance systemThe Corporate Governance system of the parent company TOD’S S.p.A. is based on the traditional system, or“Latin model.” The corporate bodies are:– the Shareholders’ Meeting, which has the prerogative of resolving at its ordinary and extraordinary meetings
on the matters reserved to it by law or the articles of association;– the Board of Directors, which is vested with full, unlimited authority for ordinary and extraordinary manage-
ment of the Company, with the right to perform all those acts that it deems appropriate to implement and re-alise the corporate purpose, excluding only those reserved by law to the Shareholders' Meeting;
S.p.A.2014 Annual Report

104 Report on operations
S.p.A.2014 Annual Report
– the Board of Statutory Auditors, which is delegated by law to monitor i) compliance with the law, memoran-dum of association and compliance with the principles of proper management; ii) the adequacy of the organi-sational structure of the Company for matters falling under its purview, its internal control system, risks andadministrative and accounting system, as well as the adequacy of the latter in fairly reporting operating per-formance; iii) the adequacy of directives issued to TOD’S Group companies in regard to the information thatthey must provide in compliance with disclosure obligations; iv) the procedures for effective implementationof the corporate governance rules set out in the Corporate Governance Code adopted by the Group.Legislative Decree 39/2010 delegates the Board of Statutory Auditors the task of monitoring the process offinancial disclosure, the effectiveness of the risk control and management systems, internal audit, if applicable,as well as independent audits and certification of the annual accounts and consolidated accounts, and the in-dependence of the audit firm retained to do so. The Manager in charge of preparing the company financial doc-uments forms part of the corporate governance bodies.
The Board of Directors has set up several internal committees: the Executive Committee, the Internal Controland Risk, the Compensation Committee and the Independent Directors Committee. The last named committeehas the role and significant responsibilities that the Regulation of Related Party Transactions, adopted by CON-SOB with Resolution no. 17221 of March 12th, 2010 and subsequently amended assigns to the committee com-prised exclusively of independent directors.The adopted corporate governance system is substantially based on the Corporate Governance Code of ListedItalian Companies approved by Corporate Governance Committee of Borsa Italiana S.p.A., whose principles havebeen adopted by the Board of Directors of Tod’s S.p.A. on April 19th, 2012, and it is based on the reference sys-tems represented by international best practice.
Disclosure pursuant to Article 123-bis of Legislative Decree 58/1998At its meeting on March 12th 2015, the Board of Directors of the parent company TOD’S S.p.A. approved the an-nual Report on Corporate Governance and Shareholdings for the year 2014, which provides, among other, thedisclosures mandated pursuant to Article 123-bis (1) of the Consolidated Law on Finance (T.U.F.). That report al-so analytically illustrates the corporate governance system of TOD’S S.p.A., and it includes not only the informa-tion required under Article 123-bis (2) T.U.F., but also a comprehensive examination of the status of implementa-tion of the corporate governance principles recommended by the Corporate Governance Code in accordancewith the “comply or explain” principle.The reader is referred to the Annual Corporate Governance and Shareholdings Report, which is available to thepublic together with this Report on Operations and accounting documentation. It may be consulted in the cor-porate section of the www.todsgroup.com website.
Disclosure pursuant to Article 123-ter of Legislative Decree 58/1998On March 12th, 2015, the Board of Directors of Tod’s S.p.A. approved, in compliance with Article 123-ter ofLegislative Decree 58 of February 24, 1998 (the “Consolidated Law on Finance” or “T.U.F.”), as amended, and Article84-ter of Consob Resolution no. 11971/99 (the “Issuers Regulation”), as amended, the Remuneration Report. TheReport is composed of two sections:(i) the first is the policy of Tod’s S.p.A. in regard to remuneration of the members of the Board of Directors, theGeneral Manager, and the executives with strategic responsibilities in regard to the 2015 financial year, as well asthe procedures used for adoption and implementation of this policy;(ii) the other is aimed at representing each of the items that compose remuneration, and describing the compen-sation paid in 2014 to members of the Board of Directors and Board of Statutory Auditors, the General Managerand the executives with strategic responsibilities.The Report will be submitted to the Shareholders’ Meeting called for April 22nd, 2015, which will be asked to re-solve in favour of or against the first section with a non-binding resolution.The Remuneration Report is available at the registered office of the Company and on the corporate websitewww.todsgroup.com.

105 Report on operations
Disclosure of Significant Companies outside the EUTOD’S S.p.A., the parent company, directly or indirectly controls ten companies that are incorporated and regu-lated pursuant to the laws of countries that do not belong to the European Union (“Significant Companies out-side the EU”, as defined by Consob Resolution no. 16191/2007, as amended).In reference to these companies, note that:– all of them prepare accounts used to prepare the consolidated financial statements. The balance sheet and in-
come statement of these entities are provided to shareholders of TOD’S S.p.A. at the times and in the waysenvisaged by applicable regulations;
– TOD’S S.p.A. has acquired the bylaws and composition and powers of the corporate bodies;– the Significant Companies outside the EU: i) provide the parent company’s independent auditor with informa-
tion that the latter needs to audit the annual and interim accounts of the parent; ii) have an administrative andaccounting system that is adequate for providing the management, Board of Statutory Auditors and inde-pendent auditor of the parent company with the operating, financial position and earnings figures necessaryfor preparing the consolidated financial statements.
In order to satisfy its own statutory obligations, the Board of Statutory Auditors of TOD’S S.p.A. has audited theadequacy of the administrative and accounting system regularly to provide the management and independent au-ditor of TOD’S S.p.A. with the operating, financial position and earnings figures necessary for preparation of theconsolidated financial statements and the effective flow of information through meetings with the independent au-ditor and with the Financial Reporting Manager.
Disclosure pursuant to Consob Resolution no. 17221 of March 12th, 2010 (Related Parties Regulation)In 2014 the Group did not conclude highly significant transactions with related parties or related party transac-tions that had a material impact on the assets, liabilities or net income of the Group, and there were no modifi-cations or developments in the transactions described in the 2013 Annual Report that had the same effects.All information regarding existing relations with related parties in 2014 are set out in the supplementary notes.
Management and coordination activities
Although TOD’S S.p.A. is subject to the control (pursuant to Article 93 of Legislative Decree 58/1998) of DI.VI.Finanziaria di Diego Della Valle & C. S.r.l., neither this latter company or any other party has dictated policy or in-terfered in the management of TOD’S S.p.A. (or any of the subsidiaries of TOD’S S.p.A.). Indeed, management ofthe issuer and its subsidiaries was not subject to any influence by third parties outside the TOD’S Group.TOD’S S.p.A. is not subject to management and coordination by the parent company DI.VI. Finanziaria di DiegoDella Valle & C. S.r.l. or any other party pursuant to Sections 2497 et seq. Italian Civil Code.Pursuant to the Corporate Governance Code, transactions that have a particularly significant impact on TOD’SS.p.A. strategy, operations, assets, liabilities, and financial position are subject to exclusive review and approval bythe Board of Directors of the issuer TOD’S S.p.A. Its members include independent directors without executiveresponsibilities at the company, in accordance with the rules set out in Article 3 of the Corporate GovernanceCode.The expertise and authority of the independent directors without executive responsibilities and their material im-pact on decisions taken by the Board of Directors represent a further guarantee that all decisions by the Boardof Directors are taken exclusively on behalf of TOD’S S.p.A. without being influenced by instructions or interfer-ence by third parties representing interests opposed to the Company’s.All subsidiaries of TOD’S S.p.A. are subject to management and coordination by the issuer. This activity consistsin defining the general strategic policies for the Group, the internal control and risk management system, and theelaboration of general policies for management of the most important operating drivers (human, financial, pro-ductive, marketing and communication resources), without impairing the complete managerial and operating au-tonomy of the subsidiaries.
S.p.A.2014 Annual Report

Significant events occurring after the end of the fiscal year
No significant events occurred after the end of the period.
Business outlook
In the year 2014 the Company recorded a temporary slowdown in operating profits, due to our strategic deci-sion to continue to invest in production capacity, communication, research and, especially, in the retail distributionnetwork, despite a particularly challenging environment, characterized by weak consumer spending in major mar-kets for luxury goods.Aware of the financial and patrimonial solidity, the Company continued to focus on the mid/long-term view, to pre-serve the quality, the awareness and prestige of the brands.Concerning the current year, even in an uncertain and demanding macro-economic environment, which continuesto be characterized by an high volatility of the markets, the confirmation of expectations for the beginning of thesummer collection, already in the stores, the enthusiasm shown by the press for the fall winter collections, and thepositive trend of the current sale campaign, indicate that the Company return to growth in revenue and profits.
Motion for allocation of the profit for the year
It is proposed that the net profit for FY 2014, 78,413,899.95 euros, be allocated as follows:i. 16,227,486.46 euros to the extraordinary reserve;ii. 61,218,802 euros, to be distributed to shareholders in the form of a dividend of 2 euros per share for each of
the outstanding 30,609,401 shares;iii. 967,611.49 euros to the specific reserve for promoting territorial solidarity projects.
Milan, March 12th, 2015
The Chairman of the Board of DirectorsDiego Della Valle
106 Report on operations
S.p.A.2014 Annual Report

FINANCIAL STATEMENTS
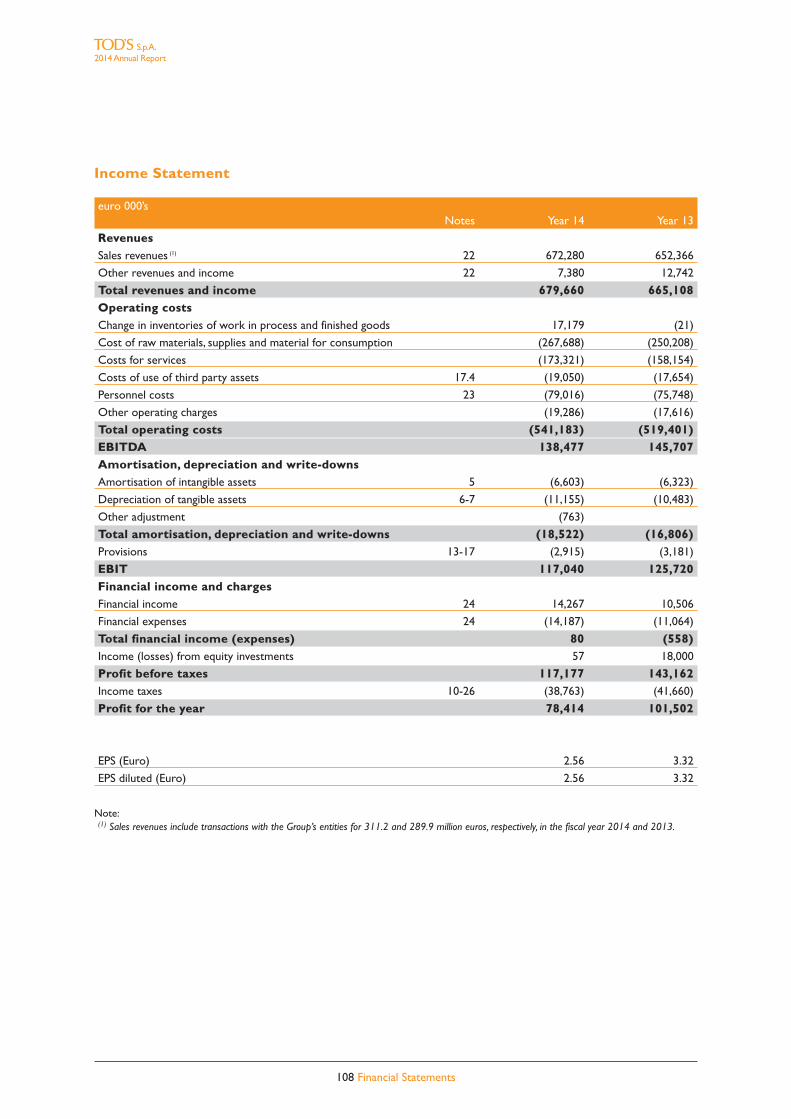
108 Financial Statements
S.p.A.2014 Annual Report
Income Statement
euro 000’sNotes Year 14 Year 13
RevenuesSales revenues (1) 22 672,280 652,366
Other revenues and income 22 7,380 12,742
Total revenues and income 679,660 665,108Operating costsChange in inventories of work in process and finished goods 17,179 (21)
Cost of raw materials, supplies and material for consumption (267,688) (250,208)
Costs for services (173,321) (158,154)
Costs of use of third party assets 17.4 (19,050) (17,654)
Personnel costs 23 (79,016) (75,748)
Other operating charges (19,286) (17,616)
Total operating costs (541,183) (519,401)EBITDA 138,477 145,707Amortisation, depreciation and write-downsAmortisation of intangible assets 5 (6,603) (6,323)
Depreciation of tangible assets 6-7 (11,155) (10,483)
Other adjustment (763)
Total amortisation, depreciation and write-downs (18,522) (16,806)Provisions 13-17 (2,915) (3,181)
EBIT 117,040 125,720Financial income and chargesFinancial income 24 14,267 10,506
Financial expenses 24 (14,187) (11,064)
Total financial income (expenses) 80 (558)Income (losses) from equity investments 57 18,000
Profit before taxes 117,177 143,162Income taxes 10-26 (38,763) (41,660)
Profit for the year 78,414 101,502
EPS (Euro) 2.56 3.32
EPS diluted (Euro) 2.56 3.32
Note:(1) Sales revenues include transactions with the Group’s entities for 311.2 and 289.9 million euros, respectively, in the fiscal year 2014 and 2013.

Statement of Comprehensive Income
euro 000’sNotes Year 14 Year 13
Profit/(loss) for the period (A) 78,414 101,502Other Comprehensive Income that will be reclassified subsequently to profit and loss:Gain/(Losses) on derivative financial instruments (cash flow hedge) 16.3 (9,300) (536)Total other Comprehensive Income that will be reclassifiedsubsequently to profit and loss (B) (9,300) (536)Other Comprehensive income that will not be reclassifiedsubsequently to profit and loss:Cumulated actuarial gains/(losses) on defined benefit plans 18 (1,018) 514Total other Comprehensive Income that will not be reclassifiedsubsequently to profit and loss (C) (1,018) 514Total Comprehensive Income (A) + (B) + (C) 68,096 101,480
109 Financial Statements
S.p.A.2014 Annual Report
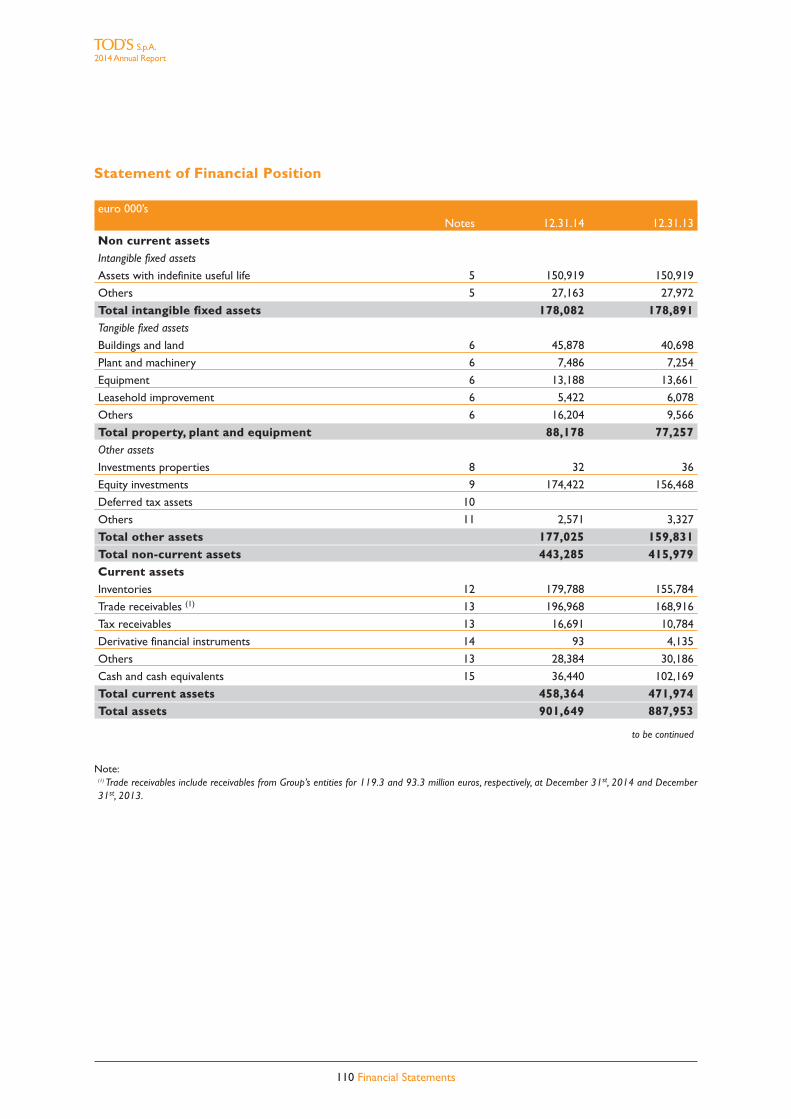
Statement of Financial Position
euro 000’sNotes 12.31.14 12.31.13
Non current assetsIntangible fixed assets
Assets with indefinite useful life 5 150,919 150,919
Others 5 27,163 27,972
Total intangible fixed assets 178,082 178,891Tangible fixed assets
Buildings and land 6 45,878 40,698
Plant and machinery 6 7,486 7,254
Equipment 6 13,188 13,661
Leasehold improvement 6 5,422 6,078
Others 6 16,204 9,566
Total property, plant and equipment 88,178 77,257Other assets
Investments properties 8 32 36
Equity investments 9 174,422 156,468
Deferred tax assets 10
Others 11 2,571 3,327
Total other assets 177,025 159,831Total non-current assets 443,285 415,979Current assetsInventories 12 179,788 155,784
Trade receivables (1) 13 196,968 168,916
Tax receivables 13 16,691 10,784
Derivative financial instruments 14 93 4,135
Others 13 28,384 30,186
Cash and cash equivalents 15 36,440 102,169
Total current assets 458,364 471,974Total assets 901,649 887,953
to be continued
Note:(1) Trade receivables include receivables from Group’s entities for 119.3 and 93.3 million euros, respectively, at December 31st, 2014 and December31st, 2013.
S.p.A.2014 Annual Report
110 Financial Statements
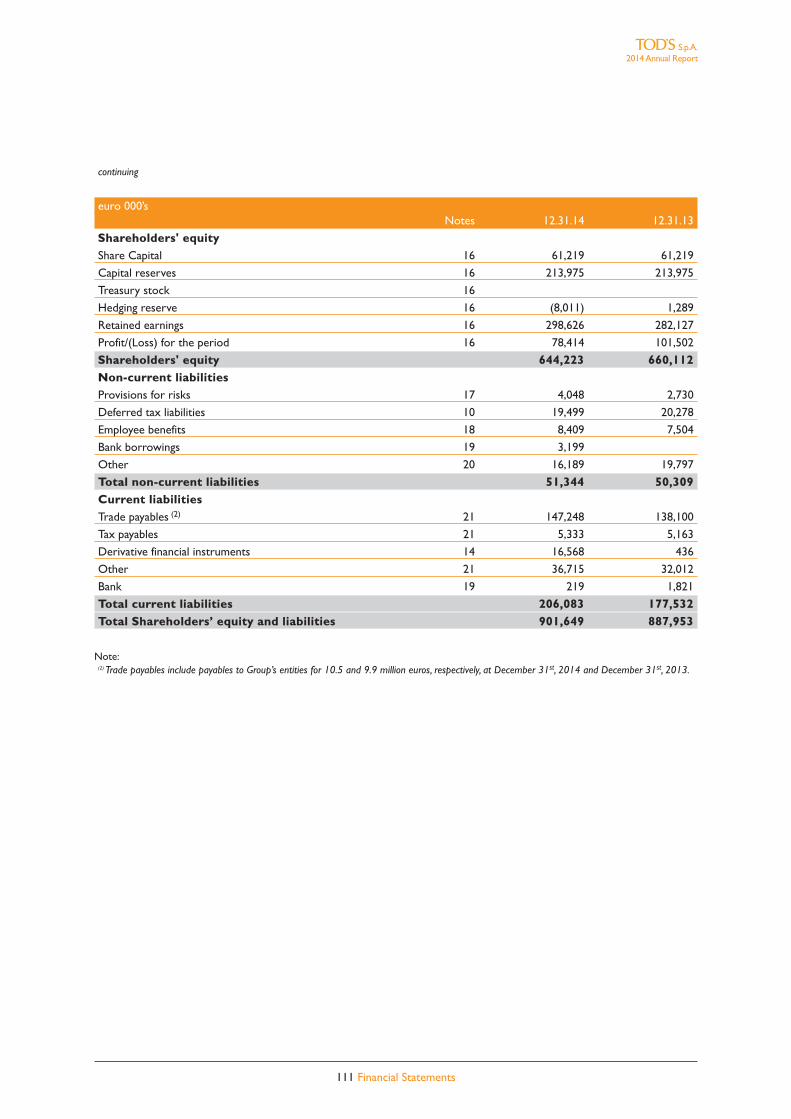
S.p.A.2014 Annual Report
111 Financial Statements
continuing
euro 000’sNotes 12.31.14 12.31.13
Shareholders' equityShare Capital 16 61,219 61,219
Capital reserves 16 213,975 213,975
Treasury stock 16
Hedging reserve 16 (8,011) 1,289
Retained earnings 16 298,626 282,127
Profit/(Loss) for the period 16 78,414 101,502
Shareholders' equity 644,223 660,112Non-current liabilitiesProvisions for risks 17 4,048 2,730
Deferred tax liabilities 10 19,499 20,278
Employee benefits 18 8,409 7,504
Bank borrowings 19 3,199
Other 20 16,189 19,797
Total non-current liabilities 51,344 50,309Current liabilitiesTrade payables (2) 21 147,248 138,100
Tax payables 21 5,333 5,163
Derivative financial instruments 14 16,568 436
Other 21 36,715 32,012
Bank 19 219 1,821
Total current liabilities 206,083 177,532Total Shareholders’ equity and liabilities 901,649 887,953
Note:(2) Trade payables include payables to Group’s entities for 10.5 and 9.9 million euros, respectively, at December 31st, 2014 and December 31st, 2013.

Statement of Cash Flows
euro 000’sNotes Year 14 Year 13
Profit/(Loss) for the period 78,414 101,502Non-cash adjustments:Amortizat., deprec., revaluat., and write-downs 5-6-7-8-10-12-13 16,816 19,495
Change in reserve for employee 18 (112) (253)
Change in deferred tax assets/liabilities 10 (780) 911
Other non monetary expenses/(income) 14-16-17 12,193 (144)
Cash flow (a) 106,531 121,511Change in current assets and liabilities:Inventories 12 (22,807) (452)
Trade receivables 13 (27,545) 12,492
Tax receivables 13 (5,907) 4,106
Other current assets  13 (616) 2,531
Trade payables 21 9,148 9,954
Tax payables 21 170 652
Other current liabilities 21 3,363 7,587
Change in operating working capital (b) (44,194) 36,871Cash flow from operations (c) = (a)+(b) 62,337 158,382Net investments in intangible and tangible assets 5-6 (28,629) (21,339)
(Increase) decrease of equity investments 9 (17,954) (10,333)
Reduction (increase) of other non-current assets 11 756 (709)
Cash flow generated (used) in investment activities (d) (45,827) (32,381)Dividend paid 16 (82,645) (82,645)
Loans to subsidiaries 19 2,418 (838)
Changes in long term borrowings/other non-current liabilities 19-20 (2,011) (3,112)
Capital increase 16
Other changes in Equity 16
Cash flow generated (used) in financing (e) (82,239) (86,595)Cash flow generated (used) (f)=(c)+(d)+(e) (65,729) 39,406
Net cash and cash equivalents at the beginning of the period 102,169 62,763
Net Financial position at the end of the period 36,440 102,169
Change in net cash and cash equivalents (65,729) 39,406
112 Financial Statements
S.p.A.2014 Annual Report
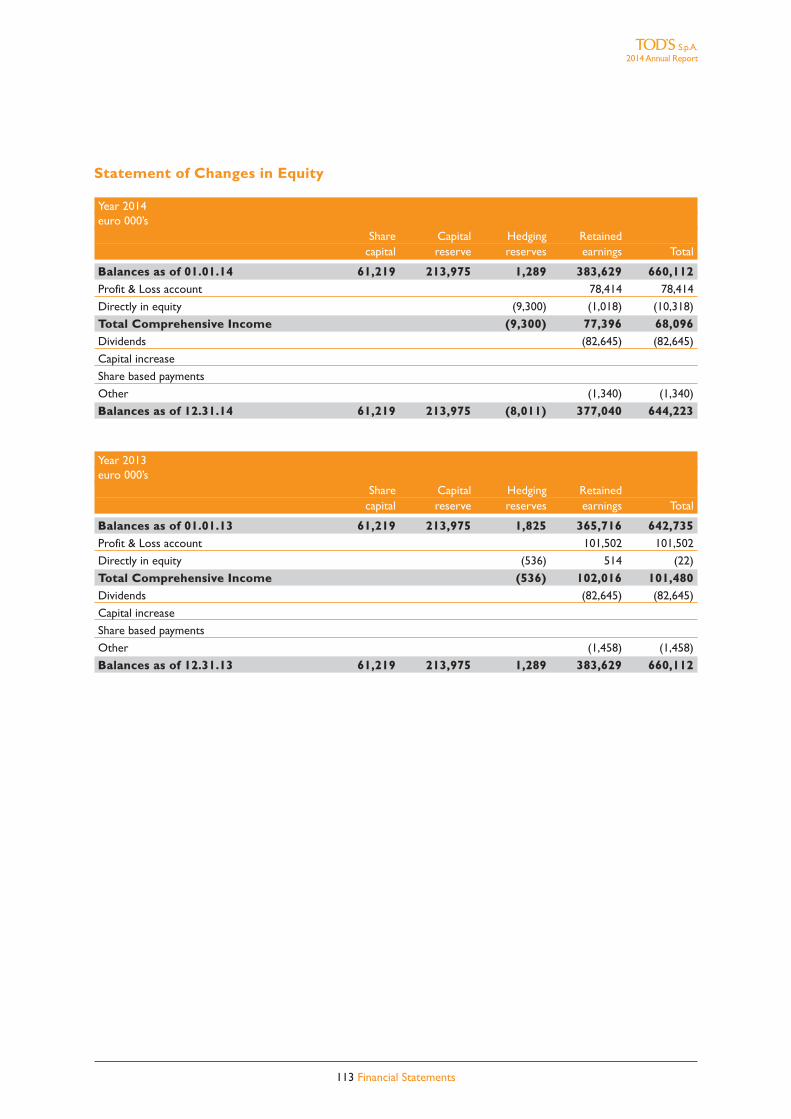
Statement of Changes in Equity
Year 2014euro 000’s
Share Capital Hedging Retainedcapital reserve reserves earnings Total
Balances as of 01.01.14 61,219 213,975 1,289 383,629 660,112Profit & Loss account 78,414 78,414
Directly in equity (9,300) (1,018) (10,318)
Total Comprehensive Income (9,300) 77,396 68,096Dividends (82,645) (82,645)
Capital increase
Share based payments
Other (1,340) (1,340)
Balances as of 12.31.14 61,219 213,975 (8,011) 377,040 644,223
Year 2013euro 000’s
Share Capital Hedging Retainedcapital reserve reserves earnings Total
Balances as of 01.01.13 61,219 213,975 1,825 365,716 642,735Profit & Loss account 101,502 101,502
Directly in equity (536) 514 (22)
Total Comprehensive Income (536) 102,016 101,480Dividends (82,645) (82,645)
Capital increase
Share based payments
Other (1,458) (1,458)
Balances as of 12.31.13 61,219 213,975 1,289 383,629 660,112
113 Financial Statements
S.p.A.2014 Annual Report

114 2014 Annual Report
[THIS PAGE HAS BEEN INTENTIONALLY LEFT BLANK]

NOTES TO THE SEPARATE FINANCIAL STATEMENTS
116 Notes to the Separate Financial Statements
S.p.A.2014 Annual Report
1. General notes
The parent company TOD’S S.p.A., registered office in Sant’Elpidio a Mare (Fermo) at Via Filippo Della Valle 1, islisted on Mercato Telematico Azionario (MTA) of Borsa Italiana S.p.A.At December 31st, 2014 TOD’S S.p.A. share capital is owned by DI.VI. FINANZIARIA of DIEGO DELLA VALLE &C. S.r.l. for 54.37%.The consolidated financial statements has been prepared by the Board of Directors of TOD’S S.p.A. on March12th, 2015 and it is subject to PricewaterhouseCoopers S.p.A. audit.
2. Basis of preparation
The Separate Financial Statements were prepared in accordance with IAS/IFRS (International Accounting Standards- IAS -, and International Financial Reporting Standards – IFRS) issued by IASB, based on the text published on theGazzetta Ufficiale of European Union (G.U.C.E.). IAS/IFRS refers also to all revised International Accounting Standards(IAS) and all interpretative documents issued by the IFRIC (International Financial Reporting InterpretationsCommittee), previously nominated Standing Interpretations Committee (SIC).The Notes have been supplemented by the additional information required by CONSOB and its implementingmeasures of Article 9 of Legislative Decree 38/2005 (Resolutions 15519 and 15520 of July 27th, 2006 and memo-randum DEM/6064293 of July 28th, 2006, pursuant to Article 114(5) of the Consolidated Law on Finance-TUF),Article 78 of the Issuer Regulation, the EC document of November 2003 and, when applicable, the Italian CivilCode. Consistently with the financial statements for the previous year, certain information is provided in theReport by the Board of Directors on Operations.The separate financial statements has been prepared on the going concern basis, and it includes the statement offinancial position, the income statement, statement of comprehensive income, the statement of cash flows and thestatement of changes in equity of TOD’S S.p.A. The separate financial statements is prepared in euro currency.For presentation of its operating income, the Company adopted the presentation of the profit and loss by nature.The format of representing revenues and costs by nature is followed, indicating the EBITDA and EBIT results asin the past, since they are considered representative indicators of company performance. In addition, it has beenprepared the statement of comprehensive income which include transactions that are outside the income state-ment but they produce their effects directly to equity. Transactions represented in the statement of comprehen-sive income are net of tax effects.The statement of financial position shows current items, for which it is supposed that they will be realized or closedduring the normal operating cycle, separately from non-current items (both assets and liabilities).The financial statements schemes, joined with both report on operations and supplementary notes, are consideredto be those that provide the best organized representation of the Company’s financial position and income. In case,for the application of a new accounting standards, there is a change in the nature of the operations or re-examina-tion of the financial statements and it is necessary or more appropriate to modify some figures to provide a clearerinformation to the stakeholders, the comparative figures will be reclassified in order to improve the comparability ofthe information between the years. In such a case, if significant, appropriate information in the notes to the separatefinancial statements will be provided. In accordance with art. 3 of Consob resolution n. 18079 of January 20th, 2012the Company adopt the waiver resulting in art. 70 c. 8 and 71 c. 1-bis of Consob regulation n. 11971/99 (and subse-quent modifications) in connection with making available, to third parties, all the documents related to mergers, cor-porate splits, capital increases, acquisitions and disposals in the corporate headquarter.
3. Evaluation methods and accounting standards
The accounting standards applied to the preparation of these Separate Financial Statements are consistent withthose applied to the preparation of the Separate Financial Statements at December 31st, 2013, except for the in-

117 Notes to the Separate Financial Statements
formation reported below in relation to any amendments, interpretations and new accounting standards applica-ble from January 1st, 2014.
Accounting standards, amendments and interpretations endorsed by the European Union, which will beapplicable from January 1st, 2014 and which were first adopted in TOD’S S.p.A. separate financial state-ments at December 31st, 2014
• IFRS 10 – Consolidated Financial Statements. This standard introduces a new principle of control and estab-lishes control as the basis for determining which entities must be consolidated. This standard sets out threeelements of control: the power over an investee, the exposure to variable returns from its involvement withthe investee and the connection between power and returns, i.e. the ability to exercise power over the investeeto affect variable returns. IFRS 10 replaces SIC-12 “Consolidation - Special Purpose Entities”, as well as any rel-evant provisions under IAS 27 “Consolidated and Separate Financial Statements”. The IASB required an enti-ty to apply this standard retrospectively for periods beginning on January 1st, 2013. The competent bodies ofthe European Union have completed the process for endorsement of this standard and have postponed therelated date of first-time adoption to January 1st, 2014, with early application permitted. The new standard hashad no impact on the Company.
• IAS 27 Revised – Separate Financial Statements. This standard was amended in 2011, as a result of the issue ofIFRS 10. The scope of application of IAS 27 is limited to separate financial statements only. This standard pre-scribes the accounting for investments in subsidiaries, joint ventures and associates in separate financial state-ments. The IASB required an entity to apply this standard retrospectively for periods beginning on January 1st,2013. The competent bodies of the European Union have completed the process for endorsement of this stan-dard and have postponed the related date of first-time adoption to January 1st, 2014, with early application per-mitted. The new standard has had no impact on the Company.
• IFRS 11 – Joint Arrangements. This standard replaces IAS 31 – Interests in Joint Ventures and SIC-13 – JointlyControlled Entities – Non-Monetary Contributions by Venturers. Specifically, this standard classifies jointarrangements into two types: joint operations and joint ventures. According to IFRS 11, joint ventures must beaccounted for using the equity method. Therefore, the method of proportionate consolidation provided for inIAS 31 for this type of joint arrangement is no longer permitted as an alternative valuation method. The IASBrequired an entity to apply this standard retrospectively for periods beginning on January 1st, 2013. The com-petent bodies of the European Union have completed the process for endorsement of this standard and havepostponed the related date of first-time adoption to January 1st, 2014, with early application permitted. Thenew standard has had no impact on the Company.
• IAS 28 Revised – Investments in Associates and Joint Ventures. This standard was amended in 2011, as a resultof the issue of IFRS 10 and IFRS 11. This standard prescribes the accounting for investments in associates andjoint ventures and sets out the requirements for the application of the equity method. The IASB required anentity to apply this standard retrospectively for periods beginning on January 1st, 2013. The competent bodiesof the European Union have completed the process for endorsement of this standard and have postponed therelated date of first-time adoption to January 1st, 2014, with early application permitted. The new standard hashad no impact on the Company.
• IFRS 12 – Disclosure of Interests in Other Entities. This standard sets out any and all disclosure requirementslaid down in consolidated financial statements, in relation to subsidiaries, joint arrangements, associates and un-consolidated structured entities. The disclosure is more extensive than that currently required by IAS 27, IAS28 and IAS 31 in force. The IASB required an entity to apply this standard retrospectively for periods begin-ning on January 1st, 2013. The competent bodies of the European Union have completed the process for en-dorsement of this standard and have postponed the related date of first-time adoption to January 1st, 2014,with early application permitted. The effects of the adoption of the new standard are limited to the disclosurerelating to interests in other entities to be provided in the explanatory notes to the annual separate financialstatements.
• Amendments to IFRS 10, IFRS 12 and IAS 27 “Investment Entities”. This standard was issued in October 2012.The amendment provides an exception to the consolidation of subsidiaries for any entities that qualify as “in-
S.p.A.2014 Annual Report

118 Notes to the Separate Financial Statements
S.p.A.2014 Annual Report
vestment entities”, except when subsidiaries provide services that relate to the investment activities carriedout by said entities. Unconsolidated subsidiaries must be valued according to IAS 39. Instead, a parent entityof an “investment entity”, which is not an “investment entity” itself, must consolidate all entities that it controls(including those controlled through an investment entity). These amendments are required to be applied ret-rospectively from January 1st, 2014 and have had no impact on the Company.
• Amendments to IAS 32 – Financial Instruments. These amendments set out the requirements for offsetting thefinancial instruments referred to in IAS 32. They are applicable retrospectively from January 1st, 2014 and havehad no significant impact on the Company.
• Amendments to IAS 36 – Impairment of Assets. The amendments were issued in May 2013 in relation to therecoverable amount disclosures for non-financial assets. Specifically, they clarify the disclosures required in thecase of impairment or reversals of non-financial assets at fair value, less costs of disposal. They are applicableretrospectively from January 1st, 2014. The effects of the adoption of the new standard are limited to the dis-closure relating to interests in other entities to be provided in the explanatory notes to the annual separatefinancial statements.
• Amendments to IAS 39 – Financial Instruments: Recognition and Measurement. These amendments were is-sued in June 2013 in relation to the novation of derivatives recognised according to hedge accounting. Underthe amendments there would be no need to discontinue hedge accounting if a hedging derivative was novat-ed with a central counterparty (CCP), as a consequence of laws or regulations. The amendments are applica-ble from January 1st, 2014 and have had no significant impact on the Company.
Accounting standards, amendments and interpretations endorsed by the European Union, which will beapplicable from January 1st, 2015 and which have not been adopted early by TOD’S S.p.A.
• IFRIC 21 – Levies. This interpretation was published on May 20th, 2013 and provides guidance on when torecognise a liability for a levy imposed by a government, both for levies that are accounted for in accordancewith IAS 37 - Provisions, Contingent Liabilities and Contingent Assets and those where the timing and amountof the levy is certain. Specifically, this interpretation states that a liability must be recognised at the time of theoccurrence of the event, which is normally specified in the legislation introducing a new duty/tax generatingthe obligation, even if the obligation is measured on past performances. The interpretation should have beenapplied retrospectively, subject to prior endorsement, for periods beginning on January 1st, 2014. The processfor endorsement that was completed with the publication in the Official Journal on June 14th, 2014 delayed itsapplication on the part of the European Union and will be applicable for periods beginning on or after June17th, 2014 (for the Group, from January 1st, 2015).
• “Annual Improvements to IFRSs: 2010-2012 Cycle” - This document, which was published on December 2013,was aimed at adopting the proposed amendments to the standards within the annual improvements process.The main amendments involve the IAS/IFRS and the issues reported below: IFRS 2 Share-based Payment -Definition of vesting conditions; IFRS 3 Business Combinations – Accounting for contingent consideration; IFRS8 Operating Segments - Aggregation of operating segments; IFRS 8 Operating Segments - Reconciliation of thetotal of the reportable segments’ assets to the entity’s assets; IFRS 13 Fair Value Measurement - Short-termreceivables and payables; IAS 16 Property, Plant and Equipment and IAS 38 Intangible Assets - Revaluationmethod: proportionate restatement of accumulated depreciation; IAS 24 Related Party Disclosures - Key man-agement personnel. The process for endorsement by the European Union was completed with the publicationin the Official Journal on January 9th, 2015. The amendments will be applicable for periods beginning on or af-ter July 1st, 2014 (for the Company, from January 1st, 2015).
• “Annual Improvements to IFRSs: 2011-2013 Cycle” – This document, which was published in December 2013,was aimed at adopting the proposed amendments to the standards within the annual improvements process.The main amendments involve the IAS/IFRS and the issues reported below: IFRS 1 First-time Adoption ofInternational Financial Reporting Standards – Meaning of “effective” IFRSs; IFRS 3 – Business Combinations -Scope exception for joint ventures; IFRS 13 Fair Value Measurement - Scope of paragraph 52 (portfolio ex-ception); IAS 40 Investment Property - Interrelationship between IFRS 3 and IAS 40. The process for en-dorsement by the European Union was completed with the publication in the Official Journal on December

119 Notes to the Separate Financial Statements
19th, 2014. The amendments will be applicable for periods beginning on or after July 1st, 2014 (for the Company,from January 1st, 2015).
• IAS 19 – Employee contributions to defined benefit plans. On November 21st, 2013, the IASB published someminor amendments to IAS 19 – Employee benefits, concerning the accounting for contributions to definedbenefit plans from employees or third parties in specific cases, to be recognised as a reduction in the servicecost for the period. The process for endorsement by the European Union was completed with the publica-tion in the Official Journal on January 9th, 2015. These amendments will be applicable retrospectively for pe-riods beginning on or after July 1st, 2014 (for the Company, from January 1st, 2015).
Accounting standards, amendments and interpretations published by the IASB but not yet endorsed bythe European Union.
• IFRS 14 – Regulatory Deferral Accounts. On January 30th, 2014 the IASB published the document as the firststep in the wider rate-regulated activities project, which was started by the IASB in September 2012. IFRS 14allows entities, but only those which are first-time adopters of IFRS, to continue to recognise the amounts ofassets/liabilities subject to rate regulation according to the accounting standards previously adopted. In orderto enhance comparability with entities that already apply IFRS and do not recognise these amounts separate-ly, the standard requires the effect of rate-regulated activities to be presented separately from other items inthe statement of financial position, the income statement and the statement of comprehensive income.
• Amendments to IFRS 11: Accounting for Acquisitions of Interests in Joint Operations (issued on May 6th, 2014).• IFRS 15 – Revenue from Contracts with Customers. On May 28th, 2014 the IASB published a document which
requires an entity to recognise revenue at the time the control of goods or services is transferred to the cus-tomer in an amount that reflects the consideration to which the entity expects to be entitled in exchange forthese goods or services. The new revenue recognition model sets out a process in five steps. The new stan-dard also requires additional disclosures regarding the nature, amount, timing and uncertainty of the revenueand cash flows arising from these contracts with customers.
• Amendments to IAS 16 and IAS 38: Clarification of Acceptable Methods of Depreciation and Amortisation(issued on May 12th, 2014).
• Amendments to IAS 16 and IAS 41: Bearer Plants (issued on June 30th, 2014).• IFRS 9 – Financial Instruments. On July 24th, 2014 the IASB published the final document constituting the con-
clusion of the process, divided into three phases: Classification and Measurement, Impairment and GeneralHedge Accounting, entirely revising IAS 39. The document introduces new requirements for classifying andmeasuring financial assets and liabilities. Specifically, as regards financial assets, the new standard adopts a sin-gle approach based on how the financial instruments are managed and on the contractual cash flow charac-teristics of the financial assets themselves in order to determine the related valuation method, aiming at even-tually replacing the various rules laid down under IAS 39. As regards financial liabilities, the main amendmentconcerns the method of accounting for fair value changes in a financial liability designated as at fair valuethrough profit or loss, which are due to own credit of the financial liability itself. According to the new stan-dard, these changes must be recognised in other comprehensive income, without affecting profit or loss. Themain development relating to hedge accounting are:- Changes in the type of transactions that qualify for hedge accounting; specifically, a more extensive range ofrisks has been introduced for non-financial assets/liabilities that qualify for hedge accounting;- A change in the method of accounting for forward contracts and options included in a hedge accountingrelationship, in order to reduce profit or loss volatility;- Changes in the effectiveness test by replacing the current methods based on the 80-125% range with theprinciple of the “economic relationship” between the hedged item and the hedging instrument; furthermore,entities are no longer required to perform an assessment of the retrospective effectiveness of the hedgingrelationship;- A greater flexibility of the accounting methods is offset by improved disclosures on the risk managementactivities carried out by entities.
S.p.A.2014 Annual Report

120 Notes to the Separate Financial Statements
S.p.A.2014 Annual Report
The new document includes a single model for the impairment of financial assets based on expected losses.• Amendments to IAS 27: Equity Method in Separate Financial Statements (issued on 12 August 2014).• Amendments to IFRS 10 and IAS 28: Sale or Contribution of Asset between an Investor and its Associate or
Joint Venture (issued on September 11th, 2014).• Annual Improvements to IFRSs: 2012-2014 Cycle (issued on September 25th, 2014). • Amendments to IAS 1: Disclosure Initiative (issued on December 18th, 2014).• Amendments to IFRS 10, IFRS 12 and IAS 28: Investment Entities: Applying the Consolidation Exception (is-
sued on December 18th, 2014)
3.1 Use of estimates. Preparation of the financial statements and notes in conformity with IFRS requires thatmanagement make judgments, estimates and assumptions which impact on the values reported for assets and li-abilities, as well as disclosures relating to contingent assets and liabilities at the balance sheet date. Estimates andassumptions are based on historical data and other elements deemed significant, as at the end of the accountingperiod of reference.
3.2 Transactions in foreign currency. The functional currency (the currency used in the principal economicarea where the company operates) used to present the financial statements is the Euro. Foreign currency transac-tions are translated into the functional currency by applying the exchange rate in effect at the date of the transac-tion. Monetary assets and liabilities denominated in foreign currencies at the date of the financial statements aretranslated by using the exchange rate in effect at the closing date. Non-monetary assets and liabilities are valued attheir historic cost in foreign currency and translated by using the exchange rate in effect at the transaction date.The foreign exchange differences arising upon settlement of these transactions or translation of cash assets andliabilities are recognized on the profit and loss account.
3.3 Derivative financial instruments. The fundamental characteristics of the derivative financial instrumentsare set out in the paragraph on Financial Assets and in the paragraph on Loans. The company uses derivate finan-cial instruments (mainly currency futures contracts) to hedge the risks stemming from foreign exchange exposureand to hedge interest rate risks deriving from its operating activity, without any speculative or trading purposes,and consistently with the strategic policies of centralized cash management dictated by the Board of Directors.When derivative transactions refer to a risk connected with the variability of forecast transaction cash flow, theyare recognized according to the rules for cash flow hedge until the transaction is recorded on the books.Subsequently, the derivatives are treated in accordance with fair value hedge rules, insofar as they can be qualifiedas instruments for hedging changes in the value of assets or liabilities carried on the balance sheet.The hedge accounting method is used at every financial statement closing date. This method envisages posting de-rivatives on the balance sheet at their fair value. Posting of the changes in fair value varies according to the typeof hedging at the valuation date:– for derivatives that hedge forecast transactions (i.e. cash flow hedge), the changes are recognized in share-
holders’ equity, while the portion for the ineffective amount is recognized on the profit and loss account, un-der financial income and expenses; differences in fair value already recognized on specific reserves are bookedin profit and loss, adjusting operating margins, once hedged items (trade receivables/payables) have been alreadyrecognized. For hedging derivatives related to interest rate risks on loans, the change in fair value, already rec-ognized in the cash flow hedge reserve, are booked in profit and loss, adjusting financial income/charges oncehedged items (financial receivables/liabilities) have been already recognized;
– for derivatives that hedge receivables and payables recognized on the balance sheet (i.e. fair value hedge), thefair value differences are recognized entirely on the profit and loss account, under financial income and ex-penses. Furthermore, the value of the hedged item (receivables/payables) is adjusted for the change in valueattributable to the hedged risk, using the item financial income and expenses as a contra-entry.

121 Notes to the Separate Financial Statements
3.4 Intangible fixed assetsi. Goodwill. All business combinations are recognized by applying the acquisition method. Goodwill is meas-ured at the acquisition date as the excess of the assets and liabilities recognised in accordance with IFRS 3 andthe fair value of consideration transferred including the amount of any non-controlling interests recognised.If the company’s interest in the fair value of assets, liabilities, and identifiable potential liabilities exceeds the costof the acquisition (negative goodwill) after redetermination of these values, the excess is immediately recognizedon the profit and loss account.For acquisitions prior to January 1st, 2005, the date of transition to IAS/IFRS, goodwill retained the values recog-nized on the basis of the previous Italian GAAP, net of accumulated amortization up to the transition date.Goodwill is recognized on the financial statements at its cost adjusted for impairment losses. It is not subject toamortization, but the adequacy of the values is annually subjected to the impairment test, in accordance with therules set forth in the section Impairment losses.
ii. Trademarks. These are recognized according to the value of their cost and/or acquisition, net of accumu-lated amortization at the date of transition to IAS/IFRS. Trademarks TOD’S, HOGAN and FAY are classified as in-tangible fixed assets with an indefinite useful life and thus are not amortized, insofar as:• they play a primary role in company strategy and are an essential driver thereof;• the corporate structure, construed as organized property, plant, and equipment, and organization itself in a fig-
urative sense, is closely correlated with and dependent on dissemination and development of the trademarkson the markets;
• the trademarks are proprietary, properly registered, and constantly protected pursuant to law, with optionsfor renewal of legal protection, upon expiration of the registration periods, that are not burdensome, easilyimplemented, and without external impediments;
• the products sold by the company with these trademarks are not subject to particular technological obsoles-cence, which is characteristic of the luxury market in which the company operates; on the contrary, they areconsistently perceived by the market as being innovative and trendy, to the point of being models for imitationor inspiration;
• in the national and/or international context characteristic of each trademark, they are distinguished by marketpositioning and notoriety that ensures their dominance of the respective market segments, being constantlyassociated and compared with benchmark brands;
• in the relative competitive context, it can be affirmed that the investments made for maintenance of the trade-marks are proportionately modest with respect to the large forecast cash flows.
The adequacy of the values is annually subjected to the impairment test, in accordance with the rules set forth inthe section Impairment losses.
iii. Research and development costs. The research costs for a project are charged fully to the profit and lossaccount of the period in which they are incurred.The development costs of an activity are instead capitalized if the technical and commercial feasibility of the rel-ative activity and economic return on the investment are certain and definite, and the company has the intentionand resources necessary to complete the development.The capitalized costs include the costs for materials, labor, and an adequate portion of overhead costs. They arerecognized at cost, net of accumulated amortization and depreciation (see below) and impairment losses.
iv. Other intangible fixed assets. These are identifiable non-monetary intangible assets under the control ofthe company and capable of causing the company to realize future economic benefits.They are initially recognized at their purchase cost, including expenses that are directly attributable to them dur-ing preparation of the asset for its intended purpose or production, if the conditions for capitalization of expens-es incurred for internally generated expenses are satisfied.The cost method is used for determining the value reported on subsequent statements, which entails posting theasset at its cost net of accumulated amortization and write-downs for impairment losses.
S.p.A.2014 Annual Report
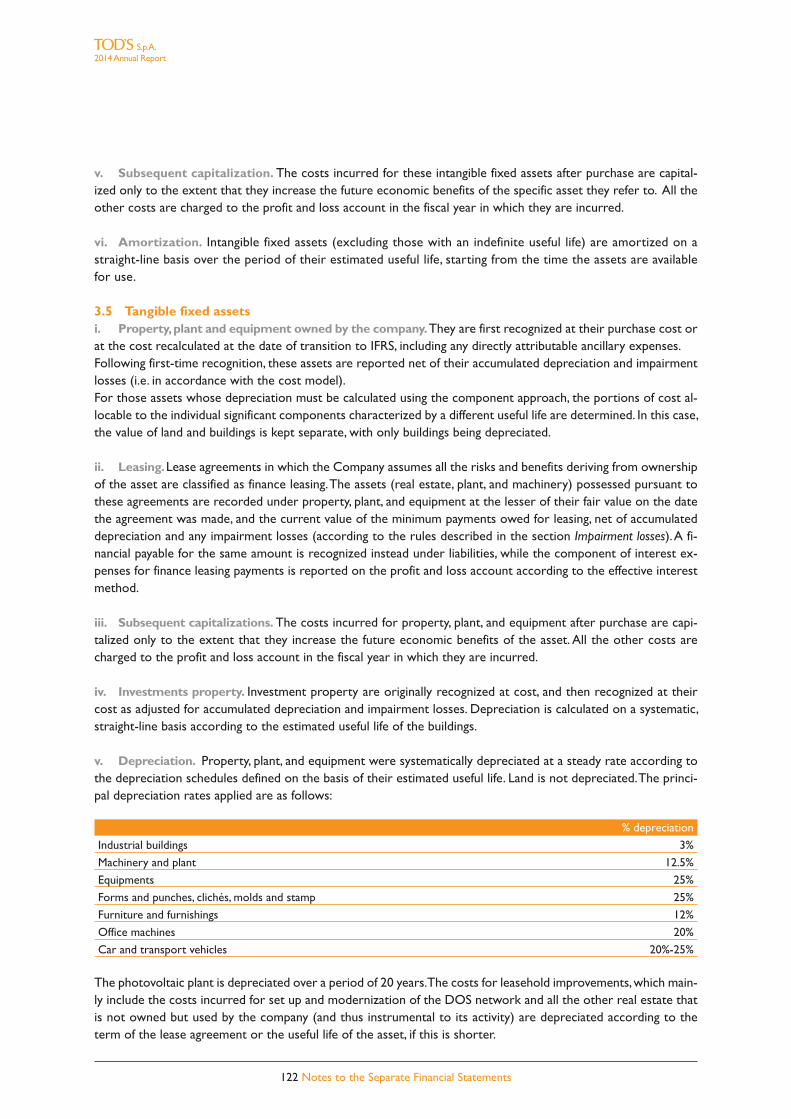
v. Subsequent capitalization. The costs incurred for these intangible fixed assets after purchase are capital-ized only to the extent that they increase the future economic benefits of the specific asset they refer to. All theother costs are charged to the profit and loss account in the fiscal year in which they are incurred.
vi. Amortization. Intangible fixed assets (excluding those with an indefinite useful life) are amortized on astraight-line basis over the period of their estimated useful life, starting from the time the assets are availablefor use.
3.5 Tangible fixed assetsi. Property, plant and equipment owned by the company. They are first recognized at their purchase cost orat the cost recalculated at the date of transition to IFRS, including any directly attributable ancillary expenses.Following first-time recognition, these assets are reported net of their accumulated depreciation and impairmentlosses (i.e. in accordance with the cost model).For those assets whose depreciation must be calculated using the component approach, the portions of cost al-locable to the individual significant components characterized by a different useful life are determined. In this case,the value of land and buildings is kept separate, with only buildings being depreciated.
ii. Leasing. Lease agreements in which the Company assumes all the risks and benefits deriving from ownershipof the asset are classified as finance leasing. The assets (real estate, plant, and machinery) possessed pursuant tothese agreements are recorded under property, plant, and equipment at the lesser of their fair value on the datethe agreement was made, and the current value of the minimum payments owed for leasing, net of accumulateddepreciation and any impairment losses (according to the rules described in the section Impairment losses). A fi-nancial payable for the same amount is recognized instead under liabilities, while the component of interest ex-penses for finance leasing payments is reported on the profit and loss account according to the effective interestmethod.
iii. Subsequent capitalizations. The costs incurred for property, plant, and equipment after purchase are capi-talized only to the extent that they increase the future economic benefits of the asset. All the other costs arecharged to the profit and loss account in the fiscal year in which they are incurred.
iv. Investments property. Investment property are originally recognized at cost, and then recognized at theircost as adjusted for accumulated depreciation and impairment losses. Depreciation is calculated on a systematic,straight-line basis according to the estimated useful life of the buildings.
v. Depreciation. Property, plant, and equipment were systematically depreciated at a steady rate according tothe depreciation schedules defined on the basis of their estimated useful life. Land is not depreciated. The princi-pal depreciation rates applied are as follows:
% depreciation
Industrial buildings 3%
Machinery and plant 12.5%
Equipments 25%
Forms and punches, clichés, molds and stamp 25%
Furniture and furnishings 12%
Office machines 20%
Car and transport vehicles 20%-25%
The photovoltaic plant is depreciated over a period of 20 years. The costs for leasehold improvements, which main-ly include the costs incurred for set up and modernization of the DOS network and all the other real estate thatis not owned but used by the company (and thus instrumental to its activity) are depreciated according to theterm of the lease agreement or the useful life of the asset, if this is shorter.
122 Notes to the Separate Financial Statements
S.p.A.2014 Annual Report
123 Notes to the Separate Financial Statements
3.6 Impairment losses. In the presence of indicators, events, or changes in circumstances that presume theexistence of impairment losses, IAS 36 envisages subjecting intangible fixed assets and property, plant and equip-ment to the impairment test in order to assure that assets with a value higher than the recoverable value are notrecognized on the financial statements. This test is performed at least once annually for non-current assets withan indefinite life in the same way as that used for non-current assets that have not yet been placed in service.Confirmation of the recoverability of the values recognized on the balance sheet is obtained by comparing thebook value at the reference date and the fair value less costs to sale (if available) or value in use. The value in useof a tangible or intangible fixed asset is determined according to the estimated future financial flows expected fromthe asset, as actualized through use of a discount rate net of taxes, which reflects the current market value of thecurrent value of the cash and risks related to Group’s activity.If it is not possible to estimate an independent financial flow for an individual asset, the cash generating unit towhich the asset belongs and with which it is possible to associate future cash flows that can be objectively deter-mined and independent from those generated by other operating units is identified. Identification of the cash gen-erating units was carried out consistently with the organizational and operating architecture of the Group.If the impairment test reveals an impairment loss for an asset, its book value is reduced to the recoverable valueby posting a charge on the profit and loss account.When the reasons for a write-down cease to exist, the book value of the asset (or the cash generating unit), withthe exception of goodwill, is increased to the new value resulting from the estimate of its recoverable value, butnot beyond the net book value that the asset would have had if the impairment loss had not been charged. Therestored value is recognized immediately on the profit and loss account.
3.7 Investments in subsidiaries and associated companies. The investments in subsidiaries, joint ventures,and associated companies that are not classified as held for sale in compliance with IFRS 5 are recognised at theirhistoric cost. The value recognised on the financial statements is periodically subjected to the impairment test, asenvisaged by IAS 36, and adjusted for any impairment losses.
3.8 Financial assets. These are recognized and cancelled on the balance sheet according to the trading dateand are initially valued at fair value which generally correspond to the cost, including costs directly related withthe acquisition.At the subsequent financial statement dates, the financial assets that the company intends and is able to hold un-til maturity (securities held until maturity) are recognized at the amortized cost according to the effective inter-est method, net of impairment losses.Financial assets other than those held to maturity are classified as held for trading or available for sale, and arerecognized at their fair value at the end of each period. When the financial assets are held for trading, the profitsand losses deriving from changes in the fair value are recognized on the profit and loss account for the period. Inthe case of financial assets available for sale, the profits and losses deriving from changes in the fair value are rec-ognized directly in shareholders’ equity until they are sold or have sustained a loss in value. At that time, the ag-gregate profits or losses that were previously recognized in shareholders’ equity are recognized on the profit andloss account of the period.
3.9 Inventories. These are recognized at the lower of purchase cost and their assumed disposal value. The netdisposal value represents the best estimate of the net sales price that can be realized through ordinary businessprocesses, net of any production costs not yet incurred and direct sales costs.The cost of inventories is based on the weighted average cost method. The production cost is determined by in-cluding all costs that are directly allocable to the products, regarding – for work in progress and/or semi-finishedproducts – the specific stage of the process that has been reached. The values that are thus obtained do not dif-fer appreciably from the current production costs referring to the same classes of assets.A special depreciation reserve is set aside for the portion of inventories that are no longer considered econom-ically useable, or with a presumed disposal value that is less than the cost recognized on the financial statements.
S.p.A.2014 Annual Report
3.10 Trade receivables and other receivables. These are initially recognised at fair value, including transac-tion costs, and subsequently measured at amortized cost. The measurement considers the recoverable amount ofthe assets through the recognition of a specific allowance for doubtful accounts determined as follows:• receivables under litigation, with certain and precise evidence documenting the impossibility of collecting them,
have been analytically identified and then written down;• for other bad debts, prudent allowances for write-downs have been set aside, estimated on the basis of in-
formation updated at the date of this document.
3.11 Cash. This includes cash on hand, bank demand deposits, and financial investments with a maturity of nomore than three months. These assets are highly liquid, easily convertible into cash, and subject to a negligible riskof change in value.
3.12 Assets and liabilities available for sale. Non-current assets (or disposal groups) are classified as heldfor sale when their carrying amount is recovered through a sale transaction rather than through continuing use.They are not depreciated and are measured at the lower of carrying amount and fair value, less costs to sell. Assetsavailable for sale and related liabilities are presented separately from other assets and liabilities in the statementof financial position.
3.13 Employee benefits. Employee benefits include (i) short-term employee benefits such as wages, salariesand related social security contributions, accrued but not yet paid, paid annual leave and paid sick leave, etc.; (ii)post-employment benefits, such as pensions or retirement benefits; (iii) other long-term benefits; and (iv) termi-nation benefits.
Short-term benefits are recognised periodically on an accruals basis and are made up of liabilities to employeesthat have not been settled by the reporting date.
Post-employment benefits are divided into two categories:
i. Defined contribution plans.The payments for eventual defined contribution plans are charged to the prof-it and loss account in the period that they are owed.
ii. Defined benefit plans.The costs of defined benefit plans are calculated using the Projected Unit Credit Method,carrying out the actuarial measurements at the end of each financial year. Past service costs are recognised immedi-ately to the extent that these benefits have already accrued; otherwise they are amortised on a straight-line basiswithin the average period within which the benefits are expected to accrue. The financial costs that have accrued onthe basis of the annual discounting rate are recognised in the income statement immediately. Actuarial gains and loss-es are recognised through other changes in comprehensive income under the specific equity item. Liabilities for post-employment benefits recognised in the financial statements represent the present value of liabilities for defined ben-efit plans. On the other hand, there are no other long-term employee benefits or termination benefits in the finan-cial statements.
iii. Share based payments.The payments based on shares are assessed at their fair value on the assignment date.This value is recognized on the profit and loss account on a straight-line basis throughout the period of accrual ofthe rights. This allocation is made on the basis of a management estimate of the stock options that will actually ac-crue in favor of vested employees, considering the conditions for use thereof not based on their market value.The fair value is determined by using the binomial method. No share based payments result in the current con-solidated financial statements.
3.14 Payablesi. Bank overdrafts and financing. Interest-bearing financing and bank overdrafts are initially recognized at fairvalue net of transaction costs, and subsequently valued at the amortized cost, using the effective interest method.
124 Notes to the Separate Financial Statements
S.p.A.2014 Annual Report

ii. Trade payables and other payables. These are measured at fair value which generally correspond to theirnominal value.
3.15 Provisions for risks. These are certain or probable liabilities that have not been determined at the datethey occurred and in the amount of the economic resources to be used for fulfilling the obligation, but which cannonetheless be reliably estimated. They are recognized on the balance sheet in the event of an existing obligation,legal or constructive, resulting from a past event, and it is likely that the company will be asked to satisfy the ob-ligation.If the effect is significant, and the date of the presumed discharge of the obligation can be estimated with sufficientreliability, the provisions are recognized on the balance sheet discounting future cash flows. The provisions that can be reasonably expected to be discharged twelve months after the reference date are clas-sified on the financial statements under non-current liabilities. Instead, the provisions for which the use of resourcescapable of generating economic benefits is expected to take place in less than twelve months after the referencedate are recognized as current liabilities.
3.16 Share capitali. Share capital. The total value of shares issued by the parent company is recognized entirely under share-holders’ equity, as they are the instruments representing its capital. ii. Treasury stock. The consideration paid for buy-back of share capital (treasury stock), including the expensesdirectly related to the transaction, is subtracted from shareholders’ equity. In particular, the par value of the sharesreduces the share capital, while the excess value is recognized as an adjustment to additional paid-in capital.
3.17 Dividends. The allocation of dividends to persons possessing instruments representing share capital afterthe reference date of the financial statement is not recognized under financial liabilities on the same reference date.
3.18 Revenues recognition. Revenues are recognized on the profit and loss account when the significant risksand benefits connected with ownership of the transferred assets are transferred to the buyer. In reference to themain transactions realized by the company, revenues are recognized on the basis of the following principles:a. Sales of goods – retail. The company operates in the retail channel through its DOS network. Revenues are
recognised when the goods are delivered to customers. Sales are usually collected in the form of cash orthrough credit cards;
b. Sales of goods – wholesale. The company distributes products on the wholesale market. These revenues arerecognised when the goods are shipped and considering the estimated effects of returns at the end of the year;
c. Provision of services. This income is recognised in proportion to the percentage of completion for the serv-ice provided on the reference date;
d. Royalties. These are recognised on the financial statements on accrual basis.
3.19 Financial income and expenses. These include all financial items recognized on the profit and loss ac-count for the period, including interest expenses accrued on financial payables calculated by using the effective in-terest method (mainly current account overdrafts, medium-long term financing), foreign exchange gains and loss-es, gains and losses on derivative financial instruments (according to the previously defined accounting principles),received dividends, the portion of interest expenses deriving from accounting treatment of assets held under fi-nance leasing (IAS 17) and employee reserves (IAS 19).Interest income and expenses are recognized on the profit and loss account for the period in which they arerealized/incurred, with the exception of capitalized expenses (IAS 23).Dividend income contributes to the result for the period in which the company accrues the right to receivethe payment.
3.20 Income taxes. The income taxes for the period include determination both of current taxes and deferredtaxes. They are recognized entirely on the profit and loss account and included in the result for the period, unlessthey are generated by transactions recognized directly to shareholders’ equity during the current or another pe-
125 Notes to the Separate Financial Statements
S.p.A.2014 Annual Report

riod. In this case, the relative deferred tax liabilities are also recognized under shareholders’ equity.Current taxes on taxable income for the period represent the tax burden determined by using the tax rates ineffect at the reference date, and any adjustments to the tax payables calculated during previous periods.Deferred tax liabilities refer to the temporary differences between the book values of assets and liabilities on thebalance and the associated values relevant for determination of taxable income. The tax liability of all temporarytaxable differences, with the exception of liabilities deriving from initial recognition of an asset or liability in a trans-action other than a business combination that, at the time of the transaction, does not influence either the income(loss) reported on the financial statements or taxable income (tax loss).Deferred tax assets and liabilities are compensated if and only if there is an executive right to compensate the re-lated current taxes and if deferred tax assets and liabilities are related to income taxes applied by the same taxauthority.Deferred tax assets that derive from temporary deductible differences are recognized on the financial statementsonly to the extent that it is likely taxable income will be realized for which the temporary deductible differencecan be used. No allocation is envisaged if the deferred tax asset derives from business combinations, or from theinitial posting of an asset or liability in a transaction other than a business combination that, at the time of thetransaction, does not influence either the income (loss) reported on the financial statements or taxable income(tax loss).The tax benefits resulting from tax losses are recognized on the financial statements of the period in which thebenefits accrued, if it is likely that taxable income will be realized and for which the tax loss can be used.The taxes in question (deferred tax assets and liabilities) are determined on the basis of a forecast of the assumedpercentage weight of the taxes on the income of the fiscal years in which the taxes will occur, taking into accountthe specific nature of taxability and deductibility. The effect of change in tax rates is recognized on the profit andloss account of the fiscal year in which this change takes place.
3.21 Statement of cash flows. The statement of cash flows is drafted using the indirect method. The net fi-nancial flows of operating activity are determined by adjusting the result for the period of the effects deriving fromchange to net operating working capital, non-monetary items, and all the other effects connected with investmentand financing activities.Net cash and cash equivalents are made up cash and cash equivalents net of bank overdrafts.
4. Management of financial risks
The company has implemented a system for monitoring its financial risks in accordance with the guidelines setout in the Corporate Governance Code of Listed Companies. As part of this policy, the financial risks connectedwith its operations are constantly monitored in order to assess their potential negative impact and undertake ap-propriate action to mitigate them. These risks are analysed as follows, highlighting the company’s level of exposure.It also includes a sensitivity analysis designed to quantify the potential impact of hypothetical fluctuations in bench-mark parameters on final results.
i. Credit riskCedit risk represents the exposure to potential losses stemming from failure to discharge obligations towardstrading counterparties. The company generates its revenues through three main channels: Group companies(directly operated store network), franchisees and customers (multi-brand). There is practically no credit riskon receivables from the Company, since almost all the entities belonging to the TOD’S Group are whollyowned by the Group. The receivables from independent customers (franchisee e wholesale), are subject to ahedging policy designed to streamline credit management and reduce the associated risk, which led to the ra-tionalisation of Italian independent distribution in the course of the financial year, with a view to conservingthe exclusive nature and positioning of the products and protecting the quality of the receivables. In particu-lar, company policy does not envisage granting credit to customers, while the creditworthiness of all cus-
126 Notes to the Separate Financial Statements
S.p.A.2014 Annual Report
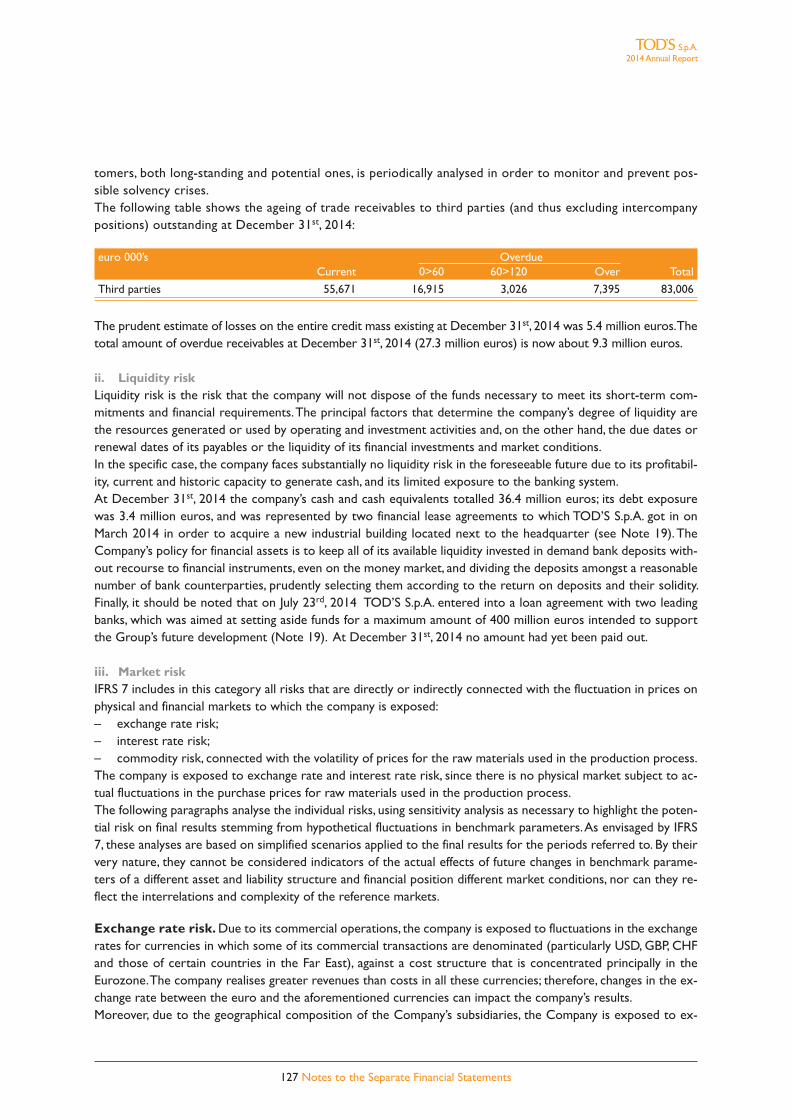
tomers, both long-standing and potential ones, is periodically analysed in order to monitor and prevent pos-sible solvency crises.The following table shows the ageing of trade receivables to third parties (and thus excluding intercompanypositions) outstanding at December 31st, 2014:
euro 000’s OverdueCurrent 0>60 60>120 Over Total
Third parties 55,671 16,915 3,026 7,395 83,006
The prudent estimate of losses on the entire credit mass existing at December 31st, 2014 was 5.4 million euros. Thetotal amount of overdue receivables at December 31st, 2014 (27.3 million euros) is now about 9.3 million euros.
ii. Liquidity riskLiquidity risk is the risk that the company will not dispose of the funds necessary to meet its short-term com-mitments and financial requirements. The principal factors that determine the company’s degree of liquidity arethe resources generated or used by operating and investment activities and, on the other hand, the due dates orrenewal dates of its payables or the liquidity of its financial investments and market conditions.In the specific case, the company faces substantially no liquidity risk in the foreseeable future due to its profitabil-ity, current and historic capacity to generate cash, and its limited exposure to the banking system.At December 31st, 2014 the company’s cash and cash equivalents totalled 36.4 million euros; its debt exposurewas 3.4 million euros, and was represented by two financial lease agreements to which TOD’S S.p.A. got in onMarch 2014 in order to acquire a new industrial building located next to the headquarter (see Note 19). TheCompany’s policy for financial assets is to keep all of its available liquidity invested in demand bank deposits with-out recourse to financial instruments, even on the money market, and dividing the deposits amongst a reasonablenumber of bank counterparties, prudently selecting them according to the return on deposits and their solidity.Finally, it should be noted that on July 23rd, 2014 TOD’S S.p.A. entered into a loan agreement with two leadingbanks, which was aimed at setting aside funds for a maximum amount of 400 million euros intended to supportthe Group’s future development (Note 19). At December 31st, 2014 no amount had yet been paid out.
iii. Market riskIFRS 7 includes in this category all risks that are directly or indirectly connected with the fluctuation in prices onphysical and financial markets to which the company is exposed:– exchange rate risk;– interest rate risk;– commodity risk, connected with the volatility of prices for the raw materials used in the production process.The company is exposed to exchange rate and interest rate risk, since there is no physical market subject to ac-tual fluctuations in the purchase prices for raw materials used in the production process.The following paragraphs analyse the individual risks, using sensitivity analysis as necessary to highlight the poten-tial risk on final results stemming from hypothetical fluctuations in benchmark parameters. As envisaged by IFRS7, these analyses are based on simplified scenarios applied to the final results for the periods referred to. By theirvery nature, they cannot be considered indicators of the actual effects of future changes in benchmark parame-ters of a different asset and liability structure and financial position different market conditions, nor can they re-flect the interrelations and complexity of the reference markets.
Exchange rate risk. Due to its commercial operations, the company is exposed to fluctuations in the exchangerates for currencies in which some of its commercial transactions are denominated (particularly USD, GBP, CHFand those of certain countries in the Far East), against a cost structure that is concentrated principally in theEurozone. The company realises greater revenues than costs in all these currencies; therefore, changes in the ex-change rate between the euro and the aforementioned currencies can impact the company’s results.Moreover, due to the geographical composition of the Company’s subsidiaries, the Company is exposed to ex-
127 Notes to the Separate Financial Statements
S.p.A.2014 Annual Report
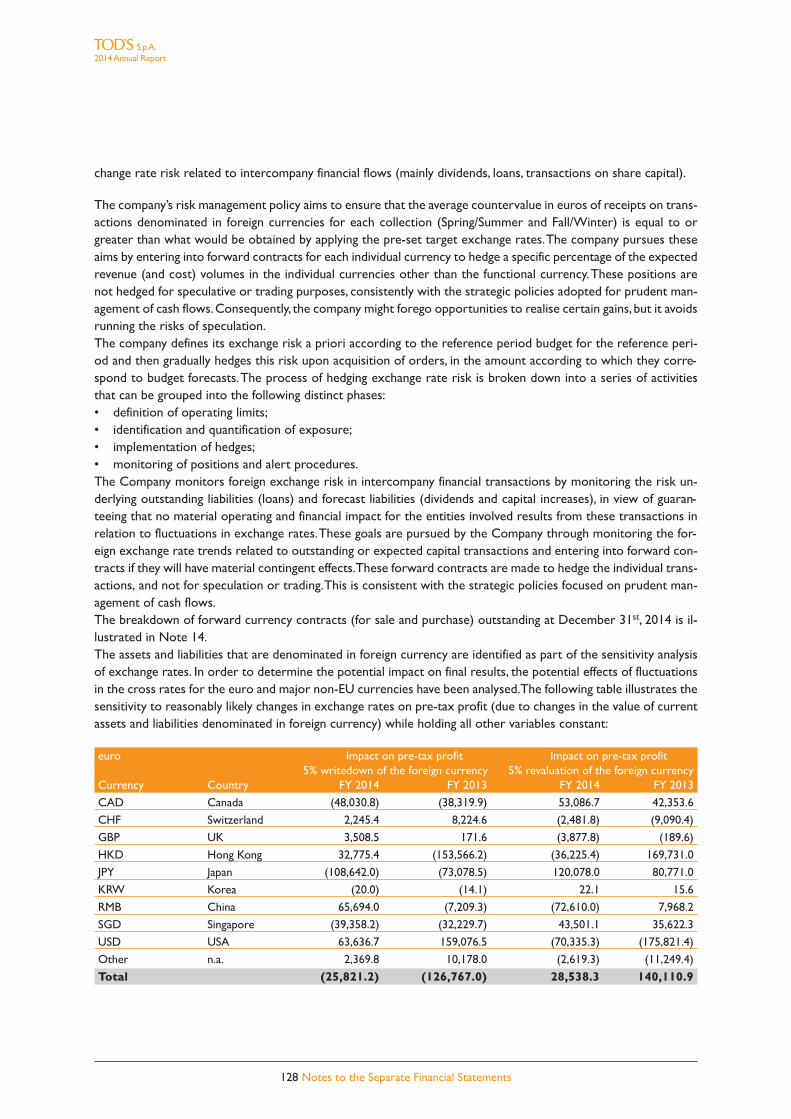
change rate risk related to intercompany financial flows (mainly dividends, loans, transactions on share capital).
The company’s risk management policy aims to ensure that the average countervalue in euros of receipts on trans-actions denominated in foreign currencies for each collection (Spring/Summer and Fall/Winter) is equal to orgreater than what would be obtained by applying the pre-set target exchange rates. The company pursues theseaims by entering into forward contracts for each individual currency to hedge a specific percentage of the expectedrevenue (and cost) volumes in the individual currencies other than the functional currency. These positions arenot hedged for speculative or trading purposes, consistently with the strategic policies adopted for prudent man-agement of cash flows. Consequently, the company might forego opportunities to realise certain gains, but it avoidsrunning the risks of speculation.The company defines its exchange risk a priori according to the reference period budget for the reference peri-od and then gradually hedges this risk upon acquisition of orders, in the amount according to which they corre-spond to budget forecasts. The process of hedging exchange rate risk is broken down into a series of activitiesthat can be grouped into the following distinct phases:• definition of operating limits;• identification and quantification of exposure;• implementation of hedges;• monitoring of positions and alert procedures.The Company monitors foreign exchange risk in intercompany financial transactions by monitoring the risk un-derlying outstanding liabilities (loans) and forecast liabilities (dividends and capital increases), in view of guaran-teeing that no material operating and financial impact for the entities involved results from these transactions inrelation to fluctuations in exchange rates. These goals are pursued by the Company through monitoring the for-eign exchange rate trends related to outstanding or expected capital transactions and entering into forward con-tracts if they will have material contingent effects. These forward contracts are made to hedge the individual trans-actions, and not for speculation or trading. This is consistent with the strategic policies focused on prudent man-agement of cash flows.The breakdown of forward currency contracts (for sale and purchase) outstanding at December 31st, 2014 is il-lustrated in Note 14.The assets and liabilities that are denominated in foreign currency are identified as part of the sensitivity analysisof exchange rates. In order to determine the potential impact on final results, the potential effects of fluctuationsin the cross rates for the euro and major non-EU currencies have been analysed. The following table illustrates thesensitivity to reasonably likely changes in exchange rates on pre-tax profit (due to changes in the value of currentassets and liabilities denominated in foreign currency) while holding all other variables constant:
euro Impact on pre-tax profit Impact on pre-tax profit 5% writedown of the foreign currency 5% revaluation of the foreign currency
Currency Country FY 2014 FY 2013 FY 2014 FY 2013
CAD Canada (48,030.8) (38,319.9) 53,086.7 42,353.6
CHF Switzerland 2,245.4 8,224.6 (2,481.8) (9,090.4)
GBP UK 3,508.5 171.6 (3,877.8) (189.6)
HKD Hong Kong 32,775.4 (153,566.2) (36,225.4) 169,731.0
JPY Japan (108,642.0) (73,078.5) 120,078.0 80,771.0
KRW Korea (20.0) (14.1) 22.1 15.6
RMB China 65,694.0 (7,209.3) (72,610.0) 7,968.2
SGD Singapore (39,358.2) (32,229.7) 43,501.1 35,622.3
USD USA 63,636.7 159,076.5 (70,335.3) (175,821.4)
Other n.a. 2,369.8 10,178.0 (2,619.3) (11,249.4)
Total (25,821.2) (126,767.0) 28,538.3 140,110.9
128 Notes to the Separate Financial Statements
S.p.A.2014 Annual Report

euro 000’s Revaluation/Writedown Impact on Impact on foreign currency pre-tax profit Shareholder’s equity
5% 28.5 (5,909.9)FY 2014
-5% (25.8) 6,532.0
The analysis did not include assets, liabilities and future commercial flows that were not hedged, since fluctuations in ex-change rates impact income in an amount equal to what is recognised in the fair value of adopted hedging instruments.
Interest rate risk. The Company is exposed to interest rate fluctuations, limited to its variable-rate debt in-struments. Interest rate risk is managed in conformity to long-established practice with the aim of cutting downthe risk of interest rate volatility, at the same time pursuing the goal of reducing the financial costs involved to aminimum. As the amounts concerned are not significant (Note 19), there were no hedges of interest rates on ex-isting financial liabilities as of December 31st, 2014. At December 31st, 2014 there were, however, two derivativecontracts in being (interest rate swaps - IRSs), which were entered into on July 23rd, 2014, to hedge the risk ofpossible changes in the interest rates on the financing transaction that has already been mentioned, for a maxi-mum amount of 400 million euros (Note 19). These derivatives protect the Company from the risk of a gener-alised rise in interest rates, swapping the variable rate on the loan (3-months EURIBOR + 110 basis points) for acontractually fixed rate (0.748%, quarterly settled). Considering that no amounts had yet been paid out as atDecember 31st, 2014 in relation to the loan underlying the abovementioned hedging transactions, it should be not-ed that the effects arising from the IRSs in 2014 have been recognized under an equity reserve for cash flow hedge(Note 14).
iv. Categories of measurement at fair valueIn accordance with IFRS 7, the financial instruments carried at fair value have been classified according to a hier-archy of levels that reflects the materiality of the inputs used to estimate their fair value. The following levels havebeen defined:Level 1 – quoted prices obtained on an active market for the measured assets or liabilities;Level 2 – inputs other than the quoted prices indicated hereinabove, which are observable either directly (prices)or indirectly (derived from prices) on the market;Level 3 – inputs that are not based on observable market data.The fair value of derivative financial instruments existing at December 31st 2014 (Note 14) has been classified asLevel 2. There are no other financial instruments measured at fair value. It is reasonable to deem that the fair val-ue of financial assets and liabilities measured at amortised cost, given their nature, does not differ significantly fromtheir carrying amounts.
5. Intangible fixed assets
5.1 Intangible assets with indefinite useful life.These include 137,235 thousand euros for the value of Groupowned brands and goodwill from business combinations for 13,685 thousand euros recognised in accordance withthe acquisition method (IFRS 3). The value of Brands is broken down amongst the various brands owned by theCompany (TOD’S, HOGAN and FAY):
euro 000’s12.31.14 12.31.13
TOD’S 3,741 3,741
HOGAN 80,309 80,309
FAY 53,185 53,185
Total 137,235 137,235
129 Notes to the Separate Financial Statements
S.p.A.2014 Annual Report
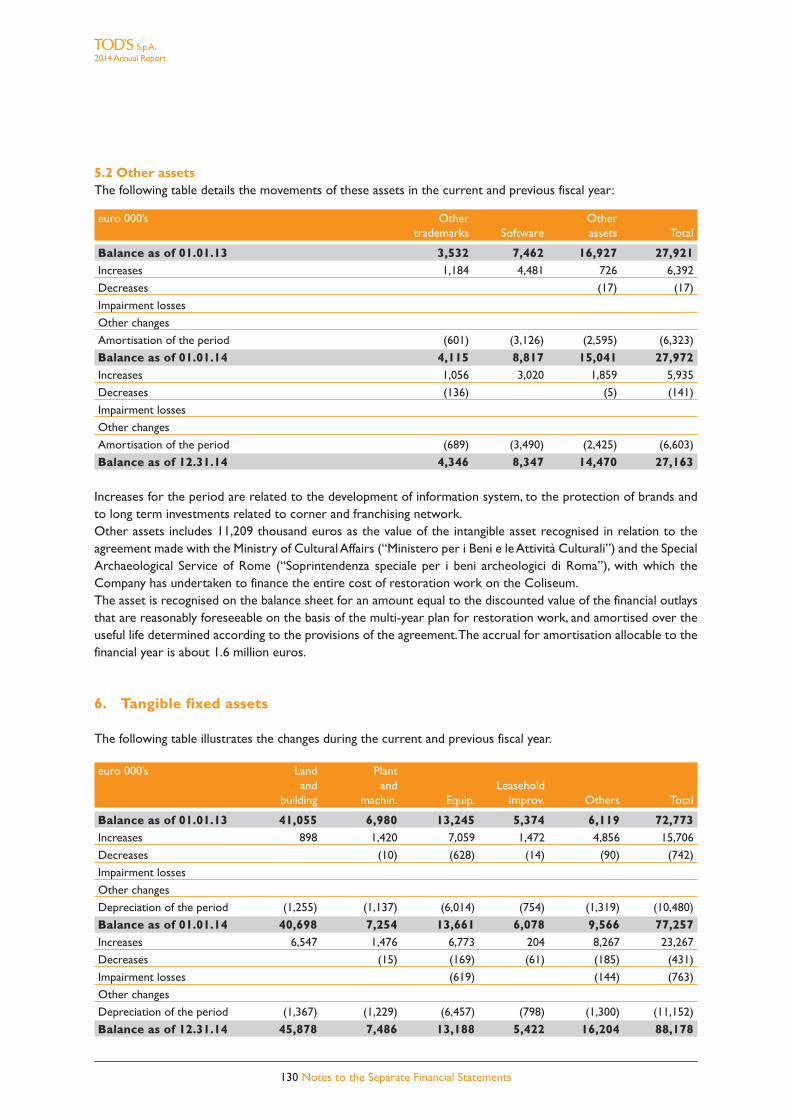
5.2 Other assetsThe following table details the movements of these assets in the current and previous fiscal year:
euro 000’s Other Othertrademarks Software assets Total
Balance as of 01.01.13 3,532 7,462 16,927 27,921Increases 1,184 4,481 726 6,392
Decreases (17) (17)
Impairment losses
Other changes
Amortisation of the period (601) (3,126) (2,595) (6,323)
Balance as of 01.01.14 4,115 8,817 15,041 27,972Increases 1,056 3,020 1,859 5,935
Decreases (136) (5) (141)
Impairment losses
Other changes
Amortisation of the period (689) (3,490) (2,425) (6,603)
Balance as of 12.31.14 4,346 8,347 14,470 27,163
Increases for the period are related to the development of information system, to the protection of brands andto long term investments related to corner and franchising network.Other assets includes 11,209 thousand euros as the value of the intangible asset recognised in relation to theagreement made with the Ministry of Cultural Affairs (“Ministero per i Beni e le Attività Culturali”) and the SpecialArchaeological Service of Rome (“Soprintendenza speciale per i beni archeologici di Roma”), with which theCompany has undertaken to finance the entire cost of restoration work on the Coliseum.The asset is recognised on the balance sheet for an amount equal to the discounted value of the financial outlaysthat are reasonably foreseeable on the basis of the multi-year plan for restoration work, and amortised over theuseful life determined according to the provisions of the agreement. The accrual for amortisation allocable to thefinancial year is about 1.6 million euros.
6. Tangible fixed assets
The following table illustrates the changes during the current and previous fiscal year.
euro 000’s Land Plantand and Leasehold
building machin. Equip. improv. Others Total
Balance as of 01.01.13 41,055 6,980 13,245 5,374 6,119 72,773Increases 898 1,420 7,059 1,472 4,856 15,706
Decreases (10) (628) (14) (90) (742)
Impairment losses
Other changes
Depreciation of the period (1,255) (1,137) (6,014) (754) (1,319) (10,480)
Balance as of 01.01.14 40,698 7,254 13,661 6,078 9,566 77,257Increases 6,547 1,476 6,773 204 8,267 23,267
Decreases (15) (169) (61) (185) (431)
Impairment losses (619) (144) (763)
Other changes
Depreciation of the period (1,367) (1,229) (6,457) (798) (1,300) (11,152)
Balance as of 12.31.14 45,878 7,486 13,188 5,422 16,204 88,178
130 Notes to the Separate Financial Statements
S.p.A.2014 Annual Report

Land and buildings increase is mainly related to the acquisition, through two financial lease agreements, of a new in-dustrial building located next to the headquarter of the Company. Equipments’ increase is mainly related to the in-dustrial tools acquisition for the creation of new collections (lasts and moulds).The increase of the item “Others”, for 7.6 million euros, includes the cost related to the working in progress of anew building located in the headquarter of the Company. Depreciations of the period, related to properties plantand equipments are 11.1 million euros while 0.8 million euros are related to write offs, reflected in the income state-ments during the period, of fixed assets no longer used.
7. Impairment losses
The recoverability of the residual value of intangible assets with an indefinite and Equity Investments in subsidiaries(“Assets”) was determined to ensure that assets with a value higher than the recoverable value were not recog-nised on the financial statements, which refers to their “value in use.” The criterion used to determine “value inuse” is based on the provisions of IAS 36, and is based on the current value of expected future cash flows (dis-counted cash-flow analysis - DCF), which is presumed to derive from the continual use and disposal of an asset atthe end of its useful life, discounted at a net discounting rate (net of taxes) that reflects current market rates forborrowing money and the specific risk associated with the individual cash generating unit.The recoverability of Assets and equity investments in subsidiaries was verified by comparing the net book valuewith the recoverable value (value in use). The value in use is represented by the discounted value of future cashflows that are expected from Assets and equity investments and by the terminal value attributable to them. In con-nection with the recoverability of Assets, the Company has identified only one CGU and it has been tested thenet invested capital.The discounted cash flow analysis was carried out by using the FY 2015 budget as its basis. That budget was preparedand approved by the Board of Directors on the assumption that the Company would be a going concern for the fore-seeable future: the Board of Directors first assessed the methods and assumptions used in developing the model.In particular:i. The medium-term projection of budget figures for FY 2015 was carried out on a time horizon of further 4years, using an average rate of sales growth of 5%, a constant EBITDA margin and a constant tax rate of 33.1%.The assumptions related to the sales growth in the middle term reflect reasonable estimates of growth which con-sider even the development trend of the whole luxury sector in the foreseeable future;ii. The terminal value was determined as perpetuity, using, for future forecasts, a prudential long term growthrate of 2% in line with the macro-economics estimates performed by the International Monetary Fund.iii. To determine the “value in use,” a WACC, net of taxes, of 8.59% was used (the WACC rate used at December31st, 2013 was 9.25%), determined by referring to the discounting rates used by a series of international analystsin financial reports on the TOD’S Group.The analyses carried out on the recoverability of Company assets (including 137.2 million euros represented byproprietary brands and 13.7 million by goodwill from business combinations) and equity investments in subsidiaries(worth 174.4 million euros at December 31st, 2014) did not show any impairment losses.The sensitivity analysis performed on the impairment test in accordance with IAS 36, in order to reveal the ef-fects produced on the “value in use” by a reasonable change in the basic assumptions (WACC, growth rates,EBITDA margin) and determination of the terminal value of brands (disposal value), did not reveal an appreciableimpact on determination of the “value in use” and its coverage. Given the significant value assumed by the cover,it would be necessary to make unrealistic base assumptions to render the “value in use” equal to the book valueof tested assets (the break-even hypothesis). Finally, in accordance with IAS 36, it’s been performed an estimate ofthe recoverable amount of brands using the royalty method with the same assumptions indicated above in termsof growth rates, tax rate, WACC and terminal value. From such analysis, no impairment indicators arose, consid-ered that the brands recoverable value is higher than their book value.
131 Notes to the Separate Financial Statements
S.p.A.2014 Annual Report
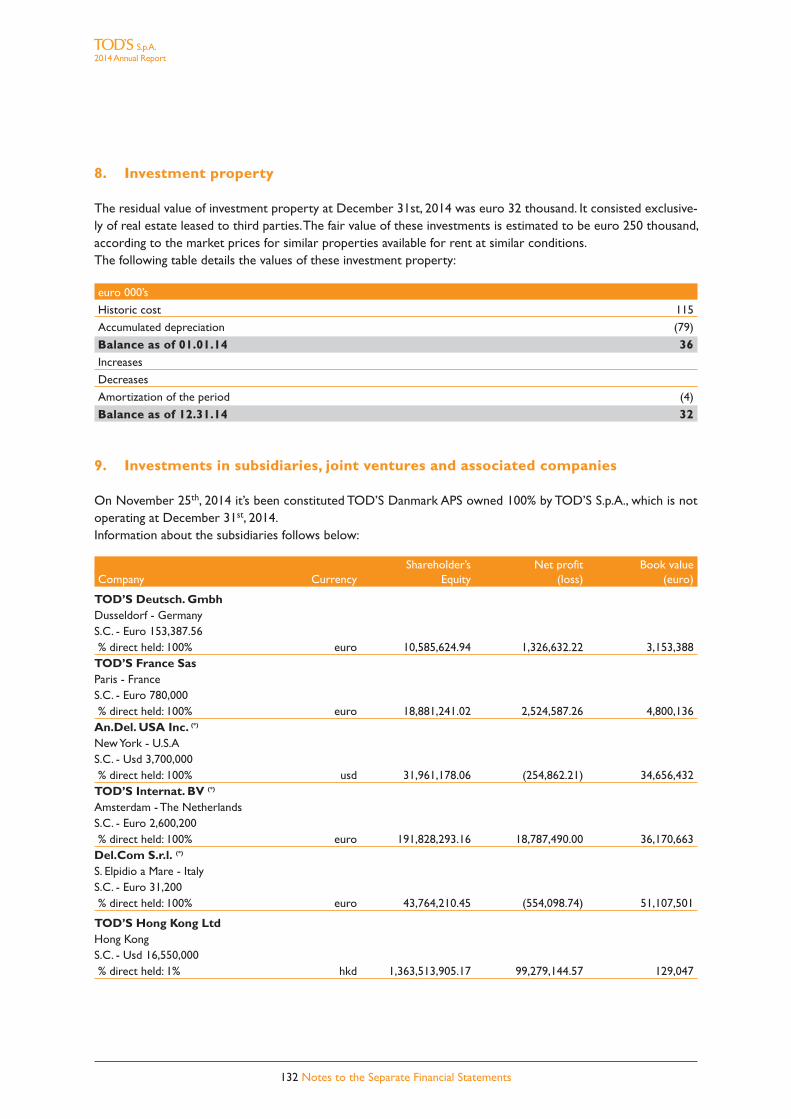
8. Investment property
The residual value of investment property at December 31st, 2014 was euro 32 thousand. It consisted exclusive-ly of real estate leased to third parties. The fair value of these investments is estimated to be euro 250 thousand,according to the market prices for similar properties available for rent at similar conditions.The following table details the values of these investment property:
euro 000’s
Historic cost 115
Accumulated depreciation (79)
Balance as of 01.01.14 36Increases
Decreases
Amortization of the period (4)
Balance as of 12.31.14 32
9. Investments in subsidiaries, joint ventures and associated companies
On November 25th, 2014 it’s been constituted TOD’S Danmark APS owned 100% by TOD’S S.p.A., which is notoperating at December 31st, 2014.Information about the subsidiaries follows below:
Shareholder’s Net profit Book valueCompany Currency Equity (loss) (euro)
TOD’S Deutsch. GmbhDusseldorf - GermanyS.C. - Euro 153,387.56% direct held: 100% euro 10,585,624.94 1,326,632.22 3,153,388
TOD’S France SasParis - FranceS.C. - Euro 780,000% direct held: 100% euro 18,881,241.02 2,524,587.26 4,800,136
An.Del. USA Inc. (*)
New York - U.S.AS.C. - Usd 3,700,000% direct held: 100% usd 31,961,178.06 (254,862.21) 34,656,432
TOD’S Internat. BV (*)
Amsterdam - The NetherlandsS.C. - Euro 2,600,200% direct held: 100% euro 191,828,293.16 18,787,490.00 36,170,663
Del.Com S.r.l. (*)
S. Elpidio a Mare - ItalyS.C. - Euro 31,200% direct held: 100% euro 43,764,210.45 (554,098.74) 51,107,501
TOD’S Hong Kong LtdHong KongS.C. - Usd 16,550,000% direct held: 1% hkd 1,363,513,905.17 99,279,144.57 129,047
132 Notes to the Separate Financial Statements
S.p.A.2014 Annual Report
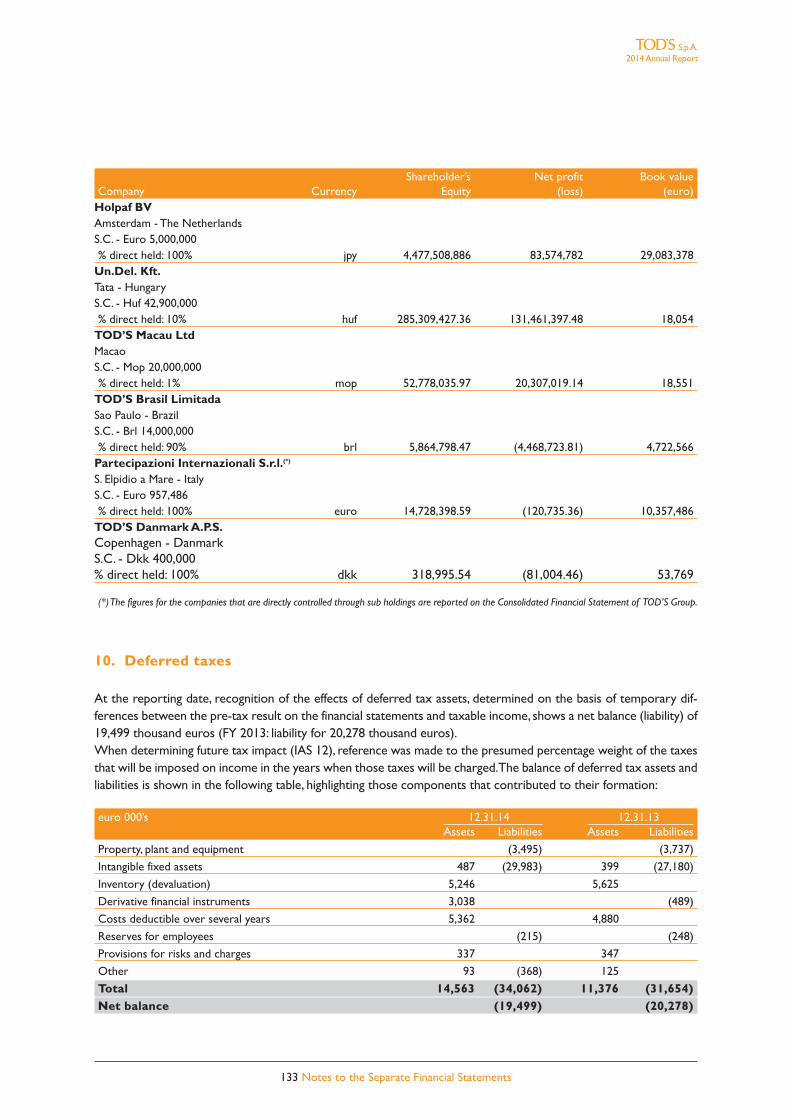
Shareholder’s Net profit Book valueCompany Currency Equity (loss) (euro)
Holpaf BVAmsterdam - The NetherlandsS.C. - Euro 5,000,000% direct held: 100% jpy 4,477,508,886 83,574,782 29,083,378
Un.Del. Kft.Tata - HungaryS.C. - Huf 42,900,000% direct held: 10% huf 285,309,427.36 131,461,397.48 18,054
TOD’S Macau LtdMacaoS.C. - Mop 20,000,000% direct held: 1% mop 52,778,035.97 20,307,019.14 18,551
TOD’S Brasil LimitadaSao Paulo - BrazilS.C. - Brl 14,000,000% direct held: 90% brl 5,864,798.47 (4,468,723.81) 4,722,566
Partecipazioni Internazionali S.r.l.(*)
S. Elpidio a Mare - ItalyS.C. - Euro 957,486% direct held: 100% euro 14,728,398.59 (120,735.36) 10,357,486
TOD’S Danmark A.P.S.Copenhagen - DanmarkS.C. - Dkk 400,000% direct held: 100% dkk 318,995.54 (81,004.46) 53,769
(*) The figures for the companies that are directly controlled through sub holdings are reported on the Consolidated Financial Statement of TOD’S Group.
10. Deferred taxes
At the reporting date, recognition of the effects of deferred tax assets, determined on the basis of temporary dif-ferences between the pre-tax result on the financial statements and taxable income, shows a net balance (liability) of19,499 thousand euros (FY 2013: liability for 20,278 thousand euros).When determining future tax impact (IAS 12), reference was made to the presumed percentage weight of the taxesthat will be imposed on income in the years when those taxes will be charged. The balance of deferred tax assets andliabilities is shown in the following table, highlighting those components that contributed to their formation:
euro 000’s 12.31.14 12.31.13Assets Liabilities Assets Liabilities
Property, plant and equipment (3,495) (3,737)
Intangible fixed assets 487 (29,983) 399 (27,180)
Inventory (devaluation) 5,246 5,625
Derivative financial instruments 3,038 (489)
Costs deductible over several years 5,362 4,880
Reserves for employees (215) (248)
Provisions for risks and charges 337 347
Other 93 (368) 125
Total 14,563 (34,062) 11,376 (31,654)Net balance (19,499) (20,278)
133 Notes to the Separate Financial Statements
S.p.A.2014 Annual Report

11. Other non current assets
The item Other non current assets is mainly related to receivables versus tax authorities to be refunded.
12. Inventories
The following table shows the book value of the inventories:
euro 000’s 12.31.14 12.31.13 Change
Raw materials 64,066 54,707 9,360
Semi-finished goods 9,092 7,920 1,172
Finished products 123,246 110,971 12,275
Write-downs (16,617) (17,814) 1,197
Total 179,788 155,784 24,004
The allowance for inventory write-downs reasonably reflects the technical and stylistic obsolescence of theGroup’s inventories at December 31st, 2014. During the year, inventory write-downs has been used for 2.8 mil-lion euros; the amount accrued during FY 2014 totalled 1.6 million euros (4.6 million euros in 2013).
13. Trade receivables and other current assets
13.1 Trade receivables
euro 000’s12.31.14 12.31.13 Change
Third parties 83,006 81,449 1,557
Subsidiaries 119,326 93,338 25,989
Allowances for doubtful accounts (5,364) (5,871) 507
Net trade receivables 196,968 168,916 28,052
Receivables from third parties. These represent the credit exposure stemming from sales made through thewholesale channel.
Receivables from subsidiaries. They include the Company’s receivables from Group entities and stem primarilyfrom commercial transactions and, to a lesser extent, provision of services.
Allowances for bad debts. The amount of the adjustment to the face value of the receivables represents thebest estimate of the loss determined against the specific and generic risk of inability to collect identified in the re-ceivables recognised on the balance sheet. The changes in the allowances for bad debts are illustrated as follows:
euro 000’s12.31.14 12.31.13
Balance as of 01.01.14 5,871 5,150Increase 800 2,100
Decrease (1,307) (1,379)
Balance as of 12.31.14 5,364 5,871
13.2 Tax receivables. Totalling 16,691 thousand euros (FY 2013: 10,784 thousand euros), they are mainly rep-resented by VAT receivables, for 10,082 thousand euros and by the positive net balance resulting from the corporatetax instalments paid during the year in respect of the corporate tax final balance resulting at December 31st, 2014.
134 Notes to the Separate Financial Statements
S.p.A.2014 Annual Report
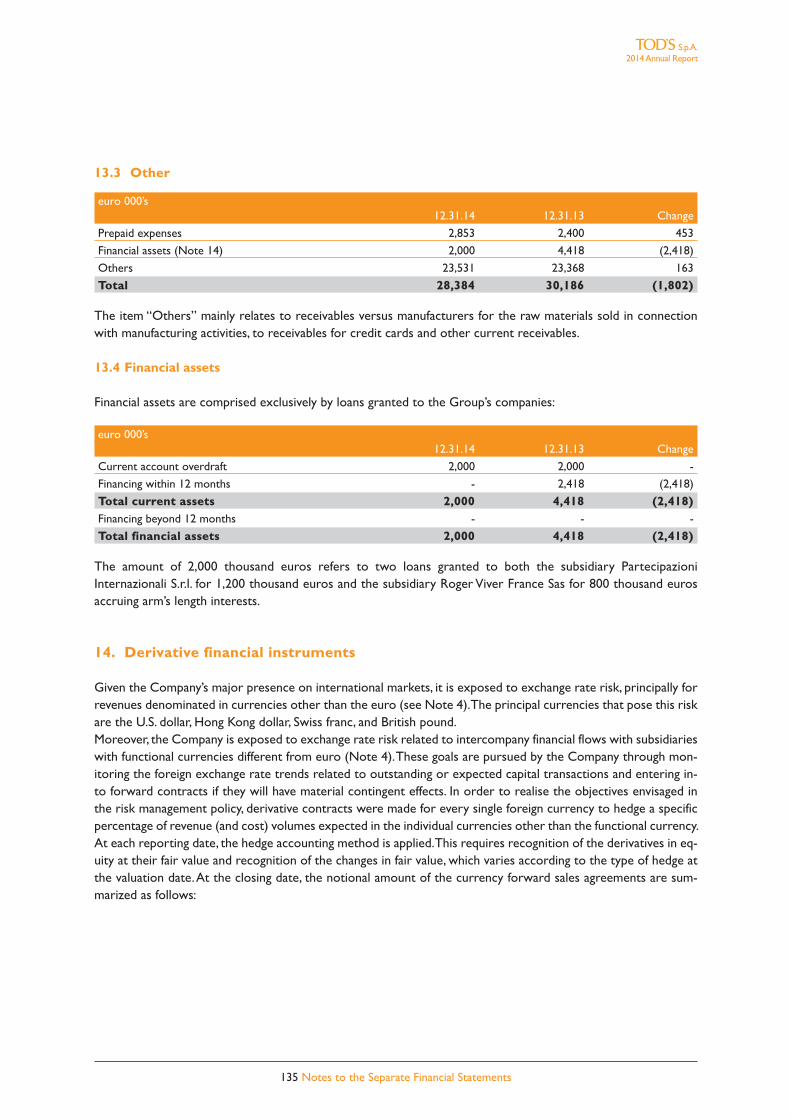
135 Notes to the Separate Financial Statements
13.3 Other
euro 000’s12.31.14 12.31.13 Change
Prepaid expenses 2,853 2,400 453
Financial assets (Note 14) 2,000 4,418 (2,418)
Others 23,531 23,368 163
Total 28,384 30,186 (1,802)
The item “Others” mainly relates to receivables versus manufacturers for the raw materials sold in connectionwith manufacturing activities, to receivables for credit cards and other current receivables.
13.4 Financial assets
Financial assets are comprised exclusively by loans granted to the Group’s companies:
euro 000’s12.31.14 12.31.13 Change
Current account overdraft 2,000 2,000 -
Financing within 12 months - 2,418 (2,418)
Total current assets 2,000 4,418 (2,418)Financing beyond 12 months - - -
Total financial assets 2,000 4,418 (2,418)
The amount of 2,000 thousand euros refers to two loans granted to both the subsidiary PartecipazioniInternazionali S.r.l. for 1,200 thousand euros and the subsidiary Roger Viver France Sas for 800 thousand eurosaccruing arm’s length interests.
14. Derivative financial instruments
Given the Company’s major presence on international markets, it is exposed to exchange rate risk, principally forrevenues denominated in currencies other than the euro (see Note 4). The principal currencies that pose this riskare the U.S. dollar, Hong Kong dollar, Swiss franc, and British pound.Moreover, the Company is exposed to exchange rate risk related to intercompany financial flows with subsidiarieswith functional currencies different from euro (Note 4). These goals are pursued by the Company through mon-itoring the foreign exchange rate trends related to outstanding or expected capital transactions and entering in-to forward contracts if they will have material contingent effects. In order to realise the objectives envisaged inthe risk management policy, derivative contracts were made for every single foreign currency to hedge a specificpercentage of revenue (and cost) volumes expected in the individual currencies other than the functional currency.At each reporting date, the hedge accounting method is applied. This requires recognition of the derivatives in eq-uity at their fair value and recognition of the changes in fair value, which varies according to the type of hedge atthe valuation date. At the closing date, the notional amount of the currency forward sales agreements are sum-marized as follows:
S.p.A.2014 Annual Report
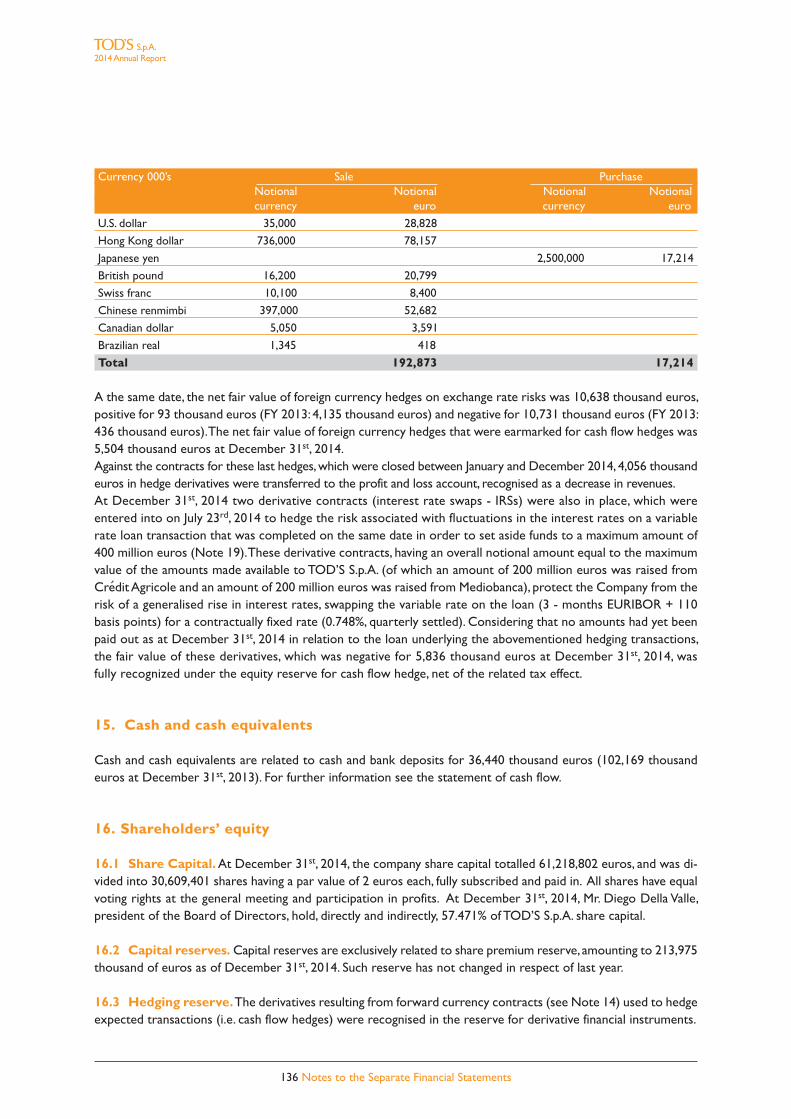
136 Notes to the Separate Financial Statements
S.p.A.2014 Annual Report
Currency 000’s Sale PurchaseNotional Notional Notional Notionalcurrency euro currency euro
U.S. dollar 35,000 28,828
Hong Kong dollar 736,000 78,157
Japanese yen 2,500,000 17,214
British pound 16,200 20,799
Swiss franc 10,100 8,400
Chinese renmimbi 397,000 52,682
Canadian dollar 5,050 3,591
Brazilian real 1,345 418
Total 192,873 17,214
A the same date, the net fair value of foreign currency hedges on exchange rate risks was 10,638 thousand euros,positive for 93 thousand euros (FY 2013: 4,135 thousand euros) and negative for 10,731 thousand euros (FY 2013:436 thousand euros). The net fair value of foreign currency hedges that were earmarked for cash flow hedges was5,504 thousand euros at December 31st, 2014.Against the contracts for these last hedges, which were closed between January and December 2014, 4,056 thousandeuros in hedge derivatives were transferred to the profit and loss account, recognised as a decrease in revenues.At December 31st, 2014 two derivative contracts (interest rate swaps - IRSs) were also in place, which wereentered into on July 23rd, 2014 to hedge the risk associated with fluctuations in the interest rates on a variablerate loan transaction that was completed on the same date in order to set aside funds to a maximum amount of400 million euros (Note 19). These derivative contracts, having an overall notional amount equal to the maximumvalue of the amounts made available to TOD’S S.p.A. (of which an amount of 200 million euros was raised fromCredit Agricole and an amount of 200 million euros was raised from Mediobanca), protect the Company from therisk of a generalised rise in interest rates, swapping the variable rate on the loan (3 - months EURIBOR + 110basis points) for a contractually fixed rate (0.748%, quarterly settled). Considering that no amounts had yet beenpaid out as at December 31st, 2014 in relation to the loan underlying the abovementioned hedging transactions,the fair value of these derivatives, which was negative for 5,836 thousand euros at December 31st, 2014, wasfully recognized under the equity reserve for cash flow hedge, net of the related tax effect.
15. Cash and cash equivalents
Cash and cash equivalents are related to cash and bank deposits for 36,440 thousand euros (102,169 thousandeuros at December 31st, 2013). For further information see the statement of cash flow.
16. Shareholders’ equity
16.1 Share Capital. At December 31st, 2014, the company share capital totalled 61,218,802 euros, and was di-vided into 30,609,401 shares having a par value of 2 euros each, fully subscribed and paid in. All shares have equalvoting rights at the general meeting and participation in profits. At December 31st, 2014, Mr. Diego Della Valle,president of the Board of Directors, hold, directly and indirectly, 57.471% of TOD’S S.p.A. share capital.
16.2 Capital reserves. Capital reserves are exclusively related to share premium reserve, amounting to 213,975thousand of euros as of December 31st, 2014. Such reserve has not changed in respect of last year.
16.3 Hedging reserve.The derivatives resulting from forward currency contracts (see Note 14) used to hedgeexpected transactions (i.e. cash flow hedges) were recognised in the reserve for derivative financial instruments.
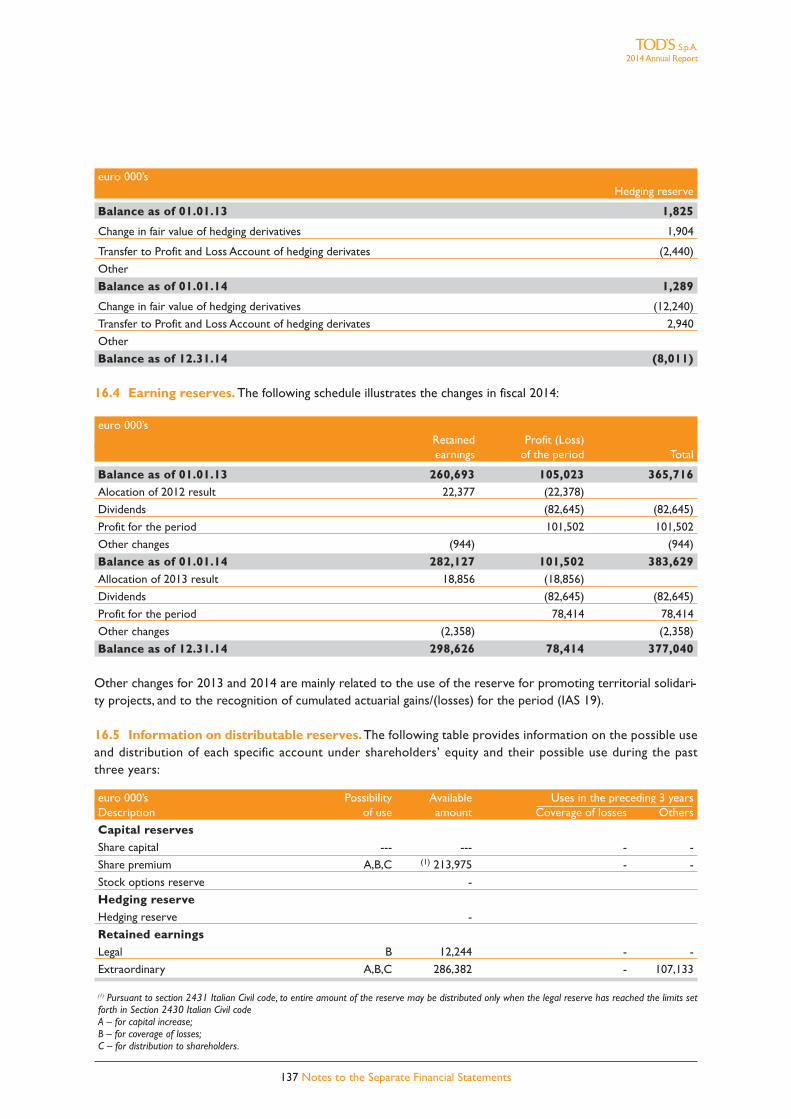
euro 000’sHedging reserve
Balance as of 01.01.13  1,825
Change in fair value of hedging derivatives 1,904
Transfer to Profit and Loss Account of hedging derivates (2,440)
Other
Balance as of 01.01.14 1,289
Change in fair value of hedging derivatives (12,240)
Transfer to Profit and Loss Account of hedging derivates 2,940
Other
Balance as of 12.31.14 (8,011)
16.4 Earning reserves. The following schedule illustrates the changes in fiscal 2014:
euro 000’sRetained Profit (Loss)earnings of the period Total
Balance as of 01.01.13 260,693 105,023 365,716Alocation of 2012 result 22,377 (22,378)
Dividends (82,645) (82,645)
Profit for the period 101,502 101,502
Other changes (944) (944)
Balance as of 01.01.14 282,127 101,502 383,629Allocation of 2013 result 18,856 (18,856)
Dividends (82,645) (82,645)
Profit for the period 78,414 78,414
Other changes (2,358) (2,358)
Balance as of 12.31.14 298,626 78,414 377,040
Other changes for 2013 and 2014 are mainly related to the use of the reserve for promoting territorial solidari-ty projects, and to the recognition of cumulated actuarial gains/(losses) for the period (IAS 19).
16.5 Information on distributable reserves.The following table provides information on the possible useand distribution of each specific account under shareholders’ equity and their possible use during the pastthree years:
euro 000’s Possibility Available Uses in the preceding 3 yearsDescription of use amount Coverage of losses Others
Capital reservesShare capital --- --- - -
Share premium A,B,C (1) 213,975 - -
Stock options reserve -
Hedging reserveHedging reserve -
Retained earningsLegal B 12,244 - -
Extraordinary A,B,C 286,382 - 107,133
(1) Pursuant to section 2431 Italian Civil code, to entire amount of the reserve may be distributed only when the legal reserve has reached the limits setforth in Section 2430 Italian Civil codeA – for capital increase;B – for coverage of losses;C – for distribution to shareholders.
137 Notes to the Separate Financial Statements
S.p.A.2014 Annual Report
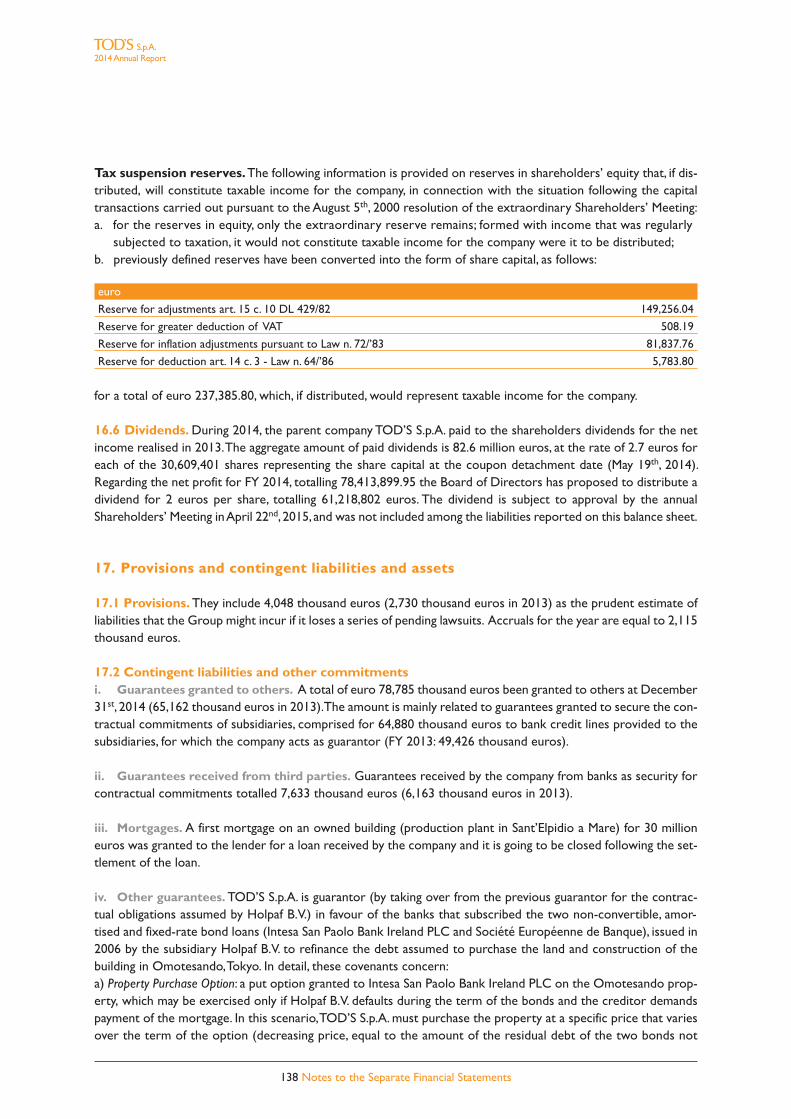
Tax suspension reserves.The following information is provided on reserves in shareholders’ equity that, if dis-tributed, will constitute taxable income for the company, in connection with the situation following the capitaltransactions carried out pursuant to the August 5th, 2000 resolution of the extraordinary Shareholders’ Meeting:a. for the reserves in equity, only the extraordinary reserve remains; formed with income that was regularly
subjected to taxation, it would not constitute taxable income for the company were it to be distributed;b. previously defined reserves have been converted into the form of share capital, as follows:
euro
Reserve for adjustments art. 15 c. 10 DL 429/82 149,256.04
Reserve for greater deduction of VAT 508.19
Reserve for inflation adjustments pursuant to Law n. 72/’83 81,837.76
Reserve for deduction art. 14 c. 3 - Law n. 64/’86 5,783.80
for a total of euro 237,385.80, which, if distributed, would represent taxable income for the company.
16.6 Dividends. During 2014, the parent company TOD’S S.p.A. paid to the shareholders dividends for the netincome realised in 2013. The aggregate amount of paid dividends is 82.6 million euros, at the rate of 2.7 euros foreach of the 30,609,401 shares representing the share capital at the coupon detachment date (May 19th, 2014).Regarding the net profit for FY 2014, totalling 78,413,899.95 the Board of Directors has proposed to distribute adividend for 2 euros per share, totalling 61,218,802 euros. The dividend is subject to approval by the annualShareholders’ Meeting in April 22nd, 2015, and was not included among the liabilities reported on this balance sheet.
17. Provisions and contingent liabilities and assets
17.1 Provisions. They include 4,048 thousand euros (2,730 thousand euros in 2013) as the prudent estimate ofliabilities that the Group might incur if it loses a series of pending lawsuits. Accruals for the year are equal to 2,115thousand euros.
17.2 Contingent liabilities and other commitmentsi. Guarantees granted to others. A total of euro 78,785 thousand euros been granted to others at December31st, 2014 (65,162 thousand euros in 2013). The amount is mainly related to guarantees granted to secure the con-tractual commitments of subsidiaries, comprised for 64,880 thousand euros to bank credit lines provided to thesubsidiaries, for which the company acts as guarantor (FY 2013: 49,426 thousand euros).
ii. Guarantees received from third parties. Guarantees received by the company from banks as security forcontractual commitments totalled 7,633 thousand euros (6,163 thousand euros in 2013).
iii. Mortgages. A first mortgage on an owned building (production plant in Sant’Elpidio a Mare) for 30 millioneuros was granted to the lender for a loan received by the company and it is going to be closed following the set-tlement of the loan.
iv. Other guarantees. TOD’S S.p.A. is guarantor (by taking over from the previous guarantor for the contrac-tual obligations assumed by Holpaf B.V.) in favour of the banks that subscribed the two non-convertible, amor-tised and fixed-rate bond loans (Intesa San Paolo Bank Ireland PLC and Société Européenne de Banque), issued in2006 by the subsidiary Holpaf B.V. to refinance the debt assumed to purchase the land and construction of thebuilding in Omotesando, Tokyo. In detail, these covenants concern:a) Property Purchase Option: a put option granted to Intesa San Paolo Bank Ireland PLC on the Omotesando prop-erty, which may be exercised only if Holpaf B.V. defaults during the term of the bonds and the creditor demandspayment of the mortgage. In this scenario, TOD’S S.p.A. must purchase the property at a specific price that variesover the term of the option (decreasing price, equal to the amount of the residual debt of the two bonds not
138 Notes to the Separate Financial Statements
S.p.A.2014 Annual Report

repaid by Holpaf B.V. at the time of default).b) Earthquake Indemnity Letter: TOD’S S.p.A. has undertaken to hold harmless the rights to repayment of the bondsheld by Intesa San Paolo Bank Ireland PLC and Société Européenne de Banque even in the event of damage or de-struction of the property in an earthquake.c) All Risks Indemnity Letter: TOD’S S.p.A. has undertaken to hold harmless the rights to repayment of the bondsheld by Intesa San Paolo Bank Ireland PLC and Société Européenne de Banque even in the event of damage or de-struction of the property due to any event.d) Pledge on the fire insurance policy: in the event of loss due to building fire, any reimbursement by the insurancecompany constitutes a pledge in guarantee of the bonds whose value has not yet been repaid to Intesa SanpaoloBank Ireland PLC and Société Européenne de Banque.At December 31st 2014, the residual face value of the principal for the two bonds amounted to JPY 2,939 million(20.2 million euros).
17.3 Derivative financial instruments. For a detailed analysis of derivative financial instruments, used for thecoverage of transaction in foreign currency, please see Note 14. All derivative contracts made with leading finan-cial institutions will expire in 2015. Furthermore, the Company entered into two derivative contracts to hedgethe risk associated with fluctuations in the interest rates on a variable rate loan agreement entered into with twoleading banks (Notes 14 and 19). The effects of these derivative contracts will mature during the set term of theunderlying loan agreement.
17.4 Operating lease agreements. The operating leases entered into by the Company are for use of proper-ties used to conduct its operating activities (offices, production plants). The amount of lease instalments payableafter the reporting date pursuant to these agreements is as follows:
euro millions2014 2013
2014 6.2
2015 6.5 6.3
2016 5.9 5.8
2017 4.8 4.6
2018 3.4 3.3
2019 2.4
Over 5 years 6.8 9.0
Total 29.7 35.4
Operating lease instalments, included in the item Costs of use of third party assets, totalled euros 7.5 million infiscal year 2014 (FY 2013: 7.3 million euros).
18. Employee benefits
Following the statutory amendments introduced beginning January 1st, 2007 all amounts for employee severanceindemnities (“TFR” a deferred benefit plan in favor of company) accrued after that date are covered by the rulesapplicable to defined contribution plans (IAS 19). These no longer require actuarial calculation and discountingprocesses, since all of the business’s obligation to employees have ceased2.The main actuarial assumptions used for the valuation are summarized below:
139 Notes to the Separate Financial Statements
S.p.A.2014 Annual Report
(2)The statutory amendment envisaged that for firms with more than 50 employees, the employee severance indemnities accrued from January 1st, 2007had to be allocated to supplemental retirement plans (pension funds) or, alternatively, to a Treasury Fund set up at the INPS (Italian National Social SecurityInstitute). Since all obligations of firms towards their employees ceased starting on January 1st, 2007 all accrued employee severance indemnities are coveredby the rules governing defined contribution plans for the liability accrued from such date.

• Discounting rate: 1.49%
It is related to the average yield curve from IBOXX Eurozone Corporates AA of December 2014.
• Inflation rate: 0.6% for the year 2015, 1.2% for the year 2016, 1.50% for the year 2017 and 2018, 2% for the year 2019 on.
• TFR incremental rate: 1.950% for the year 2015, 2.4% for the year 2016, 2.625% for the year 2017 and
2018, 3% for the year 2019 on.
The table below shows the variation of the liability occurred in 2014:
euro 000’sYear 2014 Year 2013
Opening balance 7,504 8,271Service costs
Interest costs 244 100
Benefits paid (343) (336)
Actuarial (gains)/losses  1,018 (514)
Other  (13) (17)
Closing balance 8,409 7,504
19. Financial liabilities
euro 000’s12.31.14 12.31.13 Change
Current account overdrafts
Financing 3,418 1,821 1,597
Total 3,418 1,821 1,597
The entire exposure to the bank system is related to two financial lease agreements in which TOD’S S.p.A. got inon March 2014 in order to purchase a new industrial building located next to the headquarter of the Company.
euro 000’s12.31.14 12.31.13
2014 1,821
2015 219
2016 228
2017 238
2018 248
2019 259
Over 5 years 2,225
Total 3,418 1,821
The financial liability related to the above mentioned lease agreements have been initially recognized at fair value.Moreover, it should be noted that on July 23rd, 2014 TOD’S S.p.A. entered into a variable rate loan agreement withtwo leading banks, which was aimed at setting aside funds for a maximum amount of 400 million euros.The funds will remain available for a period of eighteen months from the date of the execution of the agreement,during which the Company may require the disbursement of the loan in one or more than one tranche at the
140 Notes to the Separate Financial Statements
S.p.A.2014 Annual Report
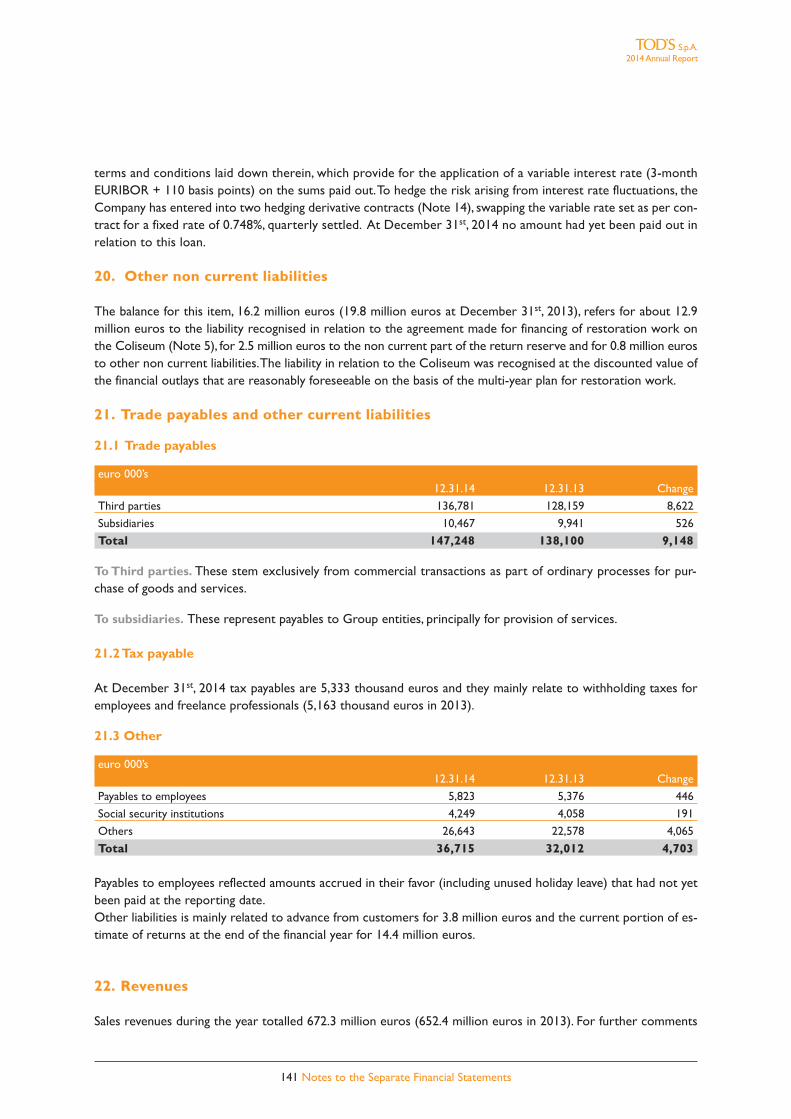
terms and conditions laid down therein, which provide for the application of a variable interest rate (3-monthEURIBOR + 110 basis points) on the sums paid out. To hedge the risk arising from interest rate fluctuations, theCompany has entered into two hedging derivative contracts (Note 14), swapping the variable rate set as per con-tract for a fixed rate of 0.748%, quarterly settled. At December 31st, 2014 no amount had yet been paid out inrelation to this loan.
20. Other non current liabilities
The balance for this item, 16.2 million euros (19.8 million euros at December 31st, 2013), refers for about 12.9million euros to the liability recognised in relation to the agreement made for financing of restoration work onthe Coliseum (Note 5), for 2.5 million euros to the non current part of the return reserve and for 0.8 million eurosto other non current liabilities. The liability in relation to the Coliseum was recognised at the discounted value ofthe financial outlays that are reasonably foreseeable on the basis of the multi-year plan for restoration work.
21. Trade payables and other current liabilities
21.1 Trade payables
euro 000’s12.31.14 12.31.13 Change
Third parties 136,781 128,159 8,622
Subsidiaries 10,467 9,941 526
Total 147,248 138,100 9,148
To Third parties. These stem exclusively from commercial transactions as part of ordinary processes for pur-chase of goods and services.
To subsidiaries. These represent payables to Group entities, principally for provision of services.
21.2 Tax payable
At December 31st, 2014 tax payables are 5,333 thousand euros and they mainly relate to withholding taxes foremployees and freelance professionals (5,163 thousand euros in 2013).
21.3 Other
euro 000’s12.31.14 12.31.13 Change
Payables to employees 5,823 5,376 446
Social security institutions 4,249 4,058 191
Others 26,643 22,578 4,065
Total 36,715 32,012 4,703
Payables to employees reflected amounts accrued in their favor (including unused holiday leave) that had not yetbeen paid at the reporting date.Other liabilities is mainly related to advance from customers for 3.8 million euros and the current portion of es-timate of returns at the end of the financial year for 14.4 million euros.
22. Revenues
Sales revenues during the year totalled 672.3 million euros (652.4 million euros in 2013). For further comments
141 Notes to the Separate Financial Statements
S.p.A.2014 Annual Report

on sales revenues see the report on operations.The item “Other income” amounts 7.4 million euros (12.7 million euros in 2013) and it mainly includes activeroyalties and insurance reimbursements.
23. Personnel costs
The personnel costs incurred by the Group in FY 2014 as compared with those for FY 2013 are illustrated as follows:
euro 000’s % on revenuesYear 2014 Year 2013 Change 2014 2013
Wages and salaries 57,479 55,390 2,089 8.5 8.5
Social security contribution 17,829 16,827 1,002 2.7 2.6
Employee sev. indemn. 3,708 3,531 177 0.6 0.5
Total 79,016 75,748 3,268 11.8 11.6
The following table illustrates the breakdown of the Group’s employees by category:
12.31.14 12.31.13 Aver. 14 Aver. 13
Executives 39 40 40 39
White-collar Employees 837 779 833 791
Blue-collar Employees 858 867 856 865
Total 1,734 1,686 1,729 1,695
24. Financial income and expenses
The breakdown of financial income and expenses in fiscal FY 2014 is as follows:
euro 000’sYear 2014 Year 2013 Change
IncomeInterest income on current account 584 1,305 (720)
Foreign exchange gains 13,386 8,887 4,499
Other 296 314 (18)
Total income 14,267 10,506 3,761
ExpensesInterest on medium-long term financing (8) (18) 10
Foreign exchange losses (12,838) (10,557) (2,280)
Other (1,341) (489) (852)
Total expenses (14,187) (11,064) (3,123)Total net income and expenses 80 (558) 638
25. Income from subsidiaries
During the year, the Company received dividends for 57 thousand euros from the subsidiaries.
142 Notes to the Separate Financial Statements
S.p.A.2014 Annual Report
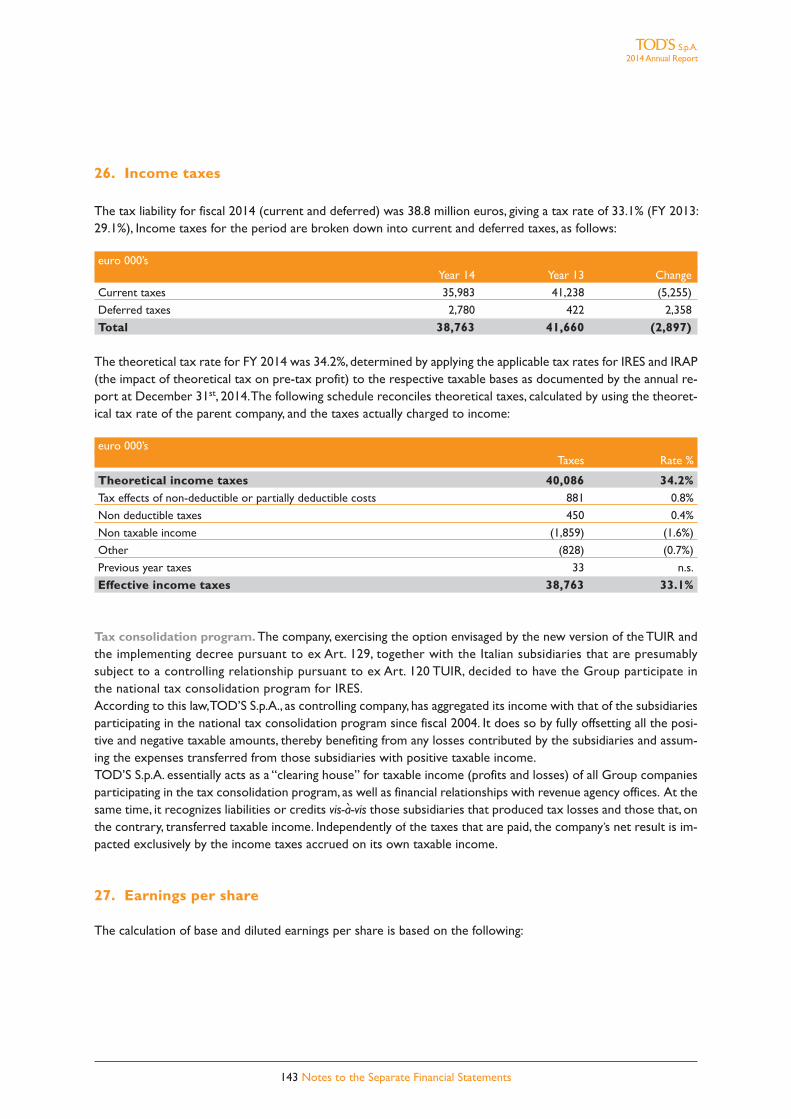
26. Income taxes
The tax liability for fiscal 2014 (current and deferred) was 38.8 million euros, giving a tax rate of 33.1% (FY 2013:29.1%), Income taxes for the period are broken down into current and deferred taxes, as follows:
euro 000’sYear 14 Year 13 Change
Current taxes 35,983 41,238 (5,255)
Deferred taxes 2,780 422 2,358
Total 38,763 41,660 (2,897)
The theoretical tax rate for FY 2014 was 34.2%, determined by applying the applicable tax rates for IRES and IRAP(the impact of theoretical tax on pre-tax profit) to the respective taxable bases as documented by the annual re-port at December 31st, 2014. The following schedule reconciles theoretical taxes, calculated by using the theoret-ical tax rate of the parent company, and the taxes actually charged to income:
euro 000’sTaxes Rate %
Theoretical income taxes 40,086 34.2%Tax effects of non-deductible or partially deductible costs 881 0.8%
Non deductible taxes 450 0.4%
Non taxable income (1,859) (1.6%)
Other (828) (0.7%)
Previous year taxes 33 n.s.
Effective income taxes 38,763 33.1%
Tax consolidation program. The company, exercising the option envisaged by the new version of the TUIR andthe implementing decree pursuant to ex Art. 129, together with the Italian subsidiaries that are presumablysubject to a controlling relationship pursuant to ex Art. 120 TUIR, decided to have the Group participate inthe national tax consolidation program for IRES. According to this law, TOD’S S.p.A., as controlling company, has aggregated its income with that of the subsidiariesparticipating in the national tax consolidation program since fiscal 2004. It does so by fully offsetting all the posi-tive and negative taxable amounts, thereby benefiting from any losses contributed by the subsidiaries and assum-ing the expenses transferred from those subsidiaries with positive taxable income.TOD’S S.p.A. essentially acts as a “clearing house” for taxable income (profits and losses) of all Group companiesparticipating in the tax consolidation program, as well as financial relationships with revenue agency offices. At thesame time, it recognizes liabilities or credits vis-a-vis those subsidiaries that produced tax losses and those that, onthe contrary, transferred taxable income. Independently of the taxes that are paid, the company’s net result is im-pacted exclusively by the income taxes accrued on its own taxable income.
27. Earnings per share
The calculation of base and diluted earnings per share is based on the following:
143 Notes to the Separate Financial Statements
S.p.A.2014 Annual Report

i. Reference profit
euro 000’s For continuing operations Year 14 Year 13
Profit used to determine basic earning per share 78,414 101,502
Dilution effects
Profit used to determine diluted earning per share 78,414 101,502
euro/000 For continuing and discontinued operations Year 14 Year 13
Net profit of the year 78,414 101,502
Income (Loss) from discontinued operations
Profit used to determine basic earning per share 78,414 101,502Dilution effects
Profit used to determine diluted earning per share 78,414 101,502
In both fiscal 2014 and 2013, there were no dilutions of net consolidated earnings, partly as a result of activitiesthat were discontinued during the periods in question.
ii. Reference number of shares
Year 14 Year 13
Weighted average number of shares to determine basic earning per share 30,609,401 30,609,401
Share options - -
Weighted average number of shares to determine diluted earning per share 30,609,401 30,609,401
iii. Base earnings per share. Calculation of the base earning per share for fiscal year 2014 is based on the netincome allocable to holders of ordinary shares of TOD’S S.p.A., totalling euro 78,414 thousand (101,502 thou-sand euros in 2013), and on the average number of ordinary shares outstanding during the same period, totalling30,609,401 (unchanged respect to 2013).
iv. Diluted earnings per share. Calculation of the diluted earnings per share for the period January-December2014 coincides with calculation of base earnings per share, due to the fact that there are no items which producedilution effects.
28. Transactions with related parties
The Company's related parties transactions were executed in compliance with the procedural sequence and im-plementing procedures set out in the Related Parties Transactions Procedure approved by the TOD'S S.p.A. Boardof Directors in implementation of the Related Parties Regulation adopted by CONSOB with Resolution no. 17221of March 12th 2010, as subsequently amended.In accordance with market best practices, significant related party transactions are subject to an in-depth reviewinvolving, inter alia:(i) complete, prompt transmission of material information to the delegated Board of Directors committees (theControl and Risk Committee and the Independent Directors Committee, each within the ambit of their delegat-ed responsibilities, where the majority or all members of these committees are independent directors), who inthe performance of their functions also avail themselves of the assistance of independent experts;(ii) the issuance of an opinion (either binding or non-binding, as applicable) before approval of the transaction bythe Board of Directors (or, if appropriate, by the body delegated to resolve on the transaction). Without preju-dice to the principles of procedural fairness cited hereinabove, no unusual related party transactions, or other
144 Notes to the Separate Financial Statements
S.p.A.2014 Annual Report
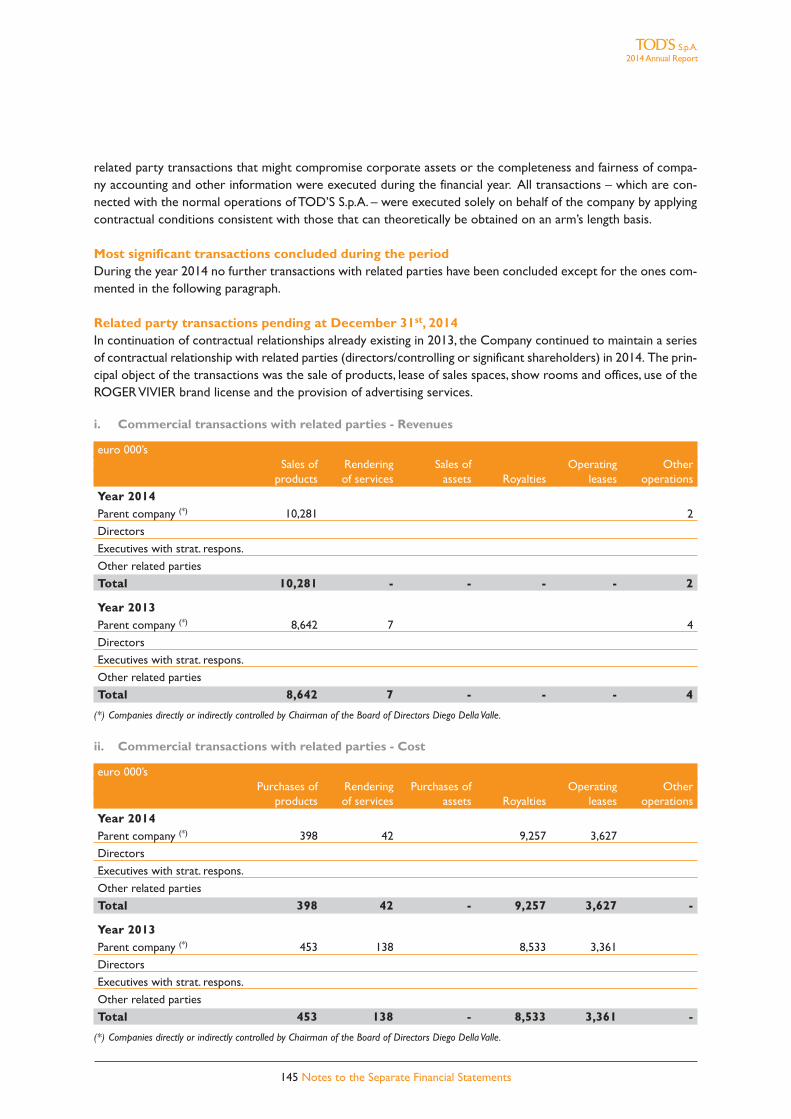
related party transactions that might compromise corporate assets or the completeness and fairness of compa-ny accounting and other information were executed during the financial year. All transactions – which are con-nected with the normal operations of TOD’S S.p.A. – were executed solely on behalf of the company by applyingcontractual conditions consistent with those that can theoretically be obtained on an arm’s length basis.
Most significant transactions concluded during the periodDuring the year 2014 no further transactions with related parties have been concluded except for the ones com-mented in the following paragraph.
Related party transactions pending at December 31st, 2014In continuation of contractual relationships already existing in 2013, the Company continued to maintain a seriesof contractual relationship with related parties (directors/controlling or significant shareholders) in 2014. The prin-cipal object of the transactions was the sale of products, lease of sales spaces, show rooms and offices, use of theROGER VIVIER brand license and the provision of advertising services.
i. Commercial transactions with related parties - Revenues
euro 000’sSales of Rendering Sales of Operating Other
products of services assets Royalties leases operations
Year 2014Parent company (*) 10,281 2
Directors
Executives with strat. respons.
Other related parties
Total 10,281 - - - - 2
Year 2013Parent company (*) 8,642 7 4
Directors
Executives with strat. respons.
Other related parties
Total 8,642 7 - - - 4
(*) Companies directly or indirectly controlled by Chairman of the Board of Directors Diego Della Valle.
ii. Commercial transactions with related parties - Cost
euro 000’sPurchases of Rendering Purchases of Operating Other
products of services assets Royalties leases operations
Year 2014Parent company (*) 398 42 9,257 3,627
Directors
Executives with strat. respons.
Other related parties
Total 398 42 - 9,257 3,627 -
Year 2013Parent company (*) 453 138 8,533 3,361
Directors
Executives with strat. respons.
Other related parties
Total 453 138 - 8,533 3,361 -
(*) Companies directly or indirectly controlled by Chairman of the Board of Directors Diego Della Valle.
145 Notes to the Separate Financial Statements
S.p.A.2014 Annual Report

iii. Commercial transactions with related parties - Receivables and Payables
Receivables and payables 12.31.14 12.31.13euro 000’s Receivables Payables Receivables Payables
Parent company (*) 2,448 4,903 1,965 4,085
Directors
Exec. with strat. respons.
Other related parties
Total 2,448 4,903 1,965 4,085
(*) Companies directly or indirectly controlled by Chairman of the Board of Directors Diego Della Valle.
Given the insignificance of these amounts, they have not been separately listed in the accounts following CONSOBresolution n. 15519 dated July 27th, 2006.
Compensation of Directors, Statutory Auditors, and General ManagersThe following table illustrates the compensation accrued in fiscal 2014 by each of the Directors, Statutory Auditors,Executives with Strategic Responsibilities of TOD’S S.p.A. (including for the activities that they performed at sub-sidiaries) for any reason and in any form:
euro 000’s Compensat. Non BonusCompensat. for part. cash and other Compens. Other
for office in Commit. benefits incentives as employ. compens.
DirectorsDiego Della Valle (*) 1,831.5 8.7
Andrea Della Valle (**) 1,231.8 9.0
Luigi Abete 31.5 15.6
Maurizio Boscarato 31.8 9.0 (2) 220.0
Luigi Cambri 31.8 24.6 9.0 (4)
Luca C. di Montezemolo 30.3
Emanuele Della Valle 31.2
Fabrizio Della Valle (****) 231.8 9.0
Emilio Macellari (****) 231.8 9.0 (2) 480.0
Pierfrancesco Saviotti 30.9 23.4
Stefano Sincini (***) 315.8 9.0 4.0 336.3 (1) 111.0
Vito Varvaro 26.5 7.8
Total 4,056.7 125.1 4.0 336.3 820.0
Statutory AuditorsGiulia Pusterla (*****) 90.0
Enrico Colombo 61.2 (3) (4) 36.0
Fabrizio Redaelli 60.0
Total 211.2 36.0Executives with strategic responsibilities 7.0 16.9 660.0 (1) 6.0
Legend
(*) Chairman of Board of Directors (1) Director of subsidiary (**) Vice Chairman of Board of Directors (2) Consultant of TOD’S S.p.A.(***) Chief Executive Officer (3) Statutory Auditor of subsidiary (****) Director with Proxies (4) Member of the Compliance Program Supervisory Body(*****) Chairman of the Statutory Board
146 Notes to the Separate Financial Statements
S.p.A.2014 Annual Report
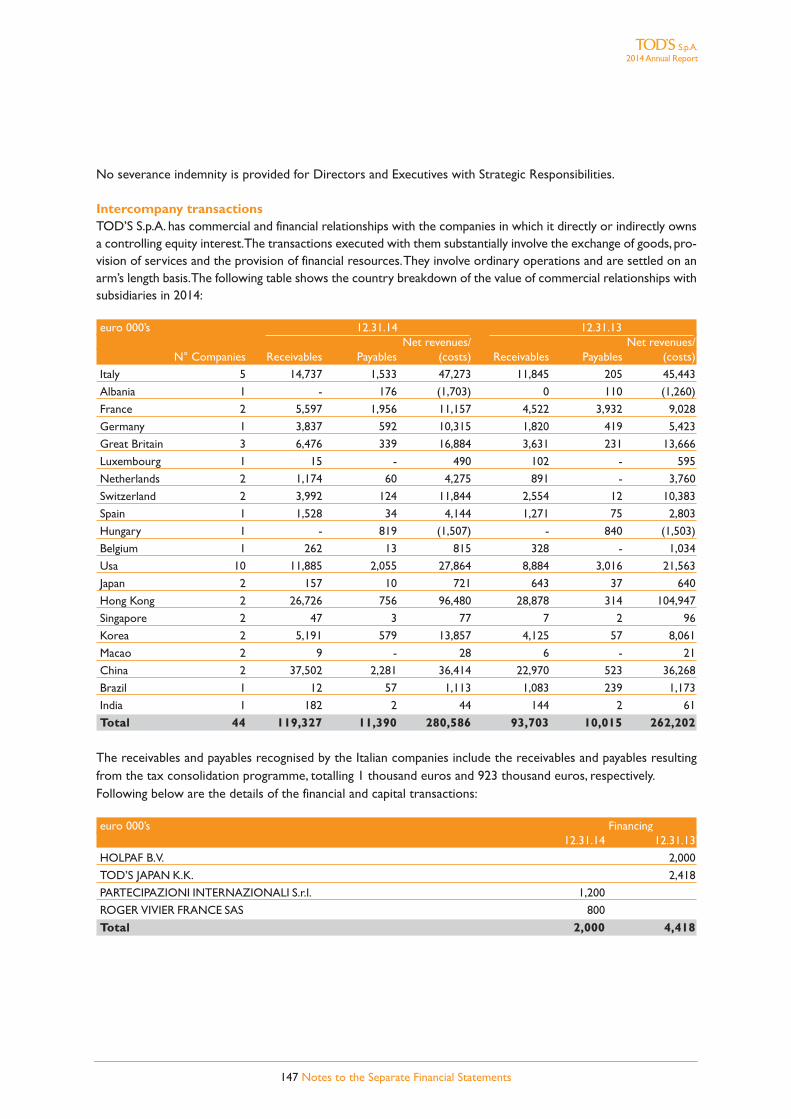
147 Notes to the Separate Financial Statements
S.p.A.2014 Annual Report
No severance indemnity is provided for Directors and Executives with Strategic Responsibilities.
Intercompany transactionsTOD’S S.p.A. has commercial and financial relationships with the companies in which it directly or indirectly ownsa controlling equity interest. The transactions executed with them substantially involve the exchange of goods, pro-vision of services and the provision of financial resources. They involve ordinary operations and are settled on anarm’s length basis. The following table shows the country breakdown of the value of commercial relationships withsubsidiaries in 2014:
euro 000’s 12.31.14 12.31.13Net revenues/ Net revenues/
N° Companies Receivables Payables (costs) Receivables Payables (costs)
Italy 5 14,737 1,533 47,273 11,845 205 45,443
Albania 1 - 176 (1,703) 0 110 (1,260)
France 2 5,597 1,956 11,157 4,522 3,932 9,028
Germany 1 3,837 592 10,315 1,820 419 5,423
Great Britain 3 6,476 339 16,884 3,631 231 13,666
Luxembourg 1 15 - 490 102 - 595
Netherlands 2 1,174 60 4,275 891 - 3,760
Switzerland 2 3,992 124 11,844 2,554 12 10,383
Spain 1 1,528 34 4,144 1,271 75 2,803
Hungary 1 - 819 (1,507) - 840 (1,503)
Belgium 1 262 13 815 328 - 1,034
Usa 10 11,885 2,055 27,864 8,884 3,016 21,563
Japan 2 157 10 721 643 37 640
Hong Kong 2 26,726 756 96,480 28,878 314 104,947
Singapore 2 47 3 77 7 2 96
Korea 2 5,191 579 13,857 4,125 57 8,061
Macao 2 9 - 28 6 - 21
China 2 37,502 2,281 36,414 22,970 523 36,268
Brazil 1 12 57 1,113 1,083 239 1,173
India 1 182 2 44 144 2 61
Total 44 119,327 11,390 280,586 93,703 10,015 262,202
The receivables and payables recognised by the Italian companies include the receivables and payables resultingfrom the tax consolidation programme, totalling 1 thousand euros and 923 thousand euros, respectively.Following below are the details of the financial and capital transactions:
euro 000’s Financing12.31.14 12.31.13
HOLPAF B.V. 2,000
TOD’S JAPAN K.K. 2,418
PARTECIPAZIONI INTERNAZIONALI S.r.l. 1,200
ROGER VIVIER FRANCE SAS 800
Total 2,000 4,418

148 Notes to the Separate Financial Statements
S.p.A.2014 Annual Report
29. Events and significant non-recurring transactions
Pursuant to Consob Communication No. DEM/6064293 of July 28th, 2006, the company did not carry out any sig-nificant non-recurring operations in 2014.
30. Independent Auditors compensation
Pursuant to Article 149-duodecies of the Issuers Regulation, the compensation received in FY 2014 by the inde-pendent auditor PricewaterhouseCoopers S.p.A. and the companies belonging to its network are illustrated be-low, as broken down into auditing services and the provision of other services:
FeesType of service Company Receiver euro 000’s
Auditing services PricewaterhouseCoopers S.p.a. TOD'S S.p.A. 146
Auditing services PricewaterhouseCoopers S.p.a. Subsidiaries 24
Total PricewaterhouseCoopers S.p.A. 170Auditing services PricewaterhouseCoopers (Network) Subsidiaries 172
Other services PricewaterhouseCoopers (Network) TOD'S S.p.A. 465
Other services PricewaterhouseCoopers (Network) Subsidiaries 339
Total PricewaterhouseCoopers (Network) 977
31. Significant events occurring after the end of the fiscal year
No significant events occurred after the end of the period.
32. Certification of the Separate Financial Statements of TOD’S S.p.A. and theConsolidated Financial Statements of the TOD’S Group pursuant to Article 81-ter ofConsob Regulation no. 11971 of May 14th, 1999, as amended
1. The undersigned Stefano Sincini, Chief Executive Officer of TOD’S S.p.A., and Rodolfo Ubaldi, manager re-sponsible for the drawing up of the financial reports of TOD’S S.p.A., certify, in accordance with the provisions ofArticle 154-bis, subsections 3 and 4, of Legislative Decree no. 58 of February 24th, 1998:
• the adequacy in terms of the company’s characteristics and • effective application
of administrative and accounting procedures for preparation of the Separate Financial Statements andConsolidated Financial Statements during the period January 1st, 2014 to December 31st, 2014.
2. They also certify that the Separate Financial Statements and Consolidated Financial Statements:a) have been prepared in compliance with the International Financial Reporting Standards recognised in theEuropean Union pursuant to Regulation EC 1606/2002 of the European Parliament and Council of July 19th 2002;b) correspond with the account books and ledger entries;c) give a true and fair view of the assets, liabilities, income and financial position of the issuer and entities includ-ed in the scope of consolidation.3. Report on operations provides a reliable analysis of the issuer’s operating performance and income, as well asthe financial position of the issuer and all the businesses included in the scope of consolidation, together with adescription of the principal risks and uncertainties to which they are exposed.
Milan, March 12th, 2015
Stefano Sincini Rodolfo UbaldiChief Executive Officer Manager responsible for the drawing up of
the financial reports
149 Notes to the Separate Financial Statements
S.p.A.2014 Annual Report

150 2014 Annual Report
[THIS PAGE HAS BEEN INTENTIONALLY LEFT BLANK]

151 Relazione sulla gestione
REPORT OF THE BOARD OF STATUTORY AUDITORS

152 Report of Statutory Auditors
S.p.A.2014 Annual Report
REPORT OF THE BOARD OF STATUTORY AUDITORS TO THE SHAREHOL-DERS’S MEETING OF TOD’S S.P.A., PURSUANT TO ARTICLE 153 OF LEGISLA-TIVE DECREE No 58/1998 AND ARTICLE 2429 OF THE ITALIAN CIVIL CODE.(Courtesy translation for the convenience of international readers - for the official documents pleaserefer to the italian version)
Dear Shareholders,
during financial year ended on December 31st, 2014, we carried out the supervisory activity provided by law, in accor-dance with the rules of conduct for the Board of Statutory Auditors recommended by the Italian Board of ProfessionalAccountants and Auditors, attending the meetings of corporate bodies, carrying out periodic audits and meeting withthe managers of the Independent Auditor, the Control and Risk Committee and the Executive in charge of preparingCompany’s accounting documents, to exchange information on the activities undertaken by them, and to assess thetimetable of scheduled internal control operations.This report has been prepared in compliance with the applicable laws and regulations for listed companies, since theshares of Tod’s S.p.A. are traded on the MTA organized and managed by Borsa Italiana S.p.A.. Pursuant to article 153 of Legislative Decree no. 58/1998 and article 2429 of the Italian Civil Code, as well as taking in-to account the indications provided by CONSOB on corporate controls and activities of the Board of StatutoryAuditors, we report the following:• we have supervised and checked compliance with the law and the by-laws of the Company;• the Directors provided us, with the required periodicity, information on the activities undertaken by them and on
the most significant economic, financial and capital transactions carried out by the Company and its subsidiaries dur-ing the financial year, and also verified that the same were in accordance with law and the articles of association andwere not manifestly imprudent or risky, in potential conflict of interests, in breach of the resolutions passed by theShareholders’ Meeting or likely to affect the integrity of the Company’s assets and its business continuity;
• we have not found nor received information from the Board of Directors, the Independent Auditors or the Controland Risk Committee regarding the existence of atypical and/or unusual transactions carried out with third parties,related parties or other companies of the same group;
• in the explanatory notes attached to the consolidated financial statements of Tod’s Group, as well as in the ex-planatory notes attached to the statutory financial statements of Tod’s S.p.A., the directors have provided an ac-count of the ordinary transactions undertaken with other Group companies and/or related parties during thecourse of the financial year. Reference is here made to such documents with regard to matters falling within ourpurview, and especially in respect of their features and economic and financial effects;With regard to such transactions, the Board of Statutory Auditors, with the help of the Board of Directors andControl and Risk Committee, verified the existence of and compliance with procedures aimed at ensuring that saidtransactions are conducted at fair terms and in the Company’s interest, and that the same can be reasonably con-sidered in line with the principles of correct administration, compatible with the Articles of Association of theCompany and coherent with the purpose of the applicable laws and regulations;
• since the conditions have not been met, no mention has been made of atypical and/or unusual transactions;• we have monitored the compliance of the Procedure on transactions with related Parties, adopted by the Company
pursuant to Consob Regulation n. 17221 of March 12th 2010, as further amended and supplemented, with the prin-ciples included in the same Consob Regulation as well as the actual implementation of said Procedure by theCompany. The information pertaining to transactions with Group companies and/or related parties, contained, inparticular, in the paragraphs “Transactions with related parties” of the explanatory notes attached to the IAS/IFRSconsolidated financial statements of Tod’s Group and in the explanatory notes to the statutory IAS/IFRS financialstatements of Tod’s S.p.A., are adequate in light of the Company’s size and structure;
• we ascertained that the information flows supplied by controlled companies outside EU are adequate in order toaudit annual and interim accounts as provided for by article 36 of Market Regulations adopted by Consob resolu-tion no. 16191 of October 29th 2007;
• the Independent Auditors have transmitted to the Board of Statutory Auditors their reports on both the statuto-ry financial statements of Tod’s S.p.A. and the consolidated financial statements of Tod’s Group, drafted in accor-

153 Report of Statutory Auditors
S.p.A.2014 Annual Report
dance with articles 14 and 16 of Legislative Decree no. 39 of January 27th 2010, in which they expressed an opin-ion with no remarks on the financial statements, thereby certifying that the same are in accordance with the rulesgoverning financial statements;
• neither complaints - pursuant to article 2408 of the Italian Civil Code - nor reports were received during the fi-nancial year;
• the received information shows that in 2014 - in addition to the tasks provided for listed companies by the appli-cable laws and regulation as indicated in the explanatory notes to the individual IAS/IFRS financial statements ofTod’s S.p.A. - the Independent Auditors and the other subjects belonging to their “network” have been entrustedto provide further services other than auditing for a total consideration of 804 thousand euros, which is consistentwith the provisions of article 17 of Legislative Decree no. 39/2010. The assessment carried out by the board of au-ditors in respect of independence of the auditing firm pursuant to article 19 of Legislative Decree no. 39/2010, re-vealed no critical aspects worthy of mention;
• we verified the correct and adequate application of criteria and procedures adopted by the Board of Directors inorder to assess and assure the independence of its members. Furthermore, we verified the meeting of such inde-pendence criteria also by the members to the Board of Statutory Auditors, in compliance with the principles pro-vided for by the Corporate Governance Code;
• during the financial year we have issued our opinions as provided for by the law; • during the course of the financial year we attended 6 meetings of the Board of Directors and 5 meetings of the
Executive Committee. Furthermore, 8 meetings of the Board of Auditors were held;• to the extent of our powers and purview, we ascertained and monitored the compliance with the principles of cor-
rect administration and the appropriateness of the organisational structure and the instructions given by theCompany to its subsidiaries pursuant to article 114, paragraph 2 of Legislative Decree no. 58/1998, through directobservation, information gathered during meetings with company officers in charge of corporate organisation, andexchanges of significant information during meetings with the Independent Auditors and with the Executive in chargeof preparing Company’s accounting documents;
• to the extent of our powers and purview, we ascertained and monitored, pursuant to article 19 of Legislative Decreeno. 39/2010, the appropriateness and efficacy of the internal control and risk management system, as well as the ac-tivities undertaken by the internal auditor staff, the appropriateness and efficacy of the administrative/accountingsystem and the reliability of the latter to faithfully reflect the management of the Company, by obtaining informa-tion from the company officers in charge of the relevant corporate departments, by examining corporate documentsand analysing the results of the work undertaken by the Independent Auditors, and by attending the meetings of theControl and Risk Committee and organizing meetings with the Executive Directors in charge of the InternalControl and Risk Management System as well as with the Executive in charge of preparing Company’s accountingdocuments;
• the financial reporting processed was monitored pursuant to article 19 of Legislative Decree no. 39/2010;• the Independent Auditors issued the report provided by article 19 of Legislative Decree 39/2010, which does not
show evidence of any material flaws in the internal auditing system;• no aspects material o worthy of mention resulted from the contacts with the corresponding bodies of those sub-
sidiaries where no members of the board of auditors were already in office;• no aspects material or worthy of mention resulted from the meetings held with the Independent Auditors pursuant
to article 150, paragraph 3, of Legislative Decree no. 58/1998, nor have any material lack have been detected in theinternal control system as far as the financial reporting process is concerned;
• we verified the procedures for the proper implementation of the rules of corporate governance provided by theCorporate Governance Code for listed companies, adopted by the Board of Directors in 2006. At the meeting ofNovember 12th 2014, the Board of Directors of Tod’s S.p.A confirmed the same “strategically significant subsidiaries”identified in the meeting held in the previous financial year - namely Tod’s France Sas, Tod’s Japan KK, Deva Inc., Tod’sHong Kong Ltd. and Tod’s (Shanghai) Trading Co. Ltd;
• through direct checks and information obtained from the Independent Auditors and the Executive in charge ofpreparing the Company’s accounting documents, we verified the compliance with statutory provisions pertainingto the preparation and layout of the consolidated financial statements of Tod’s Group, the individual financial state-ments of Tod’s S.p.A. and the reports related thereto. Our monitoring activities did not detect any facts requiring areport to internal control bodies or worthy of mention in this report;
154 Report of Statutory Auditors
S.p.A.2014 Annual Report
• pursuant to article 19 of Legislative Decree no. 39/2010, the statutory auditing of the annual accounts and the con-solidated accounts was duly monitored.
The Company adopted an Organizational and Managerial Model pursuant to Legislative Decree no. 231/2001 which hasbeen updated by the Board of Directors most recently during its meeting held on August 7th 2013.
Taking into account all the above and with regard to matters falling within our purview, we have not found any reasonshindering the approval of the financial statements as at December 31st, 2014 and we have no comments to make on theproposed distribution of dividends as recommended in the directors’ report to the individual IAS/IFRS financial state-ments of Tod’s S.p.A..
Milan, March 31st, 2015
The Board of Statutory Auditors
Dr.ssa Giulia Pusterla - ChairmanDr. Enrico Colombo - Standing auditor Dr. Fabrizio Redaelli - Standing auditor

155 Report of Statutory Auditors
S.p.A.2014 Annual Report
REPORT OF INDEPENDENT AUDITORS
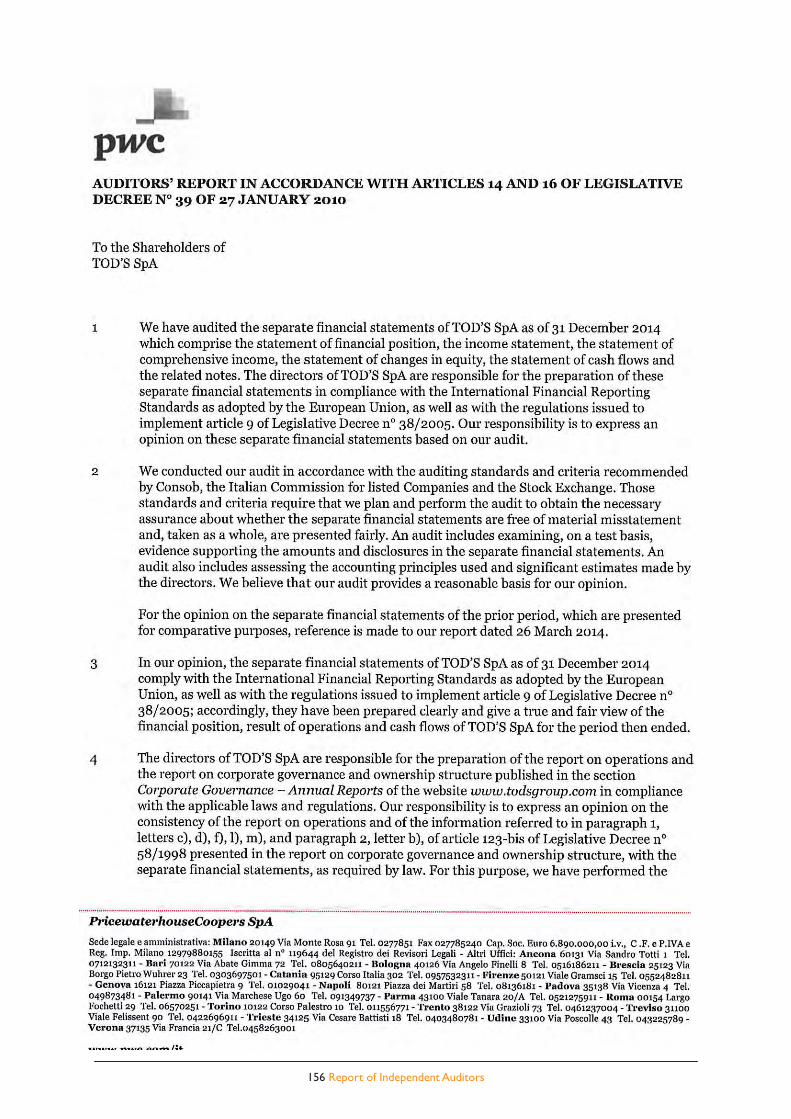
[QUESTA PAGINA È STATA LASCIATA INTENZIONALMENTE BIANCA]
156 Report of Independent Auditors
[QUESTA PAGINA È STATA LASCIATA INTENZIONALMENTE BIANCA]
157 Report of Independent Auditors

158 2014 Annual Report
[THIS PAGE HAS BEEN INTENTIONALLY LEFT BLANK]