
2014 Annual General Meeting of Shareholders Presentation ... Media/ASX... · Please find attached...
23
QBE Insurance Group Limited ABN 28 008 485 014 Level 02, 82 Pitt Street, SYDNEY NSW 2000 Australia GPO Box 82, Sydney NSW 2001 telephone + 612 9375 4444 • facsimile + 612 9231 6104 www.qbe.com 2 April 2014 The Manager Markets Announcements Office ASX Limited Level 4 Exchange Centre 20 Bridge Street SYDNEY NSW 2000 Dear Sir/Madam 2014 Annual General Meeting of Shareholders – Presentation Slides We refer to our letter earlier today. Please find attached the presentation slides to be delivered at QBE’s Annual General Meeting today. Yours faithfully Duncan Ramsay Company Secretary Attachment
Transcript of 2014 Annual General Meeting of Shareholders Presentation ... Media/ASX... · Please find attached...

QBE Insurance Group Limited ABN 28 008 485 014 Level 02, 82 Pitt Street, SYDNEY NSW 2000 Australia GPO Box 82, Sydney NSW 2001 telephone + 612 9375 4444 • facsimile + 612 9231 6104 www.qbe.com
2 April 2014 The Manager Markets Announcements Office ASX Limited Level 4 Exchange Centre 20 Bridge Street SYDNEY NSW 2000 Dear Sir/Madam 2014 Annual General Meeting of Shareholders – Presentation Slides We refer to our letter earlier today. Please find attached the presentation slides to be delivered at QBE’s Annual General Meeting today. Yours faithfully
Duncan Ramsay Company Secretary Attachment

1
Marty Becker Chairman
John Neal Group Chief Executive Officer
QBE Insurance Group 2014 Annual General Meeting
2
Marty Becker
Chairman’s address
3 3
Agenda
1. Earnings stability and predictability
2. Completing the renewal of the Board and Executive team
3. Managing the balance sheet to meet all our stakeholder requirements
2014 Annual General Meeting

4
John Neal
Group Chief Executive Officer address

5 5
Contents
• 2013 financial results summary
• 2014 outlook
• Building for the future
2014 Annual General Meeting

6 6
2013 result overview
Results
• Net profit before amortisation and tax $797M (2012 $1,348M)
• Net loss after tax of $254M (2012 profit of $761M)
• Cash profit $761M (2012 $1,042M)
• Insurance profit margin 5.5% (2012 8.0%)
Underlying insurance
business
• Underlying 2013 insurance profit margin 10 - 11%
• 2013 accident year central estimate COR 92.5%
• Attritional claims ratio (ex crop/FPS) 48.2% (2012 49.8%)
• Large individual risk and catastrophe claims of 9.7%
• Prior accident year central estimate development $621M(1)
Capital position
• Net tangible assets $5,923M up 10% from 2012
• Prescribed Capital Amount (PCA) multiple 1.59x (2012 1.57x)
• CET1(2) ratio 114% (2012 112%) or 1.9x required minimum
Dividend
• Final dividend 12 Australian cents per share, fully franked
• Full year dividend 32 Australian cents per share
• Cash payout ratio of around 50%(3)
(1) Before $69M adjustment for discount on certain long tail portfolios
(2) Common Equity Tier 1
(3) Calculated by converting cash profit to A$ at the cumulative average rate of exchange
2014 Annual General Meeting

7 7
Overview of 2013 divisional results
2013 Group
North
America
Latin
America
Europe
Australia &
New
Zealand
Asia
Pacific
Equator
Re
GWP ($M) 17,975 5,854 1,380 5,225 4,786 730 3,295
NEP ($M) 15,396 3,051 1,208 3,609 3,971 500 3,057
Claims ratio (%) 64.5 78.7 61.8 62.0 58.3 42.4 66.2
Commission
ratio (%) 16.8 4.4 21.7 18.1 14.9 21.8 27.0
Expense ratio
(%) 16.5 32.7 16.1 16.0 14.2 19.8 3.6
COR (%) 97.8 115.8 99.6 96.1 87.4 84.0 96.8
Insurance profit
margin (%) 5.5 (14.6) 8.2 5.3 18.8 17.4 5.2
NPAT ($M) (254) (1,301) 61 189 574 57 166
CASH NPAT
($M) 761 (320) 71 201 582 61 166
2014 Annual General Meeting

8 8
2014 targets
Gross written premium • US$16.8-17.3billion
Net earned premium • US$14.7-15.2billion
Combined operating ratio • around 93%
Insurance profit margin • around 10% of net earned premium
2014 Annual General Meeting

9 9
Building for the future
2014 Annual General Meeting
10 10
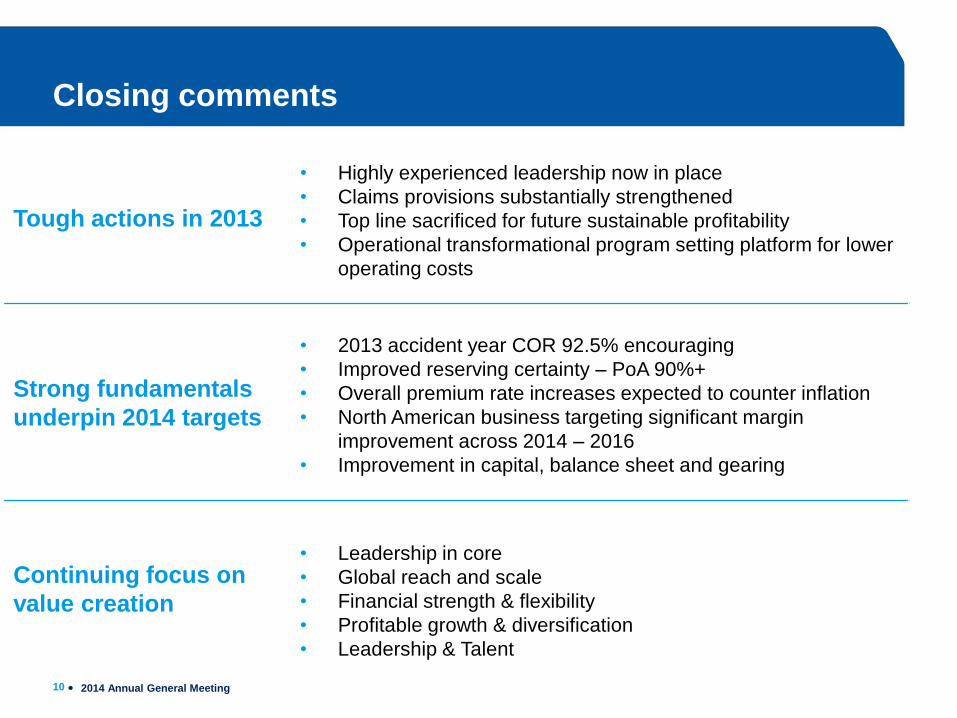
Closing comments
Tough actions in 2013
• Highly experienced leadership now in place
• Claims provisions substantially strengthened
• Top line sacrificed for future sustainable profitability
• Operational transformational program setting platform for lower
operating costs
Strong fundamentals
underpin 2014 targets
• 2013 accident year COR 92.5% encouraging
• Improved reserving certainty – PoA 90%+
• Overall premium rate increases expected to counter inflation
• North American business targeting significant margin
improvement across 2014 – 2016
• Improvement in capital, balance sheet and gearing
Continuing focus on
value creation
• Leadership in core
• Global reach and scale
• Financial strength & flexibility
• Profitable growth & diversification
• Leadership & Talent
2014 Annual General Meeting

11
Marty Becker, Chairman
Formal business

12 12
Item 1:
To receive and consider the annual financial report and the reports of the directors and of the auditors of the Company for the year ended 31 December 2013
2014 Annual General Meeting

13 13
Item 2:
To adopt the remuneration report
2014 Annual General Meeting

14 14
Item 2:
To adopt the remuneration report
Resolution For Open Against Abstain
2 687,910,247 5,310,869 61,888,698 4,206,907
91.1% 0.7% 8.2%
2014 Annual General Meeting
15 15
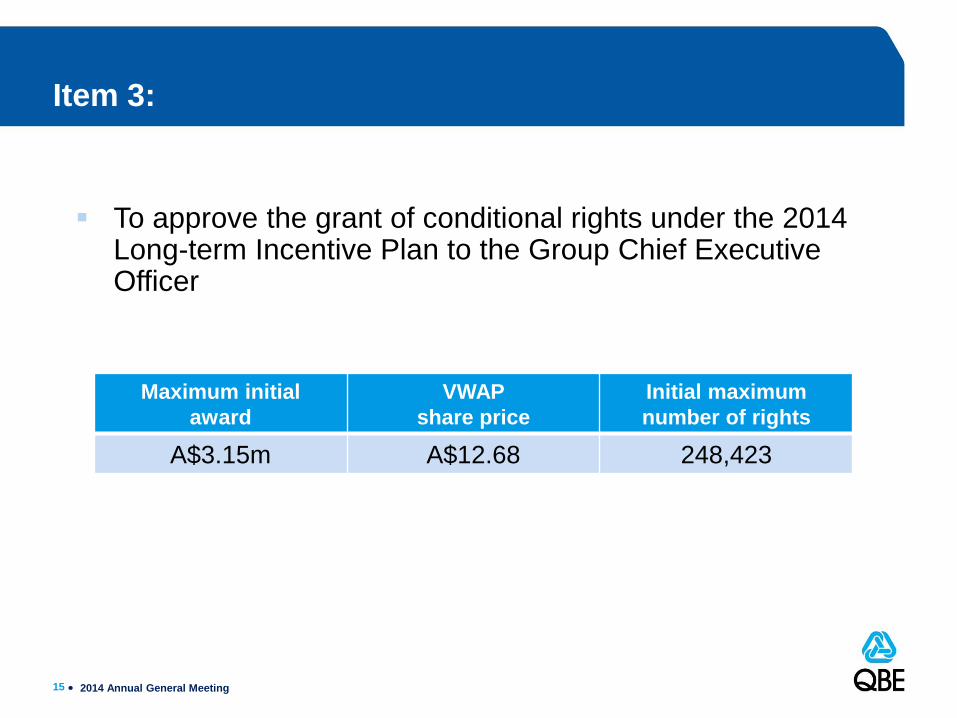
Item 3:
To approve the grant of conditional rights under the 2014 Long-term Incentive Plan to the Group Chief Executive Officer
2014 Annual General Meeting
Maximum initial
award
VWAP
share price
Initial maximum
number of rights
A$3.15m A$12.68 248,423

16 16
Item 3:
To approve the grant of conditional rights under the 2014 Long-term Incentive Plan to the Group Chief Executive Officer
Resolution For Open Against Abstain
3 722,359,067 4,291,242 27,658,153 4,046,030
95.8% 0.5% 3.7%
2014 Annual General Meeting

17 17
Item 4a:
To elect Mr W M Becker as a director of the Company
2014 Annual General Meeting

18 18
Item 4a:
To elect Mr W M Becker as a director of the Company
Resolution For Open Against Abstain
4a 742,586,979 5,476,971 8,348,115 3,219,758
98.2% 0.7% 1.1%
2014 Annual General Meeting

19 19
Item 4b:
To elect Ms M M Y Leung as a director
2014 Annual General Meeting
20 20
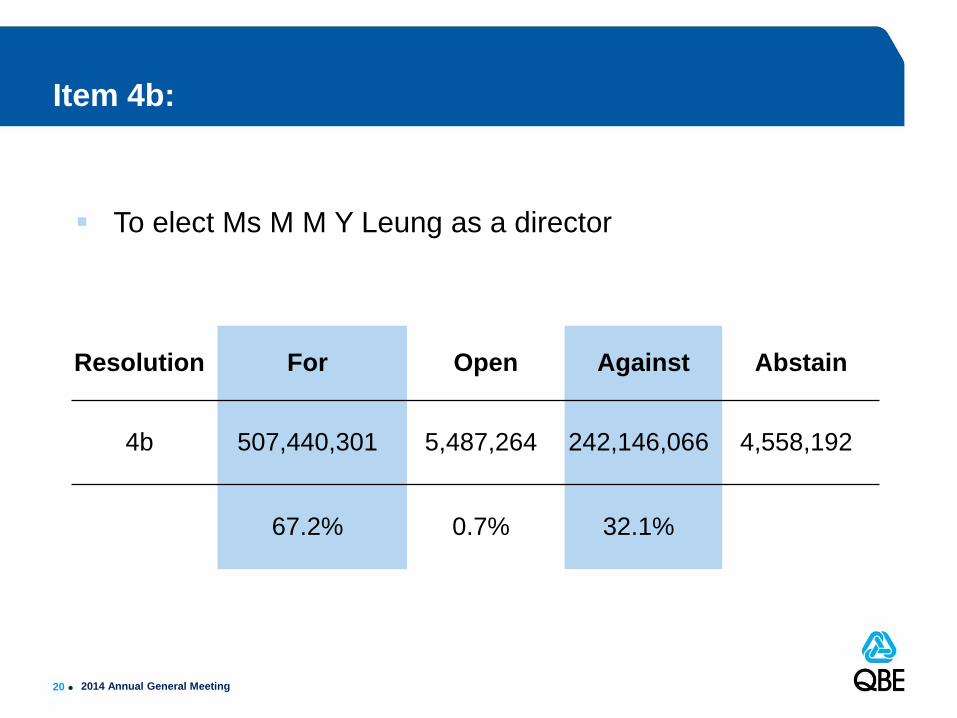
Item 4b:
To elect Ms M M Y Leung as a director
Resolution For Open Against Abstain
4b 507,440,301 5,487,264 242,146,066 4,558,192
67.2% 0.7% 32.1%
2014 Annual General Meeting

21
Thank you

22 22
Important disclaimer This presentation should be read in conjunction with all information which QBE has lodged with the Australian Securities Exchange (“ASX”). Copies of those lodgements are available from either the ASX website www.asx. com.au or QBE’s website www.qbe.com. Prior to making a decision in relation to QBE’s securities, products or services, investors, potential investors and customers must undertake their own due diligence as to the merits and risks associated with that decision, which includes obtaining independent financial, legal and tax advice on their personal circumstances. This presentation contains certain "forward-looking statements“ for the purposes of the U.S. Private Securities Litigation Reform Act of 1995. The words "anticipate", “believe", "expect", "project", "forecast", "estimate", "likely", "intend", "should", "could", "may", "target", "plan" and other similar expressions are intended to identify forward-looking statements. Indications of, and guidance on, future earnings and financial position and performance are also forward-looking statements. Such forward-looking statements are not guarantees of future performance and involve known and unknown risks, uncertainties and other factors, many of which are beyond the control of QBE that may cause actual results to differ materially from those either expressed or implied in such statements. There can be no assurance that actual outcomes will not differ materially from these statements. You are cautioned not to place undue reliance on forward-looking statements. Such forward-looking statements only speak as of the date of this presentation and QBE assumes no obligation to update such information. Any forward-looking statements assume large individual risk and catastrophe claims do not exceed the significant allowance in our business plans; no overall reduction in premium rates; no significant fall in equity markets and interest rates; no major movement in budgeted foreign exchange rates; no material change to key inflation and economic growth forecasts; recoveries from our strong reinsurance panel; and no substantial change in regulation. Should one or more of these assumptions prove incorrect, actual results may differ materially from the expectations described in this presentation.
2014 Annual General Meeting


