2014-2015 dream a dream impact report
41
2014-2015 DREAM A DREAM IMPACT REPORT The Impact Report is a comprehensive document that details out the impact created by Dream a Dream through its various programmes using the Life Skills Approach.
Transcript of 2014-2015 dream a dream impact report

2014-2015
DREAM A DREAM IMPACT REPORT The Impact Report is a comprehensive document that details out the impact created by
Dream a Dream through its various programmes using the Life Skills Approach.

1
Table of Contents
Impact Report 2014-2015: Executive Summary ........................................................... 2
Impact Analysis: After School Life Skills Programme ................................................ 6
Part 1: Introduction ................................................................................................................. 6
Part 2: Story of Yeshwanth ................................................................................................... 7
Part 3: Impact Summary of Lords Convent English High School ...................... 9
Part 4: Impact Summary of Programme .................................................................... 11
Part 5: The relation between Baseline and Improvement ............................... 14
Part 6: Impact of other factors on Programme Efficiency ................................ 14
Part 7: Conclusion ................................................................................................................. 20
Impact Analysis: Career Connect Programme ............................................................. 21
Part 1: Introduction .............................................................................................................. 21
Part 2: Story of Hajira .......................................................................................................... 22
Part 3: Impact Summary of Programme .................................................................... 24
Part 4: The relation between Baseline and Improvement ............................... 26
Part 5: Impact of other factors on Programme Efficiency ................................ 27
Part 6: Conclusion ................................................................................................................. 31
Impact Analysis: Teacher Development Programme .............................................. 33
Part 1: Introduction .............................................................................................................. 33
Part 2: Impact Indicators for 2014-15 ........................................................................ 33
Part 3: Impact of the Programme .................................................................................. 34
Part 4: Story of Change ........................................................................................................ 35
Part 5: Conclusion ................................................................................................................. 37
Acknowledgements ................................................................................................................... 38
Appendix ......................................................................................................................................... 39

2
Impact Report 2014-2015: Executive Summary
Started in 1999, Dream a Dream is a registered, charitable trust empowering children
and young people from vulnerable backgrounds to overcome adversity and flourish in a
fast-changing world using a creative Life Skills Approach to learning. Currently, Dream a
Dream runs an Innovation Lab engaging 10,000 young people referred from 40 partners,
has transformed over 1000 educators from 38 schools impacting over 100,000 children
and young people and engaged over 2500 volunteers.
Dream a Dream is accredited by Guidestar India, Credibility Alliance and Charities Aid
Foundation; has won many accolades and awards such as the GDN Most Innovative
Development Project award; three times Finalist at the India NGO Awards and three time
winner of the Outstanding Annual Report Awards. The organization works on a strong
collaborative approach with local schools, government, charities, corporates, volunteers,
expert consultants and a host of national and international strategic partners.
Dream a Dream is considered to be a pioneer in the Life Skills space in India. The Dream
Life Skills Assessment Scale developed in-house is today a published, standardized scale
that can be used by any NGO/School to assess life skills -
http://impact.sp2.upenn.edu/ostrc/doclibrary/documents/LifeSkillsAssessmentScale.p
df. More recently, Dream a Dream has been recognized by Lego Foundation and Ashoka
as a Champion in the space of Re-Imagining Learning in the world. These videos talk
about our work - https://vimeo.com/124809296 and https://vimeo.com/124817309.
Our Approach

3
1. At the centre of Dream a Dream’s approach is the child. The first is the child
itself who we believe has the potential to overcome adversity and develop life
skills. Over 15 years, Dream a Dream has built the capacity to work directly with
over 10,000
young people a
year through our
signature After
School Life Skills
and Career
Connect
Programmes.
These are our
Innovation Labs
for new life skills approaches and deepening our understanding of the child and
young person.
We embarked on a change of strategy during the last 4 years. We realized that our
directly managed programmes, however successful, would never do more than scratch
the surface of the problem and that we would have far greater impact through sharing
our programmes with others. The new strategy is two-fold: a) to continue the directly
managed After School Life Skills and Career Connect programmes to have impact in their
own right but also to be used to bring in innovation and research; b) to scale up the
impact of our work through the training of teachers to adopt our Life Skills Approach
and thereby increase the impact on young people under their tutelage.
2. Teachers are the closest influencers in a child’s life after parents and that
might include school teachers, caring adults, mentors or facilitators. At Dream a
Dream, we believe true transformation happens with the presence of a caring,
compassionate adult in a young person’s life. Adults who work with young
people are uniquely positioned to unlock their creative potential. Skilled adults
can empower young people to make positive life choices, express themselves,
commit to their own learning, and become leaders in their families and

4
communities. Our engagement provides teachers, youth workers, community
workers and facilitators with the tools and skills required to develop Life Skills
amongst young people and integrate Life Skills within their work.
3. Beyond the teacher is the community – the world of volunteers, friends,
peers, guides and mentors - someone who is a role model and creates positive
learning experiences in the young person's life. Today, over 2500 volunteers
from school, colleges and the corporate sector are engaging with young people
as mentors, role-models, designers, influencers and champions for the cause.
4. The outer key influencer is larger society - this includes potential employers,
administration, the government, and policy makers. Eventually, they make the
universe that the young will inhabit, and hence need to be made aware of the
challenges. We, at Dream a Dream, are just beginning to engage with this
outermost layer and building a network of champions, mavens and influencers
for the idea of Life Skills.
Our programs are designed in a way that all these four sectors are impacted, to create the best
possible world for the young person.
This impact report demonstrates the impact created by Dream a Dream across 3 of our core
programmes namely the After School Life Skills (ASLS) Programme, the Career Connect (CC)
Programme and the Teacher Development (TD) Programme.
The scale used in this impact report to assess life skills in the ASLS programme and CC
programme is the Dream Life Skill Assessment Scale (DLSAS), a peer reviewed standardized
scale that was developed by Dream a Dream along with Dr. David Pearson and Dr. Fiona
Kennedy. [Reference: SOCIAL BEHAVIOR AND PERSONALITY, 2014, 42(2), 197-21; © Society
for Personality Research - http://dx.doi.org/10.2224/sbp.2014.42.2.197].
The assessments were taken at the start of the programme year or module and towards the
end of the programme year or module as baseline and endline respectively. Improvement

5
was measured across 5 life skills during the assessment. They are:
• Interacting with others
• Overcoming difficulties and solving problems
• Taking initiative
• Managing conflict
• Understanding and following instructions
Each of these life skills were graded on a scale of 1-5, where 1 was for ‘does not yet do’, 2
was for ‘does with a lot of help’, 3 was for ‘does with some help’, 4 was ‘does with little help’
and finally 5 for ‘does independently’.
The highlight of 2014-15 has been that in the ASLS programme and the CC programme is
that our programme showed an impressive impact on young people most lacking in life skills
at the start of the programme year: i.e. the participants with lower baselines showed greater
improvement in their life skills scores as compared to participants with a higher baseline.
In the TD Programme, since it is a pilot programme, we primarily used Feedback Surveys
from participants and Stories of Change as an Impact Assessment framework. We have
collected baseline data from 850 children using the Dream Life Skill Assessment Scale. The
endline data will be collected by December 2015 for analysis. In this report we demonstrate
impact through the feedback that we have received from the teachers / NGO workers that
have been a part of the programme and stories of change.

6
Impact Analysis: After School Life Skills Programme
Part 1: Introduction
The After School Life Skills (ASLS) programme uses the medium of Sports and Arts to engage
and develop critical life skills. The programme is an Innovation Lab where new approaches to
Life Skills development are introduced, demonstrated, documented and fed back into the
larger framework for re-imagining learning for young people in the country.
Most beneficiaries of this programme are between 8-15 years of age based in Bangalore and
the learning opportunities provided are broadly divided under two heads: Life skills through
Arts and Life skills through Sports (football).
In the below sections, we would like to present the impact of the After School Life Skills
Programme for the year 2014-2015.
To present this information
1. We compared the baseline and endline assessment scores across 3081 beneficiaries
to understand the improvements in life-skills across the 5 life skills measured.
2. Moreover, we also performed further analysis on the dataset of assessment results
to study the effect factors on the programme efficiency.
In conclusion, we found that our programme showed an impressive impact on young people
most lacking in life skills at the start of the programme year: i.e. the participants with lower
baselines showed greater improvement in their life skills scores as compared to participants
with a higher baseline.
To demonstrate the impact of the programme, in part 2 and 3 we cover the story of
Yeshwanth, who enrolled in ASLS programme for the year 2014-2015, as well as an impact
summary of Lords Convent English High School, a new partner with Dream a Dream. This is
followed with the details of statistical analysis on the assessment data collected for this year
in part 4 to 6.

7
Part 2: Story of Yeshwanth
Yeshwanth is an 11 year old boy studying in 5th grade at one of our partner center, Ever
Bright School. He was part of the Dream Life skills through Sports programme since 1 year.
He belongs to a lower middle class family. His father works as an office supervisor, and mom
is a home maker. His sister is studying in the same school. The below story was narrated by
Arun Kumar, a Life skills Facilitator at Dream a Dream.
“Yeshwanth was a wonderful football player, but he was seen mostly distracting other
children during the sessions. When I run sessions, he would be moving around all the time
and disrupting other children. Sometimes it may go to the extent of beating another child
and I had to stop taking the session. Initially, I had told him not to repeat this, but it was
inadequate in this situation. He kept behaving the same way. I had observed Yeshwanth and
felt that he needed more attention. I then told him that if this happens again, he would have
to leave the class and wait till the class ends to get in again. He agreed and I started
observing him in the coming sessions. For a few sessions he kept calm, but then he could not
handle the silence anymore.
One day he kept distracting everyone in the class. During the reflection circle he beat up
another child and the other child started crying loudly. Surprisingly Yeshwanth, himself
moved out of the class, as he realized he had done a mistake.
When everyone in the class was engrossed in their small group activities, I moved out along
with him and spent nearly 30 minutes with him to understand what happened with him. But
Yeshwanth was quiet, and didn’t utter a word. I spent more time without saying anything.
Yeshwanth became emotional because he had not felt this kind of attention before,
especially when he was expecting a hard punishment. He cried because he felt someone
cared and spent time with him. For him this was something completely new. He felt
connected to me and started talking to me. He gave me a clue that he wants to take
responsibility for his behavior when he said sorry to the other child. I asked him to go home
that day as he was emotionally drained.
During the next class I designed the session in such a way that I welcomed each child to the

8
session with the strengths they have. I had observed Yeshwanth that he was very good in
playing football. I acknowledged this strength as I welcomed him into the session. He was so
happy and told me ‘thank you’. I kept appreciating him in every session using different
activities. Slowly he felt he was getting a lot of attention and he reached to the level of
building more confidence. In the session I saw him talking to his friends without getting
aggressive. Through the point system I had introduced, he kept receiving more points in the
class, which built on his confidence, and he stopped distracting others.
Today when I see him I can feel he is changed and became more responsible towards him
and others. I feel there are many children like Yeshwanth, who with some care and empathy
can create wonders. He says he wants to become a pilot and he started reading more about
airplanes and how it works. He shared with me a story of how responsible he should be to
take care of the passenger’s life, and I feel he is all set to do it now!
Life Skill assessment data of Yeshwanth - Baseline and Endline 2014-15
As demonstrated by this table, we can see Yeshwanth has improved on all 5 life skills. The
highest improvement is seen in his ability to overcome difficulties and manage conflict, as
corroborated by the story.
Interacting with
others
Overcoming
difficulties and
solving problems Taking Initiative
Managing
Conflict
Understanding
and following
Instructions
Baseline
(Score and
comments)
3 (Not mingling
with girls, only
with boys he
interacts)
2 (He needs lot of
help to understand
and solve problem)
3 (Taking
initiative when
asked)
2 (Using bad
words to other
friends).
3 (Understand the
instruction but
not following
what coach says
to him)
Endline
(Score and
comments)
5 (He is now
interacting with
all in the session)
4 (He started
looking for help, is
asking his friend)
5 (He takes
initiative in the
session).
4 (Using some
foul language)
5 (he understands
it so perfect)

9
Part 3: Impact Summary of Lords Convent English High School
Lords Convent English High School began their partnership with Dream a Dream in 2014, and
there were 101 young people from this school enrolled in the Life skills through Arts program
in the year 2014-2015. Most of them come from vulnerable backgrounds and demonstrated
a severe lack of life skills when compared with other partner schools of Dream a Dream.
Before the program, we took the life skill assessment for each young person as baseline and
the average baseline score for participants in this school turns out to be lowest among all
partner schools of the ASLS programme.
54 out of the total 101 young people from this school were boys and the rest 47 of them
were girls. The details of age distribution among these young people are presented as below:
Age 9 10 11 12 13 14 15 16 17 18
Counts 1 9 15 24 17 15 13 5 1 1
For each young person, life skill assessment was also done after the programme year as
endline. Gratifyingly, considerable improvements in life skills were observed: 99% of them
showed positive improvement and the average improvement from baseline to endline for all
of them was 106%!
This can also be observed through the density distribution plot of baseline and endline

10
Although the baseline score of this school was the lowest compared to young people from
other schools, they also showed the greatest improvement among all the partner schools of
this programme.
Below is a quote from Lords Convent English School:
It was like a bolt from the blue that we could have the services of Dream a Dream in our
school. Not only it changed the environment in our school, it brought freshness in the way of
imparting the education of arts and craft through the organization’s well-trained dedicated
staff.
Our children have changed both in attitude and aptitude. Attendance of children in school
has improved. Their approach towards learning has changed. They have improved a lot in
their leadership qualities. They are always eagerly waiting for the Dream a Dream
co-coordinator Mr. Kanthakumar and his team.
Appreciations both from the parents and students that we got about service of the
organization have shown that we have chosen the right organization at the right time.
Thank you from the bottom of my heart for Dream a Dream’s commitment and to the valued
members of this group. ~ Words from Vijayakumar, Principal of Lords Convent English School

11
Part 4: Impact Summary of Programme
The dataset used in the formal analysis presents the assessment records of 3081 young
people for the year 2014-2015, from the total of 5400 young people enrolled. In this dataset,
half of the beneficiaries were boys (1542 out of the total 3081) and half were girls (1539 out
of 3081); 61.44% of the participants (1893 out of 3081) were involved in the Life Skill
through Arts programme while the rest of them (1188 out of 3081) were involved in the Life
Skill through Sports programme. The age group of most young people involved in the
programme ranged from 9 to 15, and the details of age distribution are presented by the
histogram and table as below:
For the young people in our dataset, their baseline and endline data in each of the 5 life skills
being measured were recorded, and then we calculated the mean of their baselines and
endlines as Average Baseline and Average Endline, which can be used to evaluate their
overall performance before and after the intervention.
Here are the histograms of Average Baseline and Average Endline distribution:
(X-axis: assessment value; Y-axis: number of people who get this assessment value)

12
As we can see, there is a considerable improvement from baseline to endline assessment,
which can be also observed through their density distribution plot:

13
From the values of baseline and endline, we can get the improvement in each life skill by
using the formula: Improvement = Endline – Baseline. To analyze the overall improvement in
life skills, we calculated the Average Improvement which is the mean of the improvements in
all 5 life skills for each young person, a significant parameter to evaluate the program
efficiency.
Here is the histogram of Average Improvement distribution:
(X-axis: improvement value; Y-axis: number of people who show this improvement value)

14
I. 78.84% of young people show a positive improvement
II. Average improvement value: 0.89
III. Average improvement percentage based on baseline: 30.68%
Part 5: The relation between Baseline and Improvement
In the summary mentioned under Part 1, we stated that the participants with lower baseline
tend to get greater improvement in life skills through our programme, and we will discuss
more details about it in this part. It is reasonable that young people with lower baseline
performance have more potential to get better improvement. To certify this assumption,
firstly, we plot the graph of Average Improvement versus Baseline level:
(X-axis: baseline level; Y-axis: Average Improvement of all the young people with this baseline
level)
As demonstrated by this graph, along with the increase of baseline score, the trend of
average improvement is decreasing. We also obtain the correlation coefficient between
baseline and improvement as -0.667, which indicates there is a strong negative correlation
between them: When the baseline is lower, the improvement tends to be larger.
Part 6: Impact of other factors on Programme Efficiency
We established a linear model with interaction effect to study the relation between
improvement and several effect factors including gender, age, programme type and baseline.

15
The results of this model also indicate that young people with lower baseline tend to get
better improvement, and this effect on improvement is considerably significant.
I. The overall positive improvement and average improvement for each life skill is
shown below:
63.50%
64.00%
64.50%
65.00%
65.50%
66.00%
66.50%
67.00%
Interactingwith others
Overcomingdifficulties and
solvingproblems
Takinginitiative
Managingconflict
Understandingand followinginstructions
Positive Improvement Percentage
Positive Improvement
Percentage Average Improvement
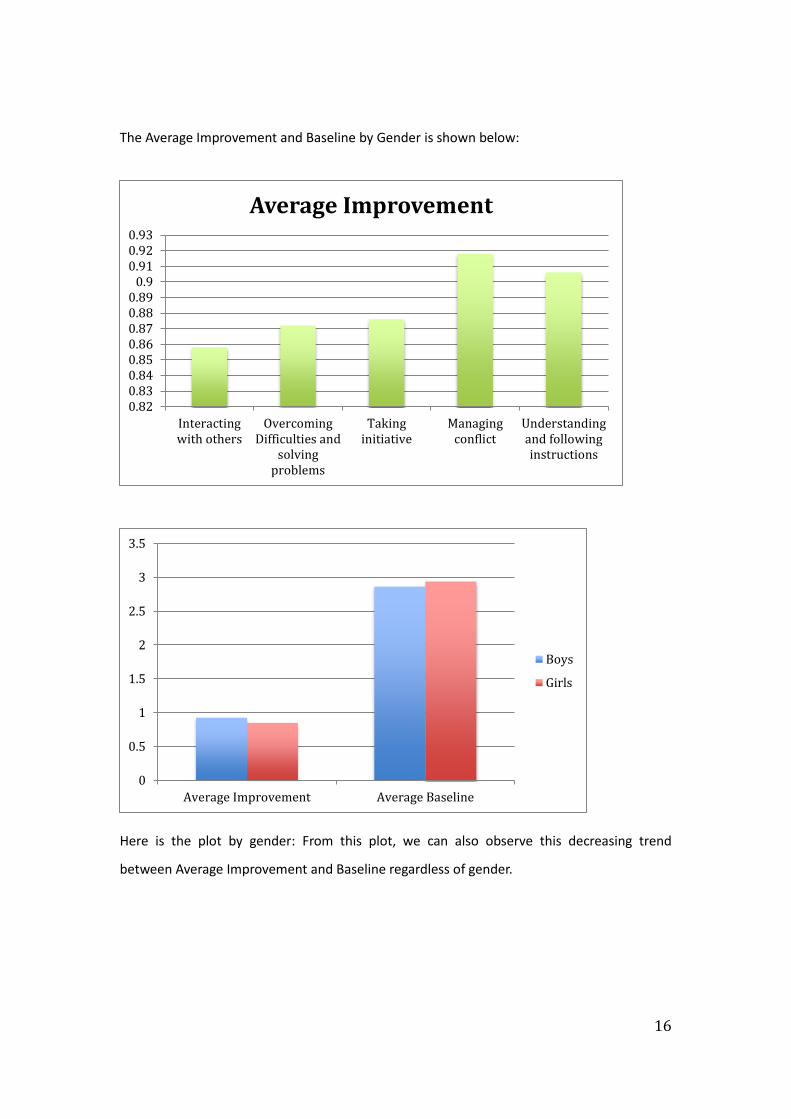
1.Interacting with others 64.7% 0.858
2.Overcoming Difficulties and
solving problems 64.9% 0.872
3.Taking initiative 64.7% 0.876
4.Managing conflict 66.4% 0.918
5.Understanding and following
instructions 66.5% 0.906
16
The Average Improvement and Baseline by Gender is shown below:
Here is the plot by gender: From this plot, we can also observe this decreasing trend
between Average Improvement and Baseline regardless of gender.
0.820.830.840.850.860.870.880.89
0.90.910.920.93
Interactingwith others
OvercomingDifficulties and
solvingproblems
Takinginitiative
Managingconflict
Understandingand followinginstructions
Average Improvement
0
0.5
1
1.5
2
2.5
3
3.5
Average Improvement Average Baseline
Boys
Girls

17
II. Average Improvement and Baseline by Age (we take ages from 9 to 15 since most
young people range within it) is shown below:

18
As we can see, the average baseline increases along with the increase of age, thus the
average improvement should be decreasing along with the increase of age because of the
relation between baseline and improvement. However, the trend of average improvement
versus age is decreasing firstly and then starts to increase at last. Hence we may infer that
besides baseline effect, the age factor would also have influence on improvement.
IV. The Positive Improvement Percentage and Average Improvement by Program Type:
V. Linear Model Analysis with Interaction Effect:
The output below is the analysis result when we use all the data (if we only use data whose
age range from 9 to 16, the result is similar)
74.00%
76.00%
78.00%
80.00%
82.00%
CA FB
Positive Improvement Percentage
0.86
0.87
0.88
0.89
0.9
0.91
CA FB
Average Improvement

19
Baseline, gender, age, programme type and all of their interaction effects were considered in
this linear model analysis. If we set P-value criterion as 0.1, the linear model should be:
Improvement=3.81836-1.11773*baseline+0.02947*baseline*age-0.05784*baseline*age (if
type==2)
However, generally the P-value criterion should be set as 0.05. The P-value of interaction
effect of baseline, age and type is 0.0729, which is comparatively large. To find out if we

20
should include this interaction effect in our model, we obtain the plot of Average
improvement versus Age in Life skills through Arts (CA) and Life skills through Sports (FB)
respectively.
As we can see, for most people from 9 to 15, difference between programs are limited,
which suggests us to ignore this interaction effect including program type. Then the final
model should be:
Improvement=3.81836-1.11773*baseline+0.02947*baseline*age
Part 7: Conclusion
In conclusion, baseline is the most significant factor to influence the improvement of
performance: young people with lower baseline tend to obtain better improvement
through our programme. Meanwhile, the effect of age cannot be ignored as well: older
people tend to improve more than younger people, and this improvement difference
between older and younger people will expand along with the increase of baseline.

21
Impact Analysis: Career Connect Programme
Part 1: Introduction
Career Connect programme equips 14-19 year olds with information, skills and access to
opportunities to make a healthy transition to adulthood. We conduct career awareness
workshops, run short-term modules in English, communication skills, money management,
and career guidance and provide access to internships, scholarships, vocational training and
jobs. The program is delivered in two learning centres, based in Bangalore.
In the time period April 2014 to March 2015, 5115 young people were engaged in career
awareness workshops, skill development modules and workshops aimed at developing
computer literacy, proficiency in spoken English, effective communication and awareness of
career options & access to career related information. In this report we would be focusing on
the young people who were part of the life skills based learning sessions of the Career
Connect programme (skills development modules).
The main objective of this report is to analyze and present the impact of the Career Connect
programme for the year 2014-2015.
To present this information
1. We compared the baseline and endline assessment scores across 599 participants to
understand the improvements in life-skills across the 5 life skills measured.
2. Moreover, we also performed further analysis on the dataset of assessment results
to study the effect factors on the programme efficiency.
In conclusion, we found that our programme showed an impressive impact on young people
most lacking in life skills at the start of the programme year: i.e. the participants with lower
baselines showed greater improvement in their life skills scores as compared to participants
with a higher baseline.
To demonstrate the impact of the programme, in part 2 we cover the story of Hajira, who
enrolled in CC programme for the year 2014-2015, as well as an impact summary of the

22
overall programme. This is followed with the details of statistical analysis on the assessment
data collected for this year in part 3 and 5.
Part 2: Story of Hajira
Here is the story of Hajira, a 16-year-old student from Madiwala Government Pre University
College. Her father is an auto driver and her mother is house wife. She has 4 siblings - one
younger brother who is 2 years old, two younger sisters who are going to 7th grade and 8th
grade, and one older sister who has completed her graduation in fashion designing. They
stay in C.P.W Quarters, Koramangala.
As narrated by Hajira,
I have been part of Career Connect Center for a period of two years; I got to know about the
programme from my college. A few people from Career Connect Centre had come to my
college and spoke about the programmes and the opportunities that are available in the
centres like Basic computers, Spoken English programme and many other programmes, so I
enrolled for the Basic Computer programme.
I joined the Career Connect programme to learn about computers, but I realised it is also
about how to talk to people and how to behave with others. For example if I go to interview
how to talk and how to give respect to others I got to know here in the life skills sessions. In
the life skill session I even learnt how to solve problems even before it arises, which was very
helpful and very beneficial.
All that I learnt in the Career Connect programme has affected my life in a very positive way
to take right decisions regarding the future. Initially I was very shy person. When I walk on
the streets many people might ask questions in English I wasn’t able to answer any of that
but now I can talk to them confidently and also I’m able to participate 100% now in college or
anywhere without any hesitation. And now I can even ask directions with the people I don’t
know in English. Even my family and friends have noticed and seen a lot of changes in me.
Like now I’m very outspoken person and my confidence has improved a lot. I now know what
to do in my future, that how I need to set a goal and work towards it.

23
Melvin facilitated the Spoke English module in which Hajira participated and below are his
observations:
Hajira had a lot of potential that I recognised in her, and gave constant support and guidance
for her to do well. Initially she was very shy and spoke only when asked, but as the
programme progressed the young person gave a lot of valid suggestions during the sessions.
Also initially she was only speaking to her friends and later she was speaking to everyone and
showed great improvement in her confidence level.
She was very confused about her future plans. She had three options (Teacher, Lawyer and
Social Worker) in her mind and she wanted to pursue all the three options! After coming to
our programme she has come to the conclusion that she would choose one option that she
best fits her personality and has finally made a choice to become a lawyer.
Life Skill assessment data of Hajira - Baseline and Endline 2014-15
Interacting
with
others
Overcoming
difficulties and
solving
problems
Taking
Initiative
Managing
Conflict
Understanding
and following
Instructions
Baseline
Score 1 2 2 1 2
Endline
Score 3 3 3 3 4
As demonstrated by this table, we can see Hajira has improved on all 5 life skills.
The improvement in “Interacting with each other” corroborates with her efforts to
communicate with others confidently.

24
Part 3: Impact Summary of Programme
The dataset used in the formal analysis presents the assessment records of 599 young
people for the year 2014-2015, from the total of 1449 young people enrolled. In this dataset,
46.9% of the beneficiaries were boys (281 out of the total 599) and 53.1% were girls (318 out
of 599); 47.9% of the participants (287 out of 599) were involved in Career Connect Centre
1(CCC1) while the rest of them (312 out of 599) enrolled in CCC 2. The age of most young
people involved in this programme range from 14 to 19, and the details of age distribution
are presented by the histogram and table as below:
As we know, the assessment measures the change in life skills brought about by the Career
Connect programme. For the young people in our dataset, their baseline and endline data in
each of the 5 life skills being measured were recorded, and then we calculated the mean of
their baselines and endlines of these 5 life skills as Average Baseline and Average Endline,
which can be used to evaluate their overall performance before and after the intervention.
Here are the histograms of Average Baseline and Average Endline distribution:
(X-axis: assessment value; Y-axis: number of people who get this assessment value)

25
As we can see, there is a tremendous improvement from baseline to endline assessment,
which can be also observed through their density distribution plot:

26
From the values of baseline and endline, we can get their improvement for each life skill by
using the formula: Improvement = Endline – Baseline. To analyze the overall improvement in
life skills, we calculated the mean of these improvements for each young people as Average
Improvement, a significant parameter to evaluate the programme efficiency.
Here is the histogram of Average Improvement distribution:
(X-axis: improvement value; Y-axis: number of people who get this improvement value)
I. 100% of young people show a positive improvement
II. Average improvement value: 2.854
III. The average improvement percentage based on baseline: 193.7%.
Part 4: The relation between Baseline and Improvement
In the summary mentioned under Part 1, we stated that the participants with lower baseline
tend to get greater improvement in life skills through our programme, and we will discuss
more details about it in this part. It is reasonable that young people with lower baseline
performance have more potential to get better improvement. To certify this assumption,
firstly, we plot the graph of Average Improvement versus Baseline level:
(X-axis: baseline level; Y-axis: Average Improvement of all the young people with this
baseline level)

27
As demonstrated by this graph, along with the increase of baseline level, the trend of
average improvement reaches peak when baseline is 1.2, and then it slumps. After that the
rough trend continues to decrease (although this decreasing trend may not be quite stable).
We then obtained the correlation coefficient between baseline and improvement as -0.645,
which indicates there is a strong negative correlation between them: When the baseline is
lower, the improvement tends to be larger.
Part 5: Impact of other factors on Programme Efficiency
We established a liner model with interaction effect to study the relation between
improvement and several effect factors including gender, age, programme type and baseline.
The results of this model also indicate that young people with lower baseline tend to get
better improvement, and this effect on improvement is considerably significant.
I. The overall positive improvement and average improvement for each life skill is
shown below:

28
2.7
2.75
2.8
2.85
2.9
2.95
Average Improvement
Average Improvement
Positive Improvement
Percentage Average Improvement
1.Interacting with others 100% 2.922
2.Overcoming Difficulties and
solving problems 99.83% 2.886
3.Taking initiative 99.83% 2.830
4.Managing conflict 99.67% 2.786
5.Understanding and following
instructions 99.83% 2.848

29
II. The Average Improvement and Baseline by Gender is shown below:
Here is the plot by gender:
From this plot, we can also observe the rough decreasing trend regardless of gender.
III. Average Improvement and Baseline by Age (we take ages from 14 to 20 since most young
people range within it):
0
0.5
1
1.5
2
2.5
3
3.5
Boys Girls
AverageImprovement
Average Baseline

30
IV. The Positive Improvement Percentage and Average Improvement by Centers:

31
VI. Linear Model Analysis with Interaction Effect
Part 6: Conclusion
From the linear model analysis, the most significant variable is baseline data, which has
greatly more influence than gender and age: along with the increase of baseline data, the
improvement will decrease.

32
However, there is also some evidence for the effect of gender: For young people with low
baseline data, boys tend to have better improvement; and for those people with high
baseline data, girls tend to get better improvement. Lastly, for age effect, if the baseline is
very low, such as 1 or 1.2, younger people get better improvement. If baseline exceeds 1.5,
older people perform better.
In 2015-16, in addition to using the DLSAS, Dream a Dream is also using a new tool called
Prepared for Life (PFL) Scale. This is a self-evaluation tool that young people fill up on
enrolment and again on graduation from the programme.

33
Impact Analysis: Teacher Development Programme
Part 1: Introduction
The programme engages adults to deepen impact on and unlock potential of young
people. We use a life skills approach to nurture empathy, expand their creativity, and
develop listening and validation skills and the ability to share with authenticity while also
learning facilitation skills. The model has been adapted from the Creative Community
Model developed by Partners for Youth Empowerment (PYE).
The Dream Teacher Development Programme is delivered through a series of 4 Life Skills
Facilitation workshops spread over 6-8 months. Each workshop is spread across 2 days
focused on
1. Learning to Understand and Express your creative potential
2. Understanding and Engaging with young people with empathy
3. Deepening understanding of how young people learn and developing facilitation skills
4. Celebrating your role in a young person’s life
Part 2: Impact Indicators for 2014-15
• 654 teachers enrolled in the programme impacting over 60,000 young people.
• 253 Teachers / NGO (39%) workers completed all 4 modules of the TD programme
• The programme was spread across 10 cities in India
• In partnership with 24 Partner Schools / Charities
26%
65%
9%
Geographical Spread
Bangalore Rest of Karnataka Outside Karnataka

34
Part 3: Impact of the Programme
The programme is in its pilot phase and impact assessment is done using 2 approaches. A)
Feedback collected from participants at the end of each module of the programme. B)
Stories of Change collected from Teachers / Participants.
Based of Feedback surveys with participants:
LSF #1
65% of participants felt that the training was packed with creativity and imagination and got
the best out of them
85% of participants liked this training very much as it was very knowledgeable and built
courage to help lose reluctance.
70% of participants felt the training provided an opportunity to explore oneself deeper and
understand strengths
LSF #2
79% of participants increased their understanding of a child's feelings, behaviours and their
situations and as a teacher how one can handle children
68% of participants learnt aspects of how to be a community, to intermingle and to work as
one towards the betterment of the community
86% of participants want to implement validation in their personal life and want to listen to
children / people with empathy
Sl No Partners
LSF#1
# of
Responde
nts
Avg Rating
LSF#2
# of
Responde
nts
Avg Rating
LSF#3
# of
Responde
nts
Avg Rating
LSF#4
# of
Responde
nts
Avg Rating Geaography
1 Salaam bombay 21 3.97 21 4.4 21 4.42 Mumbai
2 Timbaktu Collective 14 3.64 16 4.1 15 4.43 15 4.53 Andhra Pradesh
3 Mount Everest 20 4.19 17 4.5 17 4.18 Bangalore
4 Youth for Seva 25 4.47 21 4.75 21 4.54 17 4.76 Bangalore
5 Lawrence School 25 4.16 22 4.59 17 4.7 Bangalore
6 APSA 24 4.43 24 4.66 20 4.62 15 4.51 Bangalore
7 Samrudhdhi 17 4.47 15 4.66 12 4.47 12 4.77 Bangalore
8 Pearl School 20 4.47 24 4.44 18 4.57 13 4.7 North Karnataka
9 CEI 23 4.44 21 3.52 14 4.15 21 4.52 North Karnataka
10 JA Institute,Batch 1,2 &3 81 4.07 75 3.73 73 4.22 74 4.35 North Karnataka
11 TGV+Unaided 23 4.62 19 4.71 19 4.27 19 4.48 North Karnataka
12 Govt P.E Harihara 82 4.21 75 4.24 70 4.27 29 4.33 North Karnataka
* Total No.Of Responses 309 356 322 270

35
LSF #3
76% of participants learnt the importance of patience and courage. They recognize the
importance of patience needed in a classroom
64% of participants were able to discover their weaknesses and convert them to strengths
82% of participants want to create a new classroom atmosphere by being open minded and
encouraging everyone by providing equal opportunity
LSF #4
69% of participants would like to conduct similar activities in the classroom which will build
creative thinking in students
84% of participants have learnt to control and think about the situations before responding
thus building a positive atmosphere.
80% of participants feel proud that they have started listening authentically to children in the
classroom and also in their personal life
Part 4: Story of Change
Manjunath is a teacher at the JA Education Institution, Athani, Belgaum. He
participated in the Dream Teacher Development Programme from October 2014
to January 2015 and below is his story of transformation.
“We are learning through having fun” – This is what I thought of the Dream a Dream
training. Everything that I did through the four workshops, I cherished, I enjoyed and I
learnt a lot. The training has made me step outside of the box, and take a big jump
forward.
When I thought of my life in the first training, I reflected back on my past experiences –
the person that I am and what has happened through this time to me. I felt relieved
sharing it with my partner. It was challenging and yet so simple. It made me think of
why I had never done this before. From that experience, I drew strength and
practicality.
Each of the 4 trainings gave me something to think about, and something to take back

36
to my life and my classroom. In the second training, I understood what it means to see
from a child’s perspective. When I went back, I started interacting with children more
closely, and looking at the ‘why’ of things not just the ‘what’.
Recently, a young boy in my class, who is not good in academics, came to me and spoke
about participating in the school sports event; I simply didn’t brush his interest aside.
The other students in the class were not encouraging of him and my colleague also told
me clearly that since he needs to focus on academics, I should not give him this
opportunity as it will only distract him. I would have done exactly the same, but now I
looked at this boy differently. For me, it was about building the young person’s
confidence, and to understand that sports was the avenue which would do it for him.
He participated in the event and won; the moment was only a reinforcement of how
much my belief in the child is tied into his belief of his own abilities. I continue to really
see each child as unique with unique strengths.
My own confidence has greatly increased with every training. I was very hesitant
initially to participate in different art forms such as music, dance, drama, but that fear
dissipated and it became much easier. Today there is a huge change in my own teaching
method, while learning through fun I realized how boring my classes were earlier!
I am much more proactive and use a lot of fun-based learning in my classrooms.
Children give me feedback and I enjoy listening to them and talking to each one
individually. My vision of my dream classroom that I created in the last workshop has
stayed with me. I am driving towards my vision, knowing that it is possible.
Management Testimonial: Shrishail is a teacher and also part of the management
at J.A. Education Institution at Athani, Belgaum. He participated in the Dream
Teacher Development Programme from October 2014 - January 2015 and below
is his testimonial on behalf of the school.
The training organized by Dream a Dream continues to be very relevant to us. I was a
participant in all the training workshops both as a teacher and as management I have

37
seen a big change within the institution. One big area where I see the change is how the
teachers are coming together to support each other. Today, I find them to be more
understanding. We recently organized a grand event for all the children and I saw
how each teacher was helping the other, and what a difference it made to the
programme which was a huge success.
The training gave us a huge insight into understanding the child and how we can create
that interest in him/her. It gave us a different perspective into working with children
which I know for sure will be very useful in strengthening our work with them.
Overall, the training was very well designed and organized. As someone who is part of
the management, the training also made me much more spontaneous and think of how
within the institution I can plan things more creatively. I am communicating more with
teachers now and listening to their ideas. In fact, I find that the female teachers at the
school, who were very quiet, are also opening up and sharing their views. The training
has created a safe environment for everyone to be more friendly and approachable.
Creating opportunities as I go forward for everyone in my school, be it the teachers and
the students, is what I want to do.
Part 5: Conclusion
In conclusion, there is definite interest in the programme since the feedback ratings are
consistently and at 4 or above out of 5 across the board. Majority of the participants are
learning more about themselves, rediscovering their passion as a teacher, learning to
understand the child and building core skills as facilitators of learning. In 2015-16, we are
working towards building a teacher assessment scale and once the endline data from
DLSAS comes in, we will know if the learning is translating to impact on the children in the
classroom.

38
Acknowledgements
We are grateful to Yong Xianglong for all the statistical analysis for the ALS Program and the
CC Program in this impact report. Yong Xianglong, originally from Sichuan, China, is a current
senior at National University of Singapore, was awarded full scholarship from Singapore
Ministry of Education. During his time in Bangalore this summer, he worked with Dream a
Dream to analyze and present the impact of Dream a Dream programmes as well as perform
statistical analysis on the dataset of assessment results.

39
Appendix The Dream Life Skills Assessment Scale used for the impact analysis is as below:
Dream Life Skills Assessment Scale (DLSAS) Please complete this scale while observing, or as soon as possible after observing, the child. You may
need to spend some time observing before you decide on your rating. Do not spend too long thinking
about each question, just record your impression. For each question, consider age appropriateness
(think of actual age, rather than physical appearance).
Mark the most relevant number in the boxes for each question. The comments box can be used to
provide example observations that helped you to decide on your rating, or for other comments.
Name of child Gender Name of assessor
Actual age How old does the child look? Is the child having difficulty working in a
language other than his/her native language?
Does
not yet
do
Does
with lots
of help
Does
with
some
help
Does
with a
little
help
Does
independently
IO. Interacting with others
For example, does X interact appropriately with peers, staff,
opposite sex? Does X communicate effectively? Does X show
sensitivity to others’ needs and feelings?
1
2
3
4
5
Comments
DP. Overcoming difficulties and solving problems
For example, does X find a way around obstacles that arise?
Does X ask for help appropriately? Does X solve problems
successfully?
1
2
3
4
5
Comments

40
TI. Taking initiative
For example, does X carry out tasks without being told? Does
X show age-appropriate leadership?
1
2
3
4
5
Comments
MC. Managing conflict
For example, does X show appropriate assertiveness? Does X
resolve disagreements appropriately? Does X accept
appropriate discipline? Does X do this without violence or
foul language or running away?
1
2
3
4
5
Comments
UI. Understanding and following instructions
Does X understand appropriate instructions when given?
Does X comply with instructions? Does X ask for clarification
when needed?
1
2
3
4
5
Comments
OS. FOR THE OVERALL SCORE, ADD ALL ITEMS
AND DIVIDE BY 5
1
2
3
4
5
Comments