2014-15 Statement of Accounts · Chartered Institute of Public Finance and Accountancy (CIPFA), the...
128
2014-15 Statement of Accounts
Transcript of 2014-15 Statement of Accounts · Chartered Institute of Public Finance and Accountancy (CIPFA), the...

2014-15
Statement of Accounts

Contents
Explanatory Foreword ................................................................................................................................................................... 1
Review of the Financial Year ....................................................................................................................................................... 2
Statement of Responsibilities ..................................................................................................................................................... 7
Independent Auditors’ Report to the Members of the London Borough of Redbridge ..................................... 8
Movement in Reserves Statement.......................................................................................................................................... 12
Comprehensive Income and Expenditure Statement .................................................................................................... 14
Balance Sheet ................................................................................................................................................................................. 15
Cash Flow Statement ................................................................................................................................................................... 16
Notes to the Accounts ................................................................................................................................................................. 18
Housing Revenue Account Income and Expenditure Statement .............................................................................. 80
Notes to the Housing Revenue Account .............................................................................................................................. 82
Collection Fund .............................................................................................................................................................................. 85
Notes to the Collection Fund .................................................................................................................................................... 86
Group Accounts ............................................................................................................................................................................. 87
Notes to the Group Financial Statements ........................................................................................................................... 93
Pension Fund Account for the Year Ended 31 March 2015 .......................................................................................... 95
Notes to the Pension Fund Account ...................................................................................................................................... 96
Annual Governance Statement 2014/15 .......................................................................................................................... 111
Glossary .......................................................................................................................................................................................... 120
Abbreviations used in Accounts........................................................................................................................................... 124

Notes to the Accounts Index
Note 1 2 3 4 5 6 7 8 9 10 11 12 13 14 15 16 17 18 19 20 21 22 23 24 25 26 27 28 29 30 31 32 33 34 35 36 37 38 39 40 41 42 43
Statement of Accounting Policies Accounting Standards issued but not yet adopted Critical Judgements in applying Accounting Policies Assumptions made about the future and other major sources of estimation uncertainty Prior Period Adjustment Events after reporting Balance Sheet date Adjustments between Accounting basis and funding basis under Regulations Transfer to/from Earmarked Reserves Other Operating Expenditure Financing and Investment Income & Expenditure Taxation and Non-Specific Grant Income Property, Plant and Equipment Information on Assets Held Investment Property Intangible Assets Impairment Losses Private Finance Initiative Debtors Cash and Cash Equivalents Creditors Provisions Financial Instruments Nature and Extent of Risks arising from Financial Instruments Grant Income Disclosure of Deployment of Dedicated Schools Grant in 2014/15 Leases Capital Expenditure & Capital Financing Usable Reserves Unusable Reserves Amounts reported for resource allocation decisions Termination Benefits Officers’ Remuneration Members’ Allowances Related Parties External Audit Costs Internal Trading Operations Agency Services Learning Disability Partnership Mental Health Partnership Other Funds Pension Scheme Accounted for as a Defined Contribution Scheme Defined Benefit Pension Scheme Contingent Liabilities
Page(s)
18-31 31
31-32
32 33-34
35
35-37 38-39
39 39 39
40-43 43 44 44 45
45-46 46 46 47 47
48-50 50-54 55-56 56-57 57-59 59-60
60 60-64 65-68
69 69-70
70 71-72
72 73
73-74 74 74 75 75
75-79 79

London Borough of Redbridge Statement of Accounts 2014/15
1
Explanatory Foreword
Introduction The purpose of the Statement of Accounts is to summarise the financial performance for the financial year 2014/15 and the overall financial position of the Authority. This foreword aims to give a general guide to the main features of the information reported within the rest of the Accounts. The Statement of Accounts for 2014/15 has been prepared on an International Financial Reporting Standards (IFRS) basis. The framework within which these Accounts are prepared and published is regulated by the Chartered Institute of Public Finance and Accountancy (CIPFA), the Financial Reporting Advisory Board and HM Government. The requirements governing the preparation of the accounts mean that technical terminology is used. A glossary of key terms is set out on pages 120 to 123 at the end of the document. Abbreviations are set out on page 124. An explanation of the key financial statements including explanatory notes and other relevant supplementary information is also provided. The key financial statements set out within this document include:
• Movement in Reserves Statement (MiRS) – This Statement provides a summary of the movement on the different reserves held by the Authority over the course of the financial year. These reserves represent the Authority’s net worth and are divided into “usable” which are those that can be used to fund expenditure or reduce Council Tax and “unusable” which cannot.
• Comprehensive Income and Expenditure Statement (CIES) – This Statement brings together all of
the functions of the Authority and reports on the Authority’s cost of services in accordance with International Financial Reporting Standards rather than amounts funded from Council Tax and Government Grants. The amounts funded from Council Tax and Governments Grants differs from this by a series of adjustments made in accordance with regulations. These adjustments are made in the Movement in Reserves Statement.
• Balance Sheet – This records the Authority’s year-end financial position. It shows the balances and
reserves at the Authority’s disposal, its long term debt, net current assets or liabilities, and summarises information on the non-current assets held. It excludes the Pension Fund.
• Cash Flow Statement – This summarises the inflows and outflows of cash arising from transactions
with third parties for both capital and revenue.
• Notes to the Financial Statements – The notes provide more detail about the items contained in the key financial statements, the Authority’s Accounting Policies and other information to aid the understanding of the financial statements.
• Housing Revenue Account (HRA) – This records the Authority’s statutory obligations to account
separately for the cost of the landlord role in respect of the provision of Council Housing.
• Collection Fund – The Authority is responsible for collecting council tax and non-domestic rates. Proceeds of council tax are distributed to the Authority and the Greater London Authority (GLA). From the 1 April 2013, the Business Rate Retention Scheme has made Local Authorities responsible for the collection of Business Rates and to share the proceeds on a proportional basis with Central Government and the GLA. The Fund shows income due and the application of the proceeds.
• Group Accounts – The Authority has a material interest in Vision - Redbridge Culture and Leisure
(VRCL). The Group Accounts show the consolidated position of the activities of the Authority and VRCL.
• Pension Fund – The Pension Fund Accounts show the contributions from the Authority, participating employers and employees for the purpose of paying pensions. The Fund is separately managed by the Authority acting as trustee and its Accounts are separate from those of the Authority, but are included here in accordance with proper practice.

London Borough of Redbridge Statement of Accounts 2014/15
2
Review of the Financial Year
This section sets out some of the key features of the Authority's financial performance for 2014/15. The budgetary context for 2014/15 saw significant financial challenges for Redbridge, similar to those faced by all local authorities, including a £12.2 million or 10.4% reduction in mainstream funding provided by central government compared to 2013/14 on a like for like basis. The 2014/15 financial year also marked the second year of the new business rates retention scheme for local government finance. The Authority set a balanced and sustainable budget that addressed spending pressures whilst protecting frontline services wherever possible and continued to freeze Council Tax. At their meeting on 6th March 2014 the Authority approved spending proposals that:
• Set a Net Revenue Budget requirement of £189.9 million;
• Included savings of £5.2 million – the majority of which was to be delivered through efficiencies or cuts in back office services with minimal impact on frontline services;
• Continued the freeze in Council Tax for the fifth year running [0% increase on the 2009/10 Average Band D level - £1,095.53 - Redbridge element only];
• Approved a five-year Capital Programme of £241.5 million with £58 million funded from external resources.
Revenue and Budget Outturn The General Fund revenue budget relates to the day to day running expenses of the services that the Council provides during the year. The final outturn position for the year against budget is set out below together with the sources of income from which the Authority's net revenue expenditure was financed.
Cluster (Service) Budget 2014/15
£’000
Actual 2014/15
£’000
Variance 2014/15
£’000 Adults Social Services and Housing & Public Health
71,611
71,886
275
Children’s Services 60,475 61,123 648 Environment and Community Services 46,291 45,804 (487) Finance and Resources 16,700 16,638 (62) Chief Executive, Legal and Constitutional Services
3,368
3,184
(184)
Total –Cluster spend 198,445 198,635 190 Borrowing costs net of interest 11,088 10,326 (762) Levies Net Contribution from reserves Capital charges to service areas Non ring-fenced grants
14,808 (2,028)
(21,297) (13,011)
14,808 (2,028)
(21,297) (13,011)
- - - -
Other costs in total 1,932 2,487 555
Total General Fund – Net 189,937 189,920 (17)
Funded by: Budget
2014/15 £’000
Actual 2014/15
£’000 Mainstream Grant (RSG and ‘Top-Up’) 88,905 88,905 Retained Business Rates Council Tax Receipts Collection Fund Surplus
14,352 86,280
400
14,352 86,280
400
189,937 189,937
Surplus for Year - 17 General Fund Working Balance 31/03/14 17,084 17,084
Balance 31/03/2015 17,084 17,101
London Borough of Redbridge Statement of Accounts 2014/15
3
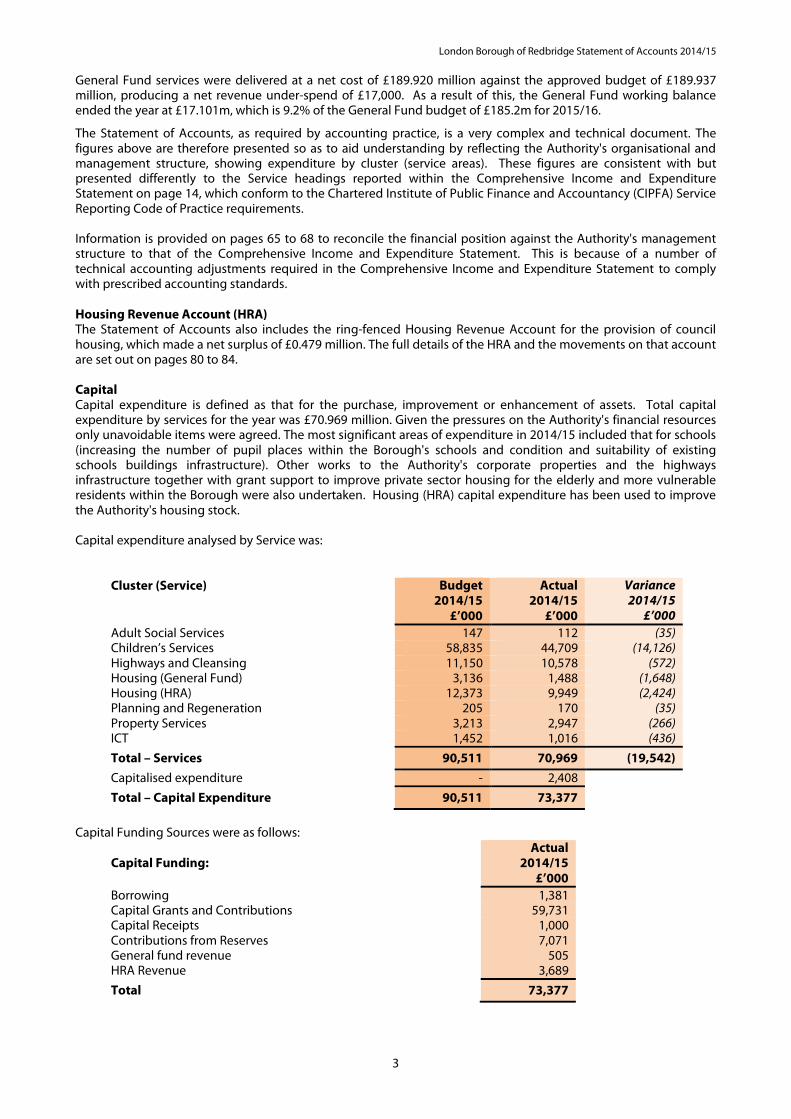
General Fund services were delivered at a net cost of £189.920 million against the approved budget of £189.937 million, producing a net revenue under-spend of £17,000. As a result of this, the General Fund working balance ended the year at £17.101m, which is 9.2% of the General Fund budget of £185.2m for 2015/16.
The Statement of Accounts, as required by accounting practice, is a very complex and technical document. The figures above are therefore presented so as to aid understanding by reflecting the Authority's organisational and management structure, showing expenditure by cluster (service areas). These figures are consistent with but presented differently to the Service headings reported within the Comprehensive Income and Expenditure Statement on page 14, which conform to the Chartered Institute of Public Finance and Accountancy (CIPFA) Service Reporting Code of Practice requirements. Information is provided on pages 65 to 68 to reconcile the financial position against the Authority's management structure to that of the Comprehensive Income and Expenditure Statement. This is because of a number of technical accounting adjustments required in the Comprehensive Income and Expenditure Statement to comply with prescribed accounting standards. Housing Revenue Account (HRA) The Statement of Accounts also includes the ring-fenced Housing Revenue Account for the provision of council housing, which made a net surplus of £0.479 million. The full details of the HRA and the movements on that account are set out on pages 80 to 84. Capital Capital expenditure is defined as that for the purchase, improvement or enhancement of assets. Total capital expenditure by services for the year was £70.969 million. Given the pressures on the Authority's financial resources only unavoidable items were agreed. The most significant areas of expenditure in 2014/15 included that for schools (increasing the number of pupil places within the Borough's schools and condition and suitability of existing schools buildings infrastructure). Other works to the Authority's corporate properties and the highways infrastructure together with grant support to improve private sector housing for the elderly and more vulnerable residents within the Borough were also undertaken. Housing (HRA) capital expenditure has been used to improve the Authority's housing stock. Capital expenditure analysed by Service was:
Cluster (Service) Budget 2014/15
£’000
Actual 2014/15
£’000
Variance 2014/15
£’000 Adult Social Services 147 112 (35) Children’s Services 58,835 44,709 (14,126) Highways and Cleansing 11,150 10,578 (572) Housing (General Fund) 3,136 1,488 (1,648) Housing (HRA) 12,373 9,949 (2,424) Planning and Regeneration 205 170 (35) Property Services 3,213 2,947 (266) ICT 1,452 1,016 (436)
Total – Services 90,511 70,969 (19,542)
Capitalised expenditure - 2,408
Total – Capital Expenditure 90,511 73,377
Capital Funding Sources were as follows:
Capital Funding: Actual
2014/15 £’000
Borrowing 1,381 Capital Grants and Contributions 59,731 Capital Receipts 1,000 Contributions from Reserves 7,071 General fund revenue 505 HRA Revenue 3,689
Total 73,377

London Borough of Redbridge Statement of Accounts 2014/15
4
The Authority spent £19.5 million less than it planned on its approved capital programme for 2014/15. This included £17.1 million (£13.6 million of its own resources and £3.5 million of external resources) that it will carry forward and spend in the following year as originally approved. The remaining unspent balance of £2.4 million that is no longer required to fund the previously approved schemes will also be carried forward and used to off-set future year capital scheme costs. Details of the Authority's capital expenditure and capital financing in 2014/15 are set out on pages 59 to 60. Borrowing The Authority undertakes long term borrowing for periods in excess of one year in order to finance capital spending and to replace maturing debt. The Authority satisfies its borrowing requirement for this purpose by securing external loans. However, the Authority is able to temporarily defer the need to borrow externally by using the cash it has set aside for longer term purposes; this practice means that there is not always a direct link between the need to borrow to pay for capital spend and the level of external borrowing. The effect of using the cash set aside for longer term purposes to temporarily defer external borrowing is to reduce the level of cash that the Authority has available for investment. In 2014/15, the Authority was required to make provision to borrow £6.3 million towards the cost of financing the General Fund capital programme. Investments The Authority's Annual Investment Strategy, which is incorporated in the Treasury Management Strategy, outlines the Authority's investment priorities. The Authority aims to achieve the optimum return on investments commensurate with appropriate level of security and liquidity. The security of assets remains paramount. In the current economic climate it is considered appropriate to keep investments short term, and only invest with highly credit rated financial institutions. A list of organisations with which funds could be invested was compiled with reference to the credit ratings issued by the credit agencies Fitch, Moody’s and Standards & Poor’s and was kept under regular review during the year. There were no losses from non-performance by any of the Council’s counterparties in 2014/15. Further details of investment activities are provided within Note 23 on pages 50 to 54.

London Borough of Redbridge Statement of Accounts 2014/15
5
Forward Look 2015/16
The Authority approved its spending plans for 2015/16 onwards at the Full Council meeting on 5th March 2015. This included approval of a three-year revenue budget and five-year capital programme both set within the context of continued large scale Government grant cuts and demand pressures on services. Redbridge’s approved Net Revenue Budget for 2015/16 is £185.2 million which is a reduction of £4.7 million on the 2014/15 figure of £189.9 million. The approved budget has been achieved despite a reduction of £15.8 million or 14.8% in the Council’s core funding provided by central government. Approved increases in spending within the overall budget have been driven by demographic growth (most notably from an increase in demand for care services both across the adult and child population) together with other unavoidable cost increases (general inflation, levy costs and other legislative changes). As in previous years the Authority has a policy of carrying forward resources that allow it to develop and implement service transformation initiatives that deliver longer term savings in core service costs. Approved reductions in spending during 2015/16 have been developed as part of a budget review process designed to protect front-line service delivery wherever this is possible. The majority of savings that will be delivered in 2015/16 will either be through the adoption of more efficient service delivery processes, from improvement in procurement arrangements and/or those that impact at a back office level only. In addition spending plans to 2017/18 assume the delivery of a minimum £19.1 million of savings from a range of cross cutting as well as service specific transformation project initiatives. Cross cutting savings are centred around radically improving the way the Council works by adopting smarter and lean working initiatives, identifying and implementing alternative service delivery models, and by making better use of assets. Balancing spending through the measures set out above has enabled the Authority to freeze the average Band D Council Tax at £1,095.53 (excluding the GLA precept) for the sixth year running. Forward revenue budget projections currently show a balanced budget in 2016/17 which is based on a further freeze in Council Tax and for 2017/18 currently show a funding gap of £32.9 million. It is important to note however that the three-year medium term revenue budget plans include the proposed use of £29.9 million of one-off reserves. The Authority is therefore exploring options to decrease core and service spending over the short to medium term which will maximise benefits from the Council’s transformation savings programme and ways to increase resource funding. The 2016/17 budget process will address the forecast gap of £32.9 million in 2017/18, including the effect of growing service pressures and further cuts in Government funding.` Gross Revenue Expenditure – is estimated at £559 million in 2015/16. This includes funding for Schools and Public Health but does not include Housing Benefit Payments that are directly off-set from the Department of Work and Pensions (DWP) that are estimated at £158 million in 2015/16. The following pie chart sets out the proportional split of gross revenue expenditure across the relevant service definitions and the table to the right how this expenditure will be funded: Revenue Spending – Service Spend Analysis
Funding by:
£m % Fees and charges 82.7 15 Specific grants 61.7 11 Dedicated schools grant
229.2
41
RSG & top up grant
74.4
13
Business rates 17.1 3 Council tax 88.3 16 Collection fund 5.5 1 Total 558.9 100

London Borough of Redbridge Statement of Accounts 2014/15
6
Capital Expenditure – The Authority’s approved 2015/16 (rolling) five-year capital spending plans include capital expenditure of £276.9 million of which £193.4 million (70%) will be funded from the Authority’s own resources and £83.5 million (30%) from external resources. Capital spending pressures continue to be dominated by the demand for pupil places within the Borough’s schools and other condition and suitability works to schools buildings (accounting for £140 million, approximately 50% of the total planned expenditure). The remaining balance of funding is being used to support other unavoidable maintenance and improvement works on the Authority’s non-schools asset base such as corporate buildings, housing and the highways network infrastructure.
Capital Spending – Service Spend Analysis
Funding by:
£m % Borrowing 103.9 38 Capital grants 66.4 24 External funding
83.5
30
Capital reserve & Community infrastructure levy
23.1
8 Total 276.9 100
Key Financial Pressures – Over the coming year the Authority is faced with the challenge of:
• Containing service delivery costs within approved budgets, notwithstanding price base changes, demographic and other service spending pressures,
• Delivering planned savings within the timescales and at the levels set within the approved budgets,
• Manage evolving risks as the Authority goes through a process of change.
• Planning for continued reductions in resources over the medium/longer term. Conclusion
The Statement of Accounts provides a very detailed and comprehensive picture of the Authority's performance for 2014/15, as required by statute. Many thanks are due to all those in the Finance Service and throughout the Council who have helped to prepare this document. A widespread understanding of the Council's financial position will become ever more important in light of the financial challenges that we face. I hope that Members of the Council, residents of the Borough and other readers find this document useful. Mark Green, CPFA Chief Financial Services Officer (Section 151 Officer) 24 September 2015

London Borough of Redbridge Statement of Accounts 2014/15
7
Statement of Responsibilities
The Authority’s Responsibilities
The Authority is required to:
• Make arrangements for the proper administration of its financial affairs and to ensure that one of its officers has the responsibility for the administration of those affairs. In this Authority, that officer is the Section 151 Officer;
• Manage its affairs to secure economic, efficient and effective use of resources and safeguard its assets;
• Approve the Statement of Accounts.
The Section 151 Officer’s Responsibilities
The Section 151 Officer is responsible for the preparation of the Authority’s Statement of Accounts in accordance with proper practices as set out in the CIPFA/LASAAC Code of Practice on Local Authority Accounting in the United Kingdom (‘the Code’).
In preparing this Statement of Accounts the Section 151 Officer has:
• selected suitable accounting policies and then applied them consistently;
• made judgements and estimates that were reasonable and prudent;
• complied with the Local Authority Code.
The Section 151 Officer has also:
• kept proper accounting records which were up to date;
• taken reasonable steps for the prevention and detection of fraud and other irregularities.
Statement of the Section 151 Officer
I certify that the Statement of Accounts presents a true and fair view of the financial position of the Authority at the 31 March 2015 and of its income and expenditure for the year ending 31 March 2015.
Mark Green, CPFA Chief Financial Services Officer (Section 151 Officer) 24 September 2015

London Borough of Redbridge Statement of Accounts 2014/15
8
Independent Auditors’ Report to the Members of the London Borough of Redbridge (the “Authority”)
Report on the financial statements Our opinion
In our opinion, the London Borough of Redbridge’s Group and Authority Statement of Accounts (the “financial statements”):
• give a true and fair view of the state of the Group and of the Authority’s affairs as at 31 March 2015 and of the Group and of the Authority’s income and expenditure and cash flows for the year then ended; and
• have been properly prepared in accordance with the requirements of the CIPFA/LASAAC Code of Practice on Local Authority Accounting in the United Kingdom 2014/15 and the CIPFA Service Reporting Code of Practice for Local Authorities 2014/15.
What we have audited
The financial statements comprise:
• the Group and Authority Balance Sheets as at 31 March 2015; • the Group and Authority Comprehensive Income and Expenditure Statements for the year then
ended; • the Group and Authority Movement in Reserves Statements for the year then ended; • the Group and Authority Statements of Cash Flows for the year then ended; • the Housing Revenue Account Income and Expenditure Statement for the year then ended; • the Movement on the Housing Revenue Account Statement for the year then ended; • the Collection Fund for the year then ended; and • the notes to the financial statements, which include a summary of significant accounting policies
and other explanatory information.
The financial reporting framework that has been applied in the preparation of the financial statements is the CIPFA/LASAAC Code of Practice on Local Authority Accounting in the United Kingdom 2014/15 supported by the CIPFA Service Reporting Code of Practice for Local Authorities 2014/15. In applying the financial reporting framework, the Chief Financial Services Officer has made a number of subjective judgements, for example in respect of significant accounting estimates. In making such estimates, they have made assumptions and considered future events.
Opinion on other matter prescribed by the Code of Audit Practice In our opinion, the information given in the explanatory foreword for the financial year for which the financial statements are prepared is consistent with the financial statements.
Other matters on which we are required to report by exception We have nothing to report in respect of the following matters where the Code of Audit Practice issued by the Audit Commission requires us to report to you if:
• in our opinion, the Annual Governance Statement does not comply with ‘Delivering Good Governance in Local Government: a Framework’ published by CIPFA/SOLACE in June 2007 (updated as at December 2012) or is misleading or inconsistent with information of which we are aware from our audit; or
• we issue a report in the public interest under section 8 of the Audit Commission Act 1998; or • we make any recommendations under section 11 of the Audit Commission Act 1998 that requires
the Authority to consider it at a public meeting and to decide what action to take in response ; or • we exercise any other special powers of the auditor under the Audit Commission Act 1998.

London Borough of Redbridge Statement of Accounts 2014/15
9
Responsibilities for the financial statements and the audit Our responsibilities and those of the Chief Financial Services Officer As explained more fully in the Statement of Responsibilities set out on page 7 the Chief Financial Services Officer is responsible for the preparation of the financial statements and for being satisfied that they give a true and fair view in accordance with the CIPFA/LASAAC Code of Practice on Local Authority Accounting in the United Kingdom 2014/15 and the CIPFA Service Reporting Code of Practice for Local Authorities 2014/15.
Our responsibility is to audit and express an opinion on the financial statements in accordance with Part II of the Audit Commission Act 1998, the Code of Audit Practice 2010 – Local Government Bodies issued by the Audit Commission and ISAs (UK & Ireland). Those standards require us to comply with the Auditing Practices Board’s Ethical Standards for Auditors.
This report, including the opinions, has been prepared for and only for the Authority’s members as a body in accordance with Part II of the Audit Commission Act 1998 and for no other purpose, as set out in paragraph 48 of the Statement of Responsibilities of Auditors and of Audited Bodies – Local Government, published by the Audit Commission in March 2010. We do not, in giving these opinions, accept or assume responsibility for any other purpose or to any other person to whom this report is shown or into whose hands it may come save where expressly agreed by our prior consent in writing.
What an audit of financial statements involves We conducted our audit in accordance with International Standards on Auditing (UK and Ireland) (“ISAs (UK & Ireland)”). An audit involves obtaining evidence about the amounts and disclosures in the financial statements sufficient to give reasonable assurance that the financial statements are free from material misstatement, whether caused by fraud or error. This includes an assessment of:
• whether the accounting policies are appropriate to the Group’s and the Authority’s circumstances and have been consistently applied and adequately disclosed;
• the reasonableness of significant accounting estimates made by the Chief Financial Services Officer; and
• the overall presentation of the financial statements.
We primarily focus our work in these areas by assessing the Chief Financial Services Officer’s judgements against available evidence, forming our own judgements, and evaluating the disclosures in the financial statements.
We test and examine information, using sampling and other auditing techniques, to the extent we consider necessary to provide a reasonable basis for us to draw conclusions. We obtain audit evidence through testing the effectiveness of controls, substantive procedures or a combination of both.
In addition, we read all the financial and non-financial information in the Statement of Accounts to identify material inconsistencies with the audited financial statements and to identify any information that is apparently materially incorrect based on, or materially inconsistent with, the knowledge acquired by us in the course of performing the audit. If we become aware of any apparent material misstatements or inconsistencies we consider the implications for our report.
Report on the pension fund accounts Our opinion In our opinion, the pension fund accounts contained within the Statement of Accounts of the London Borough of Redbridge (the “pension fund accounts”):
• give a true and fair view of the financial transactions of the Pension Fund during the year ended 31 March 2015, and the amount and disposition of the fund’s assets and liabilities as at 31 March 2015; and
• have been properly prepared in accordance with the requirements of the CIPFA/LASAAC Code of Practice on Local Authority Accounting in the United Kingdom 2014/15.
What we have audited The pension fund accounts comprise:
• the Net Assets Statement as at 31 March 2015; • the Pension Fund Account for the year then ended; and • the notes to the financial statements, which include a summary of significant accounting policies
and other explanatory information.

London Borough of Redbridge Statement of Accounts 2014/15
10
The financial reporting framework that has been applied in their preparation is the CIPFA/LASAAC Code of Practice on Local Authority Accounting in the United Kingdom 2014/15.
In applying the financial reporting framework, the Chief Financial Services Officer has made a number of subjective judgements, for example in respect of significant accounting estimates. In making such estimates, they have made assumptions and considered future events.
Opinion on other matter prescribed by the Code of Audit Practice
In our opinion, the information given in the explanatory foreword for the financial year for which the pension fund accounts are prepared is consistent with the pension fund accounts.
Responsibilities for the pension fund accounts and the audit
Our responsibilities and those of the Chief Financial Services Officer As explained more fully in the Statement of Responsibilities set out on page 7, the Chief Financial Services Officer is responsible for the preparation of the pensions fund accounts and for being satisfied that they give a true and fair view in accordance with the CIPFA/LASAAC Code of Practice on Local Authority Accounting in the United Kingdom 2014/15.
Our responsibility is to audit and express an opinion on the pension fund accounts in accordance with Part II of the Audit Commission Act 1998, the Code of Audit Practice 2010 – Local Government Bodies issued by the Audit Commission and ISAs (UK & Ireland). Those standards require us to comply with the Auditing Practices Board’s Ethical Standards for Auditors.
This report, including the opinions, has been prepared for and only for the Authority’s members as a body in accordance with Part II of the Audit Commission Act 1998 and for no other purpose, as set out in paragraph 48 of the Statement of Responsibilities of Auditors and of Audited Bodies – Local Government, published by the Audit Commission in March 2010. We do not, in giving these opinions, accept or assume responsibility for any other purpose or to any other person to whom this report is shown or into whose hands it may come save where expressly agreed by our prior consent in writing.
What an audit of pension fund accounts involves We conducted our audit in accordance with International Standards on Auditing (UK and Ireland) (“ISAs (UK & Ireland)”). An audit involves obtaining evidence about the amounts and disclosures in the pension fund accounts sufficient to give reasonable assurance that the pension fund accounts are free from material misstatement, whether caused by fraud or error. This includes an assessment of:
• whether the accounting policies are appropriate to the Pension Fund’s circumstances and have been consistently applied and adequately disclosed;
• the reasonableness of significant accounting estimates made by the Chief Financial Services Officer; and
• the overall presentation of the Pension Fund Accounts.
We primarily focus our work in these areas by assessing the Chief Financial Services Officer’s judgements against available evidence, forming our own judgements, and evaluating the disclosures in the financial statements.
We test and examine information, using sampling and other auditing techniques, to the extent we consider necessary to provide a reasonable basis for us to draw conclusions. We obtain audit evidence through testing the effectiveness of controls, substantive procedures or a combination of both.
In addition, we read all the financial and non-financial information in the Statement of Accounts and the Pension Fund Annual Report to identify material inconsistencies with the audited pension fund accounts and to identify any information that is apparently materially incorrect based on, or materially inconsistent with, the knowledge acquired by us in the course of performing the audit. If we become aware of any apparent material misstatements or inconsistencies we consider the implications for our report.
Conclusion on the Authority’s arrangements for securing economy, efficiency and effectiveness in the use of resources Conclusion On the basis of our work, having regard to the guidance on the specified criteria published by the Audit Commission on 13 October 2014, we are satisfied that, in all significant respects, the London Borough of Redbridge put in place proper arrangements to secure economy, efficiency and effectiveness in its use of resources for the year ending 31 March 2015.
London Borough of Redbridge Statement of Accounts 2014/15
11
What a review of the arrangements for securing economy, efficiency and effectiveness in the use of resources involves
We have undertaken our audit in accordance with the Code of Audit Practice, having regard to the guidance on the specified criteria, published by the Audit Commission on 13 October 2014, as to whether the Authority has proper arrangements for:
• securing financial resilience; and • challenging how it secures economy, efficiency and effectiveness.
The Audit Commission has determined these two criteria as those necessary for us to consider under the Code of Audit Practice in satisfying ourselves whether the Authority put in place proper arrangements for securing economy, efficiency and effectiveness in its use of resources for the year ended 31 March 2015.
We planned our work in accordance with the Code of Audit Practice. Based on our risk assessment, we undertook such work as we considered necessary to form a view on whether, in all significant respects, the Authority had put in place proper arrangements to secure economy, efficiency and effectiveness in its use of resources.
Our responsibilities and those of the Authority
The Authority is responsible for putting in place proper arrangements to secure economy, efficiency and effectiveness in its use of resources, to ensure proper stewardship and governance, and to review regularly the adequacy and effectiveness of these arrangements.
We are required under Section 5 of the Audit Commission Act 1998 to satisfy ourselves that the Authority has made proper arrangements for securing economy, efficiency and effectiveness in its use of resources. The Code of Audit Practice issued by the Audit Commission requires us to report to you our conclusion relating to proper arrangements, having regard to relevant criteria specified by the Audit Commission.
We report if significant matters have come to our attention which prevent us from concluding that the Authority has put in place proper arrangements for securing economy, efficiency and effectiveness in its use of resources. We are not required to consider, nor have we considered, whether all aspects of the Authority’s arrangements for securing economy, efficiency and effectiveness in its use of resources are operating effectively.
Certificate We certify that we have completed the audit of the Group and of the Authority financial statements of the London Borough of Redbridge and of the pension fund accounts of the London Borough of Redbridge in accordance with the requirements of Part II of the Audit Commission Act 1998 and the Code of Practice issued by the Audit Commission.
Ciaran McLaughlin (Senior Statutory Auditor) for and on behalf of PricewaterhouseCoopers LLP Chartered Accountants and Statutory Auditors London 30 September 2015
a) The maintenance and integrity of the London Borough of Redbridge’s website is the responsibility of the directors; the work carried out by the auditors does not involve consideration of these matters and, accordingly, the auditors accept no responsibility for any changes that may have occurred to the Statement of Accounts since they were initially presented on the website.
b) Legislation in the United Kingdom governing the preparation and dissemination of the Statement of Accounts may differ from legislation in other jurisdictions.

London Borough of Redbridge Statement of Accounts 2014/15
12
Movement in Reserves Statement
This statement shows the movement in the year on the different reserves held by the Authority, analysed into ‘usable reserves’ (i.e. those that can be applied to fund expenditure or reduce taxation) and other reserves. The Surplus and Deficit on the Provision of Service line shows the true economic cost of providing the Authority’s services, more details of which are shown in the Comprehensive Income and Expenditure Statement. These are different from the statutory amounts required to be charged to the General Fund Balance and the Housing Revenue Account for council tax setting and dwellings rent setting purposes. The Net Increase/Decrease before Transfers to Earmarked Reserves line shows the statutory General Fund Balance and Housing Revenue Account Balance before any transfers to or from earmarked reserves undertaken by the Authority.
2014/15
Gen
eral
Fu
nd
Bal
ance
£’
000
Earm
arke
d G
ener
al F
un
d R
eser
ves
£’
000
Ho
usi
ng
Rev
enu
e A
cco
un
t £’
000
Earm
arke
d H
RA
Res
erve
s £’
000
Cap
ital
Rec
eip
ts R
eser
ve
£’00
0
Maj
or
Rep
airs
Res
erve
£’
000
Cap
ital
Gra
nts
an
d C
on
trib
uti
on
s
Un
app
lied
£’
000
Tota
l Usa
ble
Res
erve
s £’
000
Un
usa
ble
Res
erve
s £’
000
Tota
l R
eser
ves
£’00
0
Balance at 1 April 2014 brought forward
(17,084) (109,440) (4,916) (5,296) (7,896) (4,816) (40,975) (190,423) (219,883) (410,306)
Movement in Reserves during 2014/15
Deficit / (Surplus) on the provision of services
15,114 0 (2,093) 0 0 0 0 13,021 0 13,021
Other Comprehensive Income and Expenditure
0 0 0 0 0 0 0 0 (29,628) (29,628)
Total Comprehensive Income and Expenditure
15,114 0 (2,093) 0 0 0 0 13,021 (29,628) (16,607)
Adjustment between accounting basis and funding basis under regulations (Note 7)
(9,100) 0 (804) 0 (3,940) (1,576) 15,024 (396) 396 0
Net (Increase) / Decrease before Transfers to Earmarked Reserves
6,014 0 (2,897) 0 (3,940) (1,576) 15,024 12,625 (29,232) (16,607)
Transfers from / (to) Earmarked Reserves (Note 8)
(6,031) 6,031 1,887 (1,887) 0 0 0 0 0 0
(Increase) / Decrease in the year
(17)
6,031
(1,010)
(1,887)
(3,940)
(1,576)
15,024
12,625
(29,232)
(16,607)
Balance at 31 March 2015 carried forward
(17,101) (103,409) (5,926) (7,183) (11,836) (6,392) (25,951) (177,798) (249,115) (426,913)

London Borough of Redbridge Statement of Accounts 2014/15
13
2013/14 - Restated Comparative Figures
Gen
eral
Fu
nd
Bal
ance
£’
000
Earm
arke
d G
ener
al F
un
d R
eser
ves
£’
000
Ho
usi
ng
Rev
enu
e A
cco
un
t £’
000
Earm
arke
d H
RA
Res
erve
s £’
000
Cap
ital
Rec
eip
ts R
eser
ve
£’00
0
Maj
or
Rep
airs
Res
erve
£’
000
Cap
ital
Gra
nts
Un
app
lied
£’
000
Tota
l Usa
ble
Res
erve
s £’
000
Un
usa
ble
Res
erve
s £’
000
Tota
l R
eser
ves
£’00
0
Balance at 1 April 2013 brought forward
(15,816) (98,619) (3,850) (3,608) (3,672) (1,515) (62,056) (189,136) (247,250) (436,386)
Movement in Reserves during 2013/14
Deficit / (Surplus) on the provision of services
60,138 0 (9,092) 0 0 0 0 51,046 0 51,046
Other Comprehensive Income and Expenditure
0 0 0 0 0 0 0 0 (24,966) (24,966)
Total Comprehensive Income and Expenditure
60,138 0 (9,092) 0 0 0 0 51,046 (24,966) 26,080
Adjustment between accounting basis and funding basis under regulations (Note 7)
(72,227) 0 6,338 0 (4,224) (3,301) 21,081 (52,333) 52,333 0
Net (Increase) / Decrease before Transfers to Earmarked Reserves
(12,089) 0 (2,754) 0 (4,224) (3,301) 21,081 (1,287) 27,367 26,080
Transfers from / (to) Earmarked Reserves (Note 8)
10,821 (10,821) 1,688 (1,688) 0 0 0 0 0 0
(Increase) / Decrease in 2013/14
(1,268) (10,821) (1,066) (1,688) (4,224) (3,301) 21,081 (1,287) 27,367 26,080
Balance at 31 March 2014 carried forward
(17,084) (109,440) (4,916) (5,296) (7,896) (4,816) (40,975) (190,423) (219,883) (410,306)
2013/14 values have been restated. Please refer to Note 5 on pages 33-34 for details.

London Borough of Redbridge Statement of Accounts 2014/15
14
Comprehensive Income and Expenditure Statement
This statement shows the accounting cost in the year of providing services in accordance with generally accepted accounting practices, rather than the amount to be funded from taxation. Authorities raise taxation to cover expenditure in accordance with regulations; this can be very different in some respects from the accounting cost. The taxation position is shown in the Movement in Reserves Statement.
Restated 2013/14 2014/15 Gross Expenditure £’000
Gross Income £’000
Net Expenditure £’000
Notes
Gross Expenditure £’000
Gross Income £’000
Net Expenditure £’000
43,765
(41,585) 2,180 Central Services to the Public 47,790 (41,272) 6,518
18,275 (770) 17,505 Cultural and Related Services
14,136 (1,578) 12,558
24,572 (4,924) 19,648 Environmental and Regulatory Services 22,269 (4,994) 17,275
6,438 (2,800) 3,638 Planning Services 6,316 (3,093) 3,223
359,988 (291,107) 68,881 Education and Children’s Services 358,113 (281,811) 76,302
37,054 (15,369) 21,685 Highways and Transport Services 36,314 (13,381) 22,933
25,140 (28,495) (3,355) Local Authority Housing (HRA) 27,626 (29,068) (1,442)
197,850 (183,774) 14,076 Other Housing Services 201,382 (186,195) 15,187
91,279 (27,274) 64,005 Adult Social Care 93,349 (29,473) 63,876
9,841 (10,374) (533) Public Health 11,411 (12,106) (695)
6,534 (1,150) 5,384 Corporate and Democratic Core 6,218 (878) 5,340
2,569 0
2,569
Non distributed costs 2,185 0 2,185
0 (3,325) (3,325) Non distributed costs (Pensions) 0 0 0
823,305 (610,947) 212,358 Cost of Services 827,109 ( 603,849) 223,260
82,725 Other operating expenditure 9 24,561
19,117 Financing and investment income and expenditure 10
17,812
(263,154) Taxation and non-specific grant income 11
(252,612)
51,046 Deficit on the provision of services 13,021
(7,048) (Surplus)on revaluation of non-current assets 29a
(59,411)
(17,918) Actuarial losses / (gains) on pension assets / liabilities 42
29,858
0 (Surplus) on revaluation of available for sale financial assets
(75)
(24,966) Other Comprehensive Income and Expenditure
(29,628)
26,080 Total Comprehensive Income and Expenditure
(16,607)
2013/14 values have been restated. Please refer to Note 5 on pages 33-34 for details.

London Borough of Redbridge Statement of Accounts 2014/15
15
Balance Sheet The Balance Sheet shows the value as at the Balance Sheet date of the assets and liabilities recognised by the Authority. The net assets of the Authority (assets less liabilities) are matched by the reserves held by the Authority. Reserves are reported in two categories. The first category of reserves are usable reserves, i.e. those reserves that the Authority may use, subject to the need to maintain a prudent level of reserves and any statutory limitations on their use (for example the Capital Receipts Reserve that may only be used to fund capital and repay debt). The second category of reserves is those that the Authority is not able to use. This category of reserves includes reserves that hold unrealised gains and losses (for example the Revaluation Reserve), where amounts could only be realised if the assets are sold and reserves that hold timing differences shown in the Movement in Reserves Statement line ‘Adjustments between accounting basis and funding basis under regulations’.
Restated 1 April
2013 £’000
Restated 31 March
2014 £’000
Notes
31 March
2015 £’000
803,255 760,057 Property, Plant & Equipment 12 821,125
25,711 25,792 Investment Property 14 25,804
437 259 Intangible Assets 15 275
2,677 0 Long Term Investments 22 10,161
2,728 2,620 Long Term Debtors 18 2,340
834,808 788,728 Long Term Assets
859,705
138,663 145,532 Short Term Investments 22 160,791
204 176 Inventories 143
40,000 43,548 Short Term Debtors 18 32,594
18,819 13,246 Cash and Cash Equivalents 19 18,319
197,686 202,502 Current Assets 211,847
(14,179) (8,611) Short Term Borrowing 22 (8,782)
(67,551) (65,206) Short Term Creditors 20 (68,069)
(476) (266) Revenue Grants Receipts in advance (178)
(2,226) (1,462) Capital Grants Receipts in Advance 24 (1,030)
(84,432) (75,545) Current Liabilities
(78,059)
(10,905) (12,158) Provisions 21 (12,869)
(162,362) (165,085) Long Term Borrowing 22 (184,064)
(337,982) (328,136) Other Long Term Liabilities 22 & 42 (369,647)
(427) 0 Capital Contributions Receipts in Advance 0
(511,676) (505,379) Long Term Liabilities (566,580)
436,386 410,306 Net Assets 426,913
189,136 190,423 Usable Reserves 28 177,798
247,250 219,883 Unusable Reserves 29 249,115
436,386 410,306 Total Reserves 426,913
2013/14 values have been restated. Please refer to Note 5 on pages 33-34 for details.
Mark Green, CPFA Chief Financial Services Officer (Section 151 Officer) 24 September 2015

London Borough of Redbridge Statement of Accounts 2014/15
16
Cash Flow Statement The Cash Flow Statement shows the changes in cash and cash equivalents of the Authority during 2014/15. The Statement shows how the Authority generates and uses cash and cash equivalents by classifying cash flows as operating, investing and financing activities. The amount of net cash flows arising from operating activities is a key indicator of the extent to which the operations of the Authority are funded by way of taxation and grant income or from the recipients of services provided by the Authority. Investing activities represent the extent to which cash outflows have been made for resources which are intended to contribute to the Authority’s future service delivery. Cash flows arising from financing activities are useful in predicting claims on future cash flows by providers of capital (i.e. borrowing) to the Authority.
Restated 2013/14
£’000
Note 2014/15
£’000 (51,046) Net deficit on the provision of services (13,021)
137,162 Adjustments to net surplus or deficit on the provision of services for non- cash movements
93,926
(54,275) Adjustments for items included in the net surplus or deficit on the provision of services that are investing and financing activities
(49,805)
31,841 Net cash flows generated from Operating Activities 31,100 (33,805) Investing Activities (45,247)
(3,609) Financing activities 19,220 (5,573) Net (decrease)/increase in cash and cash equivalents 5,073 18,819 Cash and cash equivalents at the beginning of the reporting period 19 13,246
13,246 Cash and cash equivalents at the end of the reporting period 19 18,319
Cash Flow Statement – Operating Activities
The deficit on the provision of services has been adjusted for the following non cash movements.
Restated 2013/14
£’000
2014/15
£’000 The cash flows for operating activities include the following items
(51,046) Net Deficit on the provision of services (13,021)
Adjust net deficit on the provision of services for non-cash movements
23,893 Depreciation 23,144 11,656 Impairment and downward valuations 19,842
228 Amortisation 121 (1,729) Increase/(decrease) in creditors 3,574 (3,440) (Increase)/decrease in debtors 11,236
28 Decrease in inventories 32 8,690 Movement in pension liability 12,124
73,938 Carrying amount of non-current assets sold or derecognised 15,616 23,898 Other non-cash items 8,237
137,162 93,926 Adjust for items included in net deficit on the provision of services that are
investing or financing activities
(49,344) Capital Grants (44,707)
(5,253) Proceeds from the sale of property, plant and equipment (5,098) 322 Billing Authority Council Tax and NNDR adjustments 0
(54,275) (49,805) 31,841 Net cash flows generated from operating activities 31,100

London Borough of Redbridge Statement of Accounts 2014/15
17
The cash flows for operating activities include the following items:
2013/14 £’000
2014/15 £’000
1,735 Interest Received 1,555 (7,808)
Interest Paid (7,222)
Cash Flow Statement – Investing Activities
2013/14
£’000
2014/15
£’000 (68,537) Purchase of property, plant and equipment, investment property and intangible
assets
(62,152)
(17,439) Purchase of short term and long term investments
16,145
(15,673) Other payments for investing activities
(7,555)
5,253 Proceeds from the sale of property, plant, equipment, investment property and intangible assets
5,098
13,247 Proceeds / (Purchases) from short term and long term investments
(41,490)
49,344 Other receipts from investing activities
44,707
(33,805) Net cash flows from investing activities (45,247)
Cash Flow Statement – Financing Activities
2013/14
£’000
2014/15
£’000 10,000 Cash receipts from short term and long term borrowing
25,000
176 Other receipts from financing activities
539
(618) Cash payments for the reduction of outstanding liabilities relating to finance leases on balance sheet PFI contracts
(470)
(12,845) Repayments of short term and long term borrowing
(5,849)
(322) Billing Authority Council Tax and NNDR adjustments 0
(3,609) Net cash flows from financing activities 19,220
2013/14 values have been restated. Please refer to Note 5 on pages 33-34 for details.

London Borough of Redbridge Statement of Accounts 2014/15
18
Notes to the Accounts
1. Statement of Accounting Policies
General Principles The Statement of Accounts summarises the Authority’s and Group transactions for the 2014/15 financial year and its position at the year-end of 31 March 2015. The Authority is required to prepare an annual Statement of Accounts by the Accounts and Audit (England) Regulations 2011, which require the accounts to be prepared in accordance with proper accounting practices. These practices primarily comprise the Code of Practice on Local Authority Accounting in the United Kingdom 2014/15 (the Code) and the Service Reporting Code of Practice 2014/15 (SeRCOP), supported by International Financial Reporting Standards (IFRS). The accounting convention adopted in the Statement of Accounts is principally historical cost, modified by the revaluation of certain categories of non-current assets and financial instruments. Balances relating to the Pension Fund and other funds have been excluded. Additional accounting policies applicable to the Pension Fund are set out on pages 97 to 98.
Accruals of Income and Expenditure Activity is accounted for in the year that it takes place, not simply when cash payments are made or received. In particular: • Revenue from the sale of goods is recognised when the Authority transfers the significant risks and rewards of
ownership to the purchaser and it is probable that economic benefits or service potential associated with the transaction will flow to the Authority.
• Revenue from the provision of services is recognised when the Authority can measure reliably the percentage of completion of the transaction and it is probable that economic benefits or service potential associated with the transaction will flow to the Authority.
• Supplies are recorded as expenditure when they are consumed – where there is a gap between the date supplies are received and their consumption they are carried as inventories on the Balance Sheet.
• Expenses in relation to services received (including services provided by employees) are recorded as expenditure when the services are received rather than when payments are made.
• Interest receivable on investments and payable on borrowings is accounted for respectively as income and expenditure on the basis of the effective interest rate for the relevant financial instrument rather than the cash flows fixed or determined by the contract.
• Where revenue and expenditure have been recognised but cash has not been received or paid, a debtor or creditor for the relevant amount is recorded in the Balance Sheet. Where debts may not be settled, the balance of debtors is written down and a charge made to revenue for the income that might not be collected.
Cash and Cash Equivalents Cash is represented by cash in hand and deposits with financial institutions repayable without penalty on notice of not more than 24 hours. Cash equivalents are investments that having originally been invested for no longer than three months are repayable on demand or readily convertible to known amounts of cash with insignificant risk of change in value. Fixed term deposits, excluding overnight deposits, are not considered to be readily convertible since they only become repayable at the point of maturity and cannot be traded or redeemed without penalty. In the Cash Flow Statement, cash and cash equivalents are shown net of bank overdrafts that are repayable on demand and form an integral part of the Authority’s cash management. Income from Local Taxation (Council Tax and Non Domestic Rates)
Council Tax
• Council Tax income included in the Comprehensive Income and Expenditure Statement for the year will be treated as accrued income.
Non Domestic Rates (NDR)
• Retained Business Rate income and top up income are included in the Comprehensive Income and Expenditure Statement for the year will be treated as accrued income.

London Borough of Redbridge Statement of Accounts 2014/15
19
All of the above income will be recognised in the Comprehensive Income and Expenditure Statement within the Taxation and Non-Specific Grant Income line. As a billing authority the difference between the Council Tax and NDR included in the Comprehensive Income and Expenditure Statement and the amount required by regulation to be credited to the General Fund shall be taken to the Collection Fund Adjustment Account and reported in the Movement of Reserves Statement. Each major preceptor’s share of the accrued Council Tax and NDR income will be available from the information contained in the Collection Fund Statement.
Council Tax and NDR income is recognised when it is probable that the economic benefits or service potential associated with the transaction will flow to the Authority, and the amount of revenue can be measured reliably.
Revenue relating to Council Tax and general rates is measured at the full amount receivable (net of any impairment losses) as they are non-contractual, non-exchange transactions and there can be no difference between the delivery and payment dates.
Exceptional Items When items of income and expense are material, their nature and amount is disclosed separately, either on the face of the Comprehensive Income and Expenditure Statement or in the notes to the accounts, depending upon how significant the items are to an understanding of the Authority’s financial performance. Charges to Revenue for Non-Current Assets Services, support services and trading accounts are debited with the following amounts to record the cost of holding non-current assets during the year:
• Depreciation attributable to the assets used by the relevant service.
• Revaluation and impairment losses on assets used by the service where there are no accumulated gains in the Revaluation Reserve against which the losses can be written off.
• Amortisation of intangible assets attributable to the service.
The Authority is not required to raise council tax to fund depreciation, revaluation and impairment losses or amortisations. However, it is required to make an annual contribution from revenue towards the reduction in its overall borrowing requirement that is equal to an amount calculated on a prudent basis determined by the Authority in accordance with statutory guidance. This provision is known as the Minimum Revenue Provision (MRP). Depreciation, revaluation and impairment losses and amortisations are therefore replaced by the MRP in the General Fund Balance by way of an adjusting transaction with the Capital Adjustment Account in the Movement in Reserves Statement for the difference between the two. Employee Benefits
Benefits Payable during Employment Short-term employee benefits are those due to be settled within 12 months of the year-end. They include benefits such as wages and salaries, paid annual leave and paid sick leave, bonuses and non-monetary benefits for current employees and are recognised as an expense for services in the year in which employees render service to the Authority. An accrual is made for the cost of holiday entitlements (or any form of leave, e.g. time off in lieu) earned by employees but not taken before the year-end which employees can carry forward into the next financial year. The accrual is made at the wage and salary rates applicable in the following accounting year, being the period in which the employee takes the benefit. The accrual is charged to Surplus or Deficit on the Provision of Services, but then reversed out through the Movement in Reserves Statement so that holiday benefits are charged to revenue in the financial year in which the holiday absence occurs. Termination Benefits Termination benefits are amounts payable as a result of a decision by the Authority to terminate an officer’s employment before the normal retirement date or an officer’s decision to accept voluntary redundancy. The benefits are charged on an accruals basis to the Comprehensive Income and Expenditure Statement at the earlier of when the Authority can no longer withdraw the offer of those benefits or when the Authority recognises costs for a restructure. Where termination benefits involve the enhancement of pensions, statutory provisions require the General Fund balance to be charged with the amount payable by the Authority to the Pension Fund or pensioner in the year, not the amount calculated according to the relevant accounting standards. In the Movement in Reserves Statement, appropriations are required to and from the Pensions Reserve to remove the notional debits and credits for pension enhancement termination benefits and replace them with debits for the cash paid to the Pension Fund and pensioners and any such amounts payable but unpaid at the year-end. Post-Employment Benefits Employees of the Authority are members of three separate pension schemes:

London Borough of Redbridge Statement of Accounts 2014/15
20
• The Teachers’ Pension Scheme, administered by Capita Teachers’ Pensions on behalf of the Department for Education (DfE).
• The NHS Pension Scheme, administered by EA Finance NHS Pensions.
• The Local Government Pensions Scheme, administered by the London Borough of Redbridge. These schemes provide defined benefits to members (retirement lump sums and pensions), earned as employees worked for the Authority. However, the arrangements for the teachers’ and NHS schemes mean that liabilities for these benefits cannot ordinarily be identified specifically to the Authority. These schemes are therefore accounted for as if they are defined contribution schemes and no liability for future payments of benefits is recognised in the Balance Sheet. The Education and Children’s Services line in the Comprehensive Income and Expenditure Statement is charged with the employer’s contributions payable to the Teachers’ Pensions Scheme in the year. The Public Health Services line in the Comprehensive Income and Expenditure Statement is charged with the employer’s contributions payable to the NHS Pension Scheme in year. The Local Government Pension Scheme The Local Government Scheme is accounted for as a defined benefits scheme.
The liabilities of the London Borough of Redbridge Pension Fund attributable to the Authority are included in the Balance Sheet on an actuarial basis using the projected unit method – i.e. an assessment of the future payments that will be made in relation to retirement benefits earned to date by employees, based on assumptions about mortality rates, employee turnover rates, etc., and projections of projected earnings for current employees.
Liabilities are discounted to their value at current prices, using a discount rate determined by the actuary. The discount rate is based on the indicative rate of return on high quality bonds (iBoxx Sterling Corporates AA index).
The assets of the London Borough of Redbridge Pension Fund attributable to the Authority are included in the Balance Sheet at their fair value:
• Quoted securities – current bid price; • Unquoted securities – professional estimate; • Unitised securities – current bid price; • Derivative contracts – current bid price.
The change in the net pension’s liability is analysed into the following components:
Services Cost comprising:
• Current service cost - the increase in liabilities as a result of years of service earned this year, allocated in the Comprehensive Income and Expenditure Statement to the services for which the employees worked;
• Past service cost – the increase in liabilities as a result of a scheme amendment or curtailment whose effect relates to years of service earned in earlier years, debited to the Surplus or Deficit on the Provision of Services in the Comprehensive Income and Expenditure Statement as part of Non Distributed Costs;
• Net Interest on the net defined benefit liability (asset), i.e. net interest expense for the Authority, the change during the period in the net defined benefit liability (asset) that arises from the passage of time charged to the Financing and Investment Income line in the Comprehensive Income and Expenditure Statement. This is calculated by applying the discount rate used to measure the defined benefit obligation at the beginning of the period to the net defined benefit liability (asset) at the beginning of the period, taking into account any changes in the net defined benefit liability (asset) during the period as a result of contribution and benefit payments.
Re-measurements comprising:
• The return on plan assets, excluding amounts included in net interest on the net defined benefit liability (asset), charged to the Pensions Reserve as Other Comprehensive Income and Expenditure;
• Actuarial gains and losses, changes in the net pensions liability that arise because events have not coincided with assumptions made at the last actuarial valuation or because the actuaries have updated their assumptions - charged to the Pensions Reserve as Other Comprehensive Income and Expenditure.
Contributions paid to the London Borough of Redbridge Pension Fund – cash paid as employer’s contributions to the pension fund in settlement of liabilities, not accounted for as an expense. In relation to retirement benefits, statutory provisions require the General Fund balance to be charged with the amount payable by the Authority to the pension fund or directly to pensioners in the year, not the amount calculated according to the relevant accounting standards. In the Movement in Reserves Statement, this means that there are transfers to and from the Pensions Reserve to remove the notional debits and credits for retirement benefits and replace them with debits for the cash paid to the pension fund and pensioners and any such amounts payable but
London Borough of Redbridge Statement of Accounts 2014/15
21
unpaid at the year-end. The negative balance that arises on the Pensions Reserve thereby measures the beneficial impact to the General Fund of being required to account for retirement benefits on the basis of cash flows rather than as benefits are earned by employees. Discretionary Benefits The Authority also has restricted powers to make discretionary awards of retirement benefits in the event of early retirements. Any liabilities estimated to arise as a result of an award to any member of staff (including teachers) are accrued in the year of the decision to make the award and accounted for using the same policies as are applied to the Local Government Pension Scheme. Government Grants and Contributions Whether paid on account, by instalments or in arrears, government grants and third party contributions and donations are recognised as due to the Authority when there is reasonable assurance that:
• The Authority will comply with the conditions attached to the payments, and
• The grants or contributions will be received. Amounts recognised as due to the Authority are not credited to the Comprehensive Income and Expenditure Statement until conditions attached to the grant or contributions have been satisfied. Conditions are stipulations that specify that the future economic benefits or service potential embodied in the asset acquired using the grant or contribution are required to be consumed by the recipient as specified, or future economic benefits or service potential must be returned to the transferor. Monies advanced as grants and contributions for which conditions have not been satisfied are carried in the Balance Sheet as creditors. When conditions are satisfied, the grant or contribution is credited to the relevant service line (attributable revenue grants and contributions) or Taxation and Non-Specific Grant Income (non-ring fenced revenue grants and all capital grants and contributions) in the Comprehensive Income and Expenditure Statement. Where capital grants and contributions are credited to the Comprehensive Income and Expenditure Statement, they are reversed out of the General Fund Balance in the Movement in Reserves Statement. Where the grant has yet to be used to finance capital expenditure, it is posted to the Capital Grants and Contributions Unapplied reserve. Where it has been applied, it is posted to the Capital Adjustment Account. Amounts in the Capital Grants and Contributions Unapplied reserve are transferred to the Capital Adjustment Account once they have been applied to fund capital expenditure. Revenue Expenditure Funded from Capital under Statute Expenditure incurred during the year that may be capitalised under statutory provisions but that does not result in the creation of a non-current asset has been charged as expenditure to the relevant service in the Comprehensive Income and Expenditure Statement in the year. Where the Authority has determined to meet the cost of this expenditure from existing capital resources or by borrowing, a transfer in the Movement in Reserves Statement from the General Fund Balance to the Capital Adjustment Account then reverses out the amounts charged so that there is no impact on the level of council tax. Revenue Recognition Revenue is a sub-set of income and is defined as the gross inflow of economic benefits or service potential during the reporting period when those inflows result in an increase in net worth.
Revenue is measured at the fair value of the consideration received or receivable. In most cases, the consideration receivable is in the form of cash and cash equivalents and the amount of revenue is the amount of cash and cash equivalents receivable. Where the Authority is acting as an agent of another organisation the amounts collected for that organisation are excluded from revenue.
Revenue relating to the sale of goods is recognised when the amount of revenue can be measured reliably, it is probable the revenue will be received by the Authority, and the risks and rewards of ownership have passed to the purchaser. Revenue relating to the provision of services is recognised when the amount of revenue can be measured reliably, it is probable the revenue will be received by the Authority and the stage of completion of the service can be measured.
Overheads and Support Services The costs of overheads and support services are charged to those that benefit from the supply or service in accordance with the costing principles of the CIPFA Service Reporting Code of Practice (SeRCOP) 2014/15. The total absorption costing principle is used – the full cost of overheads and support services are shared between users in proportion to the benefits received, with the exception of:

London Borough of Redbridge Statement of Accounts 2014/15
22
• Corporate and Democratic Core – costs relating to the Authority’s status as a multifunctional, democratic organisation.
• Non Distributed Costs – the cost of discretionary benefits awarded to employees retiring early and impairment losses chargeable on Assets Held for Sale.
These two cost categories are defined in SeRCOP and accounted for as separate headings in the Comprehensive Income and Expenditure Statement, as part of Net Expenditure on Continuing Services. Property, Plant and Equipment
Assets that have physical substance and are held for use in the production or supply of goods or services, for rental to others, or for administrative purposes and that are expected to be used during more than one financial year are classified as Property, Plant and Equipment. Recognition Expenditure on the acquisition, creation or enhancement of Property, Plant and Equipment is capitalised on an accruals basis, provided that it is probable that the future economic benefits or service potential associated with the item will flow to the Authority and the cost of the item can be measured reliably. Expenditure that maintains but does not add to an asset’s potential to deliver future economic benefits or service potential (i.e. repairs and maintenance) is charged as an expense when it is incurred. Measurement Assets are initially measured at cost, comprising:
• The purchase price. • Any costs attributable to bringing the asset to the location and condition necessary for it to be capable of
operating in the manner intended by management. • The initial estimate of the costs of dismantling and removing the item and restoring the site on which it is
located. The Authority does not capitalise borrowing costs incurred whilst assets are under construction. The cost of assets acquired other than by purchase is deemed to be its fair value, unless the acquisition does not have commercial substance (i.e. it will not lead to a variation in the cash flows of the Authority). In the latter case, where an asset is acquired via an exchange, the cost of the acquisition is the carrying amount of the asset given up by the Authority. Assets are then carried in the Balance Sheet using the following measurement bases:
• Infrastructure and community assets - depreciated historical cost. • Assets under construction – historic cost. • Dwellings - fair value, determined using the basis of existing use value for social housing. • All other assets - fair value, determined as the amount that would be paid for the asset in its existing use
(existing use value – EUV) except where the asset is specialised or no market exists for an asset when depreciated replacement cost (DRC) is used as an estimate of fair value; or a non-property asset has a short useful life, low value, or both, where depreciated historical cost is used as a proxy for fair value.
Assets included in the Balance Sheet at fair value are revalued sufficiently regularly to ensure that their carrying amount is not materially different from their fair value at the year-end, but as a minimum every five years. Increases in valuations are matched by credits to the Revaluation Reserve to recognise unrealised gains. Exceptionally, gains might be credited to the Comprehensive Income and Expenditure Statement where they arise from the reversal of a loss previously charged to a service. Where decreases in value are identified, they are accounted for by:
• Where there is a balance of revaluation gains for the asset in the Revaluation Reserve, the carrying amount of the asset is written down against that balance (up to the amount of the accumulated gains)
• Where there is no balance in the Revaluation Reserve or an insufficient balance, the carrying amount of the asset is written down against the relevant service line(s) in the Comprehensive Income and Expenditure Statement.
The Revaluation Reserve contains revaluation gains recognised since 1 April 2007, the date of its formal implementation. Gains arising before that date have been consolidated into the Capital Adjustment Account.

London Borough of Redbridge Statement of Accounts 2014/15
23
Impairment Assets are assessed at each year-end as to whether there is any indication that an asset may be impaired. Where indications exist and any possible differences are estimated to be material, the recoverable amount of the asset is estimated and, where this is less than the carrying amount of the asset, an impairment loss is recognised for the shortfall. Where impairment losses are identified, they are accounted for by:
• Where there is a balance of revaluation gains for the asset in the Revaluation Reserve, the carrying amount of the asset is written down against that balance (up to the amount of the accumulated gains).
• Where there is no balance in the Revaluation Reserve or an insufficient balance, the carrying amount of the asset is written down against the relevant service line(s) in the Comprehensive Income and Expenditure Statement.
Where an impairment loss is reversed subsequently, the reversal is credited to the relevant service line(s) in the Comprehensive Income and Expenditure Statement, up to the amount of the original loss, adjusted for depreciation that would have been charged if the loss had not been recognised.
Depreciation Depreciation is provided for on all Property, Plant and Equipment assets by the systematic allocation of their depreciable amounts over their useful lives. An exception is made for assets without a determinable finite useful life (i.e. freehold land and certain Community Assets) and assets that are not yet available for use (i.e. assets under construction). Deprecation is calculated on the following bases:
• Dwellings and other buildings – straight line allocation over the useful life of the property as estimated by the valuer.
• Vehicles, plant, furniture and equipment – straight line basis over the useful life of the asset.
• Infrastructure - straight line basis over a 20 year period.
Where an item of Property, Plant and Equipment asset has major components whose cost is significant in relation to the total cost of the item, the components are depreciated separately. Revaluation gains are also depreciated, with an amount equal to the difference between current depreciation charged and the depreciation that would have been chargeable based on the historic cost of the assets. The difference is transferred from the Revaluation Reserve to the Capital Adjustment Account. Component Accounting IAS 16 – Property, Plant and Equipment (PP&E) sets out the requirements for separate component depreciation of PP&E assets that are significant in relation to the total asset cost. The Authority will allocate the amount recognised in respect of an item of property, plant and equipment to its significant parts and depreciate separately each such part. For example, a property will be separated into its land and building component and depreciated separately. A significant part of an item of PP&E may have a useful life and a depreciation method that are the same as the useful life and the depreciation method of another significant part of that same item. Such parts may be grouped in determining the depreciation charge. The Code of Practice on Local Authority Accounting in the United Kingdom (the Code) requires all local authorities to establish an accounting policy for the componentisation of their assets and to apply that policy as assets are acquired, enhanced and revalued. Authorities are required to implement component accounting prospectively with effect from 1 April 2010 and it is applicable to:
• Enhancement expenditure incurred, • Acquisition expenditure incurred, and • Revaluation carried out.
The Authority has adopted different component accounting policies for the General Fund and the HRA.

London Borough of Redbridge Statement of Accounts 2014/15
24
o General Fund The Authority will only consider assets with cost or fair value above £4 million for component depreciation and then will only separate components with a cost or fair value of more than 20% of the individual asset for component depreciation.
o HRA The Authority will only consider HRA assets with cost or fair value above £250,000 for component depreciation and then will only separate components with a cost of or fair value of more than 20% of the individual asset for component depreciation.
Disposals and Non-current Assets Held for Sale When it becomes probable that the carrying amount of an asset will be recovered principally through a sale transaction rather than through its continuing use, it is reclassified as an Asset Held for Sale. The asset is revalued immediately before reclassification and then carried at the lower of this amount and fair value less costs to sell. Where there is a subsequent decrease to fair value less costs to sell, the loss is posted to the Other Operating Expenditure line in the Comprehensive Income and Expenditure Statement. Gains in fair value are recognised only up to the amount of any previously losses recognised in the Surplus or Deficit on Provision of Services. Depreciation is not charged on Assets Held for Sale. If assets no longer meet the criteria to be classified as Assets Held for Sale, they are reclassified back to non-current assets and valued at the lower of their carrying amount before they were classified as held for sale; adjusted for depreciation, amortisation or revaluations that would have been recognised had they not been classified as Held for Sale, and their recoverable amount at the date of the decision not to sell. Assets that are to be abandoned or scrapped are not reclassified as Assets Held for Sale. When an asset is disposed of or decommissioned, the carrying amount of the asset in the Balance Sheet (whether Property, Plant and Equipment or Assets Held for Sale) is written off to the Other Operating Expenditure line in the Comprehensive Income and Expenditure Statement as part of the gain or loss on disposal. Receipts from disposals (if any) are credited to the same line in the Comprehensive Income and Expenditure Statement also as part of the gain or loss on disposal (i.e. netted off against the carrying value of the asset at the time of disposal). Any revaluation gains accumulated for the asset in the Revaluation Reserve are transferred to the Capital Adjustment Account. Amounts received for a disposal in excess of £10,000 are categorised as capital receipts. A proportion of receipts relating to housing disposals are payable to the Government. The balance of receipts is required to be credited to the Capital Receipts Reserve, and can then only be used for new capital investment or set aside to reduce the Authority’s underlying need to borrow (the capital financing requirement). Receipts are appropriated to the Reserve from the General Fund Balance in the Movement in Reserves Statement. The written-off value of disposals is not a charge against council tax, as the cost of fixed assets is fully provided for under separate arrangements for capital financing. Amounts are appropriated to the Capital Adjustment Account from the General Fund Balance in the Movement in Reserves Statement. Schools In line with accounting standards and the Code on group accounts and consolidation, all maintained schools in the borough are now considered to be entities controlled by the Authority. The Code of Practice has adapted its definition of the Authority’s single entity financial statements to include the income, expenditure, assets, liabilities, reserves and cashflows of local authority maintained schools. Recognition of non-current assets used by maintained schools are determined in accordance with the relevant standards adopted in the Code. The Authority has the following types of maintained schools under its control:
• Community Schools; • Voluntary Aided Schools; • Foundation Schools.
Schools non-current assets are recognised on the Balance Sheet where the Authority directly owns the assets, where the Authority owns the balance of control of the assets, or where the school or the school governing body own the assets or have had rights to use the assets transferred to them. Community Schools are owned by the Authority and are therefore recognised on the Balance Sheet. The Authority’s Voluntary Aided Schools are mainly owned by the respective Diocese / religious bodies, with the school or governing body having no formal right to the assets as use is through licence arrangements. These schools are therefore not recognised on the Balance Sheet.

London Borough of Redbridge Statement of Accounts 2014/15
25
Where the ownership of a Foundation School lies with the school or school governing body the school is recognised on the Balance Sheet. PFI Schools are recognised on the Authority’s Balance Sheet as it is considered that the Authority controls the assets through the PFI agreement. Heritage Assets A Heritage asset is a tangible or intangible asset with historical, cultural, or environmental qualities that is held and maintained principally for its contribution to knowledge and culture. The Authority has conducted a review of assets in the Authority’s ownership to ascertain whether any may be classified as a “Heritage Asset” to be recognised as a separate class of assets. The Authority does not hold any buildings that meet the designated criteria of a heritage asset.
Other assets owned by the Authority that have been identified as heritage assets include:-
• Civic regalia: • Commemorative items such as keys, salvers, tea services, trophies, vases, statues, artwork, photos, furniture, coins
and medals; • War memorials; and • Scrolls.
For all of these assets, valuation information is not available and / or valuations cannot be obtained at a cost which is commensurate with the benefits derived. Consequently these assets are not recognised on the Authority’s Balance Sheet.
Intangible Assets Expenditure on non-monetary assets that do not have physical substance but are controlled by the Authority as a result of past events (e.g. software licences) is capitalised when it is expected that future economic benefits or service potential will flow from the intangible asset to the Authority. Internally generated assets are capitalised where it is demonstrable that the project is technically feasible and is intended to be completed (with adequate resources being available) and the Authority will be able to generate future economic benefits or deliver service potential by being able to sell or use the asset. Expenditure is capitalised where it can be measured reliably as attributable to the asset and is restricted to that incurred during the development phase (research expenditure cannot be capitalised). Intangible assets are measured initially at historic cost. Amounts are only revalued where the fair value of the assets held by the Authority can be determined by reference to an active market. In practice, no intangible asset held by the Authority meets this criterion, and they are therefore carried at amortised cost. The depreciable amount of an intangible asset is amortised over its useful life to the relevant service line(s) in the Comprehensive Income and Expenditure Statement. An asset is tested for impairment whenever there is an indication that the asset might be impaired – any losses recognised are posted to the relevant service line(s) in the Comprehensive Income and Expenditure Statement. Any gain or loss arising on the disposal or abandonment of an intangible asset is posted to the Other Operating Expenditure line in the Comprehensive Income and Expenditure Statement. Where expenditure on intangible assets qualifies as capital expenditure for statutory purposes, amortisation, impairment losses and disposal gains and losses are not permitted to have an impact on the General Fund Balance. The gains and losses are therefore reversed out of the General Fund Balance in the Movement in Reserves Statement and posted to the Capital Adjustment Account and (for any sale proceeds greater than £10,000) the Capital Receipts Reserve. Investment Property Investment properties are those that are used to earn rentals and/or for capital appreciation. The definition is not met if the property is used to facilitate the delivery of services or production of goods or is held for sale. Investment properties are measured initially at cost and subsequently at fair value, based on the amount at which the asset could be exchanged between knowledgeable parties at arm’s length. Properties are not depreciated but are revalued annually according to market conditions at the year-end. Gains and losses on revaluation are posted to the Financing and Investment Income and Expenditure line in the Comprehensive Income and Expenditure Statement. The same treatment is applied to gains and losses on disposal. Rentals received in relation to investment properties are credited to the Financing and Investment Income line and result in a gain for the General Fund Balance. However, revaluation and disposal gains and losses are not permitted by

London Borough of Redbridge Statement of Accounts 2014/15
26
statutory arrangements to have an impact on the General Fund Balance. The gains and losses are therefore reversed out of the General Fund Balance in the Movement in Reserves Statement and posted to the Capital Adjustment Account and (for any sale proceeds greater than £10,000) the Capital Receipts Reserve. Community Infrastructure Levy The Authority has elected to charge a Community Infrastructure Levy (CIL). The levy is charged on new builds (chargeable developments for the Authority) with appropriate planning consent. The Authority charges for and collects the levy, which is a planning charge. CIL is received without outstanding conditions. It is therefore recognised at the commencement date of the chargeable development in the Comprehensive Income and Expenditure Statement in accordance with the accounting policy for government grants and contributions. CIL charges will be largely used to fund capital expenditure; a small proportion of the charges may be used to fund revenue expenditure. Section 106 Agreements The Authority has entered into a number of Section 106 agreements with developers. Payments due to the Authority under these agreements are recognised when received, not when they become due. Leases
Leases are classified as finance leases where the terms of the lease transfer substantially all the risks and rewards incidental to ownership of the property, plant or equipment from the lessor to the lessee. All other leases are classified as operating leases.
Where a lease covers both land and buildings, the land and buildings elements are considered separately for classification.
Arrangements that do not have the legal status of a lease but convey a right to use an asset in return for payment are accounted for under this policy where fulfilment of the arrangement is dependent on the use of specific assets.
The Authority as Lessee
Finance Leases Property, plant and equipment held under finance leases is recognised on the Balance Sheet at the commencement of the lease at its fair value measured at the lease’s inception (or the present value of the minimum lease payments, if lower). The asset recognised is matched by a liability for the obligation to pay the lessor. Initial direct costs of the Authority are added to the carrying amount of the asset. Premiums paid on entry into a lease are applied to writing down the lease liability. Contingent rents are charged as expenses in the periods in which they are incurred. Lease payments are apportioned between:
• A charge for the acquisition of the interest in the property, plant or equipment – applied to write down the lease liability, and
• A finance charge (debited to the Financing and Investment Income and Expenditure line in the Comprehensive Income and Expenditure Statement).
Property, Plant and Equipment recognised under finance leases is accounted for using the policies applied generally to such assets, subject to depreciation being charged over the lease term if this is shorter than the asset’s estimated useful life (where ownership of the asset does not transfer to the Authority at the end of the lease period). The Authority is not required to raise council tax to cover depreciation or revaluation and impairment losses arising on leased assets. Instead, a prudent annual contribution is made from revenue funds towards the deemed capital investment in accordance with statutory requirements. Depreciation and revaluation and impairment losses are therefore substituted by a revenue contribution in the General Fund Balance, by way of an adjusting transaction with the Capital Adjustment Account in the Movement in Reserves Statement for the difference between the two. Operating Leases Rentals paid under operating leases are charged to the Comprehensive Income and Expenditure Statement as an expense of the services benefitting from use of the leased property, plant or equipment. Charges are made on a straight-line basis over the life of the lease, unless another systematic basis is more representative of the benefits received by the Authority.

London Borough of Redbridge Statement of Accounts 2014/15
27
The Authority as Lessor
Finance Leases Where the Authority grants a finance lease over a property or an item of plant or equipment, the relevant asset is written out of the Balance Sheet as a disposal. At the commencement of the lease, the carrying amount of the asset in the Balance Sheet (whether Property, Plant and Equipment or Assets Held for Sale) is written off to the Other Operating Expenditure line in the Comprehensive Income and Expenditure Statement as part of the gain or loss on disposal. A gain, representing the Authority’s net investment in the lease, is credited to the same line in the Comprehensive Income and Expenditure Statement also as part of the gain or loss on disposal (i.e. netted off against the carrying value of the asset at the time of disposal), matched by a lease (long-term debtor) asset in the Balance Sheet. Lease rentals receivable are apportioned between:
• A charge for the acquisition of the interest in the property – applied to write down the lease debtor (together with any premiums received), and
• Finance income (credited to the Financing and Investment Income and Expenditure line in the Comprehensive Income and Expenditure Statement).
The gain credited to the Comprehensive Income and Expenditure Statement on disposal is not permitted by statute to increase the General Fund Balance and is required to be treated as a capital receipt. Where a premium has been received, this is posted out of the General Fund Balance to the Capital Receipts Reserve in the Movement in Reserves Statement. Where the amount due in relation to the lease asset is to be settled by the payment of rentals in future financial years, this is posted out of the General Fund Balance to the Deferred Capital Receipts Reserve in the Movement in Reserves Statement. When the future rentals are received, the element for the capital receipt for the disposal of the asset is used to write down the lease debtor. At this point, the deferred capital receipts are transferred to the Capital Receipts Reserve The written-off value of disposals is not a charge against council tax, as the cost of fixed assets is fully provided for under separate arrangements for capital financing. Amounts are therefore transferred to the Capital Adjustment Account from the General Fund Balance in the Movement in Reserves Statement.
Operating Leases Where the Authority grants an operating lease over a property or an item of plant or equipment, the asset is retained in the Balance Sheet. Rental income is credited to the Other Operating Expenditure line in the Comprehensive Income and Expenditure Statement. Credits are made on a straight-line basis over the life of the lease, even if this does not match the pattern of payments (e.g. there is a premium paid at the commencement of the lease). Initial direct costs incurred in negotiating and arranging the lease are added to the carrying amount of the relevant asset and charged as an expense over the lease term on the same basis as rental income. Private Finance Initiative (PFI) and Similar Contracts PFI and similar contracts are agreements to receive services, where the responsibility for making available the property, plant and equipment needed to provide the services passes to the PFI contractor. As the Authority is deemed to control the services that are provided under its PFI schemes, and as ownership of the property, plant and equipment will pass to the Authority at the end of the contracts for no additional charge, the Authority carries the assets used under the contracts on its Balance Sheet as part of Property, Plant and Equipment. The original recognition of these assets at fair value (based on the cost to purchase the property, plant and equipment) was balanced by the recognition of a liability for amounts due to the scheme operator to pay for the capital investment.
The amounts payable to the PFI operators each year are analysed into five elements:
• Fair value of the services received during the year – debited to the relevant service in the Comprehensive Income and Expenditure Statement,
• Finance cost – an interest charge of 8.16% on the outstanding Balance Sheet liability, debited to the Financing and Investment Income and Expenditure line in the Comprehensive Income and Expenditure Statement,
• Contingent rent – increases in the amount to be paid for the property arising during the contract, debited to the Financing and Investment Income and Expenditure line in the Comprehensive Income and Expenditure Statement,
• Payment towards liability – applied to write down the Balance Sheet liability towards the PFI operator (the profile of write-downs is calculated using the same principles as for a finance lease),

London Borough of Redbridge Statement of Accounts 2014/15
28
• Lifecycle replacement costs – Capital lifecycle costs are debited to Property Plant and Equipment to reflect the enhancement of the PFI asset.
Financial Instruments Financial Liabilities Financial liabilities are recognised on the Balance Sheet when the Authority becomes a party to the contractual provisions of a financial instrument and are initially measured at fair value and are carried at their amortised cost. Annual charges to the Financing and Investment Income and Expenditure line in the Comprehensive Income and Expenditure Statement for interest payable are based on the carrying amount of the liability, multiplied by the effective rate of interest for the instrument. The effective interest rate is the rate that exactly discounts estimated future cash payments over the life of the instrument to the amount at which it was originally recognised. For most of the borrowings that the Authority has, this means that the amount presented in the Balance Sheet is the outstanding principal repayable (plus accrued interest); and interest charged to the Comprehensive Income and Expenditure Statement is the amount payable for the year according to the loan agreement. Gains and losses on the repurchase or early settlement of borrowing are credited and debited to the Financing and Investment Income and Expenditure line in the Comprehensive Income and Expenditure Statement in the year of repurchase/settlement. However, where repurchase has taken place as part of a restructuring of the loan portfolio that involves the modification or exchange of existing instruments, the premium or discount is respectively deducted from or added to the amortised cost of the new or modified loan and the write-down to the Comprehensive Income and Expenditure Statement is spread over the life of the loan by an adjustment to the effective interest rate. Where premiums and discounts have been charged to the Comprehensive Income and Expenditure Statement, regulations allow the impact on the General Fund Balance to be spread over future years. The Authority has a policy of spreading the gain or loss over the term that was remaining on the loan against which the premium was payable or discount receivable when it was repaid. The reconciliation of amounts charged to the Comprehensive Income and Expenditure Statement to the net charge required against the General Fund Balance is managed by a transfer to or from the Financial Instruments Adjustment Account in the Movement in Reserves Statement. Financial Assets Financial assets are classified into two types:
• Loans and receivables – assets that have fixed or determinable payments but are not quoted in an active market;
• Available-for-sale assets – assets that have a quoted market price and/or do not have fixed or determinable payments.
Loans and Receivables Loans and receivables are recognised on the Balance Sheet when the Authority becomes a party to the contractual provisions of a financial instrument and are initially measured at fair value. They are subsequently measured at their amortised cost. Annual credits to the Financing and Investment Income and Expenditure line in the Comprehensive Income and Expenditure Statement for interest receivable are based on the carrying amount of the asset multiplied by the effective rate of interest for the instrument. For most of the loans that the Authority has made, this means that the amount presented in the Balance Sheet is the outstanding principal receivable (plus accrued interest) and interest credited to the Comprehensive Income and Expenditure Statement is the amount receivable for the year in the loan agreement. The Authority has made a number of small loans which are categorised as soft loans. The transactions are not deemed material either individually or cumulatively at their carrying value. Where assets are identified as impaired because of a likelihood arising from a past event that payments due under the contract will not be made, the asset is written down and a charge made to the relevant service (for receivables specific to that service) or the Financing and Investment Income and Expenditure line in the Comprehensive Income and Expenditure Statement. The impairment loss is measured as the difference between the carrying amount and the present value of the revised future cash flows discounted at the asset’s original effective interest rate. Any gains and losses that arise on the de-recognition of an asset are credited or debited to the Financing and Investment Income and Expenditure line in the Comprehensive Income and Expenditure Statement. Available-for-Sale Assets Available-for-sale assets are recognised on the Balance Sheet when the Authority becomes a party to the contractual provisions of a financial instrument and are initially measured and carried at fair value. Where the asset has fixed or

London Borough of Redbridge Statement of Accounts 2014/15
29
determinable payments, annual credits to the Financing and Investment Income and Expenditure line in the Comprehensive Income and Expenditure Statement for interest receivable are based on the amortised cost of the asset multiplied by the effective rate of interest for the instrument. Where there are no fixed or determinable payments, income (e.g. dividends) is credited to the Comprehensive Income and Expenditure Statement when it becomes receivable by the Authority. Assets are maintained in the Balance Sheet at fair value. Values are based on the following principles:
• Instruments with quoted market prices – the market price.
• Other instruments with fixed and determinable payments – discounted cash flow analysis.
• Equity shares with no quoted market prices – independent appraisal of company valuations. Changes in fair value, where material, are balanced by an entry in the Available-for-Sale Reserve and the gain/ loss is recognised in the Surplus or Deficit on Revaluation of Available-for-Sale Financial Assets. The exception is where impairment losses have been incurred – these are debited to the Financing and Investment Income and Expenditure line in the Comprehensive Income and Expenditure Statement, along with any net gain or loss for the asset accumulated in the Available-for-Sale Reserve. Where assets are identified as impaired because of a likelihood arising from a past event that payments due under the contract will not be made (fixed or determinable payments) or fair value falls below cost, the asset is written down and a charge made to the Financing and Investment Income and Expenditure line in the Comprehensive Income and Expenditure Statement. If the asset has fixed or determinable payments, the impairment loss is measured as the difference between the carrying amount and the present value of the revised future cash flows discounted at the asset’s original effective interest rate. Otherwise, the impairment loss is measured as any shortfall of fair value against the acquisition cost of the instrument (net of any principal repayment and amortisation). Any gains and losses that arise on the de-recognition of the asset are credited or debited to the Financing and Investment Income and Expenditure line in the Comprehensive Income and Expenditure Statement, along with any accumulated gains or losses previously recognised in the Available-for-Sale Reserve. Where fair value cannot be measured reliably, the instrument is carried at cost (less any impairment losses). Business Improvement Districts A Business Improvement District (BID) scheme is funded by a BID levy payment made by non-domestic ratepayers. The Authority acts as agent under the scheme and collects money on behalf of Ilford BID and Hainault BID. This is then paid over in monthly instalments to the BID companies. Inventories Inventories are included in the Balance Sheet at the lower of cost and net realisable value. Cost of inventories is determined using either the first in first out (FIFO) costing formula or weighted average price depending on the nature of the inventory. Work in progress is recorded in the Balance Sheet at cost. Long term contracts are accounted for on the basis of charging the Surplus or Deficit on the Provision of Services with the value of works and services received under the contract during the financial year. Provisions, Contingent Liabilities and Contingent Assets Provisions Provisions are made where an event has taken place that gives the Authority a legal or constructive obligation that probably requires settlement by a transfer of economic benefits or service potential, and a reliable estimate can be made of the amount of the obligation. For example the Authority may be involved in a court case that could eventually result in the making of a settlement or the payment of compensation. Provisions are charged as an expense to the appropriate service line in the Comprehensive Income and Expenditure Statement in the year that the Authority becomes aware of the obligation, and are measured at the best estimate at the balance sheet date of the expenditure required to settle the obligation, taking into account relevant risks and uncertainties. When payments are eventually made, they are charged to the provision carried in the Balance Sheet. Estimated settlements are reviewed at the end of each financial year – where it becomes less than probable that a transfer of economic benefits will now be required (or a lower settlement than anticipated is made), the provision is reversed and

London Borough of Redbridge Statement of Accounts 2014/15
30
credited back to the relevant service. Where some or all of the payment required to settle a provision is expected to be recovered from another party (e.g. from an insurance claim), this is only recognised as income for the relevant service if it is virtually certain that reimbursement will be received if the Authority settles the obligation.
Contingent Liabilities A contingent liability arises where an event has taken place that gives the Authority a possible obligation whose existence will only be confirmed by the occurrence or otherwise of uncertain future events not wholly within the control of the Authority. Contingent liabilities also arise in circumstances where a provision would otherwise be made but either it is not probable that an outflow of resources will be required or the amount of the obligation cannot be measured reliably. Contingent liabilities are not recognised in the Balance Sheet but disclosed in a note to the accounts. Contingent Assets A contingent asset arises where an event has taken place that gives the Authority a possible asset whose existence will only be confirmed by the occurrence or otherwise of uncertain future events not wholly within the control of the Authority. Contingent assets are not recognised in the Balance Sheet but disclosed in a note to the accounts where it is probable that there will be an inflow of economic benefits or service potential.
Reserves The Authority sets aside specific amounts as reserves for future policy purposes or to cover contingencies. Reserves are created by appropriating amounts out of the General Fund Balance in the Movement in Reserves Statement. When expenditure to be financed from a reserve is incurred, it is charged to the appropriate service in that year to score against the Surplus or Deficit on the Provision of Services in the Comprehensive Income and Expenditure Statement. The reserve is then appropriated back into the General Fund Balance in the Movement in Reserves Statement so that there is no net charge against council tax for the expenditure. Certain reserves are kept to manage the accounting processes for non-current assets, financial instruments, and retirement and employee benefits and do not represent usable resources for the Authority – the reasons for these reserves are explained in the relevant policies. Value Added Tax (VAT) VAT payable is included as an expense only to the extent that it is not recoverable from Her Majesty’s Revenue and Customs. VAT receivable is excluded from income. Foreign Currency Translation Where the Authority has entered into a transaction denominated in a foreign currency, the transaction is converted into sterling at the exchange rate applicable on the date the transaction was effected. Interests in Companies and Other Entities An assessment of the Authority’s interests has been carried out to determine the group relationships that exist. Inclusion in the group is dependent upon the extent of the Authority’s control over the company or entity and the materiality of the interest. The Authority considers that it has a material interest in Vision Redbridge Culture and Leisure and has classified it as a subsidiary. Accordingly Group Accounts are prepared. In consolidating the accounts, all transactions and balances between the Authority and the subsidiary are eliminated in full. Prior Period Adjustments, Changes in Accounting Policies and Estimates and Errors Prior period adjustments may arise as a result of a change in accounting policies or to correct a material error. Changes in accounting estimates are accounted for prospectively, i.e. in the current and future years affected by the change and do not give rise to a prior period adjustment. Changes in accounting policies are only made when required by proper accounting practices or the change provides more reliable or relevant information about the effect of transactions, other events and conditions on the Authority’s financial position or financial performance. Where a change is made, it is applied retrospectively (unless stated otherwise) by adjusting opening balances and comparative amounts for the prior period as if the new policy had always been applied. Material errors discovered in prior period figures are corrected retrospectively by amending opening balances and comparative amounts for the prior period.

London Borough of Redbridge Statement of Accounts 2014/15
31
Events after the Balance Sheet Date Events after the Balance Sheet date are those events, both favourable and unfavourable, that occur between the end of the reporting period and the date when the Statement of Accounts is authorised for issue. Two types of events can be identified:
• Those that provide evidence of conditions that existed at the end of the reporting period – the Statement of Accounts is adjusted to reflect such events;
• Those that are indicative of conditions that arose after the reporting period – the Statement of Accounts are not adjusted to reflect such events, but where a category of events would have a material effect, disclosure is made in the notes of the nature of the events and either their estimated financial effect or a statement that such an estimate cannot be reliably made.
Events taking place after the date of authorisation for issue are not reflected in the Statement of Accounts.
2. Accounting Standards that have been issued but not yet been Adopted Under the Code of Practice on Local Authority Accounting in the United Kingdom 2014/15 (the Code) the Authority is required to disclose information relating to the expected impact of an accounting change that will be required by a new accounting standard that has been issued but not yet adopted by the Code.
The following standards have been issued that will be adopted by the Code in 2015/16 and will be applicable to the Authority from 1 April 2015:
IFRS 13: Fair Value Measurement. This standard provides a definition of fair value measurement (and extensive disclosure requirements), to be applied to all assets and liabilities which use fair value as a measurement basis. In respect of property, plant and equipment, operational assets will continue to be valued on an existing use basis. The standard’s requirements will therefore only impact on non-operational surplus assets which will now be required to be valued at market value (previously existing use basis). Overall this standard is not expected to have a material impact on the Statement of Accounts, as the value of assets currently classified as surplus assets is low.
IFRIC 21: Levies: This clarifies the recognition point for payment of levies as the activity which triggers the payment of the levy. This is not expected to have any impact on the Authority, as this is already current accounting practice.
In addition, there have been a number of minor changes to existing accounting standards:
IFRS 8: Operating Segments. This will require the Authority to disclose the factors used to identify the Authority’s reportable segments and therefore require additional disclosure in the 2015/16 Statement of Accounts.
IAS 16: Property, Plant and Equipment. The amendment sets out that where non-current assets are revalued, the gross carrying amount is adjusted in a manner consistent with the revaluation of the carrying amount. This is not expected to have a material impact for the Authority.
3. Critical Judgements in applying Accounting Policies The following are significant management judgements in applying the Authority’s accounting policies, as set out in pages 18 to 31 that have the most significant effect on the financial statements. Critical estimation uncertainties are described in note 4.
Accounting for Schools – Balance Sheet Recognition The Authority recognises school assets for Community schools and Foundation schools on its Balance Sheet. The Authority has not recognised non-current assets relating to Voluntary Aided schools or Academies as it is of the opinion that these assets are not controlled by the Authority.
Accounting for Schools - Academies When a school that is held on the Authority’s balance sheet transfers to Academy status, the Authority accounts for this as a disposal for nil consideration on the date that the schools converts to Academy status, rather than as an impairment on the date that approval to transfer to Academy status is announced. During 2014/15, no maintained school converted to academy status
Where the Authority has entered into a construction contract for a replacement school on behalf of an Academy, the cost of construction is charged as an Asset under Construction, part of Property Plant and Equipment. Once construction is complete and/or the school is brought into use it is transferred to Other Land and Buildings, part of Property Plant and Equipment. On the date of transfer to the Academy, it is then treated as a disposal for nil consideration. During 2014/15 the construction the ARK Primary Free School was completed and brought into use. The amount written out of the Authority’s balance sheet was £7.3 million.

London Borough of Redbridge Statement of Accounts 2014/15
32
PFI Contract - Oak Park High School: The Authority is deemed to control the services provided under the PFI contract with NU Schools to provide a secondary school, Oaks Park High School, and also to control the residual value of the school at the end of the agreement. The accounting policies for PFI schemes and similar contracts have been applied to the arrangement and the school is recognised within Property, Plant and Equipment on the Authority’s Balance Sheet. Funding The Authority anticipates that the pressures on public expenditure will continue to be severe. These pressures will be mitigated by further service area and corporate savings and a limited use of reserves. As a consequence the Authority is of the view that the level of uncertainty is not yet sufficient to provide an indication that the assets of the Authority might be impaired as a result of a need to close facilities and reduce levels of service provision. Leases The Authority has examined its leases and classified them as either operational or finance leases. In some cases the lease transaction is not always conclusive and the Authority uses judgement in determining whether the lease is a finance lease arrangement that transfers substantially all risks and rewards incidental to ownership. In reassessing the lease the Authority has estimated the implied interest rate within the lease to calculate interest and principal payments. Group Boundaries Group boundaries have been estimated using the criteria associated with the Code of Practice. Vision-Redbridge Culture and Leisure (VRCL), has acquired responsibility for the management of the services previously provided in-house by the Culture, Sport & Community Learning (CSCL) service area. The majority of the CSCL service area’s employees transferred to VRCL. The Authority can exert control over the organisation through the power to govern their financial and operating policies in order to maximise the benefits for the Authority. As such, the Authority is deemed to have a subsidiary relationship with VRCL, and VRCL has been consolidated into the Authority’s Group Accounts.
4. Assumptions made about the future and other major sources of estimation uncertainty
The Statement of Accounts contains estimated figures that are based on assumptions made by the Authority about the future or that are otherwise uncertain. Estimates are made taking into account historical experience, current trends and other relevant factors. However, because balances cannot be determined with certainty, actual results could be materially different from the assumptions and estimates. The items in the Authority’s Balance Sheet at 31 March 2015 for which there are significant risks of material adjustment in the forthcoming financial year are as follows:
Property, Plant and Equipment - Assets are depreciated over useful lives that are dependent on assumptions about the level of repairs and maintenance that will be incurred in relation to individual assets. The current economic climate makes it uncertain that the Authority will be able to sustain its current spending on repairs and maintenance, bringing into doubt the useful lives assigned to assets. If the useful life of assets is reduced, depreciation increases and the carrying amount of the assets falls. It is estimated that the annual depreciation charge for buildings would increase by £0.4 million for every year that useful lives had to be reduced. Provisions - The outcome of outstanding insurance claims is always very difficult to estimate. Certain claims, such as severe weather or environment issues, cannot be predicted far in advance and can have a significant impact. However, these are considered to be relatively infrequent and unlikely to have a significant financial impact on the Authority. In addition to the insurance provision that is held to meet existing claims, the Authority holds an Insurance Reserve of £6.8 million (£5.2 million 2013/14) which is deemed adequate to meet any future potential claims. Pensions Liability - Estimates of the net liability to pay pensions depends on a number of complex judgements relating to the discount rate used, the rate at which salaries are projected to increase, changes in retirement ages, mortality rates and expected returns on pension fund assets. A firm of consulting actuaries is engaged to provide the Authority with expert advice about the assumptions to be applied. The effects on the net pension’s liability of changes in individual assumptions can be measured. However, the assumptions interact in complex ways. During 2014/15 the Authority’s actuaries advised that the net pension’s liability had increased by £42 million (2013/14 – decreased by £9.2 million).
Business Rates – Since the introduction of the Business Rate Retention Scheme effective from 1 April 2013, Local Authorities are liable for successful appeals against business rates. The outcome of successful appeals is always very difficult to estimate and cannot be predicted. However the Authority has established a provision of £1 million for future rateable value decreases which is deemed adequate to meet any future potential claims.

London Borough of Redbridge Statement of Accounts 2014/15
33
5. Prior Period Adjustments
Prior period adjustments have been made to the Authority’s 2013/14 published financial statements in relation to the following:
Accounting for Schools
Following the introduction of new accounting standards on group accounts and consolidation, the Code of Practice requirements in relation to accounting for schools has changed. All maintained schools in the borough are now considered entities controlled by the Authority. As a result all income, expenditure assets and liabilities of each maintained school are consolidated into the Authority’s single entity accounts.
The recognition of land and buildings used by each school has been reviewed to determine whether they should be accounted for on the Authority’s Balance Sheet. The Authority has undertaken an assessment of all maintained schools in the borough to identify what ownership arrangements are in place in respect of these assets and thus the required accounting treatment.
The following arrangements were identified:
• The Authority directly owns the assets.
• The Authority controls the assets through contracts such as PFI agreements.
• The school or school governing body owns the assets.
• A third party such as a religious body owns the assets.
• Schools or the school governing body have the right to use the assets granted to them under licence.
As a result of this assessment, the land and buildings of two Foundation Schools valued at £17.6 million as at 1 April 2013 have been brought onto the Authority’s Balance Sheet as the governing body for each school owns the assets.
Assets under Construction - Capital expenditure of £6.6 million on a maintained school building works was omitted during the subsequent revaluation process thereby overstating the value of the school. This amount has therefore been written out of the Authority’s Balance Sheet with effect from the 1April 2013.
The impact of these changes on the Authority’s published core statements is shown in the tables below. Where disclosures have been restated, the relevant column on the disclosure table is headed ‘Restated’. This will occur throughout the accounts as appropriate.
Balance Sheet Opening Balance 1 April 2013
2012/13 Statements
£’000
Adjustments made £’000
Restated 1 April 2013
£’000
Property, Plant and Equipment 792,235 11,020 803,255
Net Asset 425,366 11,020 436,386
Unusable Reserves 236,230 11,020 247,250
Total Reserves 425,366 11,020 436,386
31 March 2014 2013/14 Statements
£’000
Adjustments made £’000
Restated 31 March 2014
£’000 Property, Plant and Equipment 749,429 10,628 760,057
Net Asset 399,678 10,628 410,306
Unusable Reserves 209,255 10,628 219,883
Total Reserves 399,678 10,628 410,306

London Borough of Redbridge Statement of Accounts 2014/15
34
Comprehensive Income and Expenditure Statement (CIES) 2013/14
Net Expenditure
£000
Depreciation
Adjustment £000
Restated 2013/14
Net Expenditure £ 000
Cost of Services 211,966 392 212,358 Other Operating Expenditure 82,725 - 82,725 Financing and Investment Income and Expenditure 19,117 - 19,117 Taxation and Non-Specific Grant Income (263,154) - (263,154) Deficit on Provision of Services 50,654 392 51,046 Other Comprehensive Income and Expenditure (24,966) - (24,966) Total Comprehensive Income and Expenditure 25,688 392 26,080
Movement in Reserves Statement (MIRS) Opening Balance 1 April 2013 2012/13
Statements £’000
Adjustments Made £’000
Restated 1 April 2013
£’000
Unusable Reserves (236,230) (11,020) (247,250)
Total Reserves (425,366) (11,020) (436,386)
31 March 2014 2013/14 Statements
£’000
Adjustments Made £’000
Restated 31 March 2014
£’000
Unusable Reserves (209,255) (10,628) (219,883)
Deficit on the Provision of Services 50,654 392 51,046
Adjustments between Accounting Basis and Funding Basis under Regulation
(51,941) (392) (52,333)
Total Reserves (399,678) (10,628) (410,306)
Cash flow Statement 31 March 2014 2013/14
Statements £’000
Adjustments Made £’000
Restated 31 March 2014
£’000
Deficit on the Provision of Services (50,654) (392) (51,046)
Adjustment to net deficit on the provision of services for non-cash movements
136,770
392
137,162

London Borough of Redbridge Statement of Accounts 2014/15
35
6. Events after the reporting period Balance Sheet date The Statement of Accounts was authorised for issue by the Section 151 Officer on 24 September 2015. Events taking place after this date are not reflected in the financial statements or notes. Where events taking place before this date provided information about conditions existing at 31 March 2015, the figures in the financial statements and notes have been adjusted in all material respects to reflect the impact of this information.
7. Adjustment between Accounting basis and funding basis under regulations
This note details the adjustments that are made to the total comprehensive income and expenditure recognised by the Authority in the year in accordance with proper accounting practice to the resources that are specified by statutory provisions as being available to the Authority to meet future capital and revenue expenditure. The following sets out a description of the reserves that the adjustments are made against. General Fund Balance – The General Fund is a statutory fund into which all the receipts of an Authority are required to be paid and out of which all liabilities of the Authority are to be met, except to the extent that statutory rules might provide otherwise. These rules can also specify the financial year in which liabilities and payments should impact on the General Fund Balance, which is not necessarily in accordance with proper accounting practice. The General Fund Balance therefore summarises the resources that the Authority is statutorily empowered to spend on its services or on capital investment (excluding HRA services), or the deficit of resources that the Authority is required to recover, at the end of the financial year.
Housing Revenue Account (HRA) Balance –The Housing Revenue Account Balance reflects the statutory obligation to maintain a revenue account for Local Authority council housing provision in accordance with Part VI of the Local Government and Housing Act 1989. It contains the balance of income and expenditure as defined by the 1989 Act that is available to fund future expenditure in connection with the Authority’s landlord function. Major Repairs Reserve – The Authority is required to maintain the Major Repairs Reserve, which controls the application of the Major Repairs Allowance (MRA). The MRA is restricted to being applied to new capital investment in HRA assets or the financing of historical capital expenditure by the HRA. Capital Receipts Reserve – The Capital Receipts Reserve holds the proceeds from the disposal of land or other assets which are restricted by statute from being used other than to fund new capital expenditure or to be set aside to finance historical capital expenditure. Capital Grants Unapplied – The Capital Grants Unapplied Account holds the grants and contributions received towards capital projects for which the Authority has met the conditions that would otherwise require repayment of the monies but which have yet to be applied to meet expenditure. The use of these funds may be restricted by grant terms as to the capital expenditure against which they can be applied and/or the financial year in which this can take place. Unusable Reserves – Non cash backed reserves that are used to record unrealised gains and losses, and other adjustment accounts to absorb the difference between the outcome of applying proper accounting practices and the requirements of statutory arrangements for funding expenditure.

London Borough of Redbridge Statement of Accounts 2014/15
36
2014/15
Gen
eral
Fu
nd
B
alan
ce
£’00
0
Ho
usi
ng
R
even
ue
Acc
ou
nt
£’00
0
Cap
ital
R
ecei
pts
R
eser
ve
£’00
0
Maj
or
Rep
airs
R
eser
ve
£’00
0
Cap
ital
G
ran
ts
Un
app
lied
£’
000
Mov
emen
t in
U
nu
sab
le
Res
erve
s £’
000
Reversal of items debited or credited to the Comprehensive Income and Expenditure Statement:
Charges for depreciation and impairment of non-current assets (23,144) 23,144
Revaluation losses on Property, Plant and Equipment (11,931) (7,911) 19,842
Movements in the market value of Investment Properties 12 (12)
Amortisation of intangible assets (121) 121
Capital Grants and Contributions applied 59,731 (59,731)
Revenue expenditure funded from capital under statute (7,555) 7,555
Amounts of non-current assets written off on disposal or sale as part of the gain/loss on disposal to the Comprehensive Income and Expenditure Statement
(12,833)
(2,783)
15,616
Statutory provision for the financing of capital investment 6,720 (6,720)
Capital expenditure charged in year to the General Fund and HRA Balances
2,968 4,433 (7,401)
Capital Grants and Contributions Unapplied credited to the Comprehensive Income and Expenditure Statement
43,884 823 (44,707)
Transfer of cash sale proceeds credited as part of gains/losses on disposal to the Comprehensive Income and Expenditure Statement
457 5,069 (5,526)
Use of the Capital Receipts Reserve to finance new capital expenditure 1,000 (1,000)
Contribution from the Capital Receipts Reserve to finance the payments to the Government’s capital receipts pool
(537) 537
Capital receipts received in respect of repayment of grants, advances and distributions
56 (56)
Contribution from the Capital Receipts Reserve towards administrative costs on non-current asset disposals
(160) 160
Transfer from Deferred Capital Receipts Reserve upon receipts of cash (55) 55
Reversal of Major Repairs Allowance (5,440) 5,440
Use of the Major Repairs Reserve to finance new capital expenditure 3,864 (3,864)
Amount by which council tax and non-domestic rate income credited/debited to the CI&E is different from council tax and non-domestic rate income calculated for the year in accordance with statutory requirements
5,229
(5,229)
Reversal of items relating to retirement benefits debited or credited to the Comprehensive Income and Expenditure Statement
(36,042) (856) 36,898
Employer’s pension contributions and direct payments to pensioners payable in year
24,193 581 (24,774)
Amount by which officer remuneration charged to the Comprehensive Income and Expenditure Statement on an accruals basis in different from remuneration chargeable in the year in accordance with statutory requirements
(456)
456
Total Adjustments (9,100) (804) (3,940) (1,576) 15,024 396

London Borough of Redbridge Statement of Accounts 2014/15
37
2013/14 - Restated Comparative Figures
Gen
eral
Fu
nd
B
alan
ce
£’00
0
Ho
usi
ng
Rev
enu
e A
cco
un
t £’
000
Cap
ital
Rec
eip
ts
Res
erve
£’
000
Maj
or
Rep
airs
R
eser
ve
£’00
0
Cap
ital
Gra
nts
U
nap
plie
d
£’00
0
Mov
emen
t in
U
nu
sab
le
Res
erve
s £’
000
Reversal of items debited or credited to the Comprehensive Income and Expenditure Statement:
Charges for depreciation and impairment of non-current assets (23,893) (4) 23,897
Revaluation losses on Property, Plant and Equipment (5,618) (6,038) 11,656
Movements in the market value of Investment Properties 81 (81)
Amortisation of intangible assets (228) 228
Capital Grants and Contributions applied 70,425 (70,425)
Revenue expenditure funded from capital under statute (15,673) 15,673
Amounts of non-current assets written off on disposal or sale as part of the gain/loss on disposal to the Comprehensive Income and Expenditure Statement
(69,347)
(4,584)
73,931
Statutory provision for the financing of capital investment 7,035 (7,035)
Capital expenditure charged in year to the General Fund and HRA Balances
1,102 4,541 (5,643)
Capital Grants and Contributions Unapplied credited to the Comprehensive Income and Expenditure Statement
41,716 7,628 (49,344)
Transfer of cash sale proceeds credited as part of gains/losses on disposal to the Comprehensive Income and Expenditure Statement
5,213 (5,213)
Use of the Capital Receipts Reserve to finance new capital expenditure 493 (493)
Contribution from the Capital Receipts Reserve to finance the payments to the Government’s capital receipts pool
(538) 538
Capital receipts received in respect of repayment of grants, advances and distributions
98 25 (123)
Contribution from the Capital Receipts Reserve towards administrative costs on non-current asset disposals
(174) 174
Transfer from Deferred Capital Receipts Reserve upon receipts of cash (93) 93
Reversal of Major Repairs Allowance (5,359) 5,359
Use of the Major Repairs Reserve to finance new capital expenditure 2,058 (2,058)
Amount by which council tax and non-domestic rate income credited/debited to the CI&E is different from council tax and non-domestic rate income calculated for the year in accordance with statutory requirements
547
(547)
Reversal of items relating to retirement benefits debited or credited to the Comprehensive Income and Expenditure Statement
(31,412)
(710) 32,122
Employer’s pension contributions and direct payments to pensioners payable in year
22,991 441 (23,432)
Amount by which officer remuneration charged to the Comprehensive Income and Expenditure Statement on an accruals basis in different from remuneration chargeable in the year in accordance with statutory requirements
912
(912)
Total Adjustments (72,227) 6,338 (4,224) (3,301) 21,081 52,333

London Borough of Redbridge Statement of Accounts 2014/15
38
8. Transfers to/from Earmarked Reserves This note sets out the amounts set aside from the General Fund and HRA balances in earmarked reserves to provide financing for future expenditure plans and the amounts posted back from earmarked reserves to meet General Fund HRA expenditure in 2014/15.
Balance at
31 March 2013 £’000
Net Transfers
£’000
Balance at
31 March 2014
£’000
Net Transfers
£’000
Balance at
31 March 2015
£’000 General Fund: Capital Reserve
24,145 1,347 25,492 (4,105) 21,387 Resource Reserve 9,153 9,007 18,160 1,030 19,190 Schools Balances 15,906 (3,529) 12,377 67 12,444 Insurance Fund Reserve 5,194 29 5,223 1,624 6,847 Change Management Fund 2,598 (169) 2,429 3,744 6,173 Redundancy & Early Retirement Fund 2,856 (215) 2,641 2,170 4,811 Repairs and Renewals Fund 3,671 (196) 3,475 (10) 3,465 Welfare Transition Reserve 2,800 0 2,800 0 2,800 Building Maintenance Fund 3,003 (585) 2,418 (826) 1,592 Concessionary Fares 1,875 (260) 1,615 (244) 1,371 Housing Benefit Balance 768 325 1,093 58 1,151 Tax and NDR Reserve 1,006 1,016 2,022 (98) 1,924 Schools Insurance Fund (247) 257 10 465 475 Schools Investment Programme 0 369 369 97 466 Claybury Park Endowment 667 (134) 533 (103) 430 Public Health 0 200 200 200 400 ICT Strategy Reserve 776 136 912 (516) 396 Other Funds and Balances 10,944 747 11,691 (6,161) 5,530 85,115 8,345 93,460 (2,608) 90,852 Revenue Grants Unapplied 13,504 2,476 15,980 (3,423) 12,557 TOTAL GENERAL FUND 98,619 10,821 109,440 (6,031) 103,409 Housing Revenue Account 3,608 1,688 5,296 1,887 7,183 TOTAL
102,227 12,509 114,736 (4,144) 110,592
Purpose of Earmarked Reserves and Balances
The Capital Reserve has been established primarily to support the Capital programme.
The Resource Reserve has been established to help meet the future cost pressures on the Authority resulting from transfer of responsibilities, the impact of the Government's resource review and other changes in the funding regime.
The School Balances are resources delegated to schools that will be used to fund future expenditure.
The Insurance Fund Reserve is resources set aside to provide for unquantified insurance claims that may be settled in the future.
The Change Management Fund has been established to facilitate the promotion of innovation and efficiency in the delivery of services across the Authority.
The Redundancy and Early Retirement Fund has been established to meet the costs in respect of employee loss of office as a result of the requirements to restructure Authority run services.
The Repairs and Renewals Fund exists to enable resources to be set aside for the future replacement of equipment.
The Welfare Transition Reserve has been established to help meet the cost of the potential funding shortfall following Government changes to welfare benefits.
The Building Maintenance Fund exists to enable resources to be set aside for the maintenance and repairs to Authority Buildings (except Council Housing). This provides flexibility in dealing with urgent repairs and avoids fluctuations in the yearly charge to Revenue.

London Borough of Redbridge Statement of Accounts 2014/15
39
The Concessionary Fares Reserve has been established to smooth the impact of rises in concessionary fares costs.
The Housing Benefit Balance relates to the fluctuation in respect of Housing Benefit and Council Tax benefit subsidy payments.
The Tax and NDR Reserve has been established to cover the potential impact on income of reductions in rateable values and other claims in relation to tax and rates income.
The Schools Insurance Fund is an internal schools insurance scheme to provide specified cover for schools.
The Schools Investment Programme has been established to provide replacements and the maintenance of kitchen equipment.
The Claybury Park Endowment has been established following the receipt of developer contributions towards meeting the costs of maintaining the park.
The Public Health has been established to meet future public health responsibilities with regard to general prevention activities.
The IT Strategy Reserve exists to fund the replacement and further development of the Authority's major computer systems.
Other Funds and Balances are comprised of a number of smaller earmarked reserves.
9. Other Operating Expenditure
2013/14 £’000
2014/15 £’000
13,567 Levies 13,990 538 Payments to the Government Housing Capital Receipts Pool 537
68,620 Losses on the disposal of non-current assets 10,034 82,725 Total 24,561
10. Financing and Investment Income and Expenditure
2013/14
£’000
2014/15
£’000 8,030 Interest payable and similar charges 8,191
14,476 Net Interest on the net defined benefit liability 12,865 (1,690) Interest receivable and similar income (1,672)
(1,699)
Income and expenditure in relation to investment properties and changes in their fair value
(1,572)
19,117 Total 17,812
11. Taxation and Non Specific Grant Income
2013/14 £’000
2014/15 £’000
(85,816) Council tax income (90,897) (15,332) Non domestic rates income (15,364)
(112,662) Non-ring fenced government grants (101,644) (49,344) Capital grants and contributions (44,707)
(263,154) Total (252,612)

London Borough of Redbridge Statement of Accounts 2014/15
40
12. Property, Plant and Equipment
Movements in 2014/15
Cou
nci
l D
wel
ling
s
£’00
0
Oth
er L
and
an
d
Bu
ildin
gs
£’
000
Veh
icle
s, P
lant
s,
Furn
itur
e an
d
Equ
ipm
ent
£’00
0
Infr
astr
uct
ure
A
sset
s £’
000
Com
mu
nity
A
sset
s £’
000
Surp
lus
Ass
ets
£’00
0
Ass
ets
un
der
C
onst
ruct
ion
£’00
0
Tota
l P
rop
erty
, P
lant
an
d
Equ
ipm
ent
£’00
0
PFI
Ass
ets
incl
uded
in
pro
per
ty, P
lant
an
d E
qui
pm
ent
£’00
0
Cost or Valuation
At 1 April 2014 Restated
230,647 460,787 49,010 143,684 12,903 685 2,147
899,863
12,195
Adjustments 185 (434) 0 160 0 0 0 (89) 0
Additions
8,733 31,639 4,180 9,420 102 0 11,611 65,685 0
Revaluation increases / (decreases) recognised in the Revaluation Reserve
7,282
28,143
0
0
0
(11)
0
35,414
(1,255)
Revaluation increases / (decreases) recognised in the Surplus (Deficit) on the provision of services
(7,911)
(11,931)
0
0
0
0
0
(19,842)
0
Derecognition– Disposals
(2,850) (156) 0 0 0 (185) 0 (3,191) 0
Derecognition– Other
0 (12,727) 0 0 0 0 0 (12,727) 0
Reclassified Assets
38 1,476 0 11 0 (183) (1,342) 0 0
At 31 March 2015
236,124 496,797 53,190 153,275 13,005 306 12,416 965,113 10,940
Accumulated Depreciation and Impairment
At 1 April 2014 Restated
5,186 23,580 37,420 67,787 5,813 20 0 139,806 1,019
Adjustments 0 0 (12) 0 0 0 0 (12) 0
Depreciation charge 5,368 11,071 4,553 6,964 626 6 0 28,588 321
Accumulated Write Back on Revaluation
(5,186)
(18,843)
0
0
0
(12)
0
(24,041)
(1,020)
Derecognition– Disposals
(66)
(281)
0
0
0
(6)
0
(353)
0
At 31 March 2015 5,302 15,527 41,961 74,751 6,439 8 0 143,988 320
Net Book Value
At 31 March 2015
230,822 481,270 11,229 78,524 6,566 298 12,416 821,125 10,620
At 31 March 2014 225,461 437,207 11,590 75,897 7,090 665 2,147 760,057
11,176

London Borough of Redbridge Statement of Accounts 2014/15
41
Comparative figures 2013/14 - Restated
Cou
nci
l D
wel
ling
s
£’00
0
Oth
er L
and
an
d B
uild
ings
£’
000
Veh
icle
s, P
lan
ts, F
urn
itu
re
and
Eq
uip
men
t £’
000
Infr
astr
uct
ure
Ass
ets
£’00
0
Com
mu
nity
A
sset
s £’
000
Surp
lus
Ass
ets
£’00
0
Ass
ets
un
der
Con
stru
ctio
n £’
000
Tota
l P
rop
erty
, Pla
nt a
nd
Eq
uip
men
t £’
000
PFI
Ass
ets
incl
ud
ed in
p
rop
erty
, Pla
nt a
nd
Eq
uip
men
t £’
000
Cost or Valuation
At 1 April 2013 227,018 494,940 44,930 131,864 12,903 337 4,275 916,267 11,992
Prior year adjustments
0 11,020 0 0 0 0 0 11,020 0
Restated Balances at 1 April 2013
227,018 505,960 44,930 131,864 12,903 337 4,275 927,287 11,992
Additions
14,475 31,344 4,868 11,820 0 0 2,075 64,582 203
Revaluation increases / (decreases) recognised in the Revaluation Reserve
(68)
(3,559)
0
0
0
10
0
(3,617)
0
Revaluation increases / (decreases) recognised in the Surplus (Deficit) on the provision of services
(6,038)
(5,618)
0
0
0
0
0
(11,656)
0
Derecognition– Disposals
(3,112) (71,147) (788) 0 0 0 0 (75,047) 0
Derecognition– Other
(1,628) (58) 0 0 0 0 0 (1,686) 0
Reclassified Assets
0 3,865 0 0 0 338 (4,203) 0 0
At 31 March 2014
230,647 460,787 49,010 143,684 12,903 685 2,147
899,863
12,195
Accumulated Depreciation and Impairment
At 1 April 2013 Prior year adjustment
5,226
0
20,896
392
31,182
0
61,534
0
5,183
0
11
0
0
0
124,032
392
677
0 Depreciation charge
5,295 10,362 6,238 6,253 630 9 0 28,787 342
Accumulated Write Back on Revaluation
(5,264)
(5,482)
0
0
0
0
0
(10,746)
0
Derecognition– Disposals (71) (2,588) 0 0 0 0 0 (2,659) 0
At 31 March 2014 5,186 23,580 37,420 67,787 5,813 20 0 139,806 1,019
Net Book Value
At 31 March 2014 225,461 437,207 11,590 75,897 7,090 665 2,147 760,057
11,176
At 1 April 2013
221,792 485,064 13,748 70,330 7,720 326 4,275 803,255 11,315
2013/14 values have been restated. Please refer to Note 5 on pages 33-34 for details.
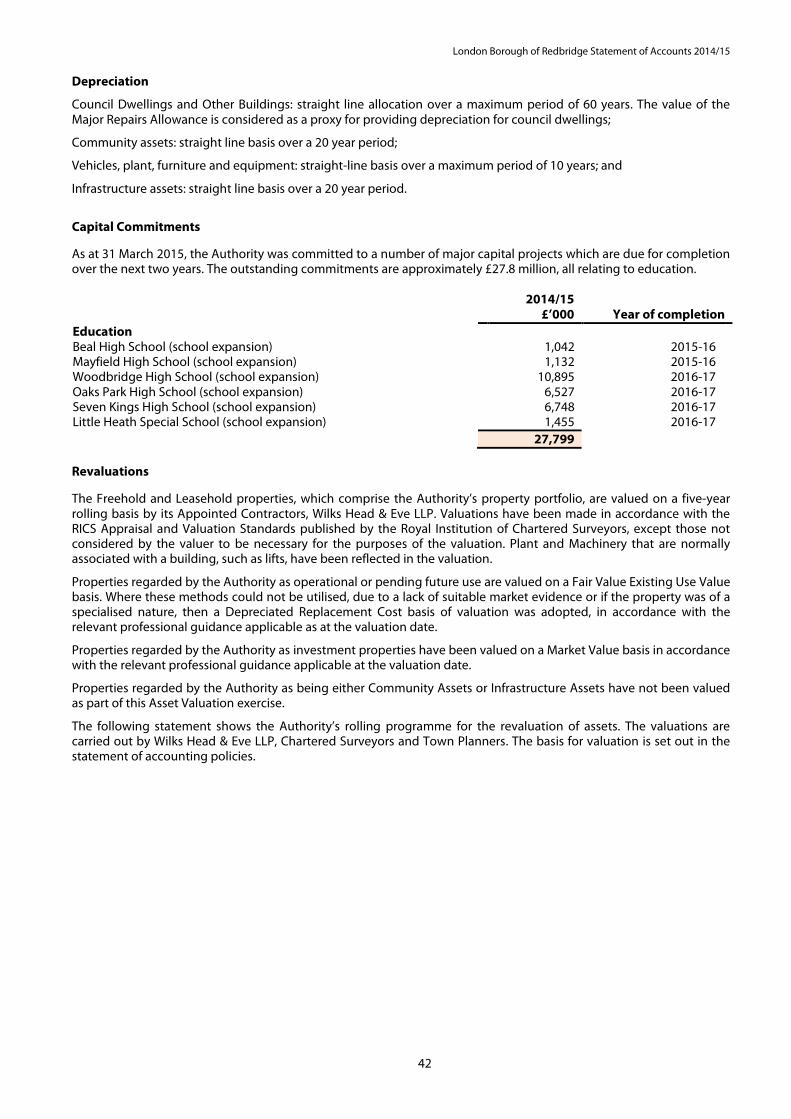
London Borough of Redbridge Statement of Accounts 2014/15
42
Depreciation
Council Dwellings and Other Buildings: straight line allocation over a maximum period of 60 years. The value of the Major Repairs Allowance is considered as a proxy for providing depreciation for council dwellings;
Community assets: straight line basis over a 20 year period;
Vehicles, plant, furniture and equipment: straight-line basis over a maximum period of 10 years; and
Infrastructure assets: straight line basis over a 20 year period.
Capital Commitments As at 31 March 2015, the Authority was committed to a number of major capital projects which are due for completion over the next two years. The outstanding commitments are approximately £27.8 million, all relating to education.
2014/15 £’000 Year of completion
Education Beal High School (school expansion) 1,042 2015-16 Mayfield High School (school expansion) 1,132 2015-16 Woodbridge High School (school expansion) 10,895 2016-17 Oaks Park High School (school expansion) 6,527 2016-17 Seven Kings High School (school expansion) 6,748 2016-17 Little Heath Special School (school expansion) 1,455 2016-17
27,799 Revaluations
The Freehold and Leasehold properties, which comprise the Authority’s property portfolio, are valued on a five-year rolling basis by its Appointed Contractors, Wilks Head & Eve LLP. Valuations have been made in accordance with the RICS Appraisal and Valuation Standards published by the Royal Institution of Chartered Surveyors, except those not considered by the valuer to be necessary for the purposes of the valuation. Plant and Machinery that are normally associated with a building, such as lifts, have been reflected in the valuation.
Properties regarded by the Authority as operational or pending future use are valued on a Fair Value Existing Use Value basis. Where these methods could not be utilised, due to a lack of suitable market evidence or if the property was of a specialised nature, then a Depreciated Replacement Cost basis of valuation was adopted, in accordance with the relevant professional guidance applicable as at the valuation date.
Properties regarded by the Authority as investment properties have been valued on a Market Value basis in accordance with the relevant professional guidance applicable at the valuation date.
Properties regarded by the Authority as being either Community Assets or Infrastructure Assets have not been valued as part of this Asset Valuation exercise.
The following statement shows the Authority’s rolling programme for the revaluation of assets. The valuations are carried out by Wilks Head & Eve LLP, Chartered Surveyors and Town Planners. The basis for valuation is set out in the statement of accounting policies.

London Borough of Redbridge Statement of Accounts 2014/15
43
Council Dwelling
£’000
Other Land and Buildings
£’000
Vehicles, Plant,
Furniture and Equipment
£’000
Surplus Assets £’000
Total £’000
Carried at historical cost 0 0 11,229 0 11,229 Valued at fair value as at:
31 March 2015 230,822 481,270 298 712,390 31 March 2014 - Restated 225,461 437,207 665 663,333 31 March 2013 221,792 474,044 326 696,162 31 March 2012 239,679 467,595 320 707,594 31 March 2011 229,862 506,143 2,527 738,532
13. Information on Assets Held Assets owned by the Authority include the following:
Number as at 31 March 2014
Number as at 31 March 2015
4,558 Council Dwellings 4,511 Operational Buildings
1 Town Hall 1 7 Other Offices 7 5 Adult Social Services Homes and Hostels 3 8 Adult Social Services Day Centres 7 3 Adult Social Services Other/Offices 3 1 Children’s Services Homes and Hostels 1 7 Children’s Services Day Centres 7 1 Children’s Services Other/Offices 1 1 Sports Centres 1 1 Swimming Pools 1
10 Libraries 10 42 Primary Schools 42
8 Secondary Schools 9 3 Special Schools 4 1 Depots 1
18 Surface Car Parks 18 1 Multi-storey Car Parks 1 5 Cemeteries 5 2 Hall and Theatre 2
Infrastructure Assets 529 Highways (km) 529
22 Bridges 22 6 Subways 6
20,965 Street Lights 20,965 Community Assets
815 hectares Parks, Open Spaces and Country Parks 815 hectares 137 hectares Allotments and Golf Courses 137 hectares
45 13
Other Assets Investment Properties Surplus Assets held for Disposal
45
7

London Borough of Redbridge Statement of Accounts 2014/15
44
14. Investment Property The following items of income and expense have been accounted for in the financing and Investment Income and Expenditure line in the Comprehensive Income and Expenditure Statement:
2013/14 £’000
2014/15 £’000
Rental income from investment property 1,984 1,968 Direct operating expenses arising from investment property (366) (408)
Net gain 1,618 1,560
There are no restrictions on the Authority’s ability to realise the value inherent in its investment property or on the Authority’s right to the remittance of income and the proceeds of disposal. The Authority has no contractual obligations to purchase, construct or develop investment property or repairs, maintenance or enhancement.
The following table summarises the movement in the fair value of investment properties over the year:
2013/14 £’000
2014/15 £’000
Balance at start of the year 25,711 25,792 Additions:
Net gains from fair value adjustments 81 12
Balance at end of the year 25,792 25,804
15. Intangible Assets The Authority accounts for its software as intangible assets, to the extent that the software is not an integral part of a particular IT system and accounted for as part of the hardware item of Property, Plant, and Equipment. The intangible assets are all purchased software licences. All software is given a finite useful life, based on assessments of the period that the software is expected to be of use to the Authority. The useful life assigned to the software licences used by the Authority is five years.
The carrying amount of intangible assets is amortised on a straight-line basis. The movement on intangible asset balances during the year is as follows:
2013/14 2014/15 Total
£’000 Total £’000
Balance at start of year: Gross cost amounts 1,963 2,013
Accumulated amortisation (1,526) (1,754)
Net carrying amount at start of year 437 259 Additions:
Purchases 50 137 Amortisation for the period (228) (121)
Net carrying amount at end of year 259 275 Comprising:
Gross cost amounts 2,013 2,150
Accumulated amortisation (1,754) (1,875)
Total 259 275

London Borough of Redbridge Statement of Accounts 2014/15
45
16. Impairment Losses
During 2014/15, the Authority has recognised an impairment loss of £7.9 million in relation to Council Dwellings. The value of Council Dwellings has been reduced as a result of changes in valuation in accordance with the market at the valuation date. Housing Revenue Account Council Dwellings £7.9 million
17. Private Finance Initiative Oaks Park High School – Scheme Details 2014/15 was the thirteenth year of a 30 year PFI contract for the construction, maintenance and operation of Oaks Park Secondary School. On the 4 July 2001, the Authority contracted with NU Schools For Redbridge Limited to provide a secondary school, Oaks Park High School, under a Private Finance Initiative.
Under the terms of the PFI, the Authority has leased a vacant site at Barley Mow to the PFI contractor for the period of the contract – 30 years. Under the PFI contract, the Authority pays an agreed charge, which has been accounted for as outlined in the Authority’s Accounting Policies as detailed on pages 27 to 28. At the time the contract was signed the total estimated contract payments were £65.90 million to the end of the contract in December 2032. Actual payments will depend on the service provided.
The Government provides a grant of approximately £52.028 million over the life of the contract. The key financial details of the scheme are detailed below: -
£’000 Total Scheme Capital Expenditure 15,999 Current residual asset value as at 31 March 2015 10,620 Residual asset value as at 31 March 2014 11,176 Estimated asset life 35 years Property Plant and Equipment The building used to provide services at the school is recognised on the Authority’s Balance Sheet. Movements in its value over the year are detailed in the analysis of the movement on the Property, Plant and Equipment in Note 12.
Payments The Authority makes an agreed payment each year which is increased each year by inflation and can be reduced if the contractor fails to meet availability and performance standards in any year but which is otherwise fixed. Payments remaining to be made under the PFI contract as at 31 March 2015 (excluding any estimation of inflation and availability / performance deductions) are as follows:
Services Charges
£’000
Principal Repayments
£’000
Interest Payments
£’000
Total £’000
Repayable within 1 year 950 383 1,059 2,392 Repayable in 2 to 5 years 3,800 1,886 3,883 9,569 Repayable in 6 to 10 years 4,750 3,409 3,802 11,961 Repayable in 11 to 15 years 4,750 5,121 2,090 11,961 Repayable in 16 to 20 years 1,900 2,344 541 4,785 Total 16,150 13,143 11,375 40,668

London Borough of Redbridge Statement of Accounts 2014/15
46
Although the payments made to the contractor are described as unitary payments, they have been calculated to compensate the contractor for the fair value of the services they provide, the capital expenditure incurred and interest payable whilst the capital expenditure remains to be reimbursed. The liability outstanding to pay the liability to the contractor for capital expenditure incurred is as follows:
2013/14 £’000
2014/15 £’000
Balance outstanding at start of the year 13,825 13,499 Payments during the year
(326) (353)
Balance outstanding at year-end 13,499 13,146
18. Debtors
31 March 2014 £’000
Long Term
31 March 2015 £’000
1,717 Leased Asset – Clements Road Car Park 1,703 378 Mortgages 141 468 Improvement Loans 468
57 Lease Premium 28 2,620 Total 2,340
31 March 2014
£’000
Short Term 31 March 2015
£’000 3,061 Central Government Bodies 2,692
103 Other Local Authorities 0 3,110 NHS bodies 4,523
55 Public corporations and trading funds 13
16,655 2,825 9,525 7,683 4,883 4,031
30,785 (39,168)
Other Debtors: Council Tax payers NDR Tax Payers Housing Tenants Housing Benefit Recoveries VAT Payment in Advance Other Entities & Individuals Bad Debts Provision
15,688
2,709 7,363 8,782 4,295 2,285
19,732 (35,488)
43,548 Total 32,594
19. Cash and Cash Equivalents
The Balance of Cash and Cash Equivalents is made up of the following elements:
31 March 2014 £’000
31 March 2015 £’000
22,012 Short Term Deposits 22,209 (8,766) Bank Overdraft (3,890)
13,246 Total Cash and Cash Equivalents 18,319

London Borough of Redbridge Statement of Accounts 2014/15
47
20. Creditors
Restated 31 March 2014
£’000
31 March 2015
£’000 951 Central Government Bodies 3,545
2,531 Other Local Authorities 4,545 708 NHS Bodies 768 210 Public corporations 201
8,068 3,216 1,419
2,658 1,032 4,011
40,402
Other Creditors: Capital Creditors Trade Creditors Housing Prepayments Council Tax Prepayments NDR Prepayments Income & Receipts Received in Advance Other Entities and Individuals
4,397 5,434 1,022 1,998
733 5,107
40,319 65,206 Total 68,069
21. Provisions
Single Status
Provision £’000
Insurance Provision
£’000
Redundancy
and Early Retirement
Provision £’000
Other Provisions
£’000
Total £’000
Balance 1 April 2014 18 11,437 97 606 12,158
Additional Provision made in 2014/15 0 1,704 400 432 2,536
Amounts used in 2014/15
(18) (1,395) (65) (85) (1,563)
Unused amounts reversed in 2014/15 0 0 0 (262) (262)
Balance at 31 March 2015 0 11,746 432 691 12,869
Purpose Insurance Provision: The Authority maintains an insurance provision to cover the retained element of risk for various areas. This includes public and employer’s liability, theft, education property damage and tree root damage. The remaining risks are transferred through cover provided by policies with insurance companies. The Authority’s insurance assessors, Jardine Lloyd Thompson, have advised that the provisional value of expected settlements relating to liability, together with actual property claims notified but not yet settled, amount to £11.7 million. The sum of £6.8 million has been set aside for unquantified insurance claims. The insurance reserve is included in Earmarked Revenue Reserve (see note 8). Redundancy and Early Retirement Provision: This has been established to meet agreed commitments relating to employee redundancy and retirements. A sum of £4.8 million has been set aside separately to meet expected future redundancy and early retirement payments (see note 8).
Other Provisions: These include a £136,000 provision for potential costs to be levied on the Authority by the LPFA, £432,000 to meet potential contract claims, £65,000 for potential repair costs to Chigwell Road Bridge and £58,000 to meet potential coroner costs.

London Borough of Redbridge Statement of Accounts 2014/15
48
22. Financial Instruments Categories of Financial Instruments The following categories of financial instrument are carried on the Balance Sheet:
Long Term
(longer than one year) Short Term
(less than one year) 31 March
2014 £’000
31 March 2015
£’000
31 March 2014
£’000
31 March 2015
£’000 Investments Loans and receivables
0 0 120,500 130,590 Available for sale of financial assets 0 10,161 25,032 30,201 Total Investments 0 10,161 145,532 160,791 Cash and Cash Equivalents 0 0 13,246 18,319 Debtors Loans and receivables 2,620 2,340 43,548 32,594 Total Debtors
2,620 2,340 43,548 32,594
Borrowings Financial liabilities at amortised cost: - PWLB 129,809 148,796 6,290 6,287 Market 35,276 35,268 505 503 Temporary Borrowing
0 0 1,816 1,992 Total Borrowings 165,085 184,064 8,611 8,782
Other Liabilities Finance lease liabilities 241 123 0 0 PFI liabilities 13,499 13,146 0 0 Total other liabilities 13,740 13,269 0 0
Creditors Financial liabilities at amortised cost 0 0 65,206 68,069 Total Creditors 0 0 65,206 68,069
Soft Loans The Authority has identified the following which may be categorised as soft loans (less than market rates):
Debt outstanding 31 March 2014
£'000
Debt outstanding 31 March 2015
£'000 Social Services – High Dependency Accommodation debtors
Balance bought forward 728 539 New loans granted 99 181 Loans Repaid (288) (197) Balance carried forward 539 523 Car Loans Balance bought forward 175 149 New loans granted 64 42 Loans Repaid (90) (65) Balance carried forward 149 126
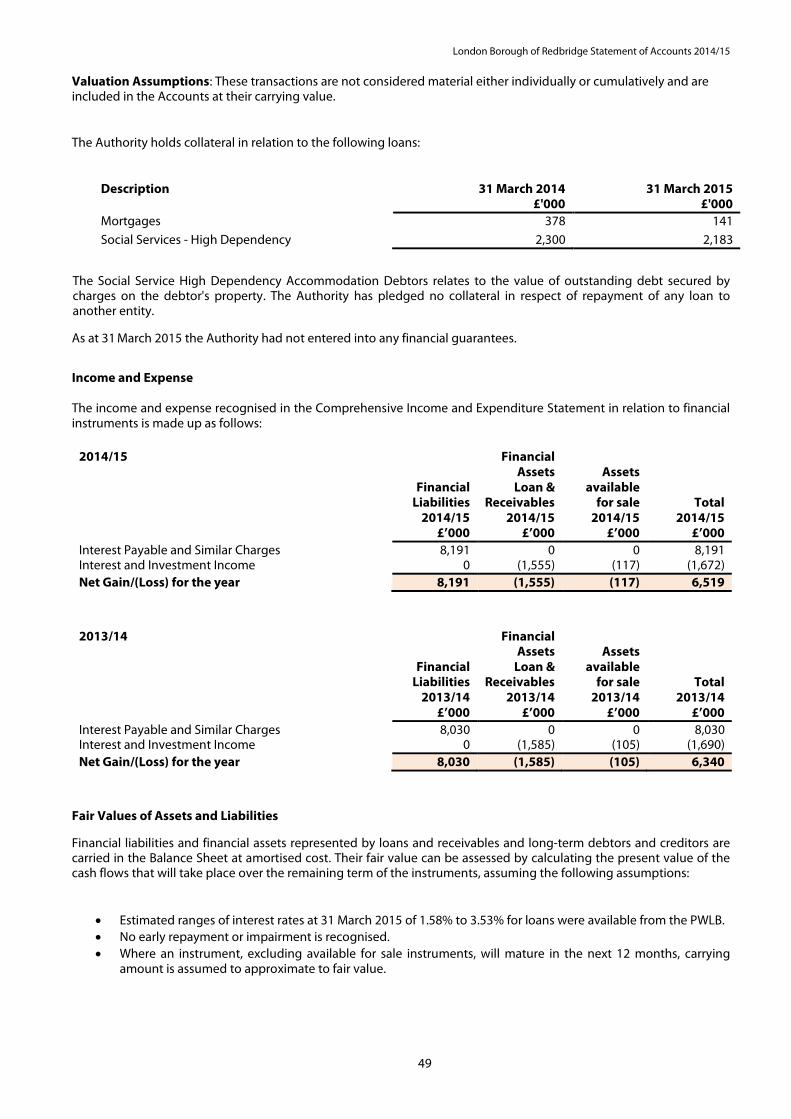
London Borough of Redbridge Statement of Accounts 2014/15
49
Valuation Assumptions: These transactions are not considered material either individually or cumulatively and are included in the Accounts at their carrying value.
The Authority holds collateral in relation to the following loans:
Description 31 March 2014 £'000
31 March 2015 £'000
Mortgages 378 141 Social Services - High Dependency
2,300 2,183
The Social Service High Dependency Accommodation Debtors relates to the value of outstanding debt secured by charges on the debtor's property. The Authority has pledged no collateral in respect of repayment of any loan to another entity. As at 31 March 2015 the Authority had not entered into any financial guarantees.
Income and Expense The income and expense recognised in the Comprehensive Income and Expenditure Statement in relation to financial instruments is made up as follows:
2014/15
Financial
Liabilities 2014/15
£’000
Financial Assets
Loan & Receivables
2014/15 £’000
Assets
available for sale
2014/15 £’000
Total 2014/15
£’000 Interest Payable and Similar Charges 8,191 0 0 8,191 Interest and Investment Income 0 (1,555) (117) (1,672) Net Gain/(Loss) for the year 8,191 (1,555) (117) 6,519
2013/14
Financial Liabilities
2013/14 £’000
Financial Assets
Loan & Receivables
2013/14 £’000
Assets
available for sale
2013/14 £’000
Total 2013/14
£’000 Interest Payable and Similar Charges 8,030 0 0 8,030 Interest and Investment Income 0 (1,585) (105) (1,690) Net Gain/(Loss) for the year 8,030 (1,585) (105) 6,340
Fair Values of Assets and Liabilities
Financial liabilities and financial assets represented by loans and receivables and long-term debtors and creditors are carried in the Balance Sheet at amortised cost. Their fair value can be assessed by calculating the present value of the cash flows that will take place over the remaining term of the instruments, assuming the following assumptions:
• Estimated ranges of interest rates at 31 March 2015 of 1.58% to 3.53% for loans were available from the PWLB. • No early repayment or impairment is recognised. • Where an instrument, excluding available for sale instruments, will mature in the next 12 months, carrying
amount is assumed to approximate to fair value.
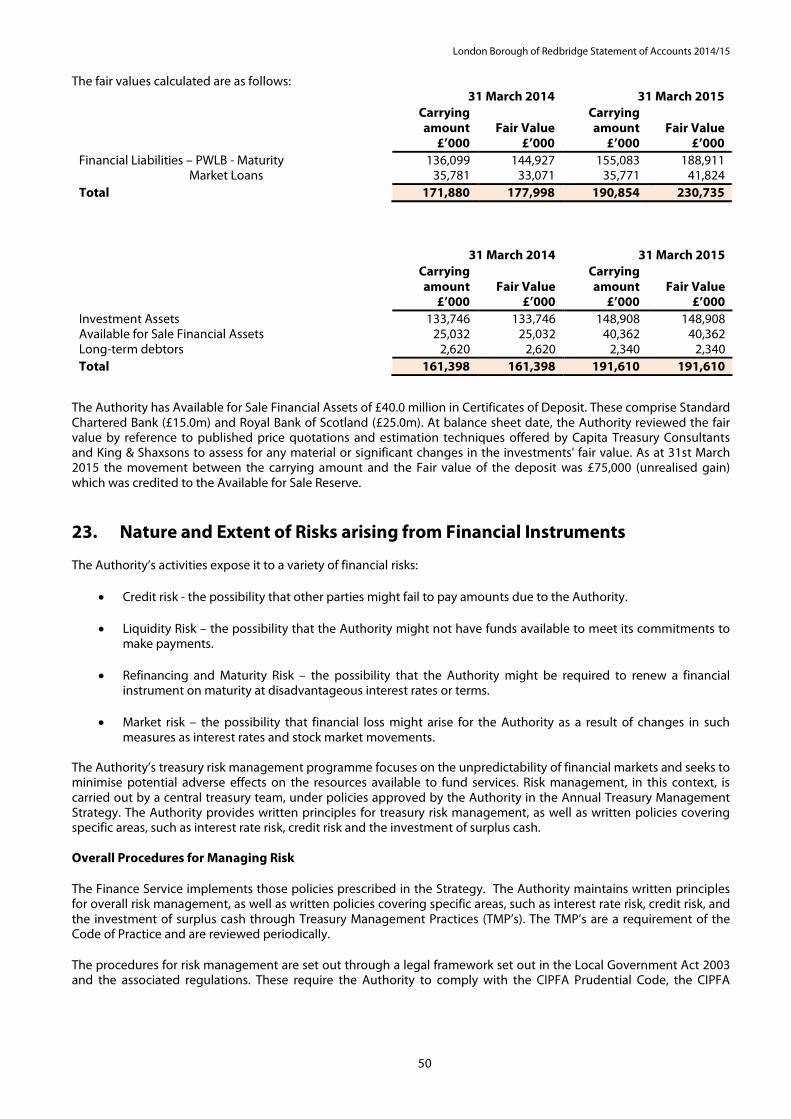
London Borough of Redbridge Statement of Accounts 2014/15
50
The fair values calculated are as follows: 31 March 2014 31 March 2015 Carrying
amount £’000
Fair Value
£’000
Carrying amount
£’000
Fair Value
£’000 Financial Liabilities – PWLB - Maturity 136,099 144,927 155,083 188,911 Market Loans 35,781 33,071 35,771 41,824 Total 171,880 177,998 190,854 230,735
31 March 2014 31 March 2015 Carrying
amount £’000
Fair Value
£’000
Carrying amount
£’000
Fair Value
£’000 Investment Assets 133,746 133,746 148,908 148,908 Available for Sale Financial Assets 25,032 25,032 40,362 40,362 Long-term debtors 2,620 2,620 2,340 2,340 Total 161,398 161,398 191,610 191,610
The Authority has Available for Sale Financial Assets of £40.0 million in Certificates of Deposit. These comprise Standard Chartered Bank (£15.0m) and Royal Bank of Scotland (£25.0m). At balance sheet date, the Authority reviewed the fair value by reference to published price quotations and estimation techniques offered by Capita Treasury Consultants and King & Shaxsons to assess for any material or significant changes in the investments' fair value. As at 31st March 2015 the movement between the carrying amount and the Fair value of the deposit was £75,000 (unrealised gain) which was credited to the Available for Sale Reserve.
23. Nature and Extent of Risks arising from Financial Instruments The Authority’s activities expose it to a variety of financial risks:
• Credit risk - the possibility that other parties might fail to pay amounts due to the Authority. • Liquidity Risk – the possibility that the Authority might not have funds available to meet its commitments to
make payments.
• Refinancing and Maturity Risk – the possibility that the Authority might be required to renew a financial instrument on maturity at disadvantageous interest rates or terms.
• Market risk – the possibility that financial loss might arise for the Authority as a result of changes in such
measures as interest rates and stock market movements.
The Authority’s treasury risk management programme focuses on the unpredictability of financial markets and seeks to minimise potential adverse effects on the resources available to fund services. Risk management, in this context, is carried out by a central treasury team, under policies approved by the Authority in the Annual Treasury Management Strategy. The Authority provides written principles for treasury risk management, as well as written policies covering specific areas, such as interest rate risk, credit risk and the investment of surplus cash.
Overall Procedures for Managing Risk
The Finance Service implements those policies prescribed in the Strategy. The Authority maintains written principles for overall risk management, as well as written policies covering specific areas, such as interest rate risk, credit risk, and the investment of surplus cash through Treasury Management Practices (TMP’s). The TMP’s are a requirement of the Code of Practice and are reviewed periodically.
The procedures for risk management are set out through a legal framework set out in the Local Government Act 2003 and the associated regulations. These require the Authority to comply with the CIPFA Prudential Code, the CIPFA

London Borough of Redbridge Statement of Accounts 2014/15
51
Treasury Management in the Public Services Code of Practice and Investment Guidance issued through the Act. Overall these procedures require the Authority to manage risk in the following ways:
• by formally adopting and following the requirements of the Code of Practice;
• by approving annually in advance Prudential Indicators for the following three years limiting:
o the Authority’s overall borrowing;
o maximum and minimum exposure to fixed and variable interest rates;
o maximum and minimum debt repayment profile;
o maximum annual exposure to investments maturing beyond a year.
The Investment Strategy for the forthcoming year sets out criteria for both investing and selecting investment counterparties in compliance with government guidance. The Strategy’s objective is to prioritise the security and liquidity of the Authority’s investments over the investment yield. Prior to being approved by full Council, the Strategy is scrutinised by the Authority’s Audit Committee. Performance is reported bi-annually to Council. An annual report is also required. The Annual Investment Strategy for 2014/15 was approved by full Council on the 6 March 2014 and is available to view on the Authority’s website – www.redbridge.gov.uk.
Credit Risk
Credit risk arises from deposits with banks, financial institutions, as well as credit exposure to the Authority’s other debtors.
Credit risk arising from deposits with Banks and Financial Institutions
The Annual Investment Strategy (details of which are available on the Authority’s website) requires the Authority to maintain a counterparty list that follows the criteria set out in the Treasury Management Practices. Creditworthiness is assessed by the use of credit ratings provided by Fitch Ratings, Moody's and Standard and Poor's, to assess an institution's long and short-term financial strength along with its individual and support ratings. Other information provided by Brokers, Advisers and financial and economic reports is also collated and assessed and then used to produce rating paramities to monitor each individual institution against the Authority's credit worthiness criteria to impose a maximum sum to be invested with a financial institution located within each category. These include credit watches and outlooks from credit rating agencies, and Credit Default Swap prices to give early warning of likely changes in credit ratings and sovereign ratings.
Any counterparty whose ratings fall to the extent that they no longer meet the credit criteria is immediately removed from the lending list.
Only highly rated counterparties may be included on the lending list:
• Banks; • UK Building Societies with assets in excess of £3billion; • AAA Money Market Funds; • UK Government (Debt Management Office); • Enhanced Cash Funds; • Non UK Government and Supranational Institutions; • Other Local Authorities.
The Authority’s maximum exposure to credit risk in relation to its investments in banks and building societies of £192.2 million can be assessed generally as the risk of any institution failing to make interest payments or repay the principal sum will be specific to each individual institution. Recent experience has shown that it is rare for such entities to be unable to meet their commitments. A risk of irrecoverability applies to all of the Authority’s deposits; there was no evidence at the 31 March 2015 that this was likely to materialise.
In addition, the diversification of investments also provides additional security. The maximum percentages of the investment portfolio, which may be invested in each class of assets, are detailed overleaf:
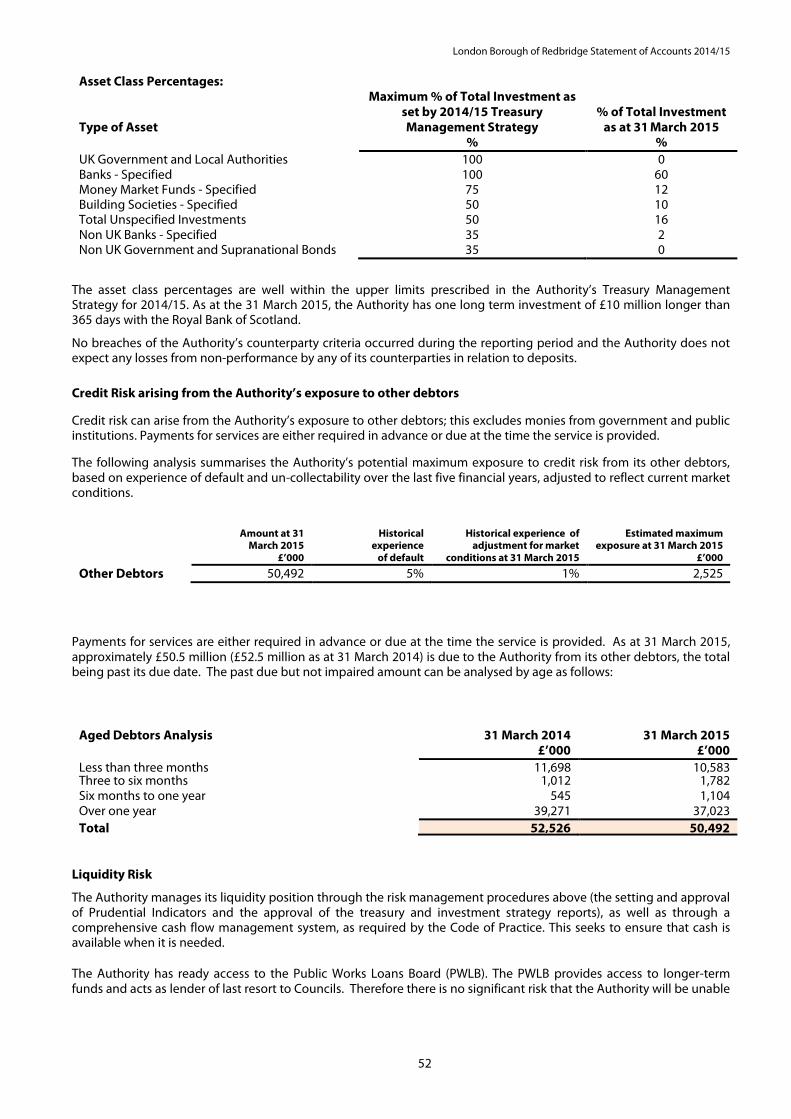
London Borough of Redbridge Statement of Accounts 2014/15
52
Asset Class Percentages: Type of Asset
Maximum % of Total Investment as set by 2014/15 Treasury Management Strategy
%
% of Total Investment
as at 31 March 2015 %
UK Government and Local Authorities 100 0 Banks - Specified 100 60 Money Market Funds - Specified 75 12 Building Societies - Specified 50 10 Total Unspecified Investments 50 16 Non UK Banks - Specified 35 2 Non UK Government and Supranational Bonds 35 0
The asset class percentages are well within the upper limits prescribed in the Authority’s Treasury Management Strategy for 2014/15. As at the 31 March 2015, the Authority has one long term investment of £10 million longer than 365 days with the Royal Bank of Scotland.
No breaches of the Authority’s counterparty criteria occurred during the reporting period and the Authority does not expect any losses from non-performance by any of its counterparties in relation to deposits.
Credit Risk arising from the Authority’s exposure to other debtors Credit risk can arise from the Authority’s exposure to other debtors; this excludes monies from government and public institutions. Payments for services are either required in advance or due at the time the service is provided. The following analysis summarises the Authority’s potential maximum exposure to credit risk from its other debtors, based on experience of default and un-collectability over the last five financial years, adjusted to reflect current market conditions.
Amount at 31 March 2015
£’000
Historical experience
of default
Historical experience of adjustment for market
conditions at 31 March 2015
Estimated maximum exposure at 31 March 2015
£’000
Other Debtors 50,492 5% 1% 2,525 Payments for services are either required in advance or due at the time the service is provided. As at 31 March 2015, approximately £50.5 million (£52.5 million as at 31 March 2014) is due to the Authority from its other debtors, the total being past its due date. The past due but not impaired amount can be analysed by age as follows:
Aged Debtors Analysis 31 March 2014 £’000
31 March 2015 £’000
Less than three months 11,698 10,583
Three to six months 1,012 1,782 Six months to one year 545 1,104 Over one year 39,271 37,023 Total
52,526 50,492
Liquidity Risk
The Authority manages its liquidity position through the risk management procedures above (the setting and approval of Prudential Indicators and the approval of the treasury and investment strategy reports), as well as through a comprehensive cash flow management system, as required by the Code of Practice. This seeks to ensure that cash is available when it is needed.
The Authority has ready access to the Public Works Loans Board (PWLB). The PWLB provides access to longer-term funds and acts as lender of last resort to Councils. Therefore there is no significant risk that the Authority will be unable

London Borough of Redbridge Statement of Accounts 2014/15
53
to raise finance to meet its commitments. As at 31 March 2015 80% (79% as at 31 March 2014) of the Authority’s loans outstanding were with the PWLB and 20% provided by the Money Market.
Through the Local Government Finance Act 1992, the Authority is required to provide a balanced budget, which ensures sufficient monies are raised to cover annual expenditure. The Authority has set a prudent three year budget and sought to set an affordable council tax for its residents. Therefore, there is no significant risk that the Authority will be unable to raise finance to meet its commitments.
The Authority manages its day-to-day liquidity position though the monitoring of Prudential Indicators, associated strategies and practices and cash flow management procedures.
Refinancing and Maturity Risk
The Authority’s approved Treasury and Investment strategies are set to avoid the risk of refinancing on unfavourable terms. The central treasury team address the operational risks within approved parameters. These include:
• Monitoring the maturity profile of financial liabilities and amending the profile through either new borrowing or rescheduling existing debt;
• Monitoring the maturity of investments to ensure that there is sufficient liquidity available for the Authority’s day-to-day cash flow needs (this is set at £25 million in the Treasury Strategy), and the spread of long term investments provides stability of maturities and returns in relation to long term cash flow needs; and
• On a short-term basis internal balances are available to be used for finance should market interest rates be unfavourable at the time of refinancing.
The maturity analysis for borrowing is as follows:
Renewal Period Loans Outstanding as at
31 March 2015
£’000’s
Limit of projected Fixed rate Borrowing
%
% of Total Borrowing
31 March 2015
%
% of Total Borrowing
31 March 2014
%
Less than one Year 26,280 30 14 15
Between one and two years 15,513 45 8 4
Between two and five years 17,025 60 9 19
Between five and ten years 16,563 80 9 10
More than 10 Years 114,695 100 60 52
Total 190,076 100 100
Market loans are included in the above table based on the callable date. Market Risk Interest Rate Risk The Authority is exposed to risk in terms of its interest rate movements on its borrowings and investments. Movements in interest rates have a complex impact on the Authority. For instance, a rise in interest rates would have the following effects:
• Borrowing at variable rates – the interest expense charged to the Surplus / Deficit on the provision of services will rise
• Borrowings at fixed rates – the fair value of the liabilities will fall • Investments at variable rates – the interest income credited to the Surplus / Deficit on the Provision of Services
will rise • Investments at fixed rates – the fair value of the assets will fall.

London Borough of Redbridge Statement of Accounts 2014/15
54
Borrowings are not carried at fair value, so nominal gains and losses on fixed rate borrowings would not impact on the Surplus and Deficit on the Provision of Services or Other Comprehensive Income and Expenditure. However, changes in interest payable and receivable on variable rate borrowings and investments will be posted to the Surplus or Deficit on the Provision of Services and affect the General Fund Balance. Movements in the fair value of fixed rate investments that have quoted market prices will be reflected in Other Comprehensive Income and Expenditure. The Authority has a number of strategies for managing interest rate risk. There policy allows for a maximum of 25% of its borrowings to be held if appropriate in variable rate loans. During periods of falling interest rates, and where economic circumstances make it favourable, fixed rate loans may be repaid early to limit exposure to losses. The Finance Service has an active strategy for assessing interest rate exposure that feeds into the setting of the annual budget and which is used to update the budget quarterly during the year. This allows any adverse changes to be accommodated. The analysis will also advise whether new borrowing taken out is fixed or variable. According to this assessment strategy, at 31 March 2015, if interest rates had been 1% higher with all other variables held constant, the financial effect would be:
Impact of 1% increase in interest rates
£’000
Increase in interest payable on variable rate borrowings
0 Increase in Interest receivable on variable rate investments 0
Increase in government grant receivables for financing costs 0
Impact on Surplus or Deficit on the Provision of Services 0
Share of overall impact debited to the HRA 0
Decrease in fair value of fixed rate investment assets Impact on Other Comprehensive Income and Expenditure 0 Decrease in fair value of fixed rate borrowings liabilities (no impact on the Surplus or Deficit) on the provision of Services or Other Comprehensive Income and Expenditure)
29,122
The fair value is greater than the carrying amount because the Authority’s portfolio includes a number of fixed rate loans where the interest rate payable is higher than the rates available for similar loans in the market at the balance sheet date. The impact of a 1% fall in interest rates would be as above but with the movements being reversed.
Price Risk The Authority does not invest in equity shares and therefore is not exposed to losses arising from movement in the price of shares. Foreign Exchange Risk The Authority, excluding its Pension Fund, has no financial assets or liabilities denominated in foreign currencies, therefore has no exposure to loss arising from movements in exchange rates.

London Borough of Redbridge Statement of Accounts 2014/15
55
24. Grant Income The Authority credited the following grants and contributions to the Comprehensive Income and Expenditure Statement in 2014/15:
2013/14 £’000
2014/15 £’000
Credited to Taxation and Non Specific Grant Income Recognised Capital Grants and contributions 49,344 44,707 Council Tax 85,816 90,897 NDR 15,332 15,364 RSG 100,434 88,905 Non Service Related Government Grants 12,228 12,739 Total 263,154 252,612 Credited to Services Department of Work & Pensions 153,580 152,168 Department for Education 262,719 255,719 Other Miscellaneous Grants 22,511 33,397 Total 438,810 441,284
The Authority has received a number of grants and contributions that have yet to be recognised as income as they have conditions attached to them that will require the monies or property to be returned to the giver. The balances at the year-end are as follows:
2013/14 £’000
2014/15 £’000
Capital Grants Receipts in Advance
Short Term Devolved Formula Capital Grant 1,462 1,030 Total 1,462 1,030
Revenue Grants Receipts in Advance Sixth Form Funding Grant
84 178 Regeneration Grant – Department for Communities and Local Government
101
0
Children’s Services 81 0 Total 266 178
Where a grant has yet to be used to finance Revenue or Capital Expenditure, it is either posted to the Revenue or Capital Unapplied Reserve.
2013/14 £’000
2014/15 £’000
Revenue Grants Unapplied Housing Grant 985 595 Department of Health Grant 611 2,889 Children’s Services Grant 3,079 1,937 Planning Delivery Grant 138 302 DCLG Grant 202 286 Climate Change Grant 74 154 Highways Grant 203 331 Safer Community Grant 145 133 Department for Communities and Local Government 7,164 4,164 Total 12,601 10,791 Section 106 – Housing 3,379 1,766 Total 15,980 12,557

London Borough of Redbridge Statement of Accounts 2014/15
56
2013/14 £’000
2014/15 £’000
Capital Grants and Contributions Unapplied Housing Grant 1,234 1,208 Standards Fund – Children’s Services 692 1 Planning Delivery Grant 50 50 Public Art Grant 38 38 Department for Education 33,646 16,829 35,660 18,126 Section 106 4,001 3,839 Community Infrastructure Levy 1,272 3,936 Other Capital Contributions 42 50 Total 40,975 25,951
25. Disclosure of Deployment of Dedicated Schools Grant in 2014/15
The Authority’s Expenditure on schools is funded primarily by grant monies provided by the Department for Education (DfE), the Dedicated Schools Grant (DSG). DSG is ring-fenced and can only be applied to meet expenditure properly included in the Schools Budget, as defined in the School Finance and Early Years (England) Regulations 2011. The Schools Budget includes elements for a range of educational services provided on an authority-wide basis and for the Individual Schools Budget, which is divided into a budget share for each maintained school.
Details of the deployment of DSG receivable for 2014/15 are as follows:
Notes
Central Expenditure
Individual Schools Budget
(ISB)
Total
£’000
£’000
£’000
Final DSG for 2014/15 1
254,822 before Academy recoupment
Academy figure recouped for 2014/15 2
(35,981)
Total DSG after Academy recoupment 3
for 2014/15
218,841
Plus: Brought forward from 2013/14 4
2,799
Total DSG including Brought Forward 221,640
Agreed initial budgeted distribution in 2014/15 5
40,773
180,027
220,800
In year adjustments 6
361
479
840
Final budget distribution for 2014/15 7
41,134
180,506
221,640
Less: Actual central expenditure 8
(43,266)
(43,266)
Less: Actual ISB deployed to schools 9
(177,826)
(177,826)
Plus Local Authority contribution for 2014/15 10
24
24
Carry forward to 2015/16 11
(2,108)
2,680
572

London Borough of Redbridge Statement of Accounts 2014/15
57
Notes 1. Final DSG figure before any amount has been recouped from the authority excluding the January 15 early years block
adjustment.
2. Figure recouped from the authority in 2014/15 by the Department for Education (DfE) for Academies.
3. Total figure after DfE academy recoupment for 2014/15.
4. Figure brought forward from 2013/14.
5. Budgeted distribution of DSG, adjusted for carry-forward, as agreed with the schools forum.
6. Changes to the initial distribution.
7. Budgeted distribution of DSG as at the end of the financial year.
8. Actual amount of central expenditure items in 2014/15.
9. Amount of ISB actually distributed to schools (ISB is regarded for DSG purposes as spent by the authority once it is deployed to schools’ budget shares).
10. Contribution to the DSG from the local authority in 2014/15.
11. Carry-forward to 2015/16.
26. Leases
The Authority as Lessee Finance Leases The Authority has acquired a number of Vehicles, Plant, Furniture and Equipment under finance leases. The assets acquired under these leases are carried as Property, Plant and Equipment in the Balance Sheet as the following net amounts:
31 March 2014 £’000
31 March 2015 £’000
Vehicles, Plant, Furniture and Equipment
495 216
495 216 The Authority is committed to making minimum payments under these leases, comprising settlement of the long term liability for the interest in the assets acquired by the Authority and finance costs that will be payable by the Authority in future years while the liability remains outstanding. The minimum lease payments are made up of the following amounts:
31 March 2014 £’000
31 March 2015 £’000
Finance lease liabilities (net present value of minimum lease payments):
Current 130 60 Non- current 135 75 Finance costs payable in future years (27) (14) Finance lease payments
238 121

London Borough of Redbridge Statement of Accounts 2014/15
58
The minimum lease payments will be payable over the following periods:
Minimum Lease Payments Finance Lease Payments 31 March 2014
£’000 31 March 2015
£’000 31 March 2014
£’000 31 March 2015
£’000
Not later than one year 130 60 117 53
Later than one year and not later than five years
135
75
121
68
Total 265 135 238 121 The minimum lease payments do not include rents that are contingent on events taking place after the lease was entered into, such as adjustments following rent reviews. In 2014/15, £0 contingent rents were payable by the Authority (2013/14 - £0).
Operating Leases
The future minimum lease payments due under non-cancellable leases in future years are as follows:
31 March 2014 £’000
31 March 2015 £’000
Not later than one year 653 177 Later than one year and not later than five years
543 487 Later than five years 213 91 Total 1,409 755 The expenditure charged to the relevant service area in the Comprehensive Income and Expenditure Statement during the year in relation to these leases was:
31 March 2014 £’000
31 March 2015 £’000
Minimum lease payments
741 653
Total
741 653 None of the assets acquired under operating leases are sub-let. In addition, there were no contingent rents attached to the contracts.
The Authority as Lessor Finance Leases The Authority entered into a contract with Britannia Parking Limited for the lease of a multi storey car park at Clements Road, Ilford for a period of 125 years, from April 2002. The car park will be both managed and operated by Britannia Parking Limited. The rent is increased annually by applying a formula based upon the annual RPI index. The Authority has a gross investment in the lease, made up of the minimum lease payments expected to be received over the remaining term and the residual value anticipated for the property when the lease comes to an end. The minimum lease payments comprise settlement of the long term debtor for the interest in the property acquired by Britannia Parking Limited and finance income that will be earned by the Authority in future years whilst the debtor remains outstanding. The gross investment is made up of the following amounts:

London Borough of Redbridge Statement of Accounts 2014/15
59
31 March 2014
£’000 31 March 2015
£’000 Finance lease debtor (net present value of minimum lease payments):
Current
97 97 Non- current
10,887 10,789 Unearned finance income
(9,266) (9,183) Unguaranteed residual value of property
149 161 Gross investment in the lease
1,867 1,864 The gross investment in the lease and the minimum lease payments will be received over the following periods:
Minimum Lease Payments Finance Lease Payments 31 March 2014
£’000 31 March 2015
£’000 31 March 2014
£’000 31 March 2015
£’000 Not later than one year 15 15 15 15
Later than one year and not later than five years
61 61 61 61
Later than five years 1,642 1,626 1,791 1,788 Total 1,718 1,702 1,867 1,864 The minimum lease payments do not include rents that are contingent on events taking place after the lease entered into, such as future price indices. In 2014/15, contingent rents of £45,670 were receivable by the Authority (£44,007 in 2013/14).
Operating Leases The Authority leases out land under operating leases for:
• The provision of community services. • Economic development purposes.
The future minimum lease payments receivable under non-cancellable leases in future years are:
31 March 2014 £’000
31 March 2015 £’000
Not later than one year 5 5 Later than one year and not later than five years
20 20 Later than five years 553 547 Total 578 572
The minimum lease payments receivable do not include rents that are contingent on events taking place after the lease was entered into, such as adjustments following rent reviews. In 2014/15, contingent rents of £2,404 were receivable by the Authority (2013/14 - £2,316).
27. Capital Expenditure and Capital Financing The total amount of capital expenditure incurred in the year is shown in the table below (including the value of assets acquired under finance leases and PFI contracts), together with the resources that have been used to finance it. Where capital expenditure is to be financed in future years by charges to revenue as assets are used by the Authority, the expenditure results in an increase in the Capital Financing Requirements (CFR), a measure of the capital expenditure incurred historically by the Authority that has yet to be financed. The CFR is analysed in the second part of this note.

London Borough of Redbridge Statement of Accounts 2014/15
60
2013/14 £’000
2014/15 £’000
Capital Investment
Property, Plant and Equipment
64,582 65,685 Intangible Assets
50 137 Revenue Expenditure Funded from Capital under Statute
15,673 7,555 Total
80,305 73,377 Sources of Finance
Capital Receipts
(493) (1,000) Government grants and other contributions
(70,425) (59,731) Capital expenditure charged against the General Fund and HRA balances
(3,847)
(4,194)
Contributions from reserves including MRR
(3,854) (7,071) (78,619) (71,996) Increase in underlying need to borrow unsupported by government financial assistance
(1,686)
(1,381)
Total
(80,305) (73,377)
Restated 2013/14
£’000
2014/15
£’000 Capital Financing Requirement
Total Assets
786,108 847,204 Less Revaluation Reserve
(128,687) (182,015) Less Capital Adjustment Account
(408,821) (421,914) Closing Capital Financing Requirements
248,600 243,275
28. Usable Reserves Movements in the Authority’s usable reserves are detailed in the movement in Reserves Statement on pages 12 and 13 and in Note 8.
29. Unusable Reserves
Restated 1 April
2013 £’000
Restated 31 March
2014 £’000
31 March
2015 £’000
131,716 128,687 Revaluation Reserve 182,015 443,753 408,821 Capital Adjustment Account 421,914
(237) (237) Financial Instruments Adjustment Account (237) 0 0 Financial Instruments Available for Sale Reserve 75
(323,624) (314,396) Pensions Reserve (356,378) 309 216 Deferred Capital Receipts 161
(5,457) (4,545) Accumulated Absences Account (5,001) 790 1,337 Collection Fund Adjustment Account 6,566
247,250 219,883 Total Unusable Reserves 249,115

London Borough of Redbridge Statement of Accounts 2014/15
61
29 (a) Revaluation Reserve
The Revaluation Reserve contains the gains made by the Authority arising from increases in the value of its Property, Plant and Equipment (and intangible assets). The balance is reduced when assets with accumulated gains are:
• Revalued downwards or impaired and the gains are lost • Used in the provision of services and the gains are consumed through depreciation, or • Disposed of and the gains are realised.
The Reserve contains only revaluation gains accumulated since 1 April 2007, the date that the reserve was created. Accumulated gains arising before that date are consolidated into the balance on the Capital Adjustment Account.
31 March 2014
£’000
31 March 2015
£’000 131,716 Balance at 1 April 128,687
13,627 Upwards revaluation of assets 73,987
(6,579)
Downward revaluation of assets and impairment losses not charged to surplus/deficit on the Provision of Services
(14,576)
7,048 (Deficit) or Surplus on revaluation of non-current assets not posted to the surplus/deficit on the Provision of Services
59,411
(3,178) Difference between fair value depreciation and historical cost depreciation
(4,812)
(6,899) Adjusting amounts written out to the Capital Adjustment Account (1,271)
128,687 Balance at 31 March 182,015
29 (b) Capital Adjustment Account The Capital Adjustment Account absorbs the timing difference arising from the different arrangements for accounting for the consumption of non-current assets and for financing the acquisitions, construction or enhancement of those assets under statutory provisions. The Account is debited with the cost of acquisition, construction or enhancement as depreciation, impairment losses and amortisations are charged to the Comprehensive Income and Expenditure Statement (with reconciling postings from the Revaluation Reserve to convert fair value figures to a historical cost basis). The Account is credited with the amounts set aside by the Authority as finance for the costs of acquisition, construction and enhancement. The Account contains accumulated gains and losses on Investment Properties and gains recognised in donated assets that have yet to be consumed by the Authority. The Account also contains revaluation gains accumulated on Property, Plant and Equipment before 1 April 2007, the date that the Revaluation Reserve was created to hold such gains.

London Borough of Redbridge Statement of Accounts 2014/15
62
Restated 31 March
2014 £’000
31 March
2015 £’000
443,753 Balance at 1 April 408,821 Items relating to capital expenditure debited or credited to
the Comprehensive Income and Expenditure Statement:
(26,078) Charges for depreciation and impairment of non-current assets (23,772)
(11,656) Revaluation losses on Property, Plant and Equipment (19,842)
(228) Amortisation of intangible assets
(121)
(15,673) Revenue expenditure funded from capital under statute (7,555)
(73,931)
Amounts of non-current assets written off on disposal or sale as part of the gain / loss on disposal to the Comprehensive Income and Expenditure Statement
(15,616)
(127,566) (66,906)
6,899 Adjusting amounts written out of the Revaluation Reserve 1,271
(120,667) Written out of the cost of non-current assets consumed in the year
(65,635)
Capital financing applied in the year: 493 Use of the Capital Receipts Reserve to finance new capital
expenditure 1,000
2,058 Use of the Major Repairs Reserve to finance new capital expenditure
3,864
70,425 Application of grants to capital financing from the Capital Grants and Contributions Unapplied Account
59,731
7,035 Statutory provisions for the financing of capital investment charged against the General Fund
6,720
5,643 Capital expenditure charged against the General Fund and HRA balances
7,401
85,654 78,716
81 Movements in the market value of Investment properties debited or credited to the Comprehensive Income and Expenditure Statement
12
408,821 Balance at 31 March 421,914
29 (c) Financial Instruments Adjustment Account This account provides a balancing mechanism between the statutory valuations and accounting requirements in respect of interest payable on staggered rate loans, where the interest payable is smoothed over the term of the loan, and discounts received on early repayment of PWLB loans, which are amortised over a number of years to the Income and Expenditure Account. The resulting difference is reflected in the Financial instruments Adjustment Account. Where premiums and discounts have been charged to the Comprehensive Income and Expenditure Statement, regulations allow the impact on the General Fund Balance to be spread over future years. The Authority spreads the gain or loss over the term that was remaining on the loan when it is repaid. The reconciliation of amounts charged to

London Borough of Redbridge Statement of Accounts 2014/15
63
the Comprehensive Income and Expenditure Statement to the net charge required against the General Fund Balance is managed by a transfer to or from the Financial Instruments Adjustment Account.
31 March 2014
£’000
31 March 2015
£’000 (237) Balance at 1 April (237)
8 Interest adjustment on staggered rate loans 8
(8) Proportion of premiums incurred in previous financial years (8)
0
Amount by which finance costs charged to the Comprehensive Income and Expenditure Statement are different from finance costs chargeable in the year in accordance with statutory requirements
0
(237) Balance at 31 March (237)
29 (d) Pension Reserve The Pensions Reserve absorbs the timing differences arising from the different arrangements for accounting for post-employment benefits and for funding benefits in accordance with statutory provisions. The Authority accounts for post-employment benefits in the Comprehensive Income and Expenditure Statement as the benefits earned by employees accruing years of service, updating the liabilities recognised to reflect inflation, changing assumptions and investment returns on any resources set aside to meet the costs. However, statutory arrangements require benefits earned to be financed as the Authority makes employer’s contributions to pension funds or eventually pay any pensions for which it is directly responsible. The debit balance on the Pensions Reserve therefore shows a substantial shortfall in the benefits earned by past and current employees and the resources the Authority has set aside to meet them. The statutory arrangements will ensue that funding will have been set aside by the time the benefits come to be paid.
31 March 2014
£’000
31 March 2015
£’000 (323,624) Balance at 1 April
(314,396)
17,918 Actuarial (losses)/gains on pensions assets and liabilities
(29,858)
(32,122)
Reversal of items relating to retirement benefits debited or credited to the Surplus or Deficit on the Provision of Services in the Comprehensive Income and Expenditure Statement
(36,898)
23,432 Employer’s pensions contributions and direct payments to pensioners payable in the year
24,774
(314,396) Balance at 31 March (356,378)
29 (e) Deferred Capital Receipts Reserve The Deferred Capital Receipts Reserve holds the gains recognised on the disposal of non-current assets but for which cash settlements have yet to take place. Under statutory arrangements, the Authority does not treat these gains as usable for financing new capital expenditure until they are backed by cash receipts. When the deferred cash settlement eventually takes place, amounts are transferred to the Capital Receipts Reserve.
31 March
2014 £’000
31 March 2015
£’000 309 Balance at 1 April
216
(93) Transfer to the Capital Receipts Reserve upon receipt of cash
(55) 216 Balance at 31 March 161

London Borough of Redbridge Statement of Accounts 2014/15
64
29 (f) Accumulated Absences Account The Accumulated Absences Account absorbs the differences that would otherwise arise in the General Fund Balance from accruing for compensated absence earned but not taken in the year, e.g. annual leave entitlement carried forward at 31 March. Statutory arrangements require that the impact on the General Fund Balance is neutralised by transfers to or from the Account.
31 March 2014
£’000
31 March 2015
£’000 (5,457) Balance at 1 April (4,545)
5,457 Settlement or cancellation of accrual made at the end of the preceding year
4,545
(4,545) Amounts accrued at the end of the current year (5,001)
912
Amount by which officer remuneration charged to the Comprehensive Income and Expenditure Statement on an accrual basis is different from remuneration chargeable in the year in accordance with statutory requirements
(456)
(4,545) Balance at 31 March (5,001)
29 (g) Collection Fund Adjustment Account The Collection Fund Adjustment Account manages the differences arising from the recognition of council tax and non- domestic rate income in the Comprehensive Income and Expenditure Statement as it falls due from council tax and rate payers, compared with the statutory arrangements for paying across amounts to the General Fund from the Collection Fund.
31 March 2014
£’000
31 March 2015
£’000 790 Balance at 1 April
1,337
547
Amount by which council tax and non-domestic rate income credited to the Comprehensive and Expenditure Statement is different from council tax and non-domestic rate income calculated for the year in accordance with statutory requirements
5,229
1,337 Balance at 31 March 6,566
29 (h) Financial Instruments Available for Sale The Financial Instruments Available for Sale Reserve contains the gains made by the Authority arising from increase in the value of its investments that have quoted market prices or otherwise do not have fixed or determinable payments. The balance is reduced when investments with accumulated gains are: -
• Revalued downwards or impaired and the gains are lost. • Disposed of and the gains are realised.
31 March
2014 £’000
31 March 2015
£’000 0 Balance at 1 April
0
0 Upward Revaluation of Certificates of Deposits
75 0 Balance at 31 March 75

London Borough of Redbridge Statement of Accounts 2014/15
65
30. Amounts reported for resource allocation decisions The analysis of income and expenditure by service on the face of the Comprehensive Income and Expenditure Statement is that specified by the Service Reporting Code of Practice 2014/15. However, decisions about resource allocation are taken by the Authority’s Cabinet on the basis of budget reports analysed across clusters. These reports are prepared on a different basis from the accounting policies used in the financial statements. In particular:
• No charges are made in relation to capital expenditure (whereas depreciation, revaluation and impairment losses in excess of the balance on the Revaluation Reserve and amortisations are charged to services in the Comprehensive Income and Expenditure Statement)
• The cost of retirement benefits is based on cash flows (payment of employer’s pension contributions) rather
than current service cost of benefits accrued in the year.
• Expenditure on some support services is budgeted for centrally and not charged to clusters.
The income and expenditure of the Authority’s principal clusters recorded in the budget reports for the year is as follows:
Cluster Income and Expenditure 2014/15
Children’s
Services £’000
Adult Social Services &
Housing £’000
Environment& Community
Services £’000
Finance & Resources
£’000
CEO, Legal & Constitutional
Services £’000
Total £’000
Fees, charges & other service income
(21,175) (90,664) (49,469) (176,315) (4,613) (342,236)
Government grants (259,134) (11,827) (4,735) (665) (126) (276,487)
Total Income (280,309) (102,491) (54,204) (176,980) (4,739) (618,723)
Employee expenses 210,933 28,873 32,114 19,394 3,792 295,106
Other service expenses 117,698 137,742 60,788 168,677 2,342 487,247
Support service recharges 12,801 7,762 7,106 5,547 1,789 35,005
Total Expenditure 341,432 174,377 100,008 193,618 7,923 817,358
Net Expenditure 61,123 71,886 45,804 16,638 3,184 198,635
Cluster Income and Expenditure Figures 2013/14
Children’s
Services £’000
Adult Social Services &
Housing £’000
Environment& Community
Services £’000
Finance & Resources
£’000
CEO, Legal & Constitutional
Services £’000
Total £’000
Fees, charges & other service income
(21,640) (80,754) (52,990) (176,158) (4,496) (336,038)
Government grants (265,304) (14,355) (5,033) (657) (13) (285,362)
Total Income (286,944) (95,109) (58,023) (176,815) (4,509) (621,400)
Employee expenses 213,891 29,354 30,024 19,529 3,784 296,582
Other service expenses 120,639 131,449 63,800 167,174 2,398 485,460
Support service recharges 11,867 7,880 11,108 6,154 1,971 38,980
Total Expenditure 346,397 168,683 104,932 192,857 8,153 821,022
Net Expenditure 59,453 73,574 46,909 16,042 3,644 199,622

London Borough of Redbridge Statement of Accounts 2014/15
66
Reconciliation of Cluster Income and Expenditure to Cost of Services in the Comprehensive Income and Expenditure Statements
This reconciliation shows how the figures in the analysis of cluster income and expenditure relate to the amounts included in the Comprehensive Income and Expenditure Statement.
Restated 2013/14
£’000
2014/15 £’000
Net expenditure in the Cluster Analysis 199,622 198,635
Net expenditure of services and support services not included in the Analysis
813
460
Amounts in the Comprehensive Income and Expenditure Statement not reported to management in the Analysis
11,923
24,165
Cost of Services in Comprehensive Income and Expenditure Statement
212,358
223,260

London Borough of Redbridge Statement of Accounts 2014/15
67
Reconciliation to Subjective Analysis
This reconciliation shows how the figures in the analysis of cluster income and expenditure relate to a subjective analysis of the Surplus or Deficit on the provision of services included in the Comprehensive Income and Expenditure Statement.
2014/15
Clu
ster
An
alys
is
Serv
ices
and
Su
pp
ort
Serv
ices
not
in A
nal
ysis
A
mou
nts
not
rep
orte
d to
M
anag
emen
t for
dec
isio
n m
akin
g A
mou
nts
not
incl
ud
ed in
I&E
Allo
cati
on o
f Rec
har
ges
Cos
t of S
ervi
ces
Cor
por
ate
Am
ount
s
Total
£’000
£’000
£’000
£’000
£’000
£’000
£’000
£’000
Fees, charges & other service income (342,236) 0 (26,779) 6,648 35,005 (327,362) (1,968) (329,330)
Interest and investment income (1,672) (1,672)
Income from council tax (90,897) (90,897)
Government grants and contribution (276,487) (276,487) (161,714) (438,201)
Total Income (618,723) 0 (26,779) 6,648 35,005 (603,849) (256,251) (860,100)
Employee expenses 295,106 456 295,562 295,562
Other service expenses 487,247 460 38,557 (6,648) 519,616 351 519,967
Support services recharges 35,005 (35,005) 0 0
Depreciation, amortisation & impairment
11,931 11,931 (12) 11,919
Interest payments 0 21,056 21,056
Levies 0 13,990 13,990
Payments to Housing Capital Receipts Pool
0 537 537
Loss on Disposal of Assets 0 10,090 10,090
Total Expenditure 817,358 460 50,944 (6,648) (35,005) 827,109 46,012 873,121
Deficit / Surplus in the provision of services
198,635 460 24,165 0 0 223,260 (210,239) 13,021

London Borough of Redbridge Statement of Accounts 2014/15
68
2013/14 - Restated Comparative Figures
Clu
ster
An
alys
is
Serv
ices
and
Su
pp
ort
Serv
ices
not
in A
nal
ysis
A
mou
nts
not
rep
orte
d to
M
anag
emen
t for
dec
isio
n m
akin
g A
mou
nts
not
incl
ud
ed in
I&E
Allo
cati
on o
f Rec
har
ges
Cos
t of S
ervi
ces
Cor
por
ate
Am
ount
s
Total
£’000
£’000
£’000
£’000
£’000
£’000
£’000
£’000
Fees, charges & other service income (336,038) 0 (27,716) (811) 38,980 (325,585) (1,984) (327,569)
Interest and investment income (1,690) (1,690)
Income from council tax (85,816) (85,816)
Government grants and contribution (285,362) 0 0 0 0 (285,362) (177,339) (462,701)
Total Income (621,400) 0 (27,716) (811) 38,980 (610,947) (266,829) (877,776)
Employee expenses 296,582 (912) 295,670 295,670
Other service expenses 485,460 813 34,541 811 521,625 367 521,992
Support services recharges 38,980 (38,980) 0 0
Depreciation, amortisation & impairment
6,010 6,010 (81) 5,929
Interest payments 0 22,506 22,506
Levies 0 13,567 13,567
Payments to Housing Capital Receipts Pool
0 538 538
Loss on Disposal of Assets 0 68,620 68,620
Total Expenditure 821,022 813 39,639 811 (38,980) 823,305 105,517 928,822
Deficit / (Surplus) in the provision of services
199,622 813 11,923 0 0 212,358 (161,312) 51,046

London Borough of Redbridge Statement of Accounts 2014/15
69
31. Termination Benefits The Authority terminated the contracts of a number of employees in 2014/15, incurring liabilities of £0.8 million (£0.7 million in 2013/14). In general these redundancies result from the Authority's efforts to reduce cost of services in response to a reduction in grant income from the government. There were a total of 48 redundancies in 2014/15 (68 in 2013/14).
The numbers of exit packages with total cost per band and total cost of the compulsory and other redundancies are set out in the table below and these include school redundancies:
Exit Package cost band
(including special payments)
Number of compulsory
redundancies
Number of other
departures agreed
Total number of exit
packages by cost band
Total cost of exit packages
in each band 2013/14 2014/15 2013/14 2014/15 2013/14 2014/15 2013/14 2014/15 £0 - £20,000 55 18 0 15 55 33 £345,545 £269,355 £20,001 - £40,000 12 4 0 8 12 12 £324,929 £302,943 £40,001 - £60,000 0 0 0 1 0 1 0 £44,257 £60,001 - £80,000 1 1 0 1 1 2 £66,496 £143,304 £80,001 - £100,000 0 0 0 0 0 0 0 0 £100,001 - £150,000 0 0 0 0 0 0 0 0
Total 68 23 0 25 68 48 £736,970 £759,859
32. Officers’ Remuneration The following table sets out the remuneration paid to the Authority’s senior employees:
Note
Salary
including Fees and
Allowances £
Other Emoluments
£
Total Remuneration
excluding pension
contributions £
Pension Contribution
£
Total Remuneration
including pension
contributions £
Roger Hampson Chief Executive
2014/15 2013/14
1 108,956 158,849
108,956 158,849
0 31,452
108,956 190,301
Director of Finance and Resources
2014/15 2013/14
2 106,586 135,213
0 4,071
106,586 139,284
0 0
106,586 139,284
Director of Children’s Services
2014/15 2013/14
133,209 133,209
133,209 133,209
32,103 30,771
165,312 163,980
Borough Solicitor and Secretary
2014/15 2013/14
111,627 109,683
111,627 109,683
26,902 25,337
138,529 135,020
Director of Environment & Community Services
2014/15 2013/14
131,205 129,204
3,291 3,163
134,496 132,367
31,620 31,270
166,116 163,637
Director of Adult Social Services and Housing
2014/15 2013/14
131,205 129,204
4,027 3,163
135,232 132,367
31,620 30,577
166,852 162,944
Director of Public Health
2014/15 2013/14
3
113,338 113,307
0 0
113,338 113,307
21,582 15,863
134,920 129,170
Note 1 – The Council agreed that the Chief Executive would take flexible retirement from the 1 January 2014, with a reduction in hours and remuneration. His annualised salary would have been £181,542. In his role as returning officer the Chief Executive also received the sum of £18,184 for the Local Elections in May 2014. Note 2 – The Director of Finance and Resources retired in January 2015. His annualised salalry would have been£137,214. The post is currently being covered by an Interim Director, the cost of this arrangement was £67,978 in 2014/15. Note 3 – Section 57 of the Health and Social Care Act 2012 defines the Director of Public Health as a statutory chief officer by amendment to Section 2(6) of the Local Government and Housing Act 1989. Until 30 September 2014, the Director was shared with London Borough of Waltham Forest who paid the salary and charged LB Redbridge for 50% of the cost (£64,585). From 1 October 2014, this arrangement ceased and the Director became an employee of Redbridge. At this stage, the Director joined the LGPS.

London Borough of Redbridge Statement of Accounts 2014/15
70
The number of employees including Senior Officers whose remuneration, excluding employer’s pension contributions, was £50,000 or more in bands of £5,000 was:
2013/14 Earning Band 2014/15 Officers Teachers Total Officers Teachers Total
40 81 121 £50,000 - £54,999 64 102 166 36 53 89 £55,000 - £59,999 36 50 86 21 35 56 £60,000 - £64,999 20 37 57
5 24 29 £65,000 - £69,999 6 20 26 4 10 14 £70,000 - £74,999 4 15 19 2 14 16 £75,000 - £79,999 4 15 19 3 10 13 £80,000 - £84,999 0 9 9 6 11 17 £85,000 - £89,999 8 10 18 3 7 10 £90,000 - £94,999 6 8 14 3 1 4 £95,000 - £99,999 1 4 5 0 3 3 £100,000 - £104,999 2 1 3 2 3 5 £105,000 - £109,999 1 0 1 0 5 5 £110,000 - £114,999 1 4 5 0 0 0 £115,000 - £119,999 0 2 2 0 2 2 £120,000 - £124,999 0 0 0 0 1 1 £125,000 - £129,999 0 0 0 3 0 3 £130,000 - £134,999 2 0 2 1 0 1 £135,000 - £139,999 1 0 1 0 0 0 £140,000 - £144,999 0 0 0 0 0 0 £145,000 - £149,999 0 0 0 0 0 0 £150,000 - £154,999 0 0 0 1 0 1 £155,000 - £159,999 0 0 0 0 1 1 £160,000 - £164,999 0 1 1
130 261 391 Total 156 278 434
Remuneration includes gross salary, bonuses, expenses allowances, compensation for loss of employment, and any other emoluments. There has been a net increase of 45 in total in the number of employees in the £50k - £55k band. This is as a result of coalition government’s agreement to a one percent pay rise for public sector employees in 2014/15, which brought more employees into this band.
33. Members’ Allowances
The Authority paid the following amounts to Members of the Authority during the year.
2013/14 £’000
2014/15 £’000
Allowances 1,010 961 Total 1,010 961

London Borough of Redbridge Statement of Accounts 2014/15
71
34. Related Parties This disclosure note has been prepared using the Council’s Register of Members’ Declarations of Interest in addition to a specific declaration obtained in respect of related party transactions from Members and Chief Officers. The Authority is required to disclose material transactions with related parties – bodies and individuals that have the potential to contract or influence the Authority or to be controlled or influenced by the Authority. Disclosure of those transactions allows readers to assess the extent to which the Authority may have been constrained in its ability to operate independently or might have secured the ability to limit another party’s ability to bargain freely with the Authority. In this context, related parties include:
• Central Government • Elected Members of the Authority • Directors and Chief Officers of the Authority • Other Public Bodies • Entities controlled or significantly influenced by the Authority
• Central Government
Central Government has significant influence over the general operations of the Authority – it is responsible for providing the statutory framework, within which the Authority operates, provides the majority of its funding in the form of grants and prescribes the terms of many of the transactions that the Authority has with other parties (e.g. council tax bills, housing benefits). Grants received from Government departments are set out in the subjective analysis in Note 30 on reporting for Resources Allocation Decisions.
• Elected Members of the Authority Members of the Authority have direct control over the Authority’s financial and operating policies. The total of Members’ allowances paid in 2014/15 is shown in Note 33. During 2014/15 services to the value of £95k were commissioned from a company in which a Member had an interest. The contract was entered into in full compliance with the Authority’s standing orders. The Members’ Register of Interests is available on the Authority’s web site, Redbridge-i (www.redbridge.gov.uk)
• Directors and Chief Officers of the Authority Senior Officers have not disclosed any material transactions with related parties.
• Other Public Bodies
East London Waste Authority Nature of Business and Relationship with the Authority The East London Waste Authority (ELWA) is a statutory body responsible for the disposal of waste in the London Boroughs of Barking and Dagenham, Havering, Newham and Redbridge. Financial Performance The levy payments paid by the Authority to ELWA amounted to £13,252,000 (£12,819,000 in 2013/14). Related Party Officers/Members Two members of the Authority are Board Members of ELWA: Councillor S. Bain and Councillor B. Nijjar. The London Borough of Redbridge Section 151 Officer is the Section 151 Officer for ELWA. The London Borough of Redbridge Interim Director of Finance and Resources is the Interim Finance Director for ELWA.
• Entities Controlled or Significantly Influenced by the Authority The Authority has the following interest in organisations. Vision Redbridge Culture and Leisure Nature of Business and Relationship with the Authority Vision Redbridge Culture & Leisure (VRCL) is a Leisure Trust which was incorporated as a company limited by guarantee under the Companies Act on 19 December 2007, and registered as a charity on 11 February 2008. Originally set up to manage the Authority’s leisure centres, in 2011/12 VRCL’s remit was widened to incorporate responsibility for the management of the services previously managed in-house by the Culture, Sport & Community Leisure service area. Under both IFRS and the CIPFA Code of Practice on Local Authority accounting in the United Kingdom 2014/15, VRCL is deemed to be a subsidiary of the London Borough of Redbridge as the Authority has the power to govern VRCL’s financial and operating policies.

London Borough of Redbridge Statement of Accounts 2014/15
72
Financial Performance The Authority made payments of £9.94 million in 2014/15 (£10.96 million in 2013/14) to VRCL for the management of these services. Related Party Officers/Members Three members of the Authority are Board Members at VRCL: Councillor D. Kaur-Thiara, Councillor M. Santos and Councillor R. Turbefield. Redbridge Theatre Company Limited Nature of Business and Relationship with the Authority The principal activity of this Company is the operation of a theatre for the London Borough of Redbridge. The Company is registered charity and carries on business as a Theatrical Charitable Trust. The Company is limited by guarantee and has no share capital. Financial Performance The Authority grants aid to the Company and during 2014/15 this amounted to £157,529 (£153,328 in 2013/14). The net assets of the Company for the year ending July 2014 totalled £204,698 (£195,410 year ending July 2013). The Company made a net surplus in 2013/14 of £10,128 (net loss of £26,038 for the year ending July 2013). At the time of the production of this year’s Accounts, the 2014/15 Accounts for the Redbridge Theatre Company Limited have not been produced as its year end is 31 July 2015. These will be available at a later date. The last audited set of Accounts was given an unqualified audit opinion. Copies are available at the offices of the Director of Finance and Resources (London Borough of Redbridge, Lynton House, 255-259 High Road, Ilford, Essex, IG1 1NN). Related Party Officers/Members Eight members of the Authority are Board Members of Redbridge Theatre Company Limited: Councillor M. Ahmed, Councillor R. Cole, Councillor F. Hussain, Councillor R. Littlewood, Councillor B. Nijjar, Councillor S. Nolan, Councillor J. Ryan and Councillor B. White. The London Borough of Redbridge’s Section 151 Officer is also the acting Honorary Treasurer for the Theatre and the Borough Solicitor and Secretary is the Honorary Secretary for the Theatre. Other During the financial year, the Authority charged the Pension Fund £449,732 for expenses incurred administering the Pension Fund (£420,309 in 2013/14) and £117,100 for expenses incurred for investment services (£115,900 in 2013/14).
35. External Audit Costs
The Authority has incurred the following costs in relation to the audit of the Statement of Accounts, certification of grant claims and statutory inspections and non-audit services provided by the Authority’s external auditors:
2013/14 £’000
Restated
2014/15 £’000
Fees payable with regard to external audit services carried out by the appointed auditor.
185
186 Fees payable to external auditors for the certificate of grant claims and returns for the year.
21 21
Fees payable in respect of other services provided by external auditors during the year.
9 0
Total 215 207
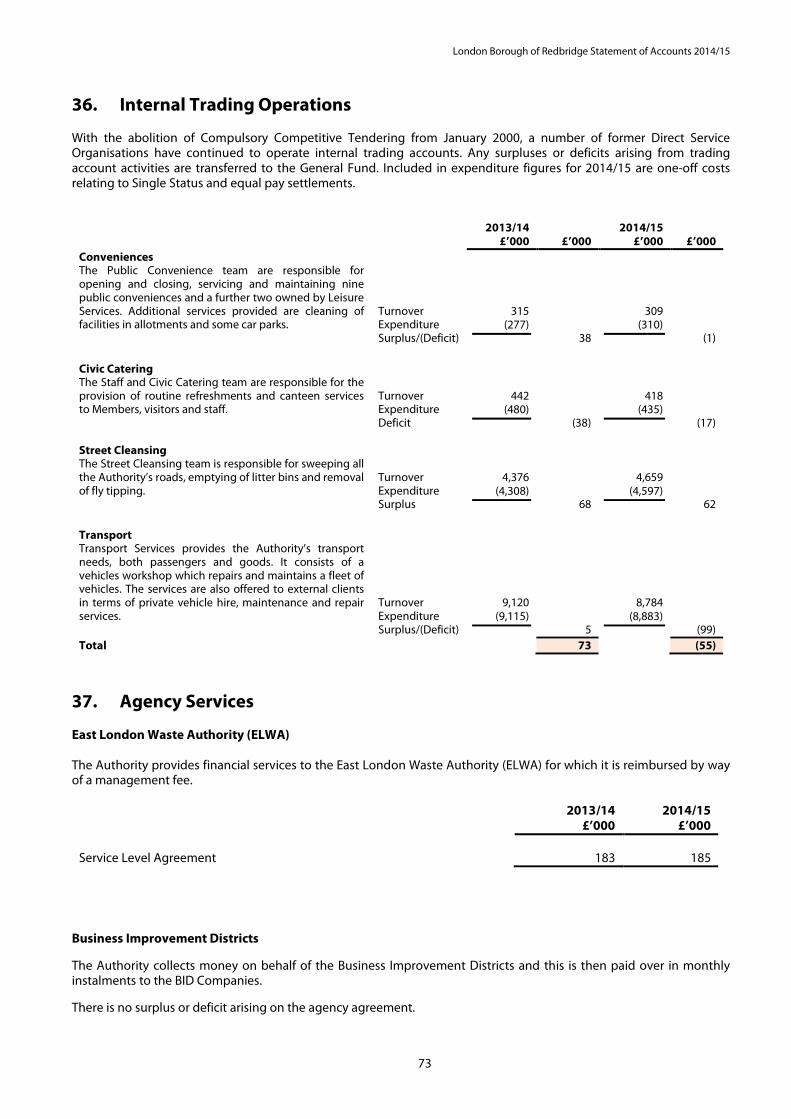
London Borough of Redbridge Statement of Accounts 2014/15
73
36. Internal Trading Operations With the abolition of Compulsory Competitive Tendering from January 2000, a number of former Direct Service Organisations have continued to operate internal trading accounts. Any surpluses or deficits arising from trading account activities are transferred to the General Fund. Included in expenditure figures for 2014/15 are one-off costs relating to Single Status and equal pay settlements.
2013/14 £’000
£’000
2014/15 £’000
£’000
Conveniences The Public Convenience team are responsible for opening and closing, servicing and maintaining nine public conveniences and a further two owned by Leisure Services. Additional services provided are cleaning of facilities in allotments and some car parks.
Turnover Expenditure Surplus/(Deficit)
315 (277)
38
309 (310)
(1) Civic Catering The Staff and Civic Catering team are responsible for the provision of routine refreshments and canteen services to Members, visitors and staff.
Turnover Expenditure Deficit
442
(480)
(38)
418
(435)
(17) Street Cleansing The Street Cleansing team is responsible for sweeping all the Authority’s roads, emptying of litter bins and removal of fly tipping.
Turnover Expenditure Surplus
4,376
(4,308)
68
4,659
(4,597)
62 Transport Transport Services provides the Authority’s transport needs, both passengers and goods. It consists of a vehicles workshop which repairs and maintains a fleet of vehicles. The services are also offered to external clients in terms of private vehicle hire, maintenance and repair services.
Turnover Expenditure Surplus/(Deficit)
9,120 (9,115)
5
8,784 (8,883)
(99) Total 73 (55)
37. Agency Services East London Waste Authority (ELWA) The Authority provides financial services to the East London Waste Authority (ELWA) for which it is reimbursed by way of a management fee.
2013/14 £’000
2014/15 £’000
Service Level Agreement
183
185
Business Improvement Districts The Authority collects money on behalf of the Business Improvement Districts and this is then paid over in monthly instalments to the BID Companies. There is no surplus or deficit arising on the agency agreement.
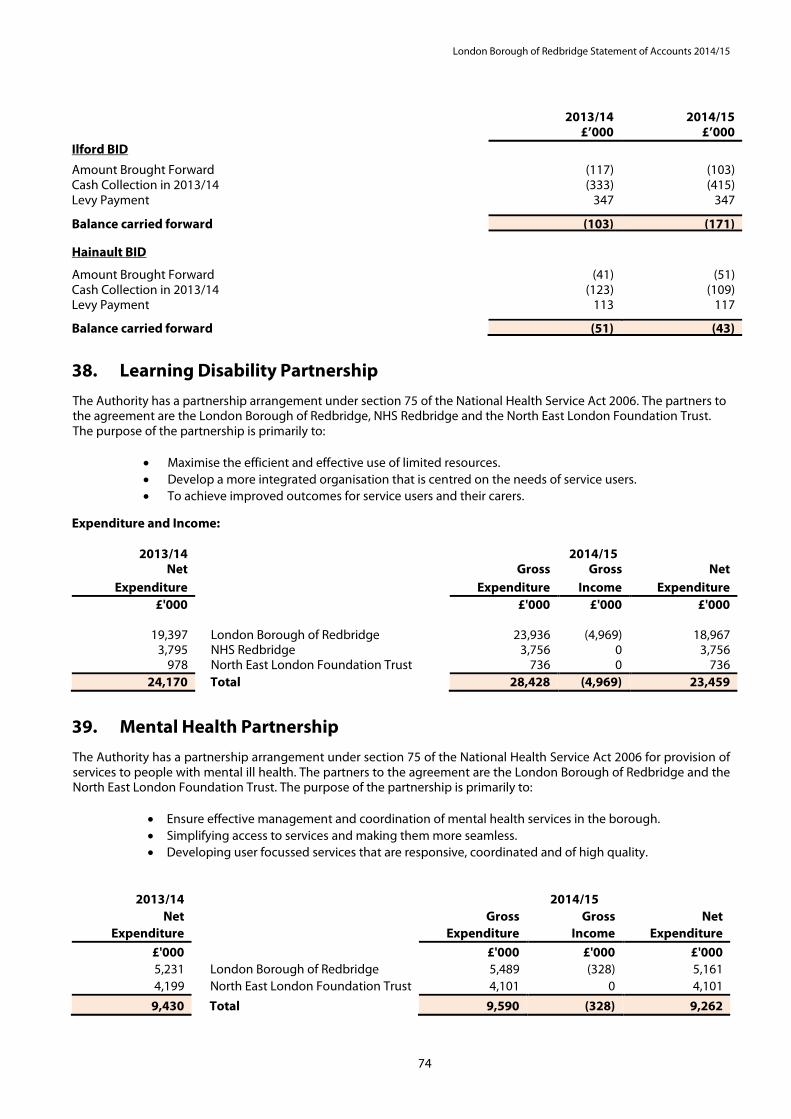
London Borough of Redbridge Statement of Accounts 2014/15
74
2013/14
£’000
2014/15
£’000 Ilford BID
Amount Brought Forward (117) (103) Cash Collection in 2013/14 (333)
(415)
Levy Payment 347 347 Balance carried forward (103) (171) Hainault BID
Amount Brought Forward (41) (51) Cash Collection in 2013/14 (123) (109) Levy Payment 113 117 Balance carried forward (51) (43)
38. Learning Disability Partnership
The Authority has a partnership arrangement under section 75 of the National Health Service Act 2006. The partners to the agreement are the London Borough of Redbridge, NHS Redbridge and the North East London Foundation Trust. The purpose of the partnership is primarily to:
• Maximise the efficient and effective use of limited resources. • Develop a more integrated organisation that is centred on the needs of service users. • To achieve improved outcomes for service users and their carers.
Expenditure and Income:
2013/14 2014/15 Net Gross Gross Net
Expenditure Expenditure Income Expenditure £'000 £'000 £'000 £'000
19,397 London Borough of Redbridge 23,936 (4,969) 18,967
3,795 NHS Redbridge 3,756 0 3,756 978 North East London Foundation Trust 736 0 736
24,170 Total 28,428 (4,969) 23,459
39. Mental Health Partnership
The Authority has a partnership arrangement under section 75 of the National Health Service Act 2006 for provision of services to people with mental ill health. The partners to the agreement are the London Borough of Redbridge and the North East London Foundation Trust. The purpose of the partnership is primarily to:
• Ensure effective management and coordination of mental health services in the borough. • Simplifying access to services and making them more seamless. • Developing user focussed services that are responsive, coordinated and of high quality.
2013/14 2014/15 Net Gross Gross Net
Expenditure Expenditure Income Expenditure
£'000 £'000 £'000 £'000 5,231 London Borough of Redbridge 5,489 (328) 5,161 4,199 North East London Foundation Trust 4,101 0 4,101
9,430 Total 9,590 (328) 9,262

London Borough of Redbridge Statement of Accounts 2014/15
75
40. Other Funds The Authority administers the affairs of some elderly residents and children in care, sometimes by named officers, and also holds various other deposits. The total value of these funds as at 31 March 2015 was £2 million (£1.8 million as at 31 March 2014).
41. Pension Scheme Accounted for as a Defined Contribution Scheme
Teachers employed by the Authority are members of the Teachers’ Pension Scheme, administered by the Department for Education. The Scheme provides teachers with specified benefits upon their retirement, and the Authority contributes towards the costs by making contributions based on a percentage of members’ pensionable salaries. The Scheme is technically a defined benefit scheme. However, the scheme is unfunded and the Department for Education uses a notional fund as the basis for calculating the employers’ contribution rate paid by Local Authorities. The Authority is not able to identify its share of the underlying financial position and performance of the Scheme with sufficient reliability for accounting purposes. For the purposes of this Statement of Accounts, it is therefore accounted for as a defined contribution scheme. In 2014/15, the Authority paid £12.7 million to the Teachers’ Pension Scheme in respect of teachers’ retirement benefits, representing 14.1% of pensionable pay. The figures for 2013/14 were £13.8 million and 14.1%. There were no contributions remaining payable at year end. The Authority is responsible for the costs of any additional benefits awarded upon early retirement outside of the terms of the teachers’ scheme. These costs are accounted for on a defined benefit basis and detailed in Note 42. NHS Staff Pension Scheme In 2013/14, former NHS employees transferred to the Authority. These employees have maintained their membership in the NHS Pension Scheme. The Scheme provides these staff with specified benefits upon their retirement and the Authority contributes towards the costs by making contributions based on a percentage of members' pensionable salaries. The scheme is an unfunded defined benefit scheme. As with the Teacher’s Pension Scheme, the Authority is not able to identify its share of the underlying financial position and performance of the Scheme with sufficient reliability for accounting purposes. For the purpose of this Statement of Accounts, it is therefore accounted for as a defined contribution scheme. In 2014/15, the Authority paid £0.2 million to the NHS Pension Scheme in respect of former NHS staff retirement benefits, representing 14% of pensionable pay. There were no contributions remaining payable at the year end.
42. Defined Benefit Pension Scheme As part of the terms and conditions of employment of its officers, the Authority makes contributions towards the cost of post-employment benefits. Although these benefits will not actually be payable until employees retire, the Authority has a commitment to make the payments that needs to be disclosed at the time that employees earn their future entitlement.
The Authority participates in two post employment arrangements:
• The Local Government Pension Scheme, administered locally by the London Borough of Redbridge – this is a funded defined benefit final salary scheme, meaning that the Authority and employees pay contributions into a fund, calculated at a level intended to balance the pensions liabilities with investment assets.
• Arrangements for the award of discretionary post-retirement benefits upon early retirement – this is an unfunded defined benefit arrangement, under which liabilities are recognised when awards are made. However, there are no investment assets built up to meet these pension liabilities, and cash has to be generated to meet actual pension payments as they eventually fall due. There have been no new awards since 2008 for officers and since 2009 for teachers.

London Borough of Redbridge Statement of Accounts 2014/15
76
Transaction Relating to Post-Employment Benefits
The Authority recognises the cost of retirement benefits in the reported cost of services when they are earned by employees, rather than when the benefits are eventually paid as pensions. However, the charge that is required to be made against Council Tax is based on the cash payable in the year, so the real cost of post-employment/retirement benefit is reversed out of the General Fund via the Movement in Reserves Statement. The following transactions have been made in the Comprehensive Income and Expenditure Statement and the General Fund Balance via the Movement in Reserves Statement during the year:
Local Government Pension Scheme
2013/14
£’000
2014/15
£’000 Comprehensive Income and Expenditure Statement
Cost of Services:
Current Service Cost 20,971 23,472
Past Service Costs 244 561
Settlements and curtailments (3,569) 0
Total Post-Employment Benefits charged to the Deficit on the provision of Services
17,646 24,033
Interest Income on scheme assets (22,919) (20,884)
Interest cost on defined benefit obligation 37,395 33,749
Total defined benefit cost recognised in profit or (loss) 32,122 36,898
Re-measurement of the net defined benefit liability
Change in demographic assumptions 546 0
Change in financial assumptions 481 81,800
Other experience (38,126) (2,928)
Return on assets excluding amounts included in net interest 19,181 (49,014)
Total Post Employment Benefit charged to the Comprehensive Income and Expenditure Statement
(17,918)
29,858
Movement in Reserve Statement:
Reversal of net charges made to the Surplus on the provision of Services for post-employment benefits in accordance with the code
(8,690) (12,124)
Actual amount charged against the General Fund Balance for pensions in the year:
Employer’s contributions payable to scheme 21,366 22,636
Employer’s discretionary contributions payable 2,066 2,138
Retirement benefits payable to pensioners 26,645 30,110
Discretionary benefits payable to pensioners 2,066 2,138

London Borough of Redbridge Statement of Accounts 2014/15
77
Assets and Liabilities in Relation to Post-Employment Benefits Reconciliation of present value of the scheme liabilities (defined benefit obligation): Scheme Liabilities
Local Government Pension Scheme
2013/14 £’000
2014/15 £’000
Opening Balance at 1 April
834,219 824,681 Current Service Cost
20,971 23,472 Interest Cost
37,395 33,749 Contributions by scheme participants 5,925 6,285 Actuarial (gains)/losses
(37,636) 78,936 Benefits paid
(26,645) (30,110) Discretionary Benefits (2,066) (2,138) Past Services Cost 244 561 Business Contribution
0 0 Curtailments
0 0 Settlements
(7,726) 0 Closing Balance at 31 March 824,681 935,436 Scheme Assets Reconciliation of fair value of the scheme:
2013/14 £’000
2014/15 £’000
Opening Balance at 1 April 510,595 510,285 Interest Income 22,919 20,884
Re-measurement gain/(loss) (19,717) 49,078
Employer contributions 21,366 22,636
Contributions by scheme participants 5,925 6,285
Benefits paid (26,645) (30,110)
Business Combination 0 0
Settlements (4,158) 0
Closing Balance at 31 March 510,285 579,058
The expected return on scheme assets is determined by considering the expected returns available on the assets underlying the current investment policy. Expected yields on fixed interest investments are based on gross redemption yields as at the Balance Sheet date.
Expected returns on equity investments reflect long-term real rates of return experienced in the respective markets.

London Borough of Redbridge Statement of Accounts 2014/15
78
Pensions Assets and Liabilities recognised in the Balance Sheet
2013/14 £’000
2014/15 £’000
Present value of liabilities:
Local Government Pension Scheme
(824,681) (935,436)
Fair value of assets in the Local Government Pension Scheme
510,285 579,058
Total Deficit in the Scheme (314,396) (356,378)
The liabilities show the underlying commitments that the Authority has in the long run to pay post-employment (retirement) benefits. The total liability of £356.4 million has a substantial impact on the net worth of the Authority as recorded in the Balance Sheet, resulting in a reduction in the Authority’s net worth of 45.1% as at the 31 March 2015 (43.9% as at 31 March 2014). However, statutory arrangements for funding the deficit mean that the financial position of the Authority remains healthy:
• The deficit on the local government scheme will be made good by increased contributions from employees and employers plus investment returns over 20 years.
• There is only a requirement for the Authority to fund discretionary benefits that are awarded when the pensions are actually paid.
Basis for Estimating Assets and Liabilities
Liabilities have been assessed on an actuarial basis using the projected unit credit method, an estimate of the pensions that will be payable in future years dependent on assumptions about mortality rates, salary levels, etc. Both the Local Government Pension Scheme and Discretionary Benefits Liabilities have been assessed by Hymans Robertson LLP, an independent firm of actuaries, estimates for the London Borough of Redbridge Pension Fund being based on the latest full valuation of the scheme as at 1 April 2013.
The principal assumptions used by the actuary have been as follows:
Local Government Pension Scheme
2013/14
2014/15
Mortality assumptions Longevity at 65 for current pensioners: Men 22.0 years 22.0 years Women 24.1 years 24.1 years Longevity at 65 for future pensioners: Men 24.3 years 24.3 years Women 26.7 years 26.7 years Rate of inflation 2.6% 2.1% Rate of increase in salaries 3.4% 3.0% Rate of increase in pensions 2.6% 2.1% Rate for discounting scheme liabilities 4.1% 3.1% Take up of option to convert some annual pension into retirement lump sum
50%
50%

London Borough of Redbridge Statement of Accounts 2014/15
79
The Discretionary Benefits arrangements have no assets to cover their liabilities. The Local Government Pension Scheme’s asset consists of the following categories, by proportion of the total assets held:
31 March 2014
£’000 31 March 2015
£’000 Equity Securities Consumer 15,199 20,643 Energy and Utilities
12,288 10,463 Financial Institutions 10,444 11,712 Health and Care 17,158 16,555 Information Technology 4,616 20,935 Other 33,187 18,236 Sub-total Equities 92,892 98,544 Bonds Corporate 64,418 73,748 Government 52,585 78,414 Other 29,506 26,636 Sub-total Bonds 146,509 178,798 Property UK Property
44,195 55,498 Investment Funds and Unit Trusts Equities 210,037 225,619 Commodities 3,406 6,180 Other 1,805 2,070 Sub-total 215,248 233,869 Derivatives Other Derivatives (441) (26,448) Cash and Cash Equivalents Cash 11,882 38,797 Total Assets
510,285 579,058
Impact on the Authority’s Cash Flows The objectives of the scheme are to keep employers’ contributions at as constant a rate as possible. The Authority has agreed a strategy with the scheme’s actuary to achieve a funding level of 100% over the next 20 years. Funding levels are reviewed on an annual basis. The next triennial valuation is due to be completed on 31 March 2016. The scheme will need to take account of the national changes to the scheme under the Public Pensions Services Act 2013. Under the Act, the Local Government Pension Scheme in England and Wales and the other main existing public service schemes may not provide benefits in relation to service after 31 March 2015. The Act provides for scheme regulations to be made within a common framework, to establish new career average revalued earnings schemes to pay pensions and other benefits to certain public servants.
The Authority is projected to pay £23.7 million employer contributions to the scheme in 2015/16.
43. Contingent Liabilities The Council's former grounds maintenance contractor, Ground Control Limited, has issued but not yet served Court proceedings against the Council. The value of the claim is unknown but indications are that it will be in the region of £1.5 million. The result of such proceedings is not expected to be known at the date of the accounts being signed. The Council intends to defend the claim and to counterclaim for losses of approximately £3.7 million. The Council considers that Ground Control Limited's claim is without foundation and does not anticipate any significant net cost to be incurred by the Council as a result of the Claim.

London Borough of Redbridge Statement of Accounts 2014/15
80
Supplementary Statements
Housing Revenue Account Income and Expenditure Statement
The Housing Revenue Account (HRA) Income and Expenditure Statement shows the economic cost in the year of providing housing services in accordance with generally accepted accounting practices, rather than the amount to be funded from rents and government grants.
Authorities charge rents to cover expenditure in accordance with regulations; this may be different from the accounting cost. The increase or decrease in the year, on the basis of which rents are raised, is shown in the Movement in the HRA Statement.
2013/14 Housing Revenue Account Income and
Expenditure Account Notes
2014/15
£’000 £’000 Expenditure
5,510 Repairs and Maintenance 5,991 7,439 Supervision and Management 7,580
665 Rents, Rates, Taxes and Other Charges 699 125 Movement in the allowance for bad debts 6
11,401 Depreciation and impairment of fixed assets 5 13,350
25,140 Total Expenditure 27,626 Income
(23,915) Dwelling Rents (24,115) (354) Non-Dwelling Rents (348)
(4,070) Charges for Services and Facilities (4,434) (131) Contributions towards expenditure (171)
(25) Repayment of capital grants/advances 0
(28,495) Total Income (29,068)
(3,355) Net Cost of HRA Services as included in the Comprehensive Income and Expenditure Statement
(1,442)
(3,355) Net Expenditure / (Income) on HRA Services
(1,442)
HRA Share of the operating Income and Expenditure included in the Comprehensive Income and Expenditure Statement:
(629) Gain on sale of HRA non-current assets (2,286) 2,357 Interest payable and similar charges 2,367 (127) Interest and investment income (212)
290 Pensions interest cost and expected return on pension assets 303 (7,628) Capital grants and contributions receivable
(823)
(9,092) Deficit or (Surplus) for the year on HRA services (2,093)

London Borough of Redbridge Statement of Accounts 2014/15
81
Movement on the Housing Revenue Account Statement
2013/14
£’000
2014/15
£’000
(3,850)
(9,092)
6,338
Balance on the HRA at the end of the previous year Deficit or (Surplus) for the year on the HRA Income and Expenditure Statement Adjustment between accounting basis and funding basis under statute
(2,093) (804)
(4,916)
(2,754) Net decrease before transfers to or from reserves (2,897)
1,688 Transfers to reserves
1,887
(1,066) Increase in year on the HRA
(1,010)
(4,916) Balance on the HRA at the end of the current year (5,926)
Note to the Movement on the HRA Statement
2013/14
Notes 2014/15
£’000 £’000
Adjustments between accounting basis and funding basis under regulations
629 Gain on sale of HRA non-current assets 2,286
25 Repayment of capital grants/advances 0
(269) HRA share of contributions to or from the Pension Reserve (275)
(6,042) Impairment of Fixed Assets 5 6 (7,911)
(174) Capital Receipts cost of sales (160)
7,628 Capital Grants and contributions receivable 823
3,847 Capital expenditure funded by the HRA 3,689
694 Transfer from reserves 744
6,338 (804)
Transfers (from) / to reserves
1,688 Movement to earmarked reserves 7 (1,887)
1,688 (1,887)

London Borough of Redbridge Statement of Accounts 2014/15
82
Notes to the Housing Revenue Account
1. Rent Income
Gross rent income is the total rent income due after allowance is made for void properties. During the year an average of 0.48% of properties were vacant (0.52% in 2013/14). The average rent for all stock was £102.67 per week in 2014/15 and £98.58 in 2013/14.
2. Housing Stock
The Authority is responsible for managing a Housing Revenue Account stock of 4,511 properties at 31 March 2015 (4,558 at 31 March 2014). An analysis is shown below. The Authority is also a freeholder of 2,407 leased properties.
2013/14 2014/15 Number Number
1,616 1,349 1,358
General Needs - One or less Bedrooms - Two Bedrooms - Three or More Bedrooms
1,606 1,329 1,341
235 Sheltered Housing Units 235 4,558 Total 4,511
3. Rent Arrears
The provision for doubtful debts against arrears was £0.745 million at 31 March 2015 (£1.232 million at 31 March 2014).
2013/14 2014/15
£’000 £’000
388 952
Arrears due from - Current tenants - Former tenants
312 546
1,340 Total 858
5.41% Total as a % of gross debt 3.55%
4. Balance Sheet Value of HRA Assets
2013/14 2014/15
£’000 £’000
225,461 Dwellings 230,822
4,097 Other Land and Buildings 4,990
229,558 Total 235,812
The vacant possession value of dwellings within the HRA as at 1 April 2014 was £921 million (£877.2 million as at 1 April 2013). The difference of £690.2 million between the vacant possession value and the Balance Sheet value of dwellings within the HRA represents the economic cost of providing council housing at less than open market value.

London Borough of Redbridge Statement of Accounts 2014/15
83
5. Depreciation and Impairment charges
Depreciation charges shown below reflect the economic consumption of HRA assets in 2014/15.
2013/14 2014/15 £’000 £’000 5,295 Operational Assets - dwellings 5,369
64 Operational Assets – other land and buildings 70 6,042 Impairment of fixed assets - dwellings 7,911
11,401 Total 13,350
The charge for impairment in 2014/15 reflected the reduction in market value of HRA dwellings. 6. Major Repairs Reserve MRA funds held in the Major Repairs reserve can be used for capital expenditure on HRA assets only.
2013/14 2014/15 £’000 £’000
(1,515) Balance Brought Forward (4,816) (5,295) Major Repairs Allowance (MRA) (5,370)
(64) Non-dwellings depreciation (70)
2,058 Capital Expenditure funded from the MRR 3,864
(4,816) Balance on the Major Repairs Reserves as at 31 March (6,392) 7. Movement in Earmarked Reserves
The following movements in earmarked reserves occurred in 2014/15:
2013/14 2014/15 £’000 £’000
115 Quality of Life Reserve – Revenue/Capital 38 435 Week 53 Reserve (65)
44 HRA IT Reserve 0 216 Non-Dwellings Depreciation and Impairment 290
0 Former Tenant Arrears 108 878 Earmarked Capital Reserves 1,516
1,688 Total 1,887
8. HRA Capital Financing
2013/14 2014/15 £’000 £’000
14,475 HRA Capital Expenditure - Dwellings 9,949
7,659 3,847 2,058
145 766
0
Financed by: Government Grants Contribution from Revenue Net Contribution from Major Repairs Reserve Capital Allowance Contribution from Other Reserves Capital Receipts – Right to Buy
823
3,689 3,864
0 744 829
14,475 Total Funding 9,949
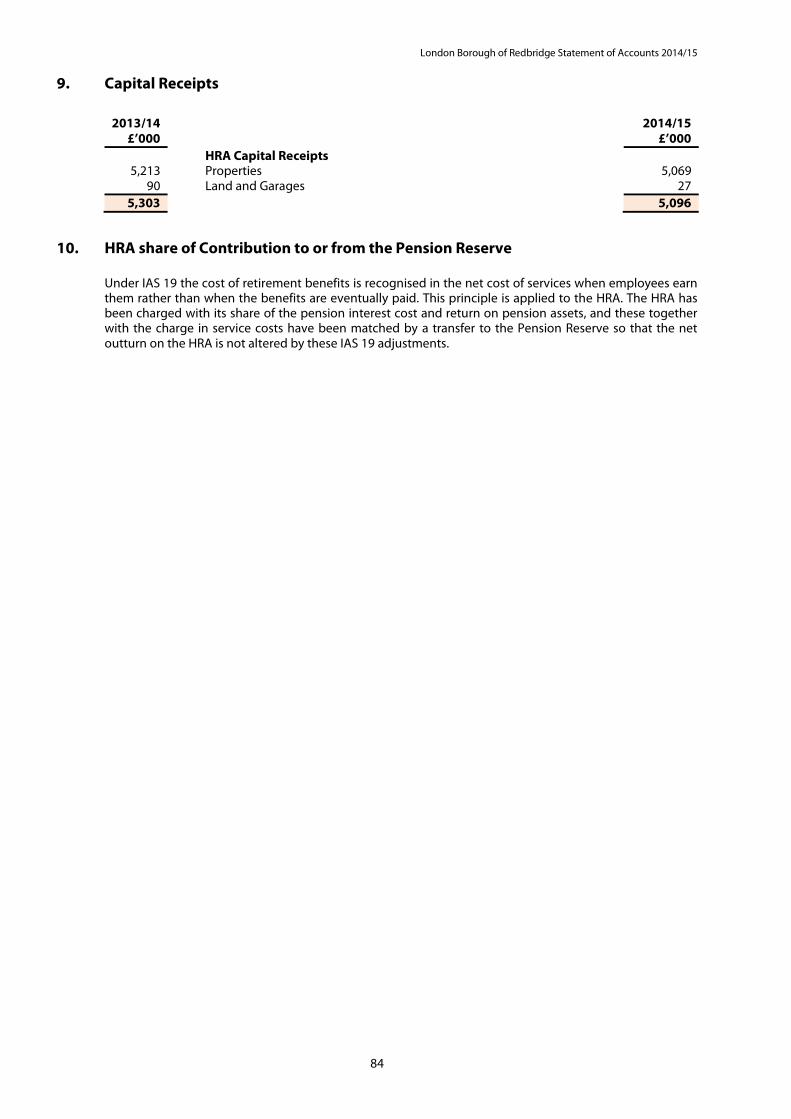
London Borough of Redbridge Statement of Accounts 2014/15
84
9. Capital Receipts
2013/14 2014/15 £’000 £’000
HRA Capital Receipts 5,213 Properties 5,069
90 Land and Garages 27 5,303 5,096
10. HRA share of Contribution to or from the Pension Reserve
Under IAS 19 the cost of retirement benefits is recognised in the net cost of services when employees earn them rather than when the benefits are eventually paid. This principle is applied to the HRA. The HRA has been charged with its share of the pension interest cost and return on pension assets, and these together with the charge in service costs have been matched by a transfer to the Pension Reserve so that the net outturn on the HRA is not altered by these IAS 19 adjustments.

London Borough of Redbridge Statement of Accounts 2014/15
85
Collection Fund
The Collection Fund is a statement that reflects the statutory obligation for billing authorities to maintain a separate Collection Fund. The statement shows the transactions of the billing authority in relation to the collection fund from taxpayers and distributions to local authorities and the Government of council tax, non-domestic rates (NDR) and the business rate supplement (BRS). The element of the Collection Fund that relates to the Authority has been consolidated with the Authority’s main accounts. The Accounts have been prepared on an accruals basis.
Income and Expenditure Account
2013/14
2014/15
2014/15
2014/15
2014/15
£’000 £’000 £’000 £’000 £’000 Council Tax NDR BRS Total
Income 113,254 Council Tax Payers 115,711 0 0 115,711
54,941 Income from Business Ratepayers 0 52,390 1,006 53,396 371 Transitional Protection–Central Government 0 131 0 131
Contribution to previous years collection fund deficit:
0 Central Government 0 439 0 439 0 London Borough of Redbridge 0 263 0 263 0 GLA 0 175 0 175
168,566 Total Income 115,711 53,398 1,006 170,115 Expenditure Precepts:
85,037 London Borough of Redbridge 86,280 0 0 86,280 23,519 Greater London Authority 23,654 0 0 23,654
Business Rates:
15,564 London Borough of Redbridge 0 14,335 0 14,335 11,513 Greater London Authority 0 9,557 1,000 10,557 25,939 Central Government 0 23,892 0 23,892
287 Costs of Collection 0 280 6 286 Apportionment of previous years estimated
collection fund surplus:
0 London Borough of Redbridge 400 0 0 400 0 GLA 106 0 0 106
Bad and Doubtful Debts 817 Provisions (1,586) 955 0 (631)
2,145 Write-offs 2,114 805 0 2,919 3,520 Provisions for appeals (665) 200 0 (465)
168,341 Total Expenditure 110,303 50,024 1,006 161,333
225 (Deficit)/Surplus for the year 5,408 3,374 0 8,782
1,012 (Deficit)/Surplus bought forward at 1 April 2,010 (773) 0 1,237 1,237 (Deficit)/Surplus carried forward at 31 March 7,418 2,601 0 10,019
Allocated to:
1,337 London Borough of Redbridge 5,786 780 0 6,566 286 Greater London Authority 1,632 520 0 2,152
(386) Central Government 0 1,301 0 1,301 1,237 Total 7,418 2,601 0 10,019

London Borough of Redbridge Statement of Accounts 2014/15
86
Notes to the Collection Fund
1. Council Tax Council Tax is based partly on the valuation of domestic properties and is partly a Personal Tax with discounts for single occupiers. The Authority set the level of Council Tax for 2014/15 at £1,394.53 for band D properties (this includes £299.00 on behalf of the Greater London Authority). The number of band D equivalent properties in each band making up the Council Tax base was as follows:
Band
2013/14 Number of Properties
2014/15 Number of Properties
A 1,029 1,073 B 8,413 8,629 C 20,678 20,900 D 29,847 29,987 E 22,204 22,159 F 9,945 10,016 G 4,935 4,983 H 337 334 Council Tax base collection allowance adjustment (1,662) (1,674) Allowance for estimated full value of exemptions (2,422) (2,432) Local Council Tax Support Scheme (15,682) (15,219) Total 77,622 78,756
2. Local Council Tax Support Scheme Council Tax Benefit ceased from 1 April 2013, replaced by the Local Council Tax Support Scheme.
3. Income from Business Rates The Authority collects business rates for its area based on rateable values (as determined by the Valuation Office Agency) and multipliers set by central government. The multipliers for 2014/15 were 47.1p for qualifying Small Businesses, with the standard multiplier being 48.2p for all other businesses (46.2p and 47.1p respectively in 2013/14).
The total rateable value for business premises as at the end of March 2015 was £136,900,813.
Under these arrangements the amounts included in these Accounts are analysed as follows:
2013/14 2014/15
£’000 £’000 61,399 Gross NNDR due in the year 62,079 (7,603) Less: Allowances and other adjustments (9,689)
53,796 52,390
In addition to NNDR collected on behalf of the Government, the Authority has collected the sum of £1.006 million on behalf of the Greater London Authority in respect of a Business Rate Supplement.
4. Business Rate Supplement (BRS) Under the arrangements for the Business Rate Supplement, the Authority collects a supplement for its area based on local rateable values. The total amount, less certain deductions, is paid to the Greater London Authority (GLA) on whose behalf it is collected. As at 31 March 2015 the balance repayable by the GLA is £239,000 (£83,000 in 2013/14).
5. Transitional Protection Payments The Authority received transitional relief of £0.13 million to remove the financial impact of transitional arrangements to the business rate retention scheme.
6. Provision for Appeals The Fund has a provision for appeals made to the Valuation Office against rating valuations but not settled as at 31 March 2015. As at 31 March 2015 a provision of £1 million (£0.8m in 2013/14) was charged to the Collection Fund. The provision for appeals is provided for in proportion to the precepting shares. The Authority's proportionate share of this provision is £0.3 million.

London Borough of Redbridge Statement of Accounts 2014/15
87
Group Accounts Basis of Consolidation Vision Redbridge Culture and Leisure The Authority has an interest in Vision Redbridge Culture and Leisure (VRCL) is a Leisure Trust which was incorporated as a company limited by guarantee under the Companies Act on 19 December 2006. It was registered as a charity on 11 February 2008. VRCL was originally set up to manage the Authority’s leisure centres, however during 2011 its remit was widened and it is now responsible for the management of the services previously managed in-house by the Culture, Sport & Community Leisure service area. Under both IFRS and the CIPFA Code of Practice on Local Authority accounting in the United Kingdom 2014/15 VRCL is deemed to be a subsidiary of the London Borough of Redbridge as the Authority has the power to govern VRCL’s financial and operating policies. VRCL had been consolidated from the 2011/12 financial year and is consolidated line by line into the Group Accounts as a subsidiary. Group Accounts have been prepared on the basis of full consolidation of the financial transactions and balances of the London Borough of Redbridge and VRCL, netting out any inter party transactions. The Group accounts was prepared using uniform policies for like transactions and the financial statement of VRCL was prepared as of the same reporting date as LBR.
The Authority or VRCL has no minority interest or contractual arrangement with respect to, providing financial support to other entities that would require reporting.

London Borough of Redbridge Statement of Accounts 2014/15
88
Group Movement in Reserves Statement This statement shows the movement in the year on the different reserves held by the Authority and its subsidiaries, analysed into ‘usable reserves’ (i.e. those that can be applied to fund expenditure or reduce local taxation) and other reserves. The Surplus or (Deficit) on the Provision of Services line shows the true economic cost of providing the Authority’s services, more details of which are shown in the Comprehensive Income and Expenditure Statement. This is different from the statutory amounts required to be charged to the General Fund Balance and the Housing Revenue Account for council tax setting and dwellings rent setting purposes. The Net Increase /Decrease before Transfers to Earmarked Reserves line shows the statutory General Fund Balance and Housing Revenue Account Balance before any discretionary transfers to or from earmarked reserves undertaken by the Authority and its subsidiaries.
Gen
eral
Fu
nd
Bal
ance
Earm
arke
d G
ener
al F
un
d
Res
erve
s H
RA
Bal
ance
HR
A E
arm
arke
d R
eser
ves
Oth
er U
sab
le R
eser
ves
Tota
l Usa
ble
Res
erve
s
Un
usa
ble
Res
erve
s
Tota
l Au
tho
rity
Res
erve
s
Au
tho
rity
’s s
har
e o
f R
eser
ves
of S
ub
sid
iari
es,
Ass
oci
ates
an
d J
oin
t V
entu
res
Tota
l G
rou
p R
eser
ves
Restated £’000 £’000 £’000 £’000 £’000 £’000 £’000 £’000 £’000 £’000 Balance at 1 April 2013 (15,816) (98,619) (3,850) (3,608) (67,243) (189,136) (247,250) (436,386) 3,361 (433,025)
Movement in reserves during 2013/14
Surplus or (deficit) on the provision of services 60,138 0 (9,092) 0 0 51,046 0 51,046 (467) 50,579
Other Comprehensive Income & Expenditure 0 0 0 0 0 0 (24,966) (24,966) (360) (25,326)
Total Comprehensive Income & Expenditure
60,138 0 (9,092) 0 0 51,046 (24,966) 26,080 (827) 25,253
Net (Increase)/Decrease before transfers 60,138 0 (9,092) 0 0 51,046 (24,966) 26,080 (827) 25,253
Adjustments between accounting basis and funding basis under regulations
(72,227) 0 6,338 0 13,556 (52,333) 52,333 0 299 299
Net (Increase)/Decrease before Transfers to Earmarked Reserves
(12,089) 0 (2,754) 0 13,556 (1,287) 27,367 26,080 (528) 25,552
Transfers to/from Earmarked Reserves
10,821 (10,821) 1,688 (1,688) 0 0 0 0 0 0
(Increase)/Decrease in 2013/14 (1,268) (10,821) (1,066) (1,688) 13,556 (1,287) 27,367 26,080 (528) 25,552
Balance at 31 March 2014 (17,084) (109,440) (4,916) (5,296) (53,687) (190,423) (219,883) (410,306) 2,833 (407,473)
Movement in reserves during 2014/15:
(Surplus) or deficit on provision of services
15,114 0 (2,093) 0 0 13,021 0 13,021 798 13,819
Other Comprehensive Income & Expenditure
0 0 0 0 0 0 (29,628) (29,628) 2,618 (27,010)
Total Comprehensive Income & Expenditure 15,114 0 (2,093) 0 0 13,021 (29,628) (16,607) 3,416 (13,191)
Adjustment between Group Accounts and Authority Accounts
0 0 0 0 0 0 0 0 0 0
Net (Increase)/Decrease before transfers 15,114 0 (2,093) 0 0 13,021 (29,628) (16,607) 3,416 (13,191)
Adjustments between accounting basis and funding basis under regulations
(9,100) 0 (804) 0 9,508 (396) 396 0 0 0
Net (Increase)/Decrease before Transfers to Earmarked Reserves
6,014 0 (2,897) 0 9,508 12,625 (29,232) (16,607) 3,416 (13,191)
Transfers to/(from) Earmarked Reserves
(6,031) 6,031 1,887 (1,887) 0 0 0 0 0 0
(Increase)/Decrease in 2014/15
(17) 6,031 (1,010) (1,887) 9,508 12,625 (29,232) (16,607) 3,416 (13,191)
Balance at 31 March 2015 carried forward (17,101) (103,409) (5,926) (7,183) (44,179) (177,798) (249,115) (426,913) 6,249 (420,664)
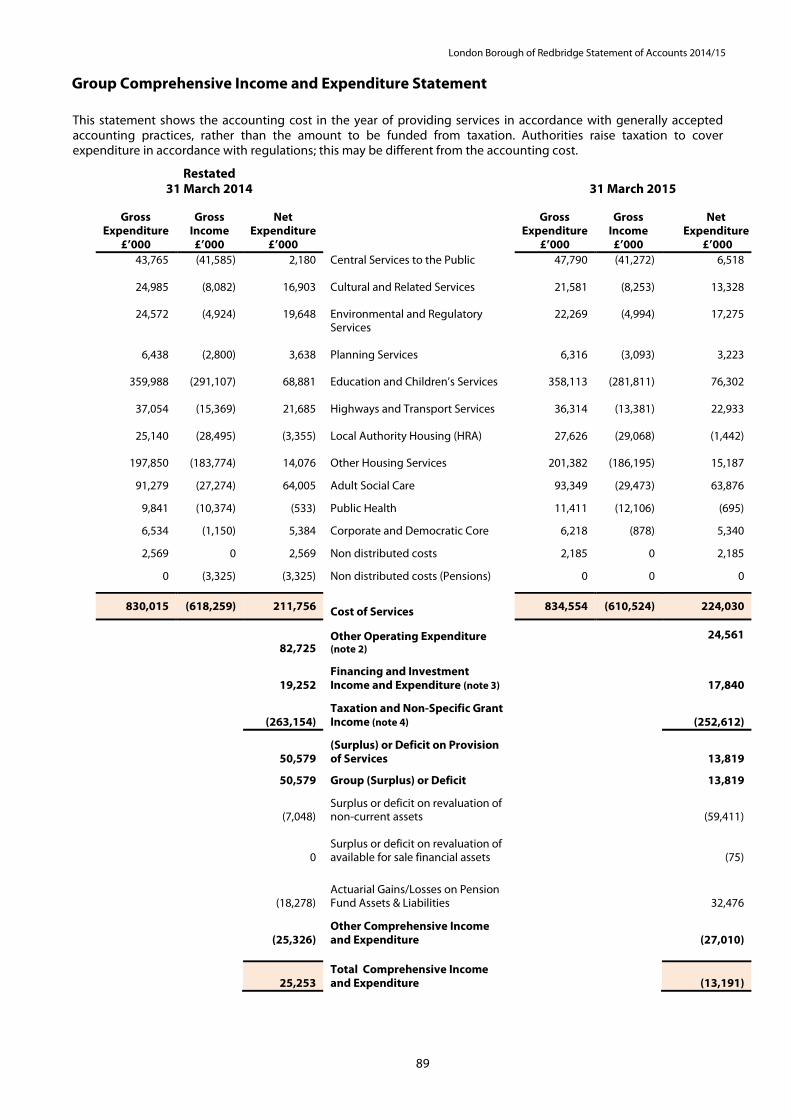
London Borough of Redbridge Statement of Accounts 2014/15
89
Group Comprehensive Income and Expenditure Statement
This statement shows the accounting cost in the year of providing services in accordance with generally accepted accounting practices, rather than the amount to be funded from taxation. Authorities raise taxation to cover expenditure in accordance with regulations; this may be different from the accounting cost.
Restated 31 March 2014 31 March 2015
Gross
Expenditure
Gross
Income
Net
Expenditure
Gross
Expenditure
Gross
Income
Net
Expenditure £’000 £’000 £’000 £’000 £’000 £’000
43,765 (41,585) 2,180 Central Services to the Public
47,790 (41,272) 6,518
24,985 (8,082) 16,903 Cultural and Related Services
21,581 (8,253) 13,328
24,572 (4,924) 19,648 Environmental and Regulatory Services
22,269 (4,994) 17,275
6,438 (2,800) 3,638 Planning Services
6,316 (3,093) 3,223
359,988 (291,107) 68,881 Education and Children’s Services
358,113 (281,811) 76,302
37,054 (15,369) 21,685 Highways and Transport Services
36,314 (13,381) 22,933
25,140 (28,495) (3,355) Local Authority Housing (HRA)
27,626 (29,068) (1,442)
197,850 (183,774) 14,076 Other Housing Services
201,382 (186,195) 15,187
91,279 (27,274) 64,005 Adult Social Care
93,349 (29,473) 63,876
9,841 (10,374) (533) Public Health 11,411 (12,106) (695)
6,534 (1,150) 5,384 Corporate and Democratic Core
6,218 (878) 5,340
2,569 0 2,569 Non distributed costs
2,185 0 2,185
0 (3,325) (3,325) Non distributed costs (Pensions)
0 0 0
830,015 (618,259) 211,756 Cost of Services 834,554 (610,524) 224,030
82,725 Other Operating Expenditure (note 2)
24,561
19,252 Financing and Investment Income and Expenditure (note 3)
17,840
(263,154) Taxation and Non-Specific Grant Income (note 4)
(252,612)
50,579 (Surplus) or Deficit on Provision of Services
13,819
50,579 Group (Surplus) or Deficit 13,819
(7,048) Surplus or deficit on revaluation of non-current assets
(59,411)
0
Surplus or deficit on revaluation of available for sale financial assets
(75)
(18,278) Actuarial Gains/Losses on Pension Fund Assets & Liabilities
32,476
(25,326) Other Comprehensive Income and Expenditure
(27,010)
25,253
Total Comprehensive Income and Expenditure
(13,191)

London Borough of Redbridge Statement of Accounts 2014/15
90
Group Balance Sheet as at 31 March 2015
The Balance Sheet shows the value as at the Balance Sheet date of the assets and liabilities recognised by the Authority and its subsidiaries. The net assets of the Authority and its subsidiaries (assets less liabilities) are matched by the reserves held by the Authority and its subsidiaries. Reserves are reported in two categories. The first category of reserves are usable reserves, i.e. those reserves that the Authority may use to provide services, subject to the need to maintain a prudent level of reserves and any statutory limitations on their use (for example the Capital Receipts Reserve that may only be used to fund capital expenditure or repay debt). The second category of reserves is those that the Authority and its subsidiaries are not able to use to provide services. This category of reserves includes reserves that hold unrealised gains and losses (for example the Revaluation Reserve), where amounts would only become available to provide services if the assets were sold; and reserves that hold timing differences shown in the Movement in Reserves Statement line ‘Adjustments between accounting basis and funding basis under regulations’.
Restated Restated 1 April
2013 31 March
2014 31 March
2015 £’000 £’000 £’000
803,910 761,743 Property, Plant and Equipment 821,667
25,711 25,792 Investment Property 25,804 437 259 Intangible Assets 275
2,677 0 Long-term Investments 10,161 2,728 2,620 Long-term Debtors 2,340
835,463 790,414 Long-term Assets 860,247
138,663 145,532 Short-term Investments 160,791 258 256 Inventories 217
39,140 44,131 Short-term Debtors 32,679 22,125 14,982 Cash and Cash Equivalents 20,263
200,186 204,901 Current Assets 213,950
(14,435) (8,611) Short-term Borrowing (8,782) (70,277) (68,013) Short-term Creditors (69,658)
0 0 Revenue Grants Receipts in Advance (178) (2,226) (1,462) Capital Grants Receipts in Advance (1,030)
(86,938) (78,086) Current Liabilities (79,648)
(10,905) (12,158) Provisions (12,869) (162,106) (165,085) Long-term Borrowing (184,064) (342,248) (332,513) Other Long-term Liabilities (376,952)
(427)
0
Capital Grants/Contributions Received in Advance
0
(515,686) (509,756) Long-term Liabilities (573,885)
433,025 407,473 Net Assets 420,664
185,775 187,590 Usable Reserves 171,549
247,250 219,883 Unusable Reserves 249,115
433,025 407,473 Total Reserves 420,664
Mark Green, CPFA Chief Financial Services Officer (Section 151 Officer) 24 September 2015

London Borough of Redbridge Statement of Accounts 2014/15
91
Group Cash Flow Statement
The Group Cash Flow Statement shows the changes in cash and cash equivalents of the Authority and its subsidiaries during the reporting year. The statement shows how the Authority and its subsidiaries generate and use cash and cash equivalents by classifying cash flows as operating, investing and financing activities. The amount of net cash flows arising from operating activities is a key indicator of the extent to which the operations of the Authority are funded by way of taxation and grant income or from the recipients of services provided by the Authority and its subsidiaries. Investing activities represent the extent to which cash outflows have been made for resources which are intended to contribute to the Authority’s and its subsidiaries future service delivery. Cash flows arising from financing activities are useful in predicting claims on future cash flows by providers of capital (i.e. borrowing) to the Authority and its subsidiaries.
Restated 2013/14 2014/15
£’000
£’000
(50,579) Net deficit on the provision of services
(13,819)
136,223
Adjustments to net deficit on the provision of services for non-cash movements
94,932
(55,373) Adjustments for items included in the net deficit on the provision of services that are investing and financing activities
(49,805)
30,271 Net cash flows from operating activities 31,308
(33,805) Investing activities (45,247)
(3,609) Financing activities 19,220
(7,143) Net increase or decrease in cash and cash equivalents 5,281
22,125 Cash and cash equivalents at the beginning of the reporting year 14,982
14,982 Cash and cash equivalents at the end of the reporting year 20,263
Cash Flow Statement – Operating Activities
The surplus or deficit on the provision of services has been adjusted for the following non cash movements.
Restated 2013/14
2014/15
£’000 £’000 The cash flows for operating activities include the following items:
(50,579) Net deficit on the provision of services
(13,819)
Adjust net deficit on the provision of services for non-cash movements 23,992 Depreciation 24,289 11,656 Impairment and downward valuations 19,842
228 Amortisation 121 (2,800) Increase/decrease in creditors 2,645 (3,335) Increase in debtors 11,506
2 Decrease in inventories 38 8,801 Movement in pension liability 15,052
73,938 Carrying amount of non-current assets sold or derecognised 15,616 23,741 Other non-cash items 5,823
136,223 94,932 Adjust for items included in net deficit on the provision of services that
are investing or financing activities
(49,344) Capital Grants (44,707)
(6,351) Proceeds from the sale of property, plant and equipment (5,098) 322 Collection Fund Items 0
(55,373) (49,805) 30,271 Net cash flows from operating activities 31,308
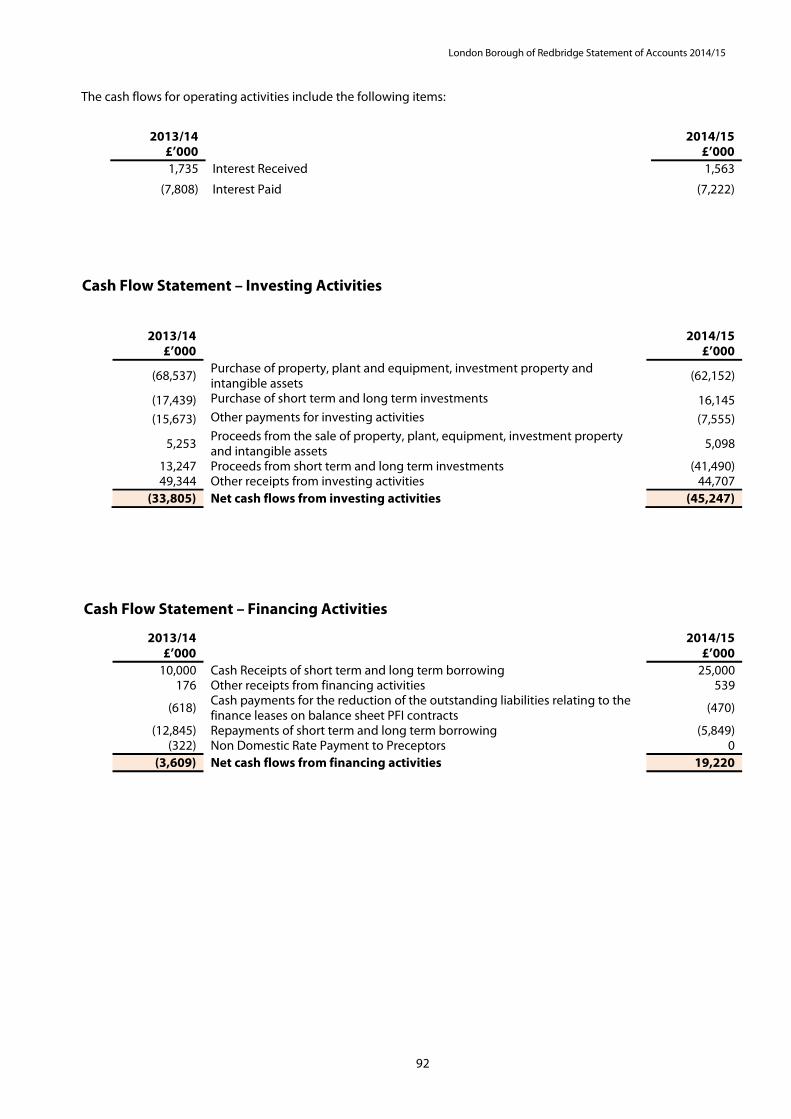
London Borough of Redbridge Statement of Accounts 2014/15
92
The cash flows for operating activities include the following items:
2013/14
£’000 2014/15
£’000 1,735 Interest Received 1,563
(7,808)
Interest Paid (7,222)
Cash Flow Statement – Investing Activities
2013/14 2014/15 £’000 £’000
(68,537) Purchase of property, plant and equipment, investment property and intangible assets
(62,152)
(17,439) Purchase of short term and long term investments 16,145
(15,673) Other payments for investing activities (7,555)
5,253 Proceeds from the sale of property, plant, equipment, investment property and intangible assets
5,098
13,247 Proceeds from short term and long term investments (41,490) 49,344 Other receipts from investing activities 44,707
(33,805) Net cash flows from investing activities (45,247)
Cash Flow Statement – Financing Activities
2013/14 2014/15 £’000 £’000
10,000 Cash Receipts of short term and long term borrowing 25,000 176 Other receipts from financing activities 539
(618) Cash payments for the reduction of the outstanding liabilities relating to the finance leases on balance sheet PFI contracts
(470)
(12,845) Repayments of short term and long term borrowing (5,849) (322) Non Domestic Rate Payment to Preceptors 0
(3,609) Net cash flows from financing activities 19,220
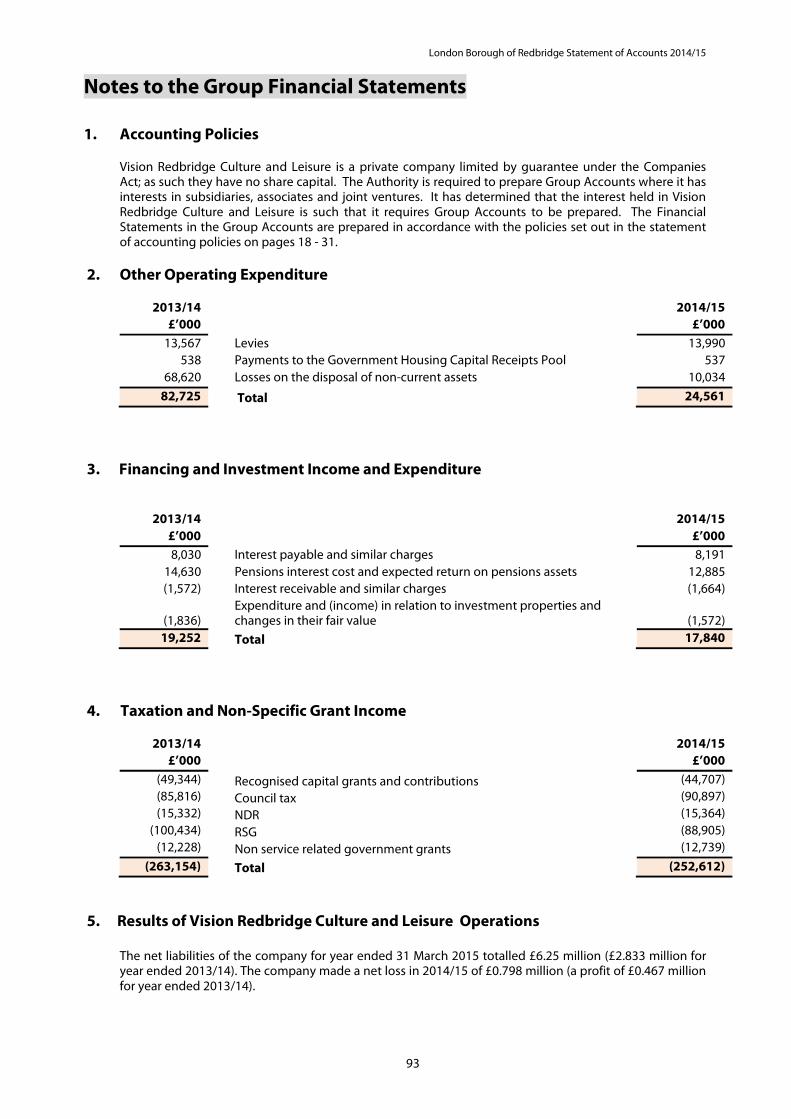
London Borough of Redbridge Statement of Accounts 2014/15
93
Notes to the Group Financial Statements
1. Accounting Policies
Vision Redbridge Culture and Leisure is a private company limited by guarantee under the Companies Act; as such they have no share capital. The Authority is required to prepare Group Accounts where it has interests in subsidiaries, associates and joint ventures. It has determined that the interest held in Vision Redbridge Culture and Leisure is such that it requires Group Accounts to be prepared. The Financial Statements in the Group Accounts are prepared in accordance with the policies set out in the statement of accounting policies on pages 18 - 31.
2. Other Operating Expenditure
2013/14 2014/15 £’000 £’000
13,567 Levies 13,990 538 Payments to the Government Housing Capital Receipts Pool 537
68,620 Losses on the disposal of non-current assets 10,034
82,725 Total 24,561
3. Financing and Investment Income and Expenditure
2013/14 2014/15
£’000 £’000 8,030 Interest payable and similar charges 8,191
14,630 Pensions interest cost and expected return on pensions assets 12,885 (1,572) Interest receivable and similar charges (1,664)
(1,836)
Expenditure and (income) in relation to investment properties and changes in their fair value
(1,572)
19,252 Total 17,840
4. Taxation and Non-Specific Grant Income
2013/14 2014/15 £’000 £’000
(49,344) Recognised capital grants and contributions (44,707) (85,816) Council tax (90,897) (15,332) NDR (15,364)
(100,434) RSG (88,905) (12,228) Non service related government grants (12,739)
(263,154) Total (252,612)
5. Results of Vision Redbridge Culture and Leisure Operations
The net liabilities of the company for year ended 31 March 2015 totalled £6.25 million (£2.833 million for year ended 2013/14). The company made a net loss in 2014/15 of £0.798 million (a profit of £0.467 million for year ended 2013/14).

London Borough of Redbridge Statement of Accounts 2014/15
94
6. Cash and Cash Equivalents
Cash is represented by cash in hand and deposits with financial institutions repayable without penalty on notice of not more than 24 hours. Cash equivalents are investments that having originally been invested for no longer than three months are repayable on demand or readily convertible to known amounts of cash with insignificant risk of change in value. Fixed term deposits, excluding overnight deposits, are not considered to be readily convertible since they only become repayable at the point of maturity and cannot be traded or redeemed without penalty. In the Cash Flow Statement, cash and cash equivalents are shown net of bank overdrafts that are repayable on demand and form an integral part of the Authority’s cash management. The Balance of Cash and Cash Equivalents is made up of the following elements:
31 March 2014 £’000
31 March 2015 £’000
23,748 Short Term Deposits 24,153 (8,766) Bank Overdraft (3,890)
14,982 Total Cash and Cash Equivalents 20,263
7. Other Information
Vision Redbridge Culture and Leisure These group accounts have been prepared from the 2014/15 draft unaudited accounts of Vision Redbridge Culture & Leisure. Vision Redbridge Culture & Leisure, Auditors - Appleby & Wood, 40 The Lock Building, 72 High Street, London, E15 2QB. A copy of the Vision Redbridge Culture & Leisure Accounts can be obtained from the Company Secretary, Vision Redbridge Culture & Leisure, Central Library, Clements Road, Ilford, IG1 1EA.

London Borough of Redbridge Statement of Accounts 2014/15
95
Pension Fund Account for the Year Ended 31 March 2015
Restated 2013/14
Notes
2014/15
£’000 £’000 Dealings with members, employers and
other directly involved in the Fund.
30,578 Contributions receivable 6 33,020 2,994 Transfers in 7 2,519
33,572 35,539 Less:
(27,845) Benefits payable 8 (27,244) (2,860) Leavers 9 (1,577)
(30,705) (28,821) 2,867 Net additions from dealings with members 6,718
(2,276) Management Expenses 10 (2,452)
Returns on Investments
12,978 Investment income 11 13,384 (547) Irrecoverable withholding tax 11 (491) 9,847 Change in market value of investments 12(b) 62,526
22,278 Net returns on Investments 75,419
22,869 Net increase in the Fund during the year 79,685
533,728 Net Assets of the scheme at 1 April 2014 556,597
556,597 Net Assets of the scheme at 31 March 2015 636,282
Net Assets Statement as at 31 March 2015
2013/14
Notes
2014/15
£’000 £’000 560,345 Investment Assets 12 641,464 (3,351) Investment Liabilities 12 (4,811)
556,994 636,653
236 Current Assets 16 130 (633) Current Liabilities 16 (501)
556,597 Net Assets of the Scheme at 31 March 2015 636,282
The accounts summarise the transactions and net assets of the Fund. They do not take account of liabilities to pay pensions and other benefits in the future. The actuarial present value of promised retirement benefits is disclosed at Note 20. I certify that the Pension Fund Account and Net Assets Statement presents a true and fair view of the income and expenditure in 2014/15 and the Pension Fund’s financial position as at 31 March 2015.
Mark Green, CPFA Chief Financial Services Officer (Section 151 Officer) 24 September 2015
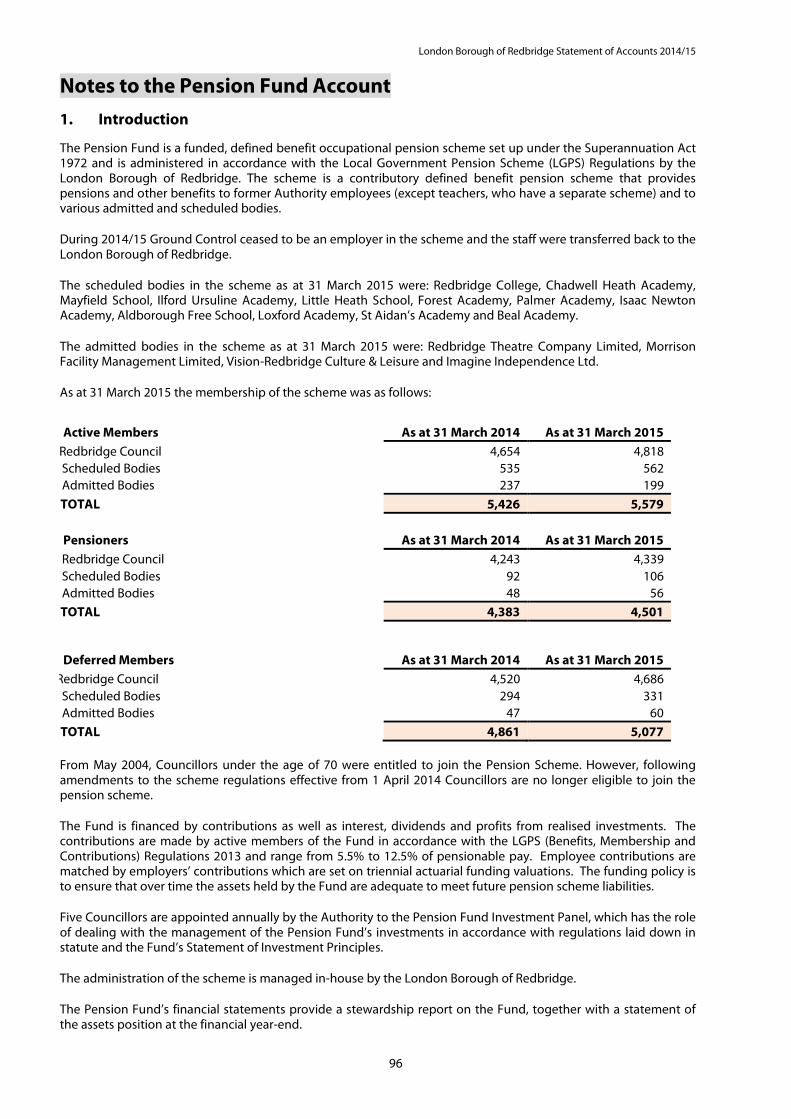
London Borough of Redbridge Statement of Accounts 2014/15
96
Notes to the Pension Fund Account
1. Introduction The Pension Fund is a funded, defined benefit occupational pension scheme set up under the Superannuation Act 1972 and is administered in accordance with the Local Government Pension Scheme (LGPS) Regulations by the London Borough of Redbridge. The scheme is a contributory defined benefit pension scheme that provides pensions and other benefits to former Authority employees (except teachers, who have a separate scheme) and to various admitted and scheduled bodies.
During 2014/15 Ground Control ceased to be an employer in the scheme and the staff were transferred back to the London Borough of Redbridge.
The scheduled bodies in the scheme as at 31 March 2015 were: Redbridge College, Chadwell Heath Academy, Mayfield School, Ilford Ursuline Academy, Little Heath School, Forest Academy, Palmer Academy, Isaac Newton Academy, Aldborough Free School, Loxford Academy, St Aidan’s Academy and Beal Academy.
The admitted bodies in the scheme as at 31 March 2015 were: Redbridge Theatre Company Limited, Morrison Facility Management Limited, Vision-Redbridge Culture & Leisure and Imagine Independence Ltd.
As at 31 March 2015 the membership of the scheme was as follows:
Active Members As at 31 March 2014 As at 31 March 2015
Redbridge Council 4,654 4,818 Scheduled Bodies 535 562 Admitted Bodies 237 199
TOTAL 5,426 5,579
Pensioners As at 31 March 2014 As at 31 March 2015 Redbridge Council 4,243 4,339 Scheduled Bodies 92 106 Admitted Bodies 48 56
TOTAL 4,383 4,501
Deferred Members As at 31 March 2014 As at 31 March 2015 Redbridge Council 4,520 4,686 Scheduled Bodies 294 331 Admitted Bodies 47 60
TOTAL 4,861 5,077
From May 2004, Councillors under the age of 70 were entitled to join the Pension Scheme. However, following amendments to the scheme regulations effective from 1 April 2014 Councillors are no longer eligible to join the pension scheme.
The Fund is financed by contributions as well as interest, dividends and profits from realised investments. The contributions are made by active members of the Fund in accordance with the LGPS (Benefits, Membership and Contributions) Regulations 2013 and range from 5.5% to 12.5% of pensionable pay. Employee contributions are matched by employers’ contributions which are set on triennial actuarial funding valuations. The funding policy is to ensure that over time the assets held by the Fund are adequate to meet future pension scheme liabilities.
Five Councillors are appointed annually by the Authority to the Pension Fund Investment Panel, which has the role of dealing with the management of the Pension Fund’s investments in accordance with regulations laid down in statute and the Fund’s Statement of Investment Principles.
The administration of the scheme is managed in-house by the London Borough of Redbridge.
The Pension Fund’s financial statements provide a stewardship report on the Fund, together with a statement of the assets position at the financial year-end.

London Borough of Redbridge Statement of Accounts 2014/15
97
2. Basis of Preparation The Statement of Accounts summarises the Fund’s transactions for the 2014/15 financial year and its position at year-end as at 31 March 2015. The accounts have been prepared in accordance with the Code of Practice on Local Authority Accounting 2014/15 which is based upon International Financial Reporting Standards (IFRS), as amended for the UK public sector. The accounts summarise the transactions of the Fund and report on the net assets available to pay pension benefits. The accounts do not take account of obligations to pay pensions and benefits which fall due after the end of the financial year. The accounting requirement under International Accounting Standard (IAS) 26 is disclosed at Note 20.
3. Summary of Significant Accounting Policies Fund account – revenue recognition
A) Contribution Income – Normal contributions, both from members and from the employer, are accounted for on an accruals basis at the percentage rate recommended by the Fund actuary in the payroll period to which they relate.
Employer’s augmentation and pension strain contributions are accounted for in the period that the liability arises. Any amount due in year but unpaid is treated as a current financial asset.
B) Transfers to and from other schemes – Transfer values represent the amounts received and paid during the year for members who have either joined or left the fund during the financial year and are calculated in accordance with the Local Government Pension Scheme Regulations. Individual transfers in/out are accounted for when received/paid.
C) Investment Income –
(i) Interest Income – Interest income is recognised in the Fund account as it accrues.
(ii) Dividend Income - Dividends have been accounted for on an accrual basis. Investment income on overseas investments has been converted into sterling at the rate of exchange on settlement date. Any amount not received by the end of the reporting period is disclosed in the net assets statement as a current asset.
(iii) Distributions from pooled equity funds – Pooled investment vehicles are accumulation funds and as such the change in market value includes income, net of withholding tax which is re-invested in the fund.
(iv) Distributions from pooled property funds – Income distributions from the pooled property fund investments have been accounted for on an accrual basis.
(v) Movement in the net market value of investments – Changes in the net market value of investments are recognised as income and comprise all realised and unrealised profits/losses during the year.
Fund account – expense items
D) Benefits Payable – pensions and lump sum benefits payable include all amounts known to be due as at the end of the financial year. Any amounts due but unpaid are disclosed in the net assets statement as current liabilities.
E) Taxation – the fund is a registered public service scheme under section 1(1) of Schedule 36 of the Finance Act 2004 and as such is exempt from UK income tax on interest received and from capital gains tax on the proceeds of investments sold. Income from overseas investments incurs withholding tax in the country of origin, unless exemption is permitted. Irrecoverable tax is accounted for as a fund expense as it arises.
F) VAT – VAT payable is included as an expense only to the extent that it is not recoverable from Her Majesty’s Revenue and Customs. VAT receivable is excluded from income.
London Borough of Redbridge Statement of Accounts 2014/15
98
G) Management Expenses – Pension Fund management expenses are accounted for in accordance with the CIPFA Guidance Accounting for Local Government Pension Scheme Management Costs. The comparator figures for 2013/14 have been restated to reflect the implementation of the CIPFA guidance. All administrative expenses are accounted for on an accruals basis. All staff costs of the pension’s administration team are charged direct to the fund. Management, accommodation and other overheads are apportioned to the fund in accordance with the Authority’s policy. All investment management expenses are also accounted for on an accruals basis. Fees of the external investment managers and custodian are agreed in the respective mandates governing their appointment. Broadly, these are based on the market value of the investments under their management and therefore increase or decrease as the value of these investments change.
The cost of obtaining investment advice from external consultants is included in investment management charges.
The costs of the Authority’s in-house fund management team are charged direct to the fund and a proportion of the Authority’s costs representing management time spent by officers on investment management are also charged to the fund.
Net assets statement
H) Financial Assets – financial assets are included in the net assets statement on a fair value basis as at the reporting date. A financial asset is recognised in the net assets statement on the date the fund becomes party to the contractual acquisition of the asset. From this date any gains or losses arising from changes in the fair value of the assets are recognised by the fund.
The values of investments as shown in the net assets statement have been determined as follows:
i) Market quoted investments – the value of an investment for which there is a readily available market price is determined by the bid market price ruling on the final day of the accounting period.
ii) Fixed Interest Securities – are recorded at net market value based on their bid price.
iii) Pooled Investment Vehicles – these are valued at either the closing bid price where a bid price exists or on the single unit price provided by the investment managers.
iv) Cash – the cash held in the Pension Fund current account is invested by the Authority in accordance with its Treasury Management policy.
I) Foreign Currency Transactions – dividends, interest and purchases and sales of investments in foreign currencies have been accounted for at the spot market rates at the date of transaction. End-of-year spot market exchanges rates are used to value any cash balances held in foreign currency bank accounts, market values of overseas investments and purchases and sales outstanding at the end of the reporting period.
J) Derivatives – the fund uses derivative financial instruments to manage its exposure to specific risk arising from its investment activities. The fund does not hold derivatives for speculative purposes. Derivative contract assets are fair valued at bid prices and liabilities are fair valued at offer prices. Changes in the fair value of derivatives contracts are included in change in market value.
The value of forward foreign exchange contracts is based on market forward exchange rates at the year-end and determined as the gain or loss that would arise if the contract were matched at the year-end with an equal and opposite contract.
Derivatives are used by the Fund Managers as part of their investment strategy to enable them to achieve our investment mandate objective.
K) Cash and cash equivalents – cash comprises of cash in hand and demand deposits. Cash equivalents are short-term, highly liquid investments that are readily convertible to known amounts of cash and that are subject to minimal risk of changes in value. Cash that is invested for longer than an overnight deposit is recognised as an investment asset.
L) Financial Liabilities – the Fund recognises financial liabilities at fair value as at the reporting date. A financial liability is recognised in the net assets statement on the date the Fund becomes party to the liability. From this date any gains or losses arising from changes in the fair value of the liability are recognised by the fund.

London Borough of Redbridge Statement of Accounts 2014/15
99
M) Actuarial present value of promised retirement benefits – the actuarial present value of promised retirement benefits is assessed on a triennial basis by the scheme actuary in accordance with the requirements of IAS 19 and relevant actuarial standards.
As permitted under the code, the fund has opted to disclose the actuarial present value of promised retirement benefits by way of a note to the net assets statement (Note 20).
N) Additional Voluntary Contributions – AVCs are not included in the accounts which is in accordance with section 4(2) (b) of the Local Government Pension Scheme (Management and Investment of Funds) Regulations 2009, but are disclosed as a note only (Note 21).
4. Assumptions made about the future and other major sources of estimation
uncertainty The Statement of Accounts contains estimated figures that are based on assumptions made by the Authority about the future or that are otherwise uncertain. Estimates are made taking into account historical experience, current trends and other relevant factors. However, because balances cannot be determined with certainty, actual results could be materially different from the assumptions and estimates. Pension fund liability – the pension fund liability is calculated every three years by the appointed actuary, with updates in the intervening years. The methodology used is in line with accepted guidelines and in accordance with IAS 19. Assumptions underpinning the valuations are agreed with the actuary and are summarised in Note 19. This estimate is subject to significant variances based on changes to the underlying assumptions. 5. Events after the Year End Date There have been no events since 31 March 2015 and up to the date when these accounts were authorised that require any adjustment to these accounts. 6. Contributions Receivable Contributions represent those amounts receivable from the various employing bodies in respect of their own contributions and those of their contributing employees. Under the provisions of the scheme, employees’ rates are based on pay bandings and range from 5.5% to 12.5% of pensionable pay. The Fund’s Actuary determines employer contribution rates (as a percentage of pensionable pay) which currently range from 12.5% to 24.1% plus any additional lump sum contributions required in respect of funding shortfalls at the time of the triennial actuarial valuation. Early retirement - All capital costs, such as employee and employer contributions foregone, and the cost of making pension payments early in respect of non-ill-health early retirements, are met by the employer that approved the early retirement.
2013/14 2014/15 £’000 £’000
Employers LBR 21,366 22,636
Scheduled Bodies 1,363 1,977 Admitted Bodies 1,130 1,117 23,859 25,730
Members LBR 5,925 6,285 Scheduled Bodies 441 648
Admitted Bodies 353 357 6,719 7,290
30,578 33,020 Contributions split between normal, deficit funding and augmentation are outlined below:
2013/14 2014/15 £’000 £’000
Normal Employer Contributions 15,537 20,394 Deficit Payments * Cessation Payment
7,887 115 5,153
0 Augmentation (Early Retirements) 320 183
23,859 25,730 * The deficit recovery policy is set out in the Scheme’s Funding Strategy Statement

London Borough of Redbridge Statement of Accounts 2014/15
100
7. Transfers In Sums received for scheme members from other pension schemes that relate to periods of previous pensionable employment.
2013/14 2014/15 £’000 £’000
Individual Transfers from other schemes – LBR 2,994 2,519 2,994 2,519
8. Benefits Payable Benefits are provided in accordance with the provisions of the Local Government Pension Scheme regulations.
2013/14 2014/15 £’000 £’000
Pensions - LBR 20,158 21,090 - Scheduled Bodies 483 517 - Admitted Bodies 659 700 Commutation of Pensions and Lump Sum Retirement Benefits 5,014 4,359 Lump Sum Death Benefit 1,495 559 Interest 36 19
27,845 27,244
9. Payments to and on Account of Leavers Regulations permit a refund of employee contributions to be made to new members with less than three months initial scheme membership. Individual transfers are payments of accrued pension benefits in respect of scheme members who have left the scheme and joined a pension scheme elsewhere.
2013/14 2014/15 £’000 £’000
Refunds to members 5 15 Individual Transfers to other Schemes 2,855 1,562
2,860 1,577 10. Management Expenses The table below shows a breakdown of the management expenses incurred during the year. The London Borough of Redbridge carries out the administrative function in-house. Restated 2013/14 2014/15 £’000 £’000
Administrative Costs 555 594 Investment Management Expenses 1,499 1,585 Oversight and Governance 222 273
2,276 2,452
11. Investment Income Interest, dividends and other income shown in the Fund Account have been broken down as follows: 2013/14 2014/15 £’000 £’000
Fixed interest securities 7,180 7,194 Index Linked 42 66 Equities 3,377 3,528 Property Unit Trusts 2,198 2,394 Cash Deposits 14 30 Other Investment Income 167 172 12,978 13,384 Less irrecoverable withholding tax (547) (491) 12,431 12,893

London Borough of Redbridge Statement of Accounts 2014/15
101
12. Investments The table below shows the Fund’s investments by asset class: 2013/14 2014/15 £’000 £’000
Investment Assets Fixed interest securities (including index-linked) 166,730 208,226 Equities 95,610 95,942 Pooled Investments 227,190 255,081 Pooled Property Investments 49,281 59,824 Derivatives
Options 617 249 Currency Forwards 611 2,481
Commodities 3,902 6,887 Cash Deposits 13,923 10,548 Investment Income Due 2,223 2,188 Amounts Receivable for sales 258 38 Total Investment Assets 560,345 641,464 Investment Liabilities Derivatives
Options (527) (247) Index Futures 0 (176)
Currency Forwards (1,861) Amounts Payable for purchases (2,824) (2,527) Total Investment Liabilities (3,351) (4,811) Net Investment Assets 556,994 636,653
The table below shows a detailed analysis of the investments held by the Fund as at 31 March 2015 with comparison table showing detailed analysis of the investments held by the Fund as at 31 March 2014.
Value
at 31/03/14
Purchases
at cost
Sales
Proceeds
Change in Fair value
Cash
movement
Value at
31/03/15 £’000 £’000 £’000 £’000 £’000 £’000
Equities Fixed Interest Securities
95,610 164,275
53,090 122,609
(60,541) (107,005)
7,783 25,725
0 0
95,942 205,604
Index Linked 2,455 0 0 167 0 2,622 Pooled Equity Unit Trusts 227,190 2,112 0 25,779 0 255,081 Property Unit Trusts 49,281 4,600 0 5,943 0 59,824 Commodities 3,902 2,728 0 257 0 6,887 542,713 185,139 (167,546) 65,654 0 625,960 Derivative Contracts Options 90 5,528 (2,063) (3,553) 0 2 Index Futures 0 121,283 (140,309) 18,850 0 (176) Currency Forwards 611 152,532 (152,532) (20,422) 20,431 620 543,414 464,482 (462,450) 60,529 20,431 626,406 Other Balances Cash Deposits 13,923 0 0 1,997 (5,372) 10,548 Receivable – Sales 258 (220) 38 Receivable - Investment Income
2,223
(35)
2,188
Payable - Purchases (2,824) 297 (2,527) 556,994 464,482 (462,450) 62,526 15,101 636,653

London Borough of Redbridge Statement of Accounts 2014/15
102
Value
at 31/03/13
Purchases
at cost
Sales
Proceeds
Change in Fair value
Cash
movement
Value at
31/03/14 £’000 £’000 £’000 £’000 £’000 £’000
Equities 99,883 47,732 (53,137) 1,132 0 95,610 Fixed Interest Securities 153,334 82,093 (60,548) (10,604) 0 164,275 Index Linked 1,935 899 (637) 258 0 2,455 Pooled Equity Unit Trusts 211,968 3 (82) 15,301 0 227,190 Property Unit Trusts 42,511 3,345 0 3,425 0 49,281 Commodities 5,152 149 0 (1,399) 0 3,902 514,783 134,221 (114,404) 8,113 0 542,713 Derivative Contracts Options (462) 6,596 (3,382) (2,662) 0 90 Currency Forwards (1,151) 508,543 (508,543) 5,063 (3,301) 611 513,170 649,360 (626,329) 10,514 (3,301) 543,414 Other Balances Cash Deposits 18,272 0 0 (667) (3,682) 13,923 Receivable – Sales 1,014 (756) 258 Receivable - Investment Income
2,298
(75)
2,223
Payable - Purchases (549) (2,275) (2,824) 534,205 649,360 (626,329) 9,847 (10,089) 556,994
The change in fair value of investments during the year comprises all increases and decreases in the value of investments held at any time during the year, including profits and losses realised on sales of investments and changes in the sterling value of assets caused by changes in exchange rates. In the case of the pooled investment vehicles changes in market value also includes income, net of withholding tax, which is reinvested in the Fund.
The cost of purchases and the sales proceeds are inclusive of transaction costs, such as broker fees and taxes, amounting to £0.2 million (£0.2 million in 2013/14). In addition to transaction costs, indirect costs are incurred through the bid-offer spread on investments within pooled investment vehicles. The amount of indirect costs is not separately provided to the Fund.
Cash balances invested by the Authority on behalf of the Pension Fund are included within cash deposits. As at 31 March 2015 the Authority invested cash amounting to £3.3 million (£1.4 million at 31 March 2014). The Fund Manager, Newton, seeks to benefit from the potentially greater returns available from investing in equities whilst minimising the risk of loss of value through adverse equity price movements. During the year the Fund bought a number of option contracts that helps protect against the volatility of the stock markets and forward foreign currency contracts to reduce the volatility associated with fluctuating currency rates. 2013/14 2014/15
£’000 £’000 Equities UK Quoted 20,351 17,786 Overseas Quoted 75,259 78,156 95,610 95,942 Fixed Interest Securities
UK – Public Sector 65,249 100,303 Overseas – Public Sector 24,707 27,419 UK - Other 38,521 42,105 Overseas- Other 35,798 35,777 164,275 205,604 Index Linked Securities UK – Public Sector 1,851 1,972 Overseas – Other 604 650 2,455 2,622 Pooled Investment Vehicles Unit trusts – UK 130,731 139,590 Unit trusts – Overseas 96,459 115,491 227,190 255,081

London Borough of Redbridge Statement of Accounts 2014/15
103
Property Unit Trusts UK
49,281
59,824
49,281 59,824 Cash Sterling Deposits 13,923 10,548 13,923 10,548 Commodities Commodities 3,902 6,887 3,902 6,887 Investment Balances Investment Income Due 2,223 2,188 Outstanding Sales 258 38 Outstanding Purchases (2,824) (2,527)
(343)
(301) A summary of individual investments exceeding 5% of the Fund’s total net assets is set out below:
Investment 31 March
2015 % of net
assets UK Equity Index Unit Trust 137,338 21.6% North America Equity Index Unit Trust 43,305 6.8% Europe ex UK Equity Index Unit Trust 33,223 5.2%
Analysis of Derivatives A summary of the options held at the year-end is set out below:
Notional Holding
Market Value as at
31.03.14 £’000 Asset Expiring Put/Call
Notional Holding
Market Value as at
31.03.15 £’000
139 7 S&P 500 Index One Month Put 82
7 124 102 S&P 500 Index Two Month Put 0 0 184 508 S&P 500 Index Three Month Put 0 0
0 0 FTSE 100 Three Month Put 83 186 0 0 EURO Stoxx Three Month Put 129 56
617 249
Notional Holding
Market Value as at
31.03.14 £’000 Liability Expiring Put/Call
Notional Holding
Market Value as at
31.03.15 £’000
(124) (41) S&P 500 Index Two Month Put 0 0 0 0 FTSE 100 Three Month Call (83) (32) 0 0 FTSE 100 Three Month Put (83) (78)
(184) (486) S&P 500 Index Three Month Call 0 0 0 0 EURO Stoxx Three Month Call (129) (114) 0 0 EURO Stoxx Three Month Put (129) (23)
(527) (247) 90 NET 2
Futures
Economic Exposure
Market Value as at
31.03.14 £’000 Liability Expiring
Economic Exposure
Market Value as at
31.03.15 £’000
0 0 FTSE 100 - Futures Three Month (3,696) (5) 0 0 S&P 500 Index - Futures Three Month (18,741) (171)
0 (176)

London Borough of Redbridge Statement of Accounts 2014/15
104
Open Forward Currency Contracts Settlement Currency
Bought Value in Sterling £
Currency Sold
Value in Sterling £
Asset Value
Liability Value
Up to 3 months GBP 48,720 US$ (49,953) (1,233) Up to 3 months GBP 1,884 C$ (1,912) (28) Up to 3 months GBP 15,099 A$ (15,208) (109) Up to 3 months GBP 2,916 NZ$ (3,007) (90) Up to 3 months GBP 1,362 SEK (1,345) 17 Up to 3 months GBP 1,726 DKK (1,586) 140 Up to 3 months GBP 26,449 EUR (24.468) 1,981 Up to 3 months GBP 487 ILS (484) 3 Up to 3 months US$ 10,029 GBP (9,718) 311 Up to 3 months CHF 2,367 GBP (2,346) 21 Up to 3 months A$ 1,206 GBP (1,198) 8 Up to 3 months NOK 1,899 GBP (1,969) (70) Up to 3 months SEK 108 GBP (110) (2) Up to 3 months DKK 1,586 GBP (1,662) (76) Up to 3 months EUR 9,739 GBP (9,992) (253) 2,481 (1,861) Net forward currency contracts at 31 March 2015 620 Prior year comparative Open forward currency contracts at 31 March 2014 814 (203) Net forward currency contracts at 31 March 2014 611
12(a) Financial Instruments Accounting policies describe how different asset classes of financial instruments are measured and how income and expenses, including fair value gains and losses, are recognised. The following table analyses the fair value amounts of financial assets and liabilities by category and net asset statement heading. No financial assets were reclassified during the accounting period. 2013/14 2014/15
Designated as fair value
through profit & loss
Loans & Receivables
Financial Liabilities at
amortised cost
Designated as fair value
through profit & loss
Loans & Receivables
Financial Liabilities at
amortised cost
£’000 £’000 £’000 £’000 £’000 £’000
Financial Assets 164,275 Fixed Interest Securities 205,604
2,455 Index Linked Securities 2,622 95,610 Equities 95,942
227,190 Pooled Investments 255,081
49,281 Pooled Property Investments 59,824
3,902 Commodities 6,887 576 Options contracts 249 611 Currency Forwards 2,481
13,923 Cash 10,548 2,717 Debtors 2,356
543,900 16,640 0 TOTAL 628,690 12,904 0

London Borough of Redbridge Statement of Accounts 2014/15
105
Financial Liabilities
(486) Options Contracts (247) 0 Index Futures (176)
Currency Forwards (1,861) (2,824) Unsettled trades (2,527)
(633) Creditors (501)
(486) 0 (3,457) TOTAL (2,284) (3,028) 543,414 16,640 (3,457) GRAND TOTAL 626,406 12,904 (3,028) 556,597 636,282
12 (b) Net Gains and Losses on Financial Instruments
31.03.14 31.03.15 £’000 Financial Assets £’000
25,179 Fair value through profit & loss 84,504 (667) Loans and receivables 1,997
24,512 86,501 Financial Liabilities
(14,665) Fair value through profit & loss (23,975)
9,847 TOTAL 62,526
12 (c) Fair Value of Financial Instruments and Liabilities The following table summarises the carrying values of the financial assets and financial liabilities by class of instrument compared with their fair value.
31.03.14 31.03.14 31.03.15 31.03.15 Carrying
Value Fair
Value Carrying
Value Fair
Value £’000 £’000 £’000 £’000
Financial Assets 464,663 543,900 Fair value through profit & loss 493,580 628,690
16,639 16,640 Loans and Receivables 12,774 12,774
481,302 560,540 Total Financial Assets 506,354 641,464 Financial Liabilities
(486) (486) Fair value through profit & loss (2,284) (2,284) (3,457) (3,457) Financial Liabilities at amortised cost (2,527) (2,527)
(3,943) (3,943) Total Financial Liabilities (4,811) (4,811)
477,359 556,994 501,543 636,653
12 (d) Valuation of Financial Instruments carried at fair value The valuation of financial instruments has been classified into two levels, according to the quality and reliability of information used to determine fair values. Level 1 Financial instruments at Level 1 are those where the fair values are derived from unadjusted quoted prices in active markets for identical assets or liabilities. Products classified as level 1 comprise quoted equities, quoted fixed securities, quoted index-linked securities and unit trusts. Level 2 Financial instruments at Level 2 are those where quoted market prices are not available, for example where an instrument is traded in a market that is not considered to be active, or where valuation techniques are used to

London Borough of Redbridge Statement of Accounts 2014/15
106
determine the fair value and where these techniques use inputs that are based significantly on observable market data. Values as at 31 March 2015
Level 1 £’000
Level 2 £’000
TOTAL £’000
Financial Assets Financial Assets at fair value through profit & loss 362,298 266,392 628,690 Loans and receivables 12,774 0 12,774 Total Financial Assets 375,072 266,392 641,464
Financial Liabilities Financial liabilities at fair value through profit & loss (2,284) 0 (2,284) Financial liabilities at amortised cost (2,527) 0 (2,527) Total Financial Liabilities (4,811) 0 (4,811) Net Financial Assets 370,261 266,392 636,653
Assets as at 31 March 2014 Level 1
£’000
Level 2 £’000
TOTAL £’000
Financial Assets Financial Assets at fair value through profit & loss 245,647 298,254 543,901 Loans and receivables 16,403 0 16,403 Total Financial Assets 262,050 298,254 560,304
Financial Liabilities Financial liabilities at fair value through profit & loss (486) 0 (486) Financial liabilities at amortised cost (2,824) 0 (2,824) Total Financial Liabilities (3,310) 0 (3,310)
Net Financial Assets 258,740 298,254 556,994
12(e) Risk and Risk Management The fund’s primary long-term risk is that the fund’s assets will fall short of its liabilities (i.e. promised benefits payable to members). Therefore the aim of investment risk management is to minimise the risk of an overall reduction in the value of the fund and to maximise the opportunity for gains across the whole fund portfolio. The fund achieves this through asset diversification to reduce exposure to market risk and credit risk to an acceptable level. In addition, the fund manages its liquidity risk to ensure that there is sufficient liquidity to meet the fund’s forecast cash-flows. The Authority manages these investment risks as part of its overall pension fund risk management programme. Market Risks Market risk is the risk of loss from fluctuations in equity and commodity prices, interest and foreign exchange rates and credit spreads. The fund is exposed to market risk from its investment activities, particularly through its equity holdings. The level of risk exposure depends on market conditions, expectations of future price and yield movements and the asset mix. The objective of the Fund’s risk management strategy is to identify, manage and control market risk exposure within acceptable parameters, whilst optimising the return on risk. In general, excessive volatility in market risk is managed through the diversification of the portfolio in terms of geographical and industry sector and individual securities. To mitigate market risk, the Authority and the Fund’s investment advisers undertake appropriate monitoring of market conditions and benchmark analysis. Exchange traded option contracts on individual securities are used periodically to manage market risk on equity investments. It is possible for over-the-counter equity derivative contracts to be used in exceptional circumstances to manage specific aspects of market risk.

London Borough of Redbridge Statement of Accounts 2014/15
107
Other Price Risk Other price risk represents the risk that the value of the financial instrument will fluctuate as a result of changes in market prices (other than those arising from interest rate risk or foreign currency), whether those changes are caused by factors specific to the individual instrument or its issuer or factors affecting all such instruments in the market. The fund is exposed to share and derivative price risk. This arises from investments held by the fund for which the future price is uncertain. All securities investments present a risk of loss of capital. Except for shares sold short, the maximum risk resulting from financial instruments is determined by the fair value of the financial instruments. Possible losses from shares sold short are unlimited. The fund’s investment managers mitigate this price risk through diversification and the selection of securities and other financial instruments and other financial instruments is monitored by the Authority to ensure it is within limits specified in the fund’s investment strategy.
Other Price Risk – Sensitivity Analysis Following analysis of historical data and expected instrument return movements during the financial year, in consultation with the fund’s performance monitoring advisers, the Authority has determined that the following movements in market price risk are reasonably possible for the 2014/15 reporting period. Asset Type: Potential
Market movement (+/-) UK Equities 9.78% Overseas Equities 8.70% UK Government Bonds 10.24% UK Corporate Bonds 8.52% Overseas Bonds 8.18% Index-Linked 9.84% Property 2.32% Commodities Cash
16.99% 0.02%
If the market price of the fund investments had increased/decreased in line with the above, the change in the net assets available to pay benefits in the market price would have been as follows:
Price Risk:
Asset Type Value £’000 % Change *
Value on Increase £’000
Value on Decrease £’000
UK Equities 157,376 9.78% 172,767 141,985 Overseas Equities 193,647 8.70% 210,494 176,800 UK Government Bonds 100,303 10.24% 110,574 90,032 UK Corporate Bonds 42,105 8.52% 45,692 38,518 Overseas Bonds Inc. Hedging 63,197 8.18% 68,367 58,027 Index Linked 1,972 9.84% 2,166 1,778 Property 59,824 2.32% 61,212 58,436 Commodities 6,887 16.99% 8,057 5,717 Cash 10,971 0.02% 10,973 10,969
Currency Risk Currency risk represents the risk that the fair value of future cash flows of a financial instrument will fluctuate because of changes in foreign exchange rates. The fund is exposed to currency risk on financial instruments that are denominated in any currency other than the base currency of the fund, i.e. £Sterling. A 5.43% fluctuation in the currency is considered reasonable based on the Fund’s performance monitoring adviser’s analysis of long-term historical movements in the month-end exchange rates over a rolling 36-month period. A 5.43% strengthening/weakening of the pound against the various currencies in which the fund holds investments would increase/decrease the net assets available to pay benefits as follows:

London Borough of Redbridge Statement of Accounts 2014/15
108
Currency Risk (by asset class):
Asset Type Value £’000 % Change *
Value on Increase £’000
Value on Decrease £’000
Overseas Equities 193,647 5.43% 204,162 183,132 Overseas Bonds 24,823 5.43% 26,171 23,475 Overseas Alternatives 6,887 5.43% 7,261 6,513
* % change has been rounded to 0.01 decimal point
Credit Risk Credit risk represents the risk that the counterparty to a transaction or a financial instrument will fail to discharge an obligation and cause the fund to incur a financial loss. The market values of investments generally reflect an assessment of credit in their pricing and consequently the risk of loss is implicitly provided for in the carrying value of the fund’s financial assets and liabilities. In essence the fund’s entire investment portfolio is exposed to some form of credit risk. The selection of high quality counterparties, brokers and financial institutions minimises credit risk that may occur through the failure to settle a transaction in a timely manner. Contractual credit risk is represented by the net payment or receipt that remains outstanding and the cost of replacing the derivative position in the event of a counterparty default. The residual risk is minimal due to the various insurance policies held by the exchanges to cover defaulting counterparties. Credit risk on over-the-counter derivative contracts is minimised as counterparties are recognised financial intermediaries with acceptable credit ratings determined by a recognised rating agency. Liquidity Risk Liquidity risk represents the risk that the fund will not be able to meet its financial obligations as they fall due. The Authority therefore takes steps to ensure that the pension fund has adequate cash resources to meet its commitments. The pension fund has immediate access to its cash holdings that are invested by the Authority. The levels of cash held are reviewed by the Authority as part of the periodic cash-flow forecasting and form part of the fund’s investment strategy. The fund’s investment strategy ensures that the majority of the fund is invested in assets that can be sold at short notice to avoid any liquidity risk.
13. Fund Management
As at 31 March 2015, the fair value of assets under management was £636 million. The Fund has undertaken work in conjunction with the Fund’s external adviser to implement a long-term strategy to match the objective of being fully funded. The structure of the Fund resulted in a strategic benchmark of 80% equities (including property and cash) and 20% bonds. As set out in the Pension Fund’s Statement of Investment Principles, the asset allocation may be varied and rebalancing may be suspended at the discretion of the Pension Fund Investment Panel. As at 31 March 2015, the Fund was allocated as shown in the table below:
Manager
Mandate
Value of Portfolio
% of the Fund
£’000 % Standard Life Fixed Income Mandate 154,540 24.3 Newton High Alpha Mandate 151,659 23.8 SSgA Global Equity Index Tracking Mandate 230,168 36.2 BlackRock Asia Pacific Equity Mandate 16,092 2.5 Schroders Emerging Markets Equity Mandate 22,661 3.6 BlackRock Property 22,433 3.5 Schroders Property 37,602 5.9 LBR Cash 1,127 0.2
636,282 100

London Borough of Redbridge Statement of Accounts 2014/15
109
14. Investments as at 31 March 2015 Investments: the Fund’s asset mix was as follows:
2013/14 2014/15
Equities 57% 55 %
Bonds 30% 33 % Property 9% 9 %
Cash and other investments 4% 3 %
100% 100%
15. Statement of Investment Principles The Authority is required by law to prepare and publish a Statement of Investment Principles (SIP). This Statement sets out the Fund’s policy on a range of matters relating to the investments and management of the Pension Fund and is regularly reviewed and updated. A copy of the SIP can be found on the Authority’s website www.redbridge.gov.uk.
16. Current Assets and Liabilities 2013/14 2014/15
£’000 £’000 Contributions due 193 130 Prepaid Expenses 43 0 Total of Current Assets 236 130 Accrued benefits (49) (50) Accrued expenses (584) (451) Total of Current Liabilities (633) (501)
17. Stock Lending The Fund does not participate in stock lending arrangements.
18. Related Party Transactions During the year no Councillors or Chief Officers with direct responsibility for Pension Fund issues have undertaken any declarable transactions with the Pension Fund, other than the following.
• Administrative services undertaken by the Authority of the Pension Fund were £449,732 (£420,309 in 2013/14).
• Investment services undertaken by the Authority of the Pension Fund were £117,100 (£115,900 in 2013/14).
There is one member of the Pension Fund Investment Panel (Councillor O’Shea) that is in receipt of pension benefits from the Redbridge Pension Fund. Each member of the Pension Fund Investment Panel is required to disclose their interest at each meeting. 19. Actuarial Valuation In 2014/15, the contribution paid by the Authority as an employer was determined following an actuarial valuation of the Fund as at the 31 March 2013. The valuation as at 31 March 2013 set the employer’s contribution rates for the years 2014/15, 2015/16 and 2016/17. The actuarial method used by the Actuary is known as the “projected unit method”. The key feature of this method is that in assessing the future service cost, the Actuary calculates the contribution rate, which meets the cost of benefits accruing in the year after the valuation date. This is the same method adopted at the previous valuation and is an appropriate method for a fund which is open to new members.
For this valuation the actuary adopted a market value approach whereby assets were valued initially on a market value basis and liability assumptions were derived from gilt yields. Those assumptions, which have the most significant effect on the results of the valuation, are:
Assumption Rate The rate of increase in pensionable earnings 2.5% ‘’Gilt-based’’ discount rate 5.0% The level of increase in earnings growth 3.3%
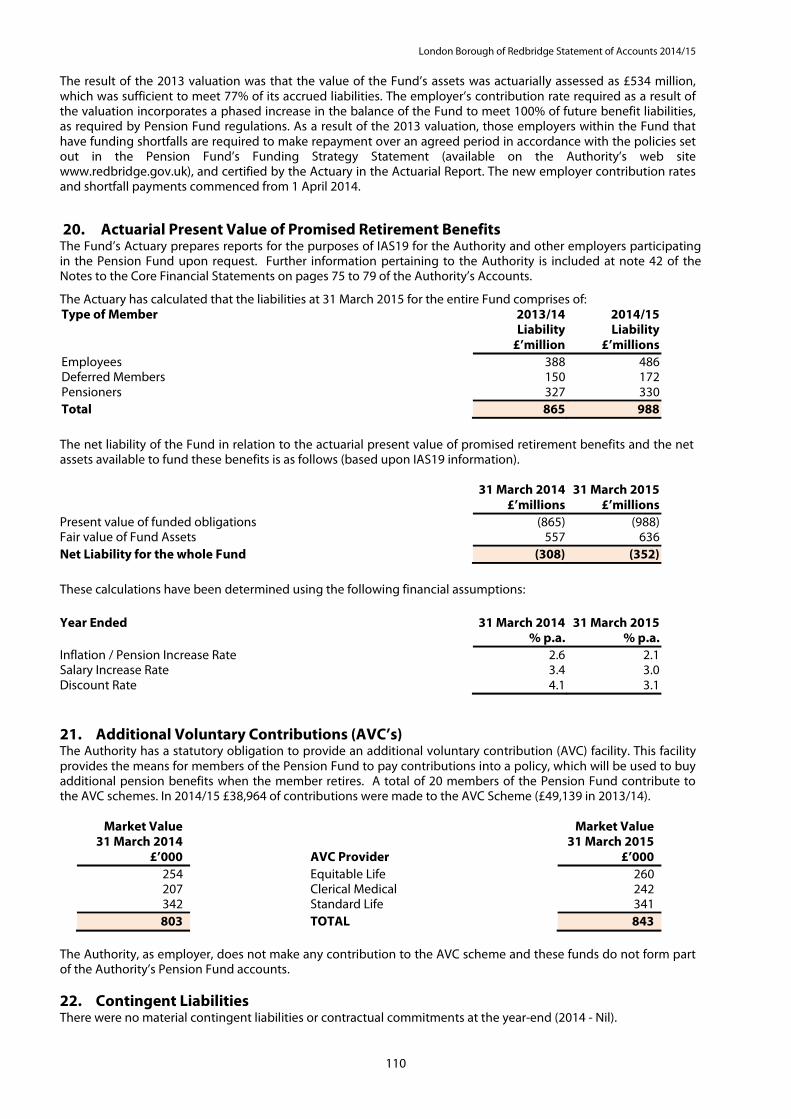
London Borough of Redbridge Statement of Accounts 2014/15
110
The result of the 2013 valuation was that the value of the Fund’s assets was actuarially assessed as £534 million, which was sufficient to meet 77% of its accrued liabilities. The employer’s contribution rate required as a result of the valuation incorporates a phased increase in the balance of the Fund to meet 100% of future benefit liabilities, as required by Pension Fund regulations. As a result of the 2013 valuation, those employers within the Fund that have funding shortfalls are required to make repayment over an agreed period in accordance with the policies set out in the Pension Fund’s Funding Strategy Statement (available on the Authority’s web site www.redbridge.gov.uk), and certified by the Actuary in the Actuarial Report. The new employer contribution rates and shortfall payments commenced from 1 April 2014.
20. Actuarial Present Value of Promised Retirement Benefits
The Fund’s Actuary prepares reports for the purposes of IAS19 for the Authority and other employers participating in the Pension Fund upon request. Further information pertaining to the Authority is included at note 42 of the Notes to the Core Financial Statements on pages 75 to 79 of the Authority’s Accounts.
The Actuary has calculated that the liabilities at 31 March 2015 for the entire Fund comprises of: Type of Member 2013/14
Liability £’million
2014/15 Liability
£’millions Employees 388 486 Deferred Members 150 172 Pensioners 327 330 Total 865 988
The net liability of the Fund in relation to the actuarial present value of promised retirement benefits and the net assets available to fund these benefits is as follows (based upon IAS19 information). 31 March 2014
£’millions 31 March 2015
£’millions Present value of funded obligations (865) (988) Fair value of Fund Assets 557 636 Net Liability for the whole Fund (308) (352)
These calculations have been determined using the following financial assumptions: Year Ended 31 March 2014
% p.a. 31 March 2015
% p.a. Inflation / Pension Increase Rate 2.6 2.1 Salary Increase Rate 3.4 3.0 Discount Rate 4.1 3.1 21. Additional Voluntary Contributions (AVC’s) The Authority has a statutory obligation to provide an additional voluntary contribution (AVC) facility. This facility provides the means for members of the Pension Fund to pay contributions into a policy, which will be used to buy additional pension benefits when the member retires. A total of 20 members of the Pension Fund contribute to the AVC schemes. In 2014/15 £38,964 of contributions were made to the AVC Scheme (£49,139 in 2013/14).
Market Value 31 March 2014
£’000
AVC Provider
Market Value 31 March 2015
£’000 254 Equitable Life 260 207 Clerical Medical 242 342 Standard Life 341 803 TOTAL 843
The Authority, as employer, does not make any contribution to the AVC scheme and these funds do not form part of the Authority’s Pension Fund accounts. 22. Contingent Liabilities There were no material contingent liabilities or contractual commitments at the year-end (2014 - Nil).

London Borough of Redbridge Statement of Accounts 2014/15
111
Annual Governance Statement 2014/15
Each year the Authority is required by law to produce a statement that details the framework for making decisions and controlling the resources of the Authority. The statement covers both the Authority’s governance arrangements as well as internal control issues. This statement should enable stakeholders to have an assurance that decisions are properly made and public money is being properly spent on taxpayers’ behalf. The statement below complies with the Accounts and Audit Regulations 2011 as amended. Scope of responsibility The Council is responsible for ensuring that its business is conducted in accordance with the law and proper standards, and that public money is safeguarded and properly accounted for, and used economically, efficiently and effectively. The Council also has a duty under the Local Government Act 1999 to make arrangements to secure continuous improvement in the way in which its functions are exercised, having regard to a combination of economy, efficiency and effectiveness. In discharging these obligations, the Council is responsible for putting in place proper arrangements for the governance of its affairs, facilitating the effective exercise of its functions, which includes arrangements for the management of risk. The Council local Code of Corporate Governance is consistent with the principles of the CIPFA/SOLACE Framework, Delivering Good Governance in Local Government. A copy of the Code is on our website. The purpose of the Governance Framework The Governance Framework comprises the systems, processes, culture and values, by which the Council conducts its activities to meet its objectives. The Council’s systems and controls are regularly reviewed to reflect changing needs. The local Code has been incorporated into the Constitution as a single point of reference for the Authority's framework for its Governance arrangements. The Governance Framework has been in place for the year ended 31 March 2015, and up to the date of approval of the Statement of Accounts. It is designed to manage risk to a reasonable level but it cannot eliminate all risk of failure to achieve policies, aims and objectives and can therefore only provide reasonable and not absolute assurance of effectiveness. The system of internal control is based on an on-going process designed to identify and prioritise the risks to the achievement of Redbridge’s policies, aims and objectives, to evaluate the likelihood of those risks being realised and the impact should they be realised, and to manage them efficiently, effectively and economically.
The key elements of the systems and processes that comprise the Authority’s governance arrangements are described in more detail in this statement. Vision and Purpose The Corporate Strategy 2014-18 was agreed in November 2014. The strategy sets the vision “Ambitious for Redbridge”. Underlying this there are four corporate priorities:
1. Increase fairness and respond to the aspirations of the Borough. 2. Empower our communities to help shape our Borough and the services we deliver. 3. Improve quality of life and civic pride amongst our communities. 4. Transform our Council in tough times to be dynamic and responsive to the challenges of the future.
The vision and priorities provide the strategic direction and values for the Council, linking the strategies for delivery, service planning and individual performance planning. Service Plans set out how services will contribute to the delivery of the Corporate Strategy within that year, along with resource and key performance information. Service Plans are supported by team work programmes and individual performance plans that ensure that all members of staff contribute to achieving the objectives within the Corporate Strategy. Performance Management and Reporting The performance management framework assists in monitoring progress in the way in which the Authority’s strategies are translated into action and demonstrates the effectiveness of those actions. It also helps to identify if any risks are materialising when indicators do not show the level of progression anticipated. Through the service planning process, performance indicators are reviewed annually to ensure they remain fit for purpose, and challenging targets are set using past performance and benchmarking information. The priorities from

London Borough of Redbridge Statement of Accounts 2014/15
112
the Corporate Strategy will be measured by a revised set of indicators, identified as part of the 2015/16 target setting exercise. The fundamentals of performance management are embedded in the way the Authority operates:
• There is a corporately defined process that ensures Service Plans are linked to corporate priorities, and in
turn are linked to arrangements for individual appraisal and personal development. • The performance management system (Corvu) ensures that the Authority has a clear and consistent picture
of performance, using a ‘traffic light’ system to highlight performance. • All Cluster Management Teams manage service delivery and monitor their performance indicators (PIs). • Management Board, Cabinet Members and Overview Committee receive regular performance reports that
highlight where performance is below target and the actions being taken to improve.
The Constitution This sets out the roles and responsibilities of Members and Officers. It provides details about how decisions are made and who can make them. It also contains the rules for managing our finances and resources effectively. The Council’s rules and regulations form part of the Constitution. The Constitution, published on the Authority’s website, sets out how the Council operates, as detailed in documents such as Standing Orders and the Scheme of Officer Delegation. The Scheme of Delegation states who is authorised to make decisions in particular areas. Alongside this the Authority has Financial Regulations, which provide details of officers’ responsibilities for the Authority’s control environment relating to income, expenditure, internal control, risk management and partnerships. To support officers when they are making purchases the Authority has developed Contract Standing Orders. The Officer Scheme of Delegations, Contract Standing Orders and Financial Regulations are regularly kept under review. Codes of Conduct The Code of Conduct for Members, under the Localism Act 2011, was adopted by the Council and came into effect from 1st July 2012. Training on the Code has been provided to Members, and further sessions are arranged as considered necessary by the Monitoring Officer. Members are required to complete a Declaration of Financial and Other Interests following the introduction of the new Code, or on taking Office, and to keep the Declaration up to date. Members are also required to declare at meetings any disclosable pecuniary, personal or prejudicial interests they have in matters under consideration by any committee. Members’ Declarations of Financial and Other Interests (which will include any hospitality or gift they have received valued at £25 or more), together with details of interests they have declared at meetings, are available for inspection on the Council Website. The Standards Committee receives a schedule at each of its meetings containing information that enables it to monitor the operation of the Code of Conduct. The Code of Conduct for Employees is available on the Council’s intranet site. It explains that citizens and service users expect high standards of all employees and provides guidance on how to achieve this. Employees are made aware of this Code of Conduct through the induction process. Audit Committee The terms of reference for the Authority’s Audit Committee were reviewed against the revised CIPFA guidance during the year and found to be in line with current good practice for audit committees. The Audit Committee has a comprehensive work programme that covers Corporate Governance (including an overview of the Annual Governance Statement); Financial Management; Internal Control and Risk Management; Internal Audit performance; Anti-Fraud and Whistleblowing; scrutiny of the Treasury Management Strategy and policies; and External Audit performance and quality. The Audit Committee receives and challenges reports from management and auditors. Each year the Audit Committee assesses its effectiveness against CIPFA guidance and also produces an annual report summarising its work. The latest annual report can be found on the Council’s website. Risk Management The Authority has embedded risk management processes throughout its structure. A Risk Management Policy and Strategy is agreed by Management Board and Cabinet on an annual basis and both receive regular reports on the progress made in managing those risks identified at a corporate level. Similarly, the Audit Committee also receive regular reports and are able to forward their comments to Cabinet for consideration. At operational level, risk is assessed and managed both at cluster and service area levels on a regular basis. Risks identified at corporate level are used to inform the assessments at cluster and service area. Likewise, overarching risks from these areas can be used in the corporate assessment.

London Borough of Redbridge Statement of Accounts 2014/15
113
Risk identification and management processes are also in place for projects, partnerships and contracts. Given the growing use of partnerships to deliver services, the processes of risk identification and management have been enhanced to reflect the greater number and complexity of such arrangements. Compliance with policies, laws and regulations The Authority has a number of statutory officers. The role of Head of Paid Service is undertaken by the Chief Executive; the role of Section 151 officer (Local Government Act 1972) is undertaken by the Director of Finance and Resources (or in his absence by the Chief Financial Services Officer); and the role of Monitoring Officer is undertaken by the Borough Solicitor and Secretary. Each has the power, and in some circumstances the duty, to refer matters to Cabinet if a breach of regulation is possible. These officers form part of the Management Board. None of these officers have been required to use this specific power during the year. The statutory officers provide professional advice on all key decision-making reports to ensure legal, financial, risk management, procedure and equality implications are addressed. Under the provisions of the Children Act 2004 the Local Authority also has a Statutory Officer with responsibility for Children’s Services. This role is carried out by the Director of Children’s Services. Likewise the Authority has a lead Member for Children Services in the Authority's Cabinet with this portfolio. The Authority has a Director, and a Lead Member, with responsibility for Adult Social Services (Director of Adult Social Services and Housing) to meet its requirements under the Local Authorities (Social Services) Act 1970, and a Director of Public Health, and Cabinet Member responsible for Public Health matters, to meet its obligations under the Health and Social Care Act 2012. The Authority has a number of policies in place such as treasury management policies, money laundering policy and a variety of employment policies and procedures, which are kept under regular review and updated as necessary. Counter Fraud including Whistle-blowing The Authority’s Anti-Fraud and Corruption Strategy was reviewed during the year and revised to reflect the requirements of CIPFA’s new Code of Practice on Managing the Risk of Fraud and Corruption. The key components that support this Strategy are:
• Whistleblowing arrangements that are publicised on the intranet for employees and a fraud reporting hotline published on the website for use by the general public. Reports on the outcomes of referrals are regularly submitted to management and the Audit Committee to ensure that appropriate actions are taken to counter proven allegations.
• Delivering a programme of anti-fraud training and guidance, including a council wide e learning tool which has been rolled out to schools.
• Participation in the National Fraud Initiative (NFI), a computerised data matching exercise conducted by the Cabinet Office, designed to detect fraud perpetrated on public bodies.
• The tenancy fraud sub-letting team use data matching and referrals to identify and investigate instances of fraudulent sub-letting.
• A recently established Governance Group meets regularly to consider allegations of fraud to ensure that appropriate action is taken.
Complaints process The Authority has a recognised, accessible complaints process which provides valuable feedback. The complaints process is in two stages, to enable the public to escalate their complaints if they are dissatisfied with the answer they receive. Details of complaints are monitored by Members and Officers. Members also receive enquiries and complaints via their surgeries, public meetings or by correspondence. The Authority has a team of staff supporting Members in addressing these queries to ensure that the public receive an appropriate answer. If not satisfied by the Authority’s process, members of the public can complain to the Local Government Ombudsman. Responding to these complaints is dealt with by Service Areas, but co-ordinated centrally. Complaints are analysed and assessed so that the organisation can identify trends and issues and if necessary, put in place changes and improvements to seek to prevent the problem recurring. Information Governance The Council has strong arrangements to promote information governance across the Council. The Lead Member for Finance and Support Services has incorporated information governance into their portfolio, and there are regular reports to Audit Committee. A report to Cabinet on Information Governance was presented on 8th April 2014. Elected members have been trained in information governance, and a session on data protection and information security was held for the new intake of members in June 2014. Additionally within the Council there is a high-level Information

London Borough of Redbridge Statement of Accounts 2014/15
114
Governance Board, regular reporting to Management Board, and numerous communications and training events. In 2014/15, the following successes were achieved:
- The use of Egress Switch as an encrypted email tool has been embedded within the organisation. - The Information Security policy and other strategic policies including the Child Sex Exploitation Policy
was deployed to all staff through the MetaCompliance online policy acceptance solution - An electronic Information Asset Register has been developed and published, with Information Asset
Owners identified and trained. Work continues on the manual Information Asset Register. Training and Development Members have a support officer and a development program to keep them up to date with changes and to support training needs. Training is supplemented by information through briefings, conferences and bulletins. The Council has a commitment that every member of staff receives a six monthly appraisal to discuss performance, targets and personal development. The Authority provides a range of training opportunities for managers and staff to ensure that they can deliver excellent service. In addition managers are required to undertake Discipline, Grievance and Dignity at Work training on the respective policies and procedures that are in place. The Council launched a People Strategy in 2014/15 which sets out how employee’s productivity can be maximised to help deliver key priorities. The Peoples Strategy can be found on the Council’s website. Communication and engagement Communication is key to the Council being able to:
• carry out its core business efficiently and effectively; • ensure residents know how they can access important and essential information and are aware of local
issues; • encourage residents to change their behaviour to meet our key objectives and save money; • let local people know what their Council Tax is funding and how we are performing; • encourage people to get involved in the democratic process, attend meetings and give their views.
The Council has a number of communication methods it uses to inform and collaborate with its residents:
• Redbridge Life is the quarterly printed publication which is distributed to all homes and businesses across the Borough.
• Our website Redbridge i has over 107,000 registered users, which is increasing by an average of over 1,500 a month. The website is interactive and allows local people to find information on all our services as well as pay bills, apply for school places and report local street scene issues. The Your Account function provides registered users with more detailed personalised information relating to the area in which they live.
• A number of e-newsletters have been developed to target specific audiences about issues and information that they find interesting such as crime and community safety, business news, and jobs and training opportunities. Redbridge Live is the flagship e-newsletter which is sent monthly to over 30,000 subscribers.
• Using social media increasingly to talk to and respond to residents' queries and concerns through a number of Twitter feeds and Facebook pages.
• DataShare is our online tool which enables service areas to publish all their non-confidential data about finances and performance, including transactions above £500.
Redbridge i provides online community engagement functions including E-forums and online surveys. The Authority exercises a ‘digital by design’ approach to consultation, however where necessary, services use a wide range of consultation methods to further assess public opinion and gather feedback on customer experience. The Authority also undertakes an annual online user satisfaction survey that provides services with feedback on the Authority’s performance and is used to inform service delivery and policy development. In recent years, the Council has consulted a range of users on its Budget plans using its own Budget consultation tool, YouChoose. Budget Consultation demonstrates the Council’s commitment in engaging the many different communities in Redbridge. To help shape the annual budget, groups that we do not regularly engage with are targeted directly through a series of meetings, workshops and focus groups. The monthly Local Forum programme offers a new form of community participation to involve residents and communities in decision making. Local Forums combine informal and formal opportunities for residents to engage

London Borough of Redbridge Statement of Accounts 2014/15
115
with and question Members and officers from the Council, Public and Third Sector services, and are designed to maximise outcomes for attendees. Partnerships Under the Health and Social Care Act 2012 the local authority was required to establish a Health and Wellbeing Board for the area. From April 2013 the Authority’s Health and Wellbeing Board became a statutory committee of the Council. This board differs significantly from other statutory committees in that the legislation also stipulates the statutory membership (which notably includes Council officers) of which this is the minimum requirement. It also has the authority to appoint other members to the board, which is up to ‘local determination’ by the Council. This membership has now been agreed. The Health, Social Care & Civic Pride Committee will build on the success of previous partnership arrangements. The Redbridge Safer Communities Partnership Board, including the Police, Probation, Health and Youth Justice Services, leads on reducing crime and making Redbridge a safer place to live. The Authority also has a range of partnerships with other bodies, which help provide cohesive services to local residents. There are sound governance arrangements in place for the great majority of these partnerships; the Authority is keen to promote good practice in all partnerships. The Authority works with its neighbours in East London in a group called “East London Solutions” which is dedicated to achieving efficiencies and improvements through joint working and procurement exercises across the six North East London Boroughs. The Authority has recently entered into a formal agreement to be a member of the North East London Strategic Alliance (NELSA) made up of six London Boroughs, Redbridge, Waltham Forest, Enfield, Havering, Newham and Barking & Dagenham. NELSA has been developed to take advantage of the opportunities within north east London such as housing and economic growth. Equalities Under the requirements of the Public Sector Equality Duty (PSED) the Authority has published its Equality Objectives for 2012 to 2016 which can be found on the Council’s website.
Service areas set actions to align to these objectives. The objectives will also be reflected in strategies and action plans across services. The Equality and Diversity Strategy is being reviewed in 2015 which may include setting new equality objectives.
Information has also been published which shows how the Authority meets the PSED to:
• Eliminate discrimination; • Promote Equality of Opportunity; and • Promote positive relations between communities.
As part of its budget development process the Authority considers the impact of the decisions it makes in terms of equality and risk as set out within its key strategies and as required by statute. This includes requirements for consultation and equality impact assessments, where necessary, including action plans to mitigate adverse impacts.
Proposals contained in committee reports will advise members of the equality implications on groups with protected characteristics under the Equality Act in order that their decisions are informed.
Role of the Chief Financial Officer In statute the Chief Financial Officer (CFO) is the organisation’s senior executive who is charged with leading and directing financial strategy and administration, occupying a pivotal role, both for external stakeholders and within the Leadership Team. At Redbridge the Director of Finance and Resources (DFR) holds this role, however as this role is at present being covered by an interim officer the CFO role is temporarily being covered by the Chief Financial Services Officer. The Council fully complies with the requirements and principles as set out in the CIPFA Statement on the Role of the Chief Financial Officer. Internal and External Audit Internal Audit and External Audit (PricewaterhouseCoopers LLP) operate an effective co-ordination arrangement to maximise the assurance derived from the audit scrutiny of the Authority. In accordance with the Audit Commission’s Code of Audit Practice, External Audit seeks to place reliance upon Internal Audit’s work in the assessment of risk, core accounting processes, and the effectiveness of internal control. An effective Internal Audit function is a core part of the

London Borough of Redbridge Statement of Accounts 2014/15
116
Authority’s arrangements to ensure the proper conduct of its financial affairs. Internal Audit’s priorities are risk based and agreed with the Director of Finance and Resources, following consultation with the Chief Executive, Directors, Chief Officers and External Audit as part of the annual planning process. The Chief Internal Auditor is authorised to complete a programme of audit reviews within the Authority. To assist in the accomplishment of this programme, the Financial Regulations of the Authority give authority for Internal Auditors to have full, free and unrestricted access to all Authority assets, records, documents, correspondence and personnel for the purposes of that audit. Recommendations arising from the work of both internal and external audit are discussed and agreed with management, including acceptable timescales for their implementation. The Chief Internal Auditor reports on the outcomes of the annual programme of audit work to management and Members, especially the Audit Committee. The Authority fully complies with the requirements and principles as set out in the CIPFA Statement on the Role of the Head of Internal Audit and there are no issues of significant non-conformance with the Public Sector Internal Audit Standards that need to be included in this statement. The Authority’s External Auditor, PricewaterhouseCoopers LLP, has an annual audit plan in place that is risk based and focuses on undertaking areas of work to enable them to carry out their duties in providing an opinion on the Authority’s financial statements and whether or not we have appropriate arrangements in place to deliver value for money. After the completion of the last Audit Plan, the Authority received an unqualified opinion on its statement of accounts and an unqualified value for money conclusion, providing further assurance of the arrangements that we have embedded within the organisation. Scrutiny Function and Relevant Committees From May 2013 a revised committee structure was introduced that includes an Overview Committee and 5 service committees which have both executive advisory and non- executive decision making functions as well as the ability to undertake a pre-decision review role. The five committees, which are Strategy and Resources; Children and Young People; Neighbourhoods; Health, Social Care & Civic Pride; and Licensing, also have delegated decision making powers in respect of non-executive matters. The roles of the Committees and Panels can be found on the Council’s website. Review of effectiveness The Council regularly reviews the effectiveness of its governance framework including the system of internal control. The review of effectiveness is informed by the work of the Directors and Chief Officers within the Authority who have responsibility for the development and maintenance of the governance environment, the Chief Auditor’s annual report, and also by comments made by the external auditors and other review agencies and inspectorates. Directors and Chief Officers, having made enquiries with relevant senior officers, are required to complete an assurance statement to confirm that proper governance and internal control arrangements are in place for their areas of responsibility. These statements should also identify any significant areas of concern or weakness within each cluster. The AGS Working Group sought evidence to substantiate the assessment of controls being sound. A Key Controls Checklist was used to undertake a review of the adequacy and effectiveness of the internal control arrangements. As part of this process some areas for improvement were identified but none were significant enough to be deemed as control weaknesses. The Chief Internal Auditor’s opinion is a contributory factor in reviewing the effectiveness of the Annual Governance Statement. Based on the audit work undertaken in 2014/15, and provided that recommendations are satisfactorily implemented, the Chief Auditor concludes that the Council’s overall control framework is generally sound, the core financial systems continue to operate effectively and there are no fundamental breakdowns of controls resulting in material discrepancy. Governance and internal control issues requiring improvement The areas identified for improvement in the 2013/14 AGS were as follows:
• Contract Management • Project Management; • Business Continuity; • Information Governance and Data Quality; • Risk Management; and • Impact on Internal Controls resulting from budget reductions

London Borough of Redbridge Statement of Accounts 2014/15
117
There has been continuous improvement to these areas in 2014/15 and although good progress has been made these continue to be included in the AGS action plan to ensure that the degree of progress is not lost and further improvements are delivered. Other improvements made during 2014/15 to Governance arrangements include:
• The establishment of a Governance Group consisting of the Interim Director of Finance and Resources, the Chief Financial Services Officer (Section 151 Officer), the Borough Solicitor and Secretary, and the Chief Auditor.
• Development of a Corporate Assurance Framework. • Establishment of a Pensions Board. • Review of decision making and governance at member level.
An Action Plan attached to this Statement sets out areas of further improvements to the internal controls in 2015/16 that will be monitored by the Audit Committee during the year. Based on the above, we are able to report that there were no significant weaknesses in the Council’s governance and control framework that affected achievement of our strategic objectives in 2014/15. Signed …………………………………………………………….. Leader of the Council
…………………………………………………………….. Chief Executive …………………………………………………………….. Date

Annual Governance Statement 2014/15 Action Plan (actions for 2015/16) Number Area to develop Ongoing Action Timescales Lead Officer 1 Continue to strengthen and embed Project management
across the Authority. • Management Board to continue to identify and monitor business
critical and Transformation projects.
• Key Corporate and Capital Projects to be reported to Management Board on a monthly basis, with improved information that reflects the full costs of projects and more accurately highlights any slippage.
• Directors to continue to monitor and challenge their own projects within their Cluster.
• The Policy, Performance and Equalities Team to provide project managers with support and advice on the application of the Authority's project management processes.
• Guidance to be periodically updated and published on the Council’s intranet
Ongoing
Tom Hook
2 Improve contract management monitoring. • Strategic Procurement to continue to identify and provide training to officers across the Authority who have contract management and monitoring responsibilities, including the impact of new legislation relating to the Public Services (Social Value) Act 2012 and changes in EU Procurement Directives.
• A corporate review of the Council’s contracting and commissioning arrangements to be undertaken as part of a wider review of Rethinking Support Services.
• The 2015/16 Audit Plan includes a number of days to look at various specific aspects of contract management including compliance with Contract Standing Orders and contract monitoring.
Ongoing March 2016
Richard Szadziewski
3 Build upon the Authority’s ability to respond to any incident that could impact upon its activities or disrupt service delivery.
• Services to continue to review and test their business continuity arrangements. This to be supported by the Emergency Planning and Business Continuity (EP & BC) Team, and assurance provided via the Corporate BC Group (ongoing task).
• Corporate arrangements are being revised by the EP&BC Team and other key Service Areas.
• A counter terrorism exercise to be undertaken.
Ongoing July 2015 December 2015
Simon Barry
118
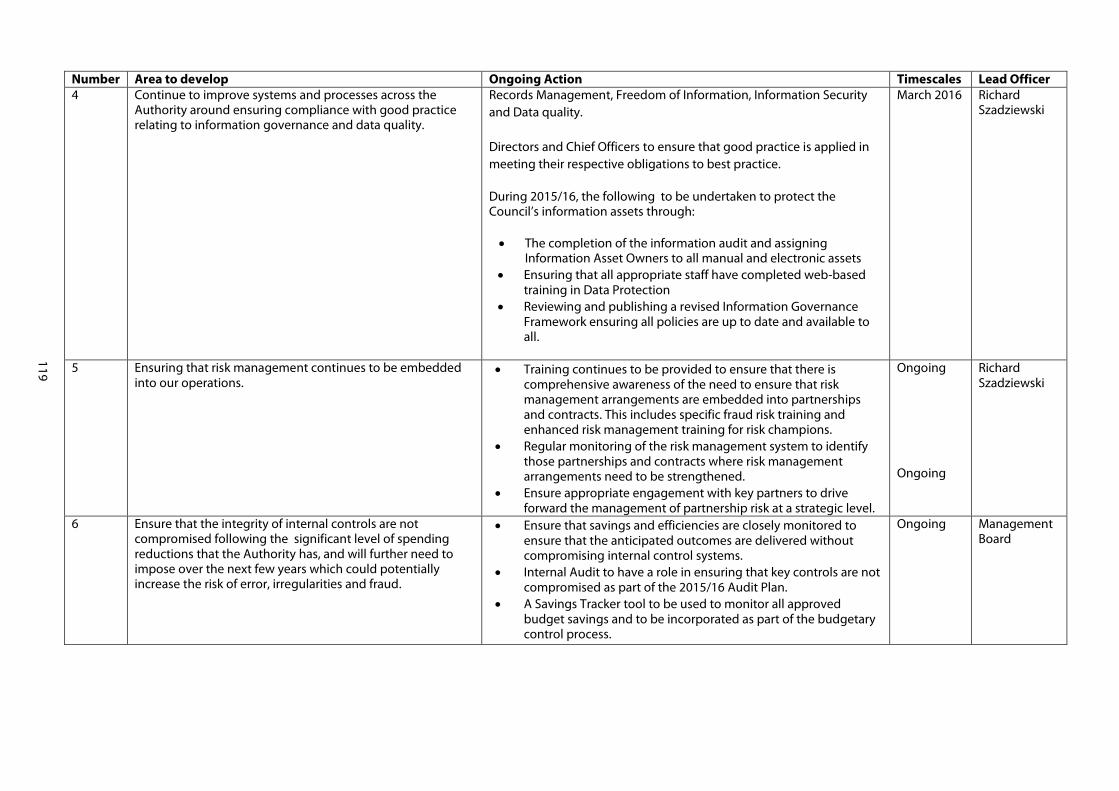
Number Area to develop Ongoing Action Timescales Lead Officer 4 Continue to improve systems and processes across the
Authority around ensuring compliance with good practice relating to information governance and data quality.
Records Management, Freedom of Information, Information Security and Data quality. Directors and Chief Officers to ensure that good practice is applied in meeting their respective obligations to best practice. During 2015/16, the following to be undertaken to protect the Council’s information assets through: • The completion of the information audit and assigning
Information Asset Owners to all manual and electronic assets • Ensuring that all appropriate staff have completed web-based
training in Data Protection • Reviewing and publishing a revised Information Governance
Framework ensuring all policies are up to date and available to all.
March 2016 Richard Szadziewski
5 Ensuring that risk management continues to be embedded into our operations.
• Training continues to be provided to ensure that there is comprehensive awareness of the need to ensure that risk management arrangements are embedded into partnerships and contracts. This includes specific fraud risk training and enhanced risk management training for risk champions.
• Regular monitoring of the risk management system to identify those partnerships and contracts where risk management arrangements need to be strengthened.
• Ensure appropriate engagement with key partners to drive forward the management of partnership risk at a strategic level.
Ongoing Ongoing
Richard Szadziewski
6 Ensure that the integrity of internal controls are not compromised following the significant level of spending reductions that the Authority has, and will further need to impose over the next few years which could potentially increase the risk of error, irregularities and fraud.
• Ensure that savings and efficiencies are closely monitored to ensure that the anticipated outcomes are delivered without compromising internal control systems.
• Internal Audit to have a role in ensuring that key controls are not compromised as part of the 2015/16 Audit Plan.
• A Savings Tracker tool to be used to monitor all approved budget savings and to be incorporated as part of the budgetary control process.
Ongoing Management Board
119

London Borough of Redbridge Statement of Accounts 2014/15
120
Glossary Actuary An independent consultant who advises the Authority on the financial impact and uncertainty of the Pension Fund.
Actuarial Valuation The Actuary reviews the assets and liabilities of the Pension Fund and reports to the Authority on the fund’s financial position and recommended employers’ contribution rates.
Appropriation The transfer of ownership of an asset, from one Service to another, at an agreed (usually market or outstanding debt) value.
Accruals The amounts by which receipts or payments are increased in order to record the full income and expenditure incurred in an accounting period.
Amortisation The writing off of a charge or loan balance over a period of time.
Balance Sheet A statement of all the assets, liabilities and other balances of the Authority at the end of an accounting period.
Business Improvement District A defined area within which businesses pay additional business rates in order to fund improvements within the districts boundary.
Budget A forecast of future expenditure plans for the Authority. Detailed revenue budgets are prepared each year and it is on the basis of these figures that the Council Tax is set. Budgets are revised towards the year-end to take account of inflation, changes in patterns of services, and other factors.
Capital Charge A depreciation charge to Service Revenue Accounts to reflect the cost of non-current or intangible assets used in the provision of the service.
Capital Expenditure Expenditure on the acquisition of non-current or intangible assets, or expenditure that adds to the value of an existing asset.
Capital Adjustment Account Represents amounts set aside from revenue resources or capital receipts to finance expenditure on assets or for the repayment of external loans and certain other capital financing transactions.
Capital Receipt Income received from the sale of a capital asset such as land or buildings.
Carrying Value (Book Value) For Financial Instruments, this value is the amount to be recognised on the Balance Sheet. Financial Assets and Liabilities need to be recognised in the Balance Sheet at fair value or at amortised cost. Cash Comprises cash in hand and available-on-demand deposits. Cash equivalents Are short-term, highly liquid investments that are readily convertible to known amounts of cash and which are subject to an insignificant risk of changes in value. Cash flow A statement that shows the changes in cash and cash equivalents during the financial year...

London Borough of Redbridge Statement of Accounts 2014/15
121
Collateral Assets pledged by a borrower to secure a loan. Collection Fund A Statutory Account, which receives Council Tax, Non-Domestic Rates and Government Grants to cover the costs of services, provided by Redbridge and its precepting authorities. Community Assets Assets that the Local Authority intends to hold in perpetuity, that have no determinable useful life and that may have restrictions on their disposal. Examples of Community Assets are parks and historic buildings.
Community Infrastructure Levy A levy that local authorities can charge on new developments in their area. The money can be used to support development by funding infrastructure that the Authority, local community and neighbourhoods want.
Comprehensive Income and Expenditure Statement A Statement showing the net cost of the Authority’s services during the year. It demonstrates how costs have been financed from general Government Grants and Income from Local Taxpayers. Contingent Liability Money set aside to fund future expenditure that is dependent upon the outcome of uncertain events.
Credit Ratings for Investments A scoring system used by credit rating agencies such as Fitch, Moodys and Standard and Poors to indicate the credit worthiness and other factors of Governments, Banks, Building Societies, and other financial Institutions.
Creditors Amount of money owed by the Authority for goods and services received.
Curtailment For a defined benefit pension scheme, an event that reduces the expected years of future service of employees or for a number of employees, the accrual of defined benefit for some or all of their entitlement. Examples include: - • Termination of employees’ services earlier than expected (for example as a result of discontinued operations);
and • Termination of, or amendments, to the terms of a defined benefit scheme, so that some or all future services
by current employees no longer qualify for benefits or will qualify for reduced benefits.
Debtors Amount of money owed to the Authority by individuals and organisations.
Deferred Capital Receipts The balance of outstanding monies owed (e.g. mortgages) by purchasers of council property. Deferred Liabilities These are creditor balances repayable after one year.
Defined Benefit Scheme A pension scheme where the benefits payable on retirement are determined by predetermined formula and not dependent on market returns.
Depreciation A loss in value of an asset due to age, wear and tear or deterioration.
Earmarked Reserves Amounts set aside for a specific purpose to meet future commitments or potential liabilities, for which it is not appropriate to establish provisions.
Fair Value The amount that an asset can be exchanged or a liability settled between knowledgeable and willing parties in an arm’s length transaction.
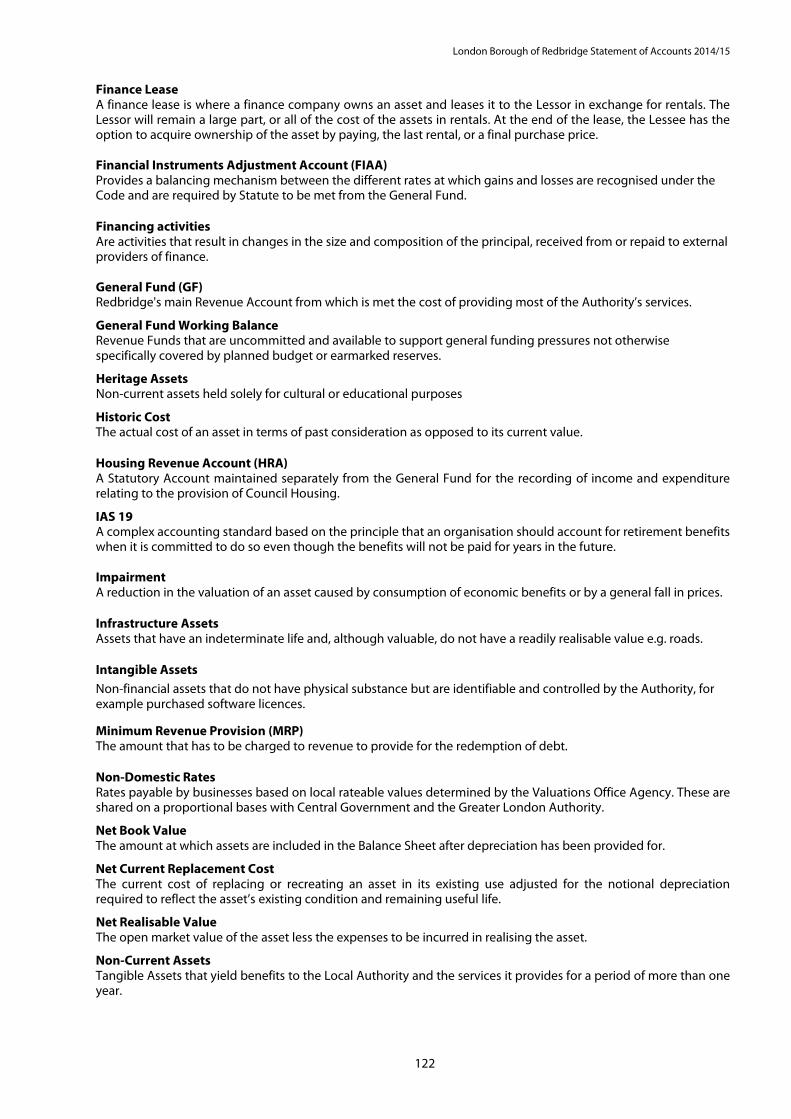
London Borough of Redbridge Statement of Accounts 2014/15
122
Finance Lease A finance lease is where a finance company owns an asset and leases it to the Lessor in exchange for rentals. The Lessor will remain a large part, or all of the cost of the assets in rentals. At the end of the lease, the Lessee has the option to acquire ownership of the asset by paying, the last rental, or a final purchase price.
Financial Instruments Adjustment Account (FIAA) Provides a balancing mechanism between the different rates at which gains and losses are recognised under the Code and are required by Statute to be met from the General Fund.
Financing activities Are activities that result in changes in the size and composition of the principal, received from or repaid to external providers of finance. General Fund (GF) Redbridge's main Revenue Account from which is met the cost of providing most of the Authority’s services.
General Fund Working Balance Revenue Funds that are uncommitted and available to support general funding pressures not otherwise specifically covered by planned budget or earmarked reserves.
Heritage Assets Non-current assets held solely for cultural or educational purposes
Historic Cost The actual cost of an asset in terms of past consideration as opposed to its current value.
Housing Revenue Account (HRA) A Statutory Account maintained separately from the General Fund for the recording of income and expenditure relating to the provision of Council Housing.
IAS 19 A complex accounting standard based on the principle that an organisation should account for retirement benefits when it is committed to do so even though the benefits will not be paid for years in the future. Impairment A reduction in the valuation of an asset caused by consumption of economic benefits or by a general fall in prices.
Infrastructure Assets Assets that have an indeterminate life and, although valuable, do not have a readily realisable value e.g. roads.
Intangible Assets
Non-financial assets that do not have physical substance but are identifiable and controlled by the Authority, for example purchased software licences. Minimum Revenue Provision (MRP) The amount that has to be charged to revenue to provide for the redemption of debt.
Non-Domestic Rates Rates payable by businesses based on local rateable values determined by the Valuations Office Agency. These are shared on a proportional bases with Central Government and the Greater London Authority.
Net Book Value The amount at which assets are included in the Balance Sheet after depreciation has been provided for.
Net Current Replacement Cost The current cost of replacing or recreating an asset in its existing use adjusted for the notional depreciation required to reflect the asset’s existing condition and remaining useful life.
Net Realisable Value The open market value of the asset less the expenses to be incurred in realising the asset.
Non-Current Assets Tangible Assets that yield benefits to the Local Authority and the services it provides for a period of more than one year.

London Borough of Redbridge Statement of Accounts 2014/15
123
Operating Lease An operating lease contract allows the use of an asset, but does not convey rights similar to ownership of the asset. The lessee pays rentals to the lease company and, the asset is returned at the end of the lease period.
Operational Assets Assets held, occupied, used or consumed by the Authority in the direct delivery of its service. Outturn The actual level of expenditure and income for the year. Post Balance Sheet Events Those events that relate to the accounting year, both favourable and unfavourable, which occur between the Balance Sheet date and the date on which the Statement of Accounts is signed by the Chief Financial Services Officer.
Precept The charge made by one Authority (e.g. Greater London Authority) on another Authority (e.g. Redbridge) to finance its net expenditure.
Private Finance Initiative A Central Government initiative whereby contracts are let to private sector suppliers for both services and capital investment in return for a unitary payment, which may be reduced if performance targets are not met.
Projected Unit Method Actuarial valuation method whose key feature is to assess future service cost; the Actuary calculates the employer’s contribution rate, which will meet the cost of benefits accruing in the year after the valuation date. This method is considered appropriate for a Pension Fund open to new members.
Provisions Amounts set aside for liabilities and losses, which are certain or very likely to occur but where the exact amount or timing of the payment are uncertain.
Public Works Loans Board (PWLB) Central Government Agency, which funds much of Local Government borrowing.
Registered Social Landlord A not for profit organisation that owns and manages homes. Reserves Amounts set aside that do not fall within the definition of a provision, to fund items of anticipated expenditure. These include general reserves or balances, which every Authority must maintain as a matter of prudence.
Revaluation Reserve Represents the increased value of the Authority’s land and building assets from 1 April 2007. Revenue Expenditure The day-to-day expenditure of the Authority, e.g. pay, goods and services and capital financing charges.
Revenue Support Grant Grant paid by the Central Government to Local Authorities. This grant is not attributable to specific services.
Soft Loan Loans given at less than market/commercial rates. Surplus or Deficit on the Provision of Services Is the total of income less expense, excluding the components of Other Comprehensive Income and Expenditure. Support Services Activities of a professional, technical and administrative nature which are not Local Authority services in their own right, but support main front line services.
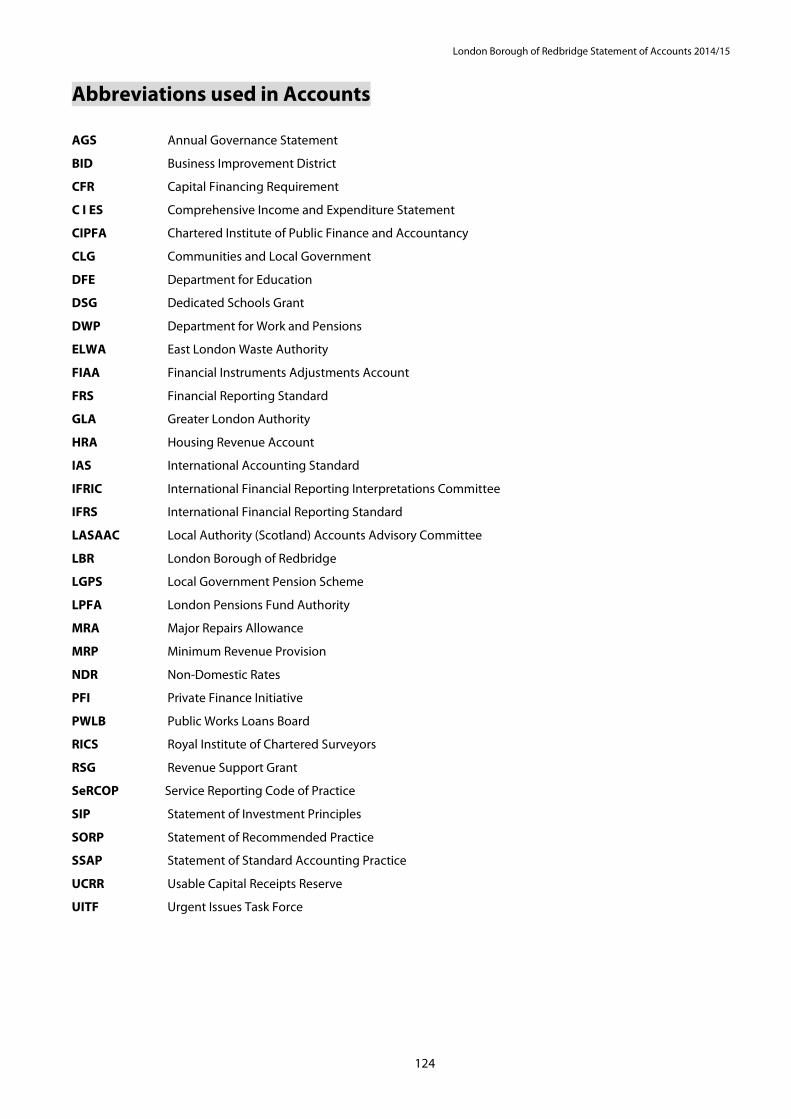
London Borough of Redbridge Statement of Accounts 2014/15
124
Abbreviations used in Accounts
AGS Annual Governance Statement
BID Business Improvement District
CFR Capital Financing Requirement
C I ES Comprehensive Income and Expenditure Statement
CIPFA Chartered Institute of Public Finance and Accountancy
CLG Communities and Local Government
DFE Department for Education
DSG Dedicated Schools Grant
DWP Department for Work and Pensions
ELWA East London Waste Authority
FIAA Financial Instruments Adjustments Account
FRS Financial Reporting Standard
GLA Greater London Authority
HRA Housing Revenue Account
IAS International Accounting Standard
IFRIC International Financial Reporting Interpretations Committee
IFRS International Financial Reporting Standard
LASAAC Local Authority (Scotland) Accounts Advisory Committee
LBR London Borough of Redbridge
LGPS Local Government Pension Scheme
LPFA London Pensions Fund Authority
MRA Major Repairs Allowance
MRP Minimum Revenue Provision
NDR Non-Domestic Rates
PFI Private Finance Initiative
PWLB Public Works Loans Board
RICS Royal Institute of Chartered Surveyors
RSG Revenue Support Grant
SeRCOP Service Reporting Code of Practice
SIP Statement of Investment Principles
SORP Statement of Recommended Practice
SSAP Statement of Standard Accounting Practice
UCRR Usable Capital Receipts Reserve
UITF Urgent Issues Task Force