2014 05 Contents Acronyms and Abbreviations 7 1 overview: A Comparative Analysis of the nCs and CAPs...
75
-
Upload
phungthuan -
Category
Documents
-
view
215 -
download
1
Transcript of 2014 05 Contents Acronyms and Abbreviations 7 1 overview: A Comparative Analysis of the nCs and CAPs...


03Umalusi 2014

04 Umalusi 2014

05Umalusi 2014
Contents
Acronyms and Abbreviations........................................................................................................ 7
1 overview: A Comparative Analysis of the nCs and CAPs for the Fet Phase......................... 81.1 Background............................................................................................................................... 81.2 The research question, research methodology and instrument........................................... 81.3 Trends across the curricula........................................................................................................ 10
1.3.1 The nature of the curriculum documentation.............................................................. 101.3.2 Curriculum objectives..................................................................................................... 121.3.3 Breadth and depth of content...................................................................................... 131.3.4 Depth................................................................................................................................ 131.3.5 Specification of content................................................................................................. 141.3.6 Pacing................................................................................................................................ 141.3.7 Sequencing and progression.......................................................................................... 151.3.8 Assessment guidance..................................................................................................... 161.3.9 Curriculum integration...................................................................................................... 171.3.10 Curriculum coherence.................................................................................................. 18
1.4 Implications for the South African context............................................................................. 191.5 Recommendations..................................................................................................................... 191.6 Concluding ideas....................................................................................................................... 20
2 Mathematical Literacy: A Comparison of the nCs and the CAPs for the Fet Phase............. 232.1 Introduction................................................................................................................................ 232.2 List of documents referenced................................................................................................... 232.3 Broad curriculum design, format and user-friendliness of curriculum documentation..... 242.4 Curriculum Objectives............................................................................................................... 262.5 Content/skill coverage.............................................................................................................. 27
2.5.1 Breadth and depth.......................................................................................................... 292.5.2 Specification of topics.................................................................................................... 342.5.3 Comment on the overall content/skills coverage...................................................... 35
2.6 Curriculum weighting and emphasis...................................................................................... 362.6.1 Curriculum emphasis within the Phase (subject time allocation).............................. 362.6.2 Curriculum emphasis within the subject (topic weighting)........................................ 37
2.7 Curriculum pacing...................................................................................................................... 402.8 Curriculum sequencing and progression................................................................................ 42
2.8.1 Specification of sequence............................................................................................. 422.8.2 Indication of progression................................................................................................ 43
2.9 Specification of pedagogic approaches............................................................................... 452.10 Assessment guidance.............................................................................................................. 482.11 Curriculum integration............................................................................................................ 50
2.11.1 Integration between subjects.................................................................................... 50
06 Umalusi 2014
2.11.2 Integration with the everyday world and knowledge of learners........................ 502.12 Curriculum overview................................................................................................................ 51
2.12.1 Curriculum coherence............................................................................................... 512.12.2 Implications for the South African context.............................................................. 522.12.3 Assumptions regarding teacher expertise............................................................... 53
2.13 Concluding remarks................................................................................................................ 542.14 Recommendations.................................................................................................................. 56
3 Mathematical Literacy: exit-Level outcomes for the Fet Phase CAPs................................... 583.1.1 Exit-level omissions........................................................................................................ 603.1.2 Appropriateness of the emphasis of the content area........................................... 613.1.3 Appropriateness of the emphasis of the skills/competencies................................ 613.1.4 Emphasis in terms of cognitive skills............................................................................ 62
4 ReFeRenCes................................................................................................................................... 63
AnneXURe A: Mathematical Literacy Basic skills Coverage in the nCs and the CAPs.......... 65

07Umalusi 2014
AS Assessment StandardAT Application TopicCAPS Curriculum and Assessment Policy StatementDBE Department of Basic EducationDoE Department of EducationFAL First Additional LanguageFET Further Education and TrainingGr GradeHESA Higher Education South AfricaHL Home LanguageLO Learning Outcomen.d. Not datedNCS National Curriculum StatementNSC National Senior CertificateOBE Outcomes-Based EducationPAYE Pay as You EarnQC Quality CouncilQCC Qualifications, Curriculum and CertificationSITE Standard Income Tax on EmployeesVAT Value-added TaxUIF Unemployment Insurance Fund
ACRonyMs And ABBReviAtions

08 Umalusi 2014
1. oveRvieW: A CoMPARAtive AnALysis oF tHe nCs And CAPs FoR tHe Fet PHAse
1.1 BACKGRoUnd
Umalusi undertook a project in 2013, the core intention of which was to establish the quality of the Curriculum and Assessment Policy Statement (CAPS) as amended version to the National Curriculum Statement (NCS) of 2008. The work done in 2013 is not only an extension of research to further the understanding of the National Senior Certificate (NSC) qualification, but is similar to the comparative research done in 2008. The research such as this not only develops an understanding of the strengths and weaknesses of the subject curricula, but also assists in building bigger picture of the nature of the qualifica-tion itself – what its strengths might be and what challenges might arise for the institutions where it is offered and for the staff implementing it. In short, the research was undertaken with the purpose of ensuring a better understanding of the NSC for all involved.
The current phase of the research is presented in the following reports:
• An overview report of the research process and key findings for subjects and sub-ject clusters
• A series of subject/subject cluster- specific reports for Mathematics, Mathemati-cal Literacy, Languages (English), Social Sciences, Natural Sciences and Business, Commerce and Management.
• Initially the reports will be submitted to the Department of Basic Education and Train-ing (DBE). The findings and recommendations have been formulated as guidelines for improvement, in terms of both the national policy and of implementation and assess-ment. The findings also point to areas that need strengthening in teacher education and professional development. Thereafter, Umalusi, in collaboration with Higher Edu-cation Institutions and Higher Education South Africa (HESA), could use this research work towards improving the quality of teacher preparation, not only to equip teach-ers as field experts, but also as subject methodologists who are able to reflect on their own teaching practice.
1.2 tHe ReseARCH QUestion, ReseARCH MetHodoLoGy And instRUMent
Research question: The research question for the comparative NCS/CAPS research/ evaluation is worded as follows:
‘What does the comparison between the Curriculum and Assessment Policy Statement (CAPS) for FET Phase (Grades 10 to 12) and the National Curriculum Statement (NCS) reveal about:
a. the extent to which the NCS curricula were repackaged or rewritten in the formula-tion of the CAPS;
b. the relative depth and breadth of the content covered in the respective curricula,

09Umalusi 2014
c. the overall design, structure and coherence of the curricula,d. thelevelofspecificationofvariousaspectsofthecurricula,ande. the guidance provided by the curricula for the teaching and assessment of the
subject?’
Research/evaluation process: The process involved identification of the evaluation teams across all the subjects under evaluation, followed by the refining of an existing instrument to evaluate and compare the NCS and the CAPS. Thereafter two workshops were held with the evaluation teams, in August and November of 2013, in order to brief them about the evaluation and for the teams to work together on the curriculum analysis. Finally, the evaluation teams completed their analysis via e-communication, and the team leaders took responsibility for the completion and submission of the teams’ reports.
instrument: An instrument was customised for this investigation, which required the eval-uators to grapple deeply with issues around broad curriculum framing, and concepts such as content breadth and depth, sequencing, progression, coherence and how to determine the weighting and curriculum focus in the documents. All those who partici-pated in the process learned a great deal, and they in turn offered insights from their own expertise which added value to the report.
The evaluation teams were asked to give their opinion on each subject regarding:
• Broad curriculum design – the central design principle;• The aims/ objectives of the subject;• The ideal learner envisaged;• The weighting of each topic in terms of the percentage of time allocated to each;• The emphasis placed on content and skills;• The depth of the subject in terms of the extent to which learners could move from a
superficial grasp of a topic to a more refined and powerful grasp;• The degree to which the curriculum of each subject is paced, in terms of the vol-
ume to be covered in a specific timeframe;• The specification of sequencing of topics;• The progression of topics from Grades 10 to 12 in terms of increase in level of com-
plexity and difficulty;• The coherence of the curriculum for each subject, in terms of connections and co-
ordination between topics through the levels;• The degree to which teachers are given explicit guidance regarding pedagogy;• The degree to which teachers are provided with guidance regarding assessment;• Format and user-friendliness of the curriculum documentation.
Evaluators were asked to comment on the overall guidance and use of the curriculum and the central values underpinning each curriculum.

10 Umalusi 2014
In addition, the teams had to substantiate their opinions about the extent to which the CAPS for the subjects mentioned above have been ‘repackaged’ or been rewritten in this repackaging process. The teams were asked to identify the extent to which the repackaging has extended – or contracted – the content and skills which learners are expected to acquire and teachers to teach. Another point for attention was whether the CAPS provides better guidance to teachers than the NCS.
Lastly the evaluation teams were required to make recommendations, based on their findings regarding all the points above. They were requested to provide recommenda-tions for the strengthening of the CAPS for each subject, where these may still require improvement. Such recommendations will form the basis for subsequent work to be un-dertaken by the DBE and monitored by Umalusi.
1.3 tRends ACRoss tHe CURRiCULA
Although the Umalusi subject evaluation teams worked towards a common goal of as-sessing the comparability of the NCS with the CAPS, the individual subject reports offer unique insights, with particular details that are of interest to those involved with teaching the subjects in question. There are, however, overarching trends that can be gleaned from the subject reports. These trends are briefly described below. A more detailed sec-tion on the trends across the curricula appears in the Overview report.
1.3.1 the nature of the curriculum documentation
The NCS documents had a great deal of uniformity in style and length across the different subjects, however, the CAPS is somewhat varied between subjects. For some subjects, such as Life Sciences and Physical Sciences, a full teaching programme is provided, with the content and prescribed activities clearly described with definite timeframes. By con-trast, the documentation for some subjects, such as History, only provide a list of content to be covered per term, with no time indications for separate topics. The extent of the assessment guidance also varies substantially between subjects, with the Mathematics CAPS containing the shortest guidance on assessment (five pages), while the guidance provided for Mathematical Literacy covers 32 pages. The CAPS documents for English HL and English FAL both contain glossaries, which none of the other subjects have.
The table below (Table 1) illustrates the variation in the length of the subject-related cur-riculum documents for the CAPS compared with the NCS.

11Umalusi 2014
table 1: variation in the length of curriculum documentsnCs CAPs
Lowest number of pages 139 (Accounting) 48 (Economics)Highest number of pages 204 (English FAL) 164 (Physical Sciences)Average number of pages 175 82
This table shows that there is much greater variation in the length of the CAPS documents across the different subjects, ranging from 48 pages (Economics) to 164 pages (Physical Sciences) in length, compared with the collection of NCS subject-related documents, which range from 139 pages (Accounting) to 204 ages (English First Additional Language (FAL)). Each subject varies in terms of the approach taken to the way in which guidance is given to the teacher. This may contribute positively towards the CAPS providing clear and appropriate guidelines within each subject, but it does suggest a lower degree of coher-ence across subjects in terms of the approach taken within the curriculum documents.
In all subjects, with the exception of Physical Sciences, the length of subject-related doc-uments that teachers need to consult has been reduced from the NCS to the CAPS. (This does not include the Examination Guidelines document for the CAPS, which may cause the number of pages in the CAPS documentation to exceed that of the NCS in some cases). The reason for the greater length of the Physical Sciences CAPS is that this docu-ment has a very detailed level of specification, which will be discussed further under the Specification heading.
In all subjects, the evaluation teams deemed the CAPS documents to be more user- friendly than the NCS equivalents, mainly due to the number of subject-specific policy documents that had to be consulted in NCS (a minimum of four). The result of this level of documentation meant that lesson preparation became complicated and unwieldy for teachers using the NCS.
The accessibility of the language was generally deemed acceptable for both curricula. Some of the evaluation teams commented on the complexity of the educational ‘jar-gon’ used in the NCS when describing OBE. This has been reduced in the CAPS, where much simpler language is used to describe the teaching and learning process.
For all subjects except Accounting, there has been an improvement in alignment be-tween the documents within each curriculum. Many of the evaluation teams reported that there are contradictions between the various subject-related documents for the NCS. The only evaluation team that did not report alignment problems in the NCS doc-umentation was the Accounting team. As the CAPS has only one subject-related docu-ment at the time of the evaluation, meant that the misalignments between documents are no longer an issue.
However, some of the evaluation teams reported alignment issues between the vari-ous undated versions of the CAPS documents which were released during the imple-mentation process. (This caused great confusion among teachers and other education

12 Umalusi 2014
practitioners, who were unsure of whether they had the latest version of the CAPS). In addition, as an Examination Guidelines document has been introduced, it is possible that problems with alignment may occur with the CAPS.
Evaluation teams for all subjects agreed that the design principle of the curricula has shifted from outcomes-based in the NCS to content-driven or syllabus-based in the CAPS. Where an outcomes-based curriculum is, by nature, learner-centred and activity-based, a content-driven curriculum involves a more teacher-centred, instructive approach. However, both of the languages evaluation teams (English FAL and English HL) com-mented that, although the CAPS is teacher-driven, there are some skills-based principles involved, such as text-based approaches, with content-based on topics and themes.
Overall, the evaluation teams concluded that the CAPS documents are an improvement over the NCS in terms of the design and structure of the curricula. The recommendation made in the Department of Education (DoE) report (2009, p 63) for ‘consistency, plain language and ease of understanding and use’ has been heeded in the compilation of the CAPS.
1.3.2 Curriculum objectives
The evaluation teams were asked to compare the objectives that are stated for their sub-jects in the NCS with those in the CAPS. The general finding across the subjects was that the objectives are very similar for both curricula. (These findings are presented in detail in the individual subject reports). Some of the NCS objectives which are related to socio-po-litical and ethical awareness, and sensitivity to cultural beliefs, prejudices and practices in society, have been excluded from the CAPS. In addition, where the NCS addresses the need for the development of skills related to self-employment and entrepreneurial ventures, these skills are not included in the CAPS objectives.
The English FAL evaluation team noted that the CAPS omits objectives that include hu-man experience, aesthetics of language, and social construction of knowledge. They commented that ‘the CAPS has removed the explicit recognition of unequal status of languagesandvarieties-akeyspecificobjectivearticulatedintheNCS’.
The Mathematics evaluation team noted that there is ‘a de-emphasis in the CAPS of the more explicit transformatory agenda that is articulated in the NCS’. This is perhaps appro-priate, given the historical timing of the two versions of the curriculum, with the NCS being introduced during a time when ‘the notion of a national curriculum was a new concept that coincided with the birth of a new democracy’ (DoE, 2009, p 11) and the CAPS, after more than a decade of democracy.

13Umalusi 2014
1.3.3 Breadth and depth of content
One of the areas that is repeatedly highlighted in the DoE report (2009) is that of finding a balance between breadth and depth in the content of the curricula. It has been shown that less breadth of content covered in more depth ensures a greater chance of future success in the discipline (Schwartz et al., 2008). With this in mind, the evaluation teams compared both the breadth and the depth of the NCS and the CAPS in order to deter-mine any shifts that may have taken place in these areas.
The Economics and Mathematics evaluation teams reported an increase in the breadth of content across the FET Phase in the move from the NCS to the CAPS. The English HL, Accounting, Business Studies, and History evaluation teams concluded that the breadth across the Fet Phase is similar for the NCS and the CAPS. The Physical Sciences, Life Sciences, Geography and English FAL evaluation teams reported a reduction in the breadth of content across the FET Phase in the CAPS compared with that in the NCS.
1.3.4 depth
An increase in depth from the NCS to the CAPS was noted for Economics and Mathe-matics. The Accounting, Business Studies, Geography and Physical Sciences evaluation teams reported a similarity in the depth required across the FET Phase for the NCS and the CAPS, whereas the English FAL and Life Sciences evaluation teams reported a reduc-tion in overall depth from the NCS to the CAPS.
The English HL evaluation team could not comment on depth, since this is left to the dis-cretion of the teacher in terms of the length and complexity of texts that are selected. They made the comment that, although some guidance is given in the CAPS around the selection of appropriate texts, this is insufficient to ensure a common understanding of the level of depth that is required.
The History evaluation team could not compare the depth of the curricula because of the structure of the content outline provided in the NCS, which does not give sufficient detail to provide any form of guidance on the level of depth required. The evaluation team commented on the depth of the CAPS itself, that ‘the CAPS manages the tensions between breadth and depth as well as is possible, although there is probably a greater emphasis on breadth than depth’.
The Mathematical Literacy evaluation team could not compare the depth of the cur-ricula because the NCS defines depth in terms of the mathematical processes involved, whereas the CAPS defines depth in terms of the level of problem-solving required within the selected real-life situations or contexts. Hence, although in one sense the NCS has greater depth than the CAPS, since it contains topics that require application of more complex mathematical skills, the evaluation team noted that the CAPS goes into greater

14 Umalusi 2014
depth than the NCS in almost every topic, since learners are expected to know more about the topic and to understand the complexity of the authentic real life situation.
1.3.5 Specification of content
The curriculum specification, or degree to which knowledge is broken down for stipula-tion, was compared for the NCS and the CAPS. On the whole, it was found that the level of specification of content is higher in the CAPS than in the NCS. More detail is provided in the CAPS on the exact scope and depth of the content that is to be taught and as-sessed, than in the NCS. However, three of the evaluation teams, namely those for Eco-nomics, English HL and English FAL, did not report an increase in specification of content in the CAPS.
In terms of satisfying the recommendation made in the DoE Report (2009, p 62) that curricula should provide ‘clear, succinct and unambiguous’ statements of learning, the majority of the CAPS subject documents satisfy these criteria. Nevertheless, particular attention must be paid to the level of clarity provided in the two English language curric-ula, to ensure that these provide the necessary guidance to teachers. In addition, many of the subject evaluation teams reported that the CAPS documents require a thorough edit, as there are numerous errors that appear throughout the documents, which may lead to confusion and erroneous interpretation of the curricula.
1.3.6 Pacing
All of the evaluation teams, with the exception of Mathematical Literacy, agreed that the level of stipulation of the pacing is greater in the CAPS than in the NCS, since more explicit guidelines on time frames are provided in the CAPS. The Mathematical Literacy evaluation team found that the work schedules in the CAPS do not provide sufficient de-tail about the actual content to be taught or the resources needed for the teaching to allow for a clear sense of pacing. They also found discrepancies between the suggested work schedules, which specify broad content for each week (Mathematical Literacy CAPS, pp 16-20), and the summary of the number of weeks to be spent on each topic (Mathematical Literacy CAPS, p 15).
The evaluation teams were asked to comment on the actual level of the pacing for each of the curricula as it would be experienced by learners in the FET Phase. The pacing was difficult to judge in the NCS due to the low level of specification, and the flexibility grant-ed to teachers to determine the pace in response to the varying needs of learners. In spite of this lack of specification, however, some of the evaluation teams were able to make broad judgements on the levels of pacing, based on the breadth of content stip-ulated within the overall time frame for each grade. On this basis the Physical sciences,

15Umalusi 2014
Accounting, economics, english FAL and Geography evaluation teams indicated that the pacing of the NCS was likely to be experienced as fast. The remaining evaluation teams were either unable to comment on the pacing, or considered the pace to be moderate.
For the CAPS, evaluation teams for all subjects except for Geography, Mathematical Literacy and Life sciences commented that pacing is likely to be experienced as fast, since the time allocation for teaching the content does not allow for a sufficient depth of engagement with the content as specified. The Geography evaluation team conclud-ed that the pacing is carefully considered and realistic in the CAPS. The Mathematical Literacy evaluation team deemed the pacing to be moderate, based on their overall impression of the material to be covered. The Life Sciences evaluation team considered the pacing to be fast for Grades 10 and 11, and commented that ‘the experience of teachers is that they have to rush through the curriculum to complete it in the year’. They considered the pacing to be moderate for Grade 12, but mentioned that the pacing is uneven, in that ‘too much time is allocated for some topics, and too little for others’.
1.3.7 sequencing and progression
In general, the evaluation teams found the degree of specification of the sequencing to be higher in the CAPS than in the NCS. This is to be expected from a curriculum which has been designed to provide a structured learning programme, as does the CAPS, in contrast to the approach taken by the NCS, which is to allow teachers the flexibility to design their own learning programmes.
The evaluation teams were asked to make a judgement on whether progression within each grade is evident in the NCS and the CAPS. Interestingly, although there is no expec-tation in the nCs that teachers follow the sequence of topics as they are laid out in the curriculum, many of the evaluation teams found that the order in which the topics are laid out in the curriculum offer an inherent sense of progression. However, a wide range of interpretations of the sequencing of topics by textbooks, provincial departments and other interpreters of the curriculum meant that this inherent progression was not always followed through in practice. For the CAPs, no clear trend is evident across the subjects in terms of the sequence of topics allowing for progression within each grade. The rea-soning behind the sequencing of content is not always clear, and in some cases does not appear to have been designed with progression in mind. An example of this is in Physical Sciences, where the Grade 10 CAPS interrupts the flow of certain chemistry topics with the insertion of unrelated physics topics, causing a break in the flow and hence conceptual progression for learners. The Accounting, Economics, Business Studies and Mathematical Literacy evaluation teams all reported strong evidence of progression within each grade.
With regard to the progression across the grades, the evaluation teams generally found

16 Umalusi 2014
that progression across the grades in the NCS is clearly evident through the way in which the Assessment Standards (ASs) are expressed, with clear increase in the cognitive de-mand indicated in the way in which these are described for each grade. Progression in terms of the content across the grades was reported as strong by all evaluation teams except for Physical Sciences, Geography, History, English HL and Mathematical Literacy, where evaluation teams reported either a clear lack of progression, with uneven degrees of complexity across the grades, or a lack of guidance regarding the required level of complexity for the specified topics.
For the CAPS, all of the subjects, with the exception of the language evaluation teams, reported a clear progression across the grades. The English FAL evaluation team made the comment that ‘theCAPSoffersalmostnospecificationastotheexpecteddepthoftopics to be covered in each successive grade, and no indication of progression across the phase’. The English HL evaluation team reported that the CAPS offers guidelines only as to how progression should take place, but does not give sufficient guidance to teach-ers to ensure that a clear increase in the level of complexity or difficulty is realised in the learning process. The lack of specification of the length and complexity of texts to be used exacerbates this.
1.3.8 Assessment guidance
Both the NCS and the CAPS provide generic guidance to teachers on the purpose, forms and methods of assessment. In addition, subject-specific guidelines are given for each subject in the various subject-related documents.
The types of assessment outlined in the NCS are baseline, diagnostic, formative and sum-mative assessment. In addition, a distinction is made between formal and informal as-sessment. In contrast, the CAPS outlines only two types of assessment, namely formal (‘as-sessment of learning’) and informal (‘assessment for learning’). It is noteworthy that the CAPS has conflated firstly, formative and informal assessment, and secondly, summative and formal assessment. In addition, no mention is made in the CAPS of assessment as an aid to diagnosing or remediating barriers to learning.
The NCS describes three methods of assessment, namely self-assessment, peer assess-ment and group assessment. The CAPS narrows this down to self- and peer assessment.
The methods of recording assessment in the NCS include rating scales, task lists or check-lists and rubrics. The method of recording assessments in the CAPS is based on marks.
With regard to the formal assessment tasks for each subject, most of the evaluation teams reported that the number of formal assessment tasks prescribed per grade is equiva-lent for the NCS and the CAPS, with exceptions being English FAL and English HL, where the number of formal assessment tasks has been reduced, and Life Sciences, where the

17Umalusi 2014
number of tasks has increased in the CAPS.
In all of the subjects there is a strong emphasis on tests and examinations in terms of the overall summative assessment mark in the CAPS. The final mark for each grade in the CAPS is made up of 25% classwork and 75% end-of-year examination. The 25% classwork mark is made up of a high proportion of marks from tests and the June examination. Hence, the minimum contribution of tests and examinations towards the Grades 10 and 11 marks is 80%, and towards the final Grade 12 mark is 85%. This leaves a maximum of 20% representation for projects, practical investigations, assignments and other forms of assessment in Grades 10 and 11, and a maximum of 15% representation of these in Grade 12. While this emphasis may be necessary for assessments to be reliable, it is prejudicial for learners who perform better at tasks that are not test- or examination-based.
The Assessment chapter of the NCS Subject Statements includes a full set of compe-tence descriptors for each level of achievement for each grade, ranging from Level 6 (Outstanding) to Level 1 (Inadequate). In practice, these descriptors were never used, as it was unclear how they should be applied. No such descriptors appear in the CAPS document.
Clearly an attempt has been made in the CAPS to simplify the fairly elaborate approach taken in the NCS. Although this has been necessary in order to reduce the complexity and administrative load caused by assessment under the NCS, it does raise the question of whether valuable insights available through the more nuanced NCS approach to as-sessment, may have been lost in the process.
1.3.9 Curriculum integration
All of the evaluation teams, without exception, found the level of integration between subjects in the Fet Phase to be low for the CAPS, with little or no explicit mention of refer-ence to fields of learning in other subjects. In the NCS the explicit mention of integration between subjects was only marginally greater than in the CAPS in History, English HL and English FAL. In all other subjects the NCS showed a similarly low level of integration with other subjects, in spite of the stated intention of cross-subject integration.
No clear trends were evident from the findings regarding the level of integration between the subjects and the everyday (general) knowledge of learners at their stage of devel-opment and in their contexts, since the subjects have varying degrees of applicability to everyday life. Some subjects, such as Mathematical Literacy and Accounting, have a natural link with the everyday world, and these evaluation teams hence reported a high level of integration with learners’ everyday lives for both the NCS and the CAPS. Other subjects, namely Economics, Physical Sciences, Life Sciences, English FAL and English HL, reported a drop in the level of integration with everyday knowledge from the NCS to the CAPS. The only visible trend in the findings was that none of the subject evaluation

18 Umalusi 2014
teams reported an increase in the level of integration with everyday life in the move to the CAPS.
The evaluation teams found that the CAPS subject documents as having much clearer discipline-boundaries than those of the NCS. This satisfies the recommendation in the DoE report (2009) for ‘statements which are clear, succinct, unambiguous, measurable, and based on essential learning as represented by subject disciplines’ (p 49).
1.3.10 Curriculum coherence
The evaluation teams found that the NCS shows clear evidence of an intention for hori-zontal coherence, in its description of integration and its definition of subjects: ‘Integra-tionisachievedwithinandacrosssubjectsandfieldsoflearning.Theintegrationofknowl-edge and skills across subjects and terrains of practice is crucial for achieving applied competence … In an outcomes-based curriculum like the NCS, subject boundaries are blurred. Knowledge integrates theory, skills and values. Subjects are viewed as dynamic, always responding to new and diverse knowledge, including knowledge that traditional-ly has been excluded from the formal curriculum’ (DoE, 2003, pp 8, 11). However, this hori-zontal coherence was not achieved in practice in the NCS, as is evidenced by the lack of explicit guidance for teachers on how to achieve this integration across subjects. In-stead, most of the subject evaluation teams commented on the strong discipline-based approach to knowledge in the NCS, which suggests a vertically aligned curriculum struc-ture. This shows a lack of coherence between the stated intention and the actual course structure of the NCS.
The low level of integration between subjects in the CAPS, as mentioned previously, in-dicates that horizontal coherence is not a design feature of the CAPS documents. The CAPS has a strong discipline-based approach to knowledge within the subjects, as re-ported by all of the evaluation teams except English FAL and Mathematical Literacy. (It is appropriate that these two subjects are not strongly discipline-based, as they are both subjects which aim to develop literary competence in their respective fields, rather than being disciplines in their own right.) It can therefore be inferred that the CAPS shows a clear and coherent vertical alignment, which is evidenced by the clearly demarcated subject boundaries, and the strong discipline-based approach within the subjects. This brings clarity for teachers and learners regarding the exact terminology, content and skill requirements within each discipline. This will lead to a more rigorous induction into the discourse of each discipline for teachers and learners than a more horizontally aligned curriculum would allow. A vertically aligned curriculum does not bring about an explicit development of the ability of a learner to transfer concepts and skills between subjects and into the everyday world.

19Umalusi 2014
1.4 iMPLiCAtions FoR tHe soUtH AFRiCAn ConteXt
The majority of the evaluation teams agreed that the structured outline of content and activities in the CAPS is more likely to facilitate the development of sound knowledge and skills than the more open, non-prescriptive approach of the NCS. The CAPS is there-fore, on the whole, a more suitable curriculum for the current South African educational context. However, the English FAL evaluation team noted that: ‘The CAPS is based on conflictingassumptionsaboutteacherexpertise.Theovertassumptionsarethatteach-ers cannot, or should not have to, develop their own teaching plans, and thus they are provided with these. This suggests that the CAPS assumes that teachers do not have the expertise (or time) necessary to develop their own teaching programmes. However, therearesomanygaps intheteachingplan,andthere isso littlespecificationaboutdepth or progression, that it would require a highly skilled and competent teacher to identify such gaps and failures of logic, and take steps to mediate the plans to address these problems’.
In addition, some of the evaluation teams expressed concern over the lack of availability of the necessary resources for implementing the CAPS:
• The Economics evaluation team raised the concern that the required learner sup-port materials (such as magazines, newspapers, statistical data and the internet) are not available in all South African classrooms.
• Both of the experimental science subjects, namely Physical Sciences and Life Scienc-es, quoted statistics that fewer than 5% of South African schools have equipped, functional laboratories (Equal Education, 2012). Both evaluation teams raised the concern that the CAPS is unlikely to be able to be fully implemented in the vast majority of South African schools, given the specialised nature of the equipment required for the prescribed classroom activities in the CAPS.
1.5 ReCoMMendAtions
Each of the subject evaluation teams made specific recommendations for the CAPS for their subject. The following general recommendations are made with the intention of strengthening the CAPS:
• The silence on the role of the teacher in the CAPS documents is concerning. The place of the teacher in the learning process needs to be clearly acknowledged and articulated in the CAPS documents.
• Since there has been an implicit shift in the underlying pedagogy from a learn-er-centred to a teacher-centred approach, explicit guidance should be given on what this shift means in terms of the choice of teaching strategies.
20 Umalusi 2014
• The findings of the evaluation teams show that three of the curricula require urgent attention:
o The Mathematics CAPS is deemed by the evaluation team to be significantly more demanding than the NCS, since the CAPS content exceeds that of the NCS in both breadth and depth. This is of great concern, since the NCS Mathe-matics was already experienced as challenging for a significant portion of the learners. The Mathematics document therefore requires revision to ensure that there is appropriate provisioning of Mathematics for all learners wanting to take Mathematics in the FET Phase.
o The english FAL CAPS is problematic, since not all of the topics mentioned in the content overview in the CAPS are represented in the teaching plans that are pro-vided. The evaluation team made the comment that ‘there are so many gaps in theteachingplan,andthereissolittlespecificationaboutdepthorprogression,that it would require a highly skilled and competent teacher to identify such gaps and failures of logic, and take steps to mediate the plans to address these prob-lems’. This is a consequence of the unrealistic breadth of content that is outlined in the content overview. The selection of content in the overview therefore needs revision. The teaching plans require reworking, to ensure internal consistency in the CAPS, and to prevent superficial or incoherent implementation of the curric-ulum. Special attention needs to be paid to the ‘Language Structures’ section, which, in particular, has major gaps and fails to progress logically.
o The english HL evaluation team found that the clarity of guidance provided in the CAPS is undermined by the lack of guidance regarding the texts to be se-lected, and the relegation of the teaching of language structures and conven-tions to an appendix in the CAPS document. It is recommended that, in order to provide clearer guidance to teachers, the teaching plans be revised as follows: - More explicit guidance should be provided on the nature and complexity of
texts to be selected.- The teaching of language structures should be integrated as part of the
teaching plan.
• The CAPS documents require a thorough edit, as many of the subject evaluation teams reported that there are numerous errors that appear throughout the docu-ments, which could lead to confusion and erroneous interpretation of the curricula. Many of the evaluation teams also commented on typographic and spelling errors in various places throughout the document which require a thorough language edit.
1.6 ConCLUdinG ideAs
In the move from the NCS to the CAPS there has been a clear shift in the underpin-ning educational approach, from the OBE of the NCS, described as encouraging ‘a

21Umalusi 2014
learner-centred and activity-based approach’ (DoE, 2003, p 7), to the approach in the CAPS which is described as ‘an active and critical approach to learning, rather than rote and uncritical learning of given truths’ (CAPS subject statements, 2011, p 4).In addition, the CAPS has narrowed its focus to a more clearly discipline-specific approach, with the exclusion of principles such as integration, portability and articulation, and with the re-establishment of subject boundaries (as evidenced by the omission of any discussion around the definition of the term ‘subjects’, and the omission of the NCS’s stated inten-tion of blurring of subject boundaries).
There has also been a shift from the strong focus on groupwork that the NCS adopted, to a focus on the learner taking individual responsibility for his/her learning, as evidenced by the inclusion of the clause ‘work as individuals’ in the description of the type of learner envisaged (CAPS subject statements, 2011, p 5).
Where the NCS explicitly states the teacher’s role as being (amongst other roles) the interpreter and designer of learning programmes and associated classroom activities, the design of the CAPS shifts this role, since the CAPS is itself a pre-designed learning programme, with prescriptive classroom activities. This, together with the silence in the introductory pages of the CAPS regarding the teacher, suggests that the role that the teacher plays has become greatly diminished in the CAPS. The implication is that teach-ers operate at the level of implementers of a predetermined learning programme, rather than having much flexibility in the design and adaptation of this learning programme to the varying needs of learners.
The findings of the Ministerial Task Team, laid out in the DoE Report (2009), showed that the expectation that teachers design their own learning programmes was strongly resist-ed by teachers and other respondents. Instead, the suggestion was that a more clearly structured teaching plan be provided to enable teachers to ‘devote their energy to delivering quality instruction’ (p 19). In this sense, the CAPS satisfies the recommendations made in the report.
The findings of the subject evaluation teams show that, for the majority of subjects, the content covered in the CAPS does not differ significantly in breadth or depth from the content in the NCS. Exceptions to this are the following subjects:
• Mathematics: The evaluation team found that the CAPS content exceeds that of the NCS in both breadth and depth, and is thus likely to be experienced as ‘significantlymore demanding than the NCS’.
• Life sciences: The evaluation team found that, although the curriculum content has been mostly repackaged in the transition from the NCS to the CAPS, there has been some reduction in both breadth and depth of the content in the CAPS.
Most of the evaluation teams concluded that the CAPS documents are an improvement over the NCS with regard to providing ‘statements which are clear, succinct, unambigu-

22 Umalusi 2014
ous, measurable, and based on essential learning as represented by subject disciplines’. Exceptions to this are the following subjects:
• english FAL: The content that is outlined in the content overview in the CAPS (pp 10-48 of the English FAL CAPS) is very broad, and consequently has led to a set of teaching plans (pp 53-76 of the English FAL CAPS) which have not incorporated all of the content in the teaching time available. As a result, there is a difference between the topics which are included in the content overview and those rep-resented in the teaching plans. This is likely to lead to confusion for teachers, and probable variations in interpretations of the curriculum.
• english HL: Although the evaluation team’s overall comment on the CAPS was fa-vourable, in that the ‘core topics are fundamental to any course or syllabus intend-ing to teach literacy, and include the development of writing, reading, listening and grammatical skills’, the evaluation team indicated that the clarity of the guid-ance provided by the CAPS is undermined by the lack of guidance regarding the texts to be selected, and the relegation of the teaching of language structures and conventions to an appendix in the CAPS document, rather than integrating this as part of the teaching plan.
The move from OBE has also resulted in a shift from a cooperative, discovery-based learning, where the learner is a participant in the learning process, as a negotiator of meaning, to content-driven learning, where the learner is a recipient of a body of pre-de-termined knowledge.
Based on the findings of the subject evaluation teams, it can be concluded that the CAPS documents have a much more detailed level of specification of content than the NCS documents. A consequence of this increased level of specification is that there has been a shift in terms of the level at which the curriculum is aimed. According to the sche-ma of curriculum levels discussed in the overview report, the NCS is set at the ‘macro’ level, since it focuses mainly around attainment levels, and the construction of the actual educational programme is left to the teacher, while the CAPS has shifted to the ‘meso’ level, and even, to some extent, the ‘micro’ level, in that its structure is that of an instruc-tional programme, with a detailed description of content, sequencing and pacing.

23Umalusi 2014 | Mathematical Literacy
2. MAtHeMAtiCAL LiteRACy: A CoMPARAtive AnALysis oF tHe nCs And CAPs FoR tHe Fet PHAse
2.1 intRodUCtion
Mathematical Literacy involves the mastery of elementary mathematical skills in order to ‘make sense of, participate in and contribute to the twenty-first century’ (Doc 2.1, p8, see Section 2.2 for reference). The subject requires learners to read text, tables and graphs with insight and understanding, to reason and make decisions, to analyse and draw conclusions, to critique arguments and interpret complex representations of information. All of these skills and competencies are for the express purpose of solving real life quan-titative problems.
Mathematical Literacy is not another level or type of Mathematics. It differs from Math-ematics in that the aim is not to solve problems of an abstract and theoretical nature, using conceptual mathematical understanding and to master sophisticated techniques and tools. The essence of Mathematical Literacy is to gain confidence and skills in nav-igating modern life with its complex financial transactions and contracts, global trade and travel, statistics-based arguments and advertising, exchange rates, consumer pres-sure, and much more.
Mathematical Literacy does not have a long history in South Africa as it was only intro-duced in the FET phase at Grade 10 level in 2006. It was included in the FET curriculum to give those learners who would drop Mathematics at the end of Grade 9 a useful, challenging and highly relevant alternative. The 21st century requires that people have both an understanding of and competency in quantitative and numeracy issues in a wide range of contexts. Mathematical Literacy is entirely based on authentic, everyday contexts, most of which are familiar to learners.
2.2 List oF doCUMents ReFeRenCed
The evaluation team consulted six documents relating to the NCS and three documents that define the CAPS. These are listed in Table 2 below. Each document is given a ref-erence code which is used when referring to the document throughout the rest of this report.
tABLe 2: Referenced documents1 nAtionAL CURRiCULUM stAteMentDepartment of Education. 2003. National Curriculum Statement for Grades 10-12 (General): Mathematical Literacy. Doc 1.1
Department of Education. 2008. National Curriculum Statement for Grades 10-12 (General): Learning Programme Guidelines - Mathematical Literacy. Doc 1.2
Department of Education. 2008. National Curriculum Statement for Grades 10-12 (General): Subject Assessment Guidelines - Mathematical Literacy. Doc 1.3
Department of Education. 2008. National Curriculum Statement for Grades 10-12: Examina-tion Guidelines - Mathematical Literacy. Doc 1.4

24 Umalusi 2014 | Mathematical Literacy
Department of Education. 2008. National Curriculum Statement for Grades 10-12: Teacher Training Guidelines - Mathematical Literacy. Doc 1.5
Department of Education. 2003. National Curriculum Statement for Grades 10-12 (General): Overview. Doc 1.6
2 CURRiCULUM And AssessMent PoLiCy stAteMent Department of Basic Education. 2011. National Curriculum Statement (NCS) Curriculum and Assessment Policy Statement (CAPS) Further Education and Training Phase Grades 10-12 - Mathematical Literacy
Doc 2.1
Department of Basic Education. (n.d.) National Policy Pertaining to the Programme and Pro-motion Requirements of the National Curriculum Statement. Grades 10 – 12 Doc 2.2
Department of Basic Education. (n.d) National Protocol for Assessment. Grades 10 – 12. Doc 2.3
2.3 BRoAd CURRiCULUM desiGn, FoRMAt And UseR-FRiendLiness oF CURRiCULUM doCUMentAtion
The evaluation team undertook an assessment of the curriculum design for the NCS and the CAPS, and also evaluated the user-friendliness, accessibility of language and align-ment of the two curricula. Table 3 below summarises the findings.
table 3: Broad design, format and user-friendlinessnCs CAPs
Number of documents (subject-related) 6 3Total number of pages (in subject-related documents) 262 233
User-friendliness (Good / Moderate / Poor) Poor GoodAccessibility of language (Good / Moderate / Poor) Moderate GoodAlignment (Good / Moderate / Poor) Moderate GoodCentral design principle (the technical curriculum design aspect that organises the curriculum)
Outcomes-based Standards based /Syllabus type
The broad curriculum design in the NCS is outcomes-based, whilst the CAPS has moved away from an outcomes-based design, and has elements of both a ‘standards-based’ and a ‘syllabus’ curriculum design. In the CAPS there is not an explicit ‘emphasis on teacher-directed, whole class teaching’ or ‘greater use of direct instruction and explicit teaching’. However, the CAPS document does indicate in a few sentences how teach-ers should handle the teaching and learning of content using contexts (Doc 2.1, pp 8, 12-13) and there are specific instances of ‘direct instruction’ to do with assessment, namely ‘divide the class into groups and each group is responsible for a sports activity…’ (Doc 2.1, p 71). In the CAPS ‘the curriculum descriptors are specific, easily understood, concise and measurable’ (Doc 2.1, pp 21-95); the curriculum is ‘based on established disciplines / categories of knowledge’ (Doc 2.1, p13), and the curriculum ‘relates to specific year lev-els’ (Doc 2.1, pp 11-14). All of these distinctions describe either a ‘standards approach’ or a ‘syllabus approach’ to curriculum design (Donnelly, 2007, Schmidt et al, 2005). In summary the CAPS is extremely specific in design, with well-organized sections and good

25Umalusi 2014 | Mathematical Literacy
amplifications which make the document a useful manual for teachers’ use.
With respect to user-friendliness of curriculum documentation, the NCS was rated as ‘Poor’ for the reason that it has 6 documents compared to the 3 documents for the CAPS. Teachers would experience difficulties in reading and understanding the contents of so many documents in order to competently teach within the guidelines and ethos of the curriculum in their daily teaching and learning situations. In addition, the organiza-tion and explanations within a single document are sometimes difficult to understand. For example, in order to design a Learning Programme the teacher needs to consult 7 pages of complex text describing three stages of development (Doc 1.2, pp 16-22). By contrast the CAPS documentation consists of only 3 documents. All information relating specif-ically to Mathematical Literacy is in one document. The other two CAPS documents, which deal with policy and assessment, are well designed. The table of contents of each provides a useful guide to navigate the pages, by describing clearly and in detail what is covered. Care has been taken in these two policy documents to define all technical terms used in the documents.
In terms of accessibility of language, the NCS has been rated as ‘Moderate’. While most of the documents use plain, direct language, at times the language is complex or ob-scure, or terms are ill-defined. For example, with regard to assessment, one of the docu-ments describes four types of assessment, three methods of assessment, three methods of collecting assessment evidence and two ways of recording and reporting. While these assessment descriptors are in themselves valid and can be used, teachers who have to implement the curriculum in the classroom would find the organization and terminology of this section redundant, abstract and obscure rather than simple and straightforward (Doc 1.1, 2003, pp 46-49).
Alignment in the NCS has been rated as ‘moderate’ because although it is sometimes clear how some documents relate to one another, it is difficult to work out how succes-sive versions of documents complement or relate to one another. Teachers would have to be sure of the chronological order of the documents. With respect to assessment, a teacher would have to read Chapter 4 in Doc 1.1, 35 pages in Doc 1.3 and 20 pages in Doc 1.4 to understand fully what is required for assessment. There are also instances of contradictions across the documents. For example, Doc 1.3, p15 suggests that exactly 25% of marks are allocated in either Paper 1and 2 for each of the Learning Outcomes (LOs), whereas Doc 1.4, p 5 allocates approximately 25% (± 5%) to each Learning Out-come (LO). Hence, in the latter document, it is possible for one LO to be allocated 30% of the marks and another one 20%. Another example of a contradiction in the NCS doc-uments is the time allocation with respect to teaching Mathematical Literacy. Doc 1.6, p21 shows a teaching time allocation per week of 5 hours, whilst Doc 1.2, p17 shows a teaching time allocation of 4 hours per week. This is a difference of 32-36 hours per year. In contrast, the CAPS documents do not reveal any obvious contradictions and the vari-ous documents complement and relate to each other well.
The evaluation team found that the broad design of the CAPS, with its clear and specif-

26 Umalusi 2014 | Mathematical Literacy
ic format and user-friendliness, is an improvement on the NCS, with its large number of documents containing some significant contradictions and vague descriptors and in-structions.
2.4 CURRiCULUM oBJeCtives
Table 4 below lists the aims and objectives of both the NCS and the CAPS showing where they are and are not aligned.
Table 4: Subject-specific aims / objectives of the curricula
objectives
nCs CAPs
objective numberPage number where similar aspect iden-
tifiedUse mathematical skills to identify, pose and solve prob-lems 1 pp 8,9
Work collaboratively in teams 2 p 5organise authentic activities in mathematical ways that demonstrate sensitivity to personal/societal concerns 3 p 5
Collect, analyse and organise quantitative data to evalu-ate and critique conclusions 4 p 5
Communicate appropriately by using descriptions in words, graphs, symbols, tables and diagrams 5 pp 5,9
Demonstrate a knowledge of the interrelatedness of sys-tems 6 p 5
Use mathematical literacy to ensure that science and technology are applied responsibly to the environment and to the health of others
7 pp 5,9
Use a variety of individual and co-operative strategies in Mathematics 8 p 9
engage responsibly with quantitative arguments relating to local, national and global issues 9 pp 4,8
Be sensitive to the aesthetic value of Mathematics 10Explore the importance of mathematical literacy for career opportunities 11
Realise that mathematical literacy contributes to entrepre-neurial success 12
Critically reflect on mathematical content in the media p 8Use non-mathematical skills to make sense of situations p 8Develop and practice decision-making skills pp 5,9
In the NCS the twelve aims and objectives specific to Mathematical Literacy (numbered 1-12 in Table 3) are dealt with explicitly and in detail under the heading Purpose (Doc 1.1, p 10). In listing them, the essential aspect of each is shown in bold. The CAPS does not specify aims and objectives explicitly. In the CAPS the aims and objectives are implied

27Umalusi 2014 | Mathematical Literacy
in the General Aims of the South African Curriculum (Doc 2.1, pp 4, 5) and in the Section called ‘What is Mathematical Literacy’? (Doc 2.1, pp 8-10).
The fact that the CAPS does not spesify subject specific aims and objectives made it dif-ficult for the evaluation team to compare them in the two documents. It seems that the NCS aims and objectives are more specific and more detailed than those of the CAPS. While this may seem like a short-coming in the CAPS, the team was of the opinion that some of the aims and objectives of the NCS are unrealistic, for instance, ‘be sensitive to the aesthetic value of mathematics’.
2.5 Content/sKiLL CoveRAGe
Comparison of the design of the two curricula: The team found that it was difficult to compare the NCS and the CAPS as the structure of each curriculum and the terminology used by each document is different.
In the NCS, the curriculum is described in terms of four LOs which each have several ASs. The NCS also has a list of mathematical content for every LO in every grade which is to be integrated into the teaching of the LOs (Doc 1.1, pp 38-42).
By contrast, the CAPS is described in terms of a list of Basic Skills and Application Top-ics (ATs). The Basic Skills ‘comprise elementary mathematical content/skills that learners have already been exposed to in Grade 9’ (Doc 2.1 p 13). The Basic Skills are to be taught in Grade 10 without reference to any real-life context. The Basic Skills are to be applied to five ATs in which ‘Learners will use the content and/or skills outlined in the Basic Skills Topics tounderstandsituationsandsolveproblemsinscenarioscomprisingthefiveApplicationTopics’ (Doc 2.1, p 21).
The terminology of the two curricula is not equivalent. In the CAPS, ATs comprise the con-texts in which to use the Basic Skills (Doc 2.1, p 9) to solve real life problems. By marked contrast, in the NCS, LOs suggest mathematical areas of learning ‘to enable learners passingthroughtheFETbandtohandlewithconfidencetheMathematicsthataffectstheir lives’ (Doc 1.1, p 11). Every LO has specific sub-outcomes (called ASs). In each LO, several contexts are suggested (Doc 1.1, pp 14-37).
Besides the difference in terminology of the curricula there is a more essential difference of approach. In the NCS, mathematical skills and concepts are expressed implicitly in a variety of contexts. In the CAPS important contexts are chosen because they use explicit mathematical skills. Figure 1shows this in a diagrammatic way.

28 Umalusi 2014 | Mathematical Literacy
This is why it is difficult to map and compare elements of the two curricula. Figure 2 is another representation of the difference in the organizational elements and design of the two curricula. The diagram demonstrates how the four LOs of the NCS have been re-structured into five ATs and Basic Skills which, although taught separately, are also incor-porated into the ATs. The content of the NSC has not been redistributed in a one-to-one transformation in the CAPS. The percentages in the blocks refer to the weighting given to the final assessment in Grade 12.
nCs desiGn
Mathematical Skills
CAPs desiGn
Real-life problems and situations
are expressed in
require
real-life problems and contexts.
mathematical skills.
At1
Finance
35% ±5
At2
Measurements
20% ±5
At3
Maps, plans and representations
15% ±5
At4
data handling
25% ±5
At5
Probability
5%
Lo1
numbers
25%
Lo2
Relations
25%
Lo3
space and shapes
25%
Lo4
data handling
25%
CAPs
nCs
Basic skills
Figure1: nCs and CAPs designs
Figure2: the design and organisation of the nCs and CAPs Mathematical Literacy curricula

29Umalusi 2014 | Mathematical Literacy
A large part of Numbers and Functional Relations is covered in the Basic Skills topics. In the NCS Functional Relationships is presented in an abstract way which makes it more difficult than the way it is handled in the CAPS. Space and Shape (in NCS) is split into two separate topics in CAPS, as is Data Handling. Therefore the matching of equivalent or-ganizational elements of the two curricula is almost impossible.
To analyse the content/skills coverage of the NCS and CAPS, the team designed a table (see Annexure A) using the core topics of the CAPS (Basic Skills and ATs) and evidence of similar content/skills in the NCS document.
The evaluation team found that it was difficult to analyse the depth of topics without considering this together with the breadth because of:
(i) The lack of comparability of terminology in the two curricula (ii) The fact that so much of the content of the NCS is implicit and therefore subject to
interpretation(iii) The fact that it is often the context of the content/skills that creates the depth of the
topics
This section concludes with a discussion of the overall qualitative comparison of breadth and depth of the two curricula.
2.5.1 Breadth and depth
Basic breadth skills: The evaluation team found it difficult to identify basic skills in the NCS document because they are implicit in the ASs and can only be inferred from the exam-ples given (Doc 1.1, p 15). In the section headed Content and Contexts for the Attainment of Assessment Standards (Doc 1.1, pp 38-42), there are lists of content associated with each AS in every grade. While there is some overlap here with the Basic Skills of the CAPS, the lists comprise only single words or phrases without amplification or explanation. In the CAPS the Basic Skills are explicit, clearly listed and explained in detail (Doc 2.1, pp 26-46). The effect of this is that the CAPS Basic Skills seem to have greater breadth than the NCS.
A minor exception in the difference in the specification of breadth is with the Operational Laws, where the NCS specifies the Associative, Distributive and Commutative laws (Doc 1.1, p 14) and CAPS only the Distributive and Associative (Doc 2.1, p 29). However, the CAPS states that learners must be able to ‘apply addition and multiplication facts’, Doc 2.1, p 29), which implies that the Commutative law is to be used.
Basic depth skills: The evaluation team found it hard to compare depth of the Basic Skills found in the CAPS and the NCS, because of the difference in the structure and design of the curricula. The NCS does not place great emphasis on the explicit teaching of basic skills and assumes that the teacher knows which skills to use.

30 Umalusi 2014 | Mathematical Literacy
The evaluation team noted that the CAPS specifies that a ‘basic four-function calculator’ (Doc 2.1, p 8) is required, but the NCS specifies that all learners must be able to ‘use com-putationaltoolscompetently(ascientificcalculatoristakenastheminimum’ (Doc1.1, p 11). In the NCS, the scientific calculator helps learners to do compound interest problems at a greater depth than can be done with a non-scientific calculator.
In the next section, the ATs of the CAPS are discussed in terms of breadth and depth, and compared with the relevant section of the NCS (note Data handling and Probability are presented as two topics in the CAPS but only one in the NCS).
Finance breadth: There is greater breadth in the CAPS than the NCS, as it covers a broad-er scope by including two additional topics ‘financial documents’ and ‘tariff systems’ (Doc 2.1, p 49-50). The team could only find a single reference to ‘tariff systems’ in the Learning Programme Guidelines of the NCS (Doc1.2, p 30). The CAPS goes into much more detail about taxation (Doc 2.1, pp 58 – 59), (dealing with personal tax, UIF, pension fund and medical aid) than the NCS does. Taxation is dealt with in the NCS in minimal and vague manner (Doc 1.1, p 17).
Finance depth: The topic in the CAPS is clearly spelled out in more detail than in the NCS. The depth in the CAPS is notable; however, in the NCS, so much is implied that the depth is uncertain. However, in the NCS there is one topic which is done in greater depth than in the CAPS.
Learners are required to use compound interest with a variety of interest periods calcu-lated annually, bi-annually, quarterly and monthly. They are also required to calculate the time period, interest rate and principle amount (Doc 1.1, p 16) which is mathemati-cally more demanding. The team expressed concern at the inclusion in the NCS of time period calculation in compound interest (which uses logs) as this is beyond the scope of Mathematical Literacy.
By specifying that a scientific calculator is not required, the CAPS limits compound inter-est problems to a number of time periods not greater than 2. Whereas in the NCS, learn-ers are required to use formulae to calculate simple and compound interest, in the CAPS learners are expected to perform simple and compound interest calculations manually using a basic calculator, pen and paper, and/or spread-sheets. Simple and compound formulae have been excluded in the CAPS (Doc 2.1, p 54). This means that the problems which are solved may be viewed as superficial and contrived, as car and home loans are for periods of 5-25 years, rather than 2 years. It also means that interest periods like daily, monthly, quarterly or bi-annual cannot be used. This is problematic and an unde-sirable result of the specification of a non-scientific calculator. Another implication of the specification of a non-scientific calculator in the CAPS is that calculations with large numbers like millions or billions are problematic. This will affect the type of problems that can be addressed in DataHandlingandMeasurement. These two implications affect the authenticity of mathematical problems which can be set in this topic.

31Umalusi 2014 | Mathematical Literacy
Measurement breadth: The coverage of this topic in the NCS is broader than in the CAPS. It specifies the measurement of and calculations to do with more 2D polygons and 3D solids (Doc 1.1, p 24-25) than the CAPS does. The NCS also includes the calculation of an-gles in order to do calculations to solve problems in 2D and 3D plans, which is a complex mathematical competence (Doc 1.1, pp 24-25).
In one of the Measurement topics in the NCS, namely Perimeter, Area and Volume, learn-ers are expected to solve both 2-D and 3-D problems. The similar topic in the CAPS has as its primary focus working with 2-dimensional shapes and calculations of perimeter and area of such shapes. Solving 3-D (volume) problems has been restricted to the volume of rectangular boxes and cylinders in the CAPS (Doc 2.1, p 69).
Measurement depth: There is a greater depth in the NCS document than in the CAPS in the use of Pythagoras’ Theorem to calculate the side of a triangle as well as doing calcu-lations involving more complex solids, for example spheres and cones (Doc 1.1, p 25). This highlights the evaluation team’s contention that the emphases in the NCS have complex mathematical calculations, at the expense of real life problems.
Maps, plans and other representations of the physical world breadth: The four sub sec-tions are covered fully in the CAPS document but not across all three grades in the NCS document. For instance in Grade 10 there is no reference to maps, and in Grades 10 and 11 no reference to models.
The NCS Assessment Standard in Grade 12 involving models is complex and vague, name-ly ‘build a model of a school building based on a plan of the building’. No scaffolding or guidance has been provided prior to this stage as to how to build a model (Doc 1.1, p 27).
Maps, Plans and other representations of the physical world depth: The CAPS document introduces a lot more depth by introducing and building models in Grades 10 and 11 (Doc 2.1, p 80). There is great depth in only two of the sections in the NCS, and a gradual increase in complexity in all four sections in the CAPS document.
Whereas the NCS does not treat Maps,plansandotherrepresentations as an isolated topic, the CAPS introduces Maps,plansandotherrepresentations of the real world as a stand-alone topic. This topic includes exploring 3-D models and packaging arrange-ments in the CAPS.
data handling breadth: The NCS and the CAPS in this topic are of equal breadth.
data handling depth: The NCS goes to a greater depth in some sections in Data handling, e.g. representing data by line of best fit, standard deviation, Ogive curves and variance (Doc 1.1, pp 33-35). The CAPS has removed these topics because they involve complex mathematical skills and the use of a scientific calculator. In the NCS, calculation of per-centiles is required (Doc 1.1, p 35), whereas in the CAPS (Doc 2.1, p 84) only interpretation of percentiles is required.

32 Umalusi 2014 | Mathematical Literacy
Probability breadth: The breadth in Probability is comparable in the CAPS and the NCS, although the CAPS diversifies into many more contexts than the NCS.
Probability depth: Expression of probability for certain outcomes is done at greater depth in the CAPS, whereas it is only dealt with in Grade 10 in the NCS. Representations for de-termining possible outcomes are also dealt with over 3 years in the CAPS and only dealt with in Grade 11 in the NCS. These give the CAPS greater depth. However, the CAPS only requires the interpretation of tree-diagrams and two-way tables whereas the NCS docu-ment required the actual drawing of these presentations, which is a more complex skill. In the CAPS probability is explored through games and weather forecasts. National lotteries and gambling are introduced as well as risk assessments and articles from newspapers that refer to probabilities.
The following is a list of the topics or sections that have been omitted from the CAPS:
• Scientific notation• Financial indices• Pythagoras’ Theorem• Cones and spheres• Standard deviation and variance• Line of best fit• Cumulative frequency and Ogives • Optimal values for two discrete variables subject to two or more constraints (linear
programming)• Solving equations simultaneously using algebraic methods• Quadratic functions• Latitude and longitude• Time zones• Trigonometry, including angle sizes from 0 - 360 º• Transformation geometry• Geometrical plane figures and tessellations
These omissions in CAPS are all justified, as the team were of the opinion that, with the ex-ception of line of best fit, cumulative frequency, latitude and longitude and time zones, there is little relevance to everyday life scenarios in the topics or sections.
overall depth of the nCs: The NCS includes calculations at a great depth of mathemati-cal complexity, as can be seen by the list of topics excluded from assessment but which are part of the NCS. It would seem that the NCS defines its depth by the mathematics involved, rather than the depth of problem-solving of a real-life situation.

33Umalusi 2014 | Mathematical Literacy
overall depth of the CAPs: The CAPS goes into greater depth than in the NCS in the areas of application in which Mathematics is involved. Learners are required to understand the practical application of mathematical skills in any area at a greater depth.
overall comparison of breadth in the nCs and the CAPs: Table 5 below shows the com-parison in broad outline of the breadth in the NCS and the CAPS. In the table Yes (Y) refers to coverage of the topic and No (N) refers to omission of the topic. Content in brackets is included in only that curriculum.
table 5: Content/ skills coverage: Breadth
topic (Content/skill)
nCs CAPsGrade 10 Grade 11 Grade 12 Grade 10 Grade 11 Grade 12
Basic Skills Y Y Y Y Y Y
Finance Y Y Y Y(VAT included)
Y Y
Measurement Y N N
Y(Temperature
& time calculations introduced)
Y N
Maps, plans and other representations
Y Y YY
(Packaging arrangements)
Y(3-D models introduced)
Y(3-D models introduced)
Data Handling Y Y Y Y Y Y
Probability Y Y YY
(Games & weather
forecasts)
Y(Product claims
/tests where results could be
inaccurate)
Y(National lotteries,
gambling risk assessments Introduced)
The breadth of the NCS and the CAPS are comparable. However, throughout the CAPS the curriculum is highly specified and explained in great detail, compared to the abbre-viated and often implied specification in the NCS. This gives the impression of a much broader coverage in the CAPS.
overall comparison of depth in the nCs and the CAPs: The evaluation team found it challenging to allocate a degree of cognitive complexity to many of the topics, either by virtue of their conceptual difficulty or calculations. In Mathematical Literacy the depth is most often determined by the context and nature of the problem, not the area of learn-ing. Some topics can be a routine procedure, multistep procedure or require high order thinking, depending on the data used and the context of the problem. However, in the opinion of the evaluation team, the sections associated with MeasurementsandMaps,plans and representations are generally the conceptually more demanding topics to understand. Those dealing with Numbers and Data handling are conceptually easier.
In one sense the NCS (Doc 1.1) has greater depth than the CAPS (Doc 2.1) because it contains topics that require application of more complex mathematical skills. However

34 Umalusi 2014 | Mathematical Literacy
it should be noted that the subsequent revised assessment and examination guidelines (Doc1.3 and Doc 1.4) exclude these same applications of complex mathematics for as-sessment purposes from 2008 onwards.
It is the evaluation team’s opinion that the applications described above of complex mathematics in the NCS are not appropriate for Mathematical Literacy and it is therefore appropriate that the CAPS does not include them.
However, in another sense the CAPS goes into greater depth in almost every topic. Learn-ers are expected to know more about the topic and to understand the complexity of the authentic real life situation, more than in the NCS. For instance, the CAPS lays great emphasis on the use of correct terminology and explains the terms fully. For example it describes more than 30 terms to be understood and used in ‘financial documents’ (Doc 2.1, p 49). The NCS does not even refer to financial documents.
Another instance of greater depth of knowledge required by the CAPS than the NCS is in the coverage of percentages. In the CAPS (Doc 2.1, p 34), 11 types of percentage calculations are listed, compared with the NCS in which percentage is just mentioned as one type of problem in an example in the NCS (Doc 1.1, p 14).
2.5.2 Specification of topics
Table 6 compares the degree of specification of the NCS and the CAPS and gives exam-ples to justify the comparison.
Table 6: Degree of specification of topicsnCs CAPs
Degree of specification Low HighExample 1 An example of too little detail spec-
ified: Assessment Standard 11.2.2.: Draw graphs as required by the situations and problems being investi-gated. Only example given: Compare cost of cell phone packages for differ-ent call intervals by drawing graphs of cost against time. (Doc 1.1, p 23)
Very detailed content specified: Basic Skills: Operations using numbers and calculator skills – 15 bullets given of the types of operations (Doc 2.1, p 29)
Example 2 An example of a vague and too broad description: Assessment Stand-ard 12.1.1: Correctly apply problem-solving and calculation skills to situations and problems dealt with. Only example given: Work with issues involving proportional representation in voting (Doc 1.1, p 15)
Taxation as a topic is divided into Income Tax and VAT, UIF and income tax. For each grade specific source documents are specified. The types of calculations involving VAT and UIF are specified. Two methods of calculating ‘price before VAT’ are also given. Doc 2.1, pp 58, 59)

35Umalusi 2014 | Mathematical Literacy
There is a clear difference between the NCS and the CAPS with respect to specification of the curriculum. The NCS has contracted assessment statements which lack detailed descriptors of what exactly is to be assessed. An instance of lack of specification in the NCS is ‘working with two or more relationships’. In Grade 10 it is not specified that only single relationships are to be taught although the example implies it is (Doc 1.1, p22). In another AS, the description of simple and compound interest is ambiguous about wheth-er all the types of calculation apply to simple and compound interest or to simple interest only (Doc1.1, p16).
Teachers who use the NCS would have only one or two, or even no examples (Doc 1.1, pp 16-17(ASs 10.1.2 – 12.1.2)) of the type of problem to be solved. The problems are not stated in a way that can be used in the classroom. This would mean that the textbook writers would have to interpret the curriculum (with very little help from the curriculum ASs) in order to provide the actual types of problems for the teacher to use.
By contrast, the CAPS is highly specific about the scope of every topic and the range of problems associated with it. The detail with which the Basic Skills are described, leave no uncertainty for the teacher using the CAPS as to what must be taught.
In the ATs, the scope of every topic is well defined and so is the purpose of every sub-sec-tion. Every sub-section of an AT contains the words ‘work with / identify / determine’ …. a list of topics, followed by ‘in order to’… perform certain calculations, analyses, etc. Even a teacher new to teaching Mathematical Literacy would have little difficulty understand-ing what is required in the teaching of the subject.
To give an idea of the high level of specification, the team looked at Measurement in AT3. In this section, page 62 outlines 20 different contexts across Grades 10-12, in which the practical measurement of length and distance, mass, volume and temperature should happen in class (Doc 2.1, p 62). This is followed by four pages of content/skills to be developed in the measurement of length and distance, mass, volume and tempera-ture (Doc 2.1, pp 64-47).
2.5.3 Comment on the overall content/skills coverage
When comparing the CAPS with the NCS it was found that the CAPS provides more direc-tion and support for teaching and learning of the subject (Doc 2.1, pp 8-127) compared to the NCS, which lacks clarity and specific detail.
The nCs places great emphasis on complex mathematical calculations, for example trigonometry, linear programming, standard deviations, ogives, variance, cones and spheres, calculation of angle sizes, latitude, longitude and international time zones. This type of abstract thinking would have had an impact on overall syllabus coverage and time, because learners would have needed more time to master them and as a result,

36 Umalusi 2014 | Mathematical Literacy
time would have to be taken from the teaching of other topics. For many learners this type of complex thinking would prove to be too challenging. These topics have been omitted from the CAPS (as has been noted above) and this is an improvement in the view of the evaluation team.
These are also the topics that were excluded from assessment for the years 2008 onwards (Doc 1.2, Revised assessment guidelines 2008). The implication of their exclusion is that there is a significant difference between the intended NCS and the curriculum as it was implemented by most schools and assessed at the end of Grade 12. There was also a difference in implementation by different examining bodies.
The CAPs has a discipline-based component (Mathematics) in the Basic Skills section, which provides the essential tools to tackle ATs. The skills of this section are essentially some skills and concepts of Grade 9 Mathematics, with which both learners and teach-ers are familiar. However, the subject of Mathematical Literacy is not Mathematics, rath-er it is a ‘literacy’ or a competence or facility with quantitative problems in life. This is made clear in the CAPS in that the problems are never contrived for the sake of using Mathematics. This is an improvement over the NCS. The evaluation team found the CAPS approach to be clearer and more understandable to the teaching and learning of this relatively new subject.
In conclusion, although there is not much ‘new’ content listed in the CAPS, the document is more explicit than the NCS about precisely what needs to be taught under each topic and section. While the NCS contains vague ASs, the CAPS has specific achievable goals in each topic. The NCS contains uncertainties regarding what is teachable content, for example critical debates about socially responsible trade compared with the specific guidelines stated in the CAPS. The NCS contains limited direction regarding suitable con-texts while the CAPS provides helpful directions when choosing contexts. Furthermore, the NCS contains contradictions on emphasis between Mathematics and real world ap-plications while the CAPS suggests using authentic real life problems and using Mathe-matics to make sense of the world. The CAPS makes reference to the fact that real life can be structured in non-mathematical ways.
2.6 CURRiCULUM WeiGHtinG And eMPHAsis
2.6.1 Curriculum emphasis within the Phase (subject time allocation)
Table 7 compares the numbers of hours of teaching allocated in both curricula to Math-ematical Literacy.

37Umalusi 2014 | Mathematical Literacy
table 7: subject time allocationnCs CAPs
Total classroom time allocated for Mathematical Literacy in the phase (per week)
5 and 4 hours 4,5 hours
% of total classroom time allocated for all subjects in the phase
16,95% and 14,04% 16,36%
The time allocation and weighting as suggested in the NCS is contradictory. In Doc 1.6 (p 21) the time allocation for Mathematical Literacy is 5 hours per week whereas all other subjects have been given a weekly time allocation of 4,5 hours weekly, except Life Ori-entation with a time allocation of 2 hours. On the other hand Doc 1.2, p 17 indicates a weekly time allocation of 4 hours weekly for Mathematical Literacy and all other subjects are allocated 4,5 hours weekly, as in Doc 1.6.
The weekly time allocation and weighting of 4,5 hours as suggested in the CAPS (Doc 2.1, p 7) is the same as for subjects such as Home Language, First Additional Language and Mathematics, whilst other subjects have been allocated less time. This is in line with the position of Mathematical Literacy as part of Group A list of subjects for the FET phase (Doc 2.2, p 43).
2.6.2 Curriculum emphasis within the subject (topic weighting)
The information for Table 8a (below) was obtained from the teaching time allocation in examples of work schedules for each grade in Annexures 2, 3 and 4 of the NCS (Doc 1.2, pp 26, 31, 40) and for the CAPS (Doc 2.1, pp 15-20). In the table, the column headed Across the Phase refers to the average teaching time as a percentage across the three grades. There is no assessment weighting specified for Basic Skills.
In Table 8a the correlation between average teaching time weighting and percentage allocation of marks in assessment is shaded in the table below as follows:
High correlation: If the average teaching time differs by less than 2,5% from the allocation of marks
Low correlation: If the average teaching time differs by 2,5% or more from the allocation of marks.

38 Umalusi 2014 | Mathematical Literacy
table 8a: Grade 10-12 Weighting per topic/emphasis within the subject% time allocated in each curriculum
nCs CAPsCentral topics
[% marks in assessment]
Gr 10 Gr 11 Gr 12Avg % across
the phase, CoRReLAtion
Central topics [% marks in assessment]
Gr 10 Gr 11 Gr 12Avg % across
the phase, CoRReLAtion
Basic Skills [0] 25 10 0 12
Numbers [25] 25 18 28 23.5
HIGHFinance [35±5] 21 32 32 28
LOW
Functions & relationships
[25]24 24 23.5 23.5
HIGHMeasurement
[20±5] 18 23 20 20 HIGH
Space, shape & measure-
ment [25]
21 31 25 26 HIGH
Maps, plans & representa-
tions of physical world
[15±5]
15 16 20 17 HIGH
Data han-dling [25]
30 27 23.5 27 HIGH
Data Handling [25±5] 15 13 20 16
LOW
Probability [Min.5] 6 6 8 7
HIGH
Revision 0 0 0 3 2 2
Total no. of teaching
weeks (excl. revision)
36 36 32 33 31 25
nCs topic weighting across the Phase: In terms of the evaluation team’s definition of correlation all four LOs have a high correlation with the percentage of marks awarded in assessment.
In the evaluation team’s judgement, Functional Relationships (LO2) and Space, Shape andMeasurement (LO3) are conceptually the most difficult topics and Data Handling (LO4) conceptually the easiest topic. It is therefore regrettable that LO2 received signifi-cantly less teaching time than LO4.
CAPs topic weighting across the Phase: There is a significant emphasis on Basic Skills which are a prerequisite for all the other ATs. Most of this weighting is in Grade 10, which is the appropriate year in which to focus on Basic Skills.
In the ATs, Finance (AT1) is weighted the highest across the phase with the emphasis be-ing mostly in Grade11 and Grade12. This is an appropriate focus as this topic has been considerably extended in the CAPS. It is also appropriate that Data Handling and Prob-ability are weighted the least. In the evaluation team’s judgement learners have found these topics easier than the others in the past. The evaluation team noted that there is a significant focus on Data Handling in Grade 12 where more complex concepts like inter-pretation of quartiles and inter-quartile range, multiple sets of data and box-and-whisker

39Umalusi 2014 | Mathematical Literacy
plots are introduced. Learners are also expected in Grade 12 to develop opposing argu-ments using the same sets of data, which is a high order skill.
When comparing the weighting for topics in the CAPS to assessment of the topics, it is noteworthy that there is a low correlation between topic weighting and assessment weighting in Finance and Data Handling. The implication of this is that learners will not receive sufficient tuition time to cover these topics. This will be a disadvantage since these topics have a high mark allocation in the assessment of Mathematical Literacy. The evaluation team considers the lack of teaching time for Finance and Data Handling to be a serious shortfall.
In the CAPS, in addition to the suggested work schedules there is also a summary of the number of weeks to be spent on each topic (Doc 2.1, p 15). This may cause confusion for some teachers through having two different ways of allocating time to topics. Each topic is allocated a range of number of weeks, i.e. Finance: 6-7 weeks. If the maximum num-ber of weeks is used, the allocation to topics will be different from the Work Schedules in the following pages (Doc 2.1, pp 16-20). The total number of weeks spent in teaching per grade is also different. Table 8b below summarizes the allocation to topics from the summary in the CAPS. However, if the average percentage of teaching time spent is compared to that in Table 8a the difference is not significant.
Table 8b uses information from another page of the CAPS (Doc 2.1, p 15) to show the allocation of teaching time across the phase.
table 8b: summary of the percentage of weeks allocated to each topic
topicPercentage of time allo-
cated to topicAverage
percentage across the
phaseGr 10 Gr 11 Gr 12
Basic skills topicsNumbers & calculations with numbers 16 0 0 5Patterns, relationships and representations 11 11 0 7
Application skills
Finance 19 29 32 27Measurement 19 23 21.5 21Maps, plans and other representations of the physical world 16 17 18 17
Data Handling 14 14 21.5 17Probability 5 6 7 6
total number of teaching weeks in each Grade 37 35 28
Comparison across the phase: Because of the differences in design of the two curricula it was difficult to compare the LOs of the NCS with the ATs of the CAPS. Within the NCS Numbers is largely embedded in the other three LOs. In the CAPS Basic Skills are taught separately as well as embedded in all four ATs.
In the NCS Finance is only one small component of Numbers (LO1) which takes 24% of teaching time, whereas Finance (as a single AT) in CAPS is allocated 28% of teaching

40 Umalusi 2014 | Mathematical Literacy
time. The implication of this difference of emphasis is that much more time is spent on Finance across the phase in the CAPS than in the NCS.
The evaluation team considered this to be an improvement on the NCS approach. How-ever, the teaching time allocated to Finance should be correlated more closely with the weighting given to the topic in assessment.
The broad learning area of Measurement,Space,Shape,PlansandMaps is treated very differently in NCS and CAPS. In NCS it is covered by Learning Outcome 3 which is allocat-ed 26% of the teaching time across the phase. In the CAPS it is covered by ATs 2 and 3 which are allocated a combined 37% of teaching time. This is a significant shift and one which the evaluation team felt is an improvement on NCS as this learning area is concep-tually difficult for most learners.
2.7 CURRiCULUM PACinG
Table 9 summarizes the level of specification in the two curricula of the pacing of teach-ing. The specification of pacing and the pacing itself are then discussed in more detail.
Table 9: Specification of pacing, and level of pacing in the NCS and the CAPSnCs CAPs
Level of specification of pacing High Moderate
Rationale / justification Examples of work schedules are very detailed for every week. (Doc 1.2, p 23-46)
Suggested work schedules specify broad content for every week. (Doc 1.2, p 16-20) A summary of the num-ber of weeks spent on each topic is also provided (DOC 2.1, p15). these two sources of pacing are not in total agreement.
Level of pacing itself Moderate Moderate
Rationale / justification
While Functional Relationships is con-ceptually difficult and needs a slower pace and more time, Data Handling is familiar and conceptually easier and does not need much time. These two imbalances of pacing compensate each other overall.
Based on an overall impression from Table 8b, not on detailed specification of content to be taught per week per grade.
Comparison of the specification of pacing in the NCS and the CAPS: The NCS gives excel-lent examples of work schedules for each grade for Mathematical Literacy. The sched-ules cover 40 weeks of the year, which include revision and examination time. The ac-tual teaching time is calculated as 36 weeks for Grade 10, 36 weeks for Grade 11 and

41Umalusi 2014 | Mathematical Literacy
25 weeks for Grade 12. Both Grades 10 and 11 are allocated 2 weeks for revision and examinations. In Grade 12 there are 3 weeks allocated to revision (Doc 1.2, pp 23-46). Suggested contexts for the problems are given. Assessment tasks are specified as well as resources needed for every section (Doc 1.2, pp 23-46).
By contrast, the work schedules in the CAPS do not cover all 40 weeks of the year. The actual teaching time for Grade 10 is calculated as 34 weeks, for Grade 11 as 31 weeks and for Grade 12 as 25 weeks (Doc 2.1, pp 16-19). With regard to revision, Grade10 has 3 weeks, Grade 11 has 2 weeks and Grade 12 has 2 weeks in the first half-year and an un-specified number in Term 4. No specific mention is made in the work schedules of a time period for assessment or examinations. It may be inferred that the tenth week of every term is to be used for assessment (Doc 2.1, pp 16-19). There is insufficient detail given in the work schedules about the actual content to be taught or the resources needed for the teaching. While the content is explained in great detail elsewhere (Doc 2.1, pp 26-95) the teacher is required to either interpret what content to deal with in any week or use a textbook which does this for him or her.
Comparison of pacing in the nCs and the CAPs: The pacing in the NCS is moderate. There are however some weeks where the pacing might be considered too slow. For ex-ample, in weeks 7-8 (Doc 1.2, p 27) and in weeks 28-33 (Doc 1.2, p 29) the specified Data Handling content in Grade 10 could be covered in less classroom time and some given to learners to do as homework/research. Similarly in weeks 15-16 (Doc 1.2, p 32) and in weeks 33-37 (Doc 1.2, p 34 ) the specified Data Handling content in Grade 11 could be covered in less classroom time and some given to learners to do as homework/research. The evaluation team was concerned by the fast pace of the sections dealing with Func-tional Relationships. For instance, only one week is given in Grade 10 to drawing graphs and applying Mathematics to income and expenditure and the impact of interest, both simple and compound (Doc 1.2, p 28). In Grade 11, two weeks is considered to be very little time to cover cost price and selling price, profit margins, break-even points, optimal ranges and relationships between variables (Doc 1.2, p 31).
The pacing in the CAPS is difficult to comment on because the content is not differenti-ated per week per grade. The grade content description does not state how long each section and sub-section should take to teach. For example, Finance in Grade 10 should take 6-7 weeks (Doc 2.1, p 15). The content for those weeks is described on eleven pages (Doc 2.1, p 49-60). However the CAPS does not specify the pacing for each section. This is true for all grades for ATs.
As a result of this it is not possible to compare the two curricula with respect to the pacing of the two curricula. As a general comment based on Table 8b it appears that the CAPS allows too much time for the teaching of Data Handling and Probability, and possibly too little time for Finance. However, this is just an overall impression. Finer detail of the pacing of smaller sections is not given in the CAPS.

42 Umalusi 2014 | Mathematical Literacy
2.8 CURRiCULUM seQUenCinG And PRoGRession
2.8.1 Specification of sequence
Table 10 shows the comparison of the levels of specification of the sequencing of the two curricula.
Table 10: Specification of sequencingnCs CAPs
Level of specification Moderate High
Rationale / justification
The rationale for teaching some topics is unclear, as some are taught in only one grade, and not developed in the higher grades. There are topics in the NCS document which are dealt with in Grade 10 or 11, but omitted in Grade 12, for example, tree-diagrams and simple contingency tables are dealt with in Grade 11, but there is no mention of this in Grade 12 (Doc1.1, p 37).
The CAPS sequencing is more purpose-ful than that of the NCS’s and related to the need to introduce a topic in one grade and then develop it in later grade(s), for example the CAPS docu-ment introduces the tree-diagram and two way tables in Grade 10 and deals with these same topics in Grades 11 and 12 (Doc 2.1, p 93).
Degree of specification of sequencing in the NCS and the CAPS: In terms of topics and sequencing, both curricula specify the order in which topics have to be taught within each grade and across the phase. (Doc1.2, pp 26 – 45; Doc 2.1, pp 21 – 95). The curricula are similar in indicating the number of weeks that need to be spent on each particular topic in each grade, although the order or level of difficulty may differ (Doc 1.2, pp 26 – 45; Doc 2.1, p15).
The NCS lacks the flow of working from simple to more complex contexts. Some topics are introduced without any prior knowledge or exposure in previous grades, for example in the NCS the use and interpretation of scale drawings to estimate and calculate values in order to build a 3D model are dealt with for the first time in Grade 12 (Doc 1.1, p 27), whereas the CAPS deals with simple 3D models in Grade 10, building 3D scale models in Grade 11 and more complex 3D models in Grade 12 (Doc 2.1, p 72).
There are topics in the NCS which are dealt with in Grade 10 or 11, but omitted in other grades, for example, break-even analysis (Doc 1.1, p 21). Selling prices (Doc 1.1, p 17) are introduced in Grade 11 but not dealt with in Grade 12. The CAPS introduces break-even analysis and selling and cost price in Grade 11 and deals with the same topics in Grade 12 (Doc 2.1, p 48).
The CAPS indicates clearly that a topic taught in Grade 10 is relevant in Grades 11 and 12, for example, simple and compound interest are introduced in Grade 10, but are also taught in Grades 11 and 12 (Doc 2.1, p 54 – 57). The NCS indicates that simple and com-pound interest with period changes ought to be done in Grade 10 only (Doc1.1, p 16).

43Umalusi 2014 | Mathematical Literacy
In summary the CAPS sequencing is more purposeful and related to the need to intro-duce a topic in one grade and then develop it in later grade(s). This is well described in the documents. The NCS, on the other hand, seems at times to have no rationale for teaching a topic only once in a grade and then not developing or building on it.
2.8.2 indication of progression
Table 11 compares the progression within the grades and across the phase in the NCS and the CAPS.
table 11: indication of progression – within and across gradesnCs CAPs
With
in g
rade
s
Level of indication Weak StrongRationale / justification For example, learners are required
to construct models for the first time and then to scale, in Grade 12 (Doc 1.1, p 27).
The CAPS gradually introduces most topics from Grade 10, and these are extended to Grade 11 and 12, with a progression of difficulty inherent in more com-plex contexts, which makes the increasing level of difficulty more manageable. For instance, meas-uring mass (Doc 2.1, pp 65-66).
Acr
oss
grad
es
Level of indication Weak StrongRationale / justification For example, in the NCS docu-
ment, ASs10.1, 11.1 and 12.1 do not actually demonstrate pro-gression in problem solving. In fact some of the examples in the AS10.1 seem more difficult than the ones in AS11.1.
In the CAPS document the level of complexity increases each year and is explicitly stated. For exam-ple, with respect to Data Handling, in Grade 10 learners are required to work ‘with single sets of data’, in Grade 11 learners are expected ‘to use two sets of data’ and in Grade 12 ‘to use multiple sets of data’ (Doc2.1, p 82).
The progression of level of difficulty in the NCS is not consistent nor well specified. For example, calculations involving Value added tax (VAT) seem to be omitted from the NCS in all grades, but the curriculum indicates that the effects of taxation have to be analysed and critically interpreted in a wide variety of financial situations (Doc 1.1, p 17). It is unclear whether the teacher should assume that this includes VAT. The CAPS is more specific: Taxation calculations are introduced in Grade 10 and gradually increased in dif-ficulty in Grade 11 (e.g. VAT, Unemployment Insurance Fund (UIF), Pay as You Earn (PAYE) and Standard Income Tax on Employees (SITE)) and Grade 12 when personal taxation (e.g. tax rate tables, income tax forms and tax deductions) is introduced (Doc 2.1, p 49).
The fact that some topics are introduced only in Grade 12 in the NCS indicates a lack of progression across the phase. It also makes the level of difficulty greater as learners have less time to practise the skills necessary to meet the assessment requirements. For exam-ple, learners are required to construct models for the first time and to scale, in Grade 12

44 Umalusi 2014 | Mathematical Literacy
(Doc 1.1, p 27). The CAPS gradually introduces most topics from Grade 10, and these are extended to Grades 11 and 12, with a progression of difficulty inherent in more complex contexts, which makes the increasing level of difficulty more manageable. For instance, in Patterns and Relationships learners are expected to use a single relationship in Grade 10, two relationships in Grade 11 and two or more relationships in Grade 12 (Doc 2.1, p 36).
There are topics in the NCS which are dealt with in Grade 10 or 11, but omitted in oth-er grades. This makes it difficult for teachers and learners as a topic is dealt with in one grade but never again. For example in the NCS Grade 10, learners are required to learn to express probability values in terms of fractions, ratios and percentages (Doc 1.1, p 36), and then the expression of probability is not specifically dealt with again in Grade 11 and 12 (Doc 1.1, p 37). The CAPS shows a progression in handling expressions of probability in Grades 10, 11 and 12 at different levels of difficulty (Doc 2.1, p 90).
Although similar content is taught in both curricula, the order and level of difficulty is vague in the NCS and clearer in the CAPS. For example in the NCS, ASs 10.1, 11.1 and 12.1 do not actually demonstrate progression in problem solving. In fact some of the ex-amples in the AS10.1 seem more difficult than the ones in AS11.1. In AS12.1 learners are simply expected to ‘correctly apply problem-solving and calculation skills to situations and problems dealt with’ (Doc1.1, p 15) without the document specifying a context or type of problem. There is no indication of the degree of complexity of the problems, only a vague general instruction.
The CAPS, on the other hand, states explicitly that, in a certain topic, learners have to identify and perform calculations involving income, expenditure, profit and loss values in order to manage finances in a household, for a trip or for personal projects (Doc 2.1, p 51). These types of calculations are made progressively more difficult by a more complex context in each grade.
In the NCS the description of the topics across the three grades does not always show a clear progression in the level of complexity or difficulty at which topics are to be taught. For example, the AS 11.4.1 is exactly the same as AS 12.4.1 (Doc1.1, p 31). Grade 11 and Grade 12 learners are expected to ‘use appropriate statistical methods, select a representative sample from a population and compare data from different sources and samples’. While the examples given are different, they are not more difficult in Grade 12. Hence the progression in the NCS from one grade to another is not always apparent.
By contrast, in the CAPS the same criteria are given but the level of complexity increases each year. For example, in Grade 10 learners are required to work ‘with single sets of data’, in Grade 11 learners are expected ‘to use two sets of data’ and in Grade 12 ‘to use multiple sets of data’ (Doc 2.1, p 82).
In summary, progression is clearly evident in the CAPS throughout the Basic Skills and ATs. By contrast the NCS does not have consistent, clear progression. In fact, with some con-tent, the layering of content with respect to difficulty is not apparent.

45Umalusi 2014 | Mathematical Literacy
2.9 sPeCiFiCAtion oF PedAGoGiC APPRoACHes
Table 12 compares the specified pedagogic approaches of the NCS and CAPS.
Table 12: Specified pedagogic approachnCs CAPs
Subject-specific pedagogic approach Outcomes-Based Education
Combination of constructivist/prob-lem-based/ standards-based/direct instruction approaches
Level of indication High Low/Moderate
Specification of pedagogic approach in the NCS: The declared pedagogic approach of the NCS is Outcomes-Based. This is supported by the following quotes:
• ‘Outcomes-Based Education forms the foundation for the curriculum in South Af-rica. It strives to enable all learners to reach their maximum learning potential by setting the LOs to be achieved by the end of the education process.’ (Doc1.1, p 2)
• ‘In an Outcomes-Based curriculum like the NCS Grades R-12 (General), subject boundaries are blurred.’ (Doc 1.1, p 6)
• ‘In line with the principles of outcome-based assessment, all assessment – both school-based and external – should primarily be criterion-referenced.’ (Doc 1.1, p 51)
• ‘ThefocusofMathematicalLiteracyisthedevelopmentofskills,knowledge,atti-tudesandvaluesrelatedtotheuseofMathematics inauthenticeverydaysitua-tions.’ (Doc 1.2, p 9)
Throughout the documents use is made of Outcomes-Based Education terminology such as the teacher being ‘a mediator of learning’ (Doc 1.1, p 5) and reference to ‘learn-er-centred’ activities (Doc 1.1, p 2). Even the Work Schedules are to be divided into ‘units of deliverable learning experiences’, rather than any reference to content (Doc 1.2, p 5).
In the overview of the National Curriculum Statement for Grades R-12 there seems to be an implicit assumption that teachers will perform the role more of facilitators than ac-tive initiators of the education process. ‘In the teaching and learning of Mathematical Literacy, learners will be provided with opportunities to engage with real-life problems in different contexts, and so to consolidate and extend basic mathematical skills. Thus, Mathematical Literacy will result in the ability to understand mathematical terminolo-gy and to make sense of numerical and spatial information communicated in tables, graphs, diagrams and texts. Furthermore, Mathematical Literacy will develop the use of basic mathematical skills in critically analysing situations and creatively solving everyday problems’ (Doc 1.6, p 47).
This is also expressed in the weighting of marks for Continuous Assessment (Doc 1.3, p 14) in which 15% of the marks in Grade 12 are awarded for investigations, and assignments, which are presumably learner-centred tasks.
While it can be seen from the above that the overwhelming thrust of the NCS is an Out-

46 Umalusi 2014 | Mathematical Literacy
come-based one, none-the-less, there are instances of other approaches.
The following quotes demonstrate a problem-based approach:
• FurthermoreMathematicalLiteracywilldeveloptheuseofbasicmathematicalskillsin critically analysing situations and creatively solving everyday problems. (Doc 1.1, p 9)
• Learners should use mathematical content to solve problems that are contextually based. (Doc 1.3, p 7)
• … learners will be provided with opportunities to engage with real life problems in different contexts and so consolidate and extend basic mathematical skills.’ (Doc 1.2, p 7)
By implication there is also reference to direct instruction, as in ‘When teaching and as-sessingMathematicalLiteracy,teachingshouldavoidteachingandassessingintheab-sence of context’. (Doc 1.3, p 7)
There is very little guidance to teachers about how to actually achieve OBE in the class-room. The NCS has broad statements about OBE but very little practical, concrete advice on how the teacher should behave. Apart from copies of the programme of 4 sessions of a teacher-training workshop provided in Document 1.5, there is no actual explanation of how to achieve OBE.
The only reference the evaluation team could find to guidelines regarding how to teach any part of the curriculum is in Doc 1.2, pp 23 – 25 which provides specific guidance for four weeks per grade in the form of extracts of a work schedule in order to guide teachers. In this example a teacher is given an exemplar of lessons including lesson fo-cus, activities and resources to be used in a sample of contexts. The actual pedagogic approach is difficult to interpret from the document. It appears to be a direct instruction approach. For the rest of the curriculum no explicit guidance regarding the preferred pedagogic approach is given.
Specification of pedagogic approach in the CAPS: The CAPS does not spell out the ped-agogic approach that teachers should take in teaching Mathematical Literacy. At best the approach is implied in statements about how learners should learn. Four different approaches are hinted at, namely a ‘constructivist’ approach, a ‘problem-based’ ap-proach, a ‘standards-based approach’ and a ‘direct instruction’ approach. To what extent any one of these approaches should be the dominant one is almost impossible to glean from the documents.
A constructivist approach can be inferred from the following quotes:
• ‘….. encouraging an active and critical approach to learning, rather than a rote and uncritical learning of given truths’ (Doc 2.1, p 4)

47Umalusi 2014 | Mathematical Literacy
• ‘……..thefocus inMathematicalLiteracy isonmakingsenseof real-lifecontextsand scenarios’ (Doc 2.1, p 8)
• ‘The Application Topics contain contexts related to scenarios involving daily life, workplace and business environments, and wider social and national issues that learners are expected to make sense of, and the content and skills needed to make sense of those contexts.’ (Doc 2.1, p 13)
A ‘problem-based’ approach can be inferred from the following quotes:
• ‘Wherever possible, learners must be able to work with real-life problems and re-sources,ratherthanproblemsdevelopedaroundsemi-real,contrivedand/orficti-tious scenarios.’ (Doc 2.1, p 8)
• ‘TheteachingandlearningofMathematicalLiteracyshouldthusprovideopportu-nities to analyse problems and devise ways to work mathematically in solving such problems.’ (Doc 2.1, p 8)
• ‘MathematicalLiteracydevelopsageneralsetofskillsneededtodealwithapar-ticular set of problems.’ (Doc 2.1, p 9)
• ‘As such, assessment tasks should require learners to take into account possible non-mathematical considerations that may have a bearing on the desired out-come to a problem.’ (Doc 2.1, p 96)
A ‘standards-based’ approach can be inferred from the following quote:
• ‘High knowledge and high skills: the minimum standards of knowledge and skills to beachievedateachgradearespecifiedandsethigh,achievablestandardsinallsubjects.’ (Doc 2.1, p 4)
A ‘direct instruction’ approach can be inferred from the following quotes:
• ‘…..intheMathematicalLiteracyclassroommathematicalcontentshouldnot be taught in the absence of contexts.’ (Doc 2.1, p 8)
• ‘However, this ability to solve problems without guidance is not something that de-velops naturally, but rather should be demonstrated and nurtured from Grade 10 to Grade 12.’ (Doc 2.1, p 12)
• ‘The inclusion of this content in this document provides teachers with the opportuni-ty to revise important concepts… ‘ (Doc 2.1, p 13)
• ‘Use quartile and percentile values, together with various measuring instruments in order to analyse the growth pattern of a baby/toddler and/or analyse the health statusofachildusingcalculatedBodyMassIndexvalues.’(Doc 2.1, p 85)
And finally, an example of a combined ‘direct instruction and constructivist’ approach:
• ‘Teachers need to design assessment tasks that provide learners with the oppor-tunity to demonstrate both competence in mathematical content and the ability

48 Umalusi 2014 | Mathematical Literacy
to use a variety of both mathematical and non-mathematical techniques and/ or considerations to make sense of real-life, everyday, meaningful problems.’ (Doc 2.1, p 96)
the appropriateness of the approaches: The way in which the CAPS has dealt with the specification of pedagogic approaches is appropriate, although lacking in specific in-structions on how a teacher needs to convey the content and skills required. The NCS gives guidance on how to teach (lesson focus, activities and resources) for only four weeks of the whole phase (Doc1.2, pp 23 – 25). There are no instructions for the teachers for the remaining weeks of the three grades on how to teach the topics, nor any guid-ance as to the levels of difficulty within respective grades.
the role of the teacher and the learner: The NCS assumes that teachers are able to plan, design and construct material around various topics and ASs. ‘These include being me-diators of learning, interpreters and designers of Learning Programmes and materials, leaders, administrators and managers, scholars, researchers and lifelong learners, com-munity members, citizens and pastors, assessors, and subject specialist’ (Doc1.1, p 5). In comparison the CAPS implies that teachers have to plan their lessons according to the given contexts and skills stipulated in the syllabus for each grade: ‘Possible assessment: Investigation: Comparing direct and indirect proportion; choose two different authen-tic real-life scenarios involving direct proportion and inverse proportion; draw graphs to represent each scenario; investigate, describe and explain the shapes of the graphs in relation to each scenario’ (Doc 2.1, p 32). This example shows that the CAPS gives some clear and precise instructions of possible teaching, learning and assessment approach-es. This type of instruction or guidance could be more clearly explained throughout the CAPS across all topics and grades.
2.10 AssessMent GUidAnCe
Table 13 compares the guidance given with respect to internal assessment across the two curricula.
table 13: AssessmentnCs CAPs
number of assess-ment tasks specified
8 per grade 8 per grade
types of assessment specified
5InvestigationAssignmentProjectControl testExamination
4InvestigationAssignmentControl testExamination

49Umalusi 2014 | Mathematical Literacy
table 13: Assessment (continued)nCs CAPs
examples of domi-nant types of assess-ment specified
Gr 10 and 111 assignment2 investigations1 project2 control tests2 examinations(Tests and exams carry the most weight)
Grade 122 assignments1 investigation / project2 tests3 examinations (Tests and exams carry the most weight)
Gr 10 and 112 assignments2 investigations2 control tests2 examinations(Tests and exams carry the most weight)
Grade 121 assignments1 investigation1 assignment / investigation2 control tests2 examinations(Tests and exams carry the most weight)
Specificity of assess-ment guidance
Subject-specific Subject-specific
Clarity of assessment guidance
High High
overview of assessment guidance: Both curricula are clear on assessment guidelines as tabulated in the NCS (Doc 1.3, pp 10, 14) and the CAPS (Doc 2.1, pp 99 – 100). There are eight required assessment tasks per grade in each curriculum. The NCS requires assess-ment tasks consisting of investigations, assignments, a project, tests and examinations. The CAPS requires assessment tasks such as assignments, investigations, control tests and examinations.
There is no external assessment in Grades 10 and 11 in the NCS and the CAPS. Both cur-ricula for Grade 12 consist of both internal and external assessments allocating 75% to the external examination and 25% to the internal assessment.
similarities and differences in assessment guidelines: The only difference between the two curricula is that the project is omitted in the CAPS assessment guidelines and re-placed with an investigation or assignment. It was noted that the ‘tests’ in the NCS have been renamed ‘control tests’ in the CAPS. The assessment guidance in both curricula is subject-specific. Both curricula contain a clear and specific programme of assessment, which leaves no room for ambiguity. There has been virtually no shift in the approach to internal assessment from the NCS to the CAPS.

50 Umalusi 2014 | Mathematical Literacy
2.11 CURRiCULUM inteGRAtion
2.11.1 integration between subjects
Table 14 compares the integration between subjects in the NCS and CAPS.
table 14: integration between subjectsnCs CAPs
Level of integration Low, with only one mention Low
example 1 (Only one example found over both curricula)
‘whether it is Dance, Design, Hospitality Studies, Business Management or the Natural and LifeSciences’ (Doc 1.2, p 9)
No example
Integration between different subjects
Although mention is made of integration with other subjects in the NCS, no practical or specific guidance is given on how to integrate Mathematical Literacy into the various subjects, for example ‘whether it is Dance, Design, Hospitality Studies, Business Manage-ment or the Natural and Life Sciences’ (Doc 1.2, p 9). Neither curriculum provides guid-ance to teachers on how to use Mathematical Literacy in a variety of other subjects. However, by implication the variety of different contexts suggested in both curricula may provide links to other subjects. The actual integration is left to the teacher to make the links to other subjects.
2.11.2 integration with the everyday world and knowledge of learners
Table 15 compares the integration between Mathematical Literacy and everyday knowl-edge.
table 15: integration between subject and everyday knowledgenCs CAPs
Level of integration High High
example 1 ‘Use grids, including the Cartesian plane and compass directions in order deter-mine locations and describe relative positions. For example local maps, seat location in cinemas and stadiums and room numbers in multi-levelled buildings’ (Doc1.1, p 27)
‘Complex projects involving measure-ment concepts integrated with content/skills from other topics in both familiar and unfamiliar contexts. Example using plans of an RDP (Reconstruction and Development Programme) house to de-termine quantities and cost of materials for the house’ (Doc 2.1, p 62)

51Umalusi 2014 | Mathematical Literacy
table 15: integration between subject and everyday knowledge (continued)nCs CAPs
example 2 ‘Draw graphs as required by the situ-ations and problems being investigat-ed. For example compare costs of cell phone packages for different call inter-vals by drawing graphs of cost against time’ (Doc1.1, p 23)
‘Workwiththefollowingfinancialdoc-uments: household bills (e.g. electricity, water, telephone, cell phone); shopping documents (e.g. till slips, account state-ments); banking documents (e.g. bank statements and fee structures)’ (Doc 2.1, p 49)
There is a highly developed relationship between Mathematical Literacy and everyday life in both the NCS and the CAPS. The formal knowledge as described in both curricula is always found within the context of everyday life and general knowledge of all learners. The world of personal life, work and communities are constantly referenced and forms part of the knowledge specified in the curricula.
2.12 CURRiCULUM oveRvieW
2.12.1 Curriculum coherence
in the nCs: While there is obviously a structure to this curriculum there is also a lack of explicit, clear, detailed explanation of what is to be covered in each grade. This makes the curriculum seem disjointed and unconnected. Examples are given which seem inap-propriate because of either the mathematical complexity or the grade in which they are to be taught. For example, a fairly complex formula without any explicit mathematical teaching in Grade 10 is introduced as a ‘simple formula’ namely A=P(1+i)n (Doc 1.1, p 14). Most Grade 10 learners would not find this simple! This lack of connectedness is also expressed by the lack of progression, in many instances, with respect to difficulty. Often different examples of the same work are given for each grade. In Learning Outcome 3.6 there is no difference between the wording of the work to be covered in Grade 10, 11 or 12 (Doc 1.1, pp 28-29).
The curriculum lacks coherence between mathematical skills and areas of learning. The former are not explained fully but contracted to terse summary phrases like ‘Fractions, decimals, percentages’ (Doc 1.1, p 38). There is no explicit direction as to how these skills are embedded in the LOs.
The stated objectives are wide-ranging. Many are lofty and probably unattainable. There is evidence in the curriculum of little coherence between stated objectives and what is to be taught. For instance ‘BesensitivetotheaestheticvalueofMathematics’and‘Explorethe importance of mathematical literacy for career opportunities’ are not represented in the LOs of the curriculum.
Overall the NCS lacks coherence and seems rather disjointed. Topics occur without de-velopment in prior grades, for example, building models to scale in Grade 12 (Doc 1.1, p 27). A sense of development of themes is not evident. Very little guidance is given about
52 Umalusi 2014 | Mathematical Literacy
how to create problems of greater complexity across the phase (Doc 1.1, p 15).
in the CAPs: Within the CAPS there is a notable sense of coherence within the design. One of the design features which promotes this coherence is the thread of contextual expan-sion which runs through all the ATs. Every topic is introduced in Grade 10 within the personal and familiar household context of the learner, expanded to the context of the workplace and business in Grade 11 and finally situated within a national and global context in Grade 12 (Doc 2.1, pp 21-24). In so doing the problems are made more challenging.
Another design feature which gives coherence to the curriculum is the explicit acknowl-edgement of the need to teach a wide range of basic mathematical skills as tools for problem-solving in the ATs, separately and at the beginning of Grade 10. The purpose of this is made explicit and the ATs encompass all the Basic Skills.
In terms of curriculum objectives there is coherence between the stated objectives and their implementation. For example, the objective ‘Use non-mathematical skills to make sense of situations’ is implemented in a possible assignment in Grade 10 which states ‘Keep a record of household income and expenditure for a time period’ (Doc 2.1, p 52). Another objective ‘Engage responsibly with quantitative arguments relating to local, national and global issues’ is implemented in a possible assignment in Grade 12 which states ‘Presentthefindingsofthestudy(onriskybehaviour)tothemanagement,learnersand teachers of the school’ (Doc 2.1, p 89).
Another feature of the design which promotes coherence is the stated integration of the ATs. Since the problems of Mathematical Literacy are real life ones, it is to be ex-pected that Finance,MeasurementandMaps,Plans etc. will be treated in one problem or assignment. For example, in Grade 12 a possible assignment called ‘Planning a trip’ requires the learner to ‘plan a trip between two cities or countries, using maps, bus/train/taxi/flighttimetables,tarifftables,exchangeratesandthefixedandrunningandoper-ating costs’ (Doc 2.1, p 75).
The overarching logic of the design of CAPS is the way in which the key idea of using basic mathematical skills to solve and make sense of practical real life problems is devel-oped conceptually and contextually across the phase. The explicit specification of this development is evident in that all Grade 10 topics are considered relevant to Grade 11 and Grade 12 (Doc 2.1, pp 54-57).
2.12.2 implications for the south African context
The CAPS is a great improvement on the NCS. It handles the need for teaching basic mathematical skills explicitly and in great detail (Doc 2.1, p 25-46). This is extremely help-ful to teachers, especially those whose background is that of not being a Mathemat-ics teacher, who include a substantial proportion of Mathematical Literacy teachers in South Africa. For learners, the emphasis on basic mathematical skills is empowering and

53Umalusi 2014 | Mathematical Literacy
will give them a greater sense of confidence to tackle quantitative and numerical prob-lems in the ATs.
The way in which the curriculum is laid out, section by section within the ATs (Doc 2.1, pp 47-95) is appropriate for the South African school context where often only one teacher teaches Mathematical Literacy. Teachers will experience this curriculum as simpler to read and understand and more supportive with its suggestions of assignment topics, authentic detailed examples (throughout Doc 2.1, p 47-95), helpful introductory over-views of ATs (see Data Handling in Doc 2.1, p 81) and list of resources and teaching aids for each AT (see Measurement in Doc 2.1 p 61). The range of contexts is accessible and interesting to most learners, notwithstanding the diversity of the South African learner population.
By contrast the NCS is not a helpful document for South African Mathematical Literacy teachers. The complex mathematical skills, which are not fully explained and sometimes only hinted at (AS 10.2.1 in Doc 1.1, p 20) would have been threatening for many teach-ers whose background was not that of being a Mathematical Literacy teacher.
In addition to the lack of explicitness of mathematical skills in the NCS, the ASs are often abbreviated, abstract and unhelpful. For example AS12.2.1 states that learners are to ‘work with numerical data and formulae in a variety of real-life situations, in order to (i) solve design and planning problems, and (ii) investigate situation of compound change,’ (Doc 1.1, p 21). It is not clear from that exactly what needs to be taught.
With regard to the learners the NCS might have seemed dense and vague and many would have not been sure what was required of them. However, the contexts given as examples are diverse and of interest across the spectrum of South African leaners.
2.12.3 Assumptions regarding teacher expertise
Considering the way in which the CAPS is laid out, it must be assumed that the purpose of the document is to explain, scaffold, support and guide teachers’ understanding of and teaching of Mathematical Literacy. The amount of detail in the Basic Skills section (Doc 2.1, pp 25-46) is explicitly given to provide optimal guidance for teachers. Similarly, the clarity of explanation of the sections of each AT provides an excellent framework for teachers to use in their day-to day teaching. This usefulness is accentuated by the lists of resources and teaching aids at the start of each AT. One of the evaluation team mem-bers who worked with teachers of Mathematical Literacy in rural schools, noted that the CAPS would be a very teacher-friendly and useful guide to teaching the subject.
A very different basic assumption underlies the NCS. It assumes that every teacher of Mathematical Literacy is a Mathematics teacher, which is not the case in South Africa. Based on this assumption the mathematical skills are implicit and hinted at, and certainly not explained nor foregrounded. The level of mathematical complexity in the curriculum, for example in AS 12.4.3, variance, standard deviation (Doc 1.1, p 35), might have been

54 Umalusi 2014 | Mathematical Literacy
threatening and bewildering for most teachers who are not from a Mathematics back-ground. This factor alone might have made teachers and learners reluctant to cover certain topics, and might have been highly demotivating for many teachers of Math-ematical Literacy. Added to this is the lack of explication of the ASs and the scarcity of examples in the LOs. This curriculum could not be said to be teacher-friendly.
2.13 ConCLUdinG ReMARKs
The comparative analysis of the NCS and CAPS for Mathematical Literacy reveals a sig-nificant shift between the two curricula. In the evaluation team’s opinion the CAPS cur-riculum is not a ‘mere repackaging’ of the old curriculum. Although there are areas of similarity, the essential design of CAPS is different.
Within the CAPS there is a notable sense of coherence within the design. One of the de-sign features which promotes this coherence is the thread of contextual expansion which runs through all the ATs. In the NCS the focus is on mathematical skills and concepts and the LOs fit around these mathematical skills. Even the naming of Learning Outcome 2, Functional Relationships, is a more mathematical term than a Mathematical Literacy area of learning. To a large extent the NCS tries to find practical contexts in which to use Mathematics and includes calculations at a great depth of mathematical complexity, as can be seen by the list of topics excluded from CAPS which are present in the NCS. The NCS defines its depth by the Mathematics involved, rather than the depth of prob-lem-solving of a real-life situation.
By contrast, the CAPS recognises the need for equipping learners with mathematical tools, hence the initial time spent on Basic Skills. The whole thrust of the curriculum is to forefront the practical situations that 21st century people find themselves in that need a solution or effective management, and then to ask ‘What mathematical tools are needed to do this?’. The complexity of the problems are largely to do with the complexity of the context and the understanding and accessibility of the information needed to solve it.
Figure 1, repeated below shows this in a diagrammatic way.
nCs desiGn
Mathematical Skills
CAPs desiGn
Real-life problems and situations
are expressed in
require
real-life problems and contexts.
mathematical skills.
Figure1: nCs and CAPs designs

55Umalusi 2014 | Mathematical Literacy
Because of the differing designs of the two curricula, it was difficult to compare the LOs of the NCS with the ATs of the CAPS. Within the NCS Numbers is largely embedded in the other three LOs. In CAPS Basic Skills are taught separately as well as embedded in all four ATs. The terminology and organisation of the two curricula are different. This meant that a systematic comparison of the content/skills was problematic. While the CAPS was explicit in listing skills, content, topics, contexts, those elements in the NCS are largely implied or given as examples. The team felt that the CAPS has good coherence with respect to purpose, organisation and design. The same cannot be said of the NCS.
In the organisation of the ATs the CAPS has placed more emphasis on Finance across the phase in the CAPS than in the NCS. The evaluation team considers this to be an improve-ment because of the relevance of this topic in everyday life. The broad learning area of Measurement,Space,Shape,PlansandMaps is treated very differently in NCS and CAPS. In NCS it is covered by Learning Outcome 3 which is allocated 26% of the teach-ing time across the phase. In the CAPS it is covered by ATs 2 and 3 which are allocated a combined 37% of teaching time. This is a significant shift and one which the team felt is an improvement on NCS as this learning area is conceptually difficult for most learners.
The team found that the broad design of the CAPS, its clear and specific format and user-friendliness is an improvement on the NCS with its large number of documents con-taining some significant contradictions and far too vague descriptors and instructions.
The CAPS does not spell out its pedagogic approach. It is rather implied in statements about how learners should learn. Four different approaches are hinted at, namely a ‘con-structivist’ approach, a ‘problem-based’ approach, a ‘standards–based approach’ and a ‘direct instruction’ approach. What is clear is that CAPS has moved away from the OBE approach of the NCS.
While the NCS aims and objectives are more wide-ranging, specific and detailed than those of the CAPS, the evaluation team noted that some of the NCS objectives are fair-ly unrealistic. The CAPS aims and objectives, on the other hand are focused and more achievable. Two regrettable omissions in the CAPS, however, are any mention of collab-orative work by learners and collecting, analysing and organising quantitative data.
Progression is clearly evident in the CAPS throughout the Basic Skills and ATs. Across the phase the content and context is specified and becomes progressively more complex. By contrast the NCS does not have consistent, clear progression. CAPS sequencing is also more purposeful and related to the need to introduce a topic in one grade and then develop it in later grade(s). This is well described in the documents. The NCS, on the other hand, seems at times to have no justification for teaching a topic only once in a grade and then never developing it or building on it.
Both curricula contain clear and specific programmes of internal assessment, which leaves no room for ambiguity. There has been no shift in the approach to internal assess-ment from NCS to CAPS.

56 Umalusi 2014 | Mathematical Literacy
There is a highly developed relationship between Mathematical Literacy and everyday life both the NCS and CAPS. The formal knowledge as laid out in both curricula is always found within the context of everyday life and general knowledge of all learners. The world of personal life, work and communities are constantly referenced and forms part of the knowledge specified in the curricula.
The CAPS is a great improvement on the NCS. It handles the need for teaching basic mathematical skills explicitly and in great detail (Doc 2.1, pp 25-46). This is extremely help-ful to teachers, (especially those whose background is that of not being Mathematics teachers), who form a substantial proportion of Mathematical Literacy teachers in South Africa. The CAPS guides teachers’ understanding of and teaching of Mathematical Lit-eracy extremely well. The amount of detail in the Basic Skills section is explicitly given to provide optimal help to teachers. The clarity of explanation of the sections of each AT provides an excellent framework for teachers to use in their day-to day teaching. This usefulness is accentuated by the lists of resources and teaching aids at the start of each AT. One of the team members who worked with teachers of Mathematical Literacy in ru-ral schools, noted that this curriculum would be a very teacher-friendly and useful guide to teaching the subject.
2.14 ReCoMMendAtions
Content issues
1. By specifying that a non-scientific calculator is not required, the CAPS document limits compound interest problems to a number of time periods not greater than 2. In the NCS, learners were using formulae to calculate simple and compound interest, but in the CAPS learners are expected to perform simple and compound interest calculations manually using a basic calculator, pen and paper, and/or spread-sheets. Simple and compound formulae have been excluded in the CAPS. This omission creates the need for superficial and contrived examples, as car and home loans are granted over periods of 5-25 years. Another result of the omission is that interest periods like daily, monthly, quarterly, bi-annual cannot be calculated. This is problematic and an undesirable implication of the specification of a non-sci-entific calculator. Another implication is that large numbers like millions or billions are problematic to use in calculations. This will restrict the type of problems that can be addressed in Data Handling and Measurement. These two implications affect the authenticity of problems which can be undertaken in these topics and prevent the use of authentic, real-life contexts. The evaluation team recommends that the use of the scientific calculator should be re-instated.
2. The evaluation team recommends that the CAPS should give more detail on period changes when dealing with compound interest.
3. The evaluation team feels that there would be value in including construction of tree diagrams and two-way tables to help explain probability.

57Umalusi 2014 | Mathematical Literacy
other aspects of the curriculum
4. The evaluation team recommends that the aims and objectives of Mathematical Literacy should be clearly spelt out in the CAPS, as they are in the NCS. Currently, the aims and objectives of the CAPS have to be inferred from the section headed ‘WhatisMathematicalLiteracy?’ (Doc 2.1, pp 8-10) or interpreted from the General Aims of the South African Curriculum (Doc 2.1, p 4).
5. When comparing the weighting of topics per assessment in the CAPS it may be noted that there is a weak correlation between topic weighting and assessment weighting for Finance. The implication of this is that learners will not receive sufficient tuition time to cover this topic, which is conceptually difficult and important part of their everyday life. The learners are disadvantaged by this, since this topic has a high mark allocation in the assessment. The team considers the lack of teaching time in Finance to be a serious shortfall.
6. However, the teaching time of Finance and Data Handling needs to correlate more closely with the weighting given to the topic in assessment.
7. The CAPS should include a single outline of the teaching time allocation rather than multiple versions with contradictions. This outline should specify time for teaching, revision and examinations.
8. The pacing in CAPS is difficult to comment on because the content is not differ-entiated per week for any grade. The content description should be made grade specific.
9. The way in which the CAPS document has dealt with the specification of pedagog-ic approaches is appropriate, although lacking specific instructions on exactly how a teacher needs to convey the content and skills required. This type of instruction or guidance to teachers should be more clearly explained throughout the CAPS document across all topics and grades.

58 Umalusi 2014 | Mathematical Literacy
3 MAtHeMAtiCAL LiteRACy: eXit-LeveL oUtCoMes FoR tHe Fet PHAse CAPs
Tables 16a to 16e show the Mathematical Literacy topics across the phase and the ex-it-level skills associated with each topic.
table 16a: exit-level outcomes for Fet (content / skills / competencies): Basic skillsBAsiC sKiLLsFet Phase topic (CAPs) exit-level outcomes for Fet (content / skills / competencies)
numbers and calculations of numbers Use basic numeric skillsManipulate numbers proficientlyInterpret answersUse basic calculatorUse appropriate terminologyEstimate anticipated solutionsUse appropriate notation
Patterns and relationships Make sense of graphs Draw and interpret graphs Recognise patternsAnalyse and interpret multiple relationships Translate between table, formula and graph
* Basic skills are introduced in Grade 10, but used throughout Grades 11 and 12.
table 16b: exit-level outcomes for Fet (content / skills / competencies): At FinanceAPPLiCAtion toPiC: FinAnCeFet Phase topic (CAPs) exit-level outcomes for Fet (content / skills / competencies)
Financial documents Read and interpret complex financial documents and tablesUse financial terminology Manage personal and business finance, including budgetsUse exchange ratesCalculate personal income taxInterpret financial contracts and make appropriate decisionsRecognise impact of inflation Solve financial problems relating to:
• Profit/loss and break-even point• Income/expenditure• Cost price/selling price• Investment/loans • Interest • Tariff
Tariff systems
Income, expenditure, profit/loss, statements, budgetsCost and selling price
Break-even analysis
Interest
Banking, loans, investments
Inflation
Taxation
Exchange rates

59Umalusi 2014 | Mathematical Literacy
table 16b: exit-level outcomes for Fet (content / skills / competencies): At Finance (continued)APPLiCAtion toPiC: MeAsUReMent
Fet Phase topic (CAPs) exit-level outcomes for Fet (content / skills / competencies)
Conversions Use, recognise and convert appropriate unitsGain useful spatial and visual orientationSolve spatial problemsMake informed decisions relating to space and shapeGain practical experience in using measuring instruments Recognise relationships between Fahrenheit and Celsius temper-ature scales Recognise impact of temperature in everyday lifeEstimate lengths, areas, time and quantities of materialsSolve practical problems of perimeter, area and volume involving quantities and cost-effectivenessMake decisions relating to cost-effectivenessBecome familiar with diverse representations of timePlan trips or projects using time constraints
Measuring distance
Measuring mass
Measuring volume
Measuring temperature
Calculating perimeter, area and volume Time
table 16c: exit-level outcomes for Fet (content/skills/competencies): At Maps, plans and rep-resentationsAPPLiCAtion toPiC: MAPs, PLAns And RePResentAtionsFet Phase topic (CAPs) exit-level outcomes for Fet (content / skills / competencies)
Scale Read and interpret scales, maps and plansRecognise need for accuracy Estimate quantities and confirm by calculationUse spatial and visual orientation effectivelyCommunicate position and directionSolve packaging and spatial problemsDraw 2D and 3D plans accurately from various perspectivesBuild 2D and 3D models to scaleRead, comprehend, interpret and write instructions
Maps
Plans
Models
table 16d: exit-level outcomes for Fet (content/skills/competencies): At data handlingAPPLiCAtion toPiC: dAtA HAndLinGFet Phase topic (CAPs) exit-level outcomes for Fet (content / skills / competencies)
Developing questions Read and interpret dense text and complex tables and graphsDesign appropriate instruments to collect dataInterpret and analyse data using various statistical measuresRecognise misleading statistics and biased statements in media Calculate various statistical measuresDraw conclusions and make decisions from analysis of dataChoose appropriate representation of dataIdentify trends and make predictions based on dataWrite and communicate decisions, opinions and conclusions
Collecting data
Classifying and organising data
Summarising data
Representing data
Interpreting and analysing data

60 Umalusi 2014 | Mathematical Literacy
table 16e: exit-level outcomes for Fet (content/skills/competencies): At ProbabilityAPPLiCAtion toPiC: PRoBABiLityFet Phase topic (CAPs) exit-level outcomes for Fet (content / skills / competencies)
Expressions of probability Realise that chance can be expressed as a numerical value Explore probability in real lifeCalculate theoretical probabilityUse terminology of probability appropriatelyRealise that probability is a theoretical valueUnderstand the difference between theoretical probability and experienceRealise that probability in real life can depend on various factorsInterpret and identify misleading probability used in mediaRealise that false negative results may be positiveRealise that risk assessment (e.g. insurance) is based on probabilityInterpret representations of probabilityMake informed decisions based on probability
Prediction
Representations for determining possi-ble outcomesEvaluating expressions involving prob-ability
3.1.1 exit-level omissions
in the Finance topic:
• Because of the limitation placed on use of a basic calculator, it is difficult to work with large numbers and exponents and this has implications for calculating com-pound interest. As a result of using only a basic calculator period changes in cal-culating compound interest are not considered. This limits problem solving to con-trived problems and learners are not exposed to real life situations or problems.
• stokvel and funeral policies need to be foregrounded, because these topics are appropriate and useful in the South African context.
• There should be some discussion on the dangers of micro-lenders as South Africans who are desperate to borrow money are often misled.
• Greater emphasis should be placed on student loans for higher education since this is a real need in South Africa.
in the Measurement topic:
• Pythagoras’ theorem and right-angled triangular prisms could be useful (e.g. pitched roof and water troughs).
• Omission of international time zones is regrettable, as learners live in a ‘global vil-lage’ with impact on social networking and travelling.
in the Probability topic:
• Omission of drawing tree-diagrams and two-way tables is regrettable because it helps learners calculate the probabilities themselves.

61Umalusi 2014 | Mathematical Literacy
3.1.2 Appropriateness of the emphasis of the content area
The emphasis placed on Basic Skills is relevant and very good to equip learners to deal with the ATs. The evaluation team is of the opinion that none of the ATs are over-empha-sised. Functional relationships are integrated throughout the curriculum, with the drawing and interpretation of graphs in most of the topics, which is a good use of the concept. The emphasis in the broad content area is on finance and spatial topics, which is a shift from the NCS. The team believes that this is a positive change.
3.1.3 Appropriateness of the emphasis of the skills/competencies
The figure below shows the distribution of exit-level skills across the CAPS. It can be clearly seen that the higher order skills of analysis, comprehension, interpretation, decision-mak-ing and drawing conclusions are most emphasized at the exit level. The team notes that this is an appropriate emphasis because it achieves the stated goals of the subject, which is to equip learners to live and function in a world that has many quantitative demands and challenges. The evaluation team was of the opinion that this emphasis should be maintained.
45%
1%5%7%
10%
10%
22%
45% Analyse, comprehend, interpret, conclude, make decisions, identify mis-leading information
22% Read, write, communi-cate, use terminology correctly
10% Draw graphs of many forms
10% Solve problems involving calculation
7% Solve spatial problems
5% Estimate, manipulate, use numeric skills
1% Manage financial matters
Figure 3: Percentages of skills and competencies required at exit level for CAPs

62 Umalusi 2014 | Mathematical Literacy
3.1.4 emphasis in terms of cognitive skills
Figure 3 shows that higher order cognitive skills are emphasised at exit level. However, it was not possible for the team to comment on the emphasis in terms of the cognitive levels specified because in Mathematical Literacy the cognitive demand is evident only in the assessment of the subject. Every topic can be assessed at every level of cognitive demand by using different contexts.
In the CAPS the suggested distribution of marks according to the levels of the Mathemat-ical Literacy taxonomy is shown in Table 17.
table 17: distribution of marks according to the levels of the Mathematical Literacy taxonomy in Formal Assessment tasks
Levels of the Mathematical Literacy assessment taxonomy Percentage of marks allocated to each level
Level 1: Knowing 30% (±5%)
Level 2: Applying routine procedures in familiar contexts 30% (±5%)
Level 3: Applying multi-step procedures in a variety of contexts 20% (±5%)
Level 4: Reasoning and reflecting 20% (±5%)

63Umalusi 2014 | Mathematical Literacy
4 ReFeRenCes
Bernstein, B. 1975. Sources of consensus and disaffection in education. Class, Codes and Control. London: Routledge and Kegan Paul.
Bernstein, B. 1990. The Structuring of pedagogic discourse, Vol iv. Class, Codes and Con-trol. London: Routledge.
Bernstein, B. 1996. Pedagogy, symbolic control and identity: theory, research, critique. London: Taylor and Francis.
Bruner, J.S. 1995. On learning mathematics. MathematicsTeacher 88(4): 330–335.
Donnelly, K. 1999. An international comparative analysis across education systems: Benchmarking the Victorian CSF. Seminar Series, No 83. Melbourne. IARTV.
Donnelly, K. 2002. A review of New Zealand’s school curriculum. Wellington. Education Forum.
Donnelly, K. 2005. Benchmarking Australian primary school curricula. Canberra. Depart-ment of Education, Science and Training. Retrieved on 16 July, 2007 from http://www.dest.gov.au/sectors/school_education/publications_resources/profiles/benchmarking_curricula.htm
Donnelly, K. 2007. Australia’s adoption of outcomes based education: A critique. Issues in Educational Research,17(2.):183-205. Melbourne: Education Strategies
Schmidt, W.H., Wang, H.C. & McKnight, C.M. 2005. Curriculum coherence: An examina-tion of U.S. mathematics and science content standards from an international perspec-tive. Journal of Curriculum Studies, 37: 525–559.
Schwartz, M.S., Sadler, P.M., Sonnert, G. & Tai, R.H. 2008. Depth Versus Breadth: How Con-tent Coverage in High School Science Courses Relates to Later Success in College Sci-ence Coursework. Science Education, 93(5): 798-826.
Umalusi. 2004.InvestigationintothestandardoftheSeniorCertificateexamination.ARe-port on Research Conducted by Umalusi. Pretoria: Umalusi Council of Quality Assurance in General and Further Education and Training.
Umalusi. 2006a. Apples and Oranges: A comparison of school and college subjects. Pre-toria: Umalusi Council of Quality Assurance in General and Further Education and Train-ing.
Umalusi. 2006b. Makingeducational judgements: Reflections on judging standards ofintended and examined curricula. Pretoria: Umalusi Council of Quality Assurance in Gen-eral and Further Education and Training.

64 Umalusi 2014 | Mathematical Literacy
Umalusi. 2007. Cognitive challenge: A report on Umalusi’s research on judging standards of intended and examined curricula. Pretoria: Umalusi Council of Quality Assurance in General and Further Education and Training.
Umalusi. 2008. Learning from Africa-Science: Umalusi’s research comparing syllabuses and examinations in South Africa with those in Ghana, Kenya and Zambia. Pretoria: Umalusi Council of Quality Assurance in General and Further Education and Training.
Umalusi. 2010. Comparing the learning bases: An evaluation of Foundation Phase cur-ricula in South Africa, Canada (British Columbia), Singapore and Kenya. Pretoria: Umalusi Council of Quality Assurance in General and Further Education and Training.

65Umalusi 2014 | Mathematical Literacy
AnneXURe AMAtHeMAtiCAL LiteRACy BAsiC sKiLLs CoveRAGe in tHe nCs And tHe CAPs
The
tabl
e be
low
list
s th
e co
nten
t/sk
ills fo
und
in th
e C
APS
acr
oss
the
thre
e gr
ades
. The
eva
luat
ion
team
has
infe
rred
w
hich
mat
hem
atic
al s
kills
from
the
NC
S Le
arni
ng O
utco
mes
(LO
s) in
the
thr
ee g
rad
es m
atch
the
CA
PS o
utco
mes
. Te
xt in
bol
d ita
lics i
s a c
omm
ent r
egar
din
g co
nten
t or s
kills
to b
e sp
ecifi
cally
not
ed in
one
of t
he c
urric
ula.
Bla
nk c
ells
labe
lled
as “
omitt
ed”
repr
esen
t top
ics n
ot c
over
ed in
that
gra
de
or in
that
cur
ricul
um.
MA
tHeM
AtiC
AL
Lite
RAC
y BA
siC
sKi
LLs
Co
veRA
Ge
in tH
e n
Cs
An
d tH
e C
APs
sKiL
LsC
APs
nC
sBa
sic s
kills
Gra
de 1
0G
rade
11
Gra
de 1
2G
rade
10
Gra
de 1
1G
rade
12
i nte
rpre
ting
answ
ers
appr
opria
tene
ss, m
odify
solu
tion,
rew
ork
answ
er,
reco
gnise
erro
rs
inte
rpre
ting
fract
iona
l par
ts o
f ans
wer
s and
cal
cula
ted
an
swer
s, ch
ecki
ng a
ccur
acy
rew
orki
ng a
pr
oble
m a
nd
inte
rpre
ting
answ
ers
Com
mun
icat
ion
com
mun
icat
e so
lutio
ns u
sing
appr
opria
te te
rmin
olog
y,
stat
e w
orki
ng a
nd ju
stify
opi
nion
s
inte
rpre
ting
calc
ulat
ed
answ
ers
inte
rpre
ting
and
co
mm
unic
atin
g re
sults
inte
rpre
ting
calc
ulat
ed
answ
ers
num
ber f
orm
ats
and
conv
entio
nsnu
mbe
r for
mat
, dec
imal
com
ma,
sepa
rato
r, po
sitiv
e,
nega
tive,
dire
ctio
nal in
dic
ator
s, nu
mbe
r con
vent
ions
not s
peci
fied
ope
ratio
ns u
sing
num
bers
and
cal
cula
tor
skill
s
scie
ntifi
c ca
lcul
ator
not
requ
ired,
onl
y no
n-sc
ient
ific
calc
ulat
or
estim
atin
g an
d
calc
ulat
ing
accu
rate
ly u
sing
men
tal,
writ
ten
& c
alcu
lato
r m
etho
ds
wor
king
with
co
mpl
ex
form
ulae
by
hand
and
us
ing
scie
ntifi
c ca
lcul
ator
not s
peci
fied
estim
atio
ns, b
asic
ope
ratio
ns, B
OD
MA
S, a
dd
ition
and
m
ultip
licat
ion
fact
s, m
enta
l arit
hmet
ic, c
alcu
lato
r ski
lls,
fract
ions
estim
atin
g an
d
calc
ulat
ing
accu
rate
ly u
sing
men
tal,
writ
ten
& c
alcu
lato
r m
etho
ds
estim
atin
g ef
ficie
ntly
, us
e d
raw
ings
to
estim
ate
valu
es
use
dra
win
gs to
es
timat
e va
lues
fract
iona
l par
tsin
terp
retin
g fra
ctio
nal p
arts
inte
rpre
ting
fract
iona
l par
ts
of a
n an
swer
squa
ring
cubi
ng
squa
re ro
otin
gsq
uarin
g cu
bing
sq
uare
root
ing
squa
ring
cubi
ng
squa
re ro
otin
gpo
sitiv
e ex
pone
nts
posit
ive
expo
nent
s and
ro
ots
not s
peci
fied
only
dist
ribut
ive
and
ass
ocia
tive
all i
nclu
ding
co
mm
utat
ive
not s
peci
fied

66 Umalusi 2014 | Mathematical Literacy
MA
tHeM
AtiC
AL
Lite
RAC
y BA
siC
sKi
LLs
Co
veRA
Ge
in tH
e n
Cs
An
d tH
e C
APs
sKiL
LsC
APs
nC
sBa
sic s
kills
(con
tinue
d)
Gra
de 1
0G
rade
11
Gra
de 1
2G
rade
10
Gra
de 1
1G
rade
12
Roun
ding
type
s of r
ound
ing
and
the
effe
ct o
f rou
ndin
gno
t spe
cifie
dsig
nific
ance
of
roun
din
gno
t spe
cifie
d
Ratio
sba
sic ra
tio c
once
pts a
nd c
alcu
latio
nsca
lcul
atio
ns
invo
lvin
g ra
tios
ratio
invo
lvin
g m
ore
than
2
quan
titie
sno
t spe
cifie
d
Prop
ortio
nd
irect
and
inve
rse
calc
ulat
ions
in
volv
ing
dire
ct
and
inve
rse
prop
ortio
n
prop
ortio
n in
volv
ing
mor
e th
an 2
qua
ntiti
esno
t spe
cifie
d
Rate
sra
te n
otat
ion,
type
s of r
ates
and
cal
cula
tions
calc
ulat
ions
in
volv
ing
rate
sno
t spe
cifie
dno
t spe
cifie
d
Perc
enta
ges
perc
enta
ge n
otat
ion
and
cal
cula
tions
calc
ulat
ions
in
volv
ing
perc
enta
ges
not s
peci
fied
not s
peci
fied
Mak
ing
sens
e of
gra
phs
fixed
and
linea
rfix
ed, l
inea
r, in
vers
e, c
ompo
und
an
d n
on-li
near
criti
cally
inte
rpre
t tab
les a
nd g
raph
s
Patte
rns
and
rela
tions
hips
singl
e re
latio
nshi
ptw
o re
latio
nshi
psm
ore
than
two
rela
tions
hips
wor
king
with
nu
mer
ical
d
ata/
form
ulae
, d
raw
gra
phs
(dep
end
ent,
ind
epen
den
t va
riabl
es, r
ate
of c
hang
e) a
nd
dra
win
g gr
aphs
wor
king
with
nu
mer
ical
dat
a/fo
rmul
ae, d
raw
gr
aphs
(bre
ak-
even
poi
nts,
optim
al ra
nges
) an
d d
raw
ing
grap
hs
wor
king
with
nu
mer
ical
d
ata/
form
ulae
, d
raw
gra
phs
(sol
ve, d
esig
n an
d p
lann
ing
prob
lem
s) a
nd
dra
win
g gr
aphs
Wor
king
with
two
or
mor
e re
latio
nshi
psno
t don
e in
gr
ade
10es
timat
ion
requ
ired
in d
eter
min
ing
valu
es in
tabl
es a
nd g
raph
sno
t cle
ar
wor
king
with
nu
mer
ical
dat
a/fo
rmul
ae, d
raw
gr
aphs
(bre
ak-
even
poi
nts,
optim
al ra
nges
) an
d d
raw
ing
grap
hs
wor
k w
ith m
ore
than
one
gra
ph

67Umalusi 2014 | Mathematical Literacy
MA
tHeM
AtiC
AL
Lite
RAC
y BA
siC
sKi
LLs
Co
veRA
Ge
in tH
e n
Cs
An
d tH
e C
APs
sKiL
LsC
APs
nC
sFi
nanc
eG
rade
10
Gra
de 1
1G
rade
12
Gra
de 1
0G
rade
11
Gra
de 1
2Fi
nanc
ial d
ocum
ents
pers
onal
/ho
useh
old
pers
onal
/ho
useh
old
/ w
orkp
lace
/bu
sines
s in
tere
st
with
per
iod
ch
ange
s not
s p
ecifi
c V
AT
UIF
ap
plie
s to
all
sect
ions
pers
onal
/ho
useh
old
/ w
orkp
lace
/bu
sines
s/
natio
nal/
glob
al a
nd
mor
e co
mpl
ex
finan
cial
sc
enar
ios /
SARS
in
tere
st w
ith
perio
d c
hang
es
not s
peci
fic V
AT
UIF
Inco
me
tax
appl
ies t
o al
l se
ctio
ns
omitt
ed
tarif
f sys
tem
som
itted
inco
me,
exp
endi
ture
, pr
ofit/
loss
, sta
tem
ents
, bu
dget
s
inco
me
expe
nditu
re
bud
gets
chec
king
st
atem
ents
in
com
e ex
pend
iture
st
atem
ents
pro
fit
mar
gin
pers
onal
and
bu
sines
s fina
nce
Cos
t sel
ling
pric
epe
rson
al/
hous
ehol
dom
itted
sellin
g co
st p
rice
omitt
ed
Brea
k-ev
en a
naly
sisno
t don
e in
gr
ade
10om
itted
brea
k ev
en
poin
tsom
itted
inte
rest
pers
onal
/ho
useh
old
in
tere
st w
ith
perio
d c
hang
es
not s
peci
fic
simpl
e an
d
com
poun
d w
ith
perio
d c
hang
esom
itted
chan
ging
in
tere
st ra
tes a
nd
inte
rest
offe
rings
Bank
ing,
loan
s,
inve
stm
ents
pers
onal
/ho
useh
old
bond
re
paym
ents
repa
ymen
ts o
f lo
an
pers
onal
bu
sines
s fina
nces
cr
edit
optio
ns
inve
stm
ents
Infla
tion
not d
one
in
Gra
de
10om
itted
omitt
edin
flatio
n C
PI
taxa
tion
VA
TVA
T om
itted
VAT o
mitt
edta
x
exch
ange
rate
sno
t don
e in
gr
ade
10om
itted
fore
ign
exch
ange
curre
ncie
s so
cial
ly
resp
onsib
le tr
ade

68 Umalusi 2014 | Mathematical Literacy
MA
tHeM
AtiC
AL
Lite
RAC
y BA
siC
sKi
LLs
Co
veRA
Ge
in tH
e n
Cs
An
d tH
e C
APs
sKiL
LsC
APs
nC
sM
easu
rem
ents
Gra
de 1
0G
rade
11
Gra
de 1
2G
rade
10
Gra
de 1
1G
rade
12
Con
vers
ions
limite
d to
sim
ple
task
s in
hous
ehol
d
limite
d to
sc
enar
ios
invo
lvin
g pl
anni
ng a
nd
com
plet
ing
larg
er p
roje
cts
in h
ouse
hold
, sc
hool
and
wid
er
com
mun
ity
com
plex
pro
ject
s in
fam
iliar a
nd
unfa
milia
r co
ntex
ts
conv
ertin
g un
its
of m
easu
rem
ent
(met
ric)
conv
ertin
g un
its b
etw
een
diff
eren
t sca
les
and
syst
ems
conv
ertin
g un
its b
etw
een
diff
eren
t sca
les
and
syst
ems
as re
quire
d in
d
ealin
g w
ith
prob
lem
s, co
nver
t uni
ts o
f te
mpe
ratu
reM
easu
ring
dist
ance
leng
ths,
dist
ance
sM
easu
ring
mas
sm
easu
ring
perim
eter
ar
ea c
omm
on
poly
gons
and
ci
rcle
s, vo
lum
e of
righ
t pris
ms
mea
surin
g pe
rimet
er
area
pol
ygon
s, vo
lum
e an
d
surfa
ce a
rea
of
right
pris
ms a
nd
cylin
der
s
mea
surin
g pe
rimet
er
area
pol
ygon
s, vo
lum
e of
righ
t pr
isms,
cylin
der
s, co
nes a
nd
sphe
res
Mea
surin
g vo
lum
e
Mea
surin
g te
mpe
ratu
reom
itted
infe
rred
from
ex
ampl
e
Cal
cula
ting
perim
eter
, ar
ea a
nd v
olum
e
perim
eter
an
d a
rea
of
2D sh
apes
Py
thag
oras
ex
clud
ed
perim
eter
and
are
a of
regu
lar
poly
gons
, sur
face
are
a an
d v
olum
e of
rect
angu
lar b
ox a
nd c
ylin
der
Py
thag
oras
and
tria
ngul
ar p
rism
ex
clud
ed
perim
eter
ar
ea c
omm
on
poly
gons
and
ci
rcle
s, vo
lum
e of
righ
t pris
ms
no s
urfa
ce a
rea
perim
eter
ar
ea p
olyg
ons,
volu
me
and
su
rface
are
a of
rig
ht p
rism
s and
cy
lind
ers
perim
eter
ar
ea p
olyg
ons,
volu
me
of ri
ght
prism
s, cy
lind
ers,
cone
s and
sp
here
s
time
inte
rpre
ting
tele
visio
n, b
us o
r tra
in ti
me
tabl
es
and
limite
d to
sim
ple
task
s in
hous
ehol
d
limite
d to
sc
enar
ios
invo
lvin
g pl
anni
ng a
nd
com
plet
ing
larg
er p
roje
cts
in h
ouse
hold
, sc
hool
and
wid
er
com
mun
ity
com
plex
pro
ject
s in
fam
iliar a
nd
unfa
milia
r co
ntex
ts
omitt
edin
ferre
d fr
om
exam
ple
omitt
ed
Ang
le s
izes
not r
equi
red
angl
e siz
es 0
- 36
0

69Umalusi 2014 | Mathematical Literacy
MA
tHeM
AtiC
AL
Lite
RAC
y BA
siC
sKi
LLs
Co
veRA
Ge
in tH
e n
Cs
An
d tH
e C
APs
sKiL
LsC
APs
nC
sM
aps,
pla
ns a
nd
repr
esen
tatio
nsG
rade
10
Gra
de 1
1G
rade
12
Gra
de 1
0G
rade
11
Gra
de 1
2
scal
e
fam
iliar c
onte
xt
less
fam
iliar
cont
ext,
and
m
odel
s of
pack
agin
g co
ntai
ners
, dra
w
2D sc
ale
pict
ures
of
3D
pac
kagi
ng
cont
aine
rs
unfa
milia
r co
ntex
t, co
mpl
ex
stru
ctur
es,
mod
els o
f pa
ckag
ing
cont
aine
rs a
nd
build
ings
, dra
w
2D sc
ale
pict
ures
of
3D
bui
ldin
gs
dra
w a
nd
inte
rpre
t sca
le
dra
win
gs to
re
pres
ent a
nd
iden
tify
view
s
use
and
inte
rpre
t sc
ale
dra
win
gs
to e
stim
ate
and
ca
lcul
ate
valu
es
use
and
inte
rpre
t sc
ale
dra
win
gs
to e
stim
ate
and
ca
lcul
ate
valu
es
to b
uild
mod
el
Map
som
itted
use
grid
s, C
arte
sian
plan
es a
nd
com
pass
dire
ctio
n to
det
erm
ine
loca
tions
and
des
crib
e re
lativ
e po
sitio
ns
Plan
s
dra
w a
nd
inte
rpre
t pla
ns
and
solv
ing
2D
and
3D
pro
blem
s
use
and
inte
rpre
t sc
ale
dra
win
gs
of p
lans
use
and
inte
rpre
t sc
ale
dra
win
gs
of p
lans
to b
uild
m
odel
s
Mod
els
wor
king
with
ac
tual
tins
and
bo
xes t
o ex
plor
e ar
rang
emen
ts
build
3D
scal
e m
odel
s of
cont
aine
rs
build
3D
scal
e m
odel
s of
pack
agin
g co
ntai
ners
to
expl
ore
final
pr
oduc
t
omitt
ed
use
and
inte
rpre
t sc
ale
dra
win
gs
to e
stim
ate
and
ca
lcul
ate
valu
es
to b
uild
mod
el

70 Umalusi 2014 | Mathematical Literacy
MA
tHeM
AtiC
AL
Lite
RAC
y BA
siC
sKi
LLs
Co
veRA
Ge
in tH
e n
Cs
An
d tH
e C
APs
sKiL
LsC
APs
nC
sda
ta h
andl
ing
Gra
de 1
0G
rade
11
Gra
de 1
2G
rade
10
Gra
de 1
1G
rade
12
deve
lopi
ng q
uest
ions
singl
e se
ts o
f d
ata
cont
aini
ng
mul
tiple
ca
tego
ries,
va
lues
that
can
be
read
dire
ctly
fro
m g
raph
s/ta
bles
with
out
the
need
for
estim
atio
n, d
ata
rela
ting
to th
e pe
rson
al liv
es
two
sets
of d
ata
cont
aini
ng
mul
tiple
ca
tego
ries,
valu
es th
at
can
be e
asily
re
ad fr
om
grap
hs/t
able
s, d
ata
rela
ting
to th
e w
ider
co
mm
unity
and
co
mpl
ex so
cial
iss
ues
mul
tiple
sets
of
dat
a co
ntai
ning
m
ultip
le
cate
gorie
s, co
mpl
ex v
alue
s, d
ata
rela
ting
to n
atio
nal a
nd
glob
al is
sues
own
life
(soc
ial,
envi
ronm
enta
l and
pol
itica
l)
Col
lect
ing
data
inte
rvie
ws,
ques
tionn
aire
s, d
ata
basis
cond
uctin
g a
surv
ey
not s
peci
fied
colle
ctin
g in
form
atio
n fro
m
com
mun
ity o
r sc
hool
no
t spe
cifie
dC
lass
ifyin
g an
d or
gani
sing
data
use
diff
eren
t m
etho
ds t
o su
mm
arise
and
d
ispla
y d
ata
(tal
lies,
tabl
es,
pie
char
ts,
hist
ogra
ms,
bar g
raph
, lin
e,
brok
en lin
e gr
aph)
use
diff
eren
t m
etho
ds t
o su
mm
arise
and
d
ispla
y d
ata
(tal
lies,
tabl
es,
pie
char
ts,
hist
ogra
ms,
bar g
raph
, lin
e,
brok
en lin
e gr
aph,
Ogi
ve,
cum
ulat
ive
frequ
ency
choo
se a
nd
inte
rpre
t the
use
of
met
hod
s to
sum
mar
ise a
nd
disp
lay
dat
a,
incl
udin
g us
e of
sc
atte
r-plo
ts a
nd
line
of b
est fi
t
sum
mar
ising
dat
a
Repr
esen
ting
data
inte
rpre
ting
and
anal
ysin
g da
ta
calc
ulat
ing
and
usin
g ap
prop
riate
m
easu
res
of c
entra
l te
nden
cy a
nd
spre
ad (m
ean,
m
edia
n, m
ode
and
rang
e) fo
r sin
gle
set o
f dat
a
calc
ulat
ing
and
usin
g ap
prop
riate
m
easu
res
of c
entra
l te
nden
cy a
nd
spre
ad (m
ean,
m
edia
n, m
ode,
ra
nge,
var
ianc
e (in
terp
reta
tion
only
), st
anda
rd
devi
atio
n (in
terp
reta
tion
only
) and
qu
artil
es) f
or
two
sets
of d
ata.
C
onsid
erin
g so
urce
s of e
rror
and
bia
s.
calc
ulat
ing
and
usin
g ap
prop
riate
m
easu
res
of c
entra
l te
nden
cy a
nd
spre
ad (m
ean,
m
edia
n, m
ode,
ra
nge,
var
ianc
e (in
terp
reta
tion
only
), st
and
ard
d
evia
tion
(inte
rpre
tatio
n on
ly),
quar
tiles
an
d p
erce
ntile
s. Ra
nge
omitt
ed.
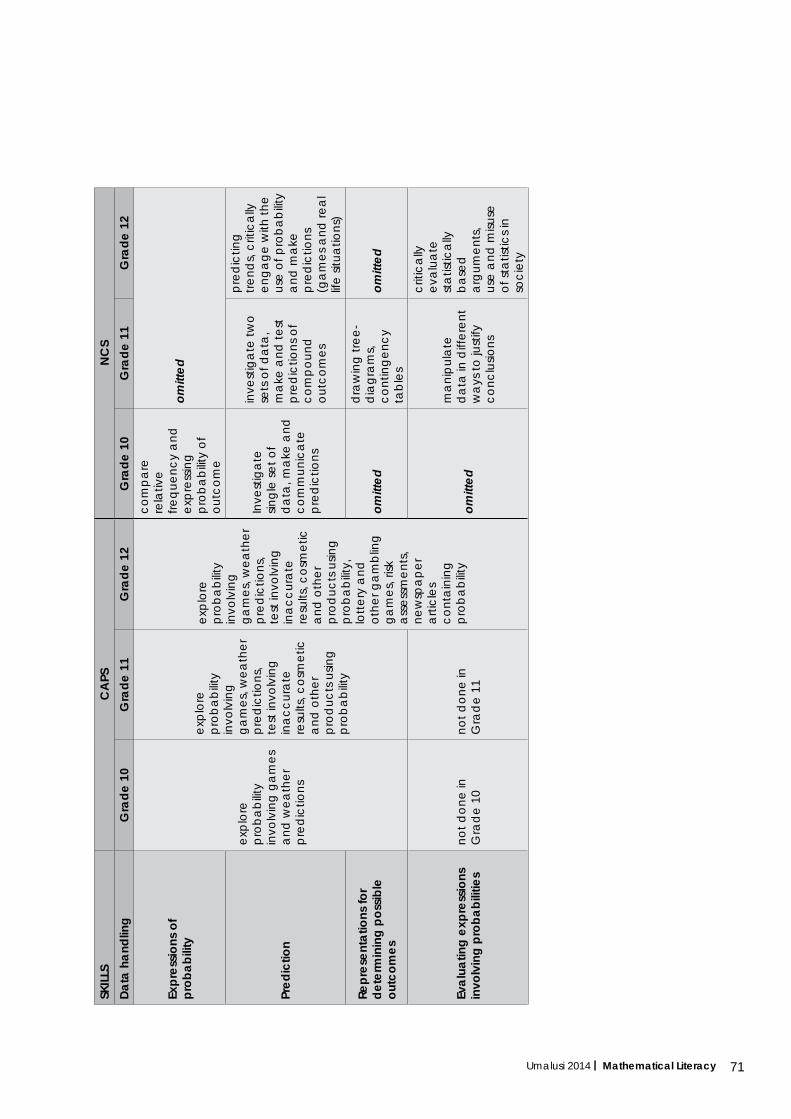
71Umalusi 2014 | Mathematical Literacy
sKiL
LsC
APs
nC
sda
ta h
andl
ing
Gra
de 1
0G
rade
11
Gra
de 1
2G
rade
10
Gra
de 1
1G
rade
12
expr
essio
ns o
f pr
obab
ility
expl
ore
prob
abilit
y in
volv
ing
gam
es
and
wea
ther
pr
edic
tions
expl
ore
prob
abilit
y in
volv
ing
gam
es, w
eath
er
pred
ictio
ns,
test
invo
lvin
g in
accu
rate
re
sults
, cos
met
ic
and
oth
er
prod
ucts
usin
g pr
obab
ility
expl
ore
prob
abilit
y in
volv
ing
gam
es, w
eath
er
pred
ictio
ns,
test
invo
lvin
g in
accu
rate
re
sults
, cos
met
ic
and
oth
er
prod
ucts
usin
g pr
obab
ility,
lo
ttery
and
ot
her g
ambl
ing
gam
es, r
isk
asse
ssm
ents
, ne
wsp
aper
ar
ticle
s co
ntai
ning
pr
obab
ility
com
pare
re
lativ
e fre
quen
cy a
nd
expr
essin
g pr
obab
ility
of
outc
ome
omitt
ed
Pred
ictio
n
Inve
stig
ate
singl
e se
t of
dat
a, m
ake
and
co
mm
unic
ate
pred
ictio
ns
inve
stig
ate
two
sets
of d
ata,
m
ake
and
test
pr
edic
tions
of
com
poun
d
outc
omes
pred
ictin
g tre
nds,
criti
cally
en
gage
with
the
use
of p
roba
bilit
y an
d m
ake
pred
ictio
ns
(gam
es a
nd re
al
life
situa
tions
)
Repr
esen
tatio
ns fo
r de
term
inin
g po
ssib
le
outc
omes
omitt
ed
dra
win
g tre
e-d
iagr
ams,
cont
inge
ncy
tabl
es
omitt
ed
eval
uatin
g ex
pres
sions
in
volv
ing
prob
abili
ties
not d
one
in
Gra
de
10no
t don
e in
G
rad
e 11
omitt
ed
man
ipul
ate
dat
a in
diff
eren
t w
ays t
o ju
stify
co
nclu
sions
criti
cally
ev
alua
te
stat
istic
ally
ba
sed
ar
gum
ents
, us
e an
d m
isuse
of
stat
istic
s in
soci
ety

72 Umalusi 2014 | Mathematical Literacy
notes

73Umalusi 2014 | Mathematical Literacy
notes