2014-05-16 Pegasus Airlines Risk Based Approach to ... · Pegasus Airlines – Risk Based Approach...
33
2014-05-16 Pegasus Airlines – Risk Based Approach to Management System Capt. Kemal HELVACIOĞLU – Vice President of Safety, Quality & Compliance
Transcript of 2014-05-16 Pegasus Airlines Risk Based Approach to ... · Pegasus Airlines – Risk Based Approach...

2014-05-16
Pegasus Airlines – Risk Based Approach to Management SystemCapt. Kemal HELVACIOĞLU – Vice President of Safety, Quality & Compliance

Risk Management System
2
Safety Management System actually uses the elements of ISO 31000 Risk Management. Ourphilosophy is to coordinate all risks of the company via an internationally recognized standard.
Risk Management Process According to ISO 31000
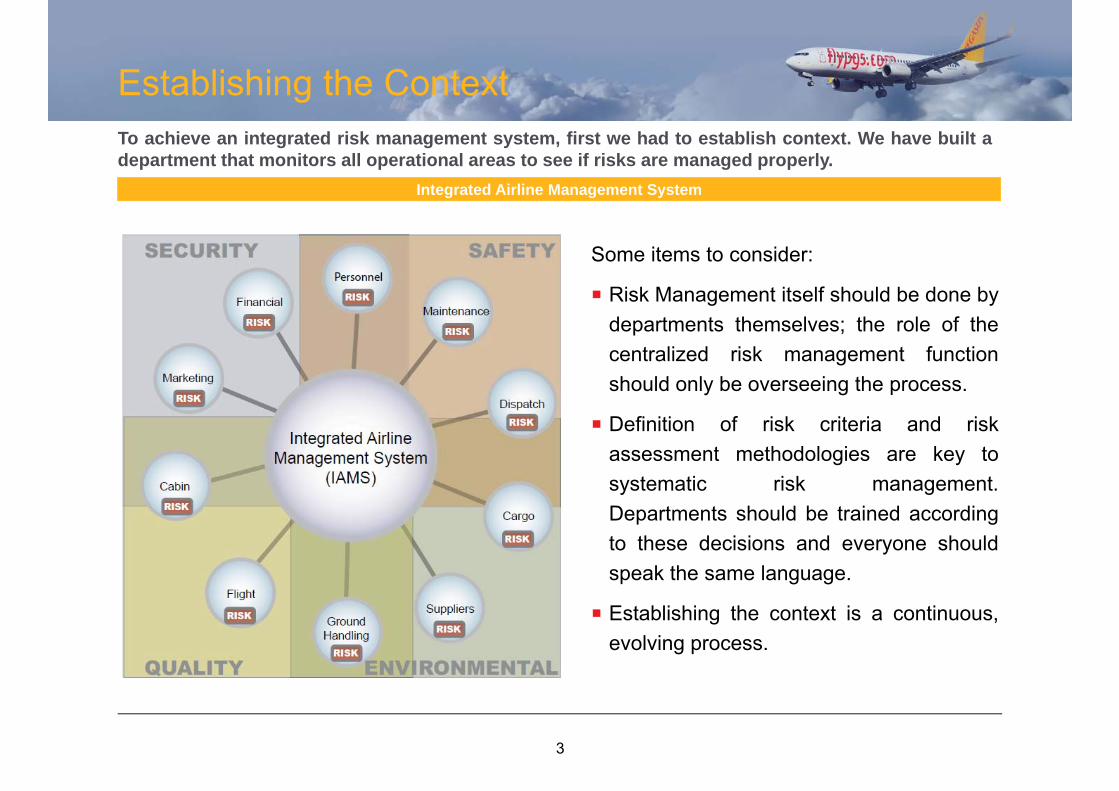
Establishing the Context
3
To achieve an integrated risk management system, first we had to establish context. We have built adepartment that monitors all operational areas to see if risks are managed properly.
Integrated Airline Management System
Some items to consider:
Risk Management itself should be done bydepartments themselves; the role of thecentralized risk management functionshould only be overseeing the process.
Definition of risk criteria and riskassessment methodologies are key tosystematic risk management.Departments should be trained accordingto these decisions and everyone shouldspeak the same language.
Establishing the context is a continuous,evolving process.

Integration of Management SystemsAs stated in ICAO Doc 9859 Safety Management Manual Section 2.9, the organization should integrateorganizational management systems designed to achieve specific organizational goals.
Benefits
4
reduction of duplication and therefore of costs;
reduction of overall organizational risks and an increase in profitability;
balance of potentially conflicting objectives; and
elimination of potentially conflicting responsibilities and relationships.
QMS SMS
Quality Safety
Quality assurance Safety assurance
Quality control Hazard identification and risk control
Quality culture Safety culture
Compliance with requirements Acceptable level of safety performance
Prescriptive Performance‐based
Standards and specifications Organizational and human factors
Reactive > Proactive Proactive > Predictive
ICAO Doc 9859 Table 5-1. Summary comparison of QMS and SMS

Hazard Identification
5

Hazard Identification
Reporting (AQD: Aviation Quality Database)1
Audits and LOSA2
Teledyne End to End Solutions and Flight Data Monitoring System3
Trend Analysis5
Safety Surveys4
New Destination Risk Assessment Studies7
Management of Change Studies6
6
We always try to have technological hazard identification methods:
External Events and Studies8
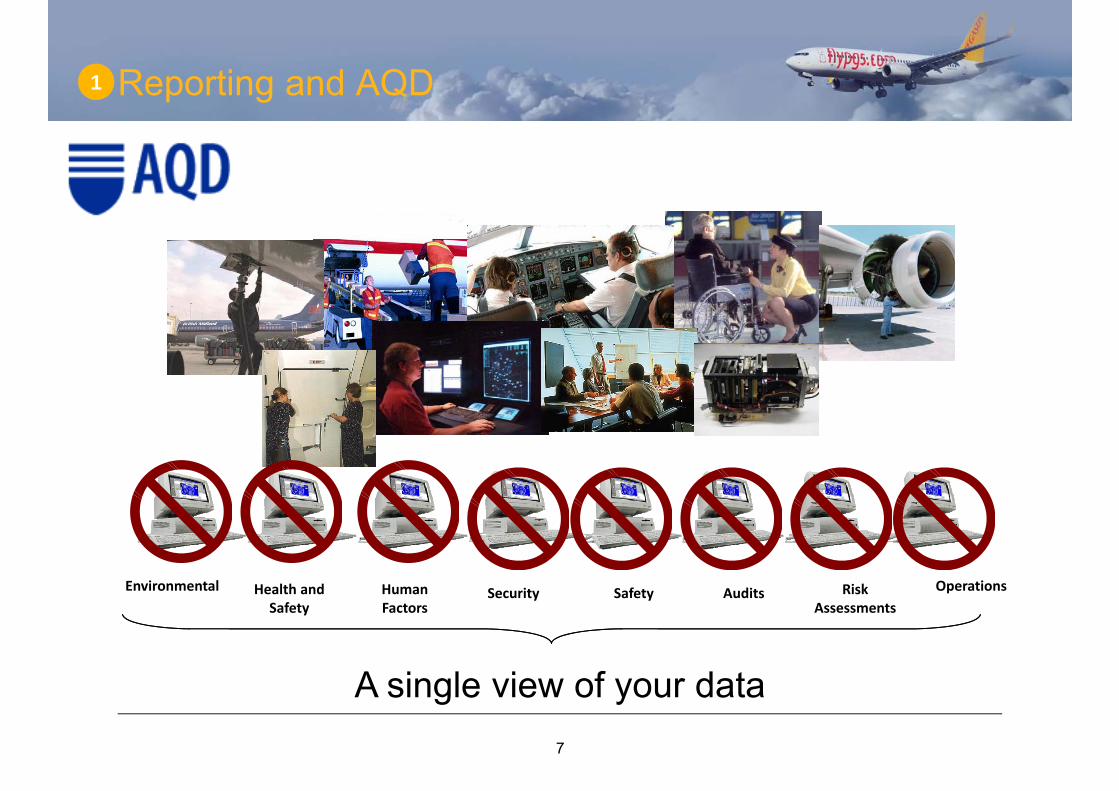
Reporting and AQD1
Safety Audits Risk Assessments
OperationsEnvironmental Health and Safety
Human Factors
Security
A single view of your data7

Audits2
Safety and Quality Audits
DGCA Audits
IOSA
Integrated Management System Audits
Audits from the Ministry of Labour regarding Occupational Health and Safety Risks
SAFA/SANA Audits
Various audits are being coordinated through AQD Audit Module.
8

LOSA (Line Operations Safety Audits)2
Via LOSA we are trying to identify inured errors in the operation. We try to conductLOSA at least once in two years.
9
Accidents
Incidents
Normal Operations
QAR
Voluntary Incident Reports
LOSA
Accident InvestigationMandatory Incident Reports
10
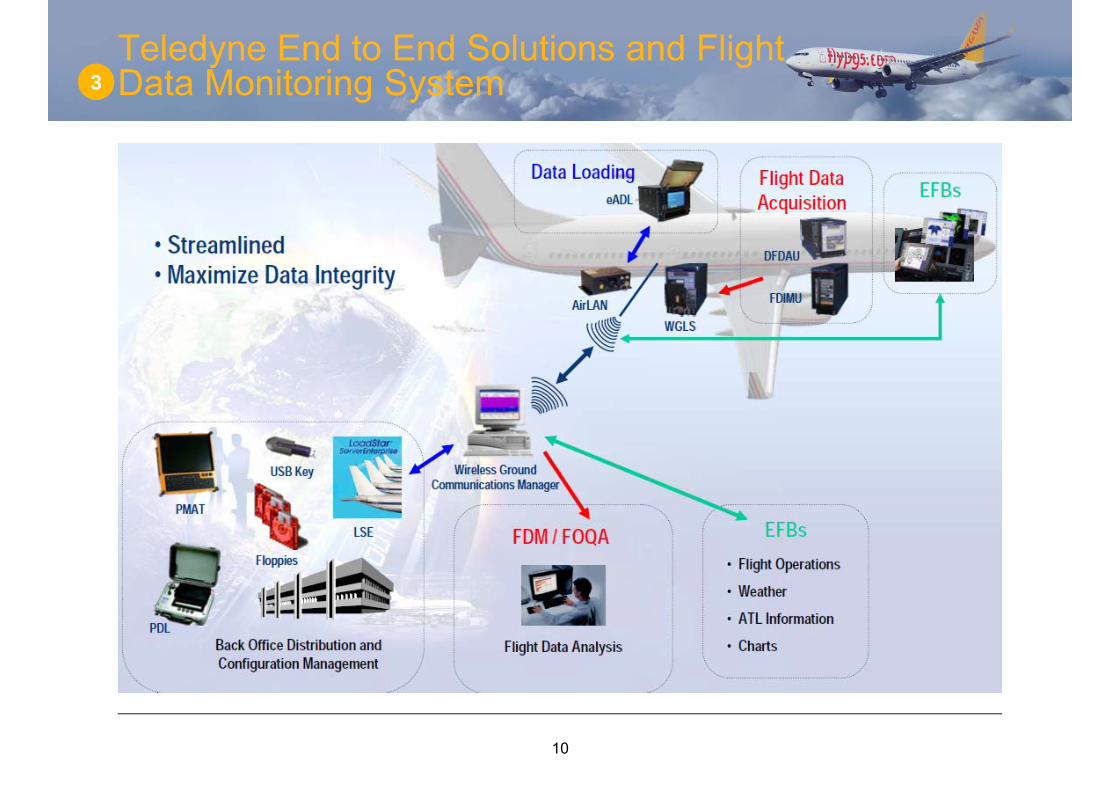
3Teledyne End to End Solutions and Flight Data Monitoring System

3Teledyne End to End Solutions and Flight Data Monitoring System
11

Teledyne End to End Solutions and Flight Data Monitoring System3
We use AirFASE and Vision software to monitor flight safety trend of the airline.
Vision Event InvestigationsAirFASE Event Investigations
Engineering AirFASE
Engineering AirFASE for predictive trend monitoring of technical performance.
12

Safety Surveys4
Through our intranet system, we conduct online safety surveys every year and comparethe results with the previous year.
13
3,2
3,4
3,6
3,8
4
4,2
4,4
4,6
EğitimDepartmanı
Uçuş İşletmeDepartmanı
KabinHizmetleriDepartmanı
Mali İşler veIK
Departmanı
TeknikDepartman
DestekHizmetlerDepartmanı
Yer İşletmeDepartmanı
BilgiTeknolojileriDepartmanı
KaliteDepartmanı
TicaretDepartmanı
Department Averages
2012
2013

Trend Monitoring5
To monitor company safety trend, we are preparing graphics of occurrence numbers usingmoving average method. We always try to compare ourselves with global statistics.
14
0,000,501,001,502,002,503,003,504,00
01.10 04.10 07.10 09.10 12.10 03.11 06.11 09.11 12.11 03.12 06.12 09.12 12.12 03.13 06.13 09.13 12.13 03.14
per 1
0.000 Flights
Month.Year
TCAS Reports per 10.000 FligthsEurocontrol Data IATA Summer Data Pegasus 12 Month Moving Average Pegasus 3 Month Moving Average
We join various reporting initiatives to be aware of global trends.
IATA FDX (Flight Data eXchange)
IATA Steades
Eurocontrol EVAIR

Management of Change Studies6
We are conducting detailed management of change studies before serious changes affecting thecompany. IATA corporate risk methodology is used here in conjunction with bowtie methodology.
15

New Destination Risk Assessment Studies7
Before new destinations, a group of specialists from various departments visit theairport for hazard identification and risk analysis.
16

External Events and Studies8
We also use external events, studies and emerging issues for hazard identification.
17
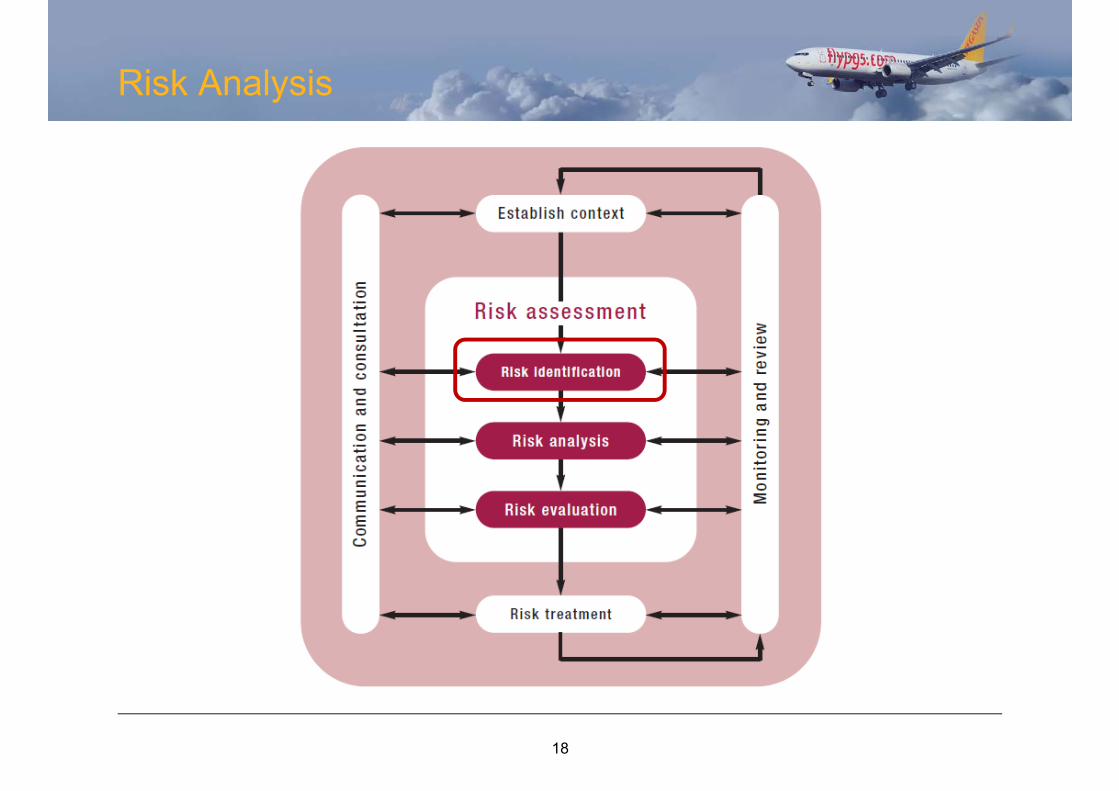
Risk Analysis
18

Risk Analysis - BowTie MethodologyRisk analysis is done using bowtie methodology.
19
We always try to put at least one technological barrier to minimise the effects of human factors.
Bowtie graphs are being built using BowTieXP software which makes it very easy tocommunicate risks to the various levels of the company.

Risk Evaluation
20

Risk EvaluationAfter risks are analysed, we evaluate them using the risk matrix.
21
Likely to occur many
times
Likely to occur
sometimes
Unlikely but possible, may occur once in a few years
Extremely unlikely but may happen in aviation
Nearly impossible
1 to 10‐3 10‐3 to 10‐5 10‐5 to 10‐7 10‐7 to 10‐9 < 10‐9
RiskProbability
Frequent Probable RareExtremely
RareExtremely Improbable
RiskSeverity
5 4 3 2 1
Multiple fatality
> 10.000.000 Euro
International exposure
Irreversible damage to
environment Catastrophic A
Single fatality200.000 ‐ 10.000.000
Euro
National exposure
High but reversible damage
Major B
Serious injuries requiring
hospitalization
20.000 ‐ 200.000 Euro
Industry or regulator exposure
only
Significant but
reversible damage
Moderate C
Minor injuries requiring medical attention
100 ‐ 20.000 Euro
Minor exposure, can be forgotten
quickly
Minor and reversable damage
Minor D
No InjuryNo damage, < 1000 Euro
No exposureNo damage
to environment
Negligible E
Basic probability assessment
Environm
ent
Repu
tatio
n
Fina
ncial
Peop
leObjective probability
assessment (per flight cycles)
Pegasus Airlines Risk Matrix

Risk Treatment
22

Risk TreatmentIf a risk is in an unacceptable area, we minimise it by strengthening a barrier or adding anew one.
23
Honeywell Launch CustomerRDR-4000 Weather Radar Software Upgrade on
B737NG Aircraft
TCAS ATC PANEL

Risk TreatmentPriority is always technological improvements that can minimise human errors.
24

Risk Treatment
25
A good emergency response system is also a necessary barrier. Apart fromdocumentation, trainings and exercises we enhance it with technological improvements.

Communication and Consultation
26

Communication and ConsultationWe facilitate or take part in various meetings for the purposes of risk communication andconsultation.
Safety Meetings
Quarterly Board Meetings
Semi-annual Safety Committee Meetings
Monthly Safety Review Board Meetings
Monthly Safety Action Group Meetings
Weekly Operational Meetings of Departments
Monthly FDM Meetings
Fatigue SAG Meetings
27
SAFETY COMMITTEE
BOARD
SAFETY REVIEW BOARD
FLIGHT OPERATION MEETINGS
FATIGUE SAFETY ACTION GROUP
FLIGHT DATA MONITORING
WORKING GROUP
SAFETY ACTION GROUP
TECHNICALMEETINGS
GROUND OPERATIONMEETINGS
CABIN SERVICESMEETINGS

Safety Performance IndicatorsSafety performance indicators are defined in the start of every year and safetyobjectives of departments are chosen accordingly.
28
SPIs are monitored after every quarterfirst by Safety Action Group and thenby Safety Review Board.
We try to choose same SPIs everyyear to monitor our trend.

Safety PromotionWe communicate risks to people via various technological means, using magazines,bulletins, read and signs and EFB.
29
SPECIAL AIRPORTSSummary of Occurrences
Magazines
Bulletins
Read and Signs
Special Airports section in EFB

Monitoring and Review
30

Monitoring and ReviewRisk management is a continuous process. We always monitor and review our existing barriers to seeif they are still efficient and effective.
31
IncidentXP

Enterprise Risk ManagementNow, our aim is to continue standardizing and improving the risk culture of other departments in thecompany by establishing Enterprise Risk Management.
32
CreditRisks
MarketRisks
LiquidityRisks
TechnicRisks
FlightRisks
CabinRisks
GroundRisks
CargoRisks
StrategicRisks
ENTERPRISE RISK MANAGEMENT
PoliticalRisks


![Chapter 9 Tools and Resources for Evaluating the ... 9... · Exhibit 1: Data Elements for Evaluating and ... aQd reOLabOe VtaQdardL]ed teVtV aQd JradXatLoQ drop oXt aQd reteQtLoQ](https://static.fdocuments.us/doc/165x107/5af3a36a7f8b9a95468cdaa4/chapter-9-tools-and-resources-for-evaluating-the-9exhibit-1-data-elements.jpg)