2013_10-31_CEC1_WXY_AssignmentPolicyStudy FINAL with edits.pdf
67
George M. Janes Associates
-
Upload
sarah-darville -
Category
Documents
-
view
224 -
download
0
Transcript of 2013_10-31_CEC1_WXY_AssignmentPolicyStudy FINAL with edits.pdf
7/27/2019 2013_10-31_CEC1_WXY_AssignmentPolicyStudy FINAL with edits.pdf
http://slidepdf.com/reader/full/201310-31cec1wxyassignmentpolicystudy-final-with-editspdf 1/68
George M. Janes Assoc
7/27/2019 2013_10-31_CEC1_WXY_AssignmentPolicyStudy FINAL with edits.pdf
http://slidepdf.com/reader/full/201310-31cec1wxyassignmentpolicystudy-final-with-editspdf 2/68
CONTENTS
2/ Executive findin s
3/ Assignment policy context
4/ Study area and period5/ Methodology
str ct n ngs

7/27/2019 2013_10-31_CEC1_WXY_AssignmentPolicyStudy FINAL with edits.pdf
http://slidepdf.com/reader/full/201310-31cec1wxyassignmentpolicystudy-final-with-editspdf 3/68
Understand the impacts of open enrollment policy in terms of stratification of“ ”, , ,
between the District 1 schools during the years 1999-2011.
Compare District 1 to another NYC District to better understand NYC trendsover the time period.

7/27/2019 2013_10-31_CEC1_WXY_AssignmentPolicyStudy FINAL with edits.pdf
http://slidepdf.com/reader/full/201310-31cec1wxyassignmentpolicystudy-final-with-editspdf 4/68
findin s
rom - , ere as een an ncrease o c us er ng o s u en s yrace and free lunch status, increasing each school’s dissimilarity from theother schools in the District. This increase has been most pronounceddurin the o en enrollment eriod.
rom - , ere s an ncrease n var a y e ween sc oo s nterms of student achievement as measured by Math and ELA scores.
,appears to be a sharp increase in the number of children with the District
area a en ng sc oo s e ne as up a e .
4/ When compared to other NYC schools districts that utilize zoned,
considerably and has a large proportion of public housing, thes ra ca on o sc oo s y race ree unc ac evemen scores an eincrease in “uptake” is noteworthy.

7/27/2019 2013_10-31_CEC1_WXY_AssignmentPolicyStudy FINAL with edits.pdf
http://slidepdf.com/reader/full/201310-31cec1wxyassignmentpolicystudy-final-with-editspdf 5/68
oliccontext
Vancouver Jefferson County
Boston
NYC Cape Town

7/27/2019 2013_10-31_CEC1_WXY_AssignmentPolicyStudy FINAL with edits.pdf
http://slidepdf.com/reader/full/201310-31cec1wxyassignmentpolicystudy-final-with-editspdf 6/68
oliccontext
u c c oo oc e y sso ves an merges w war sc oo s
1864/ Ward school system becomes the Board of Education district system
1911/ Woodrow Wilson endorses the School as Social Center movement
Brown v. Board of Education
1971/ Swann v. Charlotte-Mecklenburg Board of Education
2007/ Parents Involved in Communit Schools v. Seattle School District No. 1

7/27/2019 2013_10-31_CEC1_WXY_AssignmentPolicyStudy FINAL with edits.pdf
http://slidepdf.com/reader/full/201310-31cec1wxyassignmentpolicystudy-final-with-editspdf 7/68
oliccontext
As of Dec 2012, there are 37
UNZONED districts within NYC:
Lower East Side [D1] in 2007
Ocean Hill / Brownsville [D23] in 2012 1
23

7/27/2019 2013_10-31_CEC1_WXY_AssignmentPolicyStudy FINAL with edits.pdf
http://slidepdf.com/reader/full/201310-31cec1wxyassignmentpolicystudy-final-with-editspdf 8/68
and eriod
CEC1 Assignment Policy History
1991- 2003Communit School Board 1 removes zones and catchments in hases while uaranteein
placement of elementary school students in a school within 0.5 mile of their home, andinstitutes an o en enrollment olic with lotteries, usin race and ender uotas inoversubscribed schools.
2003DOE closes district offices and centralizes admissions, and the quota policy becomesunclear.
2007- 2013The DOE re uires CEC1 to move to a ure o en enrollment model without uotas.

7/27/2019 2013_10-31_CEC1_WXY_AssignmentPolicyStudy FINAL with edits.pdf
http://slidepdf.com/reader/full/201310-31cec1wxyassignmentpolicystudy-final-with-editspdf 9/68
and eriod
In SY 1999-2000:
MIDDLE SCHOOLS
0 CHARTER SCHOOLS
7,941 STUDENTS

7/27/2019 2013_10-31_CEC1_WXY_AssignmentPolicyStudy FINAL with edits.pdf
http://slidepdf.com/reader/full/201310-31cec1wxyassignmentpolicystudy-final-with-editspdf 10/68
and eriod
In SY 2011-2012:
MIDDLE SCHOOLS
2 CHARTER SCHOOLS
8,111 STUDENTS
7/27/2019 2013_10-31_CEC1_WXY_AssignmentPolicyStudy FINAL with edits.pdf
http://slidepdf.com/reader/full/201310-31cec1wxyassignmentpolicystudy-final-with-editspdf 11/68
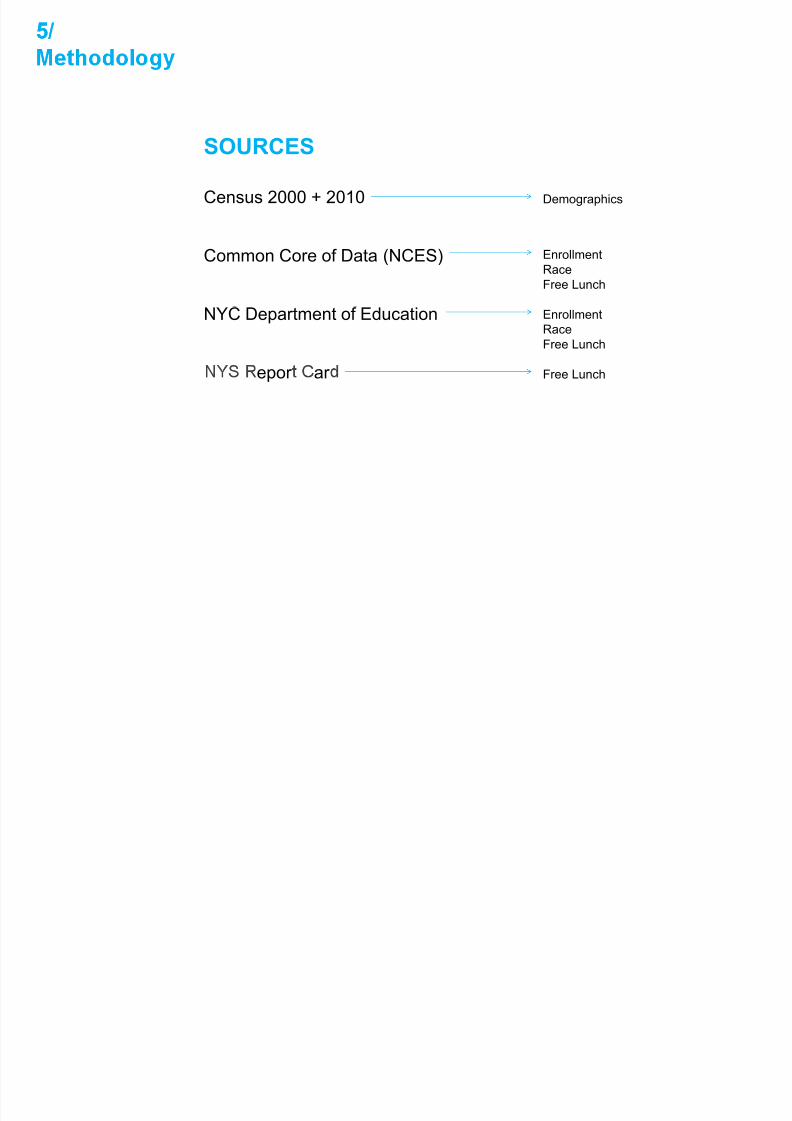
SOURCES
Census 2000 + 2010 Demographics
Common Core of Data (NCES) EnrollmentRaceFree Lunch
NYC Department of Education EnrollmentRace
Free Lunch
epor ar Free Lunch
7/27/2019 2013_10-31_CEC1_WXY_AssignmentPolicyStudy FINAL with edits.pdf
http://slidepdf.com/reader/full/201310-31cec1wxyassignmentpolicystudy-final-with-editspdf 12/68
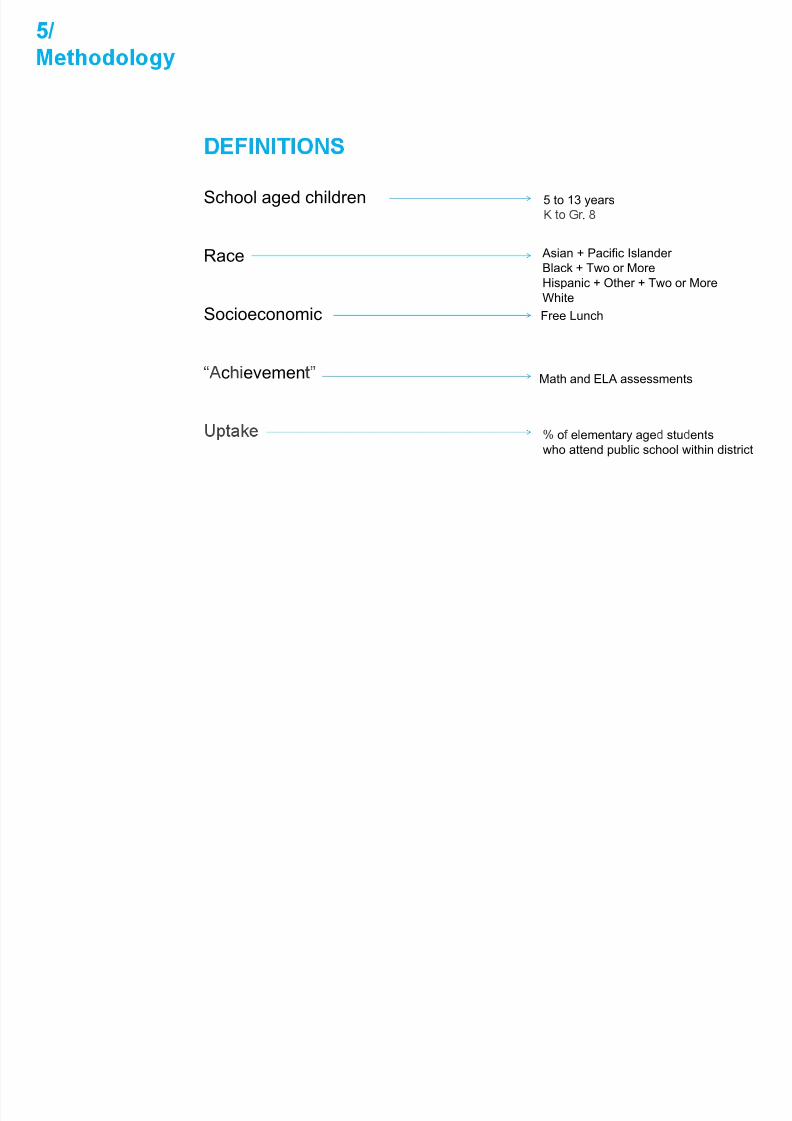
School aged children 5 to 13 years .
Race Asian + Pacific Islander Black + Two or MoreHispanic + Other + Two or MoreWhite
Socioeconomic Free Lunch
c evemen Math and ELA assessments
o e ementary age stu entswho attend public school within
7/27/2019 2013_10-31_CEC1_WXY_AssignmentPolicyStudy FINAL with edits.pdf
http://slidepdf.com/reader/full/201310-31cec1wxyassignmentpolicystudy-final-with-editspdf 13/68
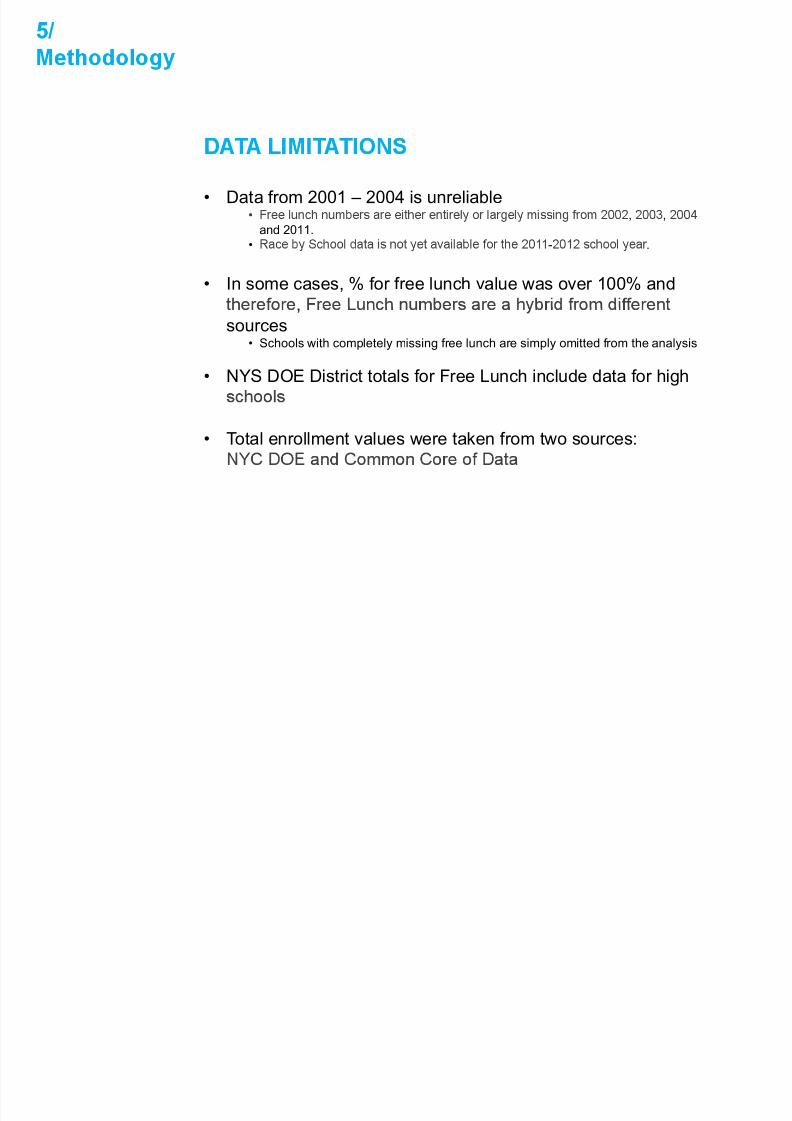
• Data from 2001 – 2004 is unreliable, ,
and 2011.• - .
• In some cases, % for free lunch value was over 100% and,
sources
• Schools with completely missing free lunch are simply omitted from the analysis
• NYS DOE District totals for Free Lunch include data for high
• Total enrollment values were taken from two sources:

7/27/2019 2013_10-31_CEC1_WXY_AssignmentPolicyStudy FINAL with edits.pdf
http://slidepdf.com/reader/full/201310-31cec1wxyassignmentpolicystudy-final-with-editspdf 14/68
INDICES OF DISSIMILARITY
1/ The district has an overall racial and free lunch profile that changesevery year
2/ An Index of Dissimilarity measures how dissimilar the individual schools
are from the district-wide average
3/ Four races (Asian, Black, Hispanic and White) and Free Lunch studentsu
• easure y a ng e ean so u e ercen erence rom e s r c -w eaverage for each category
• -w v x u z• If the index increases, segregation is increasing
,

7/27/2019 2013_10-31_CEC1_WXY_AssignmentPolicyStudy FINAL with edits.pdf
http://slidepdf.com/reader/full/201310-31cec1wxyassignmentpolicystudy-final-with-editspdf 15/68
INDICES OF DISSIMILARITY
• Simple to explain and understand• -• Every school is scored every year, so year-to-year changes are
evident• Each ear is inde endent from other ears
• – ’ * • Some data missing, especially in the early years for race, 2002-
or ree unc , an e - sc oo year
* , , .

7/27/2019 2013_10-31_CEC1_WXY_AssignmentPolicyStudy FINAL with edits.pdf
http://slidepdf.com/reader/full/201310-31cec1wxyassignmentpolicystudy-final-with-editspdf 16/68
INDICES OF SCHOOL ACHIEVEMENT DISPARITY
Goal of school achievement analysisTo measure disparity in educational achievement over the course of the
a enges data that are publicly available for all years within the study period
Tracking input (resources for schooling) and and output (cognitiveper ormance o s u en s

7/27/2019 2013_10-31_CEC1_WXY_AssignmentPolicyStudy FINAL with edits.pdf
http://slidepdf.com/reader/full/201310-31cec1wxyassignmentpolicystudy-final-with-editspdf 17/68
INDICES OF SCHOOL ACHIEVEMENT DISPARITY
1/ The index of achievement measures how dissimilar the individualsc oo s are rom e s r c -w e propor on o s u en s per orm ng agrade level
• Analyzed student performance on grades 4 and 8 English Language Arts andMathematics assessments
• These are the only grades that participated in NYS Testing program for all
• If all schools reflect the district-wide proportion of students meeting grade-level
• If the index increases, variability in student achievement is increasing
Note: The study found that there is a significant negative correlation
tests. However, it is not reasonable to describe these assessments as ameasure o ncome pover y.

7/27/2019 2013_10-31_CEC1_WXY_AssignmentPolicyStudy FINAL with edits.pdf
http://slidepdf.com/reader/full/201310-31cec1wxyassignmentpolicystudy-final-with-editspdf 18/68
UPTAKE AND ENROLLMENT
“ ”
• It is important to consider all children within District 1, not just. .story by considering how many children within D1 do not attend D1schools and what their demographics are)
ENROLLMENT FLUCTUATIONS• It is important to consider if there are changes to enrollment that
.

7/27/2019 2013_10-31_CEC1_WXY_AssignmentPolicyStudy FINAL with edits.pdf
http://slidepdf.com/reader/full/201310-31cec1wxyassignmentpolicystudy-final-with-editspdf 19/68
DISTRICTS COMPARISONS
COMPARING TO ANOTHER DISTRICT• We need to try to “control” for:•
district that has undergone similar changes (e.g. District 13)“ ”• v v
• Uptake changes over time

7/27/2019 2013_10-31_CEC1_WXY_AssignmentPolicyStudy FINAL with edits.pdf
http://slidepdf.com/reader/full/201310-31cec1wxyassignmentpolicystudy-final-with-editspdf 20/68
/ Indices of dissimilarity
/ Achievement metrics/ Capacity and uptake
utstan ng quest ons

7/27/2019 2013_10-31_CEC1_WXY_AssignmentPolicyStudy FINAL with edits.pdf
http://slidepdf.com/reader/full/201310-31cec1wxyassignmentpolicystudy-final-with-editspdf 21/68
INDICES OF DISSIMILARITY
findin sThere have been substantial changes in District 1 duringthe study period.
Number of Students by Race % of Students Receiving Free Lunch
His anic Asian Unknown / Other
WhiteBlack * Means there is substantial missing data this year

7/27/2019 2013_10-31_CEC1_WXY_AssignmentPolicyStudy FINAL with edits.pdf
http://slidepdf.com/reader/full/201310-31cec1wxyassignmentpolicystudy-final-with-editspdf 22/68
INDICES OF DISSIMILARITY A school’s Segregation Index is calculated by averaging the
findin s difference between the District and the school’s racial and free.
Total Racial Breakdown for District 1 from 1999-2000
Asian Black Hispanic White
15% 17% 61% 6%

7/27/2019 2013_10-31_CEC1_WXY_AssignmentPolicyStudy FINAL with edits.pdf
http://slidepdf.com/reader/full/201310-31cec1wxyassignmentpolicystudy-final-with-editspdf 23/68
INDICES OF DISSIMILARITY A school’s Segregation Index is calculated by averaging the
findin s difference between the District and the school’s racial and free.
Total Racial Breakdown for District 1 from 1999-2000
Asian Black Hispanic White15% 17% 61% 6%
PS 140 Nathan Straus racial breakdown from 1999-2000
8% 13% 77% 2%

7/27/2019 2013_10-31_CEC1_WXY_AssignmentPolicyStudy FINAL with edits.pdf
http://slidepdf.com/reader/full/201310-31cec1wxyassignmentpolicystudy-final-with-editspdf 24/68
INDICES OF DISSIMILARITY A school’s Segregation Index is calculated by averaging the
findin s difference between the District and the school’s racial and free.
Total Racial Breakdown for District 1 from 1999-2000
Asian Black Hispanic White15% 17% 61% 6%
PS 140 Nathan Straus racial breakdown from 1999-2000 8% 13% 77% 2%
The absolute value of the difference between the District and PS 140
Nathan Straus school
7% 4% 16% 4%

7/27/2019 2013_10-31_CEC1_WXY_AssignmentPolicyStudy FINAL with edits.pdf
http://slidepdf.com/reader/full/201310-31cec1wxyassignmentpolicystudy-final-with-editspdf 25/68
INDICES OF DISSIMILARITY A school’s Segregation Index is calculated by averaging the
findin s difference between the District and the school’s racial and free.
Total Racial breakdown for District 1 from 1999-2000
Asian Black Hispanic White15% 17% 61% 6%
PS 140 Nathan Straus racial breakdown from 1999-2000 8% 13% 77% 2%
The difference between the District and PS 140 Nathan Straus school
Asian Black Hispanic White+ + + = .
The average of the difference is . (rounded). This is the Index.

7/27/2019 2013_10-31_CEC1_WXY_AssignmentPolicyStudy FINAL with edits.pdf
http://slidepdf.com/reader/full/201310-31cec1wxyassignmentpolicystudy-final-with-editspdf 26/68
INDICES OF DISSIMILARITYThe Index for a District school can change if the school’s racial
findin s breakdown does not follow the overall District racial breakdown.
Total Racial Breakdown for District 1 from 1999-2000
Asian Black His anic WhiteTotal Racial breakdown for District 1 from 2010-2011
Asian Black His anic White DISTRICT RAC 15% 17% 61% 6%
-
20% 17% 47% 16%
-
BREAKDOWN
Asian Black Hispanic White
8% 13% 77% 2%
Asian Black Hispanic White
4% 14% 80% 2%
The difference between the District and PS 140 Nathan Straus
Asian Black Hispanic WhiteThe difference between the District and PS 140 Nathan Straus
Asian Black Hispanic White
= . = .

7/27/2019 2013_10-31_CEC1_WXY_AssignmentPolicyStudy FINAL with edits.pdf
http://slidepdf.com/reader/full/201310-31cec1wxyassignmentpolicystudy-final-with-editspdf 27/68
INDICES OF DISSIMILARITYBoth Race and Free Lunch show an increase in segregation
findin s over time.
Racial Index of Dissimilarity by Year Free Lunch Index of Dissimilarity
1st Grade race segregation
7th Grade race segregation
All Grades * Means there is substantial missing data this year

7/27/2019 2013_10-31_CEC1_WXY_AssignmentPolicyStudy FINAL with edits.pdf
http://slidepdf.com/reader/full/201310-31cec1wxyassignmentpolicystudy-final-with-editspdf 28/68
INDICES OF DISSIMILARITYWhile a two schools stand out, the overall trend is positive,
findin s meaning more there has been an increase in racial clustering.
Racial Dissimilarity Index by School by Year

7/27/2019 2013_10-31_CEC1_WXY_AssignmentPolicyStudy FINAL with edits.pdf
http://slidepdf.com/reader/full/201310-31cec1wxyassignmentpolicystudy-final-with-editspdf 29/68
INDICES OF DISSIMILARITYWith the two outlier schools (NEST and PS 184 Shuang Wen)
findin s removed from the data, the trend is still positive and the slope of
Racial Dissimilarity Index by School by Year

7/27/2019 2013_10-31_CEC1_WXY_AssignmentPolicyStudy FINAL with edits.pdf
http://slidepdf.com/reader/full/201310-31cec1wxyassignmentpolicystudy-final-with-editspdf 30/68
INDICES OF DISSIMILARITYThe trend in segregation is not equal by race.
findin s
Dissimilarity Index by Race, All Grades
White and H
index row
Black and A
Asian
Black
Hispa

7/27/2019 2013_10-31_CEC1_WXY_AssignmentPolicyStudy FINAL with edits.pdf
http://slidepdf.com/reader/full/201310-31cec1wxyassignmentpolicystudy-final-with-editspdf 31/68
INDICES OF DISSIMILARITY As a percentage the white population index is increasing more
findin s than others in most schools.
SCHOOLS WITH THE HIGHEST WHITE INDEX
NEST (City wide G/T) 28%THE EAST VILLAGE COMMUNITY SCHOOL 25%
NEIGHBORHOOD SCHOOL 24%
CHILDREN'S WORKSHOP SCHOOL 24%
White Index by School by Year
EARTH SCHOOL 21%UNIVERSITY NEIGHBORHOOD MIDDLE SCHOOL 17%

7/27/2019 2013_10-31_CEC1_WXY_AssignmentPolicyStudy FINAL with edits.pdf
http://slidepdf.com/reader/full/201310-31cec1wxyassignmentpolicystudy-final-with-editspdf 32/68
INDICES OF DISSIMILARITYRemoving NEST and PS 184 Shuang Wen increases the slope
findin s of the line.SCHOOLS WITH THE HIGHEST WHITE INDEX
NEIGHBORHOOD SCHOOL 24%
CHILDREN'S WORKSHOP SCHOOL 24%
White Index by School by Year
UNIVERSITY NEIGHBORHOOD MIDDLE SCHOOL 17%
HENRY STREET SCHOOL FOR INTERNATIONAL STUDIES 15%
7/27/2019 2013_10-31_CEC1_WXY_AssignmentPolicyStudy FINAL with edits.pdf
http://slidepdf.com/reader/full/201310-31cec1wxyassignmentpolicystudy-final-with-editspdf 33/68
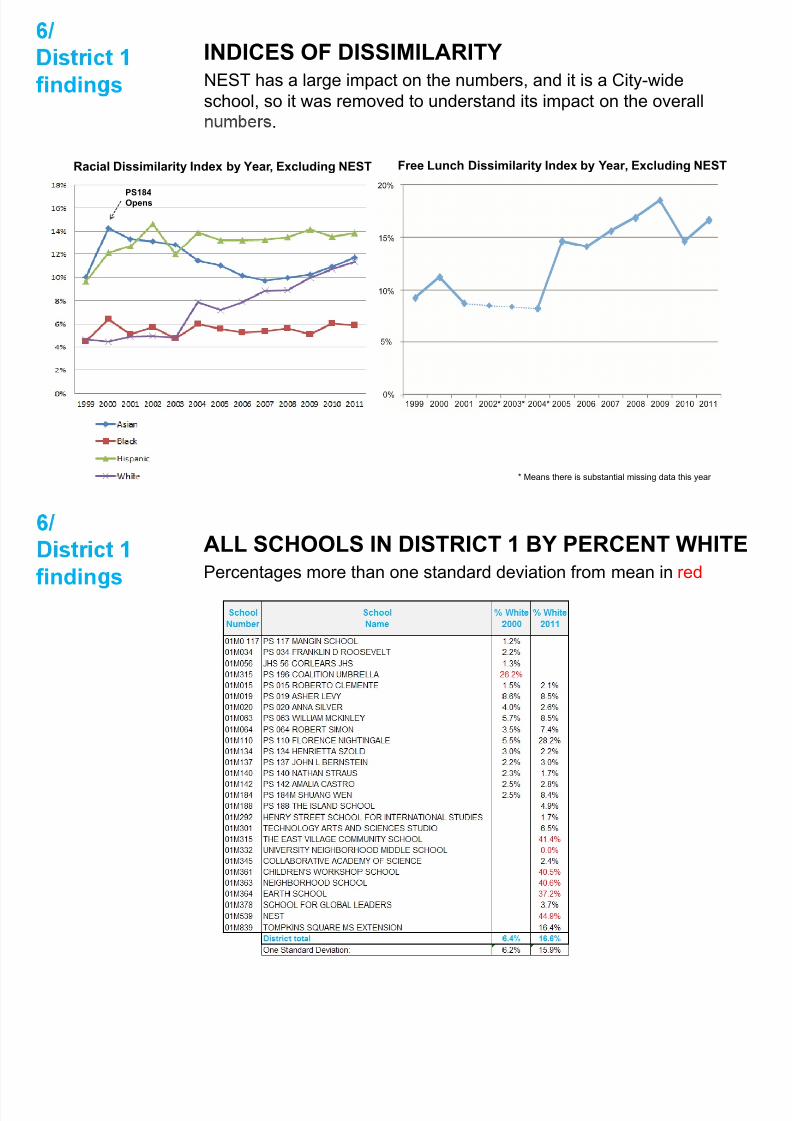
INDICES OF DISSIMILARITYNEST has a large impact on the numbers, and it is a City-wide
findin s school, so it was removed to understand its impact on the overall.
Racial Dissimilarity Index by Year, Excluding NEST Free Lunch Dissimilarity Index by Year, Excluding NES
PS184
Opens
* Means there is substantial missing data this year

7/27/2019 2013_10-31_CEC1_WXY_AssignmentPolicyStudy FINAL with edits.pdf
http://slidepdf.com/reader/full/201310-31cec1wxyassignmentpolicystudy-final-with-editspdf 34/68
ALL SCHOOLS IN DISTRICT 1 BY PERCENT WHPercentages more than one standard deviation from mean in red
findin s
7/27/2019 2013_10-31_CEC1_WXY_AssignmentPolicyStudy FINAL with edits.pdf
http://slidepdf.com/reader/full/201310-31cec1wxyassignmentpolicystudy-final-with-editspdf 35/68
INDICES OF DISSIMILARITY
findin s ere as een s gn can c ange n s r c sc oo s, no on y asbecome more diverse, but there are also many more schools in 2011than there were in 1999.
2/ With this change has also come more clustering of students by race and’ree unc s a us ncreas ng eac sc oo s ss m ar y rom e o ers n
the District.
period. Early increases are tied to the openings of PS184 and NEST,w c a rac e popu a ons eren an e s r c -w e mean. a erincreases were more broad-based. The increase in clustering is most
easily seen in the White population and to a lesser degree the Hispanic.
e ypo es s a open enro men as exacer a e segrega on canbe supported by this work.

7/27/2019 2013_10-31_CEC1_WXY_AssignmentPolicyStudy FINAL with edits.pdf
http://slidepdf.com/reader/full/201310-31cec1wxyassignmentpolicystudy-final-with-editspdf 36/68
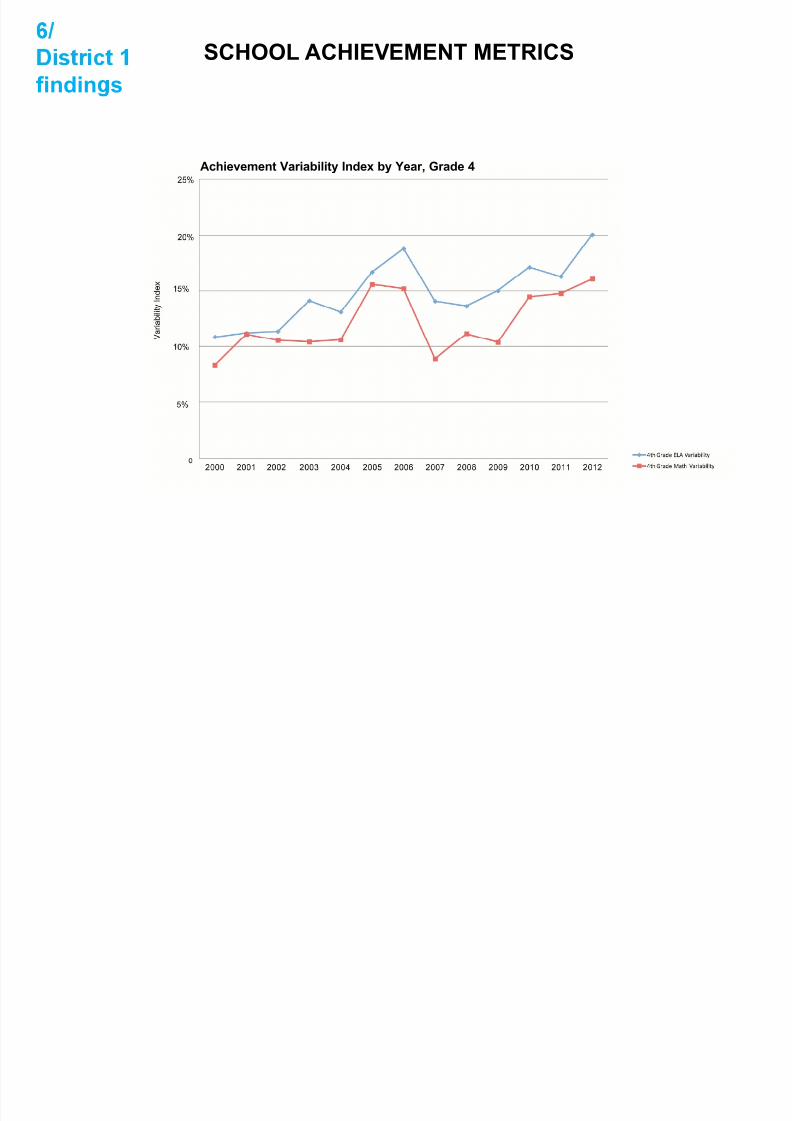
SCHOOL ACHIEVEMENT METRICS
findin s
Achievement Variability Index by Year, Grade 4

7/27/2019 2013_10-31_CEC1_WXY_AssignmentPolicyStudy FINAL with edits.pdf
http://slidepdf.com/reader/full/201310-31cec1wxyassignmentpolicystudy-final-with-editspdf 37/68
SCHOOL ACHIEVEMENT METRICS
findin s
Achievement Variability Index by Year, Grade 8
INDICES OF SCHOOL ACHIEVEMENT DISPARITY

7/27/2019 2013_10-31_CEC1_WXY_AssignmentPolicyStudy FINAL with edits.pdf
http://slidepdf.com/reader/full/201310-31cec1wxyassignmentpolicystudy-final-with-editspdf 38/68
INDICES OF SCHOOL ACHIEVEMENT DISPARITY
findin s
FINDINGS
ere are s gn can ncreases n e s ra ca on e ween sc oo s e weehigher and lower performing schools (based on State-administeredassessments in English Language Arts and Mathematics) during the study
.
ncrease s ra ca on o serve or o gra e an gra e s u en s
3/ The observed stratification between schools cannot necessarily be causally.
and makeup of standardized tests or changing district demographic.
INDICES OF SCHOOL ACHIEVEMENT DISPARITY

7/27/2019 2013_10-31_CEC1_WXY_AssignmentPolicyStudy FINAL with edits.pdf
http://slidepdf.com/reader/full/201310-31cec1wxyassignmentpolicystudy-final-with-editspdf 39/68
INDICES OF SCHOOL ACHIEVEMENT DISPARITY
findin s
NEXT STEP
schools across the city for each of the District 1 schools. Then model theu v u
assignment policy, controlling for a variety of demographic/socioeconomicfactors.
NYC CAPACITY AND UPTAKE
7/27/2019 2013_10-31_CEC1_WXY_AssignmentPolicyStudy FINAL with edits.pdf
http://slidepdf.com/reader/full/201310-31cec1wxyassignmentpolicystudy-final-with-editspdf 40/68
NYC CAPACITY AND UPTAKEThere has been an increase in uptake of NYC schools during
findin s this time period as the number of children overall has fallen. The
about the same.
33% not in 24% not in
NYC DOE Schools
[330,092 students]
NYC DOE Schools
[203,805 students]
up a e
[658,821 students]
up a e
[639,557 students]
988,913 children aged 5 - 13 843,362 children aged 5 - 13
NYC CAPACITY AND UPTAKE

7/27/2019 2013_10-31_CEC1_WXY_AssignmentPolicyStudy FINAL with edits.pdf
http://slidepdf.com/reader/full/201310-31cec1wxyassignmentpolicystudy-final-with-editspdf 41/68
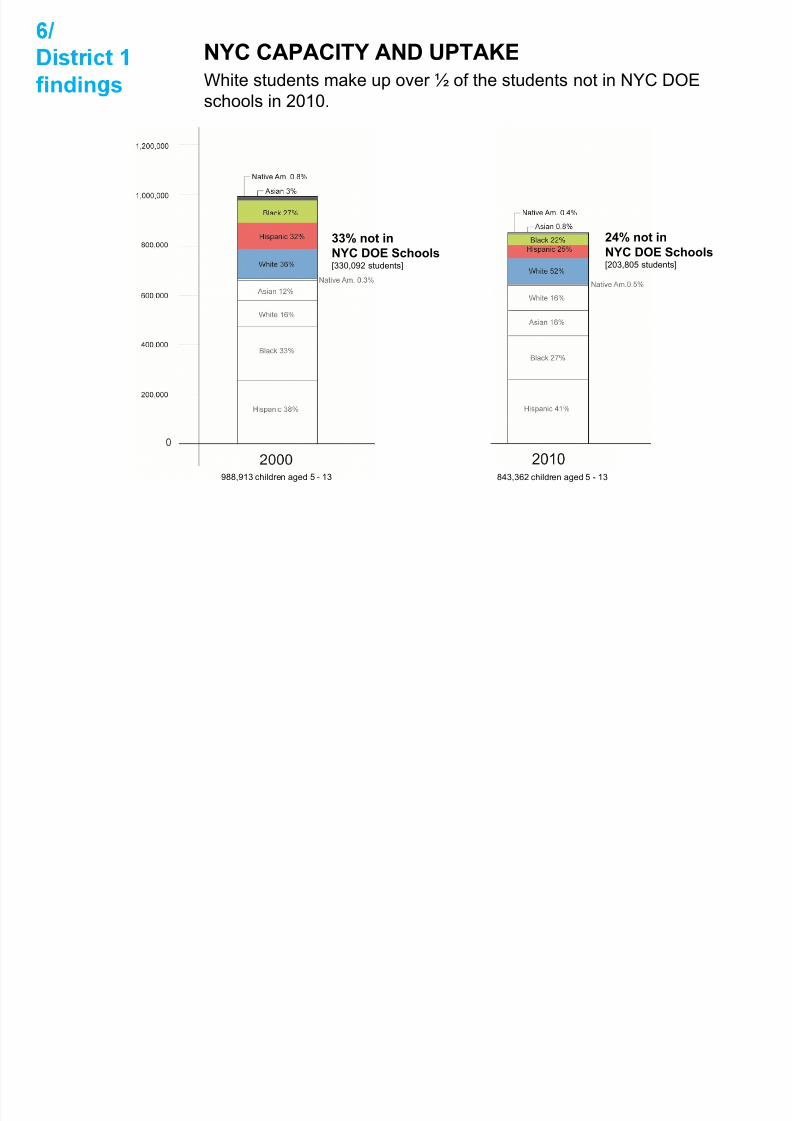
NYC CAPACITY AND UPTAKEWhite students make up over ½ of the students not in NYC DOE
findin s schools in 2010.
33% not in 24% not in
NYC DOE Schools
[330,092 students]
NYC DOE Schools
[203,805 students]
988,913 children aged 5 - 13 843,362 children aged 5 - 13
DISTRICT 1 CAPACITY AND UPTAKE

7/27/2019 2013_10-31_CEC1_WXY_AssignmentPolicyStudy FINAL with edits.pdf
http://slidepdf.com/reader/full/201310-31cec1wxyassignmentpolicystudy-final-with-editspdf 42/68
DISTRICT 1 CAPACITY AND UPTAKESince 2000, there has been a decrease in 5 – 13 aged children
findin s in District 1, which is similar to the overall NYC trend, but there.
[4,460 students]
[1,328 students]
up a e avg.
[6,850 students]
up a e
[7,137 students]
*
11,310 children aged 5 - 13 8,465 children aged 5 - 13
“leakage” to othwhere NYC is n
DISTRICT 1 CAPACITY AND UPTAKE

7/27/2019 2013_10-31_CEC1_WXY_AssignmentPolicyStudy FINAL with edits.pdf
http://slidepdf.com/reader/full/201310-31cec1wxyassignmentpolicystudy-final-with-editspdf 43/68
DISTRICT 1 CAPACITY AND UPTAKEWhile the overall number of District 1 students has decreased,
findin s there has been an increase in number of White, Asian, and Black.
11,310 children aged 5 - 13 8,465 children aged 5 - 13 11,310 children aged 5 - 13 8,465 children aged 5 - 13
White His anic0%5 n
38%470 not
435 in District63%751 not 100%
1,809 notin District
62%in Districtin District 3,703 in District
69% ,
0%
Black Asian
611,3
39%43%
6 notin District357 not
in District
847 notin District
1,184 inDistrict57%100%77%
, no
in District
, n s r c, n s r c
DISTRICT 1 CAPACITY AND UPTAKE

7/27/2019 2013_10-31_CEC1_WXY_AssignmentPolicyStudy FINAL with edits.pdf
http://slidepdf.com/reader/full/201310-31cec1wxyassignmentpolicystudy-final-with-editspdf 44/68
DISTRICT 1 CAPACITY AND UPTAKEThe makeup of students who do not attend District 1 schools has
findin s changed: in 2010, the White and Asian population largely make.
Total Aged 5-13 who
live within District 1
Total Aged 5-13 who
live within District 1
Black 14%Hispanic 51%
Black 15%Hispanic 44%
Am. Indian 1%
Am. Indian 1%
4,460 students]
1,328 students]
11,310 children aged 5 - 13 8,465 children aged 5 - 13
OUTSTANDING QUESTIONS

7/27/2019 2013_10-31_CEC1_WXY_AssignmentPolicyStudy FINAL with edits.pdf
http://slidepdf.com/reader/full/201310-31cec1wxyassignmentpolicystudy-final-with-editspdf 45/68
OUTSTANDING QUESTIONS
findin s
1/ Is the stratification reflective of the assignment policy change? Or is thisreflective of trends associated with gentrification and larger white
Are these trends reflective of neighborhood segregation trends, which
enerall show that non-His anic white o ulations tend to cluster inpredominantly white neighborhoods? (John Logan and Brian Stults, The Persistence
Is the increased uptake being driven by the assignment policy, the
changing demographics, or the improving achievement levels?

7/27/2019 2013_10-31_CEC1_WXY_AssignmentPolicyStudy FINAL with edits.pdf
http://slidepdf.com/reader/full/201310-31cec1wxyassignmentpolicystudy-final-with-editspdf 46/68
/ Why compare District 1 + 13?
/ Indices of dissimilarity/ Achievement metrics apac ty an upta e
u u
WHY COMPARE DISTRICT 1 + 13

7/27/2019 2013_10-31_CEC1_WXY_AssignmentPolicyStudy FINAL with edits.pdf
http://slidepdf.com/reader/full/201310-31cec1wxyassignmentpolicystudy-final-with-editspdf 47/68
WHY COMPARE DISTRICT 1 + 13
findin s
In 2000, Average Median Household income was $32,381 and
$39,011 in District 1 and 13, respectively.
2000
n on quare
DUMBO
NoHo Alphabet City
Brooklyn Heights
Fort Greene
Clinton Hill
BedS
Prospect Heights
Under $25K
Lower East Side$25 – 55K
–
WHY COMPARE DISTRICT 1 + 13

7/27/2019 2013_10-31_CEC1_WXY_AssignmentPolicyStudy FINAL with edits.pdf
http://slidepdf.com/reader/full/201310-31cec1wxyassignmentpolicystudy-final-with-editspdf 48/68
WHY COMPARE DISTRICT 1 + 13Between 2000 – 2010, median household income rose by 57%
findin s and 55%, respectively.
2010
n on quare
DUMBO
Alphabet City
Brooklyn Heights
NoHo
Fort Greene
Clinton Hill
BedS
Prospect Heights
Under $25K
Lower East Side$25 – 55K
–
WHY COMPARE DISTRICT 1 + 13

7/27/2019 2013_10-31_CEC1_WXY_AssignmentPolicyStudy FINAL with edits.pdf
http://slidepdf.com/reader/full/201310-31cec1wxyassignmentpolicystudy-final-with-editspdf 49/68
WHY COMPARE DISTRICT 1 13In District 1, 18% of residents live in NYCHA housing
findin s developments, compared to 8% in District 13.
2011
WHY COMPARE DISTRICT 1 + 13

7/27/2019 2013_10-31_CEC1_WXY_AssignmentPolicyStudy FINAL with edits.pdf
http://slidepdf.com/reader/full/201310-31cec1wxyassignmentpolicystudy-final-with-editspdf 50/68
WHY COMPARE DISTRICT 1 13The percentage of white population was 32% and 23% in District
findin s 1 and 13, respectively.
2000
n on quare
DUMBO
Alphabet City
Brooklyn Heights
NoHo
Fort Greene
Clinton Hill
BedS
Prospect Heights
o o a opu a on,
White
Less than 25%
Lower East Side25% – 50%
–
WHY COMPARE DISTRICT 1 + 13

7/27/2019 2013_10-31_CEC1_WXY_AssignmentPolicyStudy FINAL with edits.pdf
http://slidepdf.com/reader/full/201310-31cec1wxyassignmentpolicystudy-final-with-editspdf 51/68
Between 2000 – 2010, the total white population rose by 93%
findin s and 90%, respectively.
2010
n on quare
DUMBO
Alphabet City
Brooklyn Heights
NoHo
Fort Greene
Clinton Hill
BedS
Prospect Heights
o o a opu a on,
White
Less than 25%
Lower East Side25% – 50%
–
INDICES OF DISSIMILARITY

7/27/2019 2013_10-31_CEC1_WXY_AssignmentPolicyStudy FINAL with edits.pdf
http://slidepdf.com/reader/full/201310-31cec1wxyassignmentpolicystudy-final-with-editspdf 52/68
District 13 is notable for its decline in enrollment.findin s
Number of Students by Race, District 13 % of Students Receiving Free Lunch
Asian Hispanic UnknownDistrict 1
Black e District 13
INDICES OF DISSIMILARITY
7/27/2019 2013_10-31_CEC1_WXY_AssignmentPolicyStudy FINAL with edits.pdf
http://slidepdf.com/reader/full/201310-31cec1wxyassignmentpolicystudy-final-with-editspdf 53/68
findin s
Racial Segregation Index by Year, District 1 + 13 Free Lunch Index, District 1 + 13
INDICES OF DISSIMILARITY

7/27/2019 2013_10-31_CEC1_WXY_AssignmentPolicyStudy FINAL with edits.pdf
http://slidepdf.com/reader/full/201310-31cec1wxyassignmentpolicystudy-final-with-editspdf 54/68
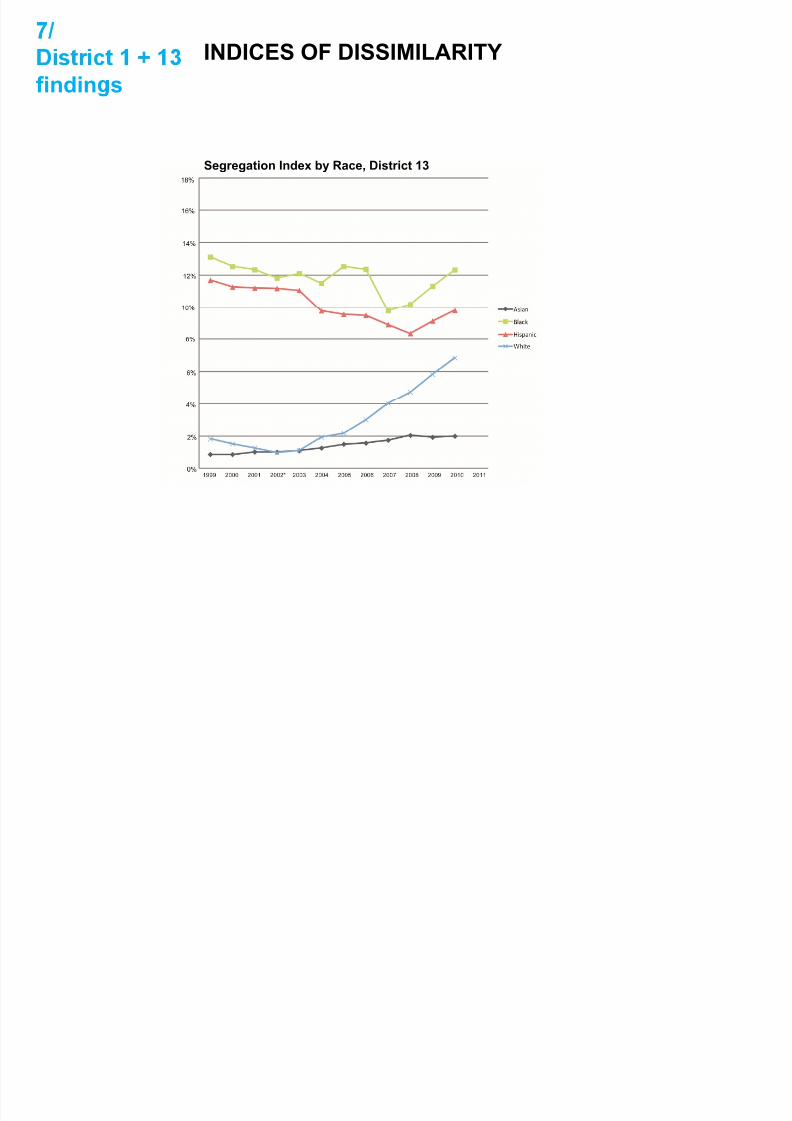
findin s
Segregation Index by Race, District 13
ACHIEVEMENT METRICS

7/27/2019 2013_10-31_CEC1_WXY_AssignmentPolicyStudy FINAL with edits.pdf
http://slidepdf.com/reader/full/201310-31cec1wxyassignmentpolicystudy-final-with-editspdf 55/68
The distribution of 4th grade achievement is comparatively stablefindin sfor District 13 schools
4th Grade ELA Achievement Variability, District 1 + 13 4th Grade Math Achievement Variability, District 1 +
ACHIEVEMENT METRICS

7/27/2019 2013_10-31_CEC1_WXY_AssignmentPolicyStudy FINAL with edits.pdf
http://slidepdf.com/reader/full/201310-31cec1wxyassignmentpolicystudy-final-with-editspdf 56/68
Stratification of 8th grade achievement scores actually declinesfindin sover the study period for District 13 schools
8th Grade ELA Achievement Variability, District 1 + 13 8th Grade Math Achievement Variability, District 1 +
ACHIEVEMENT METRICS
7/27/2019 2013_10-31_CEC1_WXY_AssignmentPolicyStudy FINAL with edits.pdf
http://slidepdf.com/reader/full/201310-31cec1wxyassignmentpolicystudy-final-with-editspdf 57/68
District 1 and 13 have had similar trajectories with respect to thefindin sproportion of students meeting the Grade 4 ELA and Math
Comparison of District 1 and District 13, 4th Grade Achievement Trajectories
ACHIEVEMENT METRICS

7/27/2019 2013_10-31_CEC1_WXY_AssignmentPolicyStudy FINAL with edits.pdf
http://slidepdf.com/reader/full/201310-31cec1wxyassignmentpolicystudy-final-with-editspdf 58/68
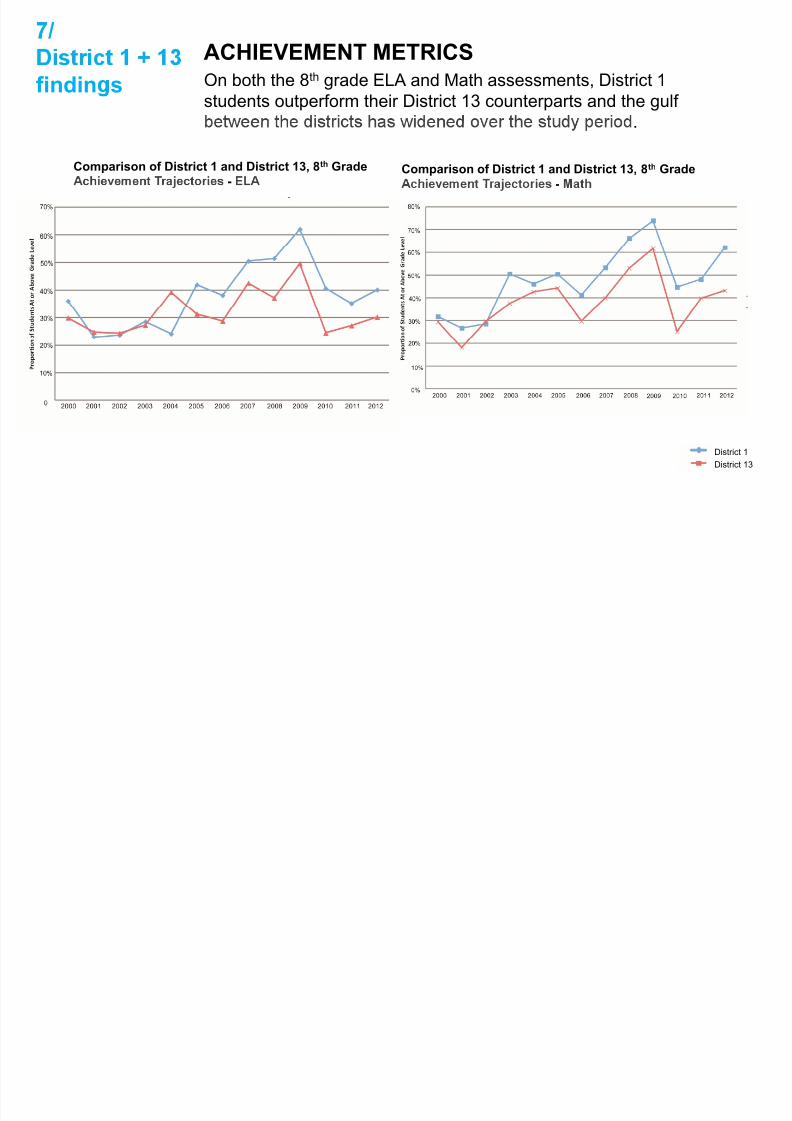
On both the 8th grade ELA and Math assessments, District 1findin sstudents outperform their District 13 counterparts and the gulf
.
Comparison of District 1 and District 13, 8th Grade
-
Comparison of District 1 and District 13, 8th Grade
-
DISTRICT 13 CAPACITY AND UPTAKE
7/27/2019 2013_10-31_CEC1_WXY_AssignmentPolicyStudy FINAL with edits.pdf
http://slidepdf.com/reader/full/201310-31cec1wxyassignmentpolicystudy-final-with-editspdf 59/68
Uptake has remained the same, even as overall numbers havefindin sdeclined.
43 not in District 41% not in District [9,723 students] [7,133 students]
up a e avg.
[13,084 students]
up a e
[10,043 students]
22,807 children aged 5 - 13 17176 children aged 5 - 13
DISTRICT 13 CAPACITY AND UPTAKE

7/27/2019 2013_10-31_CEC1_WXY_AssignmentPolicyStudy FINAL with edits.pdf
http://slidepdf.com/reader/full/201310-31cec1wxyassignmentpolicystudy-final-with-editspdf 60/68
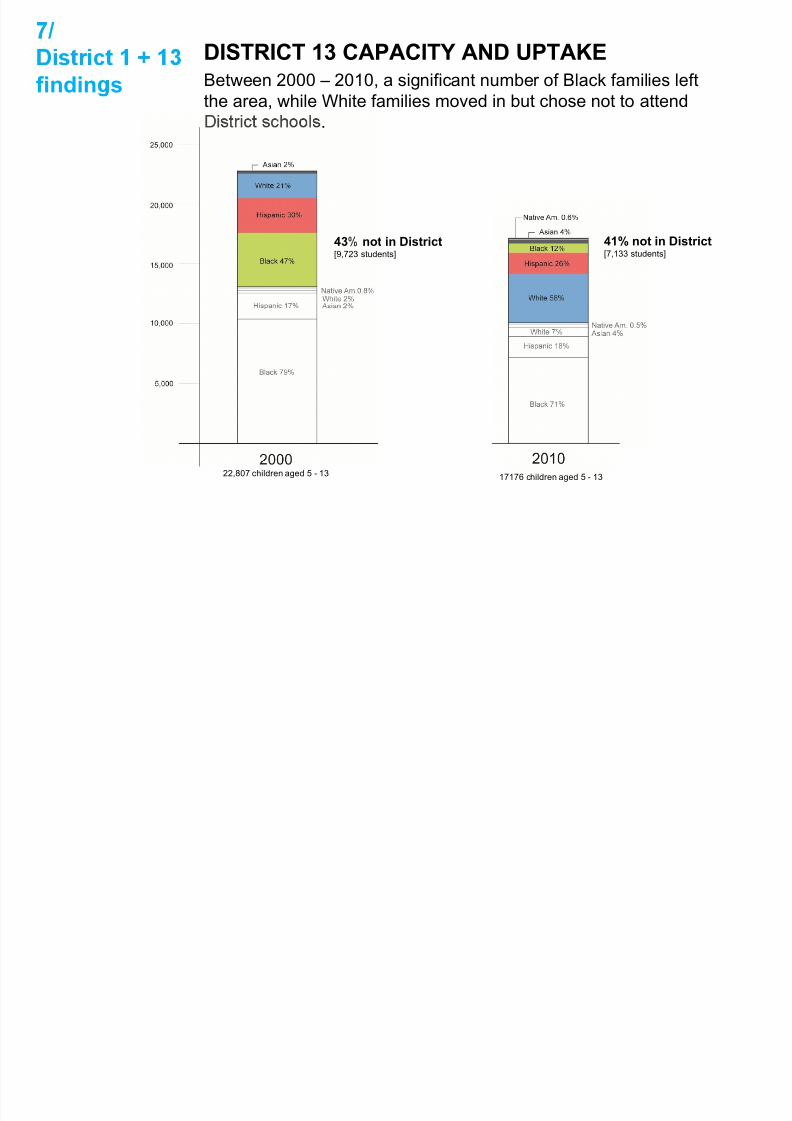
Between 2000 – 2010, a significant number of Black families leftfindin sthe area, while White families moved in but chose not to attend
.
43 not in District 41% not in District [9,723 students] [7,133 students]
22,807 children aged 5 - 13 17176 children aged 5 - 13
OUTSTANDING QUESTIONS

7/27/2019 2013_10-31_CEC1_WXY_AssignmentPolicyStudy FINAL with edits.pdf
http://slidepdf.com/reader/full/201310-31cec1wxyassignmentpolicystudy-final-with-editspdf 61/68
uestions +
next steps
1/ Can we determine a causal relationship between D1’s stratification andthe change in assignment policy?
2/ Can we determine a causal relationship between D1’s uptake increase
an e c ange n ass gnmen po cy
3/ Based on the comparison to D13, does unzoned assignment policyprovide greater encouragement for uptake than zoned schools? Does this“ ”
of those neighborhoods?
4/ How does an assi nment olic have different effects in different “kinds”
of neighborhoods – gentrifying, gentrified, non-gentrified?
NEXT STEPS: FORMING AN APPROACH

7/27/2019 2013_10-31_CEC1_WXY_AssignmentPolicyStudy FINAL with edits.pdf
http://slidepdf.com/reader/full/201310-31cec1wxyassignmentpolicystudy-final-with-editspdf 62/68
uestions +
next steps
NEXT STEPS: FORMING AN APPROACH

7/27/2019 2013_10-31_CEC1_WXY_AssignmentPolicyStudy FINAL with edits.pdf
http://slidepdf.com/reader/full/201310-31cec1wxyassignmentpolicystudy-final-with-editspdf 63/68
uestions +
next steps

7/27/2019 2013_10-31_CEC1_WXY_AssignmentPolicyStudy FINAL with edits.pdf
http://slidepdf.com/reader/full/201310-31cec1wxyassignmentpolicystudy-final-with-editspdf 64/68
George M. Janes A
DISTRICT 23 CAPACITY AND UPTAKE
i
7/27/2019 2013_10-31_CEC1_WXY_AssignmentPolicyStudy FINAL with edits.pdf
http://slidepdf.com/reader/full/201310-31cec1wxyassignmentpolicystudy-final-with-editspdf 65/68
com arison
41 not in District 39% not in District [7,938 students] [7,133 students]
up a e avg.[11,753 students]
up a e [9,409 students]
19,691 children aged 5 - 13 15,515 children aged 5 - 13
DISTRICT 2 CAPACITY AND UPTAKEBetween 2000 to 2010 District 2 increased in number of schoolsi

7/27/2019 2013_10-31_CEC1_WXY_AssignmentPolicyStudy FINAL with edits.pdf
http://slidepdf.com/reader/full/201310-31cec1wxyassignmentpolicystudy-final-with-editspdf 66/68
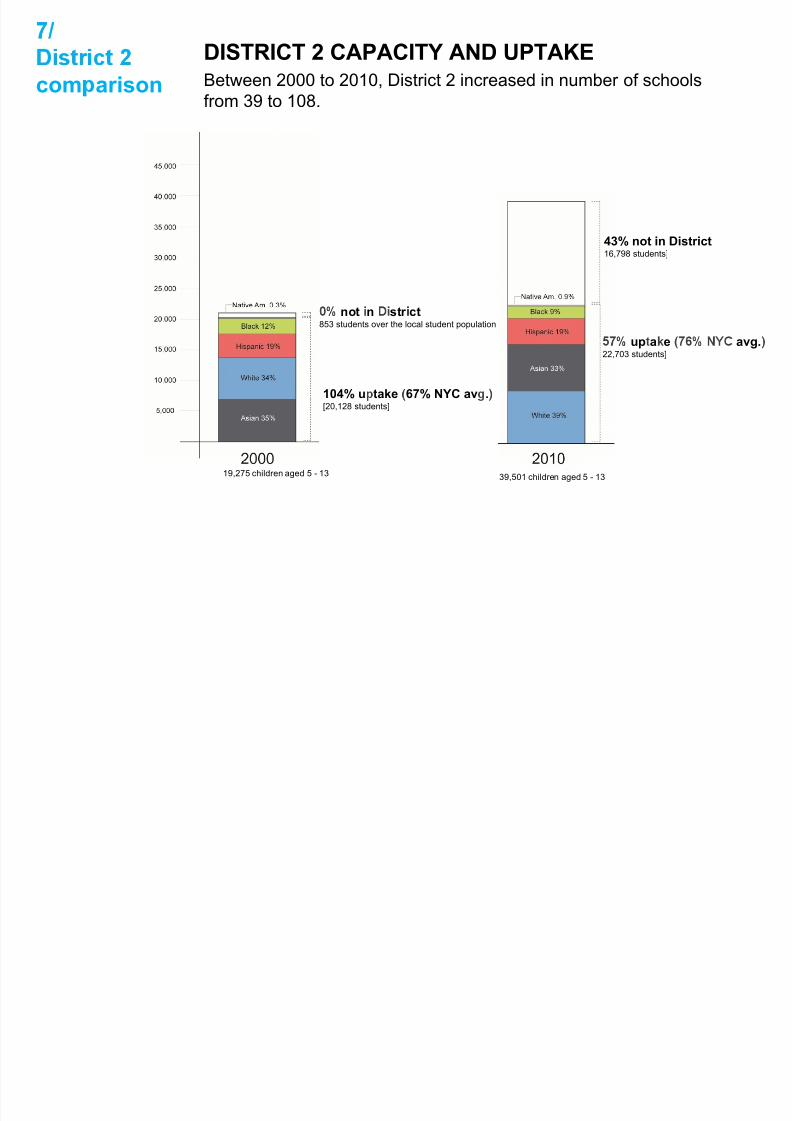
Between 2000 to 2010, District 2 increased in number of schoolscom arisonfrom 39 to 108.
43% not in District16,798 students]
not n str ct853 students over the local student population
up a e 22,703 students]
104% u take 67% NYC av .[20,128 students]
19,275 children aged 5 - 13 39,501 children aged 5 - 13
DISTRICT 2 CAPACITY AND UPTAKEBetween 2000 to 2010 District 2 increased in number of schoolscom arison

7/27/2019 2013_10-31_CEC1_WXY_AssignmentPolicyStudy FINAL with edits.pdf
http://slidepdf.com/reader/full/201310-31cec1wxyassignmentpolicystudy-final-with-editspdf 67/68
Between 2000 to 2010, District 2 increased in number of schoolscom arisonfrom 39 to 108.
43% not in District16,798 students]
not n str ct853 students over the local student population
up a e 22,703 students]
104% u take 67% NYC av .[20,128 students]
19,275 children aged 5 - 13 39,501 children aged 5 - 13
School District

7/27/2019 2013_10-31_CEC1_WXY_AssignmentPolicyStudy FINAL with edits.pdf
http://slidepdf.com/reader/full/201310-31cec1wxyassignmentpolicystudy-final-with-editspdf 68/68
School District
Racial Profile
1990, District
3 Census*
1990,
School
2000, District
3 Census*
2000,
School2010, District
3 Census*
2010,
School
Race n er : : s r c : n er : s r c - : n er : s r c -
American Indian 0.2% 79 0.1% 9 0.2% 48 0.8% 52 0.2% 41 0.8%
s an ac c s an er . , . . , . , . , .
Black 10.0% 3,223 20.9% 2,098 10.1% 2,845 17.5% 1,198 10.6% 2,344 16.6%
. , . , . , . , . , .
White 9.6% 3,108 5.4% 540 9.4% 2,631 6.4% 435 13.2% 2,930 16.5%
, , , , ,
Source: 1New York City Department of City Planning , Total Population Under 18 by Mutual2 National Center for Education Statistics, Common Core of Data