2013 Year in Review - Department of Energy · DOE / 2013 Year in Review i 2013 YIR May 2014 ......
52
DOE / 2013 Year in Review i 2013 YIR May 2014 Year-in-Review: 2013 Energy Infrastructure Events and Expansions Infrastructure Security and Energy Restoration Office of Electricity Delivery and Energy Reliability U.S. Department of Energy
Transcript of 2013 Year in Review - Department of Energy · DOE / 2013 Year in Review i 2013 YIR May 2014 ......

DOE / 2013 Year in Review i 2013 YIR
May 2014
Year-in-Review: 2013 Energy Infrastructure Events and Expansions
Infrastructure Security and Energy Restoration
Office of Electricity Delivery and Energy Reliability
U.S. Department of Energy

DOE / 2013 Year in Review ii 2013 YIR
For Further Information
This report was prepared by the Office of Electricity Delivery and Energy Reliability under the
direction of Patricia Hoffman, Assistant Secretary, and William Bryan, Deputy Assistant
Secretary.
Specific questions about this report may be directed to John Ostrich, Office of Electricity
Delivery and Energy Reliability ([email protected]).
Contributors include Kevin DeCorla-Souza, Shravan Amin, John Mulligan, Aaron Geschiere,
Erika Myers, and Courtney Good.
DOE / 2013 Year in Review iii 2013 YIR
Contents
1. Introduction .................................................................................................................... 1
1.1 Background and Organization ............................................................................. 1
1.2 Data Sources and Limitations ............................................................................. 1
1.3 Financial and Economic Context ......................................................................... 2
2. Energy Disruptions ......................................................................................................... 4
2.1 Major Events ....................................................................................................... 4
2.1.1 Electricity ................................................................................................. 4
2.1.2 Petroleum and Natural Gas ..................................................................... 5
2.3 Electricity Disruptions .......................................................................................... 7
2.3.1 Customer Outages .................................................................................. 7
2.3.2 Power Plant Outages ............................................................................... 9
2.3.3 Physical Attacks and Sabotage ..............................................................10
2.4 Natural Gas Disruptions .....................................................................................11
2.4.1 Upstream ................................................................................................11
2.4.2 Midstream and Downstream ...................................................................12
2.5 Petroleum Disruptions ........................................................................................13
2.5.1 Production ..............................................................................................13
2.5.2 Refineries ...............................................................................................14
2.5.3 Transportation and Storage ....................................................................15
2.5.4 Hours-of-Service Exemptions .................................................................16
2.6 Biofuel Disruptions .............................................................................................17
2.7 Cybersecurity .....................................................................................................17
2.7.1 Attacks and Exercises ............................................................................17
2.7.2 Cybersecurity Policies ............................................................................18
3. Infrastructure Changes ..................................................................................................20
3.1 Electricity ...........................................................................................................20
3.1.1 Environmental Regulations .....................................................................20
3.1.2 Coal-Fired Power Plant Retirements .......................................................20
3.1.3 New Generating Capacity .......................................................................21
3.1.4 Nuclear Power Plants .............................................................................23
3.1.5 Transmission Expansion and Smart Grid Implementation .......................24
3.2 Natural Gas Projects ..........................................................................................25
3.2.1 Natural Gas Processing Plants ...............................................................25
3.2.2 Natural Gas Pipelines .............................................................................26
3.2.3 Liquefied Natural Gas Export Terminals .................................................27

DOE / 2013 Year in Review iv 2013 YIR
3.3 Petroleum Projects .............................................................................................28
3.3.1 Crude Oil Production and Transportation Projects ..................................28
3.3.2 Refining and Petroleum Product Transportation .....................................32
3.4 Biofuels ..............................................................................................................35
3.4.1 New Biofuel Plants .................................................................................35
3.4.2 Plants in Transition ................................................................................36
3.4.3 Policy Changes.......................................................................................37
4. International Events .......................................................................................................39
4.1 International Incidents and Disruptions ..............................................................39
4.1.1 Africa .....................................................................................................39
4.1.2 Middle East ............................................................................................40
4.1.3 Americas ...............................................................................................40
4.1.4 Asia .......................................................................................................41
4.2 International Infrastructure Projects ...................................................................41
4.2.1 Africa ......................................................................................................41
4.2.2 Middle East .............................................................................................41
4.2.3 Asia/Australia .........................................................................................42
Appendix A. Criteria for EAD Selection .....................................................................................43
Appendix B. List of Biofuel Plants in Transition, 2013................................................................44
Figures
Figure 1. U.S. Oil and Gas Spot Prices, 2013 .................................................................... 3
Figure 2. 2013 Map of Major Events .................................................................................. 4
Figure 3. Large-Scale U.S. Electric Customer Outage Events, 2013 .................................. 7
Figure 4. Number of Major Outage Events by U.S. State, 2013 ......................................... 8
Figure 5. U.S. Electric Customer Outage Events by Cause and Magnitude, 2013 ............. 9
Figure 6. Unplanned and Unknown Power Plant Outages, 2013 .......................................10
Figure 7. U.S. Refinery Disruptions by Cause, 2013 .........................................................15
Figure 8. Coal-Fired Generation Capacity Retired or Announced to be Retired ................21
Figure 9. New Power Plant Capacity in the United States, 2013 .......................................22
Figure 10. Capacity of New Natural Gas Processing Plant Projects by State and Status ....26

DOE / 2013 Year in Review v 2013 YIR
Tables
Table 1. Hours-of-Service Exemptions, 2013 ...................................................................16
Table 2. Locations of Coal-Fired Generation Retirements................................................21
Table 3. New Natural Gas-Fired Power Plants, 2013 .......................................................22
Table 4. Proposed and Under Construction Renewable Energy Capacity, 2013 ..............23
Table 5. Transmission Line Projects Entering Service, 2013 ...........................................25
Table 6. Proposed LNG Export Projects in the United States, 2013 .................................28

DOE / 2013 Year in Review vi 2013 YIR
Abbreviations
b/d barrels per day
bbl barrel
Bcf billion cubic feet
Bcf/d billion cubic feet per day
CAISO California Independent System Operator
CDU crude distillation unit
CO2 Carbon dioxide
CPUC California Public Utilities Commission
DHS U.S. Department of Homeland Security
DOE U.S. Department of Energy
E10 10 percent ethanol-blended gasoline
EAD Energy Assurance Daily
EPA U.S. Environmental Protection Agency
FERC Federal Energy Regulatory Commission
FTA Free Trade Agreement
GW gigawatt
HOS hours-of-service
ICS-CERT Industrial Control Systems Cyber Emergency Response Team
ISER Infrastructure Security and Energy Restoration
kV kilovolts
LNG liquefied natural gas
MMBtu million British thermal units
MMcf million cubic feet
MMcf/d million cubic feet per day
MMgal million gallons

DOE / 2013 Year in Review vii 2013 YIR
MMgal/year million gallons per year
mph miles per hour
MW megawatts
MWh Megawatt-hour
NERC North American Electric Reliability Corporation
NRC Nuclear Regulatory Commission
NSPS New Source Performance Standard
OE Office of Electricity Delivery and Energy Reliability
PTC production tax credit
RFS U.S. Renewable Fuel Standard
RIN Renewable Identification Number
TCEQ Texas Commission on Environmental Quality
ULSD ultra-low sulfur diesel
VDU vacuum distillation unit
WTI West Texas Intermediate
YIR Year-in-Review

DOE / 2013 Year in Review 1 2013 YIR
1. Introduction
The 2013 Year-in-Review (YIR) provides a summary of significant energy disruptions and
infrastructure changes that occurred in the United States in 2013. The report also summarizes
international events that directly or indirectly affected the United States.
1.1 Background and Organization
The 2013 YIR is based primarily on information reported in Energy Assurance Daily (EAD)
between January 1, 2013 and December 31, 2013.1 The EAD contains summaries of energy
sector highlights and is published Monday through Friday by the U.S. Department of Energy
(DOE), Office of Electricity Delivery and Energy Reliability (OE), Infrastructure Security and
Energy Restoration (ISER) Division. For the summaries of certain major events, information is
drawn from Emergency Situation Reports, which are also published by ISER.
Events and developments reported in EAD are grouped by energy sector: Electricity, Petroleum,
and Natural Gas. The Other News section includes information related to coal, biofuels, energy
policy, and other relevant news items that do not fit into the three energy sector categories.
These sections primarily cover events and developments in the United States, but also include
relevant events and developments in Canada and Mexico that affect the United States due to
interdependencies between North American energy markets. Events and developments outside
of North America that have a significant impact on global energy markets are reported in the
International News section. EAD reports events and developments that meet a specific
threshold of impact or importance to energy supply (see Appendix A for selection criteria). A
special section, Major Developments, reports on events that disrupt energy service to a large
segment of the population and/or damage critical assets in the energy sector. The Major
Developments section is only included in EAD when an event meets the criteria for a Major
Development.
1.2 Data Sources and Limitations
EAD is derived from publicly available information and does not include classified or confidential
data or information accessible only through subscription services. As a result, EAD—and by
extension, the 2013 YIR—should not be viewed as an exhaustive summary of all significant
energy events. Information published in Emergency Situation Reports is similarly limited to the
data available in the public domain or confirmed from company websites; DOE communications;
and/or Federal, State, and local government agencies.
Filings and reports with national and State regulatory agencies are a regular source the EAD.
As a result, the events reported in EAD may be skewed toward certain regions or energy
sectors. For example, California and Texas State agencies tend to release more energy
information into the public domain than other States. This abundance of source material can
1 Unless noted otherwise, the source for all information in this report is EAD
(http://www.oe.netl.doe.gov/ead.aspx).

DOE / 2013 Year in Review 2 2013 YIR
distort the balance of information published, with more events reported for California and Texas.
Similarly, the U.S. Nuclear Regulatory Commission (NRC) provides an abundance of public
information on nuclear power plants, including daily records on the operational status of all
nuclear power plants in the United States. There is no equivalent reporting mechanism for coal,
natural gas, or any other class of utility-scale power generation. As a result, EAD often includes
a relatively large number of events relating to nuclear power plants in comparison to coal and
other generation types, even though coal accounts for significantly more electricity production in
the United States.2
This report compares events and infrastructure changes that occurred in 2012 and 2013 to
highlight a few selected trends, but these comparisons are based only on the news articles and
information captured by EAD and Situation Reports, and should not be viewed as thorough
analysis. Readers are advised to view the 2013 YIR as a snapshot of newsworthy events and
broad trends that shaped the U.S. energy sector in 2013.
1.3 Financial and Economic Context
EAD reports spot U.S. energy prices for crude oil (West Texas Intermediate [WTI]) and natural
gas (Henry Hub). Figure 1 presents a time series of these prices in 2013, as well as the
European North Sea Brent benchmark crude oil price. WTI is a crude oil produced in Texas and
southern Oklahoma, which serves as a marker for pricing North American crude streams and is
traded in the domestic spot market at Cushing, Oklahoma. WTI crude is the underlying
commodity for the New York Mercantile Exchange’s (NYMEX) oil futures contracts. Brent crude
is a blended crude stream produced in the North Sea region that serves as a reference, or
marker, for pricing a number of crude oils in the Atlantic market. Henry Hub is a natural gas
pipeline hub on the Louisiana Gulf Coast and serves as the delivery point for the NYMEX
natural gas futures contract.
2 According to the U.S. Energy Information Administration (EIA), coal-fired power plants accounted for
37 percent of U.S. electric generation (MWh), and nuclear power plants accounted for 19 percent of electric generation in 2012 (EIA Electric Power Annual, http://www.eia.gov/electricity/annual).

DOE / 2013 Year in Review 3 2013 YIR
Figure 1. U.S. Oil and Gas Spot Prices, 2013
Source: U.S. Energy Information Administration
In 2013, WTI crude prices peaked at the beginning of September at $110.62 per barrel (bbl) and
Brent prices peaked in early February at $118.90/bbl. Throughout the year, crude prices
remained relatively steady, with WTI averaging $97.98/bbl (the highest average since 2008) and
Brent averaging $108.56/bbl for the year. The Brent price in 2013 was down slightly from 2011
and 2012 averages.
Historically, WTI has traded at a slight premium to Brent because WTI is lighter (less dense)
and sweeter (less sulfuric), which are desirable characteristics for refining. Moreover, WTI’s
premium to Brent reflected the location differential for similar quality crudes based on
transportation costs into the U.S. However, beginning in 2011 and continuing through 2013, the
traditional WTI-Brent relationship flipped with WTI trading at a discount to Brent due to a surplus
of crude oil inventories in Cushing, Oklahoma (the delivery point for WTI NYMEX futures
contracts). The surplus in Cushing is the result of increasing deliveries of crude oil produced in
the Williston Basin (Bakken formation) in North Dakota, other U.S. oil fields, and Western
Canada, and the lack of pipeline infrastructure to move that crude from Cushing to U.S. Gulf
Coast refining centers. Numerous petroleum transportation projects to address these
infrastructure constraints were announced or underway in 2013 (see Section 3.3.1 of this
report). These projects have narrowed the WTI discount to Brent; in 2013, WTI’s discount to
Brent averaged $10.57/bbl, down from $18/bbl in 2012. In September 2013, the discount
narrowed to just $0.86/bbl before widening again.
The Henry Hub natural gas price averaged $3.73 per million British thermal units (MMBtu) in
2013—a 37 percent increase in price from the 2012 average ($2.75/MMBtu) as supply and
demand began to equalize amid booming North American production due to the increasing
exploitation of shale gas resources through fracking. Natural gas prices remained steady
throughout the year, reaching a low of $3.08/MMBtu in January and peaking in late December
at $4.52/MMBtu. The end of 2013 saw the onset of a colder-than-normal winter that drove the
Henry Hub price to $4.34/MMBtu for the last 2 weeks of the year.
DOE / 2013 Year in Review 4 2013 YIR
2. Energy Disruptions
This section provides a summary of disruptions reported in EAD in 2013. Energy disruptions
that occurred in 2013 are grouped into six categories: major events, electricity, natural gas,
petroleum, biofuels, and cybersecurity.
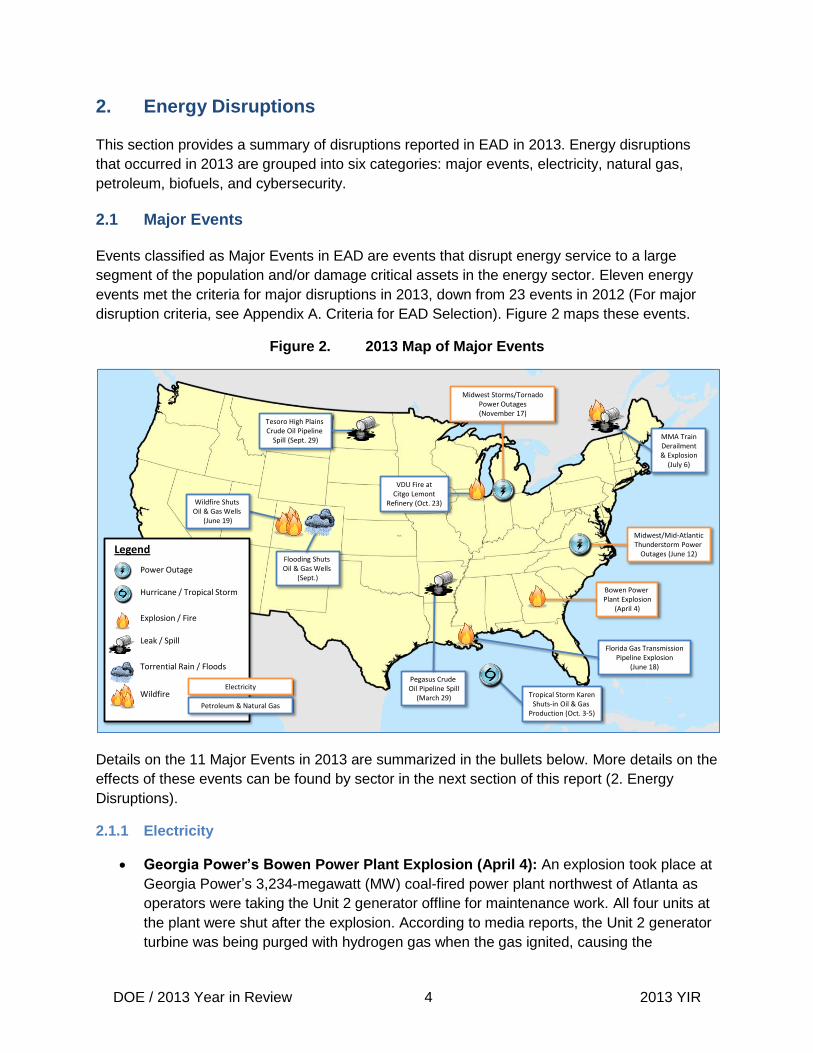
2.1 Major Events
Events classified as Major Events in EAD are events that disrupt energy service to a large
segment of the population and/or damage critical assets in the energy sector. Eleven energy
events met the criteria for major disruptions in 2013, down from 23 events in 2012 (For major
disruption criteria, see Appendix A. Criteria for EAD Selection). Figure 2 maps these events.
Figure 2. 2013 Map of Major Events
Details on the 11 Major Events in 2013 are summarized in the bullets below. More details on the
effects of these events can be found by sector in the next section of this report (2. Energy
Disruptions).
2.1.1 Electricity
Georgia Power’s Bowen Power Plant Explosion (April 4): An explosion took place at
Georgia Power’s 3,234-megawatt (MW) coal-fired power plant northwest of Atlanta as
operators were taking the Unit 2 generator offline for maintenance work. All four units at
the plant were shut after the explosion. According to media reports, the Unit 2 generator
turbine was being purged with hydrogen gas when the gas ignited, causing the
Midwest/Mid-AtlanticThunderstorm Power
Outages (June 12)
Bowen Power Plant Explosion
(April 4)
Midwest Storms/Tornado Power Outages(November 17)
Pegasus Crude Oil Pipeline Spill
(March 29)
Florida Gas TransmissionPipeline Explosion
(June 18)
Wildfire Shuts Oil & Gas Wells
(June 19)
Flooding Shuts Oil & Gas Wells
(Sept.)
MMA Train Derailment & Explosion
(July 6)
Tesoro High Plains Crude Oil Pipeline
Spill (Sept. 29)
Tropical Storm KarenShuts-in Oil & Gas
Production (Oct. 3-5)
VDU Fire atCitgo Lemont
Refinery (Oct. 23)
Power Outage
Hurricane / Tropical Storm
Explosion / Fire
Leak / Spill
Torrential Rain / Floods
Wildfire
Legend
Electricity
Petroleum & Natural Gas

DOE / 2013 Year in Review 5 2013 YIR
explosion. The blast tore a hole in the powerhouse wall behind units 1, 2, and 3. The
incident caused four minor injuries, but there were no interruptions in service to
customers and no damage to the surrounding communities.
Midwest/Mid-Atlantic Thunderstorm Power Outages (June 12): Powerful
thunderstorms affected multiple utilities in the Midwest and Mid-Atlantic regions, tearing
down power lines and knocking out power to more than 1.2 million customers. North
Carolina and Virginia reported the highest numbers of outages from the storm.
Storms and Tornadoes Cause Power Outages in the Midwest (November 17–22):
Beginning November 17, powerful storms moved across the Midwest, knocking out
power to 1.2 million customers and killing eight people. Damaging winds were reported
across Missouri, Indiana, Michigan, Wisconsin, and Illinois. Record 190 mph winds were
recorded in Illinois, producing severe Enhanced Fujita scale 4 (EF-4) damage
throughout the State. Michigan reported the highest numbers of outages from the storm.
2.1.2 Petroleum and Natural Gas
ExxonMobil Pegasus Crude Oil Pipeline Spill in Arkansas (March 29): ExxonMobil’s
96,000-barrel per day (b/d) Pegasus Crude Oil Pipeline was shut down on March 29
after a pipeline rupture spilled 5,000 barrels of oil near Mayflower, Arkansas. Oil spilled
onto local roadways and streets and flowed into local storm drains leading to a nearby
fishing lake; 22 homes were evacuated as a result. The 20-inch pipeline runs from
Patoka, Illinois, to Nederland, Texas. As a result of the spill, ExxonMobil was fined
$2.6 million by Federal regulators and had yet to resume pipeline shipments as of the
end of 2013.
Explosion Shuts Section of Florida Gas Transmission Pipeline in Louisiana (June
18): An explosion and subsequent fire broke out on the Florida Gas Transmission (FGT)
pipeline near Washington Parish, Louisiana, forcing operators to shut a section of the
pipeline and reroute natural gas to customers along other parts of the FGT system,
which transports gas from Texas to south Florida. The outage forced FGT to reduce
flows on the system to 1.1 billion cubic feet per day (Bcf/d) from 1.25 Bcf/d during normal
operations.
Wildfire Shuts Colorado Oil and Gas Wells (June 19): Beginning June 19, a wildfire
broke out in the Wild Rose-Texas Mountain region of Colorado. Encana Corp. shut-in
more than 500 oil and natural gas wells as a result of the fire, or roughly 12.2 million
cubic feet per day (MMcf/d) of production. The 60-MMcf/d Dragon Trail gas processing
plant was also shut down and evacuated. On June 24, operations were restored to the
production wells and the Dragon Tail processing plant.
Montreal, Maine, and Atlantic (MMA) Crude Oil Train Derailment and Explosion in
Quebec (July 6): An MMA tanker train carrying 50,000 barrels of Bakken shale oil
derailed in Lac-Mégantic, Quebec, killing 47 people and destroying 30 buildings. The
accident resulted in a spill of about 37,600 barrels of oil. The train was carrying crude to
the 300,000-b/d Saint John Refinery in New Brunswick. Following the incident, MMA
declared that they would no longer transport oil tankers on their entire rail system. This
accident paved the way for U.S. and Canadian regulators to seek greater oversight of
crude-by-rail shipments.

DOE / 2013 Year in Review 6 2013 YIR
Flooding Shuts Oil and Gas Operations in Colorado (September): Beginning
September 9, a week of torrential downpours caused flooding in northeast Colorado,
greatly disrupting oil and natural gas operations in the region. The flooding forced
companies to shut-in thousands of oil and gas wells, shut down numerous oil and gas
gathering and transmission pipelines that had become exposed when the ground above
them eroded, and caused tanks at production sites to shift and spill crude oil into nearby
waterways. According to the Colorado Oil and Gas Conservation Commission
(COGCC), the flooding led to 14 notable spills that released 48,250 gallons of crude oil
or condensate. A total of 2,608 wells were shut-in in anticipation of flooding, and of those
shut-in wells, 2,022 (78 percent) had returned to production by November 26.
Tesoro High Plains Pipeline Crude Oil Spill in North Dakota (September 29):
Tesoro Logistics reported that 20,600 barrels of crude oil had leaked into the soil from its
80,000-b/d High Plains Pipeline system near Tioga, North Dakota. The 6-inch pipeline
carries crude produced in the Bakken shale play to the Stampede rail facility near
Columbus, North Dakota. Pipeline corrosion was blamed for the leak and vacuum trucks
were used to clean up the affected area. On November 1, Tesoro restored normal
operations to the pipeline after spending $4.9 million for clean-up operations.
Tropical Storm Karen Disrupts Oil and Gas Production in the Gulf of Mexico
(October 3–5): Beginning October 3, Tropical Storm Karen began threatening offshore
oil and gas production in the U.S. Gulf of Mexico, as well as onshore energy assets
along the Gulf Coast. Companies operating in the Gulf of Mexico shut-in offshore
production and evacuated non-essential personnel in the storm’s path as a precaution.
The Bureau of Safety and Environmental Enforcement reported that on the peak day
(October 5), 1,830 MMcf/d of gas production was shut-in, or 48.18 percent of the total
Gulf of Mexico gas production; 866,807 b/d of oil production was shut-in, or 61.91
percent of the total oil production. Two refineries – Motiva’s 233,500-b/d Norco,
Louisiana, refinery and Shell’s 80,000-b/d Mobile, Alabama, refinery – reduced their
output by unspecified amounts for 3 days due to Tropical Storm Karen. On October 5,
the National Hurricane Center downgraded the storm to a tropical depression.
Vacuum Distillation Unit (VDU) Fire Shuts CITGO’s Lemont, Illinois, Refinery
(October 23): CITGO shut down its 174,500-b/d refinery in Lemont, Illinois, after a fire
broke out in the VDU – a secondary processing unit that helps produce petroleum
products out of the heavier oils left over from atmospheric distillation. On November 12,
CITGO partially restored production at the refinery, but was still working on repairing the
damaged VDU. Through the end of 2013, the refinery continued to run at reduced rates
using lighter, sweeter crude. An attempt was made to restart the VDU in early
December, but it failed; as of the end of 2013, the VDU had still not been fully repaired.

DOE / 2013 Year in Review 7 2013 YIR
2.3 Electricity Disruptions
Electricity disruptions are discussed from two perspectives: customer outages and power plant
outages.
2.3.1 Customer Outages
2.3.1.1 Large-Scale Outage Events
Figure 3 shows the large-scale electricity outage events that occurred in the United States in
2013. There were 12 outage events that knocked out power to at least 250,000 customers. All
12 of these events were weather related. Two notable outage events that affected more than
1 million customers and covered a wide swath of the United States are marked in red; the
powerful storms and deadly Midwest tornadoes in November and the Midwest/Mid-Atlantic
thunderstorms in June. The number of large-scale outage events (affecting at least 250,000
customers) is down from 16 in 2012. Three outage events affected more than 1 million
customers in 2012.
Figure 3. Large-Scale U.S. Electric Customer Outage Events, 2013
The two events in 2013 that affected more than 1 million customers were as follows:
The June Midwest/Mid-Atlantic storms cut power to more than 1.2 million customers
at its peak. On June 12, thunderstorms moved swiftly across the Midwest to hit States
further east in the Mid-Atlantic. North Carolina and Virginia reported the highest numbers
of outages from the storm.
The November Midwest storms and tornadoes, which also affected 1.2 million
customers, produced deadly and damaging winds across Missouri, Indiana, Michigan,
Wisconsin, and Illinois. The winds recorded in Illinois were 190 mph, producing severe
Enhanced Fujita Scale 4 damage throughout the State. The storm also left eight people
dead. Michigan reported the highest number of outages from the storm.
Midwest/Mid-
Atlantic Storms

DOE / 2013 Year in Review 8 2013 YIR
Seasonally, 5 of the 12 large-scale outage events in the United States in 2013 were in the
summer months of June through August. These summer storms averaged more than 600,000
peak outages per incident. Snow and ice were responsible for 3 of the 12 major outage events.
These events averaged nearly 550,000 peak outages per incident.
Large-scale power outage events were concentrated in the Midwest and Northeast in 2013.
Figure 4 shows the States that were affected most by the 12 large-scale outage events. New
York and Michigan were each affected by five events in 2013. In 2012, by comparison,
Connecticut and New Jersey were affected by the most events with six each. In 2013, however,
these two States were each affected by only two large-scale events.
Figure 4. Number of Major Outage Events by U.S. State, 2013
EAD also reported six large-scale outage events in Canada that affected more than 250,000
customers in 2013. Only one event in Canada, the late December snow and ice storm, cut off
power to 1 million customers. This storm also affected about 720,000 customers in the United
States (see Figure 3).
2.3.1.2 All Outage Events
In addition to large-scale outages events, EAD reports other outage events affecting 10,000 or
more customers. Including both large-scale events and all other reported events, 99 outage
events were recorded in EAD in 2013 (see Figure 5). 63 percent of these events were weather
related, down about 12 percentage points from 2012, when 75 percent of outage events were
weather related.

DOE / 2013 Year in Review 9 2013 YIR
The graph on the right in Figure 5 breaks down the number of large-, medium-, and small-scale
customer outage events by event cause. All 12 of the large-scale events were weather related,
whereas only 50 percent of the small-scale events were caused by weather. In 2013, other
(non-weather) causes for small-scale events included accidents/human error and natural
events, such as squirrels or other small animals accidentally shorting or causing damage to
electrical equipment at substations. Accidents or human error were responsible for nearly the
same number of outage events in 2013 as they were in 2012; 22 outage events were caused by
accidents or human error in 2013, compared to 21 in 2012.
Figure 5. U.S. Electric Customer Outage Events by Cause and Magnitude, 2013
Note: Large = ≥ 250,000 customers; Medium = 50,000–249,999 customers; Small = 10,000–49,000 customers
2.3.2 Power Plant Outages
Data on power plant outages are less comprehensive than data on customer outages. While
significant customer outages are almost always widely reported by utilities and the media,
power plant outages do not often receive the same level of attention. However, several sources
provide significant reporting on power plant outages for specific plant types and regions. The
NRC reports the power production status of all commercial nuclear power plants in the United
States on a daily basis. Similarly, the California Independent System Operator (CAISO) reports
daily on scheduled and unscheduled outages and curtailments at power plants of all types in
parts of California where it manages the grid. The Texas Commission on Environmental Quality
(TCEQ) reports emission events in Texas that often occur when coal- or natural gas-fired power
plants shut down or start up. For information regarding non-nuclear power plant outages in other
States, EAD relies on publicly available industry newsletters, company announcements, and
local media sources. As a result, EAD’s coverage of non-nuclear power plant outages varies
substantially among the States and regions, and among the companies that own these assets.
In 2013, EAD reported 249 outages at U.S. power plants caused by unplanned (or forced)
causes or by causes that were not reported. Figure 6 presents these outages by season.
0
5
10
15
20
25
30
35
Q1 Q2 Q3 Q4
Nu
mb
er o
f O
uta
ge E
ven
ts
Weather Accident/Human Error Natural Events Other/Unknown
12
23
28
5
17
1
1
111
0%
10%
20%
30%
40%
50%
60%
70%
80%
90%
100%
Large Medium Small
Pe
rce
nta
ge o
f O
uta
ge E
ven
ts
Data labels indicate number of outages

DOE / 2013 Year in Review 10 2013 YIR
Outage data for coal- and natural gas-fired plants represent only power plants located in
California and Texas, which are reported by CAISO and TCEQ, respectively. Other States do
not have comparable public reporting mechanisms.
Unplanned outages for nuclear units were relatively flat across the seasons because these
plants are typically base load suppliers that provide power at a constant operating rate at all
times of the year to meet the minimum demands of customers. Data on non-nuclear power plant
outages is not comprehensive enough to draw conclusions.
Figure 6. Unplanned and Unknown Power Plant Outages, 2013
2.3.3 Physical Attacks and Sabotage
In 2013, electric companies faced a number of attacks on their assets. In 2013, the most
notable attack on an electric company occurred on April 16 when PG&E reported heavy
damage to its 500 kV Metcalf transmission substation in San Jose, California following gunshots
from an apparent vandalism. The attack knocked out 17 giant transformers transmitting power
to Silicon Valley, while workers and fire crews cleaned up hazardous materials from the
location. Power was rerouted, but CAISO issued a Flex Alert, asking residents and businesses
in the San Jose area to conserve electricity. No arrests were made during the investigation. The
attack underlined the need to heighten the grid’s physical security, and would prompt FERC, the
Department of Defense, and electric companies to take a closer look at security measures at
critical assets throughout the country.
In September and October, a series of attacks on substations and power lines occurred in
Arkansas:
August 21: Entergy Corp. officials reported a downed 500 kV transmission line near
Cabot, Arkansas, that was intentionally cut. It was believed that the person responsible

DOE / 2013 Year in Review 11 2013 YIR
climbed the 100-foot tower, severed the line, and removed several bolts at the base of
the tower. No injuries resulted from this incident and no power outages were reported
September 29: A switching station in Scott, Arkansas, was intentionally set on fire. A
message was written at the entrance that said, “You should have expected U.S.”
October 6: More than 10,000 First Electric Cooperative customers were without power
following an attack targeting power lines linking a high-voltage transmission line with a
substation in Jacksonville, Arkansas. According to the FBI, the person or persons
responsible drove a tractor through a locked cattle gate, and then used the tractor to pull
down a utility pole, causing the downing of a 115 kV transmission line. The tractor used
in the incident is used by utilities for vegetation management.
October 15: The FBI and the Joint Terrorism Task Force arrested a 37-year old man in
connection with the attacks. The suspect was charged with destruction of an energy
facility.
2.4 Natural Gas Disruptions
In 2013, EAD reported numerous disruptions to natural gas assets, including both upstream and
downstream assets. Most of these outages were caused by equipment failure or power failure,
or were weather related.
2.4.1 Upstream
Three events had significant impacts on upstream natural gas assets in 2013, including wells
and platforms, flow lines and gathering lines, and processing plants. These disruptions were all
caused by natural disasters: the Wild Rose-Texas Mountain Wildfire in Colorado in June,
torrential flooding in Colorado in September, and Tropical Storm Karen in the Gulf of Mexico in
October.
Wild Rose-Texas Mountain Wildfire in Colorado (June 19–24): Encana Corp. was
forced to shut-in more than 500 oil and natural gas wells due to the Wild Rose-Texas
Mountain wildfire that began on June 19, curtailing production of 12.2 MMcf/d. In
addition, the Dragon Trail gas processing plant, which processes 60 MMcf/d, had to be
shut down and evacuated. Operations were restored at both the well heads and the
processing plant on June 24.
Colorado Floods (September): Beginning September 9, a week of torrential
downpours caused flooding throughout Colorado and greatly disrupted oil and natural
gas operations in the region. The flooding forced companies to shut-in thousands of oil
and gas wells in the region, shut down numerous oil and gas gathering and transmission
pipelines that had become exposed when the ground above them eroded, and caused
tanks at production sites to shift and spill crude oil into nearby waterways.
Tropical Storm Karen (October 3–5): Tropical Storm Karen began moving into the Gulf
of Mexico on October 3 with the potential to turn into a Category 1 hurricane. Oil and gas
companies operating production facilities offshore in the Gulf of Mexico took
precautionary measures, including shutting-in production and removing non-essential
personnel at facilities in the projected storm path. At its peak, the Bureau of Safety and
DOE / 2013 Year in Review 12 2013 YIR
Environmental Enforcement (BSEE) reported that shut-in natural gas production reached
1,830 MMcf/d, or 48.18 percent of the total U.S. Federal Offshore Gulf of Mexico gas
production.
2.4.2 Midstream and Downstream
In 2013, several events had significant effects on the midstream and downstream natural gas
sector, including natural gas storage sites and transmission, distribution, and service pipelines.
Fire Shuts Ryckman Creek Storage Facility in Wyoming (April 20): A fire shut down
Peregrine Midstream Partners’ Ryckman Creek natural gas storage facility near
Evanston, Wyoming, after a pressure valve malfunctioned and exploded. The facility,
which had a total storage capacity of 18 Bcf at the time of the incident, is connected to
five interstate natural gas pipelines and the Opal Hub. The facility restored partial
operations 10 days after the fire following repairs.
Tornado Damages Southern Star Pipeline in Oklahoma (May 20): Southern Star
Central Gas Pipeline, Inc. declared force majeure3 on the Line 340 segment of its
interstate natural gas pipeline near Cement, Oklahoma, after a devastating tornado
caused the pipeline to break away from its braces on a bridge in the area. Southern Star
immediately isolated and depressurized the affected pipeline segment. The outage
halted receipts and deliveries to several points on the segment, including DCP
Midstream’s 38-MMcf/d Mustang gas processing plant.
Explosion on Florida Gas Transmission Pipeline in Louisiana (June 18): An
explosion and subsequent fire broke out on the Florida Gas Transmission (FGT) pipeline
near Washington Parish, Louisiana, forcing operators to shut a section of the pipeline
and reroute natural gas to customers along other parts of the FGT system, which
transports gas from Texas to south Florida. The outage forced FGT to reduce flows on
the system to 1.1 Bcf/d from 1.25 Bcf/d during normal operations.
Electrical Failure Shuts Ruby Pipeline Compressor Station in Wyoming (November
18): Kinder Morgan declared force majeure on its 1.5-Bcf/d Ruby Pipeline in Wyoming
due to a mechanical failure at the Robinson Creek compressor station. Crews were
performing maintenance on one unit at the station when the other experienced an
electrical failure. Capacity on the pipeline, which delivers gas from the Rocky Mountain
basin to consumers on the West Coast, was reduced by about 795 MMcf/d for 2 days as
a result of the outage.
Colorado Floods (September): Extensive flooding in Colorado affected several natural
gas transmission and distribution assets in Colorado, including El Paso Pipeline
Partners’ 456-MMcf/d Line 252A pipeline, which was shut for 13 days, and the Young
Gas Storage facility, which was shut for 11 days when a lateral pipeline was exposed
during the flooding. In addition, flooding forced Xcel Energy to shut off natural gas
distribution service to 3,800 customers in Boulder County, Colorado.
3 Force majeure is a clause in contracts that removes liability for natural and unavoidable catastrophes
that restrict participants from fulfilling contractual obligations.

DOE / 2013 Year in Review 13 2013 YIR
2.5 Petroleum Disruptions
In 2013, multiple events significantly disrupted the petroleum supply chain, including assets
related to production, transportation, and refining. This section highlights significant disruptions
that affected the United States over the course of the year. While most of these events took
place within the United States, some took place in Canada at assets that affect U.S. petroleum
supply. Other international disruptions that affect global energy markets, but do not directly
affect supply to the United States, are covered in Section 4.1. This section also identifies
instances where State governments issued hours-of-service waivers to fuel truck driversto
expedite the movement of fuel during periods of tight supply.
2.5.1 Production
There were no major hurricanes during the 2013 season; however, four events had significant
effects on the upstream petroleum sector.
Shell Abandons Beaufort Sea Drilling Plans (January): Shell’s Kulluk drilling unit
broke free of its tug and was driven aground on Sitkalidak Island in the Gulf of Alaska
during violent weather, forcing the company to abandon plans to drill in the Beaufort Sea
in 2013. The incident, which was reported in early January, caused severe damage to
the ship’s hull and seawater damaged the ship’s electrical systems. In October, Shell
reported that the damage to the rig was too expensive to repair and they would have to
acquire another rig before continuing their drilling efforts. Shell’s Noble Discoverer, an
artic drilling ship, similarly had problems with its propulsion system in February. Although
the company has spent more than $5 billion in its efforts to explore drilling off the coast
of Alaska, the company has yet to make much progress.
Pipeline Outage Shuts Oil Production From BP’s Thunder Horse Platform in the
Gulf of Mexico (July 21–27): BP declared force majeure on the Destin gas pipeline on
July 21, which lasted until July 27, due to high levels of liquid in the pipeline’s offshore
segment. The pipeline feeds Destin’s natural gas processing plant in Pascagoula,
Mississippi, from BP’s Thunder Horse platform in the Mexican Gulf of Mexico. Because
associated gas production could not be transported from the Thunder Horse platform,
BP had to shut both oil and gas production from the platform. The outage shut-in
250,000 b/d of oil production and 200 MMcf/d of natural gas production at Thunder
Horse.
Colorado Floods (September): Torrential rains and heavy flooding in Colorado in mid-
September disrupted oil production in the Denver-Julesburg Basin. According to the
Colorado Oil and Gas Conservation Commission (COGCC), a total of 2,608 wells were
shut-in in anticipation of flooding in September and, of those shut-in wells, 2,022 (78
percent) had returned to production by November 26. In addition, COGCC reported that
the flooding led to 14 notable spills that released 48,250 gallons of crude oil or
condensate.
Tropical Storm Karen (October 5–8): Tropical Storm Karen shut-in offshore oil
production in the Gulf of Mexico for several days in early October. At the peak of the
outages, on October 5, nearly 886,000 b/d were shut-in, equal to 62 percent of the total

DOE / 2013 Year in Review 14 2013 YIR
oil production in the Gulf of Mexico. The tropical storm forced operators to remove about
one-third of all oil and gas workers from 271 platforms and 20 drilling rigs operating in
the Gulf of Mexico.
2.5.2 Refineries
In 2013, weather events and technical failures caused the majority of the notable disruptions at
refineries.
Leak Again Shuts New CDU at Motiva’s Port Arthur, Texas, Refinery (January 6):
Motiva was forced to shut down its new 325,000-b/d crude distillation unit (CDU) after a
leak was discovered on January 6. The company had been trying to restart the unit after
a fire had caused corrosion damage to the new unit in May 2012. The leak released
sulfuric acid, and after several patching attempts, Motiva was forced to replace the
affected pipe. The CDU began operating at 75 percent capacity on January 21, before
resuming full-capacity operations 4 weeks later.
Fire in Vacuum Distillation Unit Shuts CITGO’s Lemont, Illinois, Refinery (October
23): CITGO’s 174,500-b/d refinery in Lemont, Illinois, was shut down for 3 weeks after a
fire broke out in the vacuum distillation section of the CDU on October 23. CITGO was
able to partially restart the facility on November 12, but was still working on repairing the
damaged vacuum distillation unit (VDU). As a result of the VDU outage, the refinery
operated with a lower fuel output and had to run lighter, sweeter crude until the unit was
repaired. CITGO attempted to restart the VDU in early December, but as of the end of
2013, the VDU had still not been fully repaired.
Tropical Storm Karen (October 5–8): Motiva’s 233,500-b/d Norco, Louisiana, refinery
and Shell’s 80,000-b/d Mobile, Alabama. refinery reduced their output by unspecified
amounts for 3 days due to Tropical Storm Karen.
Figure 7 presents refinery disruptions reported in EAD by cause.4 There were 501 disruptions
reported in 2013. Equipment failures continue to cause the majority of the refinery disruptions,
as was the case in 2012. Fires, explosions, and smoke were the second leading cause of
disruptions, followed closely by power failures. These events highlight the interdependency
between the petroleum and electric power sectors.
4 The cause is determined by the initial occurrence. For example, if a transfer line leak leads to a fire, this
would be classified as an “equipment failure” due to the initial cause (the line leak).

DOE / 2013 Year in Review 15 2013 YIR
Figure 7. U.S. Refinery Disruptions by Cause, 2013
2.5.3 Transportation and Storage
Crude oil and petroleum products are transported by pipeline, marine vessel, rail, and truck. In
2013, transportation outages mainly resulted from accidents, leaks, and equipment failures. The
following incidents were some of the most significant of 2013:
Pegasus Crude Oil Pipeline Leak (March 29): ExxonMobil’s 96,000-b/d Pegasus
crude oil pipeline was shut down on March 29 after a pipeline carrying Canadian
Wabasca heavy crude ruptured, spilling 210,000 gallons of oil near Mayflower,
Arkansas. The 20-inch pipeline was carrying the crude from Patoka, Illinois, to the
pipeline’s terminating point at Nederland, Texas. Oil from the pipeline was released onto
local roadways and streets, and flowed into local storm drains leading to a nearby
fishing lake, resulting in the evacuation of 22 homes. As a result of the spill, ExxonMobil
was fined $2.6 million by Federal regulators and had yet to resume pipeline shipments
as of the end of 2013.
Montreal, Maine, and Atlantic (MMA) Crude Oil Train Derailment and Explosion
(July 6): A runaway tanker train carrying 72 cars of crude oil derailed and exploded in
Lac-Mégantic, Quebec, on July 6, killing 47 people and destroying 30 buildings. The
train was carrying 50,000 barrels of Bakken shale oil and was destined for the 300,000-
b/d Saint John Refinery in New Brunswick. Following the incident, MMA declared that
they would no longer transport oil tankers on the entirety of their tracks. This accident
paved the way for U.S. and Canadian regulators to seek greater oversight of crude-by-
rail shipments.
Anadarko Crude Oil Storage Tanks Leak During Colorado Floods (September 18
and 20): Anadarko reported that approximately 18,750 gallons (446 barrels) of crude oil
had been released from storage tanks in Milliken, Colorado, and Platteville, Colorado, in
two separate incidents on September 18 and 20, respectively. The spills occurred when
severe flooding caused the tanks to shift on their foundations and release oil into nearby
waterways.
High Plains Pipeline Crude Oil Leak in North Dakota (September 29): On
September 29, Tesoro Logistics reported that 20,600 barrels of crude had leaked into

DOE / 2013 Year in Review 16 2013 YIR
the soil from their High Plains pipeline system near Tioga, North Dakota. The 6-inch
pipeline carries crude from the Bakken shale play to the Stampede rail facility near
Columbus, North Dakota. Tesoro blamed the leak on pipeline corrosion and used
vacuum trucks to clean up the affected area. The 80,000-b/d pipeline resumed normal
operations on November 1, following clean-up operations totaling $4.9 million.
2.5.4 Hours-of-Service Exemptions
Hours-of-service (HOS) regulations (49 CFR Part 395) restrict the amount of time drivers are
allowed to operate commercial vehicles and mandate time-off requirements between shifts to
ensure on-road safety. In emergency situations, such as extreme weather events, State
governments have the authority to issue exemptions to these regulations in order to maintain
the supply of critical fuels, such as propane, heating oil, gasoline, and diesel fuel. EAD tracks
HOS exemptions to identify events that have triggered States to enact emergency management
measures. Table 1 summarizes the HOS exemptions issued in 2013, which were issued to
alleviate supply shortages caused by extreme winter weather, infrastructure outages, and other
demand factors, such as an increase in demand for propane to fuel crop-drying equipment in
the Midwest due to a later and wetter-than-usual harvest season. The harvest season trigged
eight HOS exemptions in midwestern States in late October 2013.
Table 1. Hours-of-Service Exemptions, 2013
State Start Date End Date Days
Colorado 1/17/2013 2/28/2013 43
Connecticut 2/07/2013 2/13/2013 7
Delaware 1/19/2013 1/22/2013 4
1/25/2013 1/28/2013 4
Illinois
10/28/2013 11/03/2013 7
12/16/2013 12/22/2013 7
12/24/2013 12/30/2013 7
Indiana 11/01/2013 11/20/2013 20
Iowa 10/25/2013 11/14/2013 21
12/19/2013 1/02/2014 15
Maine 12/13/2013 1/18/2014 37
Maryland 11/25/2013 11/30/2013 6
Massachusetts 12/17/2013 12/23/2013 7
Michigan 1/25/2013 2/03/2013 10
12/20/2013 1/10/2014 22
Minnesota
10/23/2013 11/22/2013 31
5/23/2013 6/22/2013 31
12/09/2013 1/08/2014 31
Missouri 12/12/2013 12/18/2013 7
Montana 10/24/2013 11/14/2013 22
Nebraska 10/26/2013 11/30/2013 36
New Hampshire 1/25/2013 1/31/2013 7

DOE / 2013 Year in Review 17 2013 YIR
State Start Date End Date Days
12/18/2013 1/11/2014 25
New Jersey 2/11/2013 2/18/2013 8
12/23/2013 1/11/2014 20
New York 12/13/2013 1/11/2014 30
2/06/2013 2/20/2013 15
North Dakota 11/18/2013 12/06/2013 19
Oklahoma 12/05/2013 1/04/2014 31
South Dakota 10/23/2013 11/30/2013 39
12/13/2013 12/31/2013 19
Vermont 12/20/2013 1/03/2014 15
Wisconsin
1/24/2013 2/03/2013 11
10/25/2013 11/07/2013 14
12/24/2013 1/22/2014 30
Wyoming 12/06/2013 12/16/2013 11 Sources: The National Propane Gas Association (http://www.npga.org), the U.S. Department of Transportation Federal Motor Carrier Safety Administration (http://www.fmcsa.dot.gov), and State waiver information.
2.6 Biofuel Disruptions
EAD reported few significant disruptions affecting biofuel refineries and the supply chain in
2013. The two most significant biofuel disruptions reported in 2013 were:
Ethanol Train Derailment and Leak in Iowa (May 20): Three tanker cars from an 80-
car Canadian Pacific Railroad train carrying ethanol derailed into the Little Cedar River
near Charles City, Iowa, as a result of a rail line washout caused by heavy rains and
flooding. Approximately 50,000 gallons of ethanol leaked from two derailed tanker cars.
Ethanol Train Derailment and Leak in Florida (July 25): Three ethanol tanker cars
from a CSX Corp. train derailed at the Port of Tampa in Florida. Firefighters used foam
to prevent the ethanol from igniting.
The effects on the biofuels industry from the 2012 drought are covered in Section 3.4.2.
2.7 Cybersecurity
2.7.1 Attacks and Exercises
The number of publically reported cybersecurity breaches remained low in 2013. EAD reported
three significant cybersecurity news items in 2013:
DHS Indicates Increased Reports of Cyber Attacks (January): In January, the U.S.
Department of Homeland Security (DHS) Industrial Control Systems Cyber Emergency
Response Team (ICS-CERT) said that the number of cyber attacks reported to the
agency grew by 52 percent in 2012.
DHS Reports Malware at Two Power Plants (January): Also in January, ICS-CERT
reported that unspecified malware infected two power plants’ control systems after

DOE / 2013 Year in Review 18 2013 YIR
gaining access through unprotected USB drives. In the first case, ICS-CERT provided
onsite support at a power generation facility where malware had been discovered in the
control system after an employee routinely used a USB drive for backing up control
systems configurations within the control environment. In the second case, a virus in a
turbine control system affected approximately 10 computers in its control system
network.
NERC Hosts Cyber and Physical Security Exercise (November): In November, the
North American Electric Reliability Corporation (NERC) hosted a 2-day cyber and
physical security exercise, GridEx II, to enhance and improve cyber and physical
security resources and practices within the industry. More than 200 industry and
government organizations took part in a simulated cyber attack that left hundreds of
transmission lines and transformers damaged or destroyed. According to the simulation,
attackers used guns and bombs against a Southwestern Electric Power Company power
plant and transformer, causing 108,000 of the company’s 520,000 customers to lose
power. GridEx II built on lessons learned from the original GridEx in 2011, a much
smaller drill which found that participants were good at communicating with their
neighbors but not with national organizations like NERC.
2.7.2 Cybersecurity Policies
In 2013, the Federal Government announced a handful of initiatives launched to enhance
cybersecurity:
Cybersecurity Executive Order (February): In February, President Barack Obama
issued an executive order to institute policies that will enhance critical infrastructure
cybersecurity in response to “repeated cyber intrusions” that have demonstrated the
need for improvements. The order directs U.S. Government agencies to increase the
volume, timeliness, and quality of cyber threat information shared with U.S. private
sector entities so that these entities may better protect and defend themselves against
cyber threats. The order directed DHS to establish a consultative process to coordinate
improvements to the cybersecurity of critical infrastructure. The order also directed the
National Institute of Standards and Technology to lead the development of a framework
to reduce cyber risks to critical infrastructure, and DHS, in coordination with sector-
specific agencies, to establish a voluntary program to support the adoption of the
Cybersecurity Framework by owners and operators of critical infrastructure and any
other interested entities. In addition, the order directed DHS to identify critical
infrastructure where a cybersecurity incident could reasonably result in catastrophic
regional or national effects on public health or safety, economic security, or national
security. The full text of the Cyber Security Executive Order can be read here:
http://www.whitehouse.gov/the-press-office/2013/02/12/executive-order-improving-
critical-infrastructure-cybersecurity
DOE / 2013 Year in Review 19 2013 YIR
DOE Makes Awards Grants to Enhance the Cybersecurity of Energy Delivery
Control Systems (February)5: In February, DOE announced the availability of up to
$20 million for the development of tools and technologies to enhance the cybersecurity
of the Nation’s energy delivery control systems for electricity, oil, and natural gas. The
investments are intended to help protect energy delivery control system software and
firmware updates, improve the sustainability of critical energy delivery functions and
remote access to field devices while responding to a cyber intrusion, and detect
compromises within the supply chain and manipulation of power grid components. In
September, DOE announced that it had awarded approximately $30 million as part of
the initiative.
FERC Proposes Rule to Extend the Scope of Bulk Electric Systems Protected by
Cybersecurity Standards (April): In April, the Federal Energy Regulatory Commission
(FERC) announced plans to help strengthen the cybersecurity of the bulk electric system
with a proposed rule that would extend the scope of the systems that are protected by
cybersecurity standards. The proposal, submitted in January 2013 by NERC, constituted
version 5 of the Critical Infrastructure Protection (CIP) Reliability Standards.
DOE Announces an Initiative to Build a Tool to Assess the Cybersecurity
Capabilities of Oil and Gas Infrastructure (June): In June, Energy Secretary Ernest
Moniz announced a new public-private partnership to strengthen protection of the
Nation’s oil and natural gas infrastructure from cyber attacks. The initiative will create a
tool that allows owners and operators to assess their cybersecurity capabilities and
prioritize their actions and investments to improve cybersecurity. Furthermore, a draft
maturity model, called the Oil and Natural Gas Cybersecurity Capability Maturity Model
(ONG-C2M2), will be created and followed by a pilot program that will assess the
maturity model’s effectiveness and validate results. The model will then be updated and
released to the industry.6 In February 2014, DOE released the ONG-C2M2, an updated
version of the Energy Sector C2M2, and a sector-neutral version of the C2M2.7
5 “DOE Issues Funding Opportunity for Innovations to Increase Cybersecurity for Energy Delivery
Systems.” U.S. Department of Energy. February 11, 2013. http://energy.gov/oe/articles/doe-issues-funding-opportunity-innovations-increase-cybersecurity-energy-delivery 6 “Energy Department Launches Public-Private Initiative to Help Oil and Natural Gas Industry Strengthen
Its Cybersecurity Capabilities.” U.S. Department of Energy. June 27, 2013. http://energy.gov/articles/energy-department-launches-public-private-initiative-help-oil-and-natural-gas-industry 7 “Energy Department Broadens Public-Private Initiative to Help More Organizations Strengthen Their
Cybersecurity Capabilities.” U.S. Department of Energy. February 12, 2014. http://www.energy.gov/articles/energy-department-broadens-public-private-initiative-help-more-organizations-strengthen-0

DOE / 2013 Year in Review 20 2013 YIR
3. Infrastructure Changes
This section focuses on significant changes to energy infrastructure in 2013, including new
projects, expansions, closures, and sales. Infrastructure changes are typically driven by a
number of factors, including changing production centers, the age and condition of existing
infrastructure, underlying economic conditions, and regulatory requirements. As noted in
Section 1.2, EAD summarizes the day’s news on energy disruptions and energy infrastructure
using public sources, but it is not a comprehensive survey or database service. Despite this
limitation, infrastructure changes reported in EAD highlight important developments and trends
in U.S. energy markets.
3.1 Electricity
U.S. electric infrastructure underwent many changes in 2013 as operators planned to retire
power plants, often citing environmental regulations, and announced new generation capacity
and transmission expansions.
3.1.1 Environmental Regulations
In April, the U.S. Environmental Protection Agency (EPA) delayed finalizing the New Source
Performance Standard (NSPS) regulations for new power plants, which many analysts believed
would have effectively banned new coal-fired stations unless they use carbon-capture
technology. The NSPS, which was proposed in March 2012 under the Clean Air Act, would set
a limit of 1,000 pounds of carbon dioxide (CO2) emissions per megawatt hour (MWh). The
average U.S. natural gas-fired plant emits 800 to 850 pounds of CO2 per MWh; coal-fired plants
emit an average of 1,768 pounds of CO2 per MWh. The proposed rule would not apply to
existing power plants, including those making modifications to comply with other air pollution
rules. The rule would also exempt new plants that were permitted and under construction before
the rule is finalized. The EPA had initially set a deadline to finalize the rule by mid-April 2013.
3.1.2 Coal-Fired Power Plant Retirements
EAD reported that 33 coal-fired power plants, totaling 14.89 gigawatts (GW) of generating
capacity, either retired or were the subject of retirement announcements in 2013.8 These include
several power plants whose retirement was announced prior to 2013. The plants that were the
subject of retirement announcements in 2013 will be retired by 2020. Figure 8 shows the
retirement capacity by retirement year.
8 According to data drawn from U.S. Energy Information Administration Form EIA-860, 14.89 GW
represents about 5 percent of the total coal-fired generation in the United States, which was 310 GW in 2012 (EIA Electric Power Annual, http://www.eia.gov/electricity/annual).

DOE / 2013 Year in Review 21 2013 YIR
Figure 8. Coal-Fired Generation Capacity Retired or Announced to be Retired
Table 2 breaks down the geographic location of the coal-fired capacity subject to retirement
announcements. The Midwest had the most coal-fired capacity under threat of retirement, with
nearly 6 GW. The Northeast and Southeast came in second and third, respectively, with more
than 2 GW of coal capacity retired or proposed to be retired.
Table 2. Locations of Coal-Fired Generation Retirements
Row Labels Capacity (GW)
Mid-Atlantic 1.57
Midwest 5.88
New England 1.54
Northeast 2.08
Southeast 2.06
Southwest 1.59
West 0.17
Total 14.89
3.1.3 New Generating Capacity
EAD reported that 9.75 GW of new power plant capacity came online in 2013. The second
quarter of 2013, alone, saw more than 6 GW of capacity coming online. Figure 9 illustrates new
capacity coming online in 2013, broken down by quarter and fuel type. California added the
most capacity, with 4 GW of total new capacity, 3.5 GW of which were gas-fired plants. Other
notable States include Florida (1.7 GW), North Carolina (1.2 GW), and Texas (1 GW).

DOE / 2013 Year in Review 22 2013 YIR
Figure 9. New Power Plant Capacity in the United States, 2013
3.1.3.1 New Coal- and Natural Gas-Fired Plants
Of the 9.75 GW of new generation capacity that came online in 2013, 6.07 GW were fueled by
natural gas. Table 3 lists the new gas-fired power plants that were placed into service in 2013.
California led all States with 3.50 GW coming online in 2013. Only one coal-fired plant, LS
Power’s 925-MW Sandy Creek station in Texas, came online in 2013.
Table 3. New Natural Gas-Fired Power Plants, 2013
Plant Name Company State Capacity (MW)
CPV Sentinel Competitive Power Ventures, Inc. California 800 Marsh Landing NRG California 720 Russell City Calpine California 619 El Segundo NRG California 550 Walnut Creek Walnut Creek Energy California 500 Los Esteros Calpine California 309 Cape Canaveral Florida Power & Light (FPL) Florida 1,250 Sutton Duke Energy North Carolina 625 Dan River Duke Energy North Carolina 620 WA Parish NRG Texas 75
Total 6,068
3.1.3.2 Renewable Capacity Announcements
In January 2013, the Federal production tax credit (PTC) was extended for another year. The
notice stated that renewable generation capacity that began construction before 2014 would be
eligible to receive the tax credit. Table 4 breaks down the announced and under construction
renewable generation capacity in 2013 by renewable fuel type. Note that this list does not
include proposed capacity that was announced or began construction prior to 2013.

DOE / 2013 Year in Review 23 2013 YIR
Table 4. Proposed and Under Construction Renewable Energy Capacity, 2013
Renewable Type Capacity
(MW)
Biomass 180
Fuel Cell 15
Geothermal 70
Solar 3,151
Wind 7,347
Total 10,763
The extension of the PTC spurred new development in the solar and wind industries. About
70 percent of the proposed and under construction renewable builds consisted of wind plants;
solar accounted for the remaining development. Fuel cells, geothermal, and biomass
development was negligible in 2013.
3.1.4 Nuclear Power Plants
This section discusses some of the major changes to the nuclear power industry in 2013.
3.1.4.1 Nuclear Infrastructure and Uprates
Several major projects to build new nuclear power plants underwent schedule delays or
cancellations in 2013. They are discussed below:
License Denied to UniStar’s 1,600-MW Nuclear Unit at Constellation’s Calvert
Cliffs Nuclear Station: In March, the U.S. Nuclear Regulatory Commission (NRC)
upheld a previous denial by the NRC’s Atomic Safety and Licensing Board (ASLB) to
issue a license to French-owned UniStar Nuclear to build a new reactor at
Constellation’s Calvert Cliffs Generating Station in Maryland. The ASLB first denied the
request on August 30, 2012, citing the 1954 Atomic Energy Act, which prohibits the NRC
from issuing a reactor license to any company owned by a foreign corporation or
government. UniStar Nuclear is wholly owned by Électricité de France, which is itself 85
percent owned by the government of France. The company filed a petition to appeal the
ASLB’s decision in October 2012.
Delay of Exelon’s Proposed Rerate of Its 1,122-MW Peach Bottom Nuclear Station:
In March, Exelon Corp. applied to the NRC for permission to increase the output of the
Peach Bottom nuclear power plant in Pennsylvania by 12.4 percent, or roughly 139 MW.
After initially filing the application in September 2012, Exelon was required to submit
additional information, including a steam dryer analysis and an emergency core cooling
system analysis. According to the NRC, the review process for an uprate application can
take up to 18 months.
Approval of Duke Energy’s Proposed Output Increase at Its 2,200-MW McGuire
Nuclear Station: In May, the NRC approved a request by Duke Energy Carolinas to
increase the generating capacity of McGuire Nuclear Station Units 1 and 2 in North
Carolina by 1.7 percent each, a 37 MW increase. The NRC determined that Duke could
DOE / 2013 Year in Review 24 2013 YIR
safely increase the reactors’ power output primarily through more accurate means of
measuring feedwater flow. Duke intends to implement Unit 2’s increase during its spring
2014 refueling outage, and Unit 1’s increase during its fall 2014 outage.
3.1.4.2 Nuclear Retirements
The operators of three nuclear power plants in 2013 faced decisions on whether to retire certain
units.
Southern California Edison Retires San Onofre Station: In June, Southern California
Edison (SCE) announced that it will permanently retire Units 2 and 3 of its San Onofre
Nuclear Generating Station (SONGS) in California. Both SONGS units, whose combined
capacity is 2,150 MW, have been shut down since January 2012, when operators
detected premature tube wear in the steam generators of both units. The steam
generators, which were manufactured by Mitsubishi Heavy Industries, were installed in
Unit 2 in 2009 and in Unit 3 in 2010. In October 2012, SCE submitted a restart plan to
the NRC, proposing to restart Unit 2 at 70 percent power for an initial period of
approximately 5 months. Instead of continuing to incur the costs of maintaining SONGS
in a state of readiness to restart, in addition to the costs to replace the power that
SONGS previously provided, SCE concluded that efforts were better focused on
planning for the replacement generation and transmission resources that will be required
for grid reliability. The company is working with the California Independent System
Operator, the California Energy Commission, and the California Public Utilities
Commission in planning for Southern California’s energy needs. San Diego Gas &
Electric, which historically has received 20 percent of its power from SONGS, said that it
will continue working to meet its customers’ energy needs as reliably as possible.
Entergy Announces Plans to Retire Vermont Yankee Station: In August, Entergy
announced that it plans to close and decommission its 620-MW Vermont Yankee
Nuclear Power Station in Vernon, Vermont. The station is expected to cease power
production after its current fuel cycle and move to safe shutdown in the fourth quarter of
2014. The station will remain under the oversight of the NRC throughout the
decommissioning process.
Dominion Retires Kewaunee Station in Wisconsin: In May, Dominion permanently
shut down its 556-MW Kewaunee Power Station in Wisconsin, ending almost 40 years
of operation. Dominion announced in the fall of 2012 that it would close the station and
decommission it due to poor economics.
3.1.5 Transmission Expansion and Smart Grid Implementation
Table 5 lists the transmission projects that came online in 2013. There were five projects that
entered service in 2013. The most notable transmission development in 2013 consisted of the
completion of the remaining transmission projects associated with the Competitive Renewable
Energy Zones (CREZ) initiative in Texas. The CREZ initiative began in 2008 after an order by
the Public Utilities Commission of Texas commissioned seven transmission companies to
construct approximately 2,300 miles of 345-kV transmission lines. The goal of these projects
was to transport wind power from the developing West Texas to East Texas and south of the

DOE / 2013 Year in Review 25 2013 YIR
Dallas/Fort Worth area. In March, Lone Star Transmission, a subsidiary of NextEra Energy,
completed 330 miles of lines in Texas as part of a CREZ initiative. In December, Electric
Transmission Texas energized nearly 90 miles of lines, marking the completion of all CREZ
transmission projects.
Table 5. Transmission Line Projects Entering Service, 2013
Transmission Line Name In-Service Date Miles State
Lone Star Transmission 3/2013 330 Texas
Essar Steel 4/2013 28 Minnesota
Hudson River 6/2013 7.5 New Jersey/New York
Kendall-Schleicher 9/2013 140 Texas
Edith Clarke-Cottonwood 12/2013 88.4 Texas
EAD also reported more than 20 proposals for new transmission projects spanning more than
2,000 miles across the United States. These projects include small interconnections, lines
connecting new renewable generation, and large-scale regional projects. In addition to these
projects, numerous companies have begun to overhaul their aging and vulnerable transmission
infrastructure, some proposing billions of dollars in upgrades to their networks to improve
reliability and safety.
3.2 Natural Gas Projects
According to the U.S. Energy Information Administration, domestic dry natural gas production
increased to more than 66 Bcf/d in 2013, up 1 percent from 2012, the lowest annual growth rate
since 2005.9 Production increased in 2013 despite rig counts for gas-directed drilling reaching
new lows, as the practice of drilling multiple wells per pad has increased rig productivity
dramatically in recent years, allowing more production with fewer rigs. Exports to Mexico
continued to grow in 2013 as new pipelines were added to serve the growing power load across
the border. Low gas prices in 2013 continued to buttress the economic case for liquefied natural
gas (LNG) exports from the United States. Continued production growth, coupled with
increasing demand for natural gas in power generation throughout the country, continued to
support the need for additional transportation infrastructure and processing capabilities in 2013.
3.2.1 Natural Gas Processing Plants
In 2013, EAD included 17 reports of additional natural gas processing plant capacity either in
the form of new facilities or expansions to existing facilities. These projects were at various
stages of development. Figure 10 shows the capacity of these projects by State and project
status. As indicated, for 2013, proposed/planned, under construction, and entered service plants
totaled 3.9 Bcf/d in the United States. New capacity was primarily concentrated in areas with
9 U.S. Energy Information Administration, U.S. Dry Natural Gas Production,
http://www.eia.gov/dnav/ng/ng_prod_sum_dcu_NUS_m.htm (released 1/31/2014).

DOE / 2013 Year in Review 26 2013 YIR
active shale plays: Marcellus (West Virginia, Ohio, and Pennsylvania), Bakken (North Dakota),
and Eagle Ford (Texas).
Figure 10. Capacity of New Natural Gas Processing Plant Projects by State and Status
EAD reported six plants that entered service in 2013, totaling 810 MMcf/d of new capacity, with
110 MMcf/d in Colorado, 100 MMcf/d in North Dakota, 275 MMcf/d in Texas, and 200 MMcf/d in
West Virginia. EAD also reported 1.12 Bcf/d of natural gas processing capacity under
construction in 2013. The majority of these projects had planned in-service dates in early 2014
and were under construction in West Virginia and Ohio to process gas from the Marcellus shale
region. Almost 2 Bcf/d of new natural gas processing capacity was announced in 2013, with
expected in-service dates in 2014 and 2015.
3.2.2 Natural Gas Pipelines
EAD reported several pipeline projects that entered service in 2013 and collectively added more
than 1.5 Bcf/d of natural gas transportation capacity and additional natural gas liquid (NGL)
transportation capacity. Significant projects included:
ONEOK Partners’ Bakken Natural Gas Liquids Pipeline (April 9): The 60,000-b/d
Bakken NGL pipeline, owned by ONEOK Partners, carries unfractionated NGL from the
Bakken shale production area to the Overland Pass pipeline interconnection in northern
Colorado. The pipeline came into service on April 9.
Transcontinental Pipeline’s Mid-South Expansion (June 10): Williams Partners
placed into service on June 10 an expansion that provides an additional 225 MMcf/d of
transportation capacity for markets in the southeastern United States. In addition to the
23-mile expansion of the Transcontinental pipeline, there were upgrades to compressor

DOE / 2013 Year in Review 27 2013 YIR
facilities. The project provides service to power generators in Alabama and North
Carolina and a local distribution company in Georgia.
El Paso’s Norte Crossing Pipeline (June 18): El Paso Natural Gas started service on
its Norte Crossing pipeline on June 18. The pipeline flows 366 MMcf/d of natural gas
from Texas across the border to Mexico for use by the country’s power plants.
Spectra Energy’s New York–New Jersey Expansion (November 1): Texas Eastern
Gas Transmission and Algonquin Gas Transmission pipelines were expanded over a 20-
mile distance to provide an additional 800 MMcf/d of gas transportation capacity to the
New York and New Jersey markets. Spectra Energy conducted the expansion, which
was based in Jersey City, New Jersey, and began service on November 1.
Tennessee Gas Pipeline’s Northeast Supply Diversification (November 1): On
November 1, Tennessee Gas Pipeline placed into service its Northeast Supply
Diversification project that moves gas from the Marcellus region to markets in the New
England and Niagara areas through a 250-MMcf/d expansion of its 300-line system.
3.2.3 Liquefied Natural Gas Export Terminals
The boom in domestic natural gas production, primarily from shale formations, coupled with low
domestic natural gas prices in relation to the world market, has made the exporting of LNG from
the United States a viable option. As of December 31, 2013, EAD reported 12 proposed LNG
export projects in the contiguous United States (see Table 6). Eight of these projects involve the
installation of liquefaction trains and LNG carrier loading facilities at existing LNG import
terminals, which have been running at reduced rates due to ample domestic supplies. The other
four projects are greenfield projects that have been proposed at sites that do not have existing
LNG terminal facilities.
Facilities must apply to the Office of Fossil Energy, U.S. Department of Energy (DOE), for
approval to export LNG to non-Free Trade Agreement (non-FTA) countries. DOE is reviewing all
submitted applications and has approved five terminals for LNG exports to non-FTA countries
as of December 31, 2013.
Table 6 summarizes these 12 proposed export projects, including information on the proposed
site, export capacity, target in-service date, and status of DOE approval.
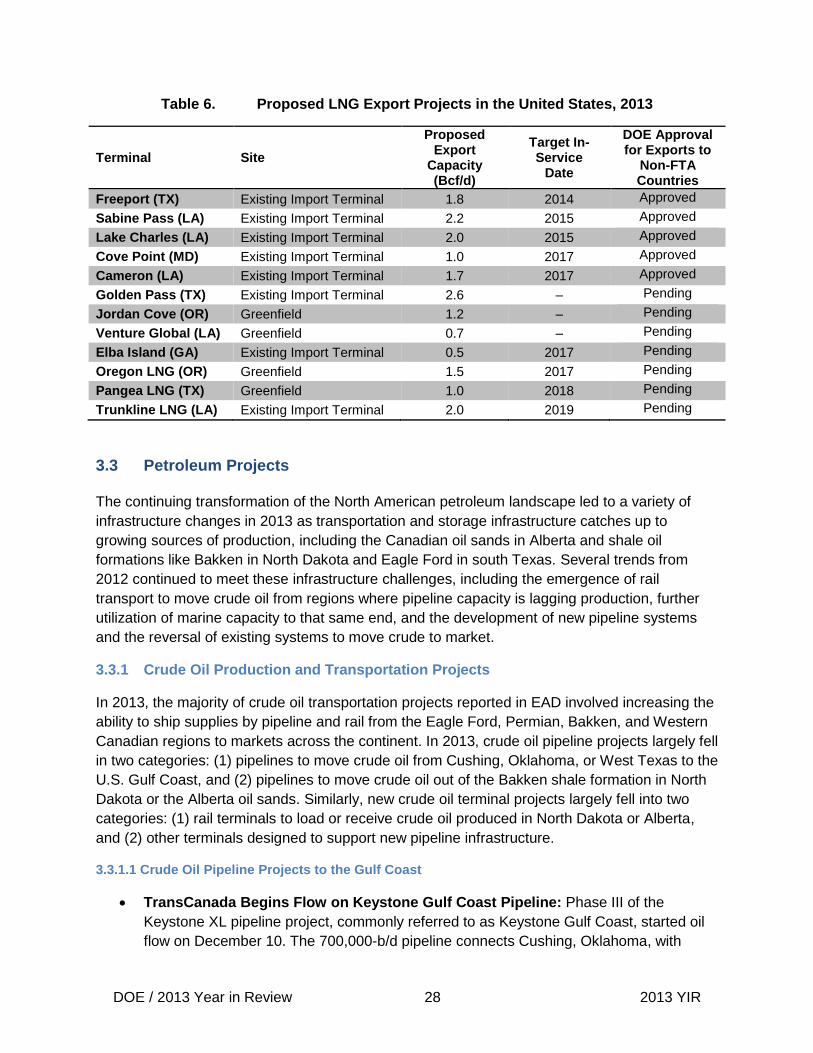
DOE / 2013 Year in Review 28 2013 YIR
Table 6. Proposed LNG Export Projects in the United States, 2013
Terminal Site
Proposed Export
Capacity (Bcf/d)
Target In-Service
Date
DOE Approval for Exports to
Non-FTA Countries
Freeport (TX) Existing Import Terminal 1.8 2014 Approved
Sabine Pass (LA) Existing Import Terminal 2.2 2015 Approved
Lake Charles (LA) Existing Import Terminal 2.0 2015 Approved
Cove Point (MD) Existing Import Terminal 1.0 2017 Approved
Cameron (LA) Existing Import Terminal 1.7 2017 Approved
Golden Pass (TX) Existing Import Terminal 2.6 – Pending
Jordan Cove (OR) Greenfield 1.2 – Pending
Venture Global (LA) Greenfield 0.7 – Pending
Elba Island (GA) Existing Import Terminal 0.5 2017 Pending
Oregon LNG (OR) Greenfield 1.5 2017 Pending
Pangea LNG (TX) Greenfield 1.0 2018 Pending
Trunkline LNG (LA) Existing Import Terminal 2.0 2019 Pending
3.3 Petroleum Projects
The continuing transformation of the North American petroleum landscape led to a variety of
infrastructure changes in 2013 as transportation and storage infrastructure catches up to
growing sources of production, including the Canadian oil sands in Alberta and shale oil
formations like Bakken in North Dakota and Eagle Ford in south Texas. Several trends from
2012 continued to meet these infrastructure challenges, including the emergence of rail
transport to move crude oil from regions where pipeline capacity is lagging production, further
utilization of marine capacity to that same end, and the development of new pipeline systems
and the reversal of existing systems to move crude to market.
3.3.1 Crude Oil Production and Transportation Projects
In 2013, the majority of crude oil transportation projects reported in EAD involved increasing the
ability to ship supplies by pipeline and rail from the Eagle Ford, Permian, Bakken, and Western
Canadian regions to markets across the continent. In 2013, crude oil pipeline projects largely fell
in two categories: (1) pipelines to move crude oil from Cushing, Oklahoma, or West Texas to the
U.S. Gulf Coast, and (2) pipelines to move crude oil out of the Bakken shale formation in North
Dakota or the Alberta oil sands. Similarly, new crude oil terminal projects largely fell into two
categories: (1) rail terminals to load or receive crude oil produced in North Dakota or Alberta,
and (2) other terminals designed to support new pipeline infrastructure.
3.3.1.1 Crude Oil Pipeline Projects to the Gulf Coast
TransCanada Begins Flow on Keystone Gulf Coast Pipeline: Phase III of the
Keystone XL pipeline project, commonly referred to as Keystone Gulf Coast, started oil
flow on December 10. The 700,000-b/d pipeline connects Cushing, Oklahoma, with

DOE / 2013 Year in Review 29 2013 YIR
Nederland, Texas, and Houston, Texas. The other major portion of the Keystone XL
project, the 830,000-b/d Keystone pipeline from Hardisty, Alberta, to Steele City,
Nebraska, continues to experience permitting delays. On April 26, the company pushed
back the estimated online date of the project to the second quarter of 2015.
Enterprise and Enbridge Expand Capacity on Seaway Pipeline: In 2012, Enterprise
and Enbridge reversed the Seaway pipeline to move crude from Cushing, Oklahoma, to
the Texas Gulf Coast due to a lack of southbound capacity. In January 2013, the joint
venture expanded the capacity from 150,000 b/d to 400,000 b/d to deliver greater
quantities of crude from the Bakken play, the Permian Basin, and Western Canada to
eight refineries in the Greater Houston area. Enterprise and Enbridge are also currently
constructing the 450,000-b/d Seaway Twin after completing a successful open season
on February 10. The developers expect the twin project, which will more than double the
current capacity of the Seaway system, to come online in the second quarter of 2014.
Shell Reverses Flow on Ho-Ho Pipeline: Shell completed the reversal of its Houston-
to-Houma pipeline on December 16, providing Gulf Coast refineries in Louisiana with
additional access to cheaper crudes. The project reversed flow on a 360,000-b/d
pipeline from Port Neches, Texas, to Houma, Louisiana, and an additional 500,000-b/d
pipeline connecting Houma to the Louisiana Offshore Oil Port (LOOP) Hub in Clovelly,
Louisiana. Shell plans on completing several supplemental projects in the first half of
2014, including a 300,000-b/d segment from Houma to Saint James, Louisiana, and
additional pumping stations to add incremental capacity at various points.
Sunoco Starts Flow on Permian Express Crude Pipeline: The first phase of Sunoco
Logistics Partners’ Permian Express crude pipeline came online in June 2013 with an
initial capacity of 90,000 b/d. The pipeline will carry crude from the Permian Basin in
West Texas to refineries on the Texas Gulf Coast. Sunoco Logistics is also developing a
second phase, the Permian Express 2, after completing a successful open season in
December. Developers expect the expansion to come online in the second quarter of
2014.
Magellan Midstream Partners Starts Flow on Reversed Longhorn Pipeline:
Magellan announced in 2011 that it would be reversing its Longhorn pipeline to bring
West Texas crude oil from El Paso to refiners in Houston. The move will redirect the
crude supply that had originally flowed to Cushing, Oklahoma, and will end the shipment
of refined fuels on the Longhorn pipeline from Houston to El Paso. The first shipment of
crude occurred on April 16, with an initial capacity of 75,000 b/d. By the middle of 2013,
Magellan had expanded the pipeline to 225,000 b/d and is considering future expansions
in the next few years.
Sunoco Proposes Eaglebine Express Pipeline Reversal: Sunoco has proposed a
reversal of its Eaglebine Express pipeline to move Permian crude from Hearn, Texas, to
Nederland, Texas. Sunoco held a successful open season in May, and is planning to
begin shipments at 60,000 b/d in the middle of 2014.
DOE / 2013 Year in Review 30 2013 YIR
3.3.1.2 Crude Oil Pipeline Projects Out of the Bakken Shale Play and the Alberta Oil Sands
Enbridge Places Expanded Bakken Pipeline Into Service: In March, the Bakken
Pipeline Expansion Project was placed into service at a capacity of 145,000 b/d. The
pipeline reversed and expanded an existing pipeline to transport crude oil from the
Bakken and Three Forks shale plays in North Dakota to Steelman, Saskatchewan. The
project also included a new 16-inch pipeline from Steelman to Enbridge Pipelines’
mainline terminal near Cromer, Manitoba. The company anticipates that the move will
allow them to better enable the production of the Bakken play in the coming years.
Enbridge Begins Construction on Woodland Pipeline Extension: Enbridge
announced that they would begin construction on a nearly 300-mile extension of the
Woodland pipeline on July 26. The extension will have an initial capacity of 400,000 b/d
with the ability to expand to 800,000 b/d, and will connect Enbridge’s Cheecham,
Alberta, terminal to its Edmonton, Alberta, terminal, and would connect the pipeline with
refineries and export pipelines in the area. The extension, which is being constructed to
serve growing oil sands production, is scheduled to come online in 2015.
Tallgrass Energy Begins Conversion of Pony Express Pipeline: Tallgrass Energy
began the process of converting the Pony Express pipeline to transport 230,000 to
320,000 b/d of light, sweet Bakken shale oil from Wyoming to Cushing, Oklahoma. The
pipeline was previously converted to a natural gas pipeline in 1996. The proposed
project will return 430 miles of 24-inch pipeline to oil service and add a 260-mile
extension from Lincoln County, Kansas, to Payne County, Oklahoma. Construction
began in the summer of 2013 and is expected to take about 12 to 14 months.
TransCanada Moves Forward With Energy East Pipeline: TransCanada is moving
forward with the Energy East pipeline, which will transport heavy crude from locations in
Alberta and Saskatchewan to delivery points near Montreal and Quebec City, Quebec,
and Saint John, New Brunswick. TransCanada held a successful open season for the
1.1 million-b/d pipeline from April to June, receiving commitments of nearly 900,000 b/d.
The project involves converting approximately 1,800 miles of natural gas pipeline to
crude oil service and constructing nearly 900 miles of additional pipeline. Energy East
will come online late in 2017 in Quebec and in 2018 in New Brunswick.
3.3.1.3 Crude Oil Rail Terminals
Enbridge Completes Berthold Rail Station in North Dakota: Enbridge completed the
Berthold Station rail facility in Berthold, North Dakota, on March 20 with a loading
capacity of 80,000 b/d. The company signed an agreement in late February with
Eddystone Rail Company to supply Bakken oil to the Philadelphia area to be further
distributed to East Coast refineries.
Eighty-Eight Oil (EEO) Announces Guernsey Rail Loading Station Project in
Wyoming: Situated near the 2 million-barrel Guernsey, Wyoming, pipeline hub, EEO
has announced a plan to build a unit train loading station on BNSF Railway’s mainline
with an initial capacity of 80,000 b/d.
Enserco Midstream Announces Douglas Rail Terminal Project in Wyoming:
Enserco Midstream, a subsidiary of Twin Eagle Resource Management, announced

DOE / 2013 Year in Review 31 2013 YIR
plans to build a new 60,000-b/d transloading terminal in Douglas, Wyoming. The facility,
which would be located in the Powder River Basin, will have crude storage and unit train
capability on the BNSF Railway mainline and will serve producers from the Niobrara
shale, Bakken shale, and Canada. The facility could be expanded to load up to 120,000
b/d if additional supply is necessary.
Kinder Morgan and KW Express Announce Greens Port Industrial Park Rail
Project in Houston, Texas: On February 21, Kinder Morgan and KW Express
announced a joint venture to build a 210,000-b/d rail project for crude oil at the Greens
Port Industrial Park on the Houston Ship Channel. The project will allow crude sourced
from the Bakken shale and Western Canada to be delivered by rail to the Houston Ship
Channel for distribution by barge and pipeline to various local refineries. The project will
be able to service three unit trains per day and will include 100,000 b/d of barge loading
capacity.
Tesoro Announces Port of Vancouver Rail-to-Barge Terminal Project: Tesoro
announced on August 5 that they plan to build a 120,000-b/d rail-to-barge terminal in
Vancouver, Washington. The project would supply West Coast refineries with cheaper
crudes from the Alberta oil sands and Bakken shale play. Tesoro will increase the
capacity up to 280,000 b/d in the future as necessary.
Indigo Resources Proposes Rail-to-Barge Terminal Project in Arkansas: Indigo
Resources proposed a new rail-to-barge terminal along the Mississippi River near
Osceola, Arkansas, in early April. The terminal will have 16 miles of track and will be
able to service up to 120-car unit trains. The proposal includes building 2 million barrels
of storage capacity, including 4 tanks of 250,000-barrel capacity and 10 tanks of
100,000-barrel capacity, to accommodate storage of several different types of Mid-
Continent crudes. The Indigo terminal will also provide blending services.
3.3.1.4 Other Crude Oil Terminals
Oiltanking Partners’ Appelt Terminal in Texas Comes Online, Announces
Expansion: Oiltanking Holding Americas announced an expansion at its Appelt facility
in Texas. The project will add 3.5 million barrels of storage in two phases (phases II and
III), in addition to the original 6.5 million barrels of storage capacity that came online at
Appelt in 2013. The company intends to take advantage of several pipeline projects with
the move, including Shell’s Ho-Ho pipeline reversal and TransCanada’s Gulf Coast
pipeline from Cushing, Oklahoma. The 390,000-barrel storage tank Appelt II will be in
service by the first quarter of 2015, with the 3.1 million-barrel Appelt III in service by the
first quarter of 2016.
Enterprise Crude Houston Oil (ECHO) Terminal Expansion: Enterprise announced
May 2 that it would add 4 million barrels of crude oil storage capacity at its ECHO and
Berton storage facilities and approximately 55 miles of pipeline to directly connect ECHO
to refineries in Southeast Texas with an aggregate capacity of 3.6 million b/d. The
project, which will bring ECHO’s total crude oil storage capacity to 6 million barrels, is
designed to add storage and distribution capabilities in the Gulf Coast market for
growing volumes of North American crude oil from the Eagle Ford, Permian,
DOE / 2013 Year in Review 32 2013 YIR
Midcontinent, Bakken, and Canada, which are displacing waterborne crude oil imports.
The project will be completed in phases, beginning in Q4 2014.
TransCanada Completes Cushing, Oklahoma, Crude Oil Storage Terminal:
TransCanada completed a 2.25 million-barrel storage facility in Cushing, Oklahoma, in
the fourth quarter of 2013 as part of the Keystone Gulf Coast project. The facility
consists of seven storage tanks and will support their Gulf Coast operations as they
begin in 2014.
3.3.2 Refining and Petroleum Product Transportation
EAD reported on various changes to refinery and petroleum product transportation infrastructure
in 2013, including changes to refineries, petroleum product pipelines, and petroleum product
terminals. Important changes are summarized in the sections below.
3.3.2.1 Refinery Sales and Closures
In 2013, Hess closed its Port Reading, New Jersey, refinery after failing to find a buyer, while
BP and Tesoro both closed on multiple refinery asset transactions.
Texas City, Texas, Refinery Sale (February 4): BP announced on February 4 that it
had sold its 451,000-b/d Texas City Refinery to Marathon. Under the agreement,
Marathon was also scheduled to receive control of a 1,040-MW onsite cogeneration
facility, four light product terminals located in the southeastern United States, and three
intrastate pipelines originating at the facility. Marathon has since renamed the facility
Galveston Bay Refinery, and plans to make several unspecified upgrades to the
refinery’s operations over the next several years.
Port Reading, New Jersey, Refinery Closure (February 26): Hess attempted to sell its
70,000-b/d Port Reading Refinery in New Jersey, which had incurred operating losses in
two of the preceding three years and was facing continuing challenges due to
environmental regulation. The Port Reading facility was Hess’s final refinery in the
United States, as the company had determined that refining would no longer be a core
part of their corporate strategy. However, Hess could not locate a potential buyer and, as
a result, Hess closed the facility on February 26.10
Carson, California, Refinery Sale (June 3): BP closed on the sale of its 265,000-b/d
Carson refinery in Southern California to Tesoro on June 3. The transaction was part of
a larger acquisition, which included all of BP’s Southern California refining and marketing
business, as well as 6.4 million barrels of storage capacity, six marketing and storage
terminal facilities, and 800 dealer-operated retail stations in addition to the refinery.
Tesoro plans to integrate the facility into their existing Southern California refining
operations.
Kapolei, Hawaii, Refinery Sale (September): Tesoro reached an agreement to sell its
94,000-b/d Kapolei refinery and its assets to a wholly owned subsidiary of Par Petroleum
10
The Hess Port Reading Refinery was unique in that it did not process crude oil, but rather had a fluid catalytic cracking unit as its main processing unit so it utilized gas oil feedstock (an intermediate product derived from crude oil) instead.

DOE / 2013 Year in Review 33 2013 YIR
Company (Hawaii Independent Energy) on June 18. The refinery had faced an uncertain
future after Tesoro had stopped operations on April 30 and reported that the facility
would be turned into an import, storage, and distribution terminal if a buyer was not
found. Following completion of the sale in September, Par Petroleum has continued to
operate the facility as a refinery. Kapolei produces gasoline, jet fuel, high-sulfur diesel,
and high- and low-sulfur fuel oil on Oahu for local use and distribution throughout the
State.
3.3.2.2 Refinery Expansion Projects
One major expansion project came online in 2013 as BP completed major work at its Whiting, Indiana, refinery, while several smaller refinery expansions were announced during the year.
BP Completes Whiting, Indiana, Refinery Expansion and Modernization Project: In
mid-December, BP commissioned the final new units at its Whiting, Indiana, refinery.
The facility had undergone a multi-year, $3.8 billion expansion and modernization
project, which will enable the refinery to process increased amounts of heavy, sour
Canadian crudes. Upgrades include a new 102,000-b/d delayed coker unit, a new gas-
oil hydrotreating unit, and a new sulfur recovery unit, among other infrastructure
changes. The changes have made the refinery capable of processing 85 percent heavy
crudes, an increase of 65 percent.
Western Refining Announces El Paso, Texas, Refinery Expansion Project: The
most significant announcement came from Western Refining, who announced their
intention to expand the 128,000-b/d El Paso refinery by 25,000 b/d in order to process
more crude from nearby shale formations. The company has yet to announce a timeline
for carrying out the expansion.
CHS Plans Expansion of McPherson, Kansas, Refinery: CHS is planning to expand
the McPherson, Kansas, refinery by 15,000 b/d to a total capacity of 100,000 b/d, in
order to better position the refinery to meet agricultural fuel demand in the Great Plains.
Northern Tier’s Saint Paul Minnesota Expansion Project: Northern Tier will expand
the Saint Paul, Minnesota, refinery to 82,000 b/d, an increase of 8,000 b/d, in order to
process additional Bakken crude. The company shut the refinery in April to complete the
1-month project by mid-May.
Marathon to Add Splitters at Its Ohio and Kentucky Refineries to Process
Condensate from Utica Shale: In February, Marathon announced the installation of
condensate splitters its 78,000 b/d Canton, Ohio, and 226,000 b/d Catlettsburg,
Kentucky, refineries. The splitters could double the 30,000 b/d of condensate currently
processed the two refineries.
3.3.2.3 New Refinery Projects
A new refinery has not come online in either the United States or Canada since 1986; however,
developments in shale oil in the Eagle Ford, Bakken, and Uinta regions are driving proposals
and construction of several new, relatively small refineries located close to production areas.

DOE / 2013 Year in Review 34 2013 YIR
MDU Resources and Calumet Refining Begin Construction of Dakota Prairie
Refinery: MDU Resources and Calumet Refining began construction on the Dakota
Prairie refinery in Stark County, North Dakota, on March 26. The project is expected to
take 20 months, which would make the project the first new refinery in the United States
since 1976 when it comes online late in 2014. The diesel refinery will have a capacity of
20,000 b/d.
Three Affiliated Tribes Begins Construction of Thunder Butte Refinery in North
Dakota: Three Affiliated Tribes broke ground in May on the 20,000-b/d Thunder Butte
refinery near Makoti, North Dakota. The project will produce naphtha, diesel, and
propane from Bakken shale oil when it comes online in the middle of 2016.
Emery Refining Begins Construction on Green River Petroleum Processing Plant
Project in Utah: Emery Refining announced plans for a 15,000- to 20,000-b/d refinery in
Emery County, Utah, on June 27. The $230 million refinery would be positioned to
process crude from the Uinta and Paradox basins in Utah and Colorado. The facility has
received environmental permits from the Utah Department of Environmental Quality and
broke ground on October 1.11
Worldwide Energy Consortium (WEC) Announces Whitetail Refinery in Texas:
WEC announced in May that they intend to build the 20,000-b/d Whitetail refinery in La
Salle County, Texas, to take advantage of increased oil production from the Eagle Ford
shale play. The project is currently in its engineering and permitting phase, which the
developers plan to wrap up in the last quarter of 2014.
Kinder Morgan Energy Partners Plans Expansion of Condensate Splitter Project
on Houston Ship Channel: In March, Kinder Morgan announced it had entered into a
long-term, fee-based agreement with BP North America to underwrite the addition of a
second 50,000 b/d splitter at its condensate splitter processing facility under construction
near its Galena Park terminal on the Houston Ship Channel. The new splitter will
increase the facility’s condensate splitter processing capacity to 100,000 b/d. In addition,
Kinder Morgan will also add 700,000 barrels of storage capacity at the facility, raising
total capacity to 1.9 million barrels. The first phase of the expansion will start up in 2014,
followed by the second phase in 2015.
3.3.2.4 Petroleum Product Pipelines and Terminals
Colonial Pipeline Announces Northeast Expansion Project: The Colonial Pipeline
delivers around 800,000 b/d of petroleum products from the U.S. Gulf Coast to
petroleum markets along the East Coast, terminating in the New York Harbor area. In
March, the Colonial Pipeline Company announced plans to expand the pipeline by up to
600,000 b/d due to growing customer demand in the Northeast. Potential upgrades
include expanding its Line 3 pipeline from Greensboro, North Carolina, to Linden, New
Jersey, by 100,000 b/d, and extending Line 4 from its current end in Central Maryland to
Southern New Jersey. Colonial will further refine its plans in 2014.
Colonial Pipeline Applies for Permits for Baton Rouge Tank Farm Expansion: On
July 12, Colonial applied for permits to add 2.5 million barrels of petroleum product
11
http://www.deq.utah.gov/businesses/emeryrefinery/index.htm

DOE / 2013 Year in Review 35 2013 YIR
storage at the company’s Baton Rouge terminal. The site will include light petroleum and
refined product storage of 2 million barrels, and 500,000 barrels of distillate capacity. In
addition, a 41,500-barrel butane sphere and truck unloading facility will be installed.
Operations will commence in April 2014.
Williams and Boardwalk Pipeline Partners Plan Moss Lake LPG Export Terminal in
Louisiana: Williams and Boardwalk Pipeline Partners announced plans in October to
develop a liquefied petroleum gas (LPG) export terminal on the Calcasieu River in Lake
Charles, Louisiana, and will service ships heading to Asia, Latin America, and Europe.
The terminal will include 900,000 barrels of storage for refrigerated propane and butane,
with a loading rate of 25,000 barrels per hour. The terminal is scheduled to come online
late in 2015.
3.4 Biofuels
The U.S. biofuels industry entered 2013 facing economic challenges due to high corn prices as
a result of the 2012 drought, although production was supported in the summer of 2013 due to a
surge in the value of Renewable Identification Numbers (RINs) for traditional ethanol and other
biofuel products. As a result of excess conventional corn ethanol capacity in the United States
and to comply with the U.S. Renewable Fuels Standard, the majority of new biofuel project
announcements in 2013 were for advanced or cellulosic ethanol facilities.
3.4.1 New Biofuel Plants
In 2013, EAD and the trade press reported the completion of the first commercial-scale
cellulosic ethanol plant in 2013, plans for seven new or converted biofuel production facilities,
and the expected completion of a cellulosic ethanol plant in early 2014. New projects were
primarily for the production of advanced ethanol, of which cellulosic ethanol is the most
common. Cellulosic ethanol is produced by processing a wide variety of waste biomass like
plant fiber, including stalks, grain straw, switchgrass, and municipal waste. Significant project
completions and plans included:
Dakota Spirit AgEnergy announced plans in February to build a 65-million gallon per
year (MMgal/year) corn ethanol facility in Jamestown, North Dakota, after receiving
approval from the EPA for its renewable fuels certification.
Canergy, LLC announced a partnership with Chemtex and Beta Renewables in April for
the development of a 25-MMgal/year cellulosic biofuels facility in Imperial Valley,
California. Construction will begin in 2014 and operation in 2016, pending permitting and
financing.
Advanced Biofuels USA announced plans in May to retrofit an existing 7-MMgal/year
ethanol facility in Moses Lake, Washington, to produce cellulosic ethanol from wheat
straw and waste alcohol.
Bio Plant Technologies, LLC and GHP Biodiesel USA, Inc. signed an agreement in
May to build a new 11.5-MMgal/year biodiesel plant in Boulder, Colorado.
Pleasant Valley Biofuels opened a new facility in Washington City, Utah, in June to
produce 1.5 MMgal/year of biodiesel.

DOE / 2013 Year in Review 36 2013 YIR
POET-DSM Advanced Biofuels, LLC announced in July that the facility is on target to
begin production of cellulosic ethanol from corn stover in Emmetsburg, Iowa, in early
2014. The facility will initially produce 20 MMgal/year of ethanol, but is expected to
increase capacity by an additional 5 MMgal/year.
INEOS Bio opened the Nation’s first commercial-scale cellulosic ethanol facility in Vero
Beach, Florida, in August. The project uses a combination of gasification and
fermentation to convert wood scraps, glass clippings, and other waste materials into
8 MMgal/year of cellulosic ethanol. The facility also generates 6 MW of green electricity.
Tri-State Biodiesel announced plans in November to acquire and expand biodiesel
operations at Bridgeport Biodiesel in Bridgeport, Connecticut. The expansion will
increase the size of the facility from approximately 3 MMgal/year to 10 MMgal/year.
Biochemtex and Beta Renewables announced plans in December to build a cellulosic
ethanol production facility in Sampson County, North Carolina. The Carolina Cellulosic
Biofuels plant is expected to be completed in 2016.
3.4.2 Plants in Transition
Economic and market conditions in 2013 led to a high degree of volatility in U.S. biofuels
production. At the beginning of 2013, a large number of existing plants were idled due to the
high cost of corn resulting from the 2012 drought. In January 2013, EAD reported that 4 corn
ethanol production facilities were idled, totaling 309 MMgal/year of production capacity.
However, operations were largely restored by the summer of 2013 due to a surge in the value of
RINs for traditional ethanol and other biofuel products. A full list of biofuel plants in transition can
be found in Appendix B. List of Biofuel Plants in Transition, 2013.
Due to the uncertain market environment, a number of advanced biofuel facilities had difficulty
acquiring capital for construction costs. A proposed 175-MMgal/year waste-to-ethanol plant in
Lake County, Indiana, was ultimately cancelled in April due to financing and feasibility concerns.
Xenex Biofuels scrapped plans for a 20-MMgal/year biodiesel facility near Dayton, Ohio, after
having difficulty acquiring capital to redevelop a brownfield site. In addition, several advanced
biofuel facilities with existing operations were forced to shutter operations due to difficult
economic conditions. Osage Bio Energy sold its existing advanced biofuels facility in Hopewell,
Virginia, to a company that later announced plans to decommission the plant and move the
equipment to the United Kingdom.
Other companies responded to the changing market environment by diversifying or altering
facility feedstock to take advantage of higher RIN values, secure premiums associated with the
California Low Carbon Fuel Standard, and mitigate risk from future droughts affecting the corn
and soybean supply. Several facilities announced feedstock changes, including:
Sweetwater Energy, Inc. announced an agreement with Ace Ethanol in Stanley,
Wisconsin, to provide cellulosic sugars from locally available non-food biomass over 16
years. The agreement supports Ace’s plans to shift approximately 7 percent of its
current production to cellulosic ethanol, up to 3.6 MMgal/year.

DOE / 2013 Year in Review 37 2013 YIR
Aemetis, Inc. restarted production at its 60-MMgal/year ethanol facility in Keyes,
California, after making upgrades to convert the principal feedstock from corn to grain
sorghum to qualify the ethanol as an advanced biofuel.
Plymouth Energy in Merrill, Iowa. began using a new corn hybrid from Enogen that is
estimated to produce an additional 5 MMgal/year of ethanol.
Quad County Corn Processors in Galva, Iowa, began converting corn kernel fibers to
produce cellulosic ethanol in July, increasing its total fuel production by 6 percent from
its current 35-MMgal/year capacity.
Advanced Biofuels Corp. purchased a 7-MMgal/year ethanol plant in Moses Lake,
Washington, and announced plans in April to convert the facility to a 6-MMgal/year
advanced ethanol facility using wheat straw and waste alcohol.
A full list of biofuel plants in transition can be found in Appendix B. List of Biofuel Plants in
Transition, 2013.
3.4.3 Policy Changes
In 2013, EAD reported a number of Federal policy and regulatory changes by Congress and the
EPA. In January, as part of the American Taxpayer Relief Act, Congress passed tax credit
extensions for the Biodiesel Mixture Excise Tax Credit (also known as the biodiesel blenders’
credit). This credit, valued at $1.00/gallon of pure biodiesel, was retroactively reinstated to
January 1, 2012, and was renewed through the end of 2013. Extensions were also approved for
a cellulosic ethanol production tax credit.
In February, the EPA proposed an increase in the U.S. Renewable Fuel Standard (RFS) by
nearly 9 percent over 2012, for a total of 16.55 billion gallons compared to 15.2 billion gallons in
2012. The proposal was finalized in August despite concerns by obligated parties about an “E10
blend wall.” The blend wall is the theoretical limit to incorporating ethanol into the available
gasoline fuel supply. The EPA acknowledged the ethanol blend wall and proposed a reduction
in the total volumetric requirements for 2014. The EPA also extended the deadline for obligated
parties to comply with the 2013 standard by 4 months.
In 2010 and 2011, EPA granted two partial waivers for the use of E15 in Model Year 2001 and
newer light-duty vehicles based on testing results from DOE. E15 may be sold by a registered
fuel manufacturer that meets certain requirements, including the approval of a misfueling
mitigation plan. In 2013, EPA approved a new blender pump configuration that permits the use
of a common hose and nozzle for both E15 and E10.12 At the date of publication the E15 waiver
was undergoing a number of legal challenges and in 2013 relatively few retailers were offering
E15 blends.
In addition to Federal policy and regulatory changes, a major court decision regarding the 2012
RFS volumetric requirements was announced in January. The U.S. Court of Appeals for the
District of Columbia vacated the EPA’s 2012 cellulosic biofuel requirement, concurring with the
American Petroleum Institute that the requirement to purchase 8.65 million gallons of cellulosic
12
U.S. EPA, ‘E15’, http://www.epa.gov/otaq/regs/fuels/additive/e15/

DOE / 2013 Year in Review 38 2013 YIR
fuel was an undue burden on obligated parties because only 20,000 gallons were produced in
the compliance year. Furthermore, the American Fuel & Petrochemical Manufacturers
announced that it had submitted a petition to the EPA to waive the 2012 cellulosic biofuel
requirement due to a lack of domestic fuel production.
In July, the U.S. Department of Agriculture published a rule that allowed the Department to sell
excess sugar at a loss to ethanol companies. The Department began selling sugar to ethanol
producers at a loss in August.

DOE / 2013 Year in Review 39 2013 YIR
4. International Events
While EAD primarily focuses on domestic and related North American energy issues, it also
reports international events with significant implications for global energy markets. This section
highlights those international incidents and summarizes the status of major global infrastructure
projects that were announced, under construction, or placed into service during 2013. Due to
the nature of international reporting and the focus of EAD, this should not be viewed as a
complete summary of global events, but rather a summary of those events captured in EAD.
4.1 International Incidents and Disruptions
A number of international events affected global energy markets in 2013, primarily in oil-
producing and politically unstable parts of the world. Significant energy events and disruptions
from 2013 are listed below. Many of these bullets summarize repeated events, such as attacks
on petroleum infrastructure, which continued throughout the year.
4.1.1 Africa
Civil Unrest Cuts Libyan Oil Production and Exports (2013): Libyan oil production
was unstable throughout the year due to continuing civil unrest. Output peaked in July
2013 at 1.4 million b/d, still down from 1.6 million b/d prior to the 2011 revolution.
However, output was dramatically reduced during August due to armed security guards
shutting down the country’s five ports and related pipeline infrastructure, and protesters
cutting production at the country’s oil fields. In September, output reached a low of
150,000 b/d. Additional protests and attacks targeting the country’s oil sector continued
through the remainder of the year and production and exports remained unstable.
Restart and Continued Instability of Sudan Oil Exports (2013): In April 2013, South
Sudan restarted oil production after halting production of 350,000 b/d in January 2012
due to disputes with Sudan over export oil pipeline transit fees, border security, and
territory. Production remained unstable from April through the end of the year due to
technical issues and ongoing disputes with Sudan. Production ramped up to 245,000 b/d
by December.
Nigerian Oil Pipeline Thefts and Attacks (2013): Thefts continued to plague the
Nigerian oil industry in 2013 as oil theft was estimated to total $7 billion annually. The
main targets reported in EAD were Shell’s Nembe Creek and Trans-Niger pipelines.
Shell said in March that they were losing about 60,000 b/d on their 150,000-b/d Nembe
Creek pipeline due to theft, causing the company to declare force majeure on exports of
Nigeria’s benchmark Bonny Light crude oil. The 150,000-b/d Trans-Niger pipeline
suffered attacks, thefts, and leaks throughout the year, leading Shell to again declare
force majeure on exports of Bonny Light in April, which ended in October just before
another force majeure was declared.
In Amenas, Algeria, Natural Gas Facility Hostage Crisis (January 16–19): More than
80 people were killed, including 3 Americans, during a 4-day siege of the Tiguentourine
natural gas facility near Amenas, Algeria, that started on January 16. The attack, which

DOE / 2013 Year in Review 40 2013 YIR
targeted foreigners, was carried out by an al-Qaeda-linked militant group. The remote
facility processes 11.5 percent of the country’s natural gas. The process trains at the
facility were returned to service at various points throughout the first half of the year.
Somali Pirates Release Crude Oil Tanker (March 11): Somali pirates released a crude
oil tanker after holding it hostage for more than 10 months. The Greek-owned crude oil
tanker was carrying 1 million barrels of oil when it was hijacked offshore Oman in May
2012.
Leak Disrupts Gas Supplies to Nigeria LNG Export Facility (May 15): Royal Dutch
Shell declared force majeure on gas supplies to the Nigeria Liquefied Natural Gas
liquefaction plant, citing a leak caused by saboteurs along the gathering system near
Awoba in Rivers State. Shell shut down its Soku and Gbaran Ubie gas exports via the
EGGS1 pipeline; some 1.5 Bcf/d were affected. The force majeure was lifted on
June 10. Shell had previously declared force majeure on natural gas supplies to LNG
terminals in February, which lasted 2 months.
4.1.2 Middle East
Repeat Attacks and Outages on Iraq-Turkey Export Oil Pipeline (2013): The Kirkuk-
Ceyhan pipeline, a 1.6 million-b/d pipeline spanning from Iraq’s northern oil fields to the
Turkish port of Ceyhan, was attacked at least 14 times throughout the year. Moreover, at
least five additional outages caused by equipment failure or corroded sections of
pipeline caused further outages along the pipeline.
Production Cut at Iraq’s Largest Oilfield (2013): Output from Iraq’s Rumaila oil field
was cut by about 500,000 b/d for a week in September due to a pipeline leak.
Repeat Attacks on Yemen’s Main Export Oil Pipeline (2013): Yemen’s 110,000-b/d
Maarib crude oil pipeline was attacked at least 19 times during 2013. The Maarib
pipeline is Yemen’s main oil export pipeline and transports light crude oil from the Safir
oil fields to the Ras Isa export terminal on the Red Sea.
4.1.3 Americas
Attacks on Columbia’s Oil and Gas Infrastructure (2013): A number of attacks
claimed by Colombian rebel groups occurred throughout the year aimed at curtailing
Ecopetrol’s operations. During 2013, the 80,000-b/d Cano Limon pipeline was attacked
at least eight times, while at least six additional attacks took place on other petroleum
and natural gas pipelines. A car bomb in March, targeting an Ecopetrol facility, left the
city of Tumaco without water or electricity.
Landslide Shuts Ecuador Oil Export Pipeline (May 31 – June 4): Petroecuador
repaired and gradually restarted its 360,000-b/d SOTE pipeline on June 4, following a
rupture on May 31 due to a landslide that burst a section of the pipeline. The pipeline
was transporting about 60,000 b/d during the restart, down from 309,000 b/d prior to the
landslide.

DOE / 2013 Year in Review 41 2013 YIR
4.1.4 Asia
Fukushima Dai’ichi Decommissioning Problems in Japan (2013): The Tokyo Electric
Power Company faced groundwater flooding and power failures during its
decommissioning of the tsunami-damaged Fukushima Dai’ichi nuclear power plant. Fuel
rod removal began on November 18 and is expected to be complete by the end of 2014.
Major Power Outage in Southeastern India (October 6–10): Strikes by power plant
workers over the split of Andhra Pradesh in India left 21 million people without power in
India for at least 4 days, starting on October 6. It is not clear from reports when power
was restored.
Oil Pipeline Blast in Eastern China (November 22): A pair of explosions on a
200,000-b/d Sinopec oil pipeline killed 55 people in Qingdao in eastern China on
November 22. The blasts caused a fire that halted operations at a major oil port, a
petroleum spill that affected 9,000 square feet of water and prompted the evacuation of
an estimated 18,000 people, and cut production at the Qingdao refinery. Portions of the
system were restarted on December 1.
4.2 International Infrastructure Projects
Major international infrastructure projects reported in EAD in 2013 focused primarily on the
petroleum sector and were located in the Middle East, Africa, and Central Asia. Significant
infrastructure projects are summarized below.
4.2.1 Africa
Offshore Nigeria Oil Development (June 21): The Nigerian National Petroleum
Corporation awarded approvals to a subsidiary of Total to develop a 200,000-b/d
offshore oil field with production expected to begin by the end of 2017.
4.2.2 Middle East
Oman Announces Ras Markaz Oil Terminal Project (January 14): In January, it was
reported that Oman was considering building a 200 million-barrel crude oil storage hub
and export terminal at Ras Markaz on the shore of the Arabian Sea. If built, the storage
hub would be the largest in the Middle East and would bypass shipping congestion on
the Gulf of Oman, near the entrance to the Strait of Hormuz, where the country’s existing
export facilities are located. News reports at the end of the year indicated that the project
had not yet begun construction, but was still on the agenda for the Oman Oil Company.
UAE Expands Storage at Terminal Bypassing the Strait of Hormuz (February 14):
The United Arab Emirates (UAE) announced plans in February to increase the storage
capacity at the port of Fujairah, outside the Strait of Hormuz on the Gulf of Oman, from
25.6 to 38.2 million barrels in 2013. This project, along with others announced or
underway, will help Fujairah’s oil storage capacity reach almost 56.6 million barrels by
2015. In 2012, UAE started up the 236-mile, 1.5 million-b/d Abu Dhabi crude oil pipeline
to Fujairah, which was designed to bypass the Strait of Hormuz, a major oil transit route
that has been threatened by Iran.

DOE / 2013 Year in Review 42 2013 YIR
Iraq Announces Basra-to-Aqaba Oil Export Pipeline Project With Jordan (February
28): Iraq announced in February that technical and design work had begun on an oil
export pipeline from Basra to the Jordanian port of Aqaba on the Gulf of Aqaba,
bypassing the Strait of Hormuz. The first phase of the 1,680-kilometer oil pipeline will
export 1 million b/d from Basra, of which 150,000 b/d will go to supply Jordan. The
second phase will export a further 1.25 million b/d to the Syrian Banias port in the
Mediterranean. The project will also build storage facilities near Basra and Haditha with
a total capacity of 28 million barrels.
BP Announces Rumaila Oil Field Expansion Project in Iraq (May 22): BP announced
plans in May to increase the production capacity at the Rumaila oil field, the largest in
Iraq, by 750,000 b/d by 2017. The company is currently producing about 1.4 million b/d
from Rumaila and plans to add about 100,000 b/d of production per year over the next
3 years, along with an additional 450,000 b/d by 2017 with the operation of a new large-
scale facility at the field. Rumaila holds estimated oil reserves of 17 billion barrels.
Kuwait Cancels Plans for Oil Export Pipeline Bypassing Strait of Hormuz
(September 17): On September 17, Kuwait cancelled plans to build an oil export
pipeline to bypass the Strait of Hormuz because it would be too difficult and costly.
Kuwait’s 2 million-b/d oil exports are shipped through the Strait of Hormuz.
Shell Inaugurates Majnoon Oil Field in Iraq (October 6): Royal Dutch Shell
inaugurated Iraq’s Majnoon oil field on October 6 as crude production levels rose to
175,000 b/d. The field contains estimated reserves of 12 billion barrels of crude oil and
9.5 trillion cubic feet of gas.
Iraqi Kurdistan-Turkey Pipeline Completed (October 25): A pipeline linking Iraq’s
autonomous Kurdistan region and Turkey was completed in September. The pipeline
has an initial capacity of 300,000 b/d, but is expected to be expanded to 400,000 b/d by
the end of 2014. The pipeline is slated to continue to expand to 1 million b/d by 2015 and
2 million b/d by 2019.
4.2.3 Asia/Australia
World’s Largest Floating LNG Terminal Proposed Off of Australia (April 2):
ExxonMobil and partner BHP Billiton proposed in April to develop the world’s largest
floating LNG facility off the coast of northeastern Australia. The proposed facility would
produce between 6 and 7 million metric tons of LNG a year (800 to 900 MMcf/d) for
several decades with production beginning in 2020. The project will tap into the remote
Scarborough natural gas field offshore of Western Australia, which is estimated to hold
up to 10 trillion cubic feet of gas reserves.
Kazakhstan’s Kashagan Oil Field Starts Phase I Production (July 7): The Kashagan
oil field in Kazakhstan began its first phase of start-up on July 7. The field was expected
to produce 75,000 b/d in its first month of operation, gradually increasing to 180,000 b/d
over the next 2 years, and then to 370,000 b/d in the second stage of development.
Kashagan is a joint venture between the Kazakh state energy company KazMunaiGaz,
Eni, ExxonMobil, Royal Dutch Shell, Total, ConocoPhillips, and Japan’s Inpex.

DOE / 2013 Year in Review 43 2013 YIR
Appendix A. Criteria for EAD Selection
Asset or Sector Activity
Type of Event or Disruption
Criteria by EAD Category1
Major Event Energy Sector Event
End Use Power Outage/ Restoration
≥ 250,000 customers 10,000–249,999 customers
Power Plant Shut Down/ Restart/ New Capacity
Depends on impact; typically > 2,000 MW
100–1,999 MW
Transmission Line
Shut Down/ Restart/ New Capacity
Depends on impact; typically > 500 kV
115–500 kV
Substation Break-in Damage/ Shutdown
– Copper theft or severe impact
Refinery Shut Down, Restart, Flaring, New Capacity
≥ 200,000 b/d < 200,000 b/d
Production or Transportation
2
Shut Down, Restart, Flaring, New Capacity
U.S./Canada: ≥ 200,000 b/d
Foreign: Depends on impact3
U.S./Canada: 10,000–199,999 b/d
Foreign: ≥ 25,000 b/d
3
Exploration Oil Discovery U.S./Canada:
> 10 billion barrels
U.S./Canada: 0.2–10 billion barrels
Foreign: ≥ 2 billion barrels
U.S./Canada Gas Production, Processing, or Transportation
2
Shutdown, Restart, New Capacity
Depends on impact; typically > 500 MMcf/d or major
explosion 100–500 MMcf/d
Ethanol Plant, Biorefinery
Shutdown, Restart, New Capacity
Depends on impact; typically > 500 MMgal/year
10–500 MMgal/year
Notes: 1. Criteria refer to the number of customers affected, or the impact on energy infrastructure (measured in volume or
capacity). 2. Transportation includes pipelines, marine tankers, tanker trucks, import/export terminals, railroads, and other
forms of transportation. 3. Foreign producers include only those countries that supply the United States.
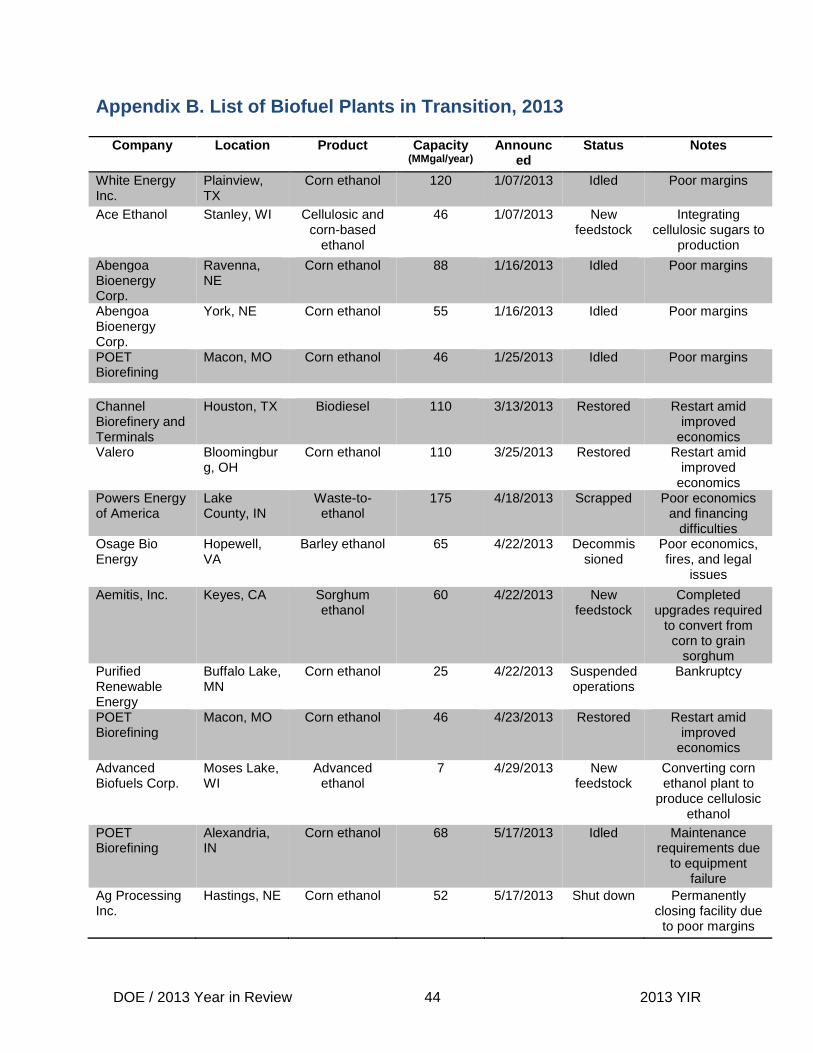
DOE / 2013 Year in Review 44 2013 YIR
Appendix B. List of Biofuel Plants in Transition, 2013
Company Location Product Capacity (MMgal/year)
Announced
Status Notes
White Energy Inc.
Plainview, TX
Corn ethanol 120 1/07/2013 Idled Poor margins
Ace Ethanol Stanley, WI Cellulosic and corn-based
ethanol
46 1/07/2013 New feedstock
Integrating cellulosic sugars to
production
Abengoa Bioenergy Corp.
Ravenna, NE
Corn ethanol 88 1/16/2013 Idled Poor margins
Abengoa Bioenergy Corp.
York, NE Corn ethanol 55 1/16/2013 Idled Poor margins
POET Biorefining
Macon, MO Corn ethanol 46 1/25/2013 Idled Poor margins
Channel Biorefinery and Terminals
Houston, TX Biodiesel 110 3/13/2013 Restored Restart amid improved
economics Valero Bloomingbur
g, OH Corn ethanol 110 3/25/2013 Restored Restart amid
improved economics
Powers Energy of America
Lake County, IN
Waste-to-ethanol
175 4/18/2013 Scrapped Poor economics and financing
difficulties Osage Bio Energy
Hopewell, VA
Barley ethanol 65 4/22/2013 Decommissioned
Poor economics, fires, and legal
issues
Aemitis, Inc. Keyes, CA Sorghum ethanol
60 4/22/2013 New feedstock
Completed upgrades required
to convert from corn to grain
sorghum Purified Renewable Energy
Buffalo Lake, MN
Corn ethanol 25 4/22/2013 Suspended operations
Bankruptcy
POET Biorefining
Macon, MO Corn ethanol 46 4/23/2013 Restored Restart amid improved
economics
Advanced Biofuels Corp.
Moses Lake, WI
Advanced ethanol
7 4/29/2013 New feedstock
Converting corn ethanol plant to
produce cellulosic ethanol
POET Biorefining
Alexandria, IN
Corn ethanol 68 5/17/2013 Idled Maintenance requirements due
to equipment failure
Ag Processing Inc.
Hastings, NE Corn ethanol 52 5/17/2013 Shut down Permanently closing facility due
to poor margins

DOE / 2013 Year in Review 45 2013 YIR
Renewable Energy Group
New Boston, TX
Biodiesel 15 7/01/2013 Restored Restored under new ownership and renovations
East Kansas Agri-Energy, LLC
Garnett, KS Corn ethanol 35 7/15/2013 Restored Restart amid improved
economics Noble Americas
South Bend, IN
Corn ethanol 102 7/18/2013 Restored After filing for Chapter 11
bankruptcy, plant was purchased
from New Energy Corp. by Noble
Americas Quad County Corn Processors
Galva, IA Corn ethanol 35 7/30/2013 New feedstock
Converting corn kernel fiber to
cellulosic ethanol Florida Biofuels Fort Myers,
FL Biodiesel 2 8/08/2013 Idled Poor economics
Agrex Benton, IL Corn ethanol 7 8/20/2013 Restored Restored under new ownership
Xenex Biofuels Dayton, OH Biodiesel 20 9/09/2013 Scrapped Financing difficulties
Three Rivers Energy
Coshocton, OH
Corn ethanol 50 10/03/2013
Restored Restored under new ownership
Pratt Energy Pratt, KS Corn ethanol 55 10/24/2013
Restored Restored under new ownership and renovations
Renewable Energy Group
Mason City, IA
Corn ethanol 30 10/29/2013
Restored Restored under new ownership and renovations
Cargill Fort Dodge, IA
Corn ethanol N/A 11/04/2013
Restored Restored under new ownership
Plymouth Energy
Merrill, IA Corn ethanol 50 11/13/2013
New feedstock
Using special hybrid corn
(Enogen) can produce an additional
5 MMgal/year of ethanol
Utica Energy N/A Corn ethanol 50 11/27/2013
Restored Restored under new ownership
Biofuel Energy Corp.
Fairmont, MN
Corn ethanol 113 12/19/2013
Restored Restored under new ownership