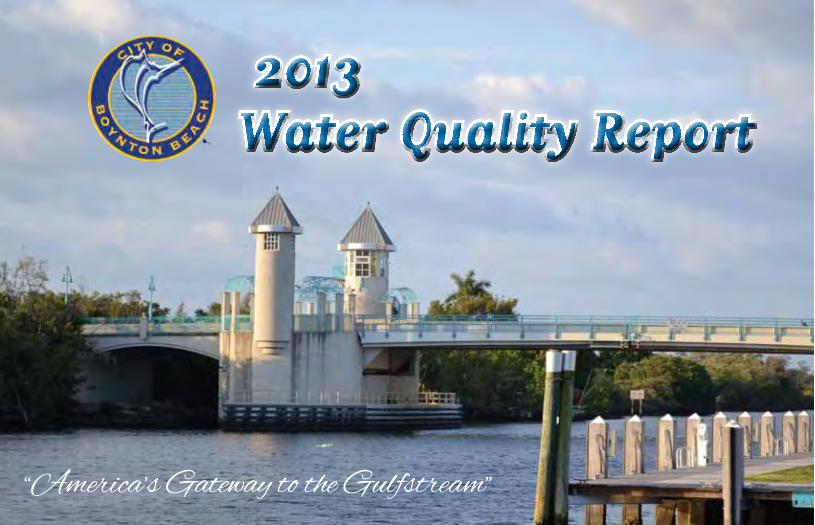
2013 Water Quality Report
7
-
Upload
city-of-boynton-beach -
Category
Documents
-
view
216 -
download
0
description
The City of Boynton Beach wants you to be informed about your water utility and the high-quality drinking water delivered to your homes and businesses.
Transcript of 2013 Water Quality Report
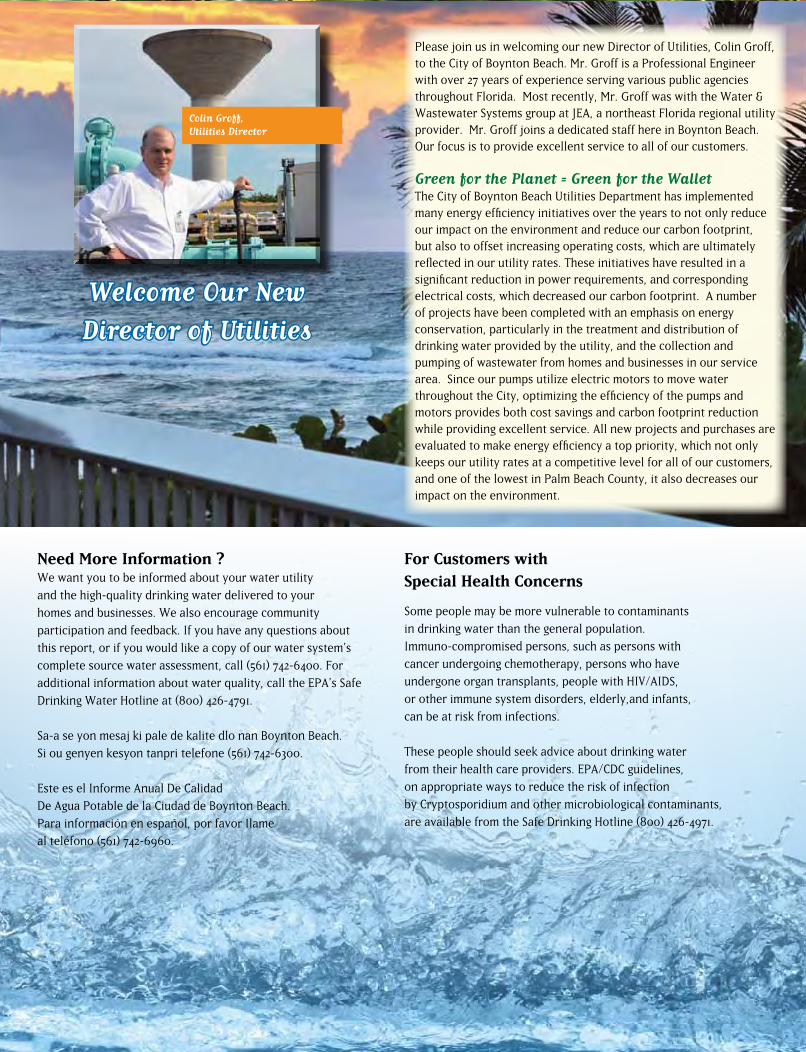
Please join us in welcoming our new Director of Utilities, Colin Groff, to the City of Boynton Beach. Mr. Groff is a Professional Engineer with over 27 years of experience serving various public agencies throughout Florida. Most recently, Mr. Groff was with the Water & Wastewater Systems group at JEA, a northeast Florida regional utility provider. Mr. Groff joins a dedicated staff here in Boynton Beach. Our focus is to provide excellent service to all of our customers.
Green for the Planet = Green for the WalletThe City of Boynton Beach Utilities Department has implemented many energy efficiency initiatives over the years to not only reduce our impact on the environment and reduce our carbon footprint, but also to offset increasing operating costs, which are ultimately reflected in our utility rates. These initiatives have resulted in a significant reduction in power requirements, and corresponding electrical costs, which decreased our carbon footprint. A number of projects have been completed with an emphasis on energy conservation, particularly in the treatment and distribution of drinking water provided by the utility, and the collection and pumping of wastewater from homes and businesses in our service area. Since our pumps utilize electric motors to move water throughout the City, optimizing the efficiency of the pumps and motors provides both cost savings and carbon footprint reduction while providing excellent service. All new projects and purchases are evaluated to make energy efficiency a top priority, which not only keeps our utility rates at a competitive level for all of our customers, and one of the lowest in Palm Beach County, it also decreases our impact on the environment.
Need More Information ?We want you to be informed about your water utility
and the high-quality drinking water delivered to your
homes and businesses. We also encourage community
participation and feedback. If you have any questions about
this report, or if you would like a copy of our water system’s
complete source water assessment, call (561) 742-6400. For
additional information about water quality, call the EPA’s Safe
Drinking Water Hotline at (800) 426-4791.
Sa-a se yon mesaj ki pale de kalite dlo nan Boynton Beach.
Si ou genyen kesyon tanpri telefone (561) 742-6300.
Este es el Informe Anual De Calidad
De Agua Potable de la Ciudad de Boynton Beach.
Para información en español, por favor Ilame
al teléfono (561) 742-6960.
For Customers with Special Health Concerns
Some people may be more vulnerable to contaminants
in drinking water than the general population.
Immuno-compromised persons, such as persons with
cancer undergoing chemotherapy, persons who have
undergone organ transplants, people with HIV/AIDS,
or other immune system disorders, elderly,and infants,
can be at risk from infections.
These people should seek advice about drinking water
from their health care providers. EPA/CDC guidelines,
on appropriate ways to reduce the risk of infection
by Cryptosporidium and other microbiological contaminants,
are available from the Safe Drinking Hotline (800) 426-4971.
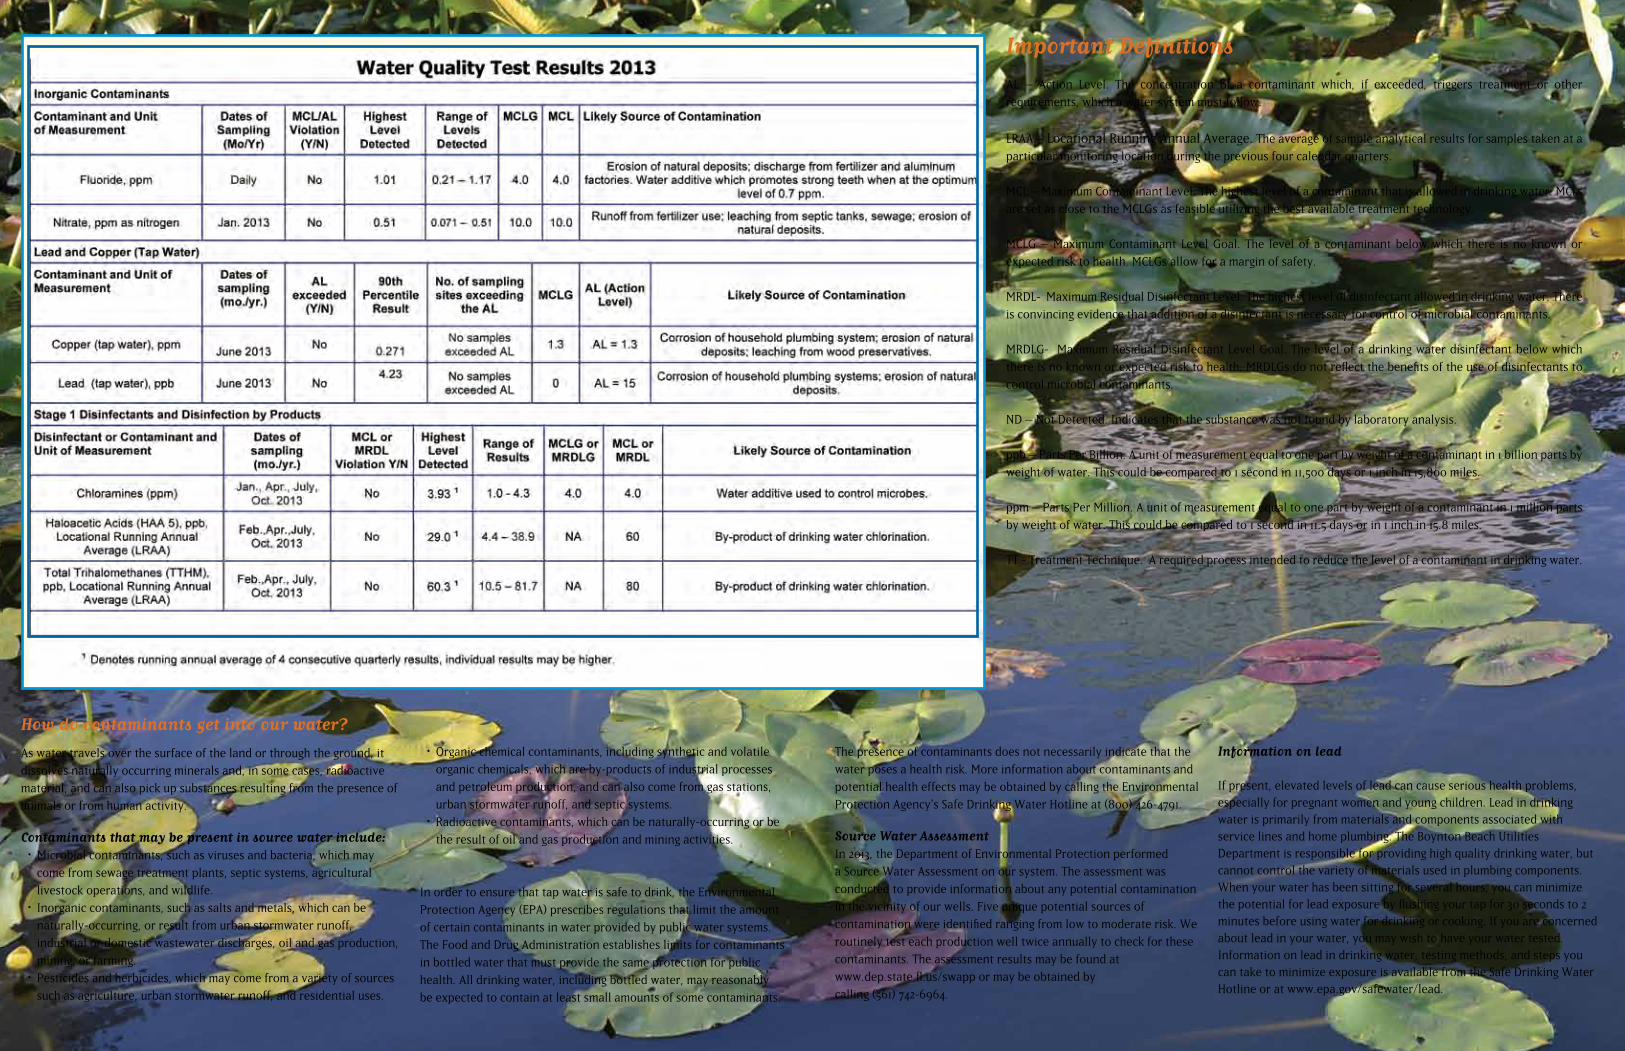
Important Definitions
AL – Action Level. The concentration of a contaminant which, if exceeded, triggers treatment or other
requirements, which a water system must follow.
LRAA – Locational Running Annual Average. The average of sample analytical results for samples taken at a
particular monitoring location during the previous four calendar quarters.
MCL – Maximum Contaminant Level. The highest level of a contaminant that is allowed in drinking water. MCLs
are set as close to the MCLGs as feasible utilizing the best available treatment technology.
MCLG – Maximum Contaminant Level Goal. The level of a contaminant below which there is no known or
expected risk to health. MCLGs allow for a margin of safety.
MRDL- Maximum Residual Disinfectant Level. The highest level of disinfectant allowed in drinking water. There
is convincing evidence that addition of a disinfectant is necessary for control of microbial contaminants.
MRDLG- Maximum Residual Disinfectant Level Goal. The level of a drinking water disinfectant below which
there is no known or expected risk to health. MRDLGs do not reflect the benefits of the use of disinfectants to
control microbial contaminants.
ND – Not Detected. Indicates that the substance was not found by laboratory analysis.
ppb – Parts Per Billion. A unit of measurement equal to one part by weight of a contaminant in 1 billion parts by
weight of water. This could be compared to 1 second in 11,500 days or 1 inch in 15,800 miles.
ppm – Parts Per Million. A unit of measurement equal to one part by weight of a contaminant in 1 million parts
by weight of water. This could be compared to 1 second in 11.5 days or in 1 inch in 15.8 miles.
TT - Treatment Technique. A required process intended to reduce the level of a contaminant in drinking water.
How do contaminants get into our water?
As water travels over the surface of the land or through the ground, it
dissolves naturally occurring minerals and, in some cases, radioactive
material, and can also pick up substances resulting from the presence of
animals or from human activity.
Contaminants that may be present in source water include:• Microbial contaminants, such as viruses and bacteria, which may
come from sewage treatment plants, septic systems, agricultural
livestock operations, and wildlife.
• Inorganic contaminants, such as salts and metals, which can be
naturally-occurring, or result from urban stormwater runoff,
industrial or domestic wastewater discharges, oil and gas production,
mining, or farming.
• Pesticides and herbicides, which may come from a variety of sources
such as agriculture, urban stormwater runoff, and residential uses.
• Organic chemical contaminants, including synthetic and volatile
organic chemicals, which are by-products of industrial processes
and petroleum production, and can also come from gas stations,
urban stormwater runoff, and septic systems.
• Radioactive contaminants, which can be naturally-occurring or be
the result of oil and gas production and mining activities.
In order to ensure that tap water is safe to drink, the Environmental
Protection Agency (EPA) prescribes regulations that limit the amount
of certain contaminants in water provided by public water systems.
The Food and Drug Administration establishes limits for contaminants
in bottled water that must provide the same protection for public
health. All drinking water, including bottled water, may reasonably
be expected to contain at least small amounts of some contaminants.
The presence of contaminants does not necessarily indicate that the
water poses a health risk. More information about contaminants and
potential health effects may be obtained by calling the Environmental
Protection Agency’s Safe Drinking Water Hotline at (800) 426-4791.
Source Water AssessmentIn 2013, the Department of Environmental Protection performed
a Source Water Assessment on our system. The assessment was
conducted to provide information about any potential contamination
in the vicinity of our wells. Five unique potential sources of
contamination were identified ranging from low to moderate risk. We
routinely test each production well twice annually to check for these
contaminants. The assessment results may be found at
www.dep.state.fl.us/swapp or may be obtained by
calling (561) 742-6964.
Information on lead
If present, elevated levels of lead can cause serious health problems, especially for pregnant women and young children. Lead in drinking water is primarily from materials and components associated with service lines and home plumbing. The Boynton Beach Utilities Department is responsible for providing high quality drinking water, but cannot control the variety of materials used in plumbing components. When your water has been sitting for several hours, you can minimize the potential for lead exposure by flushing your tap for 30 seconds to 2 minutes before using water for drinking or cooking. If you are concerned about lead in your water, you may wish to have your water tested. Information on lead in drinking water, testing methods, and steps you can take to minimize exposure is available from the Safe Drinking Water Hotline or at www.epa.gov/safewater/lead.
Mayor Jerry Taylor, At-Large
Vice-Mayor Joseph Casello, District IV
Commissioner Michael Fitzpatrick, District III
Commissioner David T. Merker, District I
Commissioner Mack McCray, District II
City Manager, Lori LaVerriere
Utilities Director, Colin Groff
Water Quality Division .................(561) 742-6964
City Hall Customer Service ...........(561) 742-6300
Utilities Department .....................(561) 742-6400
After Hours/Emergency .................(561) 742-6430
Information Line ...........................(561) 742-6467
City of Boynton Beach100 E. Boynton Beach Blvd.Boynton Beach, FL 33435
CITY COMMISSION MEETINGS1st and 3rd Tuesdays of the Month
6:30 PM at City Hall
100 E. Boynton Beach Blvd.
2013 Water Quality Report
Colin Groff, Utilities Director
Welcome Our New
Director of Utilities
Please join us in welcoming our new Director of Utilities, Colin Groff, to the City of Boynton Beach. Mr. Groff is a Professional Engineer with over 27 years of experience serving various public agencies throughout Florida. Most recently, Mr. Groff was with the Water & Wastewater Systems group at JEA, a northeast Florida regional utility provider. Mr. Groff joins a dedicated staff here in Boynton Beach. Our focus is to provide excellent service to all of our customers.
Green for the Planet = Green for the WalletThe City of Boynton Beach Utilities Department has implemented many energy efficiency initiatives over the years to not only reduce our impact on the environment and reduce our carbon footprint, but also to offset increasing operating costs, which are ultimately reflected in our utility rates. These initiatives have resulted in a significant reduction in power requirements, and corresponding electrical costs, which decreased our carbon footprint. A number of projects have been completed with an emphasis on energy conservation, particularly in the treatment and distribution of drinking water provided by the utility, and the collection and pumping of wastewater from homes and businesses in our service area. Since our pumps utilize electric motors to move water throughout the City, optimizing the efficiency of the pumps and motors provides both cost savings and carbon footprint reduction while providing excellent service. All new projects and purchases are evaluated to make energy efficiency a top priority, which not only keeps our utility rates at a competitive level for all of our customers, and one of the lowest in Palm Beach County, it also decreases our impact on the environment.
Need More Information ?We want you to be informed about your water utility
and the high-quality drinking water delivered to your
homes and businesses. We also encourage community
participation and feedback. If you have any questions about
this report, or if you would like a copy of our water system’s
complete source water assessment, call (561) 742-6400. For
additional information about water quality, call the EPA’s Safe
Drinking Water Hotline at (800) 426-4791.
Sa-a se yon mesaj ki pale de kalite dlo nan Boynton Beach.
Si ou genyen kesyon tanpri telefone (561) 742-6300.
Este es el Informe Anual De Calidad
De Agua Potable de la Ciudad de Boynton Beach.
Para información en español, por favor Ilame
al teléfono (561) 742-6960.
For Customers with Special Health Concerns
Some people may be more vulnerable to contaminants
in drinking water than the general population.
Immuno-compromised persons, such as persons with
cancer undergoing chemotherapy, persons who have
undergone organ transplants, people with HIV/AIDS,
or other immune system disorders, elderly,and infants,
can be at risk from infections.
These people should seek advice about drinking water
from their health care providers. EPA/CDC guidelines,
on appropriate ways to reduce the risk of infection
by Cryptosporidium and other microbiological contaminants,
are available from the Safe Drinking Hotline (800) 426-4971.
Important Definitions
AL – Action Level. The concentration of a contaminant which, if exceeded, triggers treatment or other
requirements, which a water system must follow.
LRAA – Locational Running Annual Average. The average of sample analytical results for samples taken at a
particular monitoring location during the previous four calendar quarters.
MCL – Maximum Contaminant Level. The highest level of a contaminant that is allowed in drinking water. MCLs
are set as close to the MCLGs as feasible utilizing the best available treatment technology.
MCLG – Maximum Contaminant Level Goal. The level of a contaminant below which there is no known or
expected risk to health. MCLGs allow for a margin of safety.
MRDL- Maximum Residual Disinfectant Level. The highest level of disinfectant allowed in drinking water. There
is convincing evidence that addition of a disinfectant is necessary for control of microbial contaminants.
MRDLG- Maximum Residual Disinfectant Level Goal. The level of a drinking water disinfectant below which
there is no known or expected risk to health. MRDLGs do not reflect the benefits of the use of disinfectants to
control microbial contaminants.
ND – Not Detected. Indicates that the substance was not found by laboratory analysis.
ppb – Parts Per Billion. A unit of measurement equal to one part by weight of a contaminant in 1 billion parts by
weight of water. This could be compared to 1 second in 11,500 days or 1 inch in 15,800 miles.
ppm – Parts Per Million. A unit of measurement equal to one part by weight of a contaminant in 1 million parts
by weight of water. This could be compared to 1 second in 11.5 days or in 1 inch in 15.8 miles.
TT - Treatment Technique. A required process intended to reduce the level of a contaminant in drinking water.
How do contaminants get into our water?
As water travels over the surface of the land or through the ground, it
dissolves naturally occurring minerals and, in some cases, radioactive
material, and can also pick up substances resulting from the presence of
animals or from human activity.
Contaminants that may be present in source water include:• Microbial contaminants, such as viruses and bacteria, which may
come from sewage treatment plants, septic systems, agricultural
livestock operations, and wildlife.
• Inorganic contaminants, such as salts and metals, which can be
naturally-occurring, or result from urban stormwater runoff,
industrial or domestic wastewater discharges, oil and gas production,
mining, or farming.
• Pesticides and herbicides, which may come from a variety of sources
such as agriculture, urban stormwater runoff, and residential uses.
• Organic chemical contaminants, including synthetic and volatile
organic chemicals, which are by-products of industrial processes
and petroleum production, and can also come from gas stations,
urban stormwater runoff, and septic systems.
• Radioactive contaminants, which can be naturally-occurring or be
the result of oil and gas production and mining activities.
In order to ensure that tap water is safe to drink, the Environmental
Protection Agency (EPA) prescribes regulations that limit the amount
of certain contaminants in water provided by public water systems.
The Food and Drug Administration establishes limits for contaminants
in bottled water that must provide the same protection for public
health. All drinking water, including bottled water, may reasonably
be expected to contain at least small amounts of some contaminants.
The presence of contaminants does not necessarily indicate that the
water poses a health risk. More information about contaminants and
potential health effects may be obtained by calling the Environmental
Protection Agency’s Safe Drinking Water Hotline at (800) 426-4791.
Source Water AssessmentIn 2013, the Department of Environmental Protection performed
a Source Water Assessment on our system. The assessment was
conducted to provide information about any potential contamination
in the vicinity of our wells. Five unique potential sources of
contamination were identified ranging from low to moderate risk. We
routinely test each production well twice annually to check for these
contaminants. The assessment results may be found at
www.dep.state.fl.us/swapp or may be obtained by
calling (561) 742-6964.
Information on lead
If present, elevated levels of lead can cause serious health problems, especially for pregnant women and young children. Lead in drinking water is primarily from materials and components associated with service lines and home plumbing. The Boynton Beach Utilities Department is responsible for providing high quality drinking water, but cannot control the variety of materials used in plumbing components. When your water has been sitting for several hours, you can minimize the potential for lead exposure by flushing your tap for 30 seconds to 2 minutes before using water for drinking or cooking. If you are concerned about lead in your water, you may wish to have your water tested. Information on lead in drinking water, testing methods, and steps you can take to minimize exposure is available from the Safe Drinking Water Hotline or at www.epa.gov/safewater/lead.
Mayor Jerry Taylor, At-Large
Vice-Mayor Joseph Casello, District IV
Commissioner Michael Fitzpatrick, District III
Commissioner David T. Merker, District I
Commissioner Mack McCray, District II
City Manager, Lori LaVerriere
Utilities Director, Colin Groff
Water Quality Division ................. (561) 742-6964
City Hall Customer Service ........... (561) 742-6300
Utilities Department ..................... (561) 742-6400
After Hours/Emergency .................(561) 742-6430
Information Line ...........................(561) 742-6467
City of Boynton Beach100 E. Boynton Beach Blvd.Boynton Beach, FL 33435
CITY COMMISSION MEETINGS1st and 3rd Tuesdays of the Month
6:30 PM at City Hall
100 E. Boynton Beach Blvd.
2013 Water Quality Report
Colin Groff, Utilities Director
Welcome Our New
Director of Utilities
Please join us in welcoming our new Director of Utilities, Colin Groff, to the City of Boynton Beach. Mr. Groff is a Professional Engineer with over 27 years of experience serving various public agencies throughout Florida. Most recently, Mr. Groff was with the Water & Wastewater Systems group at JEA, a northeast Florida regional utility provider. Mr. Groff joins a dedicated staff here in Boynton Beach. Our focus is to provide excellent service to all of our customers.
Green for the Planet = Green for the WalletThe City of Boynton Beach Utilities Department has implemented many energy efficiency initiatives over the years to not only reduce our impact on the environment and reduce our carbon footprint, but also to offset increasing operating costs, which are ultimately reflected in our utility rates. These initiatives have resulted in a significant reduction in power requirements, and corresponding electrical costs, which decreased our carbon footprint. A number of projects have been completed with an emphasis on energy conservation, particularly in the treatment and distribution of drinking water provided by the utility, and the collection and pumping of wastewater from homes and businesses in our service area. Since our pumps utilize electric motors to move water throughout the City, optimizing the efficiency of the pumps and motors provides both cost savings and carbon footprint reduction while providing excellent service. All new projects and purchases are evaluated to make energy efficiency a top priority, which not only keeps our utility rates at a competitive level for all of our customers, and one of the lowest in Palm Beach County, it also decreases our impact on the environment.
Need More Information ?We want you to be informed about your water utility
and the high-quality drinking water delivered to your
homes and businesses. We also encourage community
participation and feedback. If you have any questions about
this report, or if you would like a copy of our water system’s
complete source water assessment, call (561) 742-6400. For
additional information about water quality, call the EPA’s Safe
Drinking Water Hotline at (800) 426-4791.
Sa-a se yon mesaj ki pale de kalite dlo nan Boynton Beach.
Si ou genyen kesyon tanpri telefone (561) 742-6300.
Este es el Informe Anual De Calidad
De Agua Potable de la Ciudad de Boynton Beach.
Para información en español, por favor Ilame
al teléfono (561) 742-6960.
For Customers with Special Health Concerns
Some people may be more vulnerable to contaminants
in drinking water than the general population.
Immuno-compromised persons, such as persons with
cancer undergoing chemotherapy, persons who have
undergone organ transplants, people with HIV/AIDS,
or other immune system disorders, elderly,and infants,
can be at risk from infections.
These people should seek advice about drinking water
from their health care providers. EPA/CDC guidelines,
on appropriate ways to reduce the risk of infection
by Cryptosporidium and other microbiological contaminants,
are available from the Safe Drinking Hotline (800) 426-4971.
Important Definitions
AL – Action Level. The concentration of a contaminant which, if exceeded, triggers treatment or other
requirements, which a water system must follow.
LRAA – Locational Running Annual Average. The average of sample analytical results for samples taken at a
particular monitoring location during the previous four calendar quarters.
MCL – Maximum Contaminant Level. The highest level of a contaminant that is allowed in drinking water. MCLs
are set as close to the MCLGs as feasible utilizing the best available treatment technology.
MCLG – Maximum Contaminant Level Goal. The level of a contaminant below which there is no known or
expected risk to health. MCLGs allow for a margin of safety.
MRDL- Maximum Residual Disinfectant Level. The highest level of disinfectant allowed in drinking water. There
is convincing evidence that addition of a disinfectant is necessary for control of microbial contaminants.
MRDLG- Maximum Residual Disinfectant Level Goal. The level of a drinking water disinfectant below which
there is no known or expected risk to health. MRDLGs do not reflect the benefits of the use of disinfectants to
control microbial contaminants.
ND – Not Detected. Indicates that the substance was not found by laboratory analysis.
ppb – Parts Per Billion. A unit of measurement equal to one part by weight of a contaminant in 1 billion parts by
weight of water. This could be compared to 1 second in 11,500 days or 1 inch in 15,800 miles.
ppm – Parts Per Million. A unit of measurement equal to one part by weight of a contaminant in 1 million parts
by weight of water. This could be compared to 1 second in 11.5 days or in 1 inch in 15.8 miles.
TT - Treatment Technique. A required process intended to reduce the level of a contaminant in drinking water.
How do contaminants get into our water?
As water travels over the surface of the land or through the ground, it
dissolves naturally occurring minerals and, in some cases, radioactive
material, and can also pick up substances resulting from the presence of
animals or from human activity.
Contaminants that may be present in source water include:• Microbial contaminants, such as viruses and bacteria, which may
come from sewage treatment plants, septic systems, agricultural
livestock operations, and wildlife.
• Inorganic contaminants, such as salts and metals, which can be
naturally-occurring, or result from urban stormwater runoff,
industrial or domestic wastewater discharges, oil and gas production,
mining, or farming.
• Pesticides and herbicides, which may come from a variety of sources
such as agriculture, urban stormwater runoff, and residential uses.
• Organic chemical contaminants, including synthetic and volatile
organic chemicals, which are by-products of industrial processes
and petroleum production, and can also come from gas stations,
urban stormwater runoff, and septic systems.
• Radioactive contaminants, which can be naturally-occurring or be
the result of oil and gas production and mining activities.
In order to ensure that tap water is safe to drink, the Environmental
Protection Agency (EPA) prescribes regulations that limit the amount
of certain contaminants in water provided by public water systems.
The Food and Drug Administration establishes limits for contaminants
in bottled water that must provide the same protection for public
health. All drinking water, including bottled water, may reasonably
be expected to contain at least small amounts of some contaminants.
The presence of contaminants does not necessarily indicate that the
water poses a health risk. More information about contaminants and
potential health effects may be obtained by calling the Environmental
Protection Agency’s Safe Drinking Water Hotline at (800) 426-4791.
Source Water AssessmentIn 2013, the Department of Environmental Protection performed
a Source Water Assessment on our system. The assessment was
conducted to provide information about any potential contamination
in the vicinity of our wells. Five unique potential sources of
contamination were identified ranging from low to moderate risk. We
routinely test each production well twice annually to check for these
contaminants. The assessment results may be found at
www.dep.state.fl.us/swapp or may be obtained by
calling (561) 742-6964.
Information on lead
If present, elevated levels of lead can cause serious health problems, especially for pregnant women and young children. Lead in drinking water is primarily from materials and components associated with service lines and home plumbing. The Boynton Beach Utilities Department is responsible for providing high quality drinking water, but cannot control the variety of materials used in plumbing components. When your water has been sitting for several hours, you can minimize the potential for lead exposure by flushing your tap for 30 seconds to 2 minutes before using water for drinking or cooking. If you are concerned about lead in your water, you may wish to have your water tested. Information on lead in drinking water, testing methods, and steps you can take to minimize exposure is available from the Safe Drinking Water Hotline or at www.epa.gov/safewater/lead.
Mayor Jerry Taylor, At-Large
Vice-Mayor Joseph Casello, District IV
Commissioner Michael Fitzpatrick, District III
Commissioner David T. Merker, District I
Commissioner Mack McCray, District II
City Manager, Lori LaVerriere
Utilities Director, Colin Groff
Water Quality Division .................(561) 742-6964
City Hall Customer Service ...........(561) 742-6300
Utilities Department .....................(561) 742-6400
After Hours/Emergency .................(561) 742-6430
Information Line ...........................(561) 742-6467
City of Boynton Beach100 E. Boynton Beach Blvd.Boynton Beach, FL 33435
CITY COMMISSION MEETINGS1st and 3rd Tuesdays of the Month
6:30 PM at City Hall
100 E. Boynton Beach Blvd.
2013 Water Quality Report
Colin Groff, Utilities Director
Welcome Our New
Director of Utilities
Stormwater Management
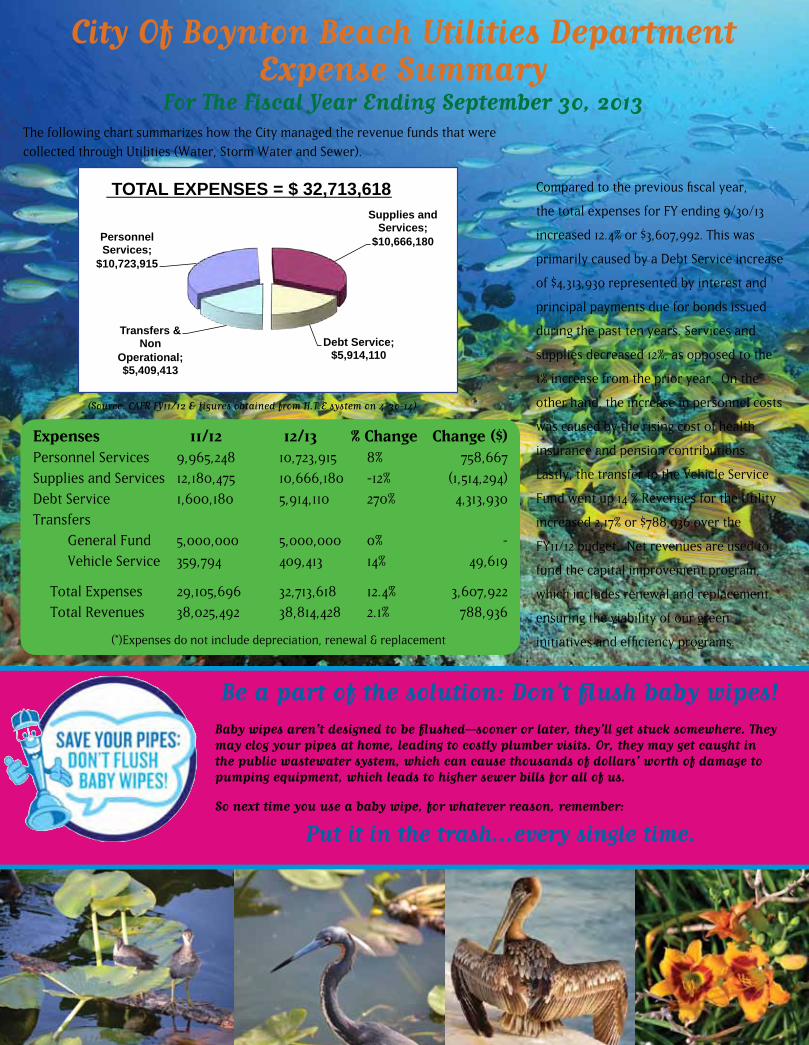
City Of Boynton Beach Utilities DepartmentExpense Summary
For The Fiscal Year Ending September 30, 2013
Compared to the previous fiscal year,
the total expenses for FY ending 9/30/13
increased 12.4% or $3,607,992. This was
primarily caused by a Debt Service increase
of $4,313,930 represented by interest and
principal payments due for bonds issued
during the past ten years. Services and
supplies decreased 12%, as opposed to the
1% increase from the prior year. On the
other hand, the increase in personnel costs
was caused by the rising cost of health
insurance and pension contributions.
Lastly, the transfer to the Vehicle Service
Fund went up 14 % Revenues for the Utility
increased 2.17% or $788,936 over the
FY11/12 budget. Net revenues are used to
fund the capital improvement program,
which includes renewal and replacement,
ensuring the viability of our green
initiatives and efficiency programs.
The following chart summarizes how the City managed the revenue funds that were
collected through Utilities (Water, Storm Water and Sewer).
Expenses 11/12 12/13 % Change Change ($)Personnel Services 9,965,248 10,723,915 8% 758,667
Supplies and Services 12,180,475 10,666,180 -12% (1,514,294)
Debt Service 1,600,180 5,914,110 270% 4,313,930
Transfers
General Fund 5,000,000 5,000,000 0% -
Vehicle Service 359,794 409,413 14% 49,619
Total Expenses 29,105,696 32,713,618 12.4% 3,607,922
Total Revenues 38,025,492 38,814,428 2.1% 788,936
(*)Expenses do not include depreciation, renewal & replacement
™
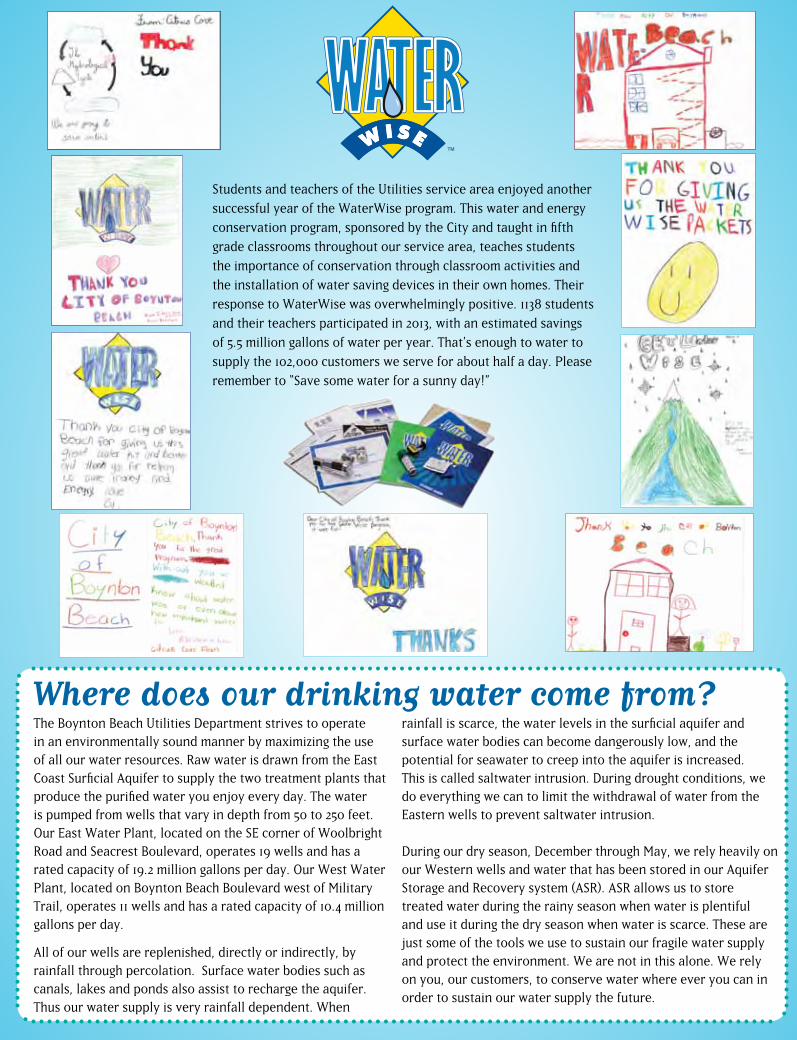
Students and teachers of the Utilities service area enjoyed another
successful year of the WaterWise program. This water and energy
conservation program, sponsored by the City and taught in fifth
grade classrooms throughout our service area, teaches students
the importance of conservation through classroom activities and
the installation of water saving devices in their own homes. Their
response to WaterWise was overwhelmingly positive. 1138 students
and their teachers participated in 2013, with an estimated savings
of 5.5 million gallons of water per year. That’s enough to water to
supply the 102,000 customers we serve for about half a day. Please
remember to “Save some water for a sunny day!”
There has been considerable progress on the important projects within our Capital Improvement Plan. We have started construction on the second stage of the raw water pipeline between our two plants along Woolbright Road, which should be completed by the middle of 2014. In addition, the design of the last phase from Congress Avenue to east of I-95 has now
ended, and work will begin sometime in the fall. Once this phase has been completed we will be ready to pump water from the western wellfield east to our Seacrest Boulevard plant.
An integral part of this project is the construction of an ion exchange resin plant at our West Plant to pretreat the
water coming east. There is progress on selecting the Design Build partnership that will work on this project. This work is being fast tracked to meet our permitting obligations and should be complete by early 2016. It will be the basis of our long term water supply strategy for the next 20 years.
Other long awaited projects are the two neighborhood improvement programs that have completed the design phase and are being put out for bid in 2014. The areas impacted are Lake Boynton Estates and the Central Seacrest area south of Boynton Beach Boulevard to Woolbright Road. Both projects include replacement of potable water mains and elimination of meters in the rear easements. There are some limited stormwater improvements in Lake Boynton Estates with more extensive work in Central Seacrest due to the local conditions.
In other areas there are smaller projects in the planning phase for water main replacement or stormwater management.
Capital Projects Update
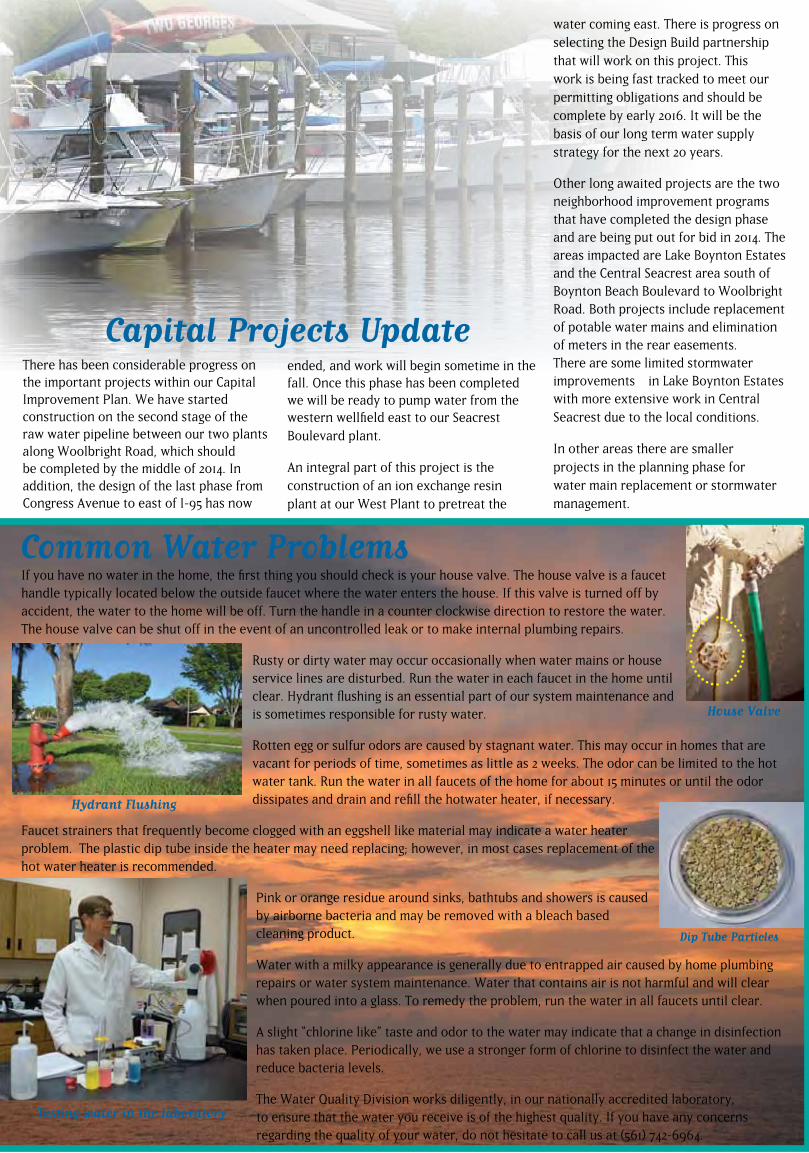
If you have no water in the home, the first thing you should check is your house valve. The house valve is a faucet handle typically located below the outside faucet where the water enters the house. If this valve is turned off by accident, the water to the home will be off. Turn the handle in a counter clockwise direction to restore the water. The house valve can be shut off in the event of an uncontrolled leak or to make internal plumbing repairs.
Rusty or dirty water may occur occasionally when water mains or house service lines are disturbed. Run the water in each faucet in the home until clear. Hydrant flushing is an essential part of our system maintenance and is sometimes responsible for rusty water.
Rotten egg or sulfur odors are caused by stagnant water. This may occur in homes that are vacant for periods of time, sometimes as little as 2 weeks. The odor can be limited to the hot water tank. Run the water in all faucets of the home for about 15 minutes or until the odor dissipates and drain and refill the hotwater heater, if necessary.
Faucet strainers that frequently become clogged with an eggshell like material may indicate a water heater problem. The plastic dip tube inside the heater may need replacing; however, in most cases replacement of the hot water heater is recommended.
Pink or orange residue around sinks, bathtubs and showers is caused by airborne bacteria and may be removed with a bleach based cleaning product.
Water with a milky appearance is generally due to entrapped air caused by home plumbing repairs or water system maintenance. Water that contains air is not harmful and will clear when poured into a glass. To remedy the problem, run the water in all faucets until clear.
A slight “chlorine like” taste and odor to the water may indicate that a change in disinfection has taken place. Periodically, we use a stronger form of chlorine to disinfect the water and reduce bacteria levels.
The Water Quality Division works diligently, in our nationally accredited laboratory, to ensure that the water you receive is of the highest quality. If you have any concerns regarding the quality of your water, do not hesitate to call us at (561) 742-6964.
Common Water Problems
House Valve
Hydrant Flushing
Dip Tube Particles
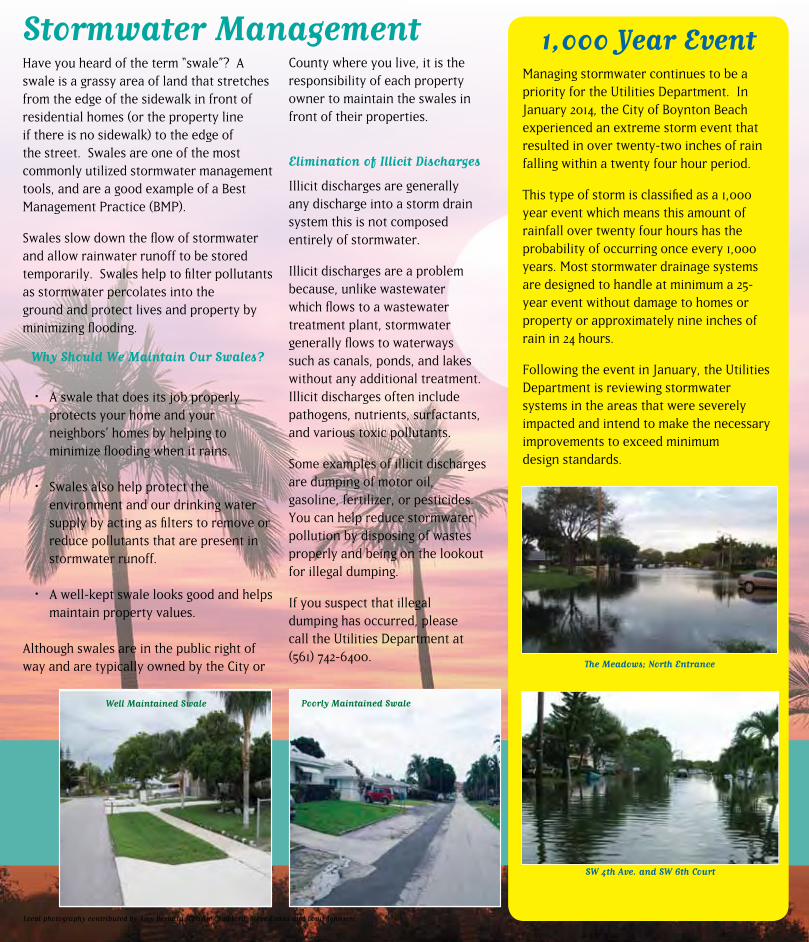
Have you heard of the term “swale”? A swale is a grassy area of land that stretches from the edge of the sidewalk in front of residential homes (or the property line if there is no sidewalk) to the edge of the street. Swales are one of the most commonly utilized stormwater management tools, and are a good example of a Best Management Practice (BMP).
Swales slow down the flow of stormwater and allow rainwater runoff to be stored temporarily. Swales help to filter pollutants as stormwater percolates into the ground and protect lives and property by minimizing flooding.
Why Should We Maintain Our Swales?
• A swale that does its job properly protects your home and your neighbors’ homes by helping to minimize flooding when it rains.
• Swales also help protect the environment and our drinking water supply by acting as filters to remove or reduce pollutants that are present in stormwater runoff.
• A well-kept swale looks good and helps maintain property values.
Although swales are in the public right of way and are typically owned by the City or
County where you live, it is the responsibility of each property owner to maintain the swales in front of their properties.
Elimination of Illicit Discharges
Illicit discharges are generally any discharge into a storm drain system this is not composed entirely of stormwater.
Illicit discharges are a problem because, unlike wastewater which flows to a wastewater treatment plant, stormwater generally flows to waterways such as canals, ponds, and lakes without any additional treatment. Illicit discharges often include pathogens, nutrients, surfactants, and various toxic pollutants.
Some examples of illicit discharges are dumping of motor oil, gasoline, fertilizer, or pesticides. You can help reduce stormwater pollution by disposing of wastes properly and being on the lookout for illegal dumping.
If you suspect that illegal dumping has occurred, please call the Utilities Department at (561) 742-6400.
ExpensesPersonnel Services 10,723,915$
Supplies and Services 10,666,180$ Debt Service 5,914,110$
Transfers & Non Operational 5,409,413$
32,713,618
Personnel Services;
$10,723,915
Supplies and Services;
$10,666,180
Debt Service; $5,914,110
Transfers & Non
Operational; $5,409,413
TOTAL EXPENSES = $ 32,713,618
Baby wipes aren’t designed to be flushed—sooner or later, they’ll get stuck somewhere. They may clog your pipes at home, leading to costly plumber visits. Or, they may get caught in the public wastewater system, which can cause thousands of dollars’ worth of damage to pumping equipment, which leads to higher sewer bills for all of us.
So next time you use a baby wipe, for whatever reason, remember:
Put it in the trash...every single time.
Be a part of the solution: Don’t flush baby wipes!
(Source: CAFR FY11/12 & figures obtained from H.T.E system on 4-30-14)
Testing water in the laboratory
The Boynton Beach Utilities Department strives to operate in an environmentally sound manner by maximizing the use of all our water resources. Raw water is drawn from the East Coast Surficial Aquifer to supply the two treatment plants that produce the purified water you enjoy every day. The water is pumped from wells that vary in depth from 50 to 250 feet. Our East Water Plant, located on the SE corner of Woolbright Road and Seacrest Boulevard, operates 19 wells and has a rated capacity of 19.2 million gallons per day. Our West Water Plant, located on Boynton Beach Boulevard west of Military Trail, operates 11 wells and has a rated capacity of 10.4 million gallons per day.
All of our wells are replenished, directly or indirectly, by rainfall through percolation. Surface water bodies such as canals, lakes and ponds also assist to recharge the aquifer. Thus our water supply is very rainfall dependent. When
Where does our drinking water come from? rainfall is scarce, the water levels in the surficial aquifer and surface water bodies can become dangerously low, and the potential for seawater to creep into the aquifer is increased. This is called saltwater intrusion. During drought conditions, we do everything we can to limit the withdrawal of water from the Eastern wells to prevent saltwater intrusion.
During our dry season, December through May, we rely heavily on our Western wells and water that has been stored in our Aquifer Storage and Recovery system (ASR). ASR allows us to store treated water during the rainy season when water is plentiful and use it during the dry season when water is scarce. These are just some of the tools we use to sustain our fragile water supply and protect the environment. We are not in this alone. We rely on you, our customers, to conserve water where ever you can in order to sustain our water supply the future.
Well Maintained Swale Poorly Maintained Swale
Managing stormwater continues to be a priority for the Utilities Department. In January 2014, the City of Boynton Beach experienced an extreme storm event that resulted in over twenty-two inches of rain falling within a twenty four hour period.
This type of storm is classified as a 1,000 year event which means this amount of rainfall over twenty four hours has the probability of occurring once every 1,000 years. Most stormwater drainage systems are designed to handle at minimum a 25-year event without damage to homes or property or approximately nine inches of rain in 24 hours.
Following the event in January, the Utilities Department is reviewing stormwater systems in the areas that were severely impacted and intend to make the necessary improvements to exceed minimum design standards.
The Meadows; North Entrance
SW 4th Ave. and SW 6th Court
1,000 Year Event
Local photography contributed by Amy Bernard, Charlie Crawford, Steve Evans and Louis Johnson.
Stormwater Management
City Of Boynton Beach Utilities DepartmentExpense Summary
For The Fiscal Year Ending September 30, 2013
Compared to the previous fiscal year,
the total expenses for FY ending 9/30/13
increased 12.4% or $3,607,992. This was
primarily caused by a Debt Service increase
of $4,313,930 represented by interest and
principal payments due for bonds issued
during the past ten years. Services and
supplies decreased 12%, as opposed to the
1% increase from the prior year. On the
other hand, the increase in personnel costs
was caused by the rising cost of health
insurance and pension contributions.
Lastly, the transfer to the Vehicle Service
Fund went up 14 % Revenues for the Utility
increased 2.17% or $788,936 over the
FY11/12 budget. Net revenues are used to
fund the capital improvement program,
which includes renewal and replacement,
ensuring the viability of our green
initiatives and efficiency programs.
The following chart summarizes how the City managed the revenue funds that were
collected through Utilities (Water, Storm Water and Sewer).
Expenses 11/12 12/13 % Change Change ($)Personnel Services 9,965,248 10,723,915 8% 758,667
Supplies and Services 12,180,475 10,666,180 -12% (1,514,294)
Debt Service 1,600,180 5,914,110 270% 4,313,930
Transfers
General Fund 5,000,000 5,000,000 0% -
Vehicle Service 359,794 409,413 14% 49,619
Total Expenses 29,105,696 32,713,618 12.4% 3,607,922
Total Revenues 38,025,492 38,814,428 2.1% 788,936
(*)Expenses do not include depreciation, renewal & replacement
™
Students and teachers of the Utilities service area enjoyed another
successful year of the WaterWise program. This water and energy
conservation program, sponsored by the City and taught in fifth
grade classrooms throughout our service area, teaches students
the importance of conservation through classroom activities and
the installation of water saving devices in their own homes. Their
response to WaterWise was overwhelmingly positive. 1138 students
and their teachers participated in 2013, with an estimated savings
of 5.5 million gallons of water per year. That’s enough to water to
supply the 102,000 customers we serve for about half a day. Please
remember to “Save some water for a sunny day!”
There has been considerable progress on the important projects within our Capital Improvement Plan. We have started construction on the second stage of the raw water pipeline between our two plants along Woolbright Road, which should be completed by the middle of 2014. In addition, the design of the last phase from Congress Avenue to east of I-95 has now
ended, and work will begin sometime in the fall. Once this phase has been completed we will be ready to pump water from the western wellfield east to our Seacrest Boulevard plant.
An integral part of this project is the construction of an ion exchange resin plant at our West Plant to pretreat the
water coming east. There is progress on selecting the Design Build partnership that will work on this project. This work is being fast tracked to meet our permitting obligations and should be complete by early 2016. It will be the basis of our long term water supply strategy for the next 20 years.
Other long awaited projects are the two neighborhood improvement programs that have completed the design phase and are being put out for bid in 2014. The areas impacted are Lake Boynton Estates and the Central Seacrest area south of Boynton Beach Boulevard to Woolbright Road. Both projects include replacement of potable water mains and elimination of meters in the rear easements. There are some limited stormwater improvements in Lake Boynton Estates with more extensive work in Central Seacrest due to the local conditions.
In other areas there are smaller projects in the planning phase for water main replacement or stormwater management.
Capital Projects Update
If you have no water in the home, the first thing you should check is your house valve. The house valve is a faucet handle typically located below the outside faucet where the water enters the house. If this valve is turned off by accident, the water to the home will be off. Turn the handle in a counter clockwise direction to restore the water. The house valve can be shut off in the event of an uncontrolled leak or to make internal plumbing repairs.
Rusty or dirty water may occur occasionally when water mains or house service lines are disturbed. Run the water in each faucet in the home until clear. Hydrant flushing is an essential part of our system maintenance and is sometimes responsible for rusty water.
Rotten egg or sulfur odors are caused by stagnant water. This may occur in homes that are vacant for periods of time, sometimes as little as 2 weeks. The odor can be limited to the hot water tank. Run the water in all faucets of the home for about 15 minutes or until the odor dissipates and drain and refill the hotwater heater, if necessary.
Faucet strainers that frequently become clogged with an eggshell like material may indicate a water heater problem. The plastic dip tube inside the heater may need replacing; however, in most cases replacement of the hot water heater is recommended.
Pink or orange residue around sinks, bathtubs and showers is caused by airborne bacteria and may be removed with a bleach based cleaning product.
Water with a milky appearance is generally due to entrapped air caused by home plumbing repairs or water system maintenance. Water that contains air is not harmful and will clear when poured into a glass. To remedy the problem, run the water in all faucets until clear.
A slight “chlorine like” taste and odor to the water may indicate that a change in disinfection has taken place. Periodically, we use a stronger form of chlorine to disinfect the water and reduce bacteria levels.
The Water Quality Division works diligently, in our nationally accredited laboratory, to ensure that the water you receive is of the highest quality. If you have any concerns regarding the quality of your water, do not hesitate to call us at (561) 742-6964.
Common Water Problems
House Valve
Hydrant Flushing
Dip Tube Particles
Have you heard of the term “swale”? A swale is a grassy area of land that stretches from the edge of the sidewalk in front of residential homes (or the property line if there is no sidewalk) to the edge of the street. Swales are one of the most commonly utilized stormwater management tools, and are a good example of a Best Management Practice (BMP).
Swales slow down the flow of stormwater and allow rainwater runoff to be stored temporarily. Swales help to filter pollutants as stormwater percolates into the ground and protect lives and property by minimizing flooding.
Why Should We Maintain Our Swales?
• A swale that does its job properly protects your home and your neighbors’ homes by helping to minimize flooding when it rains.
• Swales also help protect the environment and our drinking water supply by acting as filters to remove or reduce pollutants that are present in stormwater runoff.
• A well-kept swale looks good and helps maintain property values.
Although swales are in the public right of way and are typically owned by the City or
County where you live, it is the responsibility of each property owner to maintain the swales in front of their properties.
Elimination of Illicit Discharges
Illicit discharges are generally any discharge into a storm drain system this is not composed entirely of stormwater.
Illicit discharges are a problem because, unlike wastewater which flows to a wastewater treatment plant, stormwater generally flows to waterways such as canals, ponds, and lakes without any additional treatment. Illicit discharges often include pathogens, nutrients, surfactants, and various toxic pollutants.
Some examples of illicit discharges are dumping of motor oil, gasoline, fertilizer, or pesticides. You can help reduce stormwater pollution by disposing of wastes properly and being on the lookout for illegal dumping.
If you suspect that illegal dumping has occurred, please call the Utilities Department at (561) 742-6400.
ExpensesPersonnel Services 10,723,915$
Supplies and Services 10,666,180$ Debt Service 5,914,110$
Transfers & Non Operational 5,409,413$
32,713,618
Personnel Services;
$10,723,915
Supplies and Services;
$10,666,180
Debt Service; $5,914,110
Transfers & Non
Operational; $5,409,413
TOTAL EXPENSES = $ 32,713,618
Baby wipes aren’t designed to be flushed—sooner or later, they’ll get stuck somewhere. They may clog your pipes at home, leading to costly plumber visits. Or, they may get caught in the public wastewater system, which can cause thousands of dollars’ worth of damage to pumping equipment, which leads to higher sewer bills for all of us.
So next time you use a baby wipe, for whatever reason, remember:
Put it in the trash...every single time.
Be a part of the solution: Don’t flush baby wipes!
(Source: CAFR FY11/12 & figures obtained from H.T.E system on 4-30-14)
Testing water in the laboratory
The Boynton Beach Utilities Department strives to operate in an environmentally sound manner by maximizing the use of all our water resources. Raw water is drawn from the East Coast Surficial Aquifer to supply the two treatment plants that produce the purified water you enjoy every day. The water is pumped from wells that vary in depth from 50 to 250 feet. Our East Water Plant, located on the SE corner of Woolbright Road and Seacrest Boulevard, operates 19 wells and has a rated capacity of 19.2 million gallons per day. Our West Water Plant, located on Boynton Beach Boulevard west of Military Trail, operates 11 wells and has a rated capacity of 10.4 million gallons per day.
All of our wells are replenished, directly or indirectly, by rainfall through percolation. Surface water bodies such as canals, lakes and ponds also assist to recharge the aquifer. Thus our water supply is very rainfall dependent. When
Where does our drinking water come from? rainfall is scarce, the water levels in the surficial aquifer and surface water bodies can become dangerously low, and the potential for seawater to creep into the aquifer is increased. This is called saltwater intrusion. During drought conditions, we do everything we can to limit the withdrawal of water from the Eastern wells to prevent saltwater intrusion.
During our dry season, December through May, we rely heavily on our Western wells and water that has been stored in our Aquifer Storage and Recovery system (ASR). ASR allows us to store treated water during the rainy season when water is plentiful and use it during the dry season when water is scarce. These are just some of the tools we use to sustain our fragile water supply and protect the environment. We are not in this alone. We rely on you, our customers, to conserve water where ever you can in order to sustain our water supply the future.
Well Maintained Swale Poorly Maintained Swale
Managing stormwater continues to be a priority for the Utilities Department. In January 2014, the City of Boynton Beach experienced an extreme storm event that resulted in over twenty-two inches of rain falling within a twenty four hour period.
This type of storm is classified as a 1,000 year event which means this amount of rainfall over twenty four hours has the probability of occurring once every 1,000 years. Most stormwater drainage systems are designed to handle at minimum a 25-year event without damage to homes or property or approximately nine inches of rain in 24 hours.
Following the event in January, the Utilities Department is reviewing stormwater systems in the areas that were severely impacted and intend to make the necessary improvements to exceed minimum design standards.
The Meadows; North Entrance
SW 4th Ave. and SW 6th Court
1,000 Year Event
Local photography contributed by Amy Bernard, Charlie Crawford, Steve Evans and Louis Johnson.