
lhncbc.nlm.nih.gov 05 28 … · Web viewCurriculum Vitae. 2013-02-05 CLEMENT JOSEPH MCDONALD, M.D.
Upload
katharine-rynoCategory
view
215download
0
2013 Summer Overview
Jeffrey S McDonaldPower System OperatorCUEASan Diego, CAJune 6, 2013
ISO history
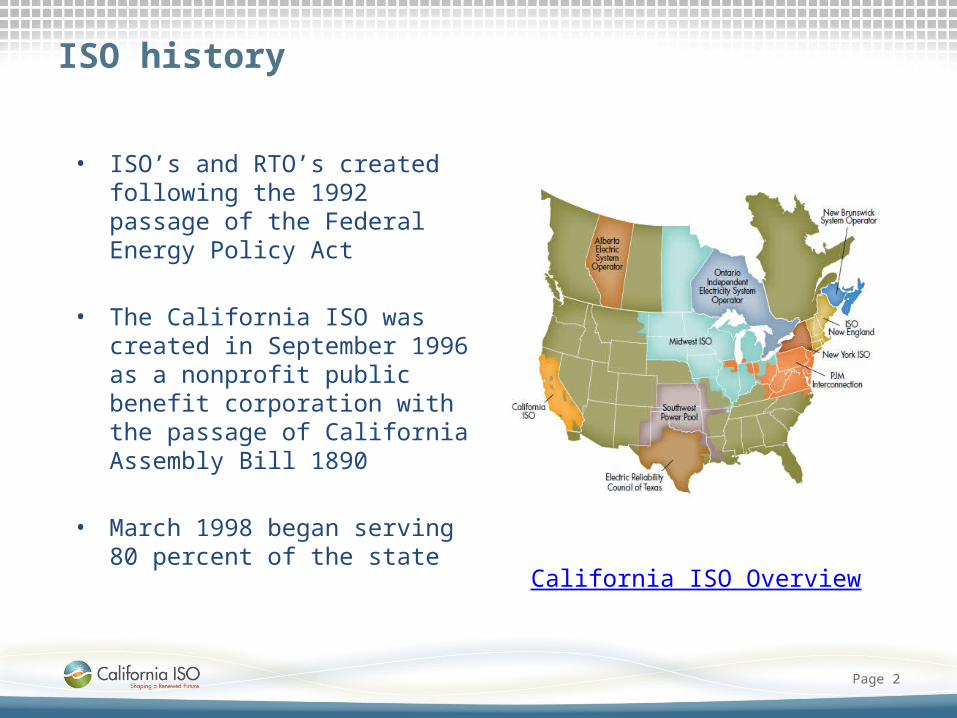
• ISO’s and RTO’s created following the 1992 passage of the Federal Energy Policy Act
• The California ISO was created in September 1996 as a nonprofit public benefit corporation with the passage of California Assembly Bill 1890
• March 1998 began serving 80 percent of the state
Page 2
California ISO Overview
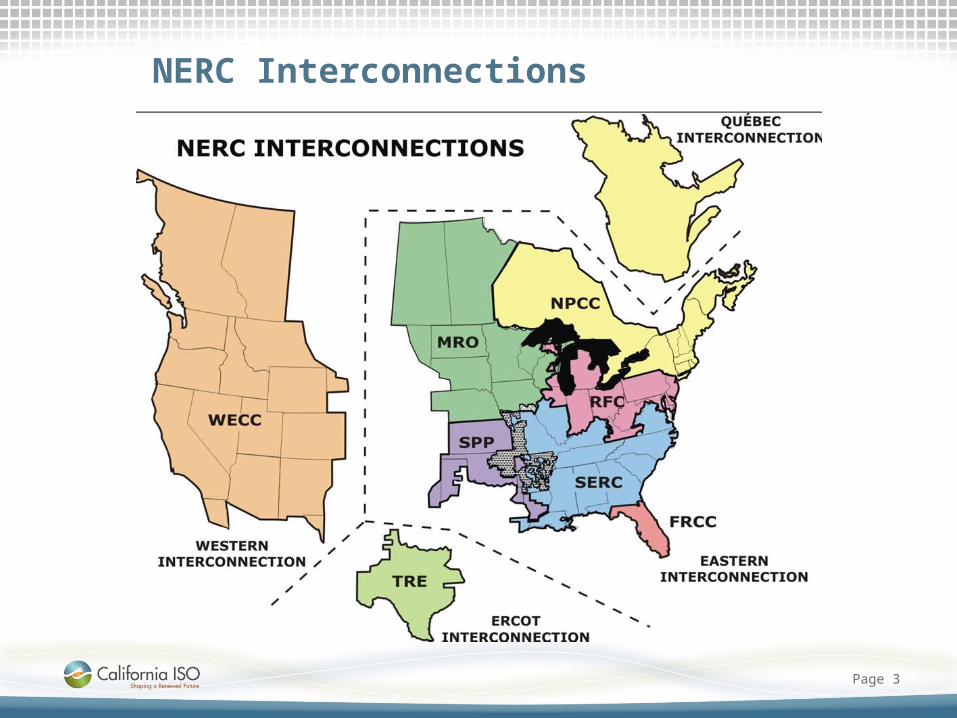
NERC Interconnections
Page 3

38 Balancing Authorities in the West
Page 4
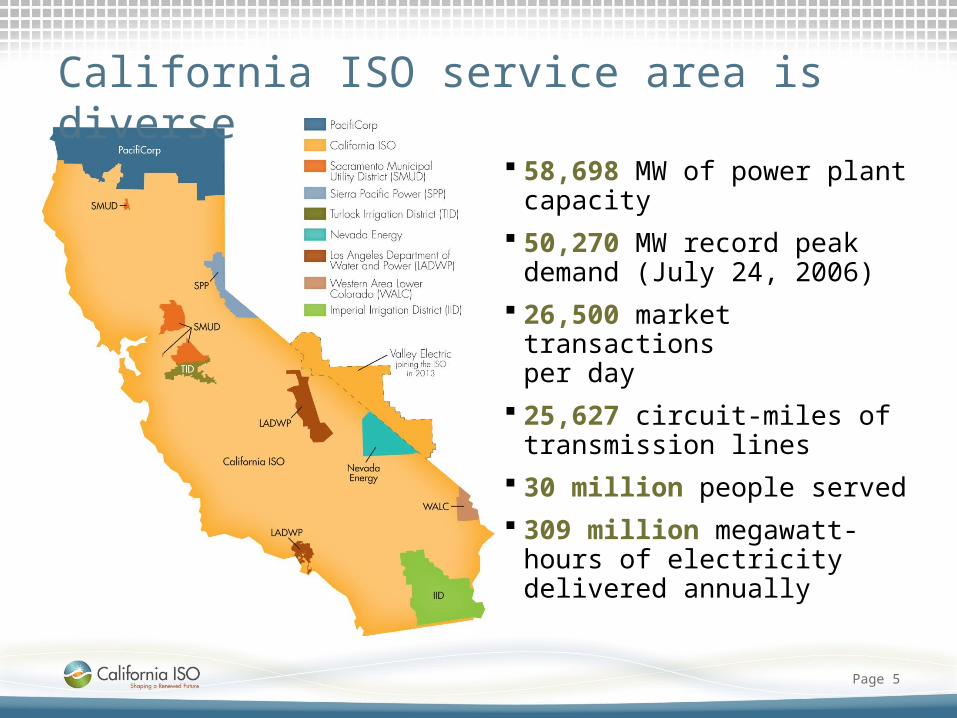
California ISO service area is diverse
58,698 MW of power plant capacity
50,270 MW record peak demand (July 24, 2006)
26,500 market transactions per day
25,627 circuit-miles of transmission lines
30 million people served
309 million megawatt-hours of electricity delivered annually
Page 5

Reliability Markets
• Day Ahead– opens 7 days prior to the operating day
– closes at 10 a.m. the day before electricity flows.
• Real Time– Hour Ahead Scheduling Process (HASP)
• Prior to real-time (RT) market, schedule energy and ancillary services for static interchange for 24 individual hours
– Real-time market (RTM)• runs every five minutes
Page 6
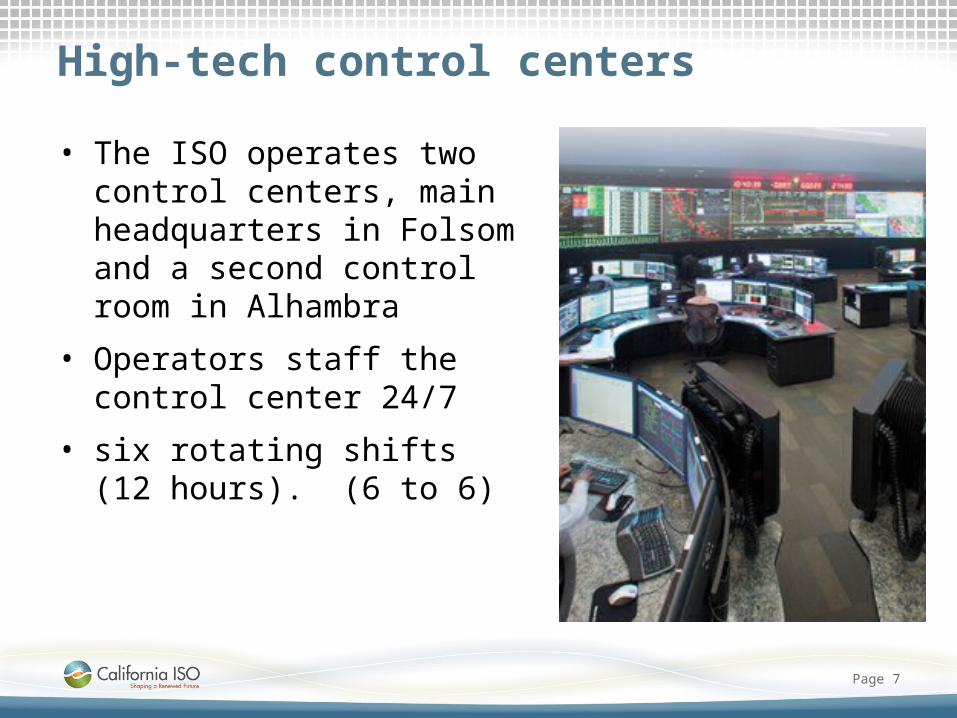
High-tech control centers
• The ISO operates two control centers, main headquarters in Folsom and a second control room in Alhambra
• Operators staff the control center 24/7
• six rotating shifts (12 hours). (6 to 6)
Page 7

Historical ISO Peak Demand
Slide 8

2013 ISO 1-in 2 Peak Load Forecast
• The ISO peak demand is projected to reach 47,413 MW
• 738 MW more than the actual peak 46,675 MW recorded in 2012 (2.3 percent higher)
• 3,393 MW of new generation since last year’s report
2013 Summer Loads Resources Assessment
Slide 9

Slide 10
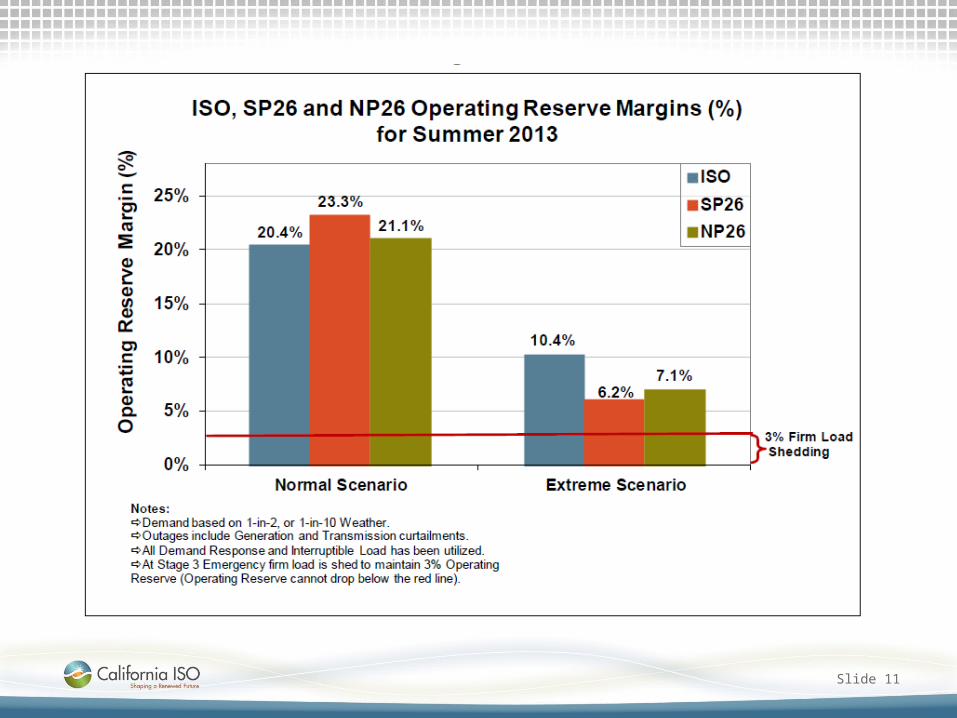
Slide 11
Slide 12
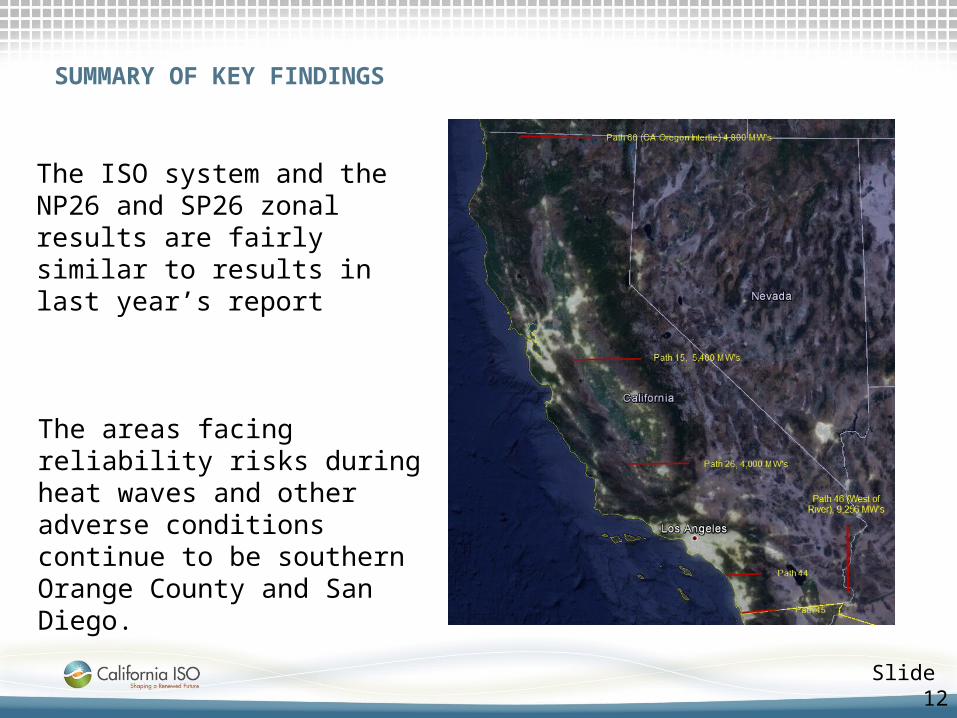
The ISO system and the NP26 and SP26 zonal results are fairly similar to results in last year’s report
The areas facing reliability risks during heat waves and other adverse conditions continue to be southern Orange County and San Diego.
SUMMARY OF KEY FINDINGS

Overview of the area and summer reliability challenges without the San Onofre nuclear power plant
Slide 13

Key actions to mitigate local reliability concerns in southern Orange County and San Diego:
• Conversion of Huntington Beach Units 3 & 4 to Synchronous Condensers
• Installation of additional reactive support near SONGS –installation of 80 MVAR capacitors at each of the Santiago and Johanna substations and a 160 MVAR capacitor at the Viejo substation.
• Barre-Ellis reconfiguration –reconfiguring the Barre-Ellis 220 kilovolt (kV) lines from the existing two circuits to four.
Slide 14
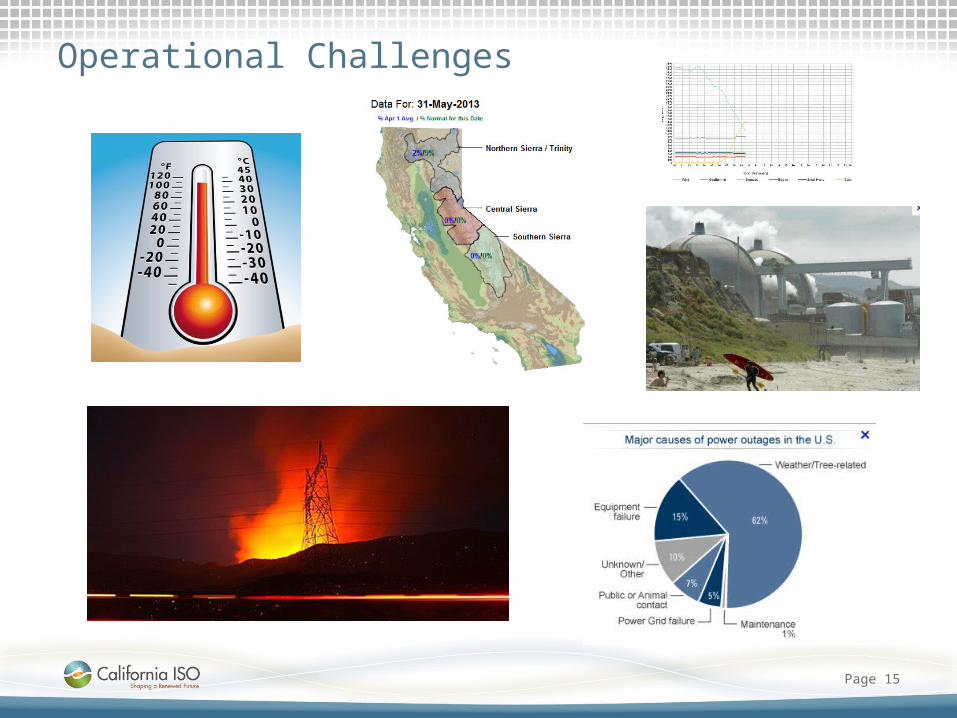
Operational Challenges
Page 15
System Emergency (Procedure 4420)
• Restricted Maintenance Operations– cancel or postpone any or all or work to preserve
overall System Reliability
• Transmission Emergency– any event that threatens, harms, or limits the
capabilities of any element of the transmission grid and overall grid reliability
• OP 4420
Page 16

System Emergency (Procedure 4420)
• Alert Notice– issued by 1500 hrs the day before anticipated
operating reserve deficiencies
• Warning Notice– issued when the Real-time Market run results indicate
that Operating Reserves are anticipated to be less required
Page 17
System Emergency (Procedure 4420)
• Emergency Stage 1– Operating Reserve shortfalls exist or are forecast to occur, and
available market and non-market resources are insufficient to maintain Operating Reserve requirements
• Emergency Stage 2– cannot maintain its Non-Spinning Reserve requirement
• Emergency Stage 3– Spinning Reserve portion depletes, or is anticipated to
depleted
Page 18
Questions?
Jeffrey S McDonald
Inte
rreg
iona
l Coo
rdin
atio
n Te
am
Fac
ilita
tors