2013 Strategic Direction and 2012 Full Year Results · (PBI No. 14/18/PBI/2012 dated 28November...
44
Untuk Anda, Bisa Slide 1 2013 Strategic Direction and 2012 Full Year Results 18 February 2013
Transcript of 2013 Strategic Direction and 2012 Full Year Results · (PBI No. 14/18/PBI/2012 dated 28November...

Untuk Anda, Bisa
Slide 1
2013 Strategic Direction
and
2012 Full Year Results
18 February 2013

Untuk Anda, Bisa
Slide 2
Agenda
I. Economic Outlook
II. Indonesian Banking Industry
III. Danamon Medium Term Strategic Priorities
a) Micro Lending business
b) Auto Financing business
c) Funding Franchise
d) Cash Management and Trade Finance
e) Liquidity
IV. Risk Management
V. Full Year 2012 Results

Untuk Anda, Bisa
Slide 3
2013 Operating Environment Outlook
• GDP growth : 6.3% (2012: 6.2%)
• GDP contributor : Domestic demand will still be the main driver. Meanwhile investment will remain strong as Indonesia’s fundamental economy will recover.
GDP
• 2012 headline inflation was 4.3%, and this year it is expected to be moderately higher due to the rise of some administered price (i.e. electricity tariff rate hike, minimum wage hike, subsidized fuel price rise).
• Estimated inflation to reach 6.17% (with subsidized fuel price hike), or 5.47% if there such hike does not happen.
Inflation
Interest
rate
Rupiah
• The central bank is expected to raise its benchmark interest rate by 25 bps to 6% if the inflation rate falls above BI’s upper target of 3.5-5.5%.
• Possible recovery in export may be positive for the improvement in CA deficit. Hence, Rupiah is expected to strengthen to Rp 9502/USD by year end or Rp 9,541/USD on average.
Source: Danamon estimates, CEIC, BPS

Untuk Anda, Bisa
Slide 4
Economics Indicators
Indonesia 2010 2011 2012 2013E 2014E
National Account
Real GDP (% YoY) 6.2 6.5 6.2 6.3 6.6
Domestic demand ex. Inventory (% y-o-y) 5.3 5.7 6.2 6.2 6.4
Real Consumption: Private (% y-o-y) 4.7 4.7 5.3 5.3 5.0
Real Gross Fixed Capital Formation (% y-o-y) 8.5 8.8 9.8 9.7 9.0
GDP (US$ bn) – nominal 709 847 879 1,002 1,175
GDP per Capita (US$) – nominal 2,983 3,514 3,596 4,044 4,680
Open Unemployment Rate (%) 7.1 6.6 6.3 6.5 6.2
External Sector
Exports, fob (% YoY, US$ bn) 32.1 26.9 -6.3 6.4 14.5
Imports, fob (% YoY, US$ bn) 43.7 30.8 8.3 7.5 11.1
Central government debt (% of GDP) 26.1 24.6 23.1 22.0 21.2
International Reserves – IRFCL (US$ bn) 96.2 110.1 112.9 115.1 120.0
Reserve cover (Imports and external debt) 7.1 6.3 6.1 6.4 6.6
Currency / US$ (Year-end) 8,991 9,068 9,670 9,502 9,252
Other
BI Policy Rate (% year end) 6.50 6.00 5.75 6.00 6.00
Consumer prices (% year end) 6.96 3.79 4.30 6.17 4.18
Fiscal balance (% of GDP; FY) -0.73 -1.16 -1.77 -1.50 -1.80
Source: BPS, Bank Indonesia, Danamon Estimates

Untuk Anda, Bisa
Slide 5
I. Economic Outlook
II. Indonesian Banking Industry
III. Danamon Medium Term Strategic Priorities
a) Micro Lending business
b) Auto Financing business
c) Funding Franchise
d) Cash Management and Trade Finance
e) Liquidity
IV. Risk Management
V. Full Year 2012 Results
Agenda

Untuk Anda, Bisa
Slide 6
Liquidity tightens in light of slower deposit growth
2009 2010 2011 2012
SOEPrivateIndividual
17% 19% 14%16%
12%23%
27%
18%
-3%
25%
15%
21%
CAGR 3 Yrs
20%
16%
23%
Private includes financial, non financial & non profit org
1,914
2,305
2,736
3,164
Funding by segment (Rp Tn)
• Loan growth continue outpacing deposit growth, prompting marginal CoF rise.
Source: Bank Indonesia
SOE : BUMN & BUMD (Financial & Non Fin Corp)
Private : Financial & Non Fin Corp, including Social org, Foundation & Cooperation)
Individual : Individual
Source : SPI (2012 use Sep 2012 data)
Note : Top 4: Mandiri, BCA, BRI, BNI. 2nd Tiers: CIMB, Danamon, BII, Panin, Permata, BTN.
23%25%
10%
23%
16%19%19%13%
2009 2010 2011 2012
Loan growth
Deposit growth
Loan growth and deposit growth slowed
down in 2012.
65% 67%77% 79%
89% 92% 98%
83%82%76%
73%
102%
2009 2010 2011 Sep-12
Industry
Top 4
2nd tiers
LDR - Excluding Top 4, LDR of 2nd
Tier banks was 102%

18.215.4
14.3 14.0 13.614.612.5
13.5
9.1 8.8
5.23.3
3.12.23.7
0.51.8 1.3 1.0 1.2
BDI BNI BRI BTN BCA Panin Mandiri CIMB BII Permata
14.0%12.3%
15.6%15.7%15.2%15.2%15.9%
17.2%18.7% 17.2%
10.9%11.7%17.6%
22.3%24.3%
17.6%
32.6%17.0%15.5%
11.5%
• Capital injection especially in the form of sub-debt (under T2) is expected to continue. Thus, impacting ROE formation particularly those banks with higher T2.
2.7
1.41.22.32.82.8
1.5
3.8
2.0 1.5
16.219.7
36.919.1
29.215.6
26.6 23.316.2 18.9
BDI BNI BRI BTN BCA Panin Mandiri CIMB BII Permata
Core capital continue to decline in supporting growth
over the years
Tier 1 & Tier 2 Capital
(%) September 2012
ROE & ROA
(%) September 2012
◄ T2
T 1 treshold: 12%
◄ NPAT /
(T1+T2)
◄ ROA
◄ ROE
◄ CAR
Source : Bank Indonesia, bank reports
Source : Bank Indonesia, bank reports
◄ T1
Untuk Anda, Bisa
Slide 8
Regulation: Capital based on risk profile and Business
Activity & Branch Networking(PBI No. 14/18/PBI/2012 dated 28 November 2012, PBI No. 14/26/PBI/2012 dated 27 Dec 2012)
New rule
1. CAR minimum requirement no longer 8% but based on bank’s risk profile
2. Perform Internal Capital Adequacy Assessment Process (ICAAP) and submit the report every 6months (Jun & Dec period to be submitted on 31 Jan & 31 Jul)
3. BI Supervisory will perform Supervisory Review and Evaluation Process (SREP)
CAR Minimum Requirement
Capital based
on risk profile
Risk Profile CAR Min
1 - Low 8%
2 - Low to Moderate 9% - < 10%
3 - Moderate 10% - < 11%
4 - Moderate to High & 5 - High 11% - 14%
Danamon is under Low to Moderate
Business
Activity &
Branch
Networking
Bank is categorized into 4 “BUKU = Bank Umum berdasarkan Kegiatan Usaha” (commercial
bank by business category) as follows:
Sharia Units : “BUKU” shall be referred to the “BUKU” of its conventional bank
“BUKU” Tier 1 Capital1 < Rp 1 Tr i l l io n2 Rp 1 Tr i l l io n- < Rp 5 T r i l l io n3 Rp 5 Tr i l l io n- < Rp 3 0 T r i l l io n4≥
Rp 3 0 T r i l l io n Danamon is under “BUKU 3”
Minimum 65% loans and financing to productive sectors for BUKU 3
Effective date : Jun 2016

Untuk Anda, Bisa
Slide 9
Regulation: Business Activity & Branch Networking cont’
Business
Activity &
Branch
Networking
Branch
opening
requirement
Standard
investment
cost
� Rated “3” (fairly sound), or better
� Have adequate core (tier 1) capital
� Adhere to branch distribution ratio (for every 3 branch in zone 1 or 2, must have1 branch in zone 5 or 6)
� Lending to SME >10%, lending to SME and micro >20%
� Full branch/regional offices Rp 10bn� Sub-branch/functional offices Rp 4bn *)� Cash offices Rp 2bn
*) Functional offices which disburse lending to SME is excluded from capital requirement
Effective
Date
� 2 Jan 2013; transition period ends June 2016� Banks have to submit action plan to BI by end of March 2013 (to be
endorsed by BI)� Endorsed action plan to be incorporated in the revised RBB (to be submitted
by June 2013)
Zoning and
Coefficient Sulawesi,
Maluku, West
Papua
Sumatra,
Kalimantan,
Sulawesi,
Papua
Sumatra,
Kalimantan,
Sulawesi,
Papua
East
Kalimantan,
Riau,
N.Sumatra
Java, Bali,
Banten
Jakarta,
Oversea
s
Area
Coefficient
Zone
0.512345
Zone 6Zone 5Zone 4Zone 3Zone 2Zone 1
Capital
Allocation
� Formula: Standard Investment Cost x Coefficient
� Sample: 1 full branch Zone 1 : Rp 10 bn x 5 = Rp 50 bn / branch

Untuk Anda, Bisa
Slide 10
Regulation: Down Payment for Mortgage and Auto
• BI and Bapepam issued new ruling on the minimum down payment for vehicle financing and LTV for mortgage
� In March 2012, BI (through its circular letter No. 14/10/DPNP dated 15 March 2012) and Bapepam (through press release No. 53/HMS/2012 dated 16 March 2012) each issued a different set of ruling regarding the minimum down payment for auto loans as summarized below:
� New issued rule of SE BI No.14/33/DPbS dated 27 Nov 2012 re: Financing Product for Mortgage and Automotive for Syariah Commercial Bank and Syariah Unit effective : 1 April 2013.
� BI also determined the maximum loan to value (LTV) for mortgage of 70%.
� The above requirement has been effective since 15 June 2012.
Type of vehicle BI Bapepam Difference
Two wheels min. 25% min. 20% 5%
Four wheels - productive min. 20% min. 20% -
Four wheels - non productive min. 30% min. 25% 5%
DP for
Conventional
and Shariah
Financing

Untuk Anda, Bisa
Slide 11
I. Economic Outlook
II. Indonesian Banking Industry
III. Danamon Medium Term Strategic Priorities
a) Micro Lending business
b) Auto Financing business
c) Funding Franchise
d) Cash Management and Trade Finance
e) Liquidity
IV. Risk Management
V. Full Year 2012 Results
Agenda

Untuk Anda, Bisa
Slide 12
Funding
2013 – 2015 Strategic Priorities
1
Milestones
Critical to build primary deposits for stable funding
� To build primary deposits : 50% CASA target to sustain loan growth and lower marginal COF than the 2nd tier banks
� To leverage existing network within BDI and subs for deposit gathering, new investments on branches and alt channels need to be carefully calibrated
� Continue to invest in creating a sustainable business model to capture more market share
� Balance the growth with sustainable profitability
� Focus on efficiency and productivity become critical as external factor can’t be avoided
Leadership
in Mass
Market
2
To Sustain High Margin Business > 50% of loans

Untuk Anda, Bisa
Slide 13
2013 – 2015 Strategic Priorities
� Right sizing head counts across LoBs and support group
� Improve business operation efficiency and promoteproductivity
� Ensure optimization of IT investments
Comprehensive People and Operating Strategies
Cost
Discipline to
sustain C/I
below 50%
3
Milestones
� Continue to gain market share in medium size customer segment with sustainable risk adjusted return
� To boost fee based income via cross-sell, bancassurance, trade finance, FX and others
To Become Customer’s Top of Mind
Cont.
to grow non-
mass market
& fee based
income
4

Untuk Anda, Bisa
Slide 14
2013 – 2015 Strategic Priorities
� Maintain prudent loan origination and customer selection criteria
� Step up fraud prevention measures
� Enhancecollection and recovery capacities
� Initiate quantitative rating model
“Through the Cycles” Maintain Assets Quality
Milestones
Maintain
Asset Quality
5

Untuk Anda, Bisa
Slide 15
1.2%
1.6%
2.1%
2.8%
1.6%
2.1%
2.4%
1.8%
Mar-
10
Jun-
10
Sep-
10
Dec-
10
Mar-
11
Jun-
11
Sep-
11
Dec-
11
Mar-
12
Jun-
12
Sep-
12
Dec-
12
East Indonesia Java Sumatera Total
3.9%
4.6%
5.9%
6.6%
4.8%
4.0%
5.4% 5.3%
Mar-
10
Jun-
10
Sep-
10
Dec-
10
Mar-
11
Jun-
11
Sep-
11
Dec-
11
Mar-
12
Jun-
12
Sep-
12
Dec-
12
East Indonesia Java Sumatera Total
DSP : Growth with improved asset quality
DSP Y-Y Growth
DSP - Curr - 30DSP - NPL
• Growth
� Robust growth at Ex Java area.
Sumatra
E. Ind
Java
TotalJavaTotalSumatra
E. Ind
• Asset quality
� Asset quality improved across the country despite Java slow down.
70.8%
17.3%
24.4% 24.4%29.5%
-1.1%
13.0%7.2%
32.0%
4.5%
21.2%14.2%
East Indonesia Java Sumatera Total
2010
2011
2012

Untuk Anda, Bisa
Slide 16
Solusi Modal (Rp bn)
1,0781,200
1,560
2010 2011 2012
DSP : 2013 Strategies through various business model
Agri (Rp bn)
615
1,380
2010 2011 2012
Strategic Alliance (Rp bn)
652
1,237
2010 2011 2012
11%30%
124%
Ex Java
• Continue growth momentum• Special sales force for small to upper tier micro• Continue Agri including adding new sectors
Java
• Combine branches within the same coverage area
• Longer term – redesign distribution channel in urban area with “Hub and Spoke”
• Remedial action for problem branches �Double team
• Special sales force for small to upper tier micro• Productivity improvement initiative
90%

Untuk Anda, Bisa
Slide 17
17.2
8.7
20.4
12.2
19.4
13.1
25.9
32.6 32.4
2W 4W Total
2010 2011 2012
CAGR: 22%
CAGR: 6%
CAGR:12%
ADMF 2012: Stability in the midst of uncertainties
Auto – 4W New Unit SoldIn 000 units
Auto – 2W New Unit SoldIn 000 units
7,3738,044
7,141
26%-11%9%
2010 2011 2012
Units sold (thousand) Industry YoY Growth
764894
1,109
57%24%17%
2010 2011 2012
Units sold (thousand) Industry YoY Growth
• 2W market is more affected than 4W as DP rule was imposed. 4W still booked robust growth due to less price sensitive buyers.
• In 2012, total industry growth was -9% compared to 10% expansion in 2011.
• ADMF new financing was relatively stable amid challenging auto industry growth.
New FinancingIn Rp Tn
ADMFDSP RB TF/FI Liq
CAGR: -2% CAGR: 21%
Untuk Anda, Bisa
Slide 18
51.162.9
15.2 10.29.6
54.2
115.7
8.56.1
49.6
India
Malaysia
Thailand
Indonesia
Singapore
20042011
Sustainable funding to cater growth opportunities
Density – MotorcycleNo of Population/Motorcycle owner Density - Car
No of Population/Car wner
21.1
64.3
4.7
54.4
35.3
9.4
31.1
11.93.6 5.5
India
Malaysia
Thailand
Indonesia
Singapore
2004
2011
Managed Receivables * In Rp Tn
• Growth opportunities: Indonesia’s auto penetration was still lower compared to neighbouring countries.
• Continuously grows through long term funding with fixed rate on the back of tightening liquidity that prompts higher CoF.
* Excluding transaction costs directly attributable to the origination
of financing accounts.
ADMFDSP RB TF/FI Liq
48%
29%17%
52%71%
83%
2010 2011 2012
Joint Financing
Self Financing
28.9
39.1
43.2

Untuk Anda, Bisa
Slide 19
CASA growth through introduction of programs
and relevant propositions to customers
RBDSP ADMF TF/FI Liq
27,27023,43921,433
15,85412,994
10,972
2010 2011 2012
CASA
In Rp bn
472488
542
2010 2011 2012
1654
Network
19
106
2010 2011 2012
Danamon Online Banking (No of Trx)
In mio
• CASA growth of 24% for the past 2 years
• Accelerate migration of transactions to low cost channels through a secure and innovative E-Banking proposition
CA
SA
36,433
9%
16%
18%
22%
43,124
32,405
12%
18%
90%66%

Untuk Anda, Bisa
Slide 20
2012 Trade Finance Highlights
TF/FiDSP ADMF RB Liq
• Awarded: “Best Trade Finance Bank in Indonesia” from the International Trade magazine, Global Finance, for eight consecutive years since 2005 and from Global Trade Review Magazine for the second times since 2011.
• Portfolio reached Rp 6.8 tn with a significant 54% YoY growth.
• New launch of Trade Service Point at Port (TSPP) serving Import and Export Tax Payment as well as B/L endorsement, has been launched in several strategic locations.
Trade Finance - On B/S
Outstanding (IDR Bn)
6,843
4,4403,391
2010 2011 2012
Trade Finance - Off B/S
Outstanding (IDR Bn)
4,172 5,0795,729
2010 2011 2012
31%
54%
22%
13%

Untuk Anda, Bisa
Slide 21
2012 Cash Management Highlight
• Current Account portfolio reached Rp 15.9 tn, significantly grew by 22% year on year.
• While on Cash Management Internet Banking users (cash@work), showing a continuous growth of 30% year on year.
• In 2012, Bank Danamon has launched a new module in cash@work :
• Financial Supply Chain � Facility that handles payment transaction between Sellers and its Buyers within the same supply chain, upstream or downstream through a single integrated electronic platform cash@work.
• ERP Direct Payment � Facility that connect customer’s ERP system with Danamon’s system which enables customer to send out payment instruction and retrieve account balance from Danamon seamlessly.
Current Account Balance
(IDR Bn)
15,854
12,99410,972
2010 2011 2012
Cash Management
(cash@work) Users
6,357
4,9044,369
2010 2011 2012
TF/FiDSP ADMF RB Liq
18%
22%
12%
30%

Untuk Anda, Bisa
Slide 22
Growth underpinned by ample liquidity
LiqDSP ADMF RB TF/FI
Key
Initiatives • Continue to support the assets growth with
prudent liquidity management.
• Evaluate accessing the off-shore markets to secure long term funding with maturity greater than 1 year for the Bank and Adira Finance throughout different structures
• Total liquid assets rose 8% to Rp 30.3 trillioncompared to last year.
• In order to prevent the Bank would face liquidity problems during a stress situation the Bank has established a Contingency Funding Plan (CFP), which is discussed periodically by the Senior Management.
• The Loans-to-Deposit (LDR) was 100.6%. The Loan to Funding, which includes Capital, bonds and other stable professional funding stand at 89.2% as of December 31st, 2012
• The consolidated professional funding was Rp 16 trillion or 15% of the total third parties funding.
Achievements
86.2%86.0% 89.2%
100.6%98.3%93.8%
2010 2011 2012
Loan to Funding LDR
LDR and Loan to Funding
87% 84% 85%
13% 16% 15%
2010 2011 2012
L o n g Te r m Fu n d i n gCu s t. D e p o s i tFunding Composition (Rp tn)
93 105 108

Untuk Anda, Bisa
Slide 23
I. Economic Outlook
II. Indonesian Banking Industry
III. Danamon Medium Term Strategic Priorities
a) Micro Lending business
b) Auto Financing business
c) Funding Franchise
d) Cash Management and Trade Finance
e) Liquidity
IV. Risk Management
V. Full Year 2012 Results
Agenda

Untuk Anda, Bisa
Slide 24
Risk Management : 2012 achievements and strategies
Credit Risk Management
• Focus on Credit Quality and Plan Metrics
• Risk rating models and scorecards – revalidated and launched in key businesses
• Preparing strong and solid team, developing risk awareness culture, eases career path and developing training for Risk Academy
• Build centralized Risk data warehouse consolidating all the bank-wide database
Oprisk & Fraud Management
• Transform control-based into risk-based management approach
• Implement ISO 22301 on Business Continuity Management System
• Improving fraud early detection strategy based on uniqueness of each LOB
Market Risk Management
Implement a new ALM System to enhance
liquidity monitoring as well as analysis
Achievements in 2012
• Overall Portfolio continued to improve especially NPL and COC.
• Awarded The Best Bank with Risk Management Education" program, among National Banks with assets over Rp 100 trillion by Business Review Magazine-IdekuGroup)
2013 Initiatives
Untuk Anda, Bisa
Slide 25
I. Economic Outlook
II. Indonesian Banking Industry
III. Danamon Medium Term Strategic Priorities
a) Micro Lending business
b) Auto Financing business
c) Funding Franchise
d) Cash Management and Trade Finance
e) Liquidity
IV. Risk Management
V. Full Year 2012 Results
Agenda

Untuk Anda, Bisa
Slide 26
Highlights Full Year 2012 Results
• Total loans rose 14% to Rp 116 trillion, driven by mass market and SMEC segments, that grew 11% and 26%, respectively.
• CASA grew 18% to Rp 43 trillion. CASA ratio stood at 47% vs 41% last year. Curent account and saving account each rose 22% to Rp 15.9 trillion and 16% to Rp 27.3 trillion, respectively.
• Loan to funding (including long term funding) was 89.2%, while LDR eased to 100.6% from 103.5% last quarter.
• Net Interest Margin stood at 10.1% or improved 20bps driven by lower cost of funds.
• Cost to income ratio improved to 50.8% compared to 51.8% last year.
• Fee income was 26% of operating income or Rp 4.4 trillion, rose 9% from last year.
• Asset quality improved as cost of credit declined to 2.8% from 3% last year, while NPL ratio also decreased to 2.3% from 2.5% a year earlier.
• NPAT rose 22% to Rp 4,012 billion. Consolidated ROA was 2.7%. Consolidated ROE stood at 16.2% sustained by solid CAR of 18.9%.

Untuk Anda, Bisa
Slide 27
Highlights of Income Statement
Rp billion 2011 2012 ����YoY 1Q12 2Q12 3Q12 4Q12
Net Interest Income 10,849 12,922 19% 3,019 3,272 3,299 3,332
Non-Interest Income 4,071 4,433 9% 1,029 1,143 1,131 1,130
Operating Income 14,920 17,355 16% 4,048 4,415 4,430 4,462
Cost of Credit (2,650) (2,984) 13% (788) (742) (779) (675)
Risk Adjusted Op.
Income12,270 14,370 17% 3,260 3,673 3,651 3,786
Operating Expenses (7,732) (8,809) 14% (2,032) (2,151) (2,278) (2,348)
Net Profit after Tax 3,294 4,012 22% 900 1,103 988 1,021

Untuk Anda, Bisa
Slide 28
Highlights of Balance Sheet
Rp billion 2011 2012 ����YoY 1Q12 2Q12 3Q12 4Q12
Total Assets 142,292 155,791 9% 145,114 152,393 150,109 155,791
Loans (gross) 101,678 116,385 14% 105,558 110,457 113,267 116,385
Government Bonds 3,947 4,063 3% 4,516 4,716 4,366 4,063
Total Deposits 88,054 91,675 4% 89,422 93,326 88,303 91,675
Current Account 12,994 15,854 22% 13,021 13,960 13,321 15,854
Savings 23,439 27,270 16% 23,214 23,582 25,620 27,270
Time Deposit 51,621 48,552 (6%) 53,187 55,784 49,362 48,552
Long Term Fundings 16,583 15,961 (4%) 15,967 17,747 17,848 15,961
Equity 25,516 28, 494 12% 25,401 26,481 27,467 28,494

Untuk Anda, Bisa
Slide 29
Key Ratios
% 2011 2012 ����YoY 1Q12 2Q12 3Q12 4Q12
Net Interest Margin 9.8 10.1 0.2 9.7 10.3 10.0 10.2
Cost of Credit 3.0 2.8 (0.2) 3.2 2.8 2.9 2.4
Cost / Income 51.8 50.8 (1.1) 50.2 48.7 51.4 52.6
ROAA 2.6 2.7 0.1 2.5 3.0 2.6 2.7
ROAE 17.2 16.2 (1.1) 14.6 18.1 15.8 16.1
Assets to Capital (x) 6.4 6.3 (0.1) 6.3 6.4 6.2 6.3
Consolidated RWA to Assets 89.0 84.0 (5.0) 83.4 82.4 85.9 84.0
Loan to funding* 86.0 89.2 3.2 87.2 84.4 89.3 89.2
Regulatory LDR 98.3 100.6 2.3 98.6 97.1 103.5 100.6
Stand alone CAR 16.6 18.4 1.8 17.9 18.1 18.2 18.4
Consolidated CAR 17.6 18.9 1.3 19.1 18.8 18.7 18.9
NPL – Gross 2.5 2.3 (0.2) 2.5 2.5 2.4 2.3
Impairment (LLP/Total Loans) 2.6 2.6 (0.0) 2.6 2.6 2.7 2.6
Loan Loss Coverage (LLP/NPL) 107.2 112.5 5.3 106.9 105.7 109.7 112.5
*) Loan to funding is defined as (Loans + Reserves with BI + Cash in Vault + HTM bonds) / (Third Party Deposits + Long Term Funding + Capital –
Net Other Assets). The ratio measures BDI’s only, including joint financing.
Untuk Anda, Bisa
Slide 30
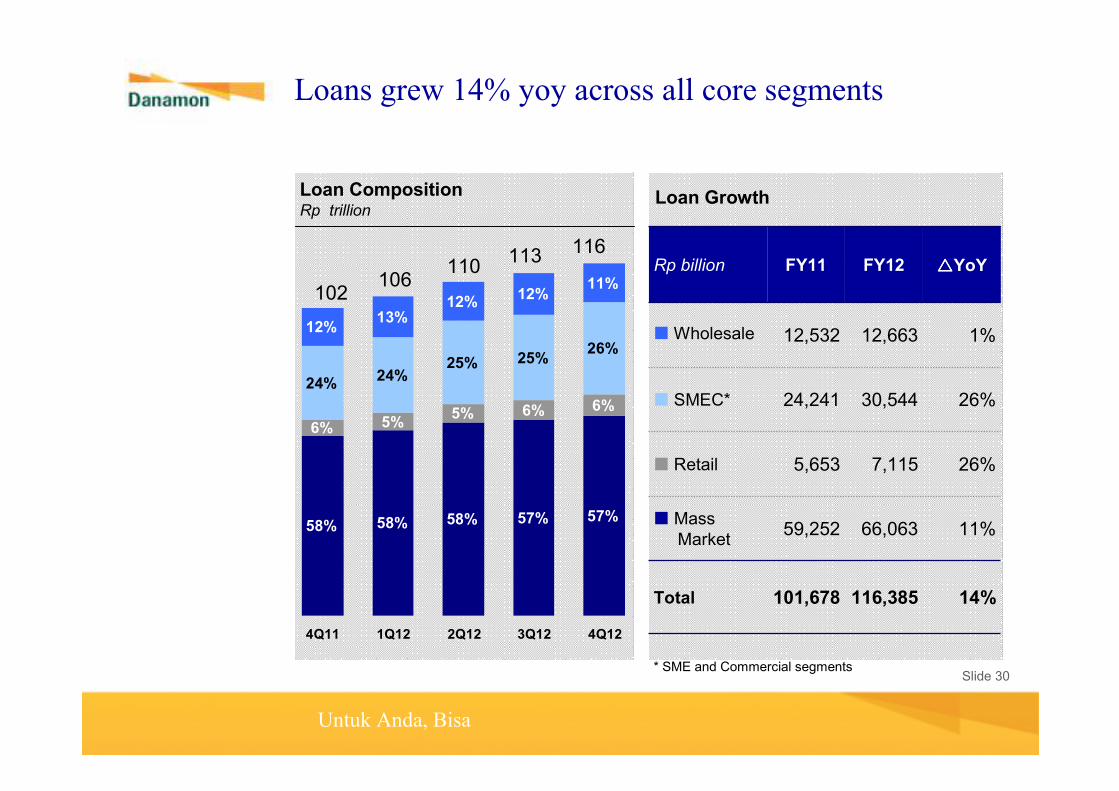
Loans grew 14% yoy across all core segments
Loan Growth
Rp billion FY11 FY12 ����YoY
� Wholesale 12,532 12,663 1%
� SMEC* 24,241 30,544 26%
� Retail 5,653 7,115 26%
� Mass Market
59,252 66,063 11%
Total 101,678 116,385 14%
* SME and Commercial segments
57%57%58%58%58%
6%6%5%5%6%
26%25%25%
24%24%
11%12%
12%13%
12%
4Q11 1Q12 2Q12 3Q12 4Q12
Loan Composition Rp trillion
116
102106
110113

Untuk Anda, Bisa
Slide 31
Mass Market Loan Growth
High margin business was 57% of total loans
Rp billion FY11 FY12 ����YoY
� AdiraQuantum
1,416 1,436 1%
� Adira Finance 41,363 45,595 10%
� Pawn Broking 40 255 NM
� SEMM (DSP) 16,433 18,777 14%
Total 59,252 66,063 11%
Mass Market Loan (to total loans)Rp trillion
16%16%16%16%16%
39%40%40%40%41%
1%1%
1% 1% 1%
4Q11 1Q12 2Q12 3Q12 4Q12
66
5961 64
65

Untuk Anda, Bisa
Slide 32
CASA to deposits rose to 47% vs 41%
• As of 31 Dec 2012, the bank has an excess of liquid assets of approx. Rp7.7 trillion and USD 450 mio(including Rp 3.9 T of Government bonds in the AFS portfolio)
Funding Composition (Rp trillion)
Loans to Deposits Ratio (%)
15%17%14%14%16%
45%47%51%51%49%
25%24%22%
22%22%
15%13%12%
12%12%
4Q11 1Q12 2Q12 3Q12 4Q12
89.289.384.4
87.286
100.6103.5
97.198.698.3
Loan to Funding Regulatory LDR
105 105 111 106
Funding Growth
Rp billion FY11 FY12 ����YoY
�Current Account
12,994 15,854 22%
�Saving Account
23,439 27,270 16%
� Time Deposit
51,621 48,552 -6%
Total
Deposits88,054 91,675 4%
� Long-term Funding
16,583 15,961 -4%
Total Funding 104,638 107,635 3%
108

Untuk Anda, Bisa
Slide 33
NIM improved as lower yield was offset by lower CoF
Net Interest Margin%, annualized
YoY NIM Movement%, annualized
Lower yield
Lower CoF
6.7 6.57.5 7.1 7.8
2.9 3.22.8 2.9 2.4
4Q11 1Q12 2Q12 3Q12 4Q12
Risk Adj NIM CoC
14.814.714.914.815.0
4.54.54.55.15.7
Yield Cost of Funds
10.29.6 9.7 10.3 10.0
10.1
0.61.0
9.8
FY11 FY12

Untuk Anda, Bisa
Slide 34
Non interest income rose 9% driven by credit related
fees
Non Interest Income GrowthRp billion
Rp billion FY11 FY12 ����YoY
� Credit Related3,049 3,306
8%
� Bancassurance 330 300 -9%
� General Insurance
457 459 1%
� Treasury (46) 80 NM
� Transaction Banking
280 287 3%
Total 4,071 4,433 9%
Non Interest Income Composition Rp billion
7%6%6%7%7%2% 3%1%3%
16%20%17%15%19%
74%73%74%
76%
74%
4Q11 1Q12 2Q12 3Q12 4Q12
1,130
1,126
1,029
1,1431,131

Untuk Anda, Bisa
Slide 35
Cost to Income Ratio stood at 50.8%
Operating Income and ExpenseRp billion
52.651.448.750.2
52.5
▼▼▼▼ Cost to Income Ratio (%)
4,003 4,048
4,415 4,430 4,462
2,100 2,032 2,151 2,278 2,348
4Q11 1Q12 2Q12 3Q12 4Q12
Operating Income Operating Expense

Untuk Anda, Bisa
Slide 36
Cost of Credit improved to 2.8%
90%83%93%89%94%
10%17%7%11%
6%
4Q11 1Q12 2Q12 3Q12 4Q12
Mass Market Non Mass Market
Cost of Credit / Avg. Earning Assets
(%)
Cost of Credit
(Rp billion)
2.42.92.8
3.22.9
675696788 742 779

Untuk Anda, Bisa
Slide 37
NPL remained low
Loan’s Collectibility% of Outstanding loans
Non-Performing Loans by SegmentRp billion
88.1% 87.8% 87.2% 88.2%87.6%
9.3% 9.9% 10.4% 9.5%9.7%2.5% 2.5% 2.3%2.5% 2.4%
4Q11 1Q12 2Q12 3Q12 4Q12
Non-Performing
SpecialMention
Current
62%59%59%60%60%
5%5%5%5%4%
17%19%20%24%23%
16%17%17%11%12%
4Q11 1Q12 2Q12 3Q12 4Q12
Wholesale
SME &Commercial
Retail
M ass market
2,479 2,594 2,751 2,734 2,659

Untuk Anda, Bisa
Slide 38
Majority of special mention loans were within 30 days
Special mention loans by Aging% of Special Mention Loans
Special Mention Loans by SegmentRp billion
84.3% 84.3% 85.6% 85.3% 83.9%
9.7% 9.9% 9.1% 9.4% 10.1%
5.9% 5.8% 5.4% 5.3% 6.0%
4Q11 1Q12 2Q12 3Q12 4Q12
61 - 90 Days
31 - 60 Days
1 - 30 Days
92%92%90%91%92%
3%3%3%
2%
3%2% 3% 2%
2%2%4%
4% 3%3%
3%
4Q11 1Q12 2Q12 3Q12 4Q12
Wholesale
SME & Commercial
Retail
Mass market
9,584 10,459 10,69311,827
11,055

Untuk Anda, Bisa
Slide 39
Successful Rp 5 trillion capital raising boosted capital
RWA / Total Assets Capital Adequacy Ratio (%)
% 4Q11 1Q12 2Q12 3Q12 4Q12
CAR w/ Credit Risk
21.2 24.1 23.5 23.3 23.4
Market Risk Charge
0.0 0.1 0.1 0.1 0.0
Operational Risk Charge
3.6 4.9 4.6 4.5 4.5
CAR
Consolidated17.6 19.1 18.8 18.7 18.9
18.7
17.6
19.118.8 18.9
16.6
17.918.418.218.1
4Q11 1Q12 2Q12 3Q12 4Q12
Consolidated Stand Alone
RWA BDI Only RWA Consolidated
17.0
18.6 18.4 18.3 18.40.6
0.50.4 0.4 0.5
4Q11 1Q12 2Q12 3Q12 4Q12
Tier 1 Capital Tier 2 Capital
Tier 1 and Tier 2 capital ratio (%) - Consol
68%70%68%69%75%
4Q11 1Q12 2Q12 3Q12 4Q12
84%86%82%83%89%
4Q11 1Q12 2Q12 3Q12 4Q12
RWA Other Assets
17.6
19.118.8 18.7 18.9

Untuk Anda, Bisa
Slide 40
Corporate Updates
Ownership
structure
• As at 2 April 2012, the Bank has been informed by Fullerton Financial Holding Pte. Ltd. (FFH), that it has entered into a share purchase agreement with DBS Group Holdings (DBS) to sell its interest in the whole of the issued share capital of Asia Financial (Indonesia) Pte. Ltd. to DBS. Currently, AFI holds approximately 67.37% of the total issued shares of the Bank. This transaction is subject to the approvals, among others, of DBS shareholders and regulators, including Bank Indonesia.

Untuk Anda, Bisa
Slide 41
Danamon
PEFINDO
August 2012
Corporate Rating idAA+ / Stable
Bond Rating idAA+ / Stable
Standard &
Poor’s
December 2012
Long-term / Short-term Local Currency
BB / B / Stable
Long-term / Short-term Foreign Currency
BB / B / Stable
Fitch’s
October 2012
Long-term / Short-term Foreign Currency
BB+ / B / Stable
National Long-term
Individual / Support Rating
AA+ (idn) / Stable
C/D / 3 / Stable
Moody’s
May 2012
Global Local Currency Deposit Baa3 / P-3 / Stable
Foreign Currency Long-term / Short-term Deposit
Ba2 / NP / Stable
Bank Financial Strength Rating (BFSR)
D / Positive
S&P upgrade BDI’s outlook to positive in April 2012
following DBS acqusition announcementDaily share price and trading volumeBDMN IJ
The ultimate shareholder of AFI is Temasek Holding Pte. Ltd, an investment holding company based in Singapore.
Indonesia Sovereign (Foreign Currency)
Standard & Poor’s Fitch’s Moody’s
BB+ / Positive BBB- / Stable Baa3 / Stable
Ownership Structure
As of 31 December 2012
Number of
Shares
Ownership (%)
Asia Financial (Indonesia) Pte, Ltd. 6,457,558,472 67.37%
JPMCB - Franklin Templeton Inv. Funds
611,958,888 6.38%
Public < 5% 2,515,126,005 26.25%
Total 9,584,643,365 100.00%
010,00020,00030,00040,00050,00060,00070,00080,00090,000100,000110,000
Jan-
12
Feb-
12
Mar-
12
Apr- 12 May-
12
Jun-
12
Jul- 12 Sep-
12
Oct-
12
Nov-
12
Dec-
12
0
2,500
5,000
7,500
10,000Volume ('000)
Share Price

Untuk Anda, Bisa
Slide 42
Reconciliation with Newsletter
a b c d e f g h i
Net Interest
Income
Net Under-
writing
Income
Net Sharia
Interest
Income
Other
Operating
Income
Other
Operating
Expenses
Non Operating
Income
Non
Operating
Loss
Income
before Tax Taxes
Minority
Interest Income after Minority Interest
13,019 464 84 5,386 (12,771) - (696) 5,487 (1,370) (105) 4,012
a+c b+d e f+g h i
Net Interest
Income
Non-
Interest
Income
Operating
Income
Operating
Expenses
Pre-
Provision
Operating
Profit Cost of Credit
Non
Operating
Income/
(Loss) Taxes
Minority
Interest
Net Profit
after Tax
and
Minority
Interest Remark
13,103 5,851 18,954 (12,771) 6,183 - (696) (1,370) (105) 4,012
(181) (181) 181 - - LPS Deposit Insurance
- - (621) 621 - Loss on reposess assets
(11) (11) (11) 11 - Provision for ADMF acquisition cost
(158) (158) (158) 158 - Write off on amortization cost
(200) (200) 200 - - ADMF indirect acquisition cost
(672) (672) 672 - - Decrease in fair value of financial assets (MTM)
(2.153) (2) 2 - - Losses from sale of financial assets (marketable securities)
(69) (69) 69 - - Losses from spot and derivative transaction (realised)
- 2,527 2,527 (2,527) - Impairment losses on financial assets
(298) (298) 298 - - Fees/commissions and administrative expenses
- 5 5 (5) - Allowance for possible losses on non earning assets
(7) (7) 7 - - - Others
12,922 4,433 17,355 (8,809) 8,546 (2,984) (74) (1,370) (105) 4,012
Newsletter
Analyst Briefing Presentation

Untuk Anda, Bisa
Slide 43
Business Activity & Branch Networking - Zoning
Jakarta
Java Bali
West NusaTenggara
East NusaTenggara
Maluku
West Papua
Papua
AcehNorth Sumatra
Riau Islands
Riau
West Sumatra
Bengkulu
Jambi
South Sumatra
Lampung
West Kalimantan
CentralKalimantan
SouthKalimantan
EastKalimantan
Central Sulawesi
NorthSulawesi
WestSulawesi
SouthSulawesi
South EastSulawesi
Coeff.
Zone
0.512345
654321

Untuk Anda, Bisa
Slide 44
Thank You
Investor RelationsPT Bank Danamon Indonesia, TbkMenara Bank Danamon, 6th FloorJl. Prof. Dr. Satrio Kav. E4 No.6Mega Kuningan, Jakarta 12950Phone: +62 21 5799 1001-03Fax: +62 21 5799 1445Email: [email protected]
IR Contacts: Indah Hermawan – [email protected] Prasetyo – [email protected]
EconomistsAnton Gunawan – Chief Economist - [email protected] Hendranata - Economist / Econometrician- [email protected] Ayu Yustina - Economist / Bond Analyst - [email protected]
Disclaimer:This report has been prepared by PT Bank Danamon Indonesia Tbk independently and is circulated for the purpose of general information only. It is not intended to the specifi c person who may receive this report. The information in this report has been obtained from sources which we deem reliable. No warranty (expressed or implied) is made to the accuracy or completeness of the information. All opinions and estimates included in this report constitute our judgment as of this date and are subject to change without prior notice. We disclaim any responsibility or liability (expressed or implied) of PT Bank Danamon Indonesia Tbkand/or its affi liated companies and/or their respective employees and/or agents whatsoever and howsoever arising which may be brought against or suffered by any person as a result of acting in reliance upon the whole or any part of the contents of this report and neither PT Bank Danamon Indonesia Tbk and/or its affiliated companies and/or their respective employees and/or agents accepts liability for any errors, omissions or mis-statements, negligent or otherwise, in this report and any inaccuracy herein or omission herefrom which might otherwise arise.