2013 Sleep in America Poll Sleep in America®Poll Exercise and Sleep Summary of Findings 2.20.2013...
94
2191 Defense Highway Suite 401 Crofton, MD 21114 • 410-721-0500 • www.WBandA.com 2013 Sleep in America ® Poll Exercise and Sleep Summary of Findings 2.20.2013 National Sleep Foundation 1010 N. Glebe Road, Suite 310 Arlington, VA 22201 Ph: (703) 243-1697 www.sleepfoundation.org
Transcript of 2013 Sleep in America Poll Sleep in America®Poll Exercise and Sleep Summary of Findings 2.20.2013...

2191 Defense Highway Suite 401 Crofton, MD 21114 • 410-721-0500 • www.WBandA.com
2013 Sleep in America® PollExercise and Sleep
Summary of Findings
2.20.2013
National Sleep Foundation1010 N. Glebe Road, Suite 310
Arlington, VA 22201
Ph: (703) 243-1697
www.sleepfoundation.org

Table of Contents
Page Number
Page Number
Objectives, Background and Purpose ........................................... 2 Less time sitting associated with better sleep and health
Summary of Findings Overall Sleep Quality...................................................... 41
Exercise is good for sleep Overall Health ................................................................ 42
Overall Sleep Quality............................................................ 6 Time spent sitting ............................................................ 43
Hours of sleep ...................................................................... 7 Exercise is good, regardless of time of day
Hours of sleep needed .......................................................... 8 Vigorous/Moderate activity within 4 hours of bedtime .... 48
Sleep needed versus hours slept ............................................ 9 Other sleep habits
Sleep quality on exercise days ............................................... 11 Average bed time, wake time, hours slept ........................ 51
Sleep length on exercise days ................................................ 12 Sleep and exercise ratings
Has a good night’s sleep ....................................................... 13 Exercise and awakening during the night ......................... 54
Vigorous exercisers report best sleep More likely to exercise on weekend days or workdays ..... 55
Frequency of Sleep Problems ................................................ 17 Physical activity after night with little or poor sleep ......... 56
Problem Maintaining Enthusiasm .......................................... 18 Sleep when unable to exercise on a day typically would .. 57
Amount of Time Taken to Fall Asleep .................................... 19 Indoors versus outdoors activity ...................................... 58
Non-exercisers report worse sleep/health Personal habits and behaviors
Overall Health ...................................................................... 22 Smoking ......................................................................... 60
Trouble staying awake during activities ................................. 23 Alcoholic beverages ........................................................ 61
Napping ............................................................................... 24 Drowsy driving ............................................................... 62
Caffeinated beverages ........................................................... 25 Appendix
Medicine to help sleep .......................................................... 26 Methodology ......................................................................... 64
Level of excessive sleepiness ................................................. 27 Standard Error ........................................................................ 66
Current weekday routine allows for adequate sleep ............... 28 Characteristics of Respondents ............................................... 67
Impact of not getting enough sleep ........................................ 30 Additional Data-Modified Sheehan Disability Scales ............... 70
Sheehan Disability Scales ...................................................... 31 Additional Data-Time spent sitting
NSF Disability Index ............................................................. 37 By Health Quality/Sleep Quality ..................................... 76
Sleep apnea indicator............................................................ 39 By Sleep Quality/Length of Sleep on Exercise Days .......... 80
By Modified Epworth Sleepiness Scale ............................. 84
Survey Instrument .................................................................. 86
1

The National Sleep Foundation commissioned WB&A Market Research to conduct a national survey of Americans regarding their sleep habits – the NSF 2013 Sleep in America® poll. This poll is an annual review of habits, behaviors and attitudes pertaining to sleep and sleep quality. The study incudes measures of sleepiness, drowsy driving, sleep disorders and general health.
The National Sleep Foundation has conducted the Sleep in America® poll since 1991. The poll is representative of the U.S. population, age 23 to 60, with a primary focus of this year’s poll being to evaluate the relationship between sleep and physical activity.
A total of 1,000 surveys were conducted yielding a maximum standard error of ±3.1 percentage points at the 95% confidence level (see Appendix page 66 for detailed information on standard error). A representative sample was constructed with stratification by age and area of the country (Northeast, Midwest, West, and South) to determine the relationship between sleep quantity, sleep quality, sleep problems and physical activity. 500 surveys were completed via the Web and 500 via telephone interviews (see Appendix page 64 for detailed information on the methodology used to conduct the poll).
Details concerning the respondents’ demographic information, such as: age, gender, ethnicity, region of residence, marital status, employment status, income and education level can be found in the Appendix (page 67).
When referring to this poll in an article or story, please refer to it as the “National Sleep Foundation 2013 poll” and link it to www.sleepfoundation.org/2013poll.
Matthew P. Buman, PhDAssistant Professor- Exercise and WellnessSchool of Nutrition and Health PromotionArizona State University
Objectives, Background and Purpose
NSF wishes to acknowledge the volunteer work of the members of its 2013 Poll Task Force:
Sleep in America ® is a trademark of the National Sleep Foundation. All rights reserved. 2
Task Force Chair:
Take Force Members:
Max Hirshkowitz, PhDTenured Associate ProfessorBaylor College of Medicine and VAMC Sleep Center
Christopher E. Kline, PhDPostdoctoral Scholar- Department of Psychiatry University of Pittsburgh School of Medicine
Barbara Phillips, MD, MSPH, FCCPDivision of Pulmonary Critical Care and Sleep Medicine University of Kentucky College of Medicine
Prof. Dr. Marco Túlio de MelloAssociate Professor- Department of PsychobiologyUniversidade Federal de Sao Paolo- UNIFESP
Shawn D. Youngstedt, PhDAssociate Professor- Department of Exercise Science University of South CarolinaDorn VA Medical Center
Vigorous activity18%
Moderate activity25%
Light activity48%
No activity9%
Don't know/Not sure/Refused
<1%
Activity Levels: Self-Reported
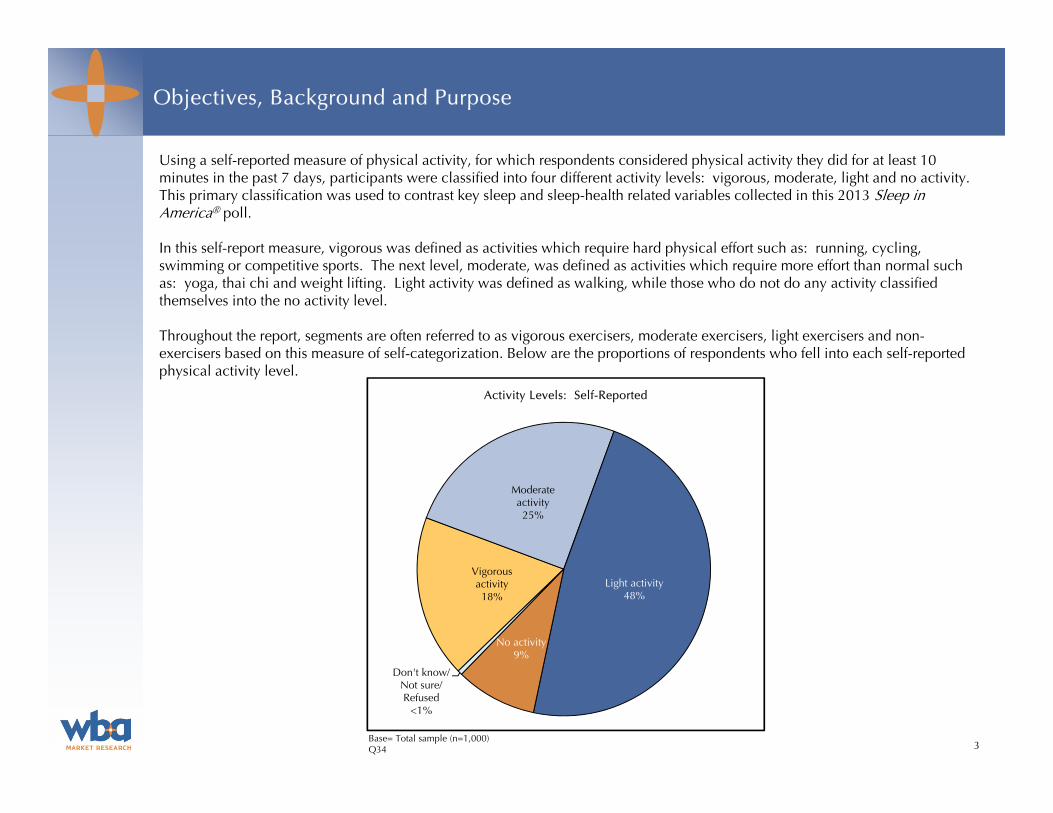
Using a self-reported measure of physical activity, for which respondents considered physical activity they did for at least 10 minutes in the past 7 days, participants were classified into four different activity levels: vigorous, moderate, light and no activity. This primary classification was used to contrast key sleep and sleep-health related variables collected in this 2013 Sleep in America® poll.
In this self-report measure, vigorous was defined as activities which require hard physical effort such as: running, cycling, swimming or competitive sports. The next level, moderate, was defined as activities which require more effort than normal such as: yoga, thai chi and weight lifting. Light activity was defined as walking, while those who do not do any activity classified themselves into the no activity level.
Throughout the report, segments are often referred to as vigorous exercisers, moderate exercisers, light exercisers and non-exercisers based on this measure of self-categorization. Below are the proportions of respondents who fell into each self-reported physical activity level.
3Base= Total sample (n=1,000) Q34
Objectives, Background and Purpose

Summary of Findings

Exercise is good for sleep

6
14%BCD
4%
4%
3%
5%
31%BCD
20%
18%
14%
19%
39%
60%E
57%E
57%E
57%
17%
16%
20%
26%D
19%
0% 20% 40% 60% 80% 100%
No activity (E)
Light (D)
Moderate (C)
Vigorous (B)
Total (A)
Overall Sleep Quality
Very bad Fairly bad Fairly good Very good
Base= Total sample (Total n=1,000; Vigorous n=183; Moderate n=250; Light n=477; No activity n=88) Letters indicate significant differences at the 95% confidence level.Q30
Net: Very good/Fairly good
76%
83%DE
77%E
76%E
56%
Exercise is good for sleep
Data from the 2013 Sleep in America® poll overwhelmingly support the proposition that “Exercise is good for sleep”. This section highlights findings showing that although those who exercise and do not exercise report very similar sleep needs and sleep patterns, those who exercise are more likely to say, “I had a good night’s sleep” on both worknights and non-worknights.
As shown below, the proportion of those who categorize themselves as vigorous exercisers, moderate exercisers and light exercisers, and report very good or fairly good overall sleep quality (83%, 77% and 76% respectively) is significantly higherthan those who categorize themselves as no activity or non-exercisers (56%).

Hours of Sleep Workdays
Activity Levels
Total(A)
Vigorous(B)
Moderate (C)
Light(D)
No activity(E)
Workdays n = (1,000) (183) (250) (477) (88)
Less than 6 hours 14% 15% 12% 14% 14%
6 hours to less than 7 hours 26 25 22 27 28
7 hours to less than 8 hours 33 38 35 32 28
8 hours or more 25 21 28 26 24
Don’t know/Not sure/Refused 2 1 3 1 6
Average hours slept 6h 51m 6h 48m 6h 57m 6h 50m 6h 43m
Base= Total sample Letters indicate significant differences at the 95% confidence level.Q5
7
Exercise is good for sleep (continued)
Each segment (vigorous, moderate, light and no activity) reports getting relatively similar average lengths of sleep on workdays and non-workdays.
Hours of Sleep Non-Workdays
Activity Levels
Total(A)
Vigorous(B)
Moderate (C)
Light(D)
No activity(E)
Non-Workdays n = (1,000) (183) (250) (477) (88)
Less than 6 hours 7% 7% 5% 8% 9%
6 hours to less than 7 hours 13 11 12 14 14
7 hours to less than 8 hours 23 23 23 23 23
8 hours or more 55 57 57 54 49
Don’t know/Not sure/Refused 2 1 3 1 6
Average hours slept 7h 37m 7h 40m 7h 41m 7h 34m 7h 36m
Base= Total sampleLetters indicate significant differences at the 95% confidence level.Q6

8
14%
14%
13%
15%
14%
19%
25%
25%
23%
24%
25%
29%
31%
35%
30%
39%B
31%
31%
26%
31%
3%
1%
1%
1%
0% 20% 40% 60% 80% 100%
No activity (E)
Light (D)
Moderate (C)
Vigorous (B)
Total (A)
Hours of Sleep Needed to Function at Best During the Day(Self-Reported)
Less than 6 hours 6 to less than 7 hours 7 to less than 8 hours 8 hours or more Don't know/Not sure/Refused
Mean:
7h 17m
7h 10m
7h 20m
7h 18m
7h 28m
Base= Total sample (Total n=1,000; Vigorous n=183; Moderate n=250; Light n=477; No activity n=88) Letters indicate significant differences at the 95% confidence level.Q14
Exercise is good for sleep (continued)
Comparable to similar average lengths of sleep on workdays and non-workdays, each segment reports needing roughly the same amount of sleep to function best during the day (from 7 hours and 10 minutes to 7 hours and 28 minutes).

14%
28%E
26%E
26%E
26%E
40%
40%
43%
44%
42%
39%
30%
28%
27%
30%
8%D
2%
3%
2%
3%
0% 20% 40% 60% 80% 100%
No activity (E)
Light (D)
Moderate (C)
Vigorous (B)
Total (A)
Sleep Needed versus Hours Slept Workdays
More sleep than needed Sufficient Less sleep than needed Don't know/Not sure/Refused
Base= Total sample (Total n=1,000; Vigorous n=183; Moderate n=250; Light n=477; No activity n=88)Letters indicate significant differences at the 95% confidence level.Q5/Q14
Net: Sleep Needs Met
67%E
70%E
69%E
68%E
53%
9
Exercise is good for sleep (continued)
Those who report themselves to be exercisers are also significantly more likely than non-exercisers to say their sleep needs are being met (either getting more sleep than needed or sufficient sleep) on workdays (vigorous 70%, moderate 69% and light 68% vs. no activity 53%).
Notably, exercisers are also significantly more likely to get more sleep than needed as compared to non-exercisers on workdays (vigorous 26%, moderate 26% and light 28% vs. no activity 14%).

10
34%
53%E
53%E
66%CDE
54%
41%B
30%
32%
25%
31%
17%B
15%B
11%
8%
13%
8%D
2%
4%
2%
3%
0% 20% 40% 60% 80% 100%
No activity (E)
Light (D)
Moderate (C)
Vigorous (B)
Total (A)
Sleep Needed versus Hours Slept Non-Workdays
More sleep than needed Sufficient Less sleep than needed Don't know/Refused
Base= Total sample (Total n=1,000; Vigorous n=183; Moderate n=250; Light n=477; No activity n=88)Letters indicate significant differences at the 95% confidence level.Q6/Q14
Net: Sleep Needs Met
84%E
90%DE
86%E
83%E
75%
Exercise is good for sleep (continued)
Similar to the findings for workdays, those who report themselves to be exercisers are significantly more likely than non-exercisers to say their sleep needs are being met (either getting more sleep than needed or sufficient sleep) on non-workdays (vigorous 90%, moderate 86% and light 83% vs. no activity 75%).
Exercisers are also significantly more likely to get more sleep than needed as compared to non-exercisers on non-workdays (vigorous 66%, moderate 53% and light 53% vs. no activity 34%).
11
On days you exercise…
Activity Levels
Total(A)
Vigorous(B)
Moderate (C)
Light(D)
No activity(E)
Your quality of sleep n= (1,000) (183) (250) (477) (88)
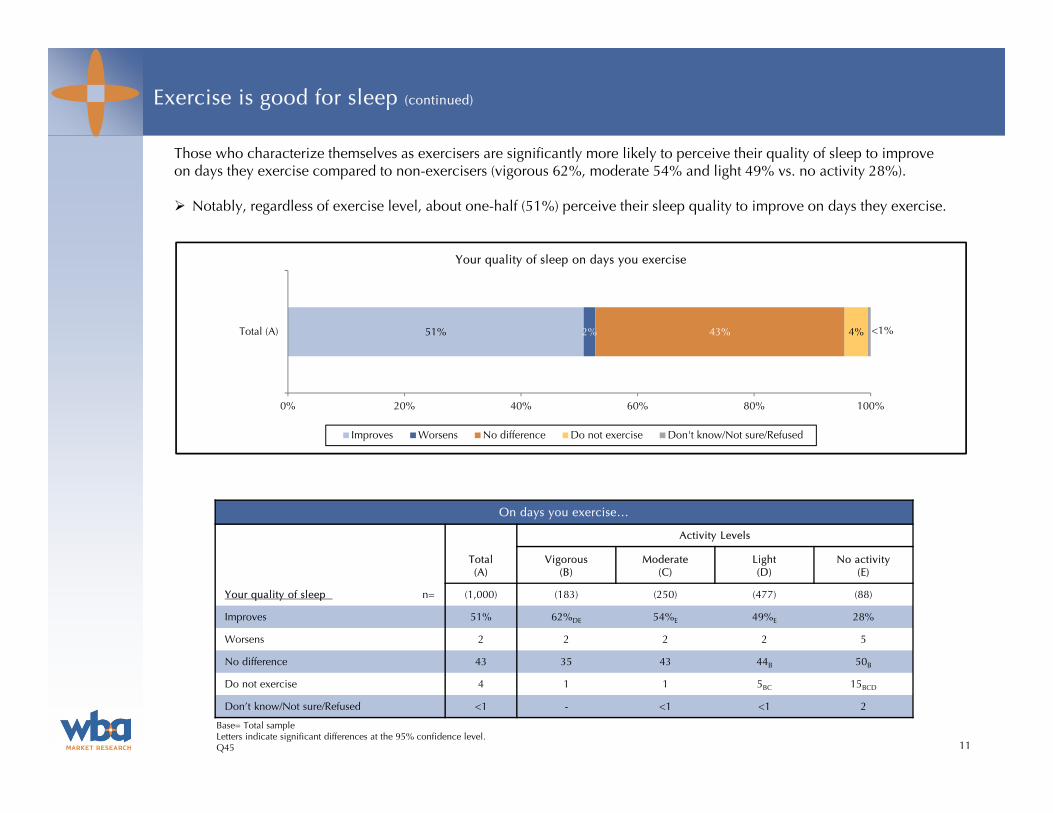
Improves 51% 62%DE 54%E 49%E 28%
Worsens 2 2 2 2 5
No difference 43 35 43 44B 50B
Do not exercise 4 1 1 5BC 15BCD
Don’t know/Not sure/Refused <1 - <1 <1 2
Base= Total sampleLetters indicate significant differences at the 95% confidence level.Q45
51% 2% 43% 4% <1%
0% 20% 40% 60% 80% 100%
Total (A)
Your quality of sleep on days you exercise
Improves Worsens No difference Do not exercise Don't know/Not sure/Refused
Exercise is good for sleep (continued)
Those who characterize themselves as exercisers are significantly more likely to perceive their quality of sleep to improve on days they exercise compared to non-exercisers (vigorous 62%, moderate 54% and light 49% vs. no activity 28%).
Notably, regardless of exercise level, about one-half (51%) perceive their sleep quality to improve on days they exercise.

12
On days you exercise…(continued)
Activity Levels
Total(A)
Vigorous(B)
Moderate (C)
Light(D)
No activity(E)
Your length of sleep n= (1,000) (183) (250) (477) (88)
Improves 28% 32%E 29%E 30%E 11%
Worsens 2 2 2 1 2
No difference 66 64 68 64 67
Do not exercise 4 1 1 4BC 15BCD
Don’t know/Not sure/Refused 1 - - 1 5
Base= Total sampleLetters indicate significant differences at the 95% confidence level.Q46
28% 2% 66% 4% 1%
0% 20% 40% 60% 80% 100%
Total (A)
Your length of sleep on days you exercise
Improves Worsens No difference Do not exercise Don't know/Not sure/Refused
Exercise is good for sleep (continued)
Those who characterize themselves as exercisers are also significantly more likely to perceive their sleep length to improve on days they exercise compared to non-exercisers (vigorous 32%, moderate 29% and light 30% vs. no activity 11%).
However, almost two-thirds (66%) overall perceive no difference in their sleep length on days they exercise.

6%
7%
5%
11%C
7%
33%
49%E
53%E
56%E
50%
47%B
38%B
38%B
29%
37%
15%BCD
5%
4%
4%
5%
1%
<1%
0% 20% 40% 60% 80% 100%
No activity (E)
Light (D)
Moderate (C)
Vigorous (B)
Total (A)
Number of worknights can say “I Had a Good Night’s Sleep”
Every night Almost every night Rarely Never Don't know/Refused
Net: Every night/
Almost every night
57%
67%CDE
58%E
56%E
39%
13
Base= Total sample (Total n=1,000; Vigorous n=183; Moderate n=250; Light n=477; No activity n=88) Letters indicate significant differences at the 95% confidence level.Q11
Exercise is good for sleep (continued)
While those who exercise report needing and actually sleeping similar lengths of time as their non-exercising counterparts, their perception of sleep quality, or having a good night’s sleep every night or almost every night on worknights, is significantly higher than those who do not exercise (vigorous 67%, moderate 58% and light 56% vs. no activity 39%).
Exercise is good for sleep (continued)
14
17%
15%
16%
22%D
17%
31%
53%E
56%E
55%E
52%
38%B
28%B
27%B
19%
27%
15%BCD
3%
1%
4%
4%
<1%
<1%
0% 20% 40% 60% 80% 100%
No activity (E)
Light (D)
Moderate (C)
Vigorous (B)
Total (A)
Number of non-worknights can say “I Had a Good Night’s Sleep”
Every night Almost every night Rarely Never Don't know/Refused
Net: Every night/
Almost every night
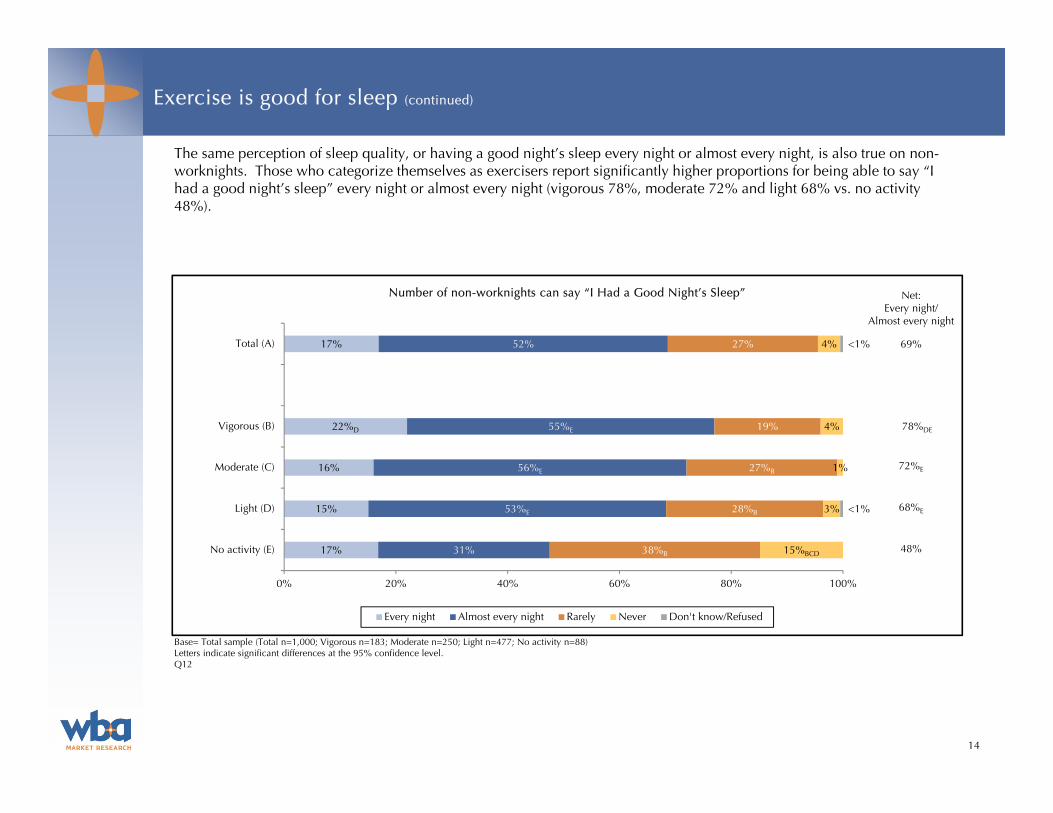
69%
78%DE
72%E
68%E
48%
Base= Total sample (Total n=1,000; Vigorous n=183; Moderate n=250; Light n=477; No activity n=88) Letters indicate significant differences at the 95% confidence level.Q12
The same perception of sleep quality, or having a good night’s sleep every night or almost every night, is also true on non-worknights. Those who categorize themselves as exercisers report significantly higher proportions for being able to say “I had a good night’s sleep” every night or almost every night (vigorous 78%, moderate 72% and light 68% vs. no activity 48%).

Vigorous exercisers report best sleep

Vigorous exercisers report best sleep
16
The data from the 2013 Sleep in America® poll not only shows that exercise is good for sleep, it also shows that those who classify themselves as vigorous exercisers generally have the best sleep.
Approximately one-fourth (26%) of respondents who classified themselves as vigorous exercisers reported very good sleep quality. This chart can be seen on page 6. Not only does the vigorous exercising subset of respondents report the largest proportion of very good sleep quality, this is significantly higher than those who classify themselves as light exercisers (16%).
Vigorous exercisers also report the largest proportion of satisfaction with the amount of sleep they actually get compared tothe amount of sleep they report needing. As seen on page 10, vigorous exercisers (66%) are significantly more likely to report getting more sleep than needed as compared to moderate exercisers (53%), light exercisers (53%) and non-exercisers (34%).

17
Frequency of Sleep Problems
Activity Levels
Total(A)
Vigorous(B)
Moderate (C)
Light(D)
No activity(E)
Net: Every night/almost every night n= (1,000) (183) (250) (477) (88)
Woke up during the night 42% 33% 40% 44%B 50%B
Woke up feeling un-refreshed 24 17 20 26BC 43BCD
Had difficulty falling asleep 14 8 14B 16B 24BC
Woke up too early and could not get back to sleep 11 9 10 13 15
Net: At least a few nights/days a week n= (1,000) (183) (250) (477) (88)
Woke up during the night 67% 60% 69%B 69%B 65%
Woke up feeling un-refreshed 59 52 55 62B 70BC
Had difficulty falling asleep 38 31 39 38 48B
Woke up too early and could not get back to sleep 35 27 35 38B 39
Net: Rarely/never n= (1,000) (183) (250) (477) (88)
Woke up during the night 33% 40%CD 31% 31% 34%
Woke up feeling un-refreshed 40 46DE 44E 38E 27
Had difficulty falling asleep 62 69E 61 61 50
Woke up too early and could not get back to sleep 64 72DE 65 61 58
Base= Total sampleLetters indicate significant differences at the 95% confidence level.Q19
Vigorous exercisers report best sleep (continued)
In terms of sleep problems, those categorizing themselves as vigorous exercisers are significantly more likely to say that inthe past two weeks, they rarely or never had the following sleep problems: woke up during the night (40%, significantly more than moderate exercisers 31% and light exercisers 31%); they woke up feeling unrefreshed (46%, significantly more than light exercisers 38% and non-exercisers 27%); they had difficulty falling asleep (69%, significantly more than non-exercisers 50%); and/or they woke up too early and could not get back to sleep (72%, significantly more than light exercisers 61% and non-exercisers 58%).
Overall, those who categorize themselves as vigorous exercisers have had fewer sleep problems in the past two weeks than the other subsets of respondents.

18
33%
40%
40%
50%CDE
41%
20%
39%E
42%E
38%E
38%
34%BCD
17%
15%
11%
17%
11%BCD
4%B
3%
1%
4%
1%
<1%
0% 20% 40% 60% 80% 100%
No activity (E)
Light (D)
Moderate (C)
Vigorous (B)
Total (A)
Problem Maintaining Enthusiasm to get things done in the Past 2 Weeks
No problem Slight problem Somewhat of a problem Very big problem Don't know/Not sure/Refused
Base= Total sample (Total n=1,000; Vigorous n=183; Moderate n=250; Light n=477; No activity n=88) Letters indicate significant differences at the 95% confidence level.Q33
One-half (50%) of vigorous exercisers report that they have had no problem maintaining enthusiasm to get things done in the past two weeks. This is significantly higher than those categorizing themselves as moderate exercisers, light exercisersand non-exercisers.
Vigorous exercisers report best sleep (continued)

19
Base= Total sample (Total n=1,000; Vigorous n=183; Moderate n=250; Light n=477; No activity n=88)Letters indicate significant differences at the 95% confidence level.Q17
15%
13%
10%
18%C
13%
17%
21%
22%
23%
21%
10%
19%E
25%E
26%E
21%
22%
20%
21%
20%
20%
11%
13%B
10%B
4%
10%
10%BC
4%B
2%
1%
4%
10%
9%
7%
5%
8%
5%
2%
2%
2%
2%
0% 20% 40% 60% 80% 100%
No activity (E)
Light (D)
Moderate (C)
Vigorous (B)
Total (A)
Amount of Time Taken to Fall Asleep on Weekdays/Workdays
Less than 5 minutes 5 to less than 10 minutes 10 to less than 15 minutes15 to less than 30 minutes 30 to less than 45 minutes 45 minutes to less than 1 hour1 hour or more Don't know/Not sure/Depends
Average (minutes)
21.3
16.6
20.5B
22.6B
26.3BC
Vigorous exercisers report shorter time taken to fall asleep on weekdays and workdays as well as weekend days and non-workdays. Non-exercisers (26.3 minutes), light exercisers (22.6 minutes) and moderate exercisers (20.5 minutes) stated a significantly longer average time to fall asleep on weekdays and workdays than vigorous exercisers (16.6 minutes).
Vigorous exercisers report best sleep (continued)

20
Base= Total sample (Total n=1,000; Vigorous n=183; Moderate n=250; Light n=477; No activity n=88)Letters indicate significant differences at the 95% confidence level.Q18
14%
13%
11%
20%CD
14%
20%
23%
24%
29%
24%
11%
19%E
26%DE
22%E
21%
18%
18%
18%
15%
18%
11%
12%B
10%
6%
10%
9%B
5%B
3%
1%
4%
11%B
9%B
8%
4%
8%
5%
2%
1%
3%
2%
0% 20% 40% 60% 80% 100%
No activity (E)
Light (D)
Moderate (C)
Vigorous (B)
Total (A)
Amount of Time Taken to Fall Asleep on Weekend Days/Non-Workdays
Less than 5 minutes 5 to less than 10 minutes 10 to less than 15 minutes15 to less than 30 minutes 30 to less than 45 minutes 45 minutes to less than 1 hour1 hour or more Don't know/Not sure/Depends
Average (minutes)
20.8
14.7
20.4B
22.4B
26.1BC
Similarly, non-exercisers (26.1 minutes), light exercisers (22.4 minutes) and moderate exercisers (20.4 minutes) stated a significantly longer average time to fall asleep on weekend days and non-workdays than vigorous exercisers (14.7 minutes).
Vigorous exercisers report best sleep (continued)

Non-exercisers report worse sleep/health
Non-exercisers report worse sleep/health
22
12%BCD
2%
1%
1%
2%
30%BCD
19%BC
10%
8%
16%
51%
64%BE
59%B
44%
58%
7%
15%E
30%DE
47%CDE
24%
0% 20% 40% 60% 80% 100%
No activity (E)
Light (D)
Moderate (C)
Vigorous (B)
Total (A)
Overall Health
Poor Fair Good Excellent
Base= Total sample (Total n=1,000; Vigorous n=183; Moderate n=250; Light n=477; No activity n=88) Letters indicate significant differences at the 95% confidence level.Q24
Net: Good/Excellent
82%
91%DE
89%DE
79%E
58%
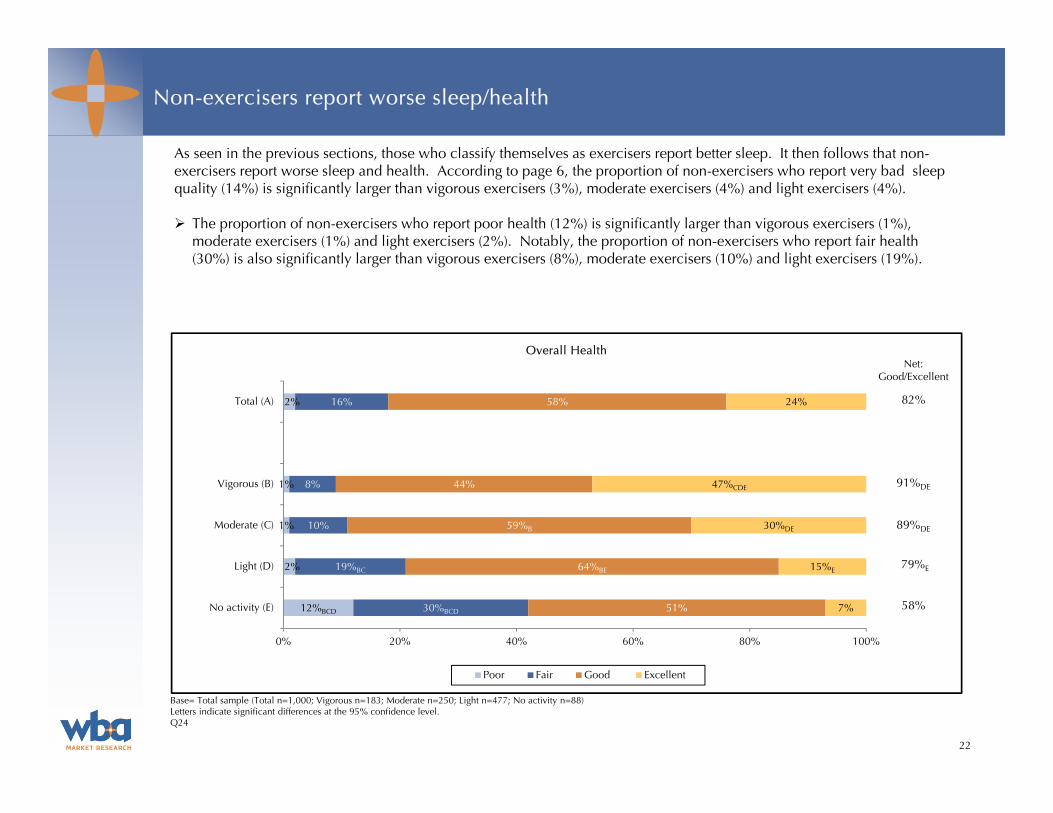
As seen in the previous sections, those who classify themselves as exercisers report better sleep. It then follows that non-exercisers report worse sleep and health. According to page 6, the proportion of non-exercisers who report very bad sleep quality (14%) is significantly larger than vigorous exercisers (3%), moderate exercisers (4%) and light exercisers (4%).
The proportion of non-exercisers who report poor health (12%) is significantly larger than vigorous exercisers (1%), moderate exercisers (1%) and light exercisers (2%). Notably, the proportion of non-exercisers who report fair health (30%) is also significantly larger than vigorous exercisers (8%), moderate exercisers (10%) and light exercisers (19%).
23
78%
86%
82%
87%
85%
5%
8%
12%E
9%
9%
11%BD
4%
5%
3%
5%
3%
1%
1%
1%
1%
2%
<1%
<1%
0% 20% 40% 60% 80% 100%
No activity (E)
Light (D)
Moderate (C)
Vigorous (B)
Total (A)
Trouble Staying Awake while Driving, Eating or Engaging in Social Activity in the Past 2 Weeks
Never Less than once a week Once or twice a week Three or more times a week Don't know/Not sure/Refused
Base= Total sample (Total n=1,000; Vigorous n=183; Moderate n=250; Light n=477; No activity n=88) Letters indicate significant differences at the 95% confidence level.Q32
Non-exercisers report worse sleep/health (continued)
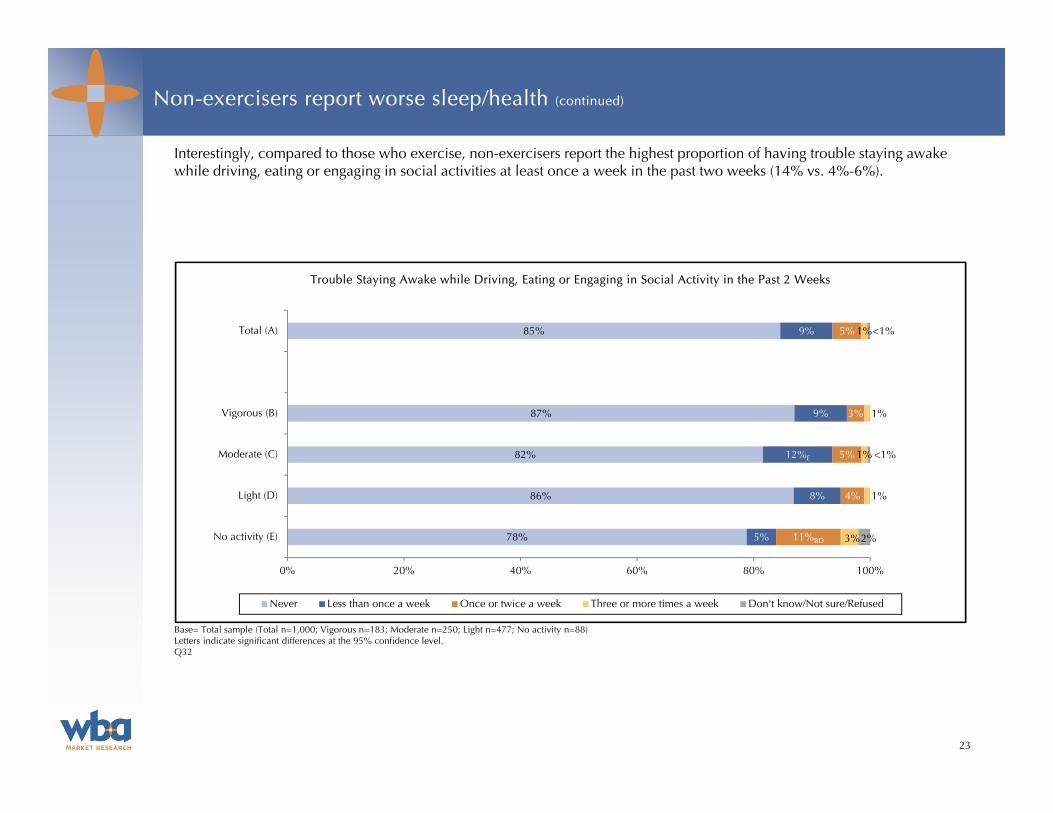
Interestingly, compared to those who exercise, non-exercisers report the highest proportion of having trouble staying awake while driving, eating or engaging in social activities at least once a week in the past two weeks (14% vs. 4%-6%).
24
Napping
Activity Levels
Total(A)
Vigorous(B)
Moderate (C)
Light(D)
No activity(E)
Workdays n= (1,000) (183) (250) (477) (88)
Net: Any naps 33% 30% 34% 32% 40%
1-2 naps 21 20 21 21 19
3-5 naps 8 8 8 7 12
6-10 naps 3 1 4 3 3
More than 10 naps 1 1 1 1 5
No naps 67 70 66 68 60
Average # of naps taken1 3.0 2.6 3.0 2.9 4.0BD
Average amount of time napping (in minutes)1 37.1 35.0 36.1 36.7 45.2BCD
Non-Workdays n= (1,000) (183) (250) (477) (88)
Net: Any naps 43% 40% 41% 45% 44%
1-2 naps 36 34 34 39 34
3-5 naps 6 5 6 6 6
6-10 naps <1 1 1 - 1
More than 10 naps <1 - - <1 3
No naps 57 60 59 55 56
Average # of naps taken2 2.0 1.9 2.0 1.9 2.8BCD
Average amount of time napping (in minutes)2 44.0 44.7 41.3 44.4 47.5
Base= Total sample1Base = Those who take naps workdays (Total n=326; Vigorous n=54; Moderate n=84; Light n=152; No activity n=35)2Base = Those who take naps non-workdays (Total n=430; Vigorous n=73; Moderate n=102; Light n=216; No activity n=39)Letters indicate significant differences at the 95% confidence level.Q7, Q8, Q9, Q10
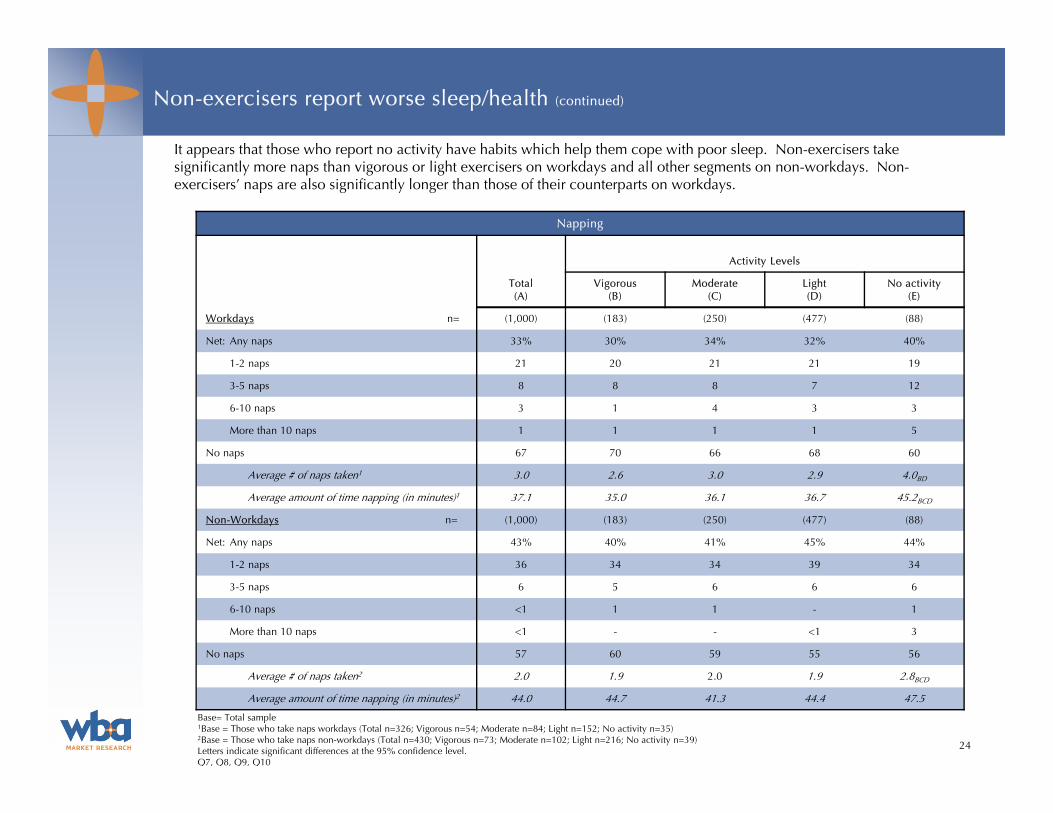
It appears that those who report no activity have habits which help them cope with poor sleep. Non-exercisers take significantly more naps than vigorous or light exercisers on workdays and all other segments on non-workdays. Non-exercisers’ naps are also significantly longer than those of their counterparts on workdays.
Non-exercisers report worse sleep/health (continued)
Number of Caffeinated Beverages Consumed on Average Workday
Activity Levels
Total(A)
Vigorous(B)
Moderate (C)
Light(D)
No activity(E)
Caffeinated Beverages perWorkday n= (1,000) (183) (250) (477) (88)
Net: Any beverages 80% 78% 83% 81% 77%
1 beverage 17 17 20E 16 11
2 beverages 18 17E 23E 19E 8
3 beverages 16 14 14 17 18
4-5 beverages 16 17 15 15 17
6-10 beverages 8 8 7 8 15
More than 10 beverages 5 4 4 6 8
None 17 20 14 17 15
Don’t know/Not sure/Refused 3 3 3 3 8
Average (# of beverages) 1 3.5 3.1 3.3 3.6 5.0BCD
Base= Total sample1Base= Those answeringLetters indicate significant differences at the 95% confidence level.Q29
25
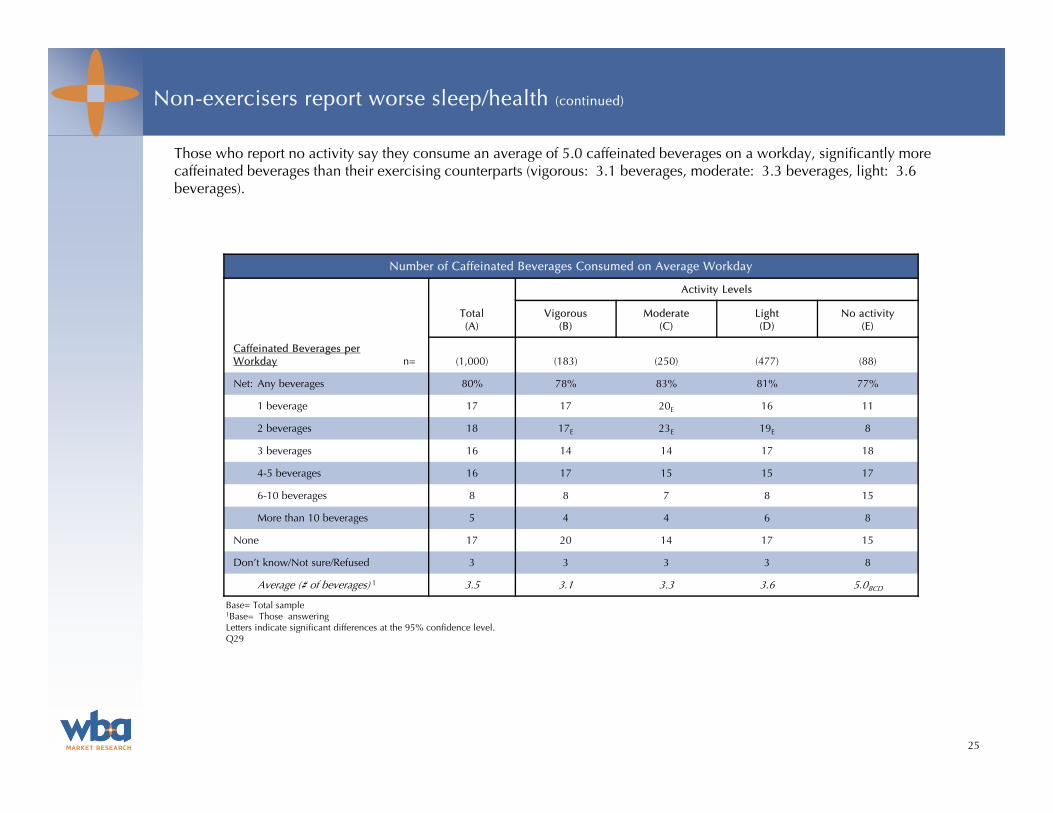
Those who report no activity say they consume an average of 5.0 caffeinated beverages on a workday, significantly more caffeinated beverages than their exercising counterparts (vigorous: 3.1 beverages, moderate: 3.3 beverages, light: 3.6 beverages).
Non-exercisers report worse sleep/health (continued)

26
66%
79%E
81%E
83%E
79%
6%
4%
5%
5%
4%
6%
4%
7%
5%
5%
22%BC
13%BC
7%
7%
11%
1%
<1%
<1%
<1%
0% 20% 40% 60% 80% 100%
No activity (E)
Light (D)
Moderate (C)
Vigorous (B)
Total (A)
Taken Medicine to Help you Sleep in the Past 2 Weeks
Never Less than once a week Once or twice a week Three or more times a week Don't know/Not sure/Refused
Base= Total sample (Total n=1,000; Vigorous n=183; Moderate n=250; Light n=477; No activity n=88) Letters indicate significant differences at the 95% confidence level.Q31
Non-exercisers may also be coping by taking medicine to help them sleep. In the past two weeks, a significantly higher proportion of non-exercisers reported that they took medicine to help them sleep (34% vs. vigorous 17%, moderate 19% and light 21%). Roughly one-third of those who report no activity have ever taken medicine in the past two weeks to help them sleep.
Non-exercisers report worse sleep/health (continued)

27
Base = Those able to rate all ESS attributes (Total n=942; Vigorous n=176; Moderate n=238; Light n=451; No activity n=75)Letters indicate significant differences at the 95% confidence level.Q13
76%
87%E
85%
88%E
86%
24%BD
13%
15%
12%
14%
0% 20% 40% 60% 80% 100%
No activity (E)
Light (D)
Moderate (C)
Vigorous (B)
Total (A)
Level of excessive sleepiness
Normal (0-9) Sleepy (10-24)
Respondents were asked to rate their chance of dozing during activities from “no chance” to “high chance”. Attributes included: Sitting and reading; Watching TV; In a car while stopped for a few minutes in traffic; As a passenger in a car foran hour without a break; Sitting and talking to someone; Sitting quietly after a lunch without alcohol; Lying down to rest inthe afternoon when circumstances permit. These questions were used to calculate a modified version of the Epworth Sleepiness scale or ESS. The NSF used this index to determine the proportion of individuals who are classified as Sleepy vs.Normal.
Nearly one-fourth (24%, significantly higher than vigorous 12% or light 13%) of those who report no activity are classified as Sleepy.
Non-exercisers report worse sleep/health (continued)

28
59%
72%E
68%
76%E
70%
39%BD
28%
31%
24%
29%
2%
1%
<1%
1%
0% 20% 40% 60% 80% 100%
No activity (E)
Light (D)
Moderate (C)
Vigorous (B)
Total (A)
Current Workday Schedule/Routine Allows Adequate Sleep
Yes No Don't know/Not sure/Refused
Base= Total sample (Total n=1,000; Vigorous n=183; Moderate n=250; Light n=477; No activity n=88) Letters indicate significant differences at the 95% confidence level.Q15
Significantly more non-exercisers (39%) than vigorous exercisers (24%) and light exercisers (28%) stated their current workday or weekday schedule or routine does not allow for adequate sleep.
Non-exercisers report worse sleep/health (continued)

29
A version of the validated Sheehan Disability Scale (SDS) was developed to determine the functional impairment in three domains: family life, work life and social life. Each domain is converted to a scale, and the three scales (family, work and social life) make up the total Sheehan Disability Scale. It is recommended that clinicians pay close attention to scores of 6 or greater on any of the three scales, because high scores are associated with significant functional impairment.
The National Sleep Foundation also scaled the mood and intimate or sexual relations, similar to family life, work life and social life attributes, to determine if these factors of impairment are due to lack of sleep and should be brought to the attention of clinicians.
The following page shows the proportion of respondents who claim that not getting adequate sleep adversely affects each domain in question. These questions were asked of those who claim their current workday/weekday routine allows them to get adequate sleep, and conversely of those who claim their workday/weekday routine does not allow for them to get adequate sleep.
The subsequent pages show the detailed scales for each domain of mood, family life, work life, social life and sexual relations followed by a version of the total Sheehan Disability Scale as well as the National Sleep Foundation Disability Index.
A significant difference in impairment is seen between exercisers and non-exercisers on many slides referring to the Sheehan Disability Scale.
Non-exercisers report worse sleep/health (continued)

30
Impact of “Not Getting Enough Sleep” - Those who say they do not get adequate sleep
Activity Levels
Total(A)
Vigorous(B)
Moderate (C)
Light(D)
No activity(E)
Net: Any impact n = (289) (44) (78) (132) (34*)
Mood 82% 80% 83% 82% 85%
Family life or home responsibilities 69 59 72 66 82BD
Work 61 73D 67D 53 62
Social life or leisure activities 64 73 65 63 56
Intimate or sexual relations 51 36 53 53B 56
Base = Those who do not get adequate sleep *Caution: Small BaseLetters indicate significant differences at the 95% confidence level.Q16
Impact of “Not Getting Enough Sleep” - Those who say they get adequate sleep
Activity Levels
Total(A)
Vigorous(B)
Moderate (C)
Light(D)
No activity(E)
Net: Any impact n = (705) (139) (171) (342) (52)
Mood 64% 62% 63% 66% 60%
Family life or home responsibilities 46 47 43 48 38
Work 43 41 42 44 42
Social life or leisure activities 48 53 46 47 46
Intimate or sexual relations 36 37 35 36 40
Base = Those who get adequate sleep Letters indicate significant differences at the 95% confidence level.Q16
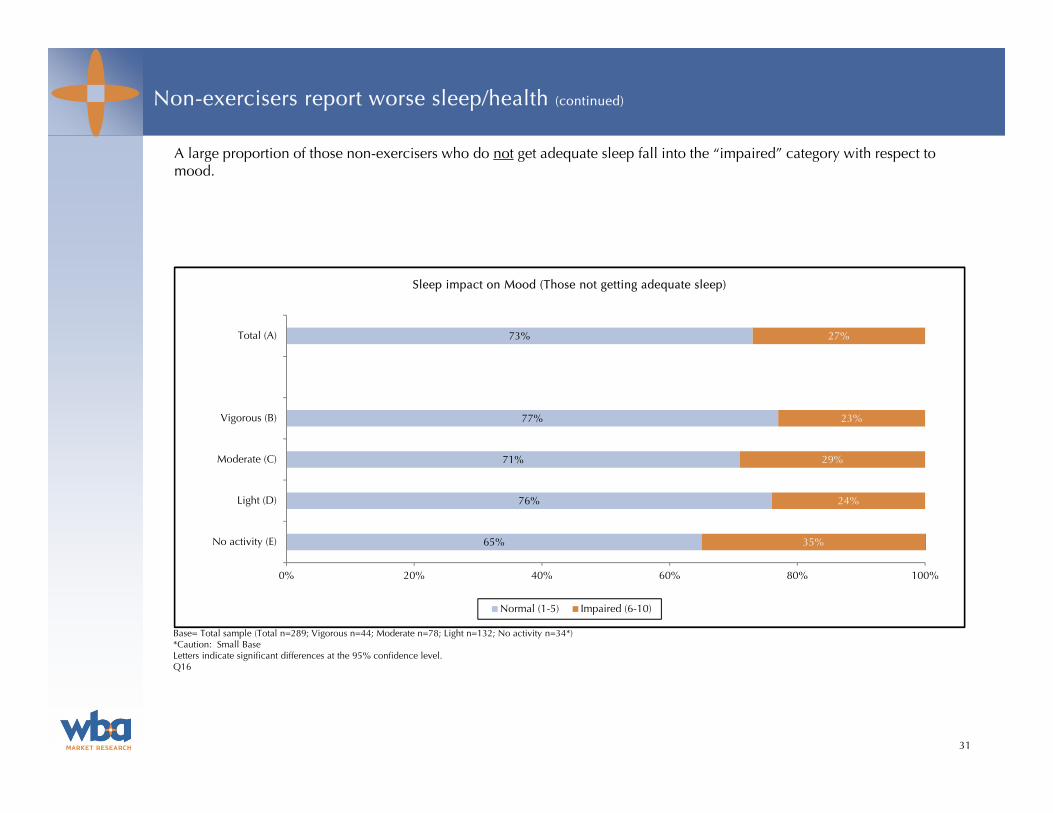
The tables below show the proportion of each segment that report there is any impact on each of the following domains as a result of not getting enough sleep: mood, family life, work life, social life and/or intimate or sexual relations. As mentioned, these are the factors used to calculate the Sheehan Disability Scale. The first table displays results for those whose schedule does not allow for adequate sleep, and the second table displays results for those whose schedule allows for adequate sleep. The following scales are presented in this order.
Non-exercisers report worse sleep/health (continued)
31
65%
76%
71%
77%
73%
35%
24%
29%
23%
27%
0% 20% 40% 60% 80% 100%
No activity (E)
Light (D)
Moderate (C)
Vigorous (B)
Total (A)
Sleep impact on Mood (Those not getting adequate sleep)
Normal (1-5) Impaired (6-10)
Base= Total sample (Total n=289; Vigorous n=44; Moderate n=78; Light n=132; No activity n=34*)*Caution: Small Base Letters indicate significant differences at the 95% confidence level.Q16
A large proportion of those non-exercisers who do not get adequate sleep fall into the “impaired” category with respect to mood.
Non-exercisers report worse sleep/health (continued)
32
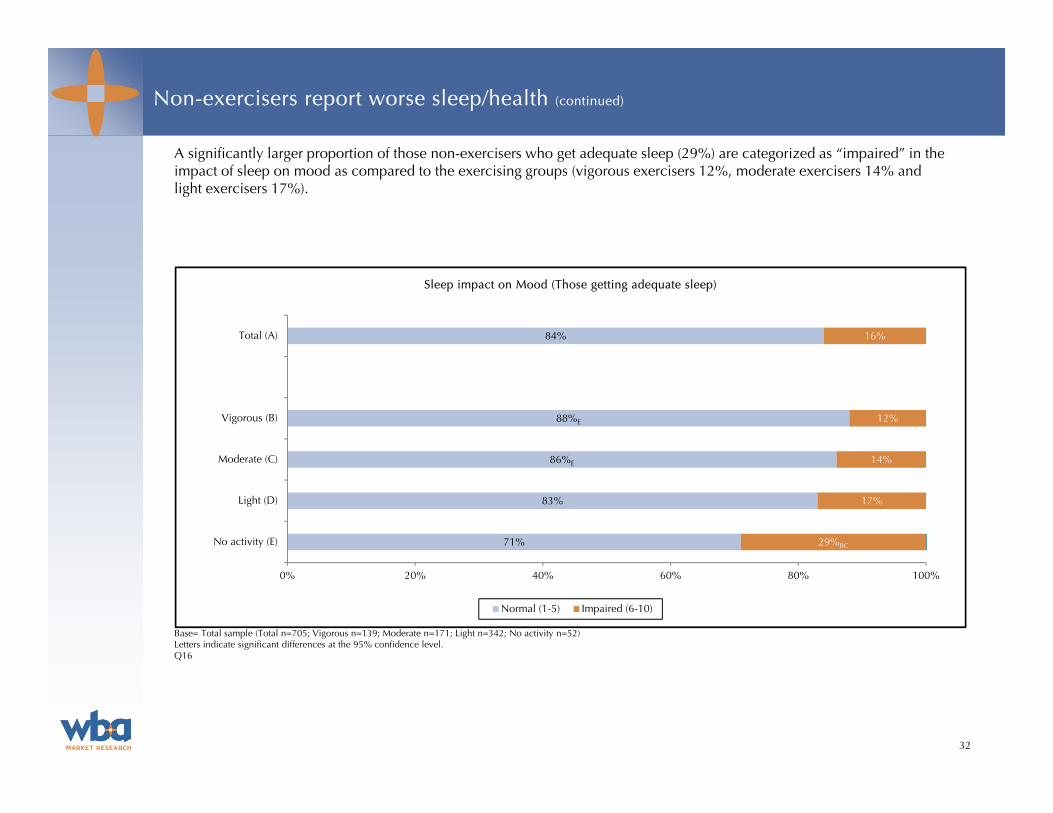
71%
83%
86%E
88%E
84%
29%BC
17%
14%
12%
16%
0% 20% 40% 60% 80% 100%
No activity (E)
Light (D)
Moderate (C)
Vigorous (B)
Total (A)
Sleep impact on Mood (Those getting adequate sleep)
Normal (1-5) Impaired (6-10)
Base= Total sample (Total n=705; Vigorous n=139; Moderate n=171; Light n=342; No activity n=52) Letters indicate significant differences at the 95% confidence level.Q16
A significantly larger proportion of those non-exercisers who get adequate sleep (29%) are categorized as “impaired” in the impact of sleep on mood as compared to the exercising groups (vigorous exercisers 12%, moderate exercisers 14% and light exercisers 17%).
Non-exercisers report worse sleep/health (continued)

33
76%
86%C
73%
95%CDE
83%
24%B
14%B
27%BD
5%
17%
0% 20% 40% 60% 80% 100%
No activity (E)
Light (D)
Moderate (C)
Vigorous (B)
Total (A)
Sleep impact on Family Life (Those not getting adequate sleep)
Normal (1-5) Impaired (6-10)
Base= Total sample (Total n=289; Vigorous n=44; Moderate n=78; Light n=132; No activity n=34*)*Caution: Small Base Letters indicate significant differences at the 95% confidence level.Q16
Interestingly, while nearly one-fourth (24%) of the non-exercisers who do not get adequate sleep are categorized as “impaired” in the impact of sleep on family life, moderate exercisers who do not get adequate sleep have the highest proportion (27%) of those who are “impaired” in the impact of sleep on family life.
Non-exercisers report worse sleep/health (continued)
34
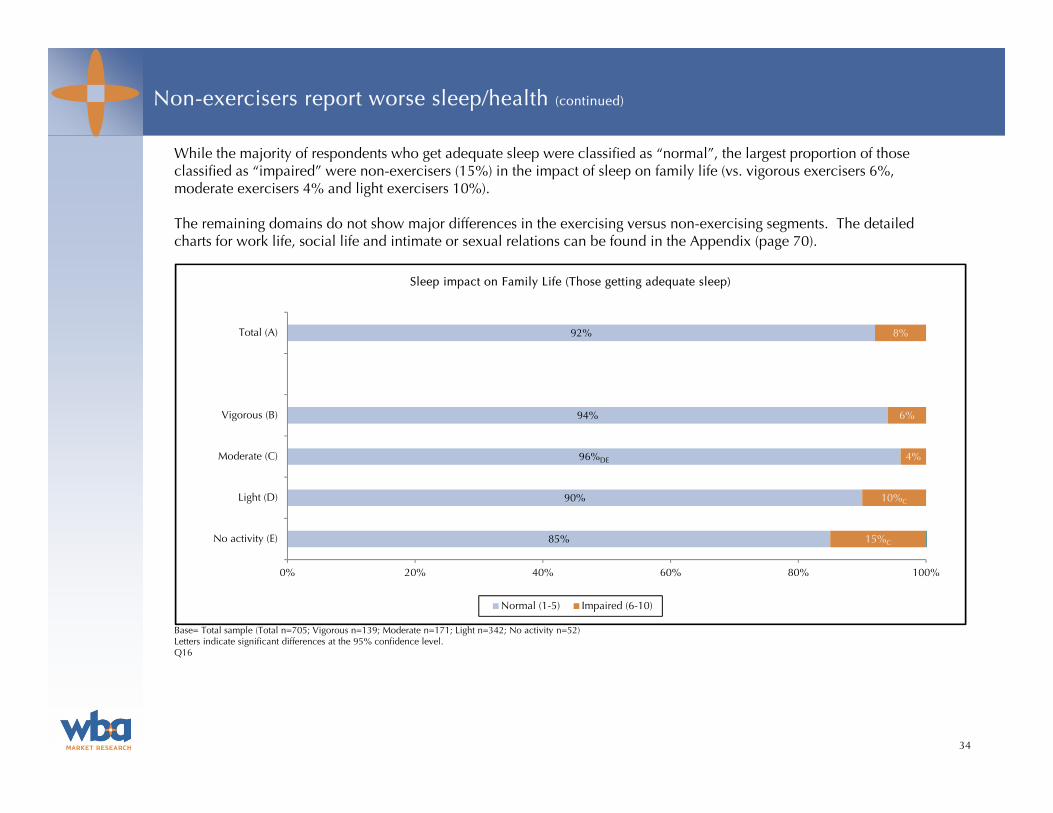
85%
90%
96%DE
94%
92%
15%C
10%C
4%
6%
8%
0% 20% 40% 60% 80% 100%
No activity (E)
Light (D)
Moderate (C)
Vigorous (B)
Total (A)
Sleep impact on Family Life (Those getting adequate sleep)
Normal (1-5) Impaired (6-10)
Base= Total sample (Total n=705; Vigorous n=139; Moderate n=171; Light n=342; No activity n=52) Letters indicate significant differences at the 95% confidence level.Q16
While the majority of respondents who get adequate sleep were classified as “normal”, the largest proportion of those classified as “impaired” were non-exercisers (15%) in the impact of sleep on family life (vs. vigorous exercisers 6%, moderate exercisers 4% and light exercisers 10%).
The remaining domains do not show major differences in the exercising versus non-exercising segments. The detailed charts for work life, social life and intimate or sexual relations can be found in the Appendix (page 70).
Non-exercisers report worse sleep/health (continued)

35
To determine the total Sheehan Disability Scale, the National Sleep Foundation chose to define the level of impairment as any respondent who scored as 6-10 (impaired) on any of the three SDS 10 point scales (work, family or social life). If a respondent did not rate as impaired on any of the 10 point scales, they were scored as normal on the total Sheehan Disability Scale.
Below is the total Sheehan Disability Scale for those not getting adequate sleep, and the next page displays the total Sheehan Disability Scale for those getting adequate sleep.
The highest proportion of those not getting adequate sleep classified as SDS “impaired” were non-exercisers (27%, significantly higher than vigorous exercisers 2%).
73%
90%CE
79%
98%CE
87%
27%B
10%
21%BD
2%
13%
0% 20% 40% 60% 80% 100%
No activity (E)
Light (D)
Moderate (C)
Vigorous (B)
Total (A)
Sheehan Disability Scale (SDS) Total (Those not getting adequate sleep)
Normal Impaired
Base= Total sample (Total n=289; Vigorous n=44; Moderate n=78; Light n=132; No activity n=34*)*Caution: Small Base Letters indicate significant differences at the 95% confidence level.Q16
Non-exercisers report worse sleep/health (continued)

36
84%
93%
97%DE
94%
94%
16%C
7%C
3%
6%
6%
0% 20% 40% 60% 80% 100%
No activity (E)
Light (D)
Moderate (C)
Vigorous (B)
Total (A)
Sheehan Disability Scale (SDS) Total (Those getting adequate sleep)
Normal Impaired
Base= Total sample (Total n=705; Vigorous n=139; Moderate n=171; Light n=342; No activity n=52) Letters indicate significant differences at the 95% confidence level.Q16
The highest proportion of those getting adequate sleep classified as SDS “impaired” were non-exercisers (16%, significantly higher than moderate exercisers 3%).
Non-exercisers report worse sleep/health (continued)
37
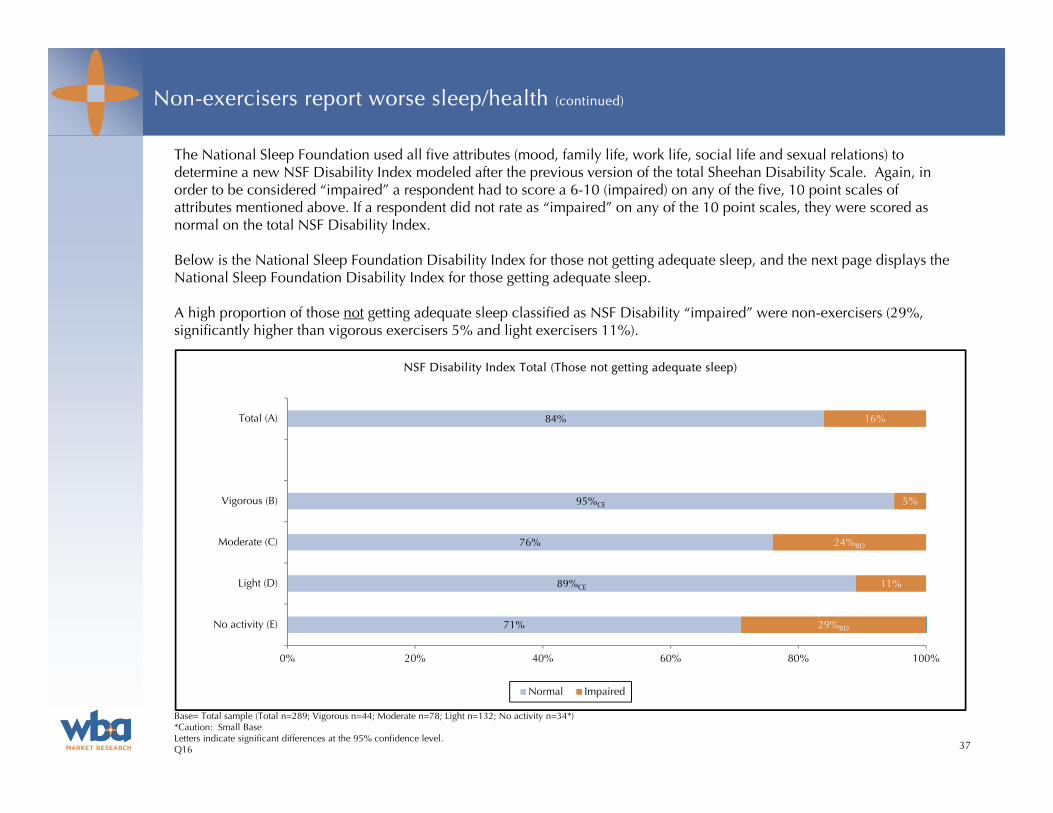
The National Sleep Foundation used all five attributes (mood, family life, work life, social life and sexual relations) to determine a new NSF Disability Index modeled after the previous version of the total Sheehan Disability Scale. Again, in order to be considered “impaired” a respondent had to score a 6-10 (impaired) on any of the five, 10 point scales of attributes mentioned above. If a respondent did not rate as “impaired” on any of the 10 point scales, they were scored as normal on the total NSF Disability Index.
Below is the National Sleep Foundation Disability Index for those not getting adequate sleep, and the next page displays the National Sleep Foundation Disability Index for those getting adequate sleep.
A high proportion of those not getting adequate sleep classified as NSF Disability “impaired” were non-exercisers (29%, significantly higher than vigorous exercisers 5% and light exercisers 11%).
71%
89%CE
76%
95%CE
84%
29%BD
11%
24%BD
5%
16%
0% 20% 40% 60% 80% 100%
No activity (E)
Light (D)
Moderate (C)
Vigorous (B)
Total (A)
NSF Disability Index Total (Those not getting adequate sleep)
Normal Impaired
Base= Total sample (Total n=289; Vigorous n=44; Moderate n=78; Light n=132; No activity n=34*)*Caution: Small Base Letters indicate significant differences at the 95% confidence level.Q16
Non-exercisers report worse sleep/health (continued)

38
83%
90%
94%E
91%
91%
17%C
10%
6%
9%
9%
0% 20% 40% 60% 80% 100%
No activity (E)
Light (D)
Moderate (C)
Vigorous (B)
Total (A)
NSF Disability Index Total (Those getting adequate sleep)
Normal Impaired
Base= Total sample (Total n=705; Vigorous n=139; Moderate n=171; Light n=342; No activity n=52) Letters indicate significant differences at the 95% confidence level.Q16
A high proportion of those getting adequate sleep classified as NSF Disability “impaired” were non-exercisers (17%, significantly higher than moderate exercisers 6%).
Non-exercisers report worse sleep/health (continued)

39
Sleep Apnea Indicator
Activity Levels
Total(A)
Vigorous(B)
Moderate (C)
Light(D)
No activity(E)
Snoring n= (810) (160) (205) (375) (68)
Yes 23% 16% 16% 26%BC 40%BCD
Tiredness n= (810) (160) (205) (375) (68)
Yes 51% 40% 46% 55%BC 72%BCD
Observed apnea n= (810) (160) (205) (375) (68)
Yes 12% 6% 11% 10% 32%BCD
Pressure (High BP) n= (810) (160) (205) (375) (68)
Yes 18% 8% 15%B 21%B 34%BCD
BMI (Higher than 35) n= (810) (160) (205) (375) (68)
Yes 9% 4% 6% 9%B 24%BCD
Age (Higher than 50) n= (810) (160) (205) (375) (68)
Yes 26% 20% 27% 29%B 19%
Gender (Male) n= (810) (160) (205) (375) (68)
Yes 49% 62%CD 49% 43% 49%
Moderate risk of sleep apnea (Score 3-5) n= (810) (160) (205) (375) (68)
Yes 26% 19% 22% 26%B 44%BCD
High risk of sleep apnea (Score Higher than 5) n= (810) (160) (205) (375) (68)
Yes 1% -% <1% 1% 6%
Base= Total sample; Letters indicate significant differences at the 95% confidence level.Q20, Q21, Q22, Q23, S1, S3
The National Sleep Foundation used a modified version of the STOP-BANG questionnaire to determine if respondents were at a moderate or high risk for sleep apnea. Neck circumference was not assessed as a part of this measure. Questions pertaining to snoring, tiredness, stopping breathing, high blood pressure as well as a calculated BMI, gender and age were used to calculate this sleep apnea indicator score.
More than four in ten (44%) non-exercisers are at a moderate risk for sleep apnea, significantly higher than all segments of exercisers. In fact, 6% of non-exercisers are at a high risk for sleep apnea compared to 0%-1% of exercisers.
Non-exercisers report worse sleep/health (continued)

Less time sitting associated with better sleep and health

Segmenting the 2013 data by hours spent sitting in the past seven days demonstrated an interesting finding in the relation between sitting and sleep quality. Those who sit less per day report better sleep quality, as well as better health quality.
Those who say they spent less than 6 hours sitting per day (22%) and those who say they spent 6 to less than 8 hours sitting per day (25%) in the past seven days, report very good sleep quality. This is significantly higher than those who spent 8 to less than 10 hours sitting (15%) or those who spent 10 hours or more sitting (12%) per day in the past seven days.
41
6%
3%
4%
6%
5%
24%B
17%
21%
16%
19%
58%
65%BC
50%
56%
57%
12%
15%
25%DE
22%DE
19%
0% 20% 40% 60% 80% 100%
10 hours or more sitting (E)
8 to <10 hours sitting (D)
6 to <8 hours sitting (C)
<6 hours sitting (B)
Total (A)
Overall Sleep Quality
Very bad Fairly bad Fairly good Very good
Base= Total sample (Total n=1,000; <6 hours n=447;6 to <8 hours n=159;8 to <10 hours n=155;10 hours or more n=199)Letters indicate significant differences at the 95% confidence level.Q30
Less time sitting associated with better sleep and health
42
4%D
1%
1%
3%D
5%
19%
14%
15%
15%
19%
61%
59%
53%
57%
57%
16%
26%E
30%E
25%E
19%
0% 20% 40% 60% 80% 100%
10 hours or more sitting (E)
8 to <10 hours sitting (D)
6 to <8 hours sitting (C)
<6 hours sitting (B)
Total (A)
Overall Health
Poor Fair Good Excellent
Base= Total sample (Total n=1,000; <6 hours n=447;6 to <8 hours n=159;8 to <10 hours n=155;10 hours or more n=199) Letters indicate significant differences at the 95% confidence level.Q24
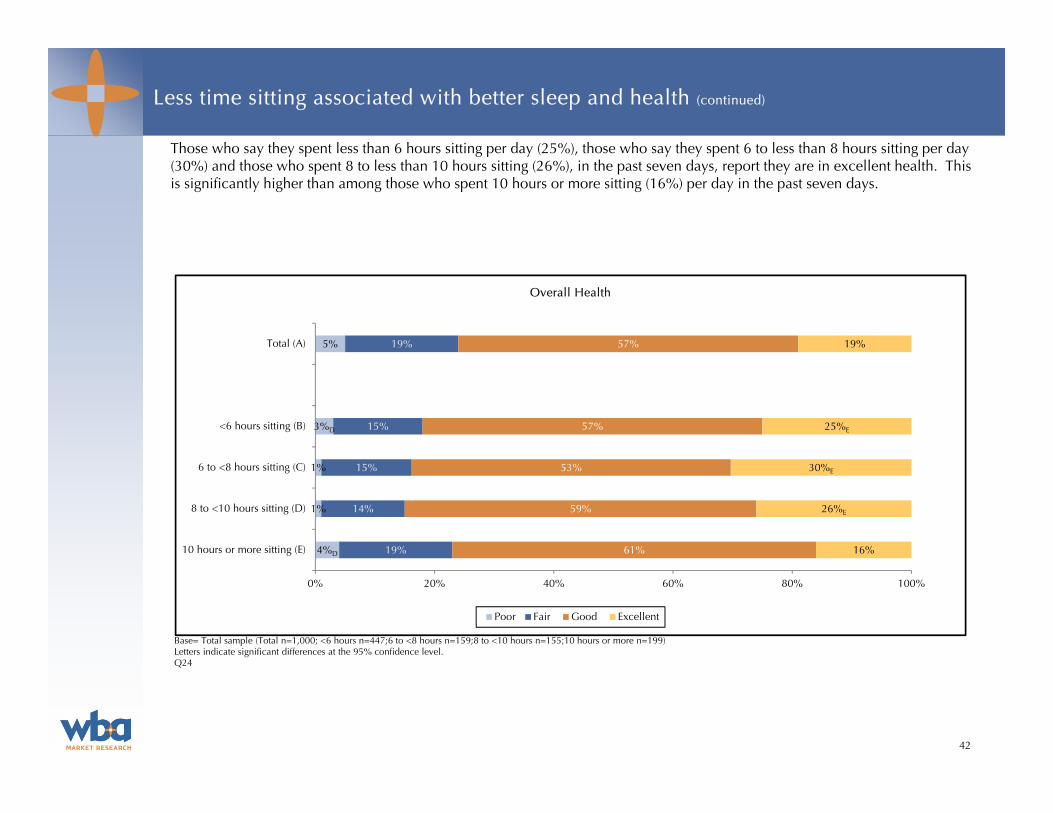
Those who say they spent less than 6 hours sitting per day (25%), those who say they spent 6 to less than 8 hours sitting per day (30%) and those who spent 8 to less than 10 hours sitting (26%), in the past seven days, report they are in excellent health. This is significantly higher than among those who spent 10 hours or more sitting (16%) per day in the past seven days.
Less time sitting associated with better sleep and health (continued)
43
Time spent sitting
Activity Levels
Total(A)
Vigorous(B)
Moderate (C)
Light(D)
No activity(E)
Time per day SITTING n= (1,000) (183) (250) (477) (88)
Less than 6 hours 45% 43% 53%BDE 43%E 32%
6 to less than 8 hours 16 15 16 17 11
8 hours or more 35 41C 27 36C 48CD
Average amount of time (hours) 6h 20m 6h 22mC 5h 32m 6h 27mC 8h 5mBCD
What time of day1 n= (1,000) (183) (250) (477) (88)
More than 8 hours before bed 36% 39% 34% 36% 39%
4 to 8 hours before bed 44 42 45 45 44
4 or more hours before bed 67 67 64 68 69
Less than 4 hours before bed 44 43 48E 45 34
Don’t know/Not sure/Refused 3 4 2 3 6
Base= Total sample1Multiple responses accepted; B= Those doing _____ activity Letters indicate significant differences at the 95% confidence level.Q42, Q44
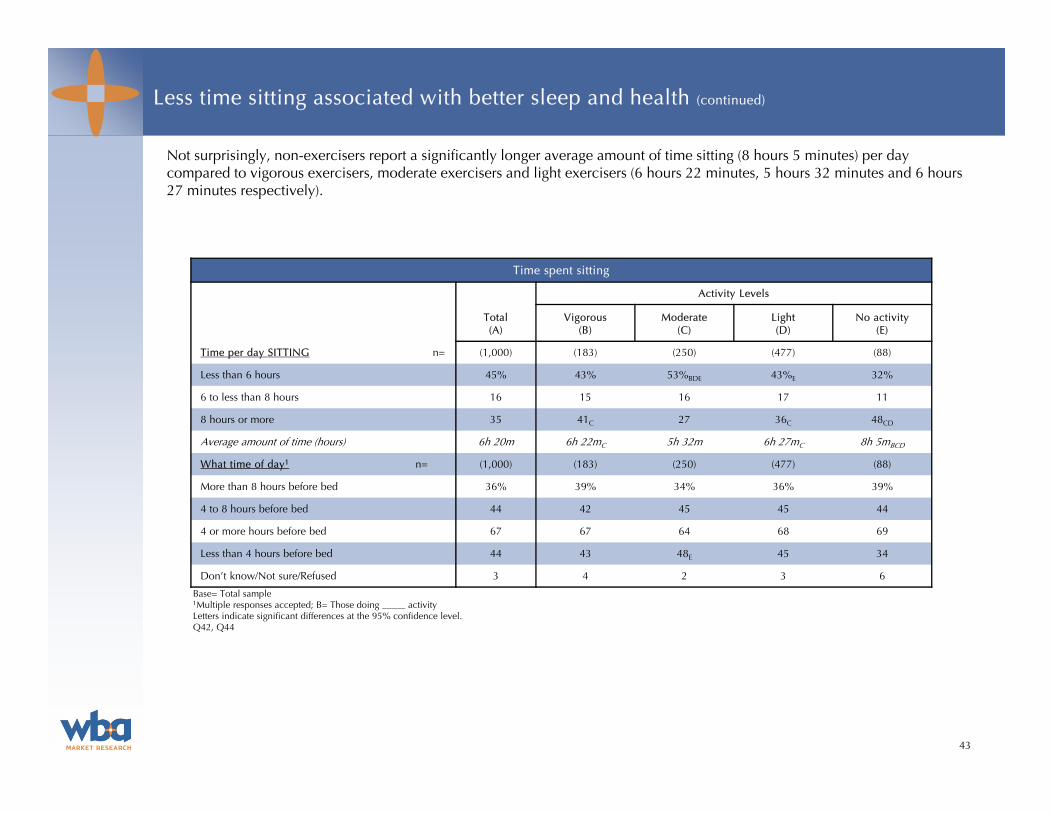
Not surprisingly, non-exercisers report a significantly longer average amount of time sitting (8 hours 5 minutes) per day compared to vigorous exercisers, moderate exercisers and light exercisers (6 hours 22 minutes, 5 hours 32 minutes and 6 hours27 minutes respectively).
Less time sitting associated with better sleep and health (continued)

44
Base= Total sample (Total n=1,000; Vigorous n=183; Moderate n=250; Light n=477; No activity n=88) Letters indicate significant differences at the 95% confidence level.Q42
12%
12%
20%D
16%
15%
31%
48%E
50%E
42%
46%
10%
15%
14%
22%CE
16%
38%BCD
21%C
13%
19%
20%
9%B
4%B
4%B
1%
4%
0% 20% 40% 60% 80% 100%
No activity (E)
Light (D)
Moderate (C)
Vigorous (B)
Total (A)
Time spent sitting per day in the past 7 days
Less than 3 hours 3 to less than 8 hours 8 to less than 10 hours 10 hours or more Don't know/Not sure/Refused
Average time sitting:
6h 20m
6h 22mC
5h 32m
6h 27mC
8h 5mBCD
Significantly more non-exercisers report sitting for more than 10 hours (38%) per day compared to vigorous exercisers (19%), moderate exercisers (13%) and light exercisers (21%).
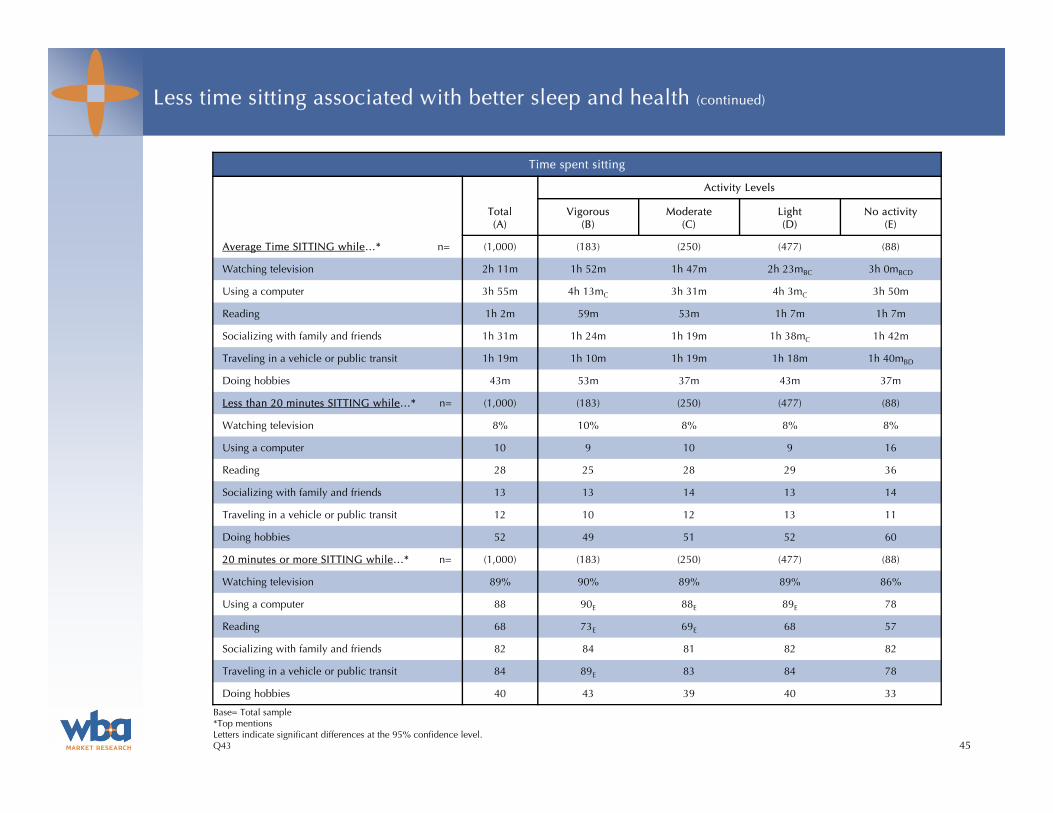
The following page displays activities done while sitting in the past seven days along with the average lengths of time the activity was performed. More data on sitting can be found in the Appendix (page 76).
Less time sitting associated with better sleep and health (continued)
45
Time spent sitting
Activity Levels
Total(A)
Vigorous(B)
Moderate (C)
Light(D)
No activity(E)
Average Time SITTING while…* n= (1,000) (183) (250) (477) (88)
Watching television 2h 11m 1h 52m 1h 47m 2h 23mBC 3h 0mBCD
Using a computer 3h 55m 4h 13mC 3h 31m 4h 3mC 3h 50m
Reading 1h 2m 59m 53m 1h 7m 1h 7m
Socializing with family and friends 1h 31m 1h 24m 1h 19m 1h 38mC 1h 42m
Traveling in a vehicle or public transit 1h 19m 1h 10m 1h 19m 1h 18m 1h 40mBD
Doing hobbies 43m 53m 37m 43m 37m
Less than 20 minutes SITTING while…* n= (1,000) (183) (250) (477) (88)
Watching television 8% 10% 8% 8% 8%
Using a computer 10 9 10 9 16
Reading 28 25 28 29 36
Socializing with family and friends 13 13 14 13 14
Traveling in a vehicle or public transit 12 10 12 13 11
Doing hobbies 52 49 51 52 60
20 minutes or more SITTING while…* n= (1,000) (183) (250) (477) (88)
Watching television 89% 90% 89% 89% 86%
Using a computer 88 90E 88E 89E 78
Reading 68 73E 69E 68 57
Socializing with family and friends 82 84 81 82 82
Traveling in a vehicle or public transit 84 89E 83 84 78
Doing hobbies 40 43 39 40 33
Base= Total sample*Top mentionsLetters indicate significant differences at the 95% confidence level.Q43
Less time sitting associated with better sleep and health (continued)

Exercise is good, regardless of time of day

47
Exercise is good, regardless of time of day
While some believe exercising near bedtime can adversely affect sleep and sleep quality, no major differences were found between the data for individuals who say they have done vigorous and/or moderate activity within four hours of bedtime compared to their counterparts (those who did vigorous or moderate activity more than four hours before bedtime). According to the 2013 Sleep in America® poll, the conclusion can be drawn that exercise, or physical activity in general, is generally good for sleep, regardless of the time of day the activity is performed.
The following two pages show the data for the key questions examined by the segments of those who did vigorous and/or moderate activity within four hours of bedtime and those who did vigorous and/or moderate activity more than four hours before bedtime.

48
Exercise is good, regardless of time of day (continued)
Vigorous/Moderate Activity within 4 hours of Bedtime
Vigorous/Moderate Activity within 4 hours of Bedtime (B)
Vigorous/Moderate Activity more than 4 hours before Bedtime (C)
Modified Epworth Sleepiness Scale n= (218) (518)
Sleepy 16% 14%
Normal 84 86
Overall Sleep Quality n= (231) (542)
Very good 17% 22%
Fairly good 59 58
Fairly bad 19 17
Very bad 6 4
Overall Health Quality n= (231) (542)
Excellent 26% 27%
Good 57 57
Fair 14 15
Poor 3C 1
Quality of Sleep on Exercise Days n= (231) (542)
Improves 55% 54%
Worsens 3 2
No difference 39 42
Don’t know/Refused/No exercise 3 2
Length of Sleep on Exercise Days n= (231) (542)
Improves 33% 29%
Worsens 2 2
No difference 63 67
Don’t know/Refused/No exercise 2 2
Base= Total sampleLetters indicate significant differences at the 95% confidence level.Q13,Q30,Q24,Q45,Q46

49
Vigorous/Moderate Activity within 4 hours of Bedtime
Vigorous/Moderate Activity within 4 hours of Bedtime (B)
Vigorous/Moderate Activity more than 4 hours before Bedtime (C)
Workday/Weekday Routine allows for Adequate Sleep n= (231) (542)
Yes 65% 73%B
No 33 27
Don’t know/Refused 1 -
More likely to exercise on weekend days or work days n= (231) (542)
Much more likely on weekend days 20% 20%
A little more likely on weekend days 11 10
No difference 35 33
A little more likely on weekdays 11 9
Much more likely on weekdays 18 26%B
Do not exercise 3 3
Don’t know/Not sure/Refused <1 <1
Base= Total sampleLetters indicate significant differences at the 95% confidence level.Q15, Q48
Exercise is good, regardless of time of day (continued)
An interesting finding in this comparison is that those who are doing vigorous and/or moderate activity more than four hours before bedtime (73%) are more likely to say their workday or weekday routine allows for adequate sleep as compared to their counterparts (65%).

Other sleep habits

6:10 AM
7:33 AM
11:47 PM
11:01 PM
9:00 PM
10:00 PM
11:00 PM
12:00 AM
1:00 AM
2:00 AM
3:00 AM
4:00 AM
5:00 AM
6:00 AM
7:00 AM
8:00 AM
9:00 AM
10:00 AM
Other sleep habits
Total(n=1,000)
Typical Workday and Non-Workday(Average Wake Time; Average Bed Time;
Average Hours Slept – Self Reported)
51
6h 51m
7h37m
Base = Total sampleDK/Ref = <1% - 2%Note: See note on next page on how times are derived. Q1, Q2, Q3, Q4, Q5, Q6
Workday/WeekdayNon-Workday/Weekend
Respondents were asked when they typically go to bed, wake up and how long they sleep on both a typical school day, workday or weekday and non-school day, non-workdays or weekends.
Overall, respondents’ bed times (11:01 PM vs. 11:47 PM), wake times (6:10 AM vs. 7:33 AM) and length of time slept (6 hours 51 minutes vs. 7 hours 37 minutes) on weekends were roughly one hour later or longer on average than on weekdays.
Those who classify themselves as performing moderate activity and those who classify themselves as performing light activity report a significantly later wake time (7:38 AM each) on weekends than those who consider themselves to do no activity (6:45 AM).
Interestingly, light exercisers also report a significantly later wake-time (6:14 AM) than non-exercisers on weekdays (5:51 AM).
Those who classify themselves as light exercisers have a significantly later bed time on weekdays (11:09 PM) than those who consider themselves moderate exercisers (10:46 PM).

10:46 PM
11:40 PM11:09 PM
11:51 PM
11:00 PM
11:49 PM
6:01 AM
7:37 AM
6:16 AM
7:38 AM
6:14 AM
7:38 AM
5:51 AM
6:45 AM
11:45 PM
11:06 PM
9:00 PM
10:00 PM
11:00 PM
12:00 AM
1:00 AM
2:00 AM
3:00 AM
4:00 AM
5:00 AM
6:00 AM
7:00 AM
8:00 AM
9:00 AM
10:00 AM
Workday/Weekday Non-Workday/Weekend
Other sleep habits (continued)
Typical Workday/Weekday and Non-Workday/Weekend(Average Wake Time; Average Bed Time; Average Hours Slept – Self Reported)
Base = Total sampleDK/Ref = 0% – 6% Note: Wake/Bed times are averages derived by using ranges of times (i.e. between 7:00 AM – 7:14 AM), while hours slept is collected by asking respondents for hours and minutes they usually sleep in one night. Letters indicate significant differences at the 95% confidence level.Q1, Q2, Q3, Q4, Q5, Q6 52
E
6h 48m
7h40m
6h 57m
7h41m
6h 50m
7h34m
6h 43m
7h36m
C
E E
Vigorous (B)(n=183)
Moderate (C)(n=250)
Light (D)(n=477)
No Activity (E)(n=88)

Sleep and exercise ratings

54
7% 55% 32% 6%
0% 20% 40% 60% 80% 100%
Total (A)
Effect exercise has on awakening during the night
More time awake No effect Less time awake Do not exercise
Sleep and exercise ratings
Effect of Exercise on Sleep
Activity Levels
Total(A)
Vigorous(B)
Moderate (C)
Light(D)
No activity(E)
Effect exercise has on awakening during the night n= (1,000) (183) (250) (477) (88)
Much more time awake 2% 2% 2% 1% 3%
A little more time awake 5 4 6E 5E 1
No effect 55 57 54 56 48
A little less time awake 20 22 26DE 17 14
Much less time awake 12 11 11 13 8
Do not exercise 6 2 1 6BC 23BCD
Don’t know/Not sure/Refused 1 1 - 2 3
Base= Total sampleLetters indicate significant differences at the 95% confidence level.Q47
Overall, more than one-half of respondents (55%) mentioned they feel that exercise has no effect on awakening during the night.
Don’t know/Not sure/Refused: 1%

55
Effect of Exercise on Sleep (continued)
Activity Levels
Total(A)
Vigorous(B)
Moderate (C)
Light(D)
No activity(E)
More likely to exercise on weekend days or workdays n= (1,000) (183) (250) (477) (88)
Much more likely on weekend days 19 14 17 23B 17
A little more likely on weekend days 11 9 11 12 11
No difference 33 36E 33 33E 23
A little more likely on weekdays 10 9 6 11C 9
Much more likely on weekdays 21 30DE 30DE 14 12
Do not exercise 6 2 2 6BC 26BCD
Don’t know/Not sure/Refused 1 1 1 <1 1
Base= Total sampleLetters indicate significant differences at the 95% confidence level.Q48
Sleep and exercise ratings (continued)
30% 33% 31% 6%
0% 20% 40% 60% 80% 100%
Total (A)
More likely to exercise on weekend days or workdays
More likely on weekend days No difference More likely on workdays Do not exercise
One-third (33%) mentioned there is no difference between workdays and weekend days as to when they are more likely to exercise. Interestingly, vigorous and moderate exercisers are significantly more likely than light and non-exercisers to exercise on weekdays than weekend days (30% each vs. 14% and 12%).
Don’t know/Not sure/Refused: 1%
56
Effect of Exercise on Sleep (continued)
Activity Levels
Total(A)
Vigorous(B)
Moderate (C)
Light(D)
No activity(E)
Level of physical activity after a night of little or poor sleep n= (1,000) (183) (250) (477) (88)
Much less than usual 24% 20% 24% 26% 25%
A little less than usual 33 34E 36E 34E 19
The same as usual 33 43DE 36E 29 24
More than usual 4 2 3 4 6
Do not exercise 6 2 1 6BC 22BCD
Don’t know/Not sure/Refused 1 1 <1 <1 5
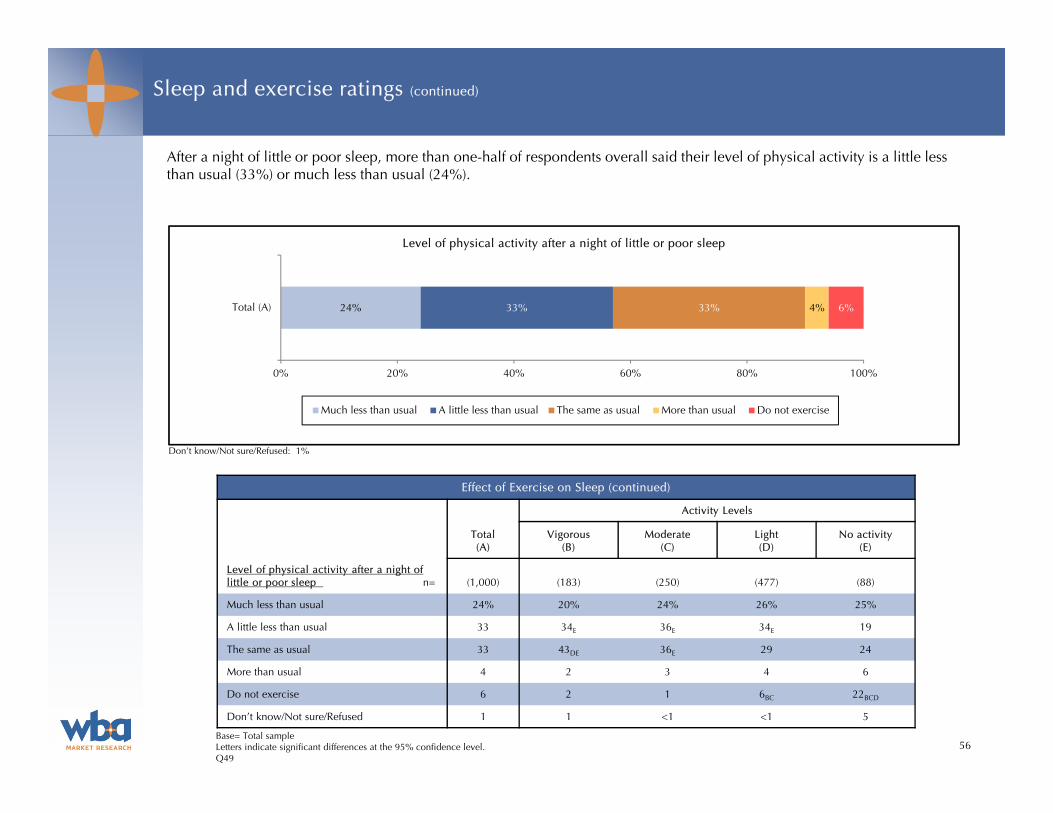
Base= Total sampleLetters indicate significant differences at the 95% confidence level.Q49
Sleep and exercise ratings (continued)
24% 33% 33% 4% 6%
0% 20% 40% 60% 80% 100%
Total (A)
Level of physical activity after a night of little or poor sleep
Much less than usual A little less than usual The same as usual More than usual Do not exercise
After a night of little or poor sleep, more than one-half of respondents overall said their level of physical activity is a little less than usual (33%) or much less than usual (24%).
Don’t know/Not sure/Refused: 1%
57
24% 65% 4% 6%
0% 20% 40% 60% 80% 100%
Total (A)
Effect on sleep when you are unable to exercise on a day you typically would
Worse No different Better Do not exercise
Sleep and exercise ratings (continued)
Effect of Exercise on Sleep (continued)
Activity Levels
Total(A)
Vigorous(B)
Moderate (C)
Light(D)
No activity(E)
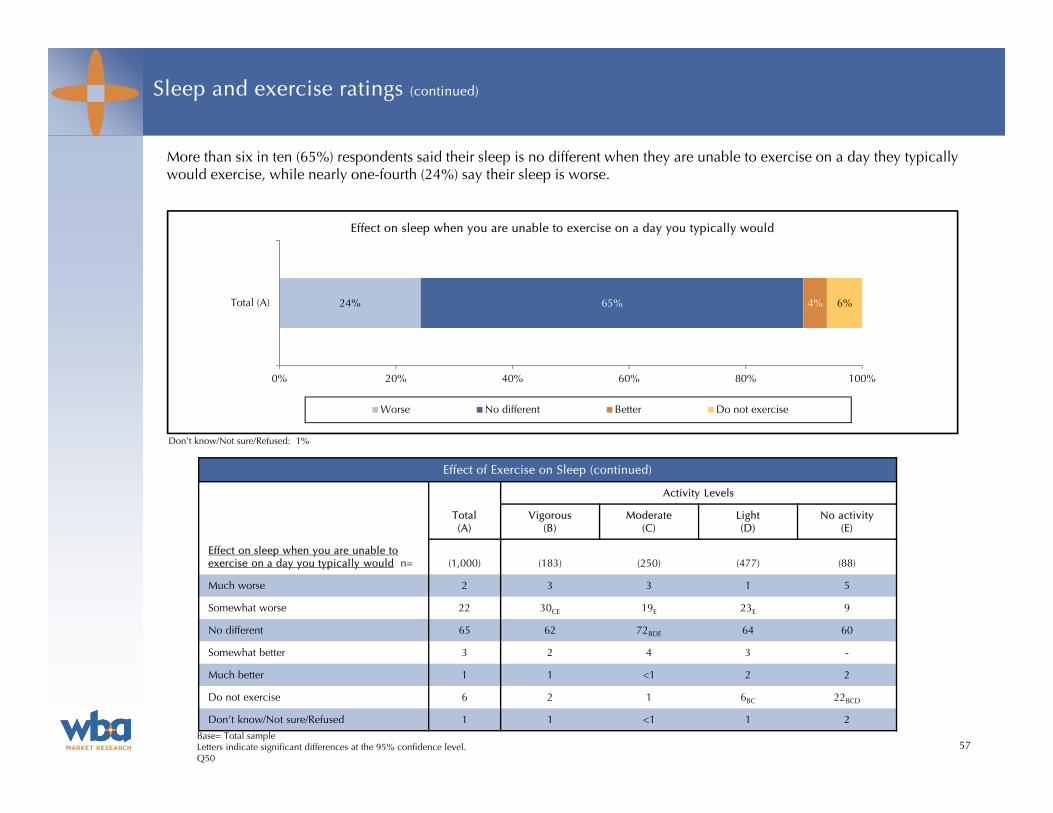
Effect on sleep when you are unable to exercise on a day you typically would n= (1,000) (183) (250) (477) (88)
Much worse 2 3 3 1 5
Somewhat worse 22 30CE 19E 23E 9
No different 65 62 72BDE 64 60
Somewhat better 3 2 4 3 -
Much better 1 1 <1 2 2
Do not exercise 6 2 1 6BC 22BCD
Don’t know/Not sure/Refused 1 1 <1 1 2
Base= Total sampleLetters indicate significant differences at the 95% confidence level.Q50
More than six in ten (65%) respondents said their sleep is no different when they are unable to exercise on a day they typicallywould exercise, while nearly one-fourth (24%) say their sleep is worse.
Don’t know/Not sure/Refused: 1%

No activity indoors
9%
1%-50% activity indoors
33%
51%-99% activity indoors
36%
All activity indoors
16%
Activity done Indoors versus Outdoors
58
Activity level and behavior (continued)
Percentage of Activity done Indoors versus Outdoors
Activity Levels
Total(A)
Vigorous(B)
Moderate (C)
Light(D)
No activity(E)
Percentage of Activity done Indoors n= (1,000) (183) (250) (477) (88)
None (0%) 9% 14%CE 4% 10%C 6%
1%-25% 12 15 11 14 -
26%-50% 21 23E 26E 21E 6
51%-75% 14 12 16E 15E 7
76%-99% 22 19 24 22 18
All (100%) 16 16 15 13 34BCD
Do not exercise 5 - 1 4C 27CD
Don’t know/Not sure/Refused 1 - 2 1 2
Base= Total sampleLetters indicate significant differences at the 95% confidence level. Q35
Notably, more than one in seven (16%) of all respondents say they do all of their activity indoors.

Personal habits and behaviors

Smoking
60
17%
17%B
14%
10%
15%
5%
6%
6%
4%
6%
19%
17%
15%
14%
16%
59%
60%
65%
73%DE
64%
0% 20% 40% 60% 80% 100%
No activity (E)
Light (D)
Moderate (C)
Vigorous (B)
Total (A)
Ever smoked cigarettes, cigars or a pipe
Yes, Currently Yes, quit less than 3 years ago Yes, quit more than 3 years ago No, Never smoked
Base= Total sample (Total n=1,000; Vigorous n=183; Moderate n=250; Light n=477; No activity n=88) Letters indicate significant differences at the 95% confidence level.Q25
Net: Ever
36%
27%
35%
40%B
41%B
Almost three-fourths (73%) of vigorous exercisers say they have never smoked cigarettes, cigars or a pipe which is significantlyhigher than light exercisers or non-exercisers (60% and 59% respectively).

Alcoholic Beverages
61
Alcoholic Beverages
Activity Levels
Total(A)
Vigorous(B)
Moderate (C)
Light(D)
No activity(E)
Drink Alcoholic Beverages n= (1,000) (183) (250) (477) (88)
Yes 60% 67%DE 70%DE 57%E 40%
No 40 33 30 43BC 60BCD
Days had a beverage in the last 2 weeks1 n= (602) (122) (174) (270) (35)
Zero days 14% 11% 14% 15% 17%
1 to 3 days 50 44 49 53 49
4 to 6 days 18 25D 17 16 17
7 to 10 days 10 14 9 9 9
More than 10 days 8 6 11 7 9
Average number of days 3.6 4.0 3.8 3.4 3.5
Number of beverages normally consumed1 n= (602) (122) (174) (270) (35)
1 to 2 drinks 75% 70% 80%BE 77% 60%
3 to 5 drinks 20 25 18 19 26
6 to 9 drinks 3 2 2 4 3
10 drinks or more 1 2 - 1 9
Average number of drinks 2.3 2.5C 2.1 2.3 3.2CD
Base= Total sample1Base= Those who drink alcoholic beverages Letters indicate significant differences at the 95% confidence level.Q26, Q27, Q28
Interestingly, six in ten (60%) non-exercisers say they do not drink alcoholic beverages. This is significantly higher than vigorous, moderate and light exercisers.

Drowsy Driving
62
8%
5%
6%
5%
6%
6%
7%
8%
7%
7%
24%
18%
21%
20%
20%
6%
18%E
18%E
23%E
18%
47%
49%C
41%
44%
46%
9%BD
3%
5%B
1%
4%
0% 20% 40% 60% 80% 100%
No activity (E)
Light (D)
Moderate (C)
Vigorous (B)
Total (A)
Drowsy Driving
3 or more times a week 1 to 2 times a week1 to 2 times a month Less than once a monthHave not driven drowsy Don't drive/Don't have a license
Net: At least once
a month
32%
32%
36%
30%
38%
Base= Total sample (Total n=1,000; Vigorous n=183; Moderate n=250; Light n=477; No activity n=88) Letters indicate significant differences at the 95% confidence level.Q51
Nearly one-third (32%) of all respondents say they drive drowsy at least once a month.

Appendix

64
Methodology
The National Sleep Foundation has conducted the Sleep in America® poll annually since 1991. The poll is representative of the U.S. population with a primary focus of this year’s poll being to evaluate the relationship between physical activity, exercise and sleep.
A total of 1,000 surveys were conducted among a sample of Americans in order to collect the information to fulfill the objectives previously cited. Specifically, 500 surveys were completed via the Web using an E-Rewards online panel of Americans who met the qualifications set for the study. An additional 500 completes were gathered via CATI telephone interviewing from listed,random digit dial and cell phone telephone sample. The telephone interviewing was completed by WB&A’s in-house professional interviewing staff.
In order to qualify for this study, respondents had to be between the ages of 23 and 60. The number of completes needed for both age groups and regions was determined using the most current U.S. Census data from 2010.
In survey research, the entire population is not typically interviewed, but rather a sample of that population is polled. Therefore, the data are subject to sampling error. The maximum sampling error of the data for the total sample (1,000 interviews) is ±3.1 percentage points at the 95% confidence level. The sampling error will vary depending on the sample size and the percentagesbeing examined in the sample. For more detail on the sampling error, please see the Appendix (page 66).
Completed Surveys
23-29 177 Northeast 178
30-39 266 Midwest 217
40-49 272 West 232
50-60 285 South 373
TOTAL 1,000 TOTAL 1,000

Methodology (continued)
The survey methodology is subject to some limitations: First, not everyone is connected via the Internet and all respondents are not equally computer literate. Second, while no bias may be apparent, there may be some bias with regards to being part of an online panel or completing an online survey. Furthermore, the age of respondents interviewed on the telephone tends to skew towards an older population.
Upon completion, interviews were edited, coded and keypunched, and the data were then computer cross-tabulated. All of the study percentages have been rounded to the nearest whole percentage. Percentages may not add up to 100% due to rounding.
All surveys were conducted with the respondents themselves.
Significant differences at the 95% confidence level are shown between the segmented groups through the use of letters. For example, if a significant difference was found between Vigorous exercisers and Moderate exercisers, there would be a “B” with the percentage if the Vigorous exercisers were found to be significantly more likely to have given that survey answer. Likewise, there would be a “C” with the percentage if Moderate exercisers were found to be significantly more likely to have given that survey answer.
The National Sleep Foundation does not solicit or accept corporate support for its annual Sleep in America® polls; its polls are developed by an independent task force of sleep scientists and government representatives who provide guidance and expertise in developing the poll questionnaire as well as providing the analysis of the data. All poll task force members have provided disclosures of relevant financial relationships that may be related to the subject matter. Information about the National SleepFoundation, the current and former polls and a database of sleep professionals and sleep centers can be found online at www.sleepfoundation.org.
The National Sleep Foundation recommends that researchers and writers citing the Sleep in America® poll use the National Library of Medicine Recommended Formats for Bibliographic Citation as follows:
National Sleep Foundation. 2013 Sleep in America Poll: Exercise and Sleep. Washington (DC): The Foundation; 2013 Mar. Available from: http:www.sleepfoundation.org/2013poll
When referring to this poll in an article or story, please refer to it as the “National Sleep Foundation 2013 poll” and link it to www.sleepfoundation.org/2013poll. 65

Standard Error
Because in research the entire population is typically not interviewed, but rather a sample of that population is surveyed, the data are subject to sampling error. A sample size of 1,000 will yield data with a maximum fluctuation of ±3.1 percentage points at the 95% confidence level. However, the actual standard error may be smaller, depending on the data being examined. Standard errors are shown below for various study percentages and by occupation, at the 95% confidence level:
If the study percentage is around:
50%
40% or
60%
30% or
70%
20% or
80%
10% or
90%
1% or
99%Then, the standard error in percentage points is:
Total Sample (n=1,000) ±3.1 ±3.0 ±2.8 ±2.5 ±1.9 ±0.6
Quartile 1 (n=298) ±5.7 ±5.6 ±5.2 ±4.5 ±3.4 ±1.1
Quartile 2 (n=253) ±6.2 ±6.0 ±5.6 ±4.9 ±3.7 ±1.2
Quartile 3 (n=233) ±6.4 ±6.3 ±5.9 ±5.1 ±3.9 ±1.3
Quartile 4 (n=216) ±6.7 ±6.5 ±6.1 ±5.3 ±4.0 ±1.3
For example, if a question yielded a percentage of 20% among the Total Sample, then we can be sure 95 out of 100 times that the true percentage would lie between 17.5% and 22.5% (20% ±2.5 percentage points).
66

67
Characteristics of Respondents
Activity Levels
Total(A)
Vigorous(B)
Moderate (C)
Light(D)
No activity(E)
Age n= (1,000) (183) (250) (477) (88)
23 to 29 18% 24%DE 20% 15% 12%
30 to 39 27 30 26 26 26
40 to 49 27 25 26 28 32
50 to 60 28 22 28 31B 30
Mean 42.0 39.9 41.3 42.8B 43.2B
Median 42.0 38.0 41.0 43.0 43.0
Gender n= (1,000) (183) (250) (477) (88)
Male 48% 64%CDE 48% 42% 48%
Female 52 36 52B 58B 52B
Region n= (1,000) (183) (250) (477) (88)
Northeast 18% 15% 18% 18% 23%
Midwest 22 17 20 24B 25
South 37 41 34 38 33
West 23 27D 28D 20 19
Base= Total sampleLetters indicate significant differences at the 95% confidence level.QS1, QS3, QS4
Characteristics of Respondents
The following pages detail the characteristics and demographic information of the respondents surveyed.

Characteristics of Respondents (continued)
Characteristics of Respondents (continued)
Activity Levels
Total(A)
Vigorous(B)
Moderate (C)
Light(D)
No activity(E)
Marital Status n= (1,000) (183) (250) (477) (88)
Married or partnered 64% 66% 66% 65% 56%
Single 22 20 22 21 27
Living with someone 5 8C 3 5 6
Divorced 5 3 6 5 6
Widowed 2 1 1 1 5
Separated 1 2 2 1 -
Refused 1 1 <1 1 1
Employment Status n= (1,000) (183) (250) (477) (88)
Employed full or part-time 77% 84%DE 80%E 77%E 57%
Homemaker 8 4 7 10B 10
Not working or retired 9 7 9 8 17BD
Something else 6 5 4 6 15BCD
Don’t know/Refused <1 - - <1 1
Highest Level of Education n= (1,000) (183) (250) (477) (88)
High school diploma or less 14% 7% 10% 18%BC 28%BCD
Some college/Associate’s Degree 29 17 29B 35B 25
Four year degree or more 56 75CDE 61DE 47 45
Base= Total sampleLetters indicate significant differences at the 95% confidence level.Q53, S2, Q54
68
69
Characteristics of Respondents (continued)
Activity Levels
Total(A)
Vigorous(B)
Moderate (C)
Light(D)
No activity(E)
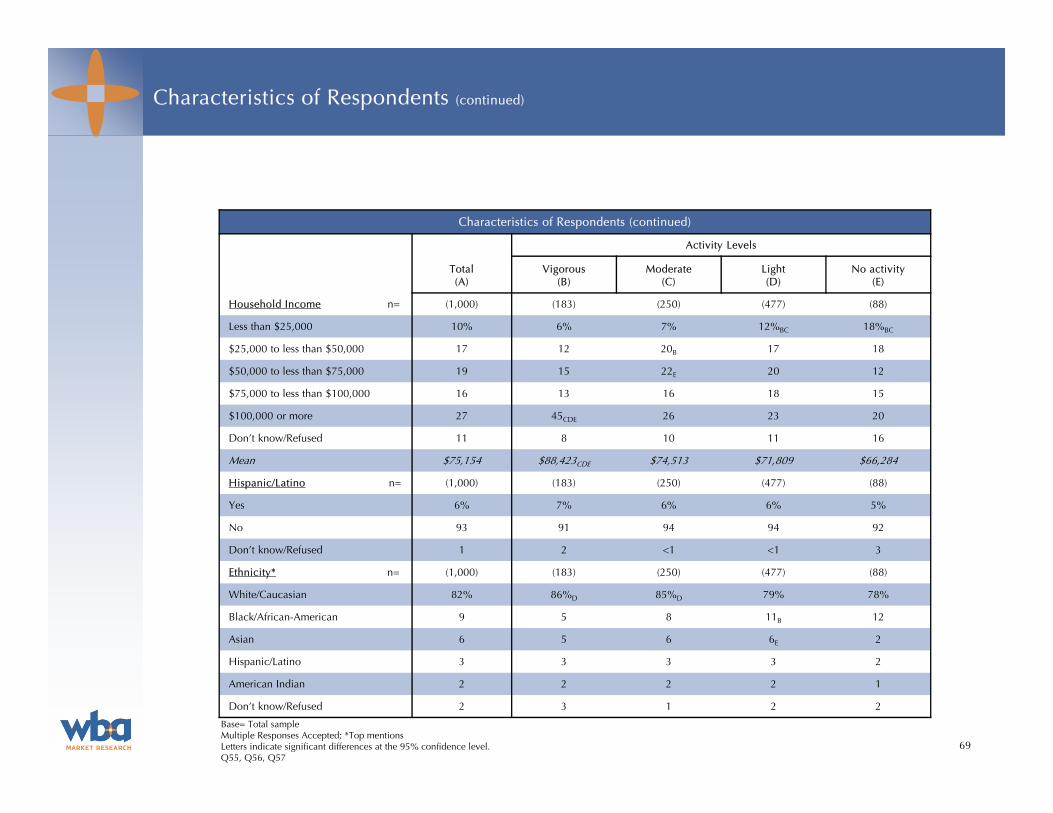
Household Income n= (1,000) (183) (250) (477) (88)
Less than $25,000 10% 6% 7% 12%BC 18%BC
$25,000 to less than $50,000 17 12 20B 17 18
$50,000 to less than $75,000 19 15 22E 20 12
$75,000 to less than $100,000 16 13 16 18 15
$100,000 or more 27 45CDE 26 23 20
Don’t know/Refused 11 8 10 11 16
Mean $75,154 $88,423CDE $74,513 $71,809 $66,284
Hispanic/Latino n= (1,000) (183) (250) (477) (88)
Yes 6% 7% 6% 6% 5%
No 93 91 94 94 92
Don’t know/Refused 1 2 <1 <1 3
Ethnicity* n= (1,000) (183) (250) (477) (88)
White/Caucasian 82% 86%D 85%D 79% 78%
Black/African-American 9 5 8 11B 12
Asian 6 5 6 6E 2
Hispanic/Latino 3 3 3 3 2
American Indian 2 2 2 2 1
Don’t know/Refused 2 3 1 2 2
Base= Total sampleMultiple Responses Accepted; *Top mentionsLetters indicate significant differences at the 95% confidence level.Q55, Q56, Q57
Characteristics of Respondents (continued)
70
82%
89%C
76%
93%C
85%
18%
11%
24%BD
7%
15%
0% 20% 40% 60% 80% 100%
No activity (E)
Light (D)
Moderate (C)
Vigorous (B)
Total (A)
Sleep impact on Work Life (Those not getting adequate sleep)
Normal (1-5) Impaired (6-10)
Base= Total sample (Total n=289; Vigorous n=44; Moderate n=78; Light n=132; No activity n=34*)*Caution: Small Base Letters indicate significant differences at the 95% confidence level.Q16
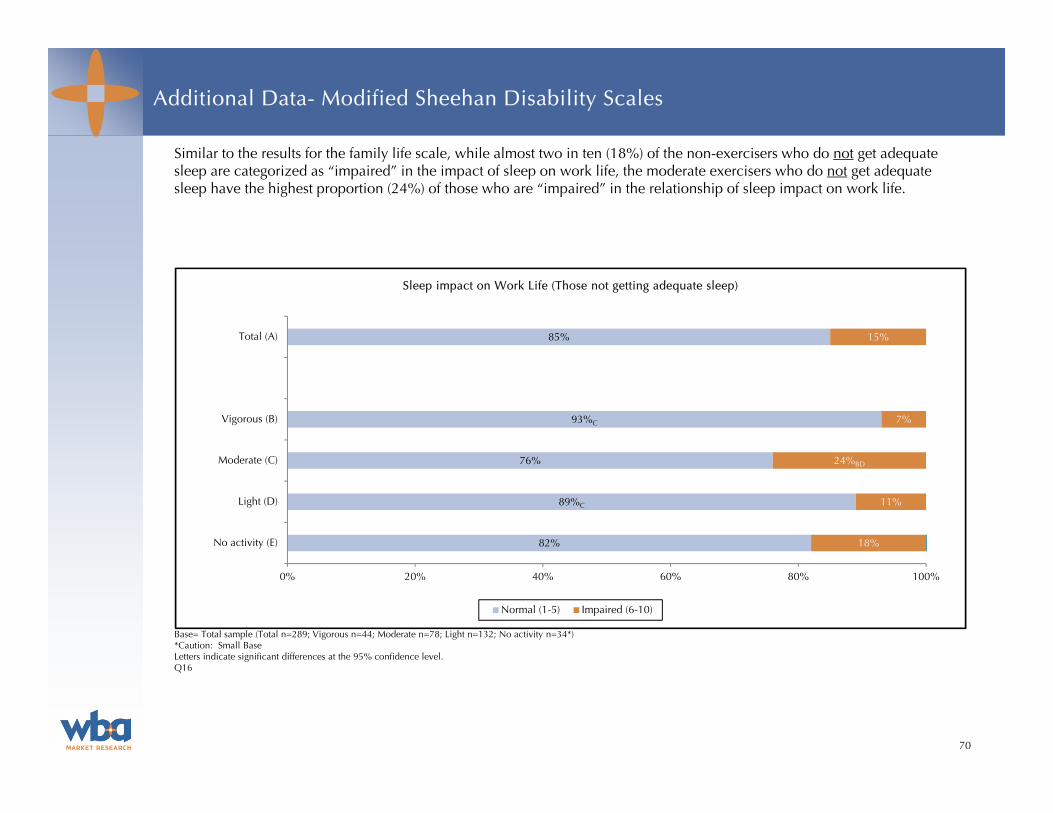
Similar to the results for the family life scale, while almost two in ten (18%) of the non-exercisers who do not get adequate sleep are categorized as “impaired” in the impact of sleep on work life, the moderate exercisers who do not get adequate sleep have the highest proportion (24%) of those who are “impaired” in the relationship of sleep impact on work life.
Additional Data- Modified Sheehan Disability Scales
71
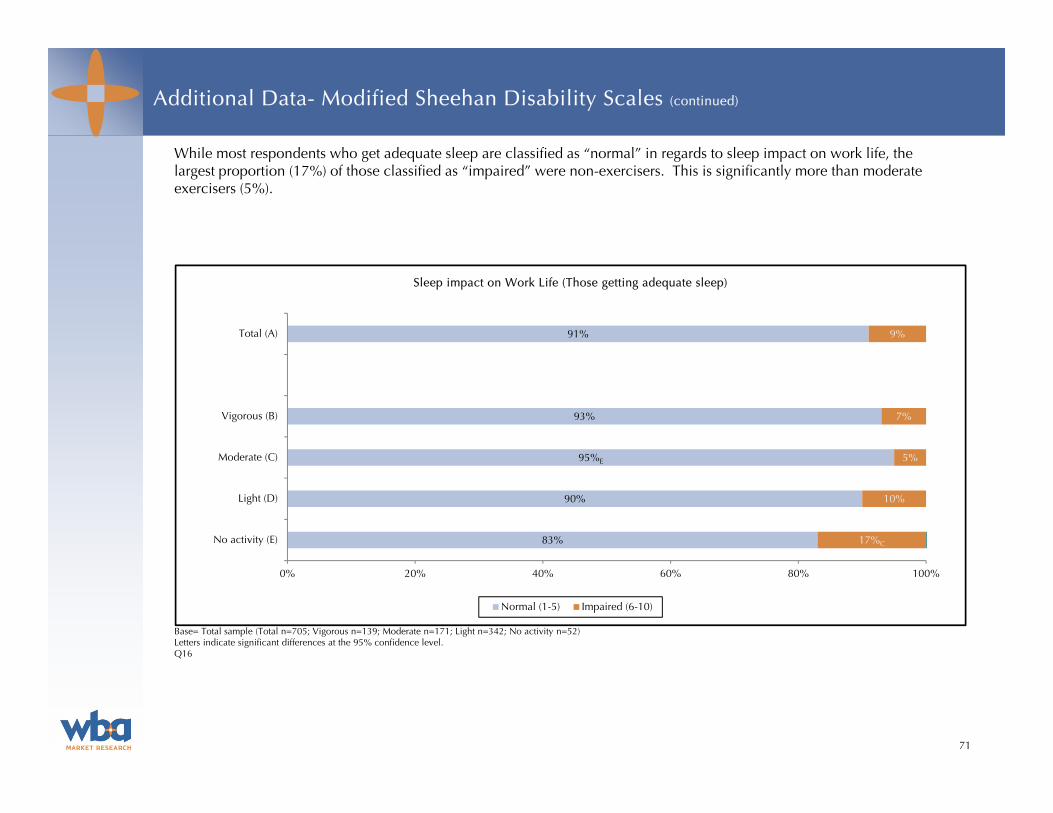
83%
90%
95%E
93%
91%
17%C
10%
5%
7%
9%
0% 20% 40% 60% 80% 100%
No activity (E)
Light (D)
Moderate (C)
Vigorous (B)
Total (A)
Sleep impact on Work Life (Those getting adequate sleep)
Normal (1-5) Impaired (6-10)
Base= Total sample (Total n=705; Vigorous n=139; Moderate n=171; Light n=342; No activity n=52) Letters indicate significant differences at the 95% confidence level.Q16
While most respondents who get adequate sleep are classified as “normal” in regards to sleep impact on work life, the largest proportion (17%) of those classified as “impaired” were non-exercisers. This is significantly more than moderate exercisers (5%).
Additional Data- Modified Sheehan Disability Scales (continued)

72
71%
83%
79%
89%E
81%
29%B
17%
21%
11%
19%
0% 20% 40% 60% 80% 100%
No activity (E)
Light (D)
Moderate (C)
Vigorous (B)
Total (A)
Sleep impact on Social Life (Those not getting adequate sleep)
Normal (1-5) Impaired (6-10)
Base= Total sample (Total n=289; Vigorous n=44; Moderate n=78; Light n=132; No activity n=34*)*Caution: Small Base Letters indicate significant differences at the 95% confidence level.Q16
Nearly three in ten (29%) of the non-exercisers who do not get adequate sleep are categorized as “impaired” in the impact of sleep on social life.
Additional Data- Modified Sheehan Disability Scales (continued)

73
87%
92%
94%
91%
92%
13%
8%
6%
9%
8%
0% 20% 40% 60% 80% 100%
No activity (E)
Light (D)
Moderate (C)
Vigorous (B)
Total (A)
Sleep impact on Social Life (Those getting adequate sleep)
Normal (1-5) Impaired (6-10)
Base= Total sample (Total n=705; Vigorous n=139; Moderate n=171; Light n=342; No activity n=52) Letters indicate significant differences at the 95% confidence level.Q16
In regards to sleep impact on social life, the majority of respondents who get adequate sleep are classified as “normal”. The largest proportion (13%) of those classified as “impaired” were non-exercisers.
Additional Data- Modified Sheehan Disability Scales (continued)

74
88%
83%
82%
89%
84%
12%
17%
18%
11%
16%
0% 20% 40% 60% 80% 100%
No activity (E)
Light (D)
Moderate (C)
Vigorous (B)
Total (A)
Sleep impact on Intimate or Sexual Relations (Those not getting adequate sleep)
Normal (1-5) Impaired (6-10)
Base= Total sample (Total n=289; Vigorous n=44; Moderate n=78; Light n=132; No activity n=34*)*Caution: Small Base Letters indicate significant differences at the 95% confidence level.Q16
Interestingly, more moderate exercisers and light exercisers who do not get adequate sleep were classified as “impaired” than vigorous exercisers and non-exercisers, regarding sleep impact on intimate or sexual relations.
Additional Data- Modified Sheehan Disability Scales (continued)

75
83%
89%
95%DE
91%
90%
17%C
11%C
5%
9%
10%
0% 20% 40% 60% 80% 100%
No activity (E)
Light (D)
Moderate (C)
Vigorous (B)
Total (A)
Sleep impact on Intimate or Sexual Relations (Those getting adequate sleep)
Normal (1-5) Impaired (6-10)
Base= Total sample (Total n=705; Vigorous n=139; Moderate n=171; Light n=342; No activity n=52) Letters indicate significant differences at the 95% confidence level.Q16
While most respondents who get adequate sleep are classified as “normal” in regards to sleep impact on intimate or sexual relations, the largest proportion (17%) of those classified as “impaired” were non-exercisers. This is significantly more than moderate exercisers (5%).
Additional Data- Modified Sheehan Disability Scales (continued)
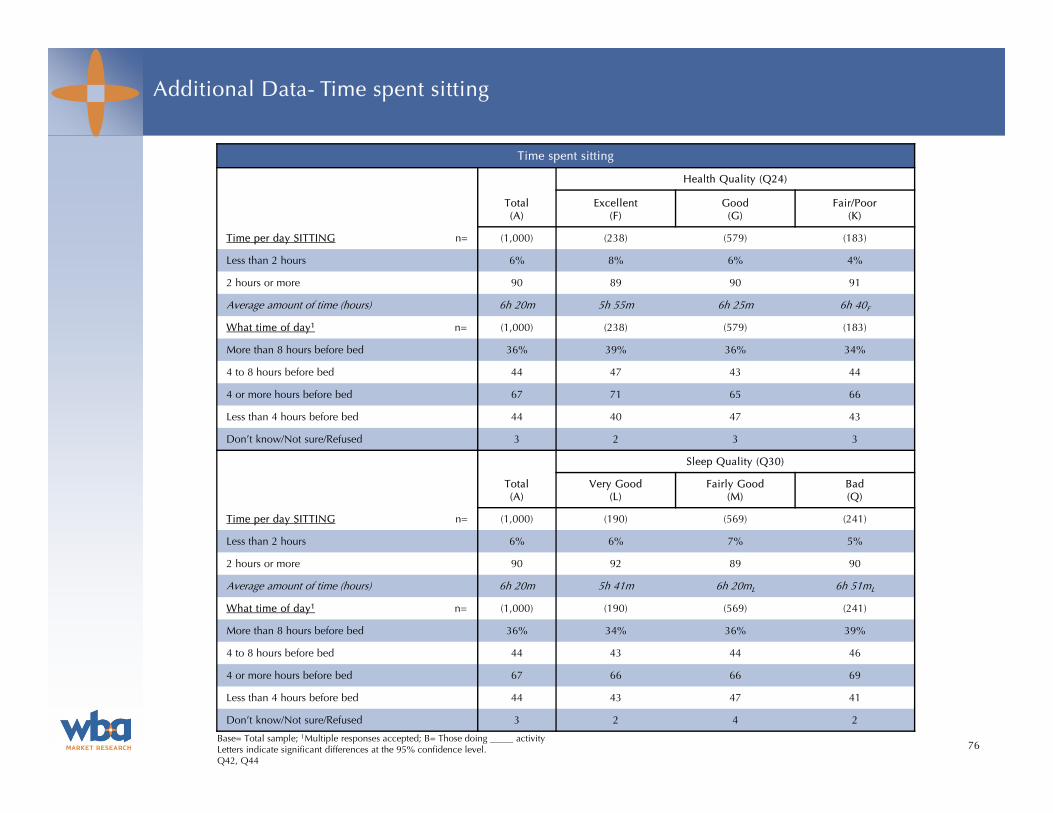
Time spent sitting
Health Quality (Q24)
Total(A)
Excellent (F)
Good (G)
Fair/Poor (K)
Time per day SITTING n= (1,000) (238) (579) (183)
Less than 2 hours 6% 8% 6% 4%
2 hours or more 90 89 90 91
Average amount of time (hours) 6h 20m 5h 55m 6h 25m 6h 40F
What time of day1 n= (1,000) (238) (579) (183)
More than 8 hours before bed 36% 39% 36% 34%
4 to 8 hours before bed 44 47 43 44
4 or more hours before bed 67 71 65 66
Less than 4 hours before bed 44 40 47 43
Don’t know/Not sure/Refused 3 2 3 3
Sleep Quality (Q30)
Total(A)
Very Good(L)
Fairly Good (M)
Bad (Q)
Time per day SITTING n= (1,000) (190) (569) (241)
Less than 2 hours 6% 6% 7% 5%
2 hours or more 90 92 89 90
Average amount of time (hours) 6h 20m 5h 41m 6h 20mL 6h 51mL
What time of day1 n= (1,000) (190) (569) (241)
More than 8 hours before bed 36% 34% 36% 39%
4 to 8 hours before bed 44 43 44 46
4 or more hours before bed 67 66 66 69
Less than 4 hours before bed 44 43 47 41
Don’t know/Not sure/Refused 3 2 4 2
76Base= Total sample; 1Multiple responses accepted; B= Those doing _____ activity Letters indicate significant differences at the 95% confidence level.Q42, Q44
Additional Data- Time spent sitting

77
Time spent sitting (continued)
Health Quality (Q24)
Total(A)
Excellent (F)
Good (G)
Fair/Poor (K)
Time per day SITTING n= (1,000) (238) (579) (183)
Less than 3 hours 15% 18% 15% 12%
3 to less than 8 hours 46 49 44 46
8 to less than 10 hours 16 17 16 12
10 hours or more 20 13 21F 25F
Less than 6 hours 45 47 44 44
6 to less than 8 hours 16 20 15 14
8 hours or more 35 31 37 37
Average amount of time (hours) 6h 20m 5h 55m 6h 25m 6h 40F
Sleep Quality (Q30)
Total(A)
Very Good(L)
Fairly Good (M)
Bad (Q)
Time per day SITTING n= (1,000) (190) (569) (241)
Less than 3 hours 15% 16% 15% 15%
3 to less than 8 hours 46 57MQ 43 43
8 to less than 10 hours 16 12 18L 13
10 hours or more 20 13 20L 24L
Less than 6 hours 45 52Q 44 41
6 to less than 8 hours 16 21M 14 17
8 hours or more 35 25 38L 37L
Average amount of time (hours) 6h 20m 5h 41m 6h 20mL 6h 51mL
Base= Total sampleLetters indicate significant differences at the 95% confidence level.Q42
Additional Data- Time spent sitting (continued)

Time spent sitting (continued)
Health Quality (Q24)
Total(A)
Excellent (F)
Good (G)
Fair/Poor (K)
Average Time SITTING while…* n= (1,000) (238) (579) (183)
Watching television 2h 11m 1h 43m 2h 10mF 2h 52mFG
Using a computer 3h 55m 3h 47m 4h 5mK 3h 31m
Reading 1h 2m 52m 1h 4mF 1h 10m
Socializing with family and friends 1h 31m 1h 28m 1h 28m 1h 47mG
Traveling in a vehicle or public transit 1h 19m 1h 7m 1h 20mF 1h 28mF
Doing hobbies 43m 38m 41m 54m
Less than 20 minutes SITTING while…* n= (1,000) (238) (579) (183)
Watching television 8% 11% 8% 6%
Using a computer 10 10 8 15G
Reading 28 29 27 33
Socializing with family and friends 13 11 14 14
Traveling in a vehicle or public transit 12 13 11 14
Doing hobbies 52 57 51 48
20 minutes or more SITTING while…* n= (1,000) (238) (579) (183)
Watching television 89% 88% 89% 91%
Using a computer 88 90K 89K 82
Reading 68 68 70 63
Socializing with family and friends 82 85 81 81
Traveling in a vehicle or public transit 84 85 86K 78
Doing hobbies 40 38 40 43
78
Base= Total sample*Top mentionsLetters indicate significant differences at the 95% confidence level.Q43
Additional Data- Time spent sitting (continued)

79
Time spent sitting (continued)
Sleep Quality (Q30)
Total(A)
Very Good(L)
Fairly Good (M)
Bad (Q)
Average Time SITTING while…* n= (1,000) (190) (569) (241)
Watching television 2h 11m 1h 45m 2h 8mL 2h 41mLM
Using a computer 3h 55m 3h 23m 4h 2mL 4h 2mL
Reading 1h 2m 50m 1h 5mL 1h 4m
Socializing with family and friends 1h 31m 1h 36m 1h 26m 1h 40m
Traveling in a vehicle or public transit 1h 19m 1h 14m 1h 18m 1h 23m
Doing hobbies 43m 56mM 40m 41m
Less than 20 minutes SITTING while…* n= (1,000) (190) (569) (241)
Watching television 8% 12%M 7% 8%
Using a computer 10 11 8 13
Reading 28 32 26 31
Socializing with family and friends 13 12 13 14
Traveling in a vehicle or public transit 12 17M 10 13
Doing hobbies 52 53 50 55
20 minutes or more SITTING while…* n= (1,000) (190) (569) (241)
Watching television 89% 86% 91% 88%
Using a computer 88 88 89 85
Reading 68 65 70 65
Socializing with family and friends 82 84 82 80
Traveling in a vehicle or public transit 84 81 87L 82
Doing hobbies 40 44 41 35
Base= Total sample*Top mentionsLetters indicate significant differences at the 95% confidence level.Q43
Additional Data- Time spent sitting (continued)

Time spent sitting
Sleep Quality on Exercise Days (Q45)
Total(A)
Improves (N)
Worsens(O)
Stays the same(P)
Don’t know/Refused/No exercise
(Q)
Time per day SITTING n= (1,000) (509) (22*) (426) (43)
Less than 2 hours 6% 6% 5% 7% 5%
2 hours or more 90 91 95 89 81
Less than 3 hours 15 14Q 9 17Q 5
3 to less than 8 hours 46 46 36 46 37
8 to less than 10 hours 16 15 18 16 14
10 hours or more 20 20 36 17 30
Less than 6 hours 45 44 32 48Q 33
6 to less than 8 hours 16 17 14 15 9
8 hours or more 35 36 55P 33 44
Average amount of time (hours) 6h 20m 6h 23m 8h 35mNP 6h 2m 7h 41mNP
What time of day1 n= (1,000) (509) (22*) (426) (43)
More than 8 hours before bed 36% 37% 50% 34% 42%
4 to 8 hours before bed 44 45 41 44 37
4 or more hours before bed 67 69 77 63 63
Less than 4 hours before bed 44 43 41 48Q 30
Don’t know/Not sure/Refused 3 2 - 3 16NP
80
Base= Total sample1Multiple responses acceptedB= Those doing _____ activity*Caution: Small BaseLetters indicate significant differences at the 95% confidence level.Q42, Q44
Additional Data- Time spent sitting (continued)

81
Time spent sitting (continued)
Length of Sleep Time on Exercise Days (Q46)
Total(A)
Improves(R)
Worsens(S)
Stays the same(T)
Don’t know/Refused/No exercise
(U)
Time per day SITTING n= (1,000) (285) (18*) (655) (42)
Less than 2 hours 6% 6% 6% 6% 10%
2 hours or more 90 89 83 91 79
Less than 3 hours 15 14 17 15 10
3 to less than 8 hours 46 48 28 46 33
8 to less than 10 hours 16 14 22 16 17
10 hours or more 20 19 22 20 29
Less than 6 hours 45 46U 33 45U 29
6 to less than 8 hours 16 16 11 16 14
8 hours or more 35 33 44 36 45
Average amount of time (hours) 6h 20m 6h 16m 7h 26m 6h 16m 7h 25m
What time of day1 n= (1,000) (285) (18*) (655) (42)
More than 8 hours before bed 36% 40% 28% 35% 43%
4 to 8 hours before bed 44 42 33 45 45
4 or more hours before bed 67 70 50 66 69
Less than 4 hours before bed 44 40 61U 47U 26
Don’t know/Not sure/Refused 3 2 6 2 17RT
Base= Total sample1Multiple responses acceptedB= Those doing _____ activity*Caution: Small BaseLetters indicate significant differences at the 95% confidence level.Q42, Q44
Additional Data- Time spent sitting (continued)

Time spent sitting (continued)
Sleep Quality on Exercise Days (Q45)
Total(A)
Improves (N)
Worsens(O)
Stays the same(P)
Don’t know/Refused/No exercise
(Q)
Average Time SITTING while…* n= (1,000) (509) (22*) (426) (43)
Watching television 2h 11m 2h 3h 1mN 2h 19mN 2h 51mN
Using a computer 3h 55m 4h 1m 4h 57m 3h 42m 4h 20m
Reading 1h 2m 1h 1m 53m 1h 1m 1h 27m
Socializing with family and friends 1h 31m 1h 25m 2h 4mN 1h 36m 1h 50m
Traveling in a vehicle or public transit 1h 19m 1h 20m 1h 19m 1h 16m 1h 14m
Doing hobbies 43m 43m 58m 43m 43m
Less than 20 minutes SITTING while…* n= (1,000) (509) (22*) (426) (43)
Watching television 8% 8% 5% 8% 12%
Using a computer 10 8 9 12N 14
Reading 28 26 18 31 35
Socializing with family and friends 13 12 5 15O 16
Traveling in a vehicle or public transit 12 11 9 13 12
Doing hobbies 52 50 32 55O 58O
20 minutes or more SITTING while…* n= (1,000) (509) (22*) (426) (43)
Watching television 89% 90% 86% 89% 79%
Using a computer 88 90P 82 86 81
Reading 68 72P 73 65 58
Socializing with family and friends 82 83 86 81 72
Traveling in a vehicle or public transit 84 87Q 77 83 72
Doing hobbies 40 42Q 55Q 38 26
82
Base= Total sample*Caution: Small Base*Top mentionsLetters indicate significant differences at the 95% confidence level.Q43
Additional Data- Time spent sitting (continued)

83
Time spent sitting (continued)
Length of Sleep Time on Exercise Days (Q46)
Total(A)
Improves(R)
Worsens(S)
Stays the same(T)
Don’t know/Refused/No exercise
(U)
Average Time SITTING while…* n= (1,000) (285) (18*) (655) (42)
Watching television 2h 11m 2h 10m 2h 26m 2h 10m 2h 37m
Using a computer 3h 55m 4h 10m 4h 12m 3h 45m 4h 44m
Reading 1h 2m 1h 2m 1h 30m 59m 1h 29m
Socializing with family and friends 1h 31m 1h 33m 2h 8m 1h 29m 1h 46m
Traveling in a vehicle or public transit 1h 19m 1h 26m 1h 43m 1h 15m 1h 11m
Doing hobbies 43m 47m 55m 41m 41m
Less than 20 minutes SITTING while…* n= (1,000) (285) (18*) (655) (42)
Watching television 8% 6% -% 9% 14%
Using a computer 10 8 - 11 7
Reading 28 28 28 28 38
Socializing with family and friends 13 12 11 14 14
Traveling in a vehicle or public transit 12 9 11 13R 10
Doing hobbies 52 43 33 56RS 57
20 minutes or more SITTING while…* n= (1,000) (285) (18*) (655) (42)
Watching television 89% 92%U 89% 89% 79%
Using a computer 88 89 89 87 86
Reading 68 68 61 69 55
Socializing with family and friends 82 84 78 82 74
Traveling in a vehicle or public transit 84 88 78 84 76
Doing hobbies 40 46TU 56U 38 29
Base= Total sample*Caution: Small Base *Top mentionsLetters indicate significant differences at the 95% confidence level.Q43
Additional Data- Time spent sitting (continued)

84
Time spent sitting
Modified Epworth Sleepiness Scale
Total(A)
Normal(L)
Sleepy(M)
Time per day SITTING n= (1,000) (808) (134)
Less than 2 hours 6% 6% 6%
2 hours or more 90 91 90
Less than 3 hours 15% 14% 13%
3 to less than 8 hours 46 47 46
8 to less than 10 hours 16 16 16
10 hours or more 20 20 21
Less than 6 hours 45 45 42
6 to less than 8 hours 16 16 17
8 hours or more 35 36 37
Average amount of time (hours) 6h 20m 6h 21m 6h 32m
What time of day1 n= (1,000) (808) (134)
More than 8 hours before bed 36% 36% 40%
4 to 8 hours before bed 44 44 50
4 or more hours before bed 67 66 75L
Less than 4 hours before bed 44 46M 36
Don’t know/Not sure/Refused 3 3 -Base= Total sample1Multiple responses accepted; B= Those doing _____ activity Letters indicate significant differences at the 95% confidence level.Q40,Q41, Q42, Q44
Additional Data- Time spent sitting (continued)

85
Time spent sitting (continued)
Modified Epworth Sleepiness Scale
Total(A)
Normal(L)
Sleepy(M)
Average Time SITTING while…* n= (1,000) (808) (134)
Watching television 2h 11m 2h 10m 2h 28m
Using a computer 3h 55m 3h 54m 4h 19m
Reading 1h 2m 1h 2m 1h 5m
Socializing with family and friends 1h 31m 1h 31m 1h 34m
Traveling in a vehicle or public transit 1h 19m 1h 19m 1h 20
Doing hobbies 43m 43m 49m
Less than 20 minutes SITTING while…* n= (1,000) (808) (134)
Watching television 8% 8% 7%
Using a computer 10 10 7
Reading 28 28 28
Socializing with family and friends 13 12 15
Traveling in a vehicle or public transit 12 12 8
Doing hobbies 52 52 51
20 minutes or more SITTING while…* n= (1,000) (808) (134)
Watching television 89% 90% 90%
Using a computer 88 88 91
Reading 68 69 69
Socializing with family and friends 82 83 81
Traveling in a vehicle or public transit 84 85 87
Doing hobbies 40 40 43
Base= Total sample*Top mentionsLetters indicate significant differences at the 95% confidence level.Q43
Additional Data- Time spent sitting (continued)

86
Survey Instrument

87
Survey Instrument (continued)

88
Survey Instrument (continued)
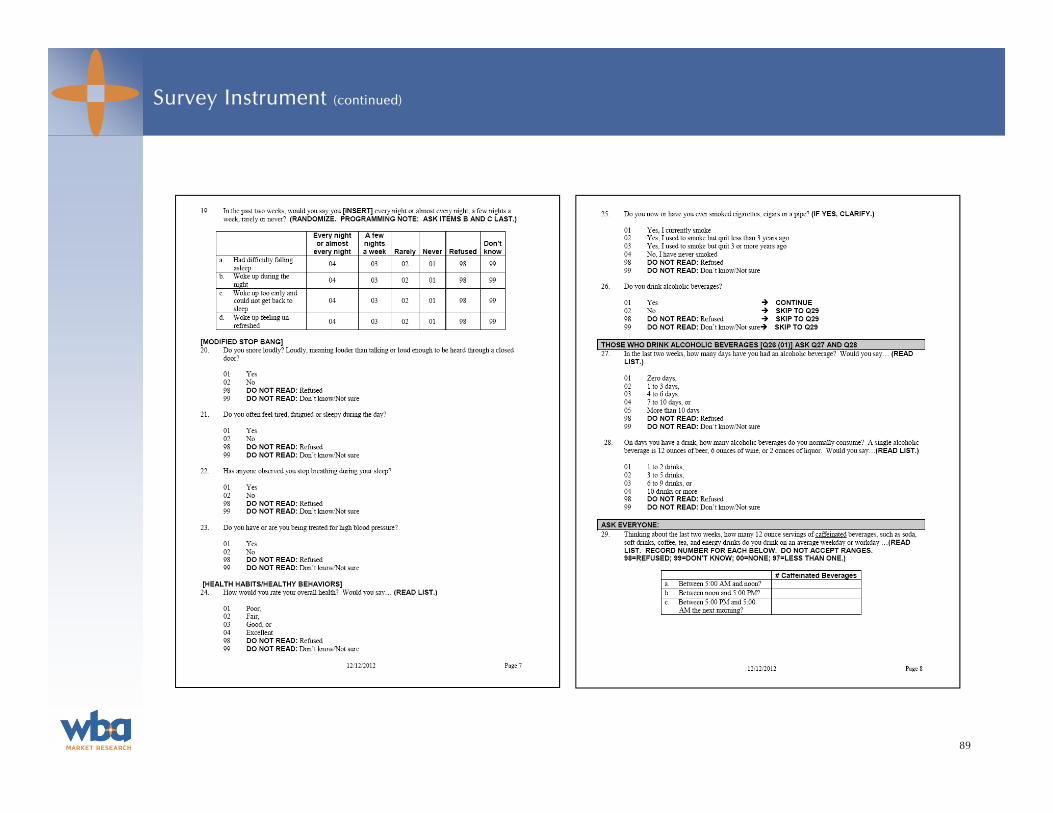
89
Survey Instrument (continued)

90
Survey Instrument (continued)
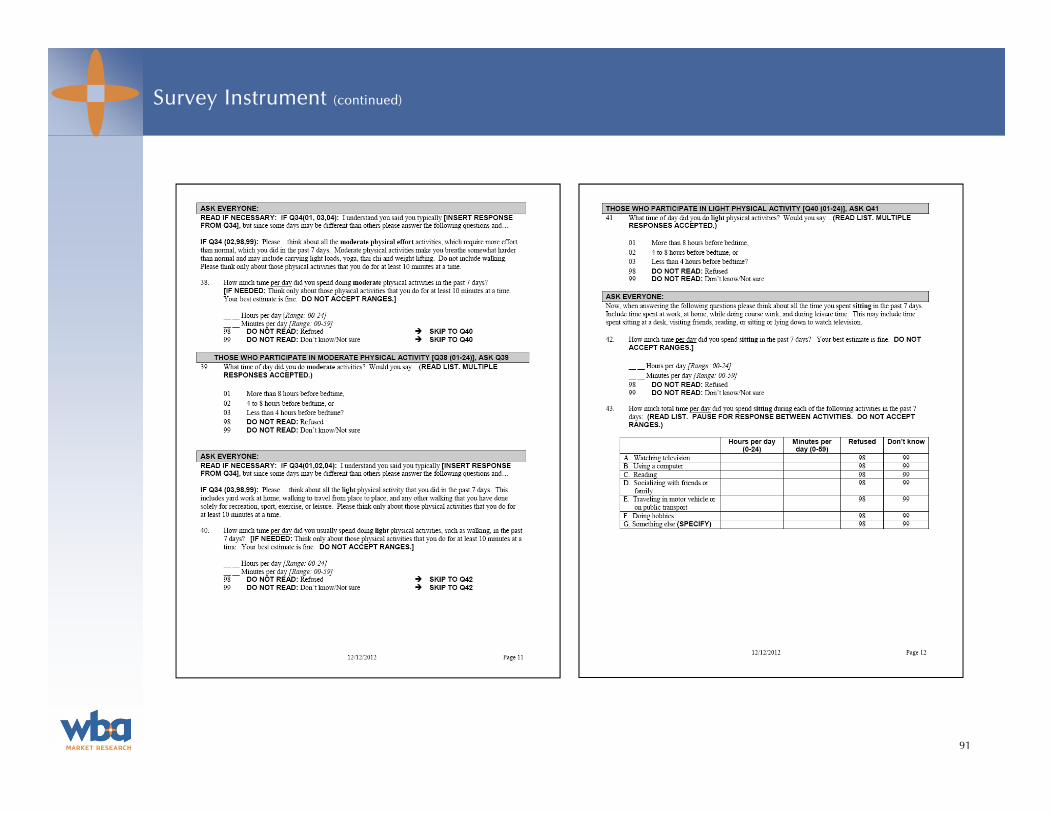
91
Survey Instrument (continued)
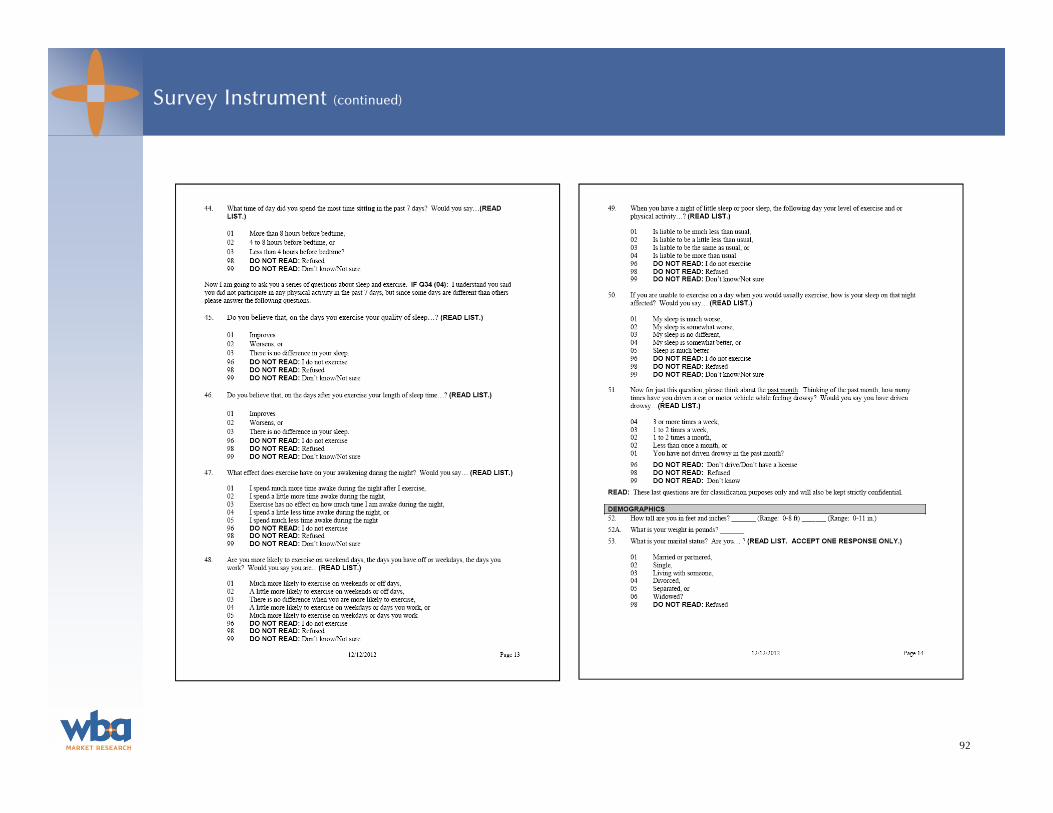
92
Survey Instrument (continued)

Survey Instrument (continued)
93