2013 Sapporo Group Business Results Presentation for the ...
27
1/27 URL http://www.sapporoholdings.jp/english 2013 Sapporo Group Business Results Presentation for the Nine Months ended September 30, 2013 October 31 2013 Copyright, 2013 SAPPORO HOLDINGS LTD. All rights reserved. SAPPORO HOLDINGS LIMITED
Transcript of 2013 Sapporo Group Business Results Presentation for the ...
1/27
URL http://www.sapporoholdings.jp/english
2013Sapporo Group Business Results Presentationfor the Nine Months ended September 30, 2013
October 31 2013
Copyright, 2013 SAPPORO HOLDINGS LTD. All rights reserved.
SAPPORO HOLDINGS LIMITED

2/27
Contents
Copyright, 2013 SAPPORO HOLDINGS LTD. All rights reserved.
1. Overview of the First Nine Months of 2013
2. Progress of Implementation of 2013 Basic Strategies
3. Overview of Results for the First Nine Months of 2013
Reference: Management Targets 2013-2014
Reference: Supplementary Information to Results for the First Nine Months of 2013
3/27
1. Overview of the First Nine Months of 20131. Overview of the First Nine Months of 2013
Copyright, 2013 SAPPORO HOLDINGS LTD. All rights reserved.

4/27
Overview of the First Nine Months of 2013
Overview of the First Nine Months of 2013Overview of the First Nine Months of 2013 Sales increased by ¥14.7 billion, operating income by ¥3.8 billion, and net income by ¥4.8 billion
•Japanese Alcoholic Beverages: Sales increased by ¥3.1 billion, operating income by ¥4.6 billion:Sales volume of beer grew strongly, exceeding the level of the previous year, as Yebisu Beer sales continued to
expand.In addition to increased sales for beer and beer-type beverages compared to the previous year, with sales of new-
genre product Goku zero increased, and sales of wine, western spirits and shochu also rose, resulting in increased sales for the entire segment.
Operating income also rose significantly as a result of increased sales as well as tighter cost controls beginning with marketing expenses.
Copyright, 2013 SAPPORO HOLDINGS LTD. All rights reserved.
Launched Goku zero, the world’s first beer-type beverage with no carbohydrates or purine bodies, on June 19.
Initial sales plan of 2.2 million cases was upwardly revised to 3 million cases (large bottle count)
About 2.1 million cases sold as of the end of September, exceeding the plan.
100
103
102 102
97
99
98 98
94
96
98
100
102
104
Jan.- Mar. Apr.- Jun. Jul.-Sep. Jan.-Sep.
%Sapporo Total demand
Jan.-Sep. Cumulative Sales Volume YoYComparison (Beer)
97
100
103
100
98
100
99 99
94
96
98
100
102
104
Jan.- Mar. Apr.- Jun. Jul.-Sep. Jan.-Sep.
%Sapporo Total demand
Jan.-Sep. Cumulative Sales Volume YoY Comparison (Beer, Happoshu New Genre)

5/27
Overview of the First Nine Months of 2013
Overview of the First Nine Months of 2013Overview of the First Nine Months of 2013
•International Business: Sales increased by ¥9.9 billion, operating income by ¥0.8 billionBoth sales and profits increased on the back of local currency-based growth in North America and Vietnam as well as the addition
of Silver Spring Citrus, whose consolidation started in April 2012, in addition to the impact of yen depreciation.•Food & Soft Drinks: Sales increased by ¥2.5 billion, operating income declined by ¥1.3 billion
Sales increased, despite the decrease in domestic soft drinks sales from the beginning of the year due to the impact of integration preparations in the previous year on normal sales activities, and also of the decrease in product items, as net increase of POKKA ACE Malaysia, whose consolidation began at the start of the year, contributed.
Decline in operating income is due to the impact of the decrease in profits in domestic soft drinks through the 2nd quarter
•Income before income taxes and minority interests: increased by ¥9.1 billionIncreased as a result of factors including the recording of a ¥3.5 billion gain on sales of investment securities as extraordinary gains.
Copyright, 2013 SAPPORO HOLDINGS LTD. All rights reserved.
89 93 94
101 103 102
50
65
80
95
Jan-Mar Jan-Jun Jan-Sep
% SapporoTotal demand
Jan.-Sep. Cumulative Sales Volume YoY Comparison(Domestic soft drinks)
Jan-Mar Apr-Jun Jul-Sep Jan-Sep
Operating income 2013 (1.1) 0.1 1.6 0.5
Operating income 2012 (0.6) 0.7 1.7 1.8
Change (0.5) (0.6) (0.1) (1.3)
Food & Soft Drinks Operating income before goodwill amortization by each quarter YoY

6/27
2. Progress of Implementation of 2013 Basic Strategies
2. Progress of Implementation of 2013 Basic Strategies
Copyright, 2013 SAPPORO HOLDINGS LTD. All rights reserved.

7/27
Progress of Implementation of 2013 Basic Strategies
Creating new opportunities for growthCreating new opportunities for growth
Restructuring of North American Production Facilities: International Business• Production of Sapporo brand products for the U.S. market was outsourced from SLEEMAN Breweries in Canada to City Brewing
Company, a major contract beverage manufacturer in the U.S., from July, as the SLEEMAN facility was operating at full capacity.• Canada: Tackled the increased domestic demand for the Sleeman brand by boosting production capacity• U.S.: Met increased demand for Sapporo brand products.• Built a foundation for further growth in the growing North American beer market
Copyright, 2013 SAPPORO HOLDINGS LTD. All rights reserved.
Unit sales (YoY) 2012 2013
SLEEMAN* 107% 104%
Canada total demand
Approx.103%
Approx.
97%
SLEEMAN (Canada) Sales growth on increased investment
in marketing of premium brands• Sales growth higher than total demand
growth in Canada
Sapporo USA (U.S.) Expanding from the Japanese-
American market into wider U.S. and Asian-American markets
• Performance better than U.S. total import beer demand for the previous year
Post M&A,7th straight year of year-over-year volume growth!
1.5 times compared to 2006!
Unit sales (YoY) 2012 2013
Sapporo USA* 103% 107%
US total import beer demand
Approx.
98%Approx. 99%
(Jan-Sep)
4th straight year of year-over-year volume growth!Impact of collapse of Lehman Brothers in 2009
*Excluding Sapporo brand
*Sapporo brand
163.3 165.2
182.6
198.3 204.9
234.6245.8
150
180
210
240
2007 2008 2009 2010 2011 2012 2013
SLEEMAN(Can$ millions)
33.036.1
32.6
37.039.1
40.943.3
20
30
40
2007 2008 2009 2010 2011 2012 2013USA(US$ millions)
Sapporo USA Net Sales (before elimination of inter-company transactions) in Local Currency (Jan-Sep)
SLEEMAN Net Sales (before elimination of inter-company transactions) in Local Currency (Jan-Sep)
(Jan-Sep)

8/27
Progress of Implementation of 2013 Basic Strategies
Challenges toward growth in all businessesChallenges toward growth in all businesses
See the segment pages in Reference: Supplementary Information to Results for the First Nine Months of 2013.
Creating new opportunities for growthCreating new opportunities for growth
Copyright, 2013 SAPPORO HOLDINGS LTD. All rights reserved.
Reorganization of restaurant business in Singapore: Restaurants•Transfer of the restaurant business in Singapore from POKKA Corporation (Singapore) Pte.Ltd. to Sapporo Lion Limited in January•Brought forward the opening by one year of the 1st Ginza Lion in Singapore to October•Spreading the beer hall culture around the world – start of overseas operations•Initial plan: Aim to operate 10 beer halls in Singapore and elsewhere in Southeast Asia within five years
Singapore outlets: total of 11(as of September 30, 2013)
-Tonkichi (pork cutlets): 4 outlets-Domani (Italian): 1 outlet-Rive Gauche (pastry): 6 outlets
Singapore Tonkichi
Singapore Ginza Lion Beer Hall

9/27
Progress of Implementation of 2013 Basic Strategies
Carrying out growth measuresCarrying out growth measures
Activities to enhance the value of existing properties: Real Estate•In consideration of the resolution of excess supply due to a spate of office building construction and recovery in rent levels in the real estate rental market from now on, enhance the value of existing properties through renewal.•Implementation of measures to enhance the value of Yebisu Garden Place in preparation for its 20th anniversary in 2014
Office renewal focused on business continuity, including augmentation of emergency power supply facilities in times of disaster, as well as enhancement of office convenienceRefurbishing commercial and restaurant facilities to enhance the appeal of the entire Ebisu area
•Redevelopment works at Seiwa Yebisu Building (tentative name: Sapporo Ebisu Building) including expansion of total floorarea has been progressing favorably for completion in the autumn of 2014
•Continuing consultations with concerned parties regarding redevelopment of Sapporo Ginza Building, located in Ginza 4-chome (including expansion of total floor area)
Enhance lemon products’ (foods) production capability: Food & Soft Drinks• Domestic Foods: Added lemon products (foods) production line in Kitanagoya City, enhanced
production capacityConstructed a new building and set up cutting-edge production line in response to the growth strategy for the core business of Pokka Lemon 100. Production capacity can be increased by a maximum of 70% compared to present capacity. Start of operations scheduled for December 2013.
Strengthening of the soft drinks business in Southeast Asia: Food & Soft Drinks•Overseas Soft Drinks: POKKA Singapore to construct a new plant in Malaysia and double production capacity
Planned start of construction in Johor State at the end of June,with full-scale operation planned for April 2014Resolution of chronic supply shortages in Singapore and export marketsStrengthening the business in Malaysia, the most important market in Southeast Asia,and surrounding countries
Yebisu Garden Place
Copyright, 2013 SAPPORO HOLDINGS LTD. All rights reserved.
Seiwa Yebisu Building (artist’s rendering)(Tentative name: Sapporo Ebisu Bldg.)
Malaysia plant (artist’s rendering)
Malaysia plant ground-breaking ceremony
Nagoya plant new building (artist’s rendering)

10/27
Progress of Implementation of 2013 Basic Strategies
State of progress in Alcoholic BeveragesBusiness in Vietnam: International Business
•Steady progress with sales volume in Vietnam, where full -scale marketing began in April 2012, and exports to neighboring countries have also been progressing well
•Substantial growth in sales volumes in Vietnam during the first Tet (New Year’s Holiday) sales season after full-scale market entry
•Supply of beer kegs to expand beer culture in Vietnam. Plans to expand sales activities to Hanoi •In Vietnam at the end of September, we delivered to approx. 2,000 outlets in the commercial market, mainly in Ho Chi Minh City, and to approx. 2,500 outlets in the retail market, including convenience stores and large supermarkets.•Sequential start of export to neighboring countries in 2013: export to Malaysia, Singapore, Thailand, Australia, New Zealand, South Korea, Indonesia, Hong Kong, the Philippines, Myanmar, Cambodia, and Guam as of September 30•Sapporo brand has a presence in eight of ten ASEAN countries
Jan-Sep 2013 sales volume, taking Jan-Sep 2012 volume (excluding exports) as 100
Third largest market in Asia after China and Japan
Expected to reach size of the Japanese market by 2020Beer market in Vietnam*
Carrying out growth measuresCarrying out growth measures
Copyright, 2013 SAPPORO HOLDINGS LTD. All rights reserved.
4,304 4,850 5,392 5,917 6,365 6,829 7,298
2,303 2,595
2,853 3,079 3,297 3,505 3,701
0.0
1,000.0
2,000.0
3,000.0
4,000.0
0.0
2,000.0
4,000.0
6,000.0
8,000.0
2010 2011 2012 2013 2014 2015 2016
$ mn Litter mn* Euromonitor
US$ million Million liters
100
281
0
100
200
300
2012 2013
Million liters
11/27
Implementation Status of Strategic Investments(Including Ordinary Capex)
Implementation Status of Strategic Investments(Including Ordinary Capex)
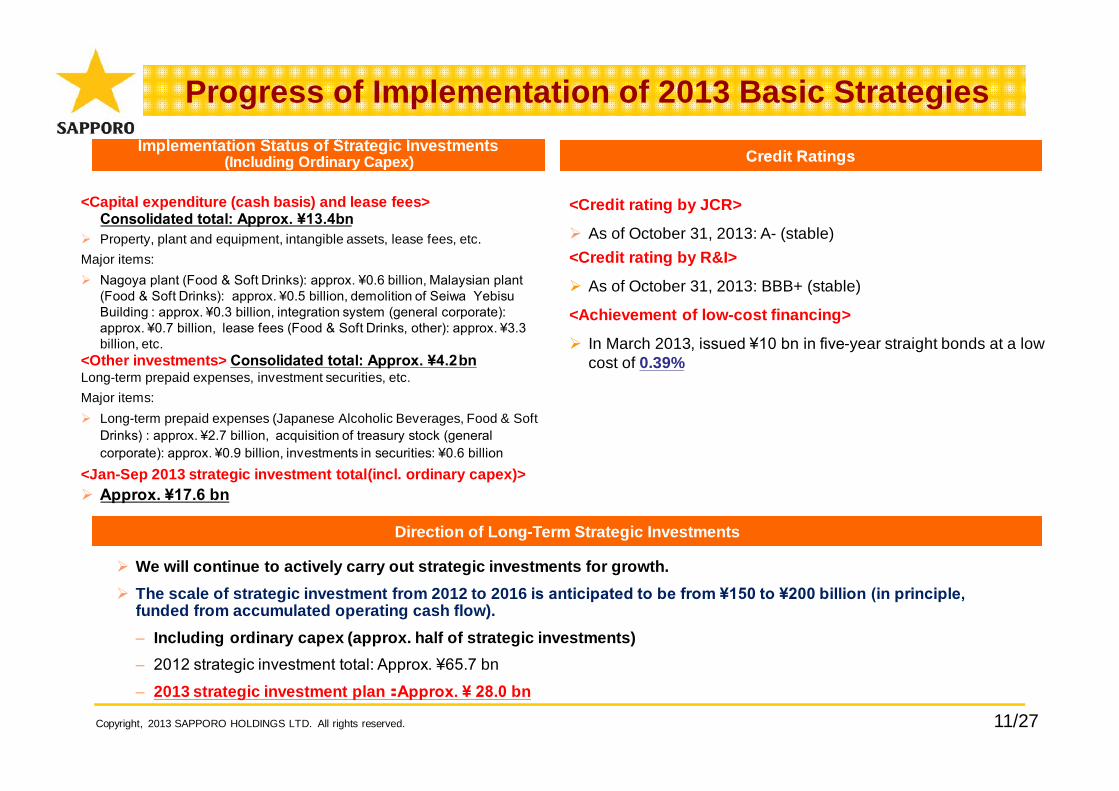
<Capital expenditure (cash basis) and lease fees> Consolidated total: Approx. ¥13.4bn
Property, plant and equipment, intangible assets, lease fees, etc.Major items: Nagoya plant (Food & Soft Drinks): approx. ¥0.6 billion, Malaysian plant
(Food & Soft Drinks): approx. ¥0.5 billion, demolition of Seiwa Yebisu Building : approx. ¥0.3 billion, integration system (general corporate): approx. ¥0.7 billion, lease fees (Food & Soft Drinks, other): approx. ¥3.3 billion, etc.
<Other investments> Consolidated total: Approx. ¥4.2bnLong-term prepaid expenses, investment securities, etc.Major items: Long-term prepaid expenses (Japanese Alcoholic Beverages, Food & Soft
Drinks) : approx. ¥2.7 billion, acquisition of treasury stock (general corporate): approx. ¥0.9 billion, investments in securities: ¥0.6 billion
<Jan-Sep 2013 strategic investment total(incl. ordinary capex)> Approx. ¥17.6 bn
Credit RatingsCredit Ratings
Progress of Implementation of 2013 Basic Strategies
<Credit rating by JCR>
As of October 31, 2013: A- (stable) <Credit rating by R&I>
As of October 31, 2013: BBB+ (stable)
<Achievement of low-cost financing>
In March 2013, issued ¥10 bn in five-year straight bonds at a low cost of 0.39%
Direction of Long-Term Strategic InvestmentsDirection of Long-Term Strategic Investments
We will continue to actively carry out strategic investments for growth. The scale of strategic investment from 2012 to 2016 is anticipated to be from ¥150 to ¥200 billion (in principle,
funded from accumulated operating cash flow). – Including ordinary capex (approx. half of strategic investments)– 2012 strategic investment total: Approx. ¥65.7 bn
– 2013 strategic investment plan: Approx. ¥ 28.0 bn
Copyright, 2013 SAPPORO HOLDINGS LTD. All rights reserved.

12/27
3. Overview of Results forthe First Nine Months of 2013
3. Overview of Results forthe First Nine Months of 2013
Copyright, 2013 SAPPORO HOLDINGS LTD. All rights reserved.

13/27
Overview of Results for the First Nine Months of 2013: Special Factors
Copyright, 2013 SAPPORO HOLDINGS LTD. All rights reserved.
Net SalesNet Sales Operating IncomeOperating Income
Breakdown of special factors (net increase, etc.) that prevent meaningful year -on-year comparisons between net sales and operating income in 2012 and 2013 are shown below. See the Supplementary Information to the Earnings Report for factors behind changes resulting from other business activities.
<International Business> April 2012 consolidation of profit and loss account of
Silver Springs Citrus Jan-Mar 2013 net increase ⇒approx. +¥2.7 bn
<Food & Soft Drinks> January consolidation of profit and loss account of
POKKA ACE Malaysia (change from equity method affiliate to consolidated subsidiary)⇒approx. +¥3.9 bn
<Real Estate> March 2012 inclusion of 15% of trust beneficiary rights
for Yebisu Garden Place in the profit and loss accountJan-Feb 2013 net increase ⇒ approx. +¥0.4 bn
<Consolidated Total> Approx. +¥7.0 bn
<International Business> April 2012 consolidation of profit and loss account of Silver
Springs Citrus Jan-Mar 2013 net increase ⇒ approx. +¥0.1 bn
<Food & Soft Drinks> January consolidation of profit and loss account of POKKA
ACE Malaysia (change from equity method affiliate to consolidated subsidiary)⇒ approx. +¥0.0 bn
<Real Estate> March 2012 inclusion of 15% of trust beneficiary rights for
Yebisu Garden Place in the profit and loss account Jan-Feb 2013 net increase ⇒ approx. +¥0.2 bn
<Consolidated Total> Approx. +¥0.3 bn

14/27Copyright, 2013 SAPPORO HOLDINGS LTD. All rights reserved.
Overview of Results for the First Nine Months of 2013 –Consolidated–
YoY change
2012 3Q 2013 3Q Amount %
Consolidated net sales 354.7 369.5 14.7 4.2%
Consolidated operating income 5.5 9.4 3.8 68.9%
Consolidated operating income before goodwill amortization 8.4 12.4 3.9 47.0%
Consolidated ordinary income 4.4 8.8 4.4 100.1%
Consolidated net income 0.5 5.4 4.8 817.1%
(billions of yen)

15/27Copyright, 2013 SAPPORO HOLDINGS LTD. All rights reserved.
Overview of Results for the First Nine Months of 2013 by Segment
YoY change
2012 3Q* 2013 3Q Amount %
Japanese Alcoholic Beverages 0.8 5.5 4.6 541.2%
InternationalNorth America, other
Vietnam
0.11.4
(1.3)
1.02.3
(1.3)
0.80.9
(0.0)
595.6%67.0%
―
Food & Soft Drinks (0.1) (1.5) (1.3) ―
Restaurants 0.2 0.2 (0.0) (17.2%)
Real Estate 7.1 6.7 (0.3) (5.2%)
Other (0.3) 0.1 0.4 ―
General corporate (2.4) (2.7) (0.3) ―
Consolidated operating income 5.5 9.4 3.8 68.9%
Consolidated operating income before goodwill amortization 8.4 12.4 3.9 47.0%
(billions of yen)
Operating IncomeOperating Income
*Effective the three months ended March 31, 2013, Sapporo Logistics Systems Co., Ltd., which was previously included in the J apanese Alcoholic Beverages segment, and Pokka Logistics Co., Ltd., which was previously included in the Food & Soft Drinks segment, were recla ssified to the Other segment. Additionally, effective the three months ended March 31, 2013, Pokka Food (Singapore) Pte. Ltd. which was previously included in the Food & Soft Drinks segment was reclassified to the Restaurants segment These changes have been retroactively applied to the above figures for 2012.

16/27
Reference: 2013-2014 Management TargetsReference: 2013-2014 Management Targets
Copyright, 2013 SAPPORO HOLDINGS LTD. All rights reserved.
*2013-2014 management targets are unchanged from the figures announced on February 8, 2013.

17/27
2006 results 2012 results 2013 targets 2014 targets 2016 targets
Consolidated net sales*incl. liquor taxes ¥435.0 bn ¥492.4 bn ¥512.0 bn ¥533.0 bn ¥600.0 bn
(excl. liquor taxes) ¥294.0 bn ¥379.7 bn ¥397.3 bn ¥416.0 bn ¥450.0 bnConsolidated operating
income ¥8.6 bn ¥14.4 bn ¥15.3 bn ¥17.8 bn¥40.0 bn(before goodwill
amortization) ¥8.6 bn ¥18.2 bn ¥19.2 bn ¥21.6 bnConsolidated ordinary
income ¥5.8 bn ¥13.6 bn ¥14.0 bn ¥16.5 bn –Consolidated net
income ¥2.3 bn ¥5.3 bn ¥5.5 bn ¥7.0 bn –Consolidated operating
margin*excl. liquor taxes
2.9% 3.8% 3.9% 4.3%9.0%
(before goodwill amortization) 2.9% 4.8% 4.4% 5.2%
D/E ratio 2.1 times 1.9 times 1.8 times 1.7 times Around 1:1
ROE 2.1% 4.2% 4.1% 5.1%8% or higher(before goodwill
amortization) 2.1% 7.3% 7.1% 8.0%
2013-2014 Management Targets
Consolidated targetsConsolidated targets
*Assumed exchange rates: 2013-2014: US$ = ¥85.00, CAN$ = ¥83.00*Since the government's consumption tax policy was uncertain as of February 8, the above 2014 targets do not take into account the impact of a consumption tax increase.
Copyright, 2013 SAPPORO HOLDINGS LTD. All rights reserved.

18/27
*Assumed exchange rates: 2013-2014: US$ = ¥85.00, CAN$ = ¥83.00*Effective the three months ended March 31, 2013, Sapporo Logistics Systems Co., Ltd., which was previously included in the J apanese Alcoholic Beverages segment, and Pokka Logistics Co., Ltd., which was previously included in the Food & Soft Drinks segment, were reclassified to the Other segment. Additionally, effective the three months ended March 31, 2013, Pokka Food (Singapore) Pte.Ltd. which was previously included in the Food & Soft Drinks segment was reclassified to the Restaurants segment These change s have been retroactively applied to the above figures for 2012.*Since the government's consumption tax policy was uncertain as of February 8, the above 2014 targets do not take into account the impact of a consumption tax increase.
2013-2014 Management Targets by Segment2012 results* 2013 targets 2014 targets
Net sales
Japanese Alcoholic Beverages ¥269.9 bn ¥275.2 bn ¥283.5 bnInternational Business ¥36.1 bn ¥43.3 bn ¥46.4 bnFood & Soft Drinks ¥129.0 bn ¥136.5 bn ¥145.5 bnRestaurants ¥26.6 bn ¥26.8 bn ¥28.2 bnReal Estate ¥23.2 bn ¥23.6 bn ¥22.4 bnOther Businesses ¥7.5 bn ¥6.6 bn ¥7.0 bnCorporate and intercompany transactions – – –Consolidated total ¥492.4 billion ¥512.0 billion ¥533.0 billion
Op
erating
inco
me
Japanese Alcoholic Beverages ¥7.5 bn ¥9.0 bn ¥9.0 bnInternational Business (¥0.0 bn) ¥0.0 bn ¥1.1 bnFood & Soft Drinks ¥0.3 bn ¥1.0 bn ¥2.7 bnRestaurants ¥0.5 bn ¥0.8 bn ¥1.0 bnReal Estate ¥9.3 bn ¥8.3 bn ¥7.3 bnOther (¥0.4 bn) (¥0.1 bn) ¥0.0 bnCorporate and intercompany transactions (¥2.9 bn) (¥3.7 bn) (¥3.3 bn)
Consolidated total ¥14.4 bn ¥15.3 bn ¥17.8 bnConsolidated total(before goodwill amortization) ¥18.2 billion ¥19.2 billion ¥21.6 billion
TargetsTargets
Copyright, 2013 SAPPORO HOLDINGS LTD. All rights reserved.
19/27
Reference: Supplementary Information to Results for the First Nine Months of 2013Reference: Supplementary Information to Results for the First Nine Months of 2013
Copyright, 2013 SAPPORO HOLDINGS LTD. All rights reserved.
For information on the profitability of each business, please see the Supplementary Information to our Earnings Report.

20/27
Japanese Alcoholic BeveragesYoY change
2012 3Q 2013 3Q Amount %
Net sales* 192.2 195.3 3.1 1.6%
Operating income 0.8 5.5 4.6 541.2%
Copyright, 2013 SAPPORO HOLDINGS LTD. All rights reserved.
Premium Alcohol Free: down 1% year over year in the Jan-Sep period
*Incl. liquor taxes
(billions of yen)
Results highlights Results highlights
Key points in business plan: implementation statusKey points in business plan: implementation status
Net sales increased year over year and total sales volumes for beer and beer-type beverages exceeded the previous year’s level, as sales volume of beer grew 2% year over year and sales of wine, western spirits and shochu also rose year over year. Operating income significantly rose as a result of higher sales as well as cost control over items including marketing expenses.
1. Bolstering of brand strength of core products (excl. beer and new-genre)
2. Growth as a comprehensive alcoholicbeverage enterprise
RTD Although Bacardi performed favorably, up 34% from the same period a year
earlier, sales volume declined year over year, partly due to lower -than-expected sales of Nectar RTD and TEA’S HI .
Following the launch of RTD Bacardi Mojito in April, the Bacardi Pina Colada Fizz Bottle was introduced in July.
Sales of Sapporo Otokoume Sour launched in April for a limited periodhave been strong and it was made available year -round from the end of September.
Wine Total net sales rose year over year on growth from imported wines in
addition to higher sales of domestic wines. Imported wines: Strong performance from Yellow Tail and
Garcia Carrion Domestic wines: Strong performance from Grande Polaire
Western Spirits Conclusion of an operating alliance agreement with Bacardi Japan,
supplier of the world’s No.1 rum brand.Start of sales in Oct 2011
•Significant year-over-year increase in net sales•Active business development in both the household and commercial markets
Sales of RTS* product “Bacardi Classic Cocktails Mojito” have been progressing at a rate significantly exceeding the plan
*Ready to serve. Liqueur which can be made into cocktail just by adding soda, etc.
Shochu Significant year-over-year increase in net sales Solid performance from Imo Shochu Kokuimo
blended shochu Contribution to the sales increase from Kuroumesyu

21/27
International Business
Copyright, 2013 SAPPORO HOLDINGS LTD. All rights reserved.
YoY change
2012 3Q 2013 3Q Amount %
Net sales 26.3 36.2 9.9 37.6%
Operating incomeNorth America,
othersVietnam
0.11.4
(1.3)
1.02.3
(1.3)
0.80.9
(0.0)
595.6%67.0%-
(billions of yen)
2. Asian and Oceania Market (excl. Vietnam)
Developments in Singapore Household market sales channel expansion in collaboration with POKKA for
beer produced in Vietnam 2014 sales target: Approx. 150,000 cases (1 case = 355 ml×24 bottles) Striving to be the No. 1 Japanese beer brand. 2013 3Q: outperforming the plan. Double digit growth year over year
Key points in business plan: implementation statusKey points in business plan: implementation status
Silver Springs Citrus (U.S.) Acquired a 51% stake in Silver Springs Citrus, the largest U.S.
maker of private-brand chilled drinks • Full-scale entry into the beverage business in the North American
market• Consolidation of the profit and loss account from April, 2012• Contributing to sales and profits
1. North American business growth (excl. SLEEMAN,Sapporo USA)
Net sales increased 37.6% year over year as a result of local currency-based growth, mainly in North America, the impact of yen depreciation, and the addition of the Jan-March results of Silver Springs Citrus (SSC).Operating income rose as increases in income from the North American business as well as SSC significantly exceeded growth in expenses for market development in Vietnam.
Results highlights Results highlights
Developments in South Korea Strengthened Sapporo brand value and sales structure in South Korea by entering
into an alliance with Maeil Dairies Co., Ltd. (market share leader in cheese, low-fat milk, and chilled coffee drinks) in January 2012 and acquiring a 15% stake in M’s Beverage Co., Ltd., a wholly owned liquor sales subsidiary of MaeilNon-equity method affiliate
2012 sales target of 380,000 cases (1 case = 350 ml×24 bottles): 420,000 cases sold and target achieved
2015 sales target of 1.5 million cases (1 case = 350 ml×24 bottles) Aiming to be the No. 1 imported brand. 2013 3Q: Outperforming the plan. Double digit growth year over yearDevelopments in Oceania October 2011 entry into the Australian/New Zealand premium beer market
via a licensing agreement with Coopers Brewery Ltd. (No.3 in Australia’s beer market, No. 2 in premium beer market with a 17.3% share)
Full-scale start-up in 2012 Aiming to be the No. 1 Japanese beer brand. 2012 sales target of 160,000 cases (1 case = 355 ml×24 bottles):
160,000 cases sold and target achieved 2016 sales target of 500,000 cases (1 case = 355 ml×24 bottles ) 2013 3Q: Progressing in line with the plan. Double digit growth year
over year
22/27
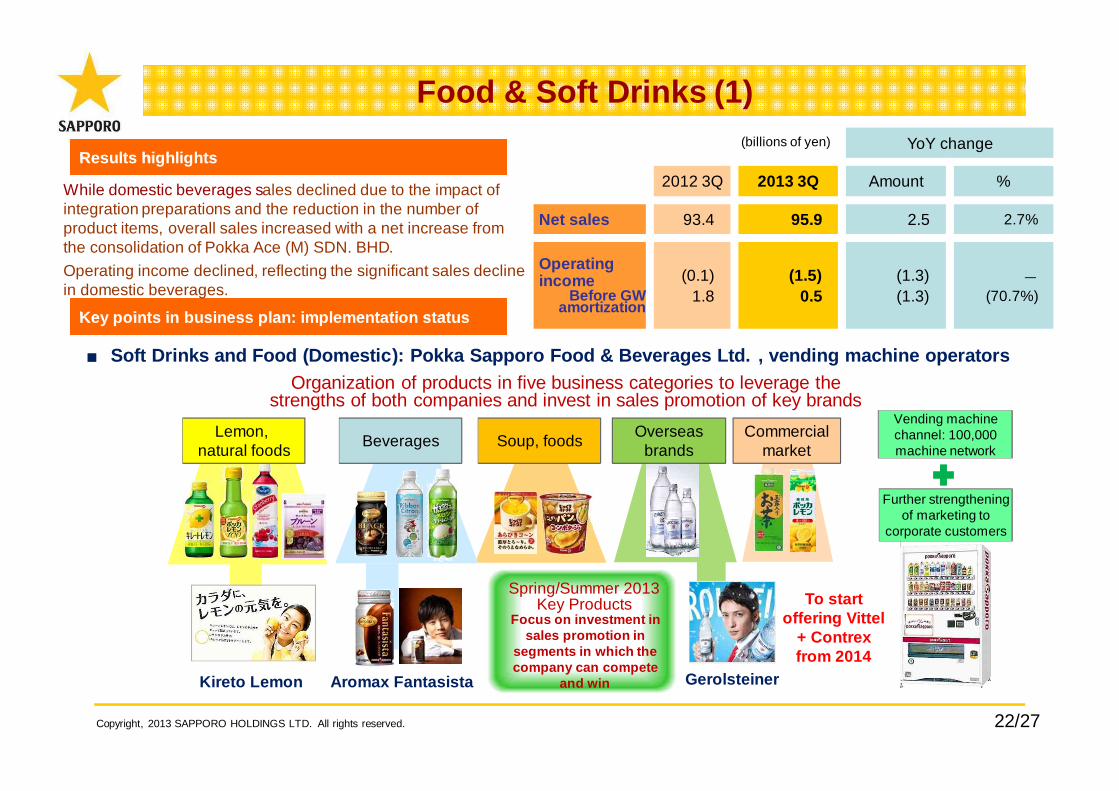
Food & Soft Drinks (1)YoY change
2012 3Q 2013 3Q Amount %
Net sales 93.4 95.9 2.5 2.7%
Operating income
Before GW amortization
(0.1)1.8
(1.5)0.5
(1.3)(1.3)
-
(70.7%)
Copyright, 2013 SAPPORO HOLDINGS LTD. All rights reserved.
To start offering Vittel
+ Contrexfrom 2014
(billions of yen)Results highlights Results highlights
Key points in business plan: implementation statusKey points in business plan: implementation status
■ Soft Drinks and Food (Domestic): Pokka Sapporo Food & Beverages Ltd. , vending machine operators
While domestic beverages sales declined due to the impact of integration preparations and the reduction in the number of product items, overall sales increased with a net increase from the consolidation of Pokka Ace (M) SDN. BHD. Operating income declined, reflecting the significant sales decline in domestic beverages.
Organization of products in five business categories to leverage the strengths of both companies and invest in sales promotion of key brands
Vending machine channel: 100,000 machine network
Further strengthening of marketing to
corporate customers
Lemon, natural foods Beverages Soup, foods Commercial
marketOverseas
brands
Kireto Lemon Aromax Fantasista Gerolsteiner
Spring/Summer 2013Key Products
Focus on investment in sales promotion in
segments in which the company can compete
and win
23/27
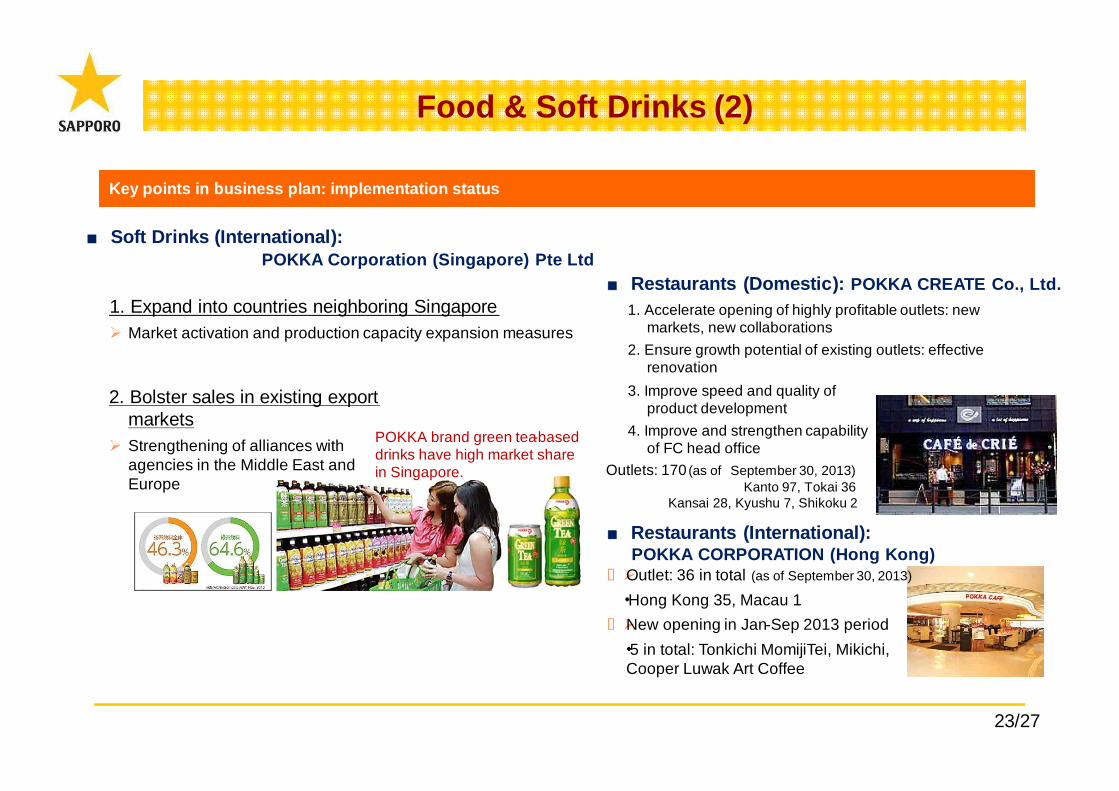
Food & Soft Drinks (2)
Key points in business plan: implementation statusKey points in business plan: implementation status
1. Expand into countries neighboring Singapore Market activation and production capacity expansion measures
2. Bolster sales in existing export markets
Strengthening of alliances with agencies in the Middle East and Europe
POKKA brand green tea-based drinks have high market share in Singapore.
■ Restaurants (Domestic): POKKA CREATE Co., Ltd.1. Accelerate opening of highly profitable outlets: new
markets, new collaborations 2. Ensure growth potential of existing outlets: effective
renovation3. Improve speed and quality of
product development 4. Improve and strengthen capability
of FC head office
■ Soft Drinks (International):POKKA Corporation (Singapore) Pte Ltd
Outlets: 170 (as of September 30, 2013)Kanto 97, Tokai 36
Kansai 28, Kyushu 7, Shikoku 2
■ Restaurants (International):POKKA CORPORATION (Hong Kong)
Outlet: 36 in total (as of September 30, 2013)
・Hong Kong 35, Macau 1 New opening in Jan-Sep 2013 period・5 in total: Tonkichi MomijiTei, Mikichi, Cooper Luwak Art Coffee
24/27
Restaurants
YoY change
2012 3Q 2013 3Q Amount %
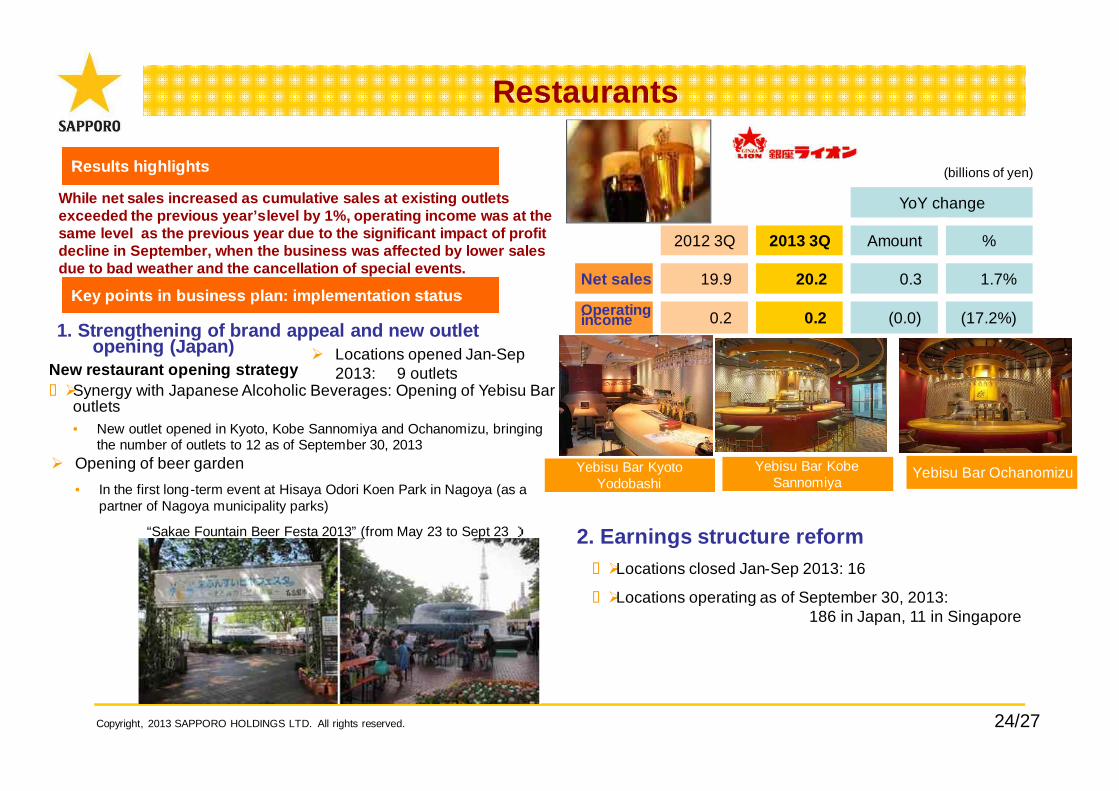
Net sales 19.9 20.2 0.3 1.7%
Operating income 0.2 0.2 (0.0) (17.2%)
While net sales increased as cumulative sales at existing outlets exceeded the previous year’s level by 1%, operating income was at the same level as the previous year due to the significant impact of profit decline in September, when the business was affected by lower sales due to bad weather and the cancellation of special events.
(billions of yen)
Locations opened Jan-Sep 2013: 9 outlets
Copyright, 2013 SAPPORO HOLDINGS LTD. All rights reserved.
Yebisu Bar Kyoto Yodobashi
Yebisu Bar OchanomizuYebisu Bar Kobe Sannomiya
Results highlights Results highlights
Key points in business plan: implementation statusKey points in business plan: implementation status
1. Strengthening of brand appeal and new outlet opening (Japan)
Opening of beer garden• In the first long-term event at Hisaya Odori Koen Park in Nagoya (as a
partner of Nagoya municipality parks)
“Sakae Fountain Beer Festa 2013” (from May 23 to Sept 23 )
New restaurant opening strategy Synergy with Japanese Alcoholic Beverages: Opening of Yebisu Bar
outlets• New outlet opened in Kyoto, Kobe Sannomiya and Ochanomizu, bringing
the number of outlets to 12 as of September 30, 2013
2. Earnings structure reform Locations closed Jan-Sep 2013: 16
Locations operating as of September 30, 2013: 186 in Japan, 11 in Singapore

25/27
Real Estate (1)
Yebisu Garden Place Maintenance and improvement of the occupancy rate and
achievement of appropriate rent levels• Maintained high occupancy rates and rent levels in September on a
single -month basis at major Tokyo properties (table at right) compared to the 92% average for office buildings in Tokyo’s 5 central wards
• Augmentation of emergency power supply facilities for completion in spring 2014, has been progressing according to the plan, renovation of the communal space in the second basement, which is a restaurant floor.
Site areas are taken from the land registry. Floor areas are as per building certification.Occupancy rates are averages for Jan–Sep 2013.*1. The number of floors is for the office block only. Occupancy rates are for office areas only.*2: Figures are for entire property. Sapporo owns 922m2 of the site (sectional ownership) and 89.72% of the building (joint management)
YoY change
2012 3Q 2013 3Q Amount %
Net sales 17.3 16.8 (0.4) (2.8%)
Operating income 7.1 6.7 (0.3) (5.2%)(As of September 30, 2013)
Major rental properties inTokyo*s 23 wards
Site area(m2)
Floor area(m2)
Occupancy rate(%) No. of floors
Yebisu Garden Place *1 56,943 298,007 91% 40 floors aboveground, 5 below
Seiwa Yebisu Building* 2,617 ― *0% 6 floors aboveground, 1 below
Yebisu Square 1,561 9,126 100% 7 floors aboveground, 1 below
Shibuya SakuragaokaSquare 1,200 9,268 100% 10 floors above
ground, 1 below
Sapporo Ginza Building*
530 4,232 *79% 10 floors aboveground, 4 below
Strata Ginza *2 1,117 11,411 100% 13 floors aboveground, 1 belowRedevelopment of the Ginza and Ebisu Areas
Redevelopment of Seiwa Yebisu Building*• Started redevelopment including expansion of floor area• Making smooth progress towards completion in the autumn of 2014
(tentative name: Sapporo Ebisu Building)
Redevelopment Sapporo Ginza Building*• Continuing with assessment , through ongoing discussion with concerned
parties, of redevelopment to include total floor area expansion in preparation for redevelopment of the Ginza 4-chome area
Sapporo Ginza Building (completed 1970)
Copyright, 2013 SAPPORO HOLDINGS LTD. All rights reserved.
(billions of yen)
A stable revenue structure was maintained amid weakening of rent levels in the Tokyo metropolitan area office leasing market.
Boosting the value of existing properties
Results highlights Results highlights
Key points in business plan: implementation statusKey points in business plan: implementation status
For more details about our Real Estate business’s properties, visit the following website:(http:/www.yebisu-gp.jp/business/index.html)

26/27
Real Estate (2)
Copyright, 2013 SAPPORO HOLDINGS LTD. All rights reserved.
Jan-Sep 2012 Jan-Sep 2013 Change (value) FY2012 FY2013 est. Change
(value)Real estate leasing
Tokyo’s 23 wards 6.4 6.0 (0.4) 8.6 7.8 (0.8)Other areas 0.8 0.8 0.0 1.0 0.9 (0.0)
Real estate leasing total 7.2 4.6 (0.3) 9.6 8.8 (0.8)Real estate total - - - - - -
Other operations* (0.1) (0.1) (0.0) (0.2) -0.5 (0.2)Total 7.1 6.7 (0.3) 9.3 8.3 (1.0)
Jan-Sep 2012 Jan-Sep 2013 Change (value) FY2012 FY2013 est. Change
(value)Real estate leasing
Tokyo’s 23 wards 9.1 8.5 (0.5) 12.1 11.2 (0.9)Other areas 1.3 1.4 0.0 1.7 1.6 (0.0)
Real estate leasing total 10.5 10.0 (0.5) 13.8 12.9 (1.0)Real estate total - - - - - -
Other operations* 0.1 0.1 (0.0) 0.1 (0.1) (0.2)Total 10.6 10.1 (0.5) 14.0 12.7 (1.3)
EBITDAEBITDA
Operating IncomeOperating Income
Balance sheet value at Dec.31, 2012: 209.9 billion yen
Fair value at Dec.31,2012: 335.6 billion yen
Overview of Real Estate BusinessOverview of Real Estate Business
The majority of operating income from the Real Estate business is from real estate leasing.– The property portfolio largely comprises properties in Tokyo (5 central wards: see previous page).– Unrealized gain on real estate for lease was ¥125.7 billion as of Dec. 31, 2012.
(billions of yen)
EBITDA = operating income + depreciation and amortization*”Other operations” includes back-office operations.
27/27Copyright, 2013 SAPPORO HOLDINGS LTD. All rights reserved.
To make people’s lives richer and more enjoyable.
The earnings forecasts and forward-looking statements appearing in this document were prepared by theSAPPORO Group based on currently available information and its best assessment of potential risks anduncertainties. Actual outcomes may differ materially from forecasts due to changes in various underlyingfactors.