2013 — Healthy Smiles / Healthy Growth Wisconsin’s … the 2012-13 school year, the Wisconsin...
42
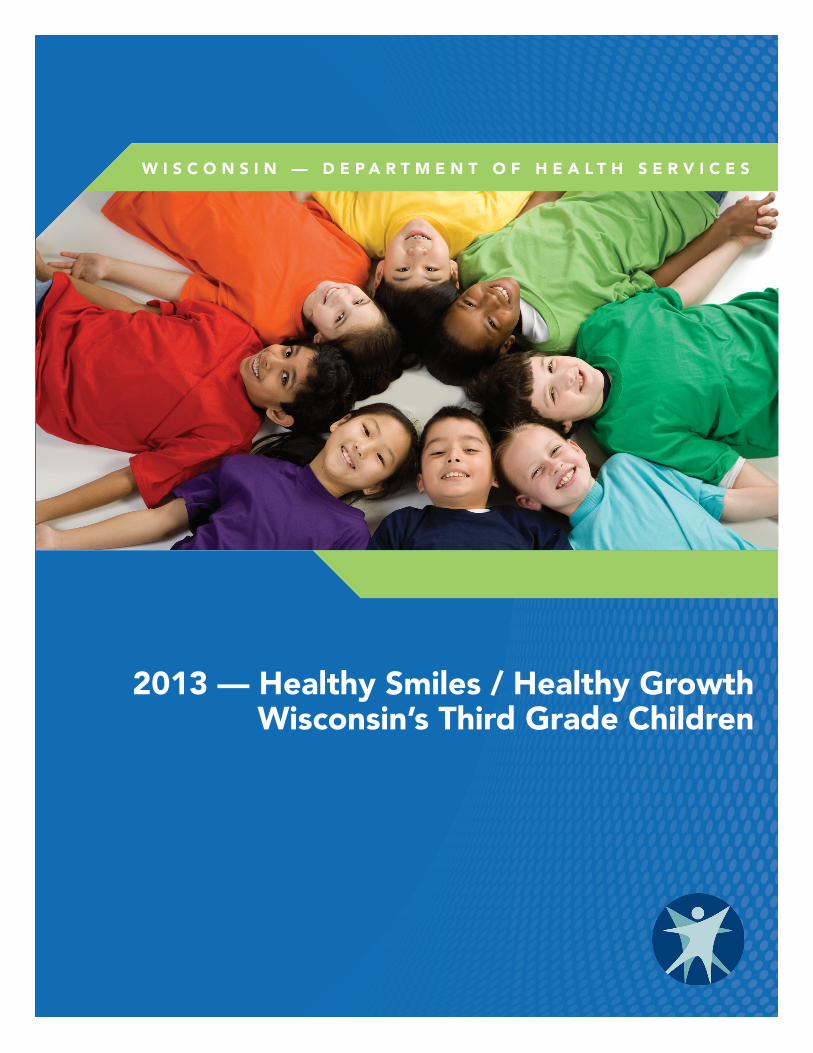
WISCONSIN — DEPARTMENT OF HEALTH SERVICES 2013 — Healthy Smiles / Healthy Growth Wisconsin’s Third Grade Children
Transcript of 2013 — Healthy Smiles / Healthy Growth Wisconsin’s … the 2012-13 school year, the Wisconsin...
W I S C O N S I N — D E P A R T M E N T O F H E A L T H S E R V I C E S
2013 — Healthy Smiles / Healthy GrowthWisconsin’s Third Grade Children
AuthorsMelissa Olson, MSJeffrey Chaffin, DDS, MPH, MBA, MHANancy Chudy, MPHAlyssa Yang, MPH
Survey Planning and DesignLisa Bell, RDH, MPHRobbyn Kuester, RDH, BSDHWarren LeMay, DDS, MPHMelissa Olson, MSMary Pesik, RD, CDJenna Schneider, MPHBrian Weaver, MPH
Technical Assistance Kathy Phipps, DrPH Epidemiologist, ASTDD Consultant
ScreenersLisa Bell, RDH, MPHLinda Bohacek, RDHMatt Crespin, MPH, RDHDiane Flanagan, RDHTracy Jannssen, RDHKim Johns, RDH, BSDH, MSRobbyn Kuester, RDH, BSDHJenna Linden, RDH, CDHC, BSKelley Moran, RDH, CDHC, BSCarol Newton, RDHJulio Rodriguez, DDSNancy Rublee, RDHCarrie Stempski, RDH, CDHC, BS
Funding SourcesThe publication was made possible in part by funding from two grants from the Centers for Disease Control and Prevention. The Division of Oral Health, Cooperative Agreement DP08-802 and the Division of Nutrition, Physical Activity and Obesity Cooperative Agreement 5U58DP001494-05.
The Wisconsin Department of Health Services would like to acknowledge and thank the Department of Public Instruction and the staff at all participating schools. Additionally, without the support of numerous volunteers this survey would not have been possible.
For additional information on the Wisconsin Oral Health Program, please visit the website at http://dhs.wisconsin.gov/health/Oral_Health/
For additional information on the Wisconsin Nutrition, Physical Activity and Obesity Program, please visit the website at http://www.dhs.wisconsin.gov/physical-activity/
Suggested CitationOlson, MA, Chaffin JG, Chudy N, Yang A. Healthy Smiles / Healthy Body: Wisconsin’s Third Grade Children, 2013. Wisconsin Oral Health Program, Wisconsin Department of Health Services.
Publication #: P-00589
AC
KN
OW
LED
GE
ME
NTS
H E A LT H Y S M I L E S / H E A LT H Y G R O W T H
PAGE ONE
Executive Summary . . . . . . . . . . . . . . . . . . . . . . . . . . . . . . . . . . . . . . . . . . . . . . . . 3
Introduction . . . . . . . . . . . . . . . . . . . . . . . . . . . . . . . . . . . . . . . . . . . . . . . . . . . . . . 5
Methods . . . . . . . . . . . . . . . . . . . . . . . . . . . . . . . . . . . . . . . . . . . . . . . . . . . . . . . . 9
Results . . . . . . . . . . . . . . . . . . . . . . . . . . . . . . . . . . . . . . . . . . . . . . . . . . . . . . . . . 12
Conclusions . . . . . . . . . . . . . . . . . . . . . . . . . . . . . . . . . . . . . . . . . . . . . . . . . . . . . 26
Data Tables . . . . . . . . . . . . . . . . . . . . . . . . . . . . . . . . . . . . . . . . . . . . . . . . . . . . . 28
References . . . . . . . . . . . . . . . . . . . . . . . . . . . . . . . . . . . . . . . . . . . . . . . . . . . . . . 35
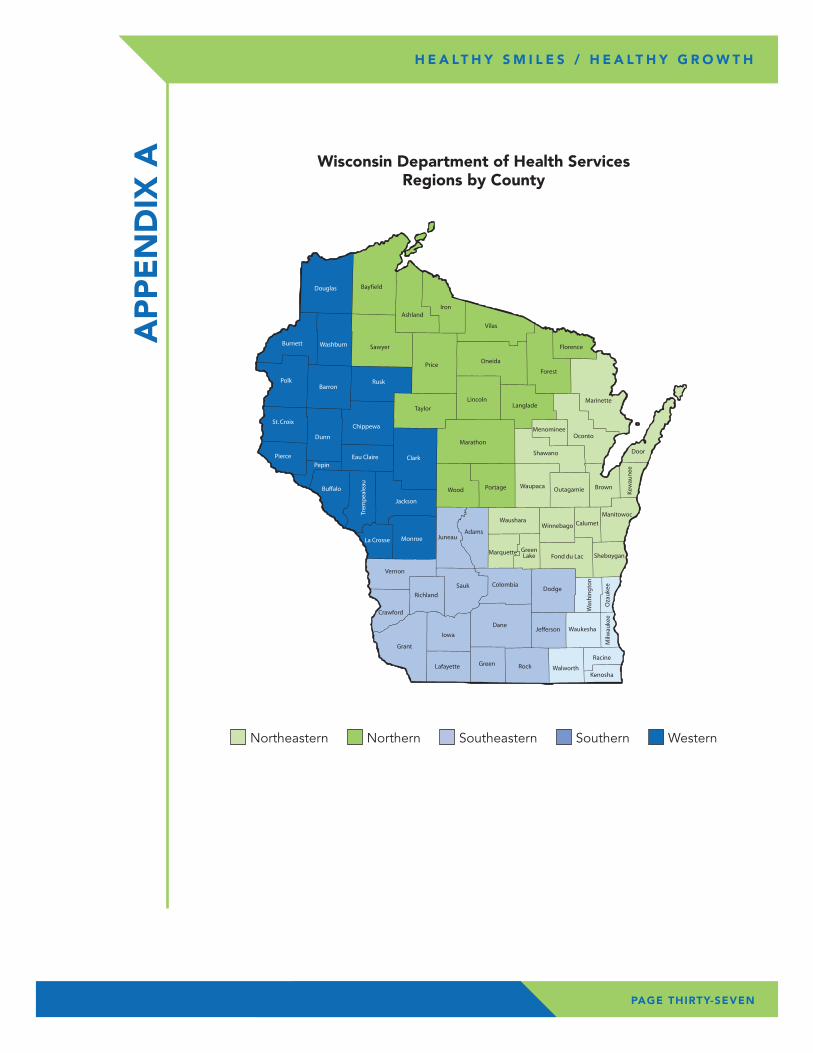
Appendix A: Department of Health Services Public Health Regions. . . . . . . . . 37
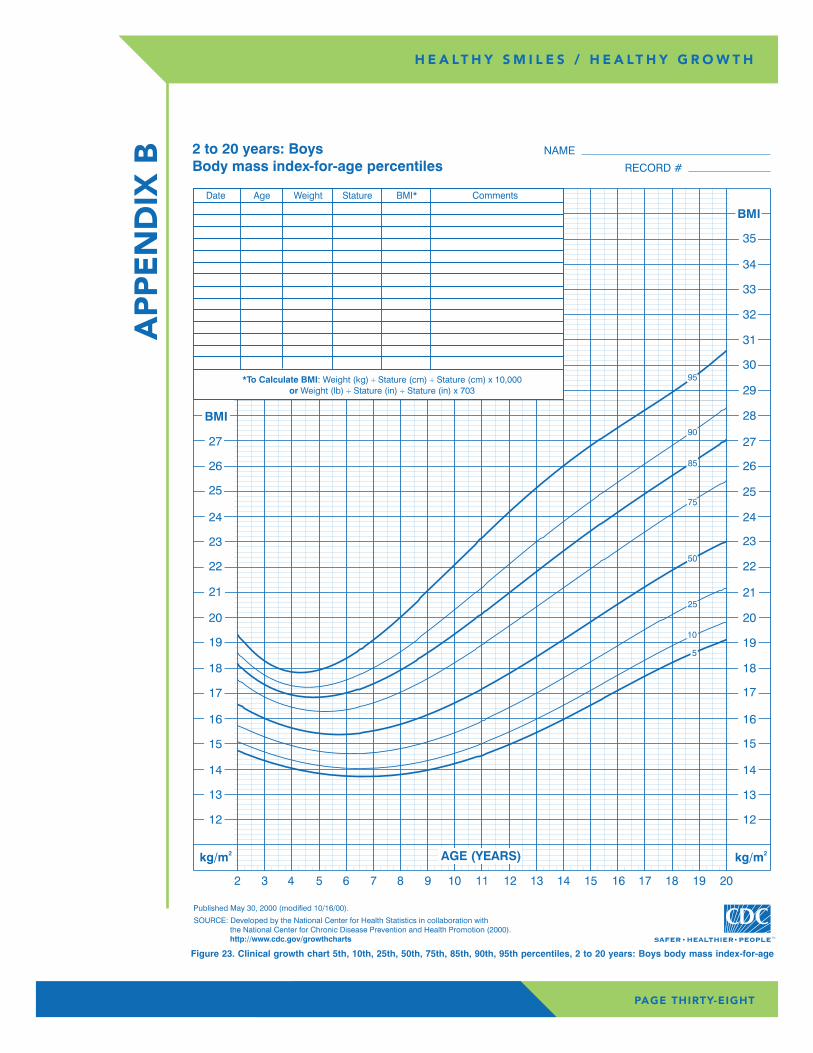
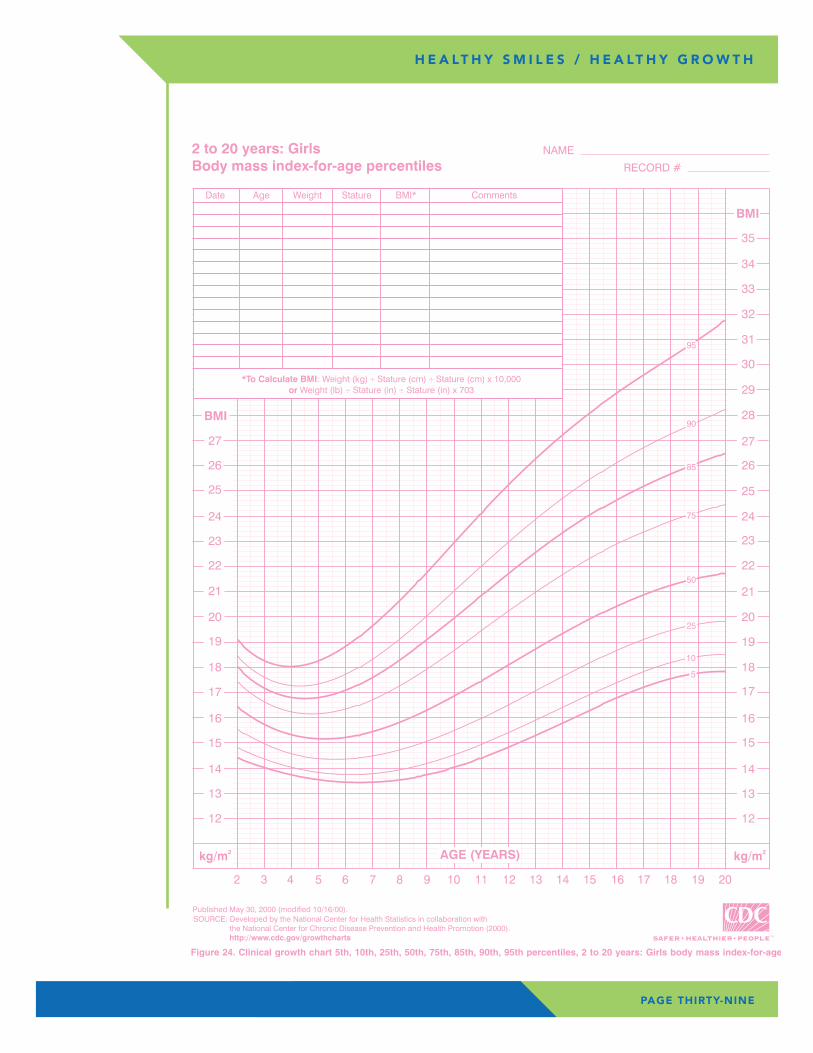
Appendix B: CDC Growth Charts . . . . . . . . . . . . . . . . . . . . . . . . . . . . . . . . . . . . 38
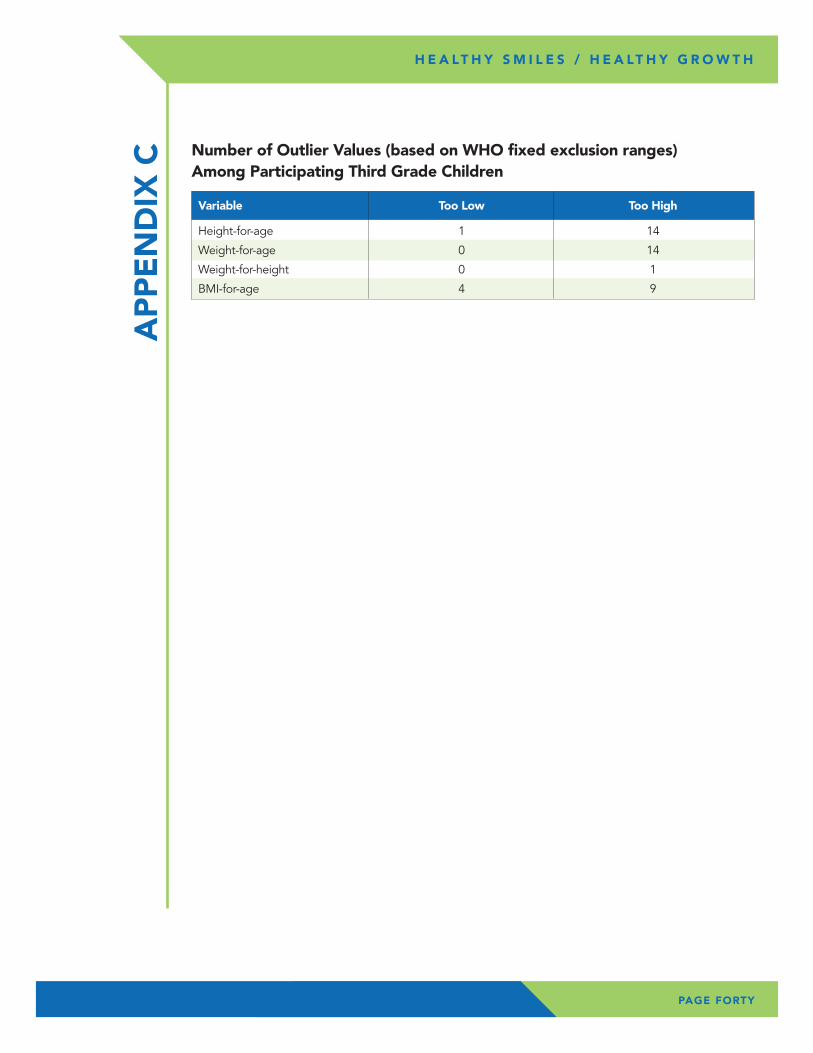
Appendix C: Number of Outlier Values . . . . . . . . . . . . . . . . . . . . . . . . . . . . . . . 40
TAB
LE O
F C
ON
TEN
TS
PAGE TWO
H E A LT H Y S M I L E S / H E A LT H Y G R O W T H
During the 2012-13 school year, the Wisconsin Department of Health Services, completed the Healthy Smiles / Healthy Growth, a statewide survey on the oral health and height / weight status of Wisconsin’s third grade children. More than 2,800 third grade children in public schools participated in the survey. Dental screenings and height / weight measurements were completed by dental hygienists and dentists following the protocol of a Basic Screening Survey from the Association of State and Territorial Dental Directors. Results were compared to similar surveys conducted in 2001-02 and the 2007-08 school years. Overall, it was found that in the 2012-13 school year, tooth decay and obesity continue to be a problem for Wisconsin’s children. Seven key findings were identified.
Key Findings – Oral Health• Tooth decay is a significant public health problem, as 53 percent of Wisconsin
third grade children have caries experience.
• Over 18 percent of Wisconsin third grade children have untreated dental decay and three percent have an urgent condition causing pain and / or infection. While this is an improvement over previous surveys, there are still approximately 2,000 Wisconsin third graders in public schools requiring urgent dental care because of pain or infection.
EX
EC
UTI
VE
SU
MM
AR
Y
PAGE THREE
H E A LT H Y S M I L E S / H E A LT H Y G R O W T H
• Over 60 percent of third grade children in Wisconsin have at least one dental sealant on a permanent molar. This is an improvement over previous surveys and a positive finding as dental sealants are a well-accepted clinical intervention to prevent dental caries.
• The oral health disparity gap seems to be shrinking for access to dental sealants as children of all races and socioeconomic groups have similar levels of dental sealants. The school-based sealant programs are likely to play a major role in expanding availability of dental sealants to all children.
Key Findings – Growth Status• Seventeen percent of Wisconsin third grade children are obese; and one-third
of children are either overweight or obese.
• Children who attend schools with high levels of Free / Reduced Meals Program (FRMP) eligibility have greater rates of obesity. Children attending schools with the highest level of FRMP (≥75 percent) had the highest level of children who were classified as obese (27 percent).
• Overweight and obesity differ among Wisconsin’s racial and ethnic groups. Third grade children of racial and ethnic minority groups had higher levels of overweight and obesity in comparison to White children during both measurement periods. Overall, 14 percent of White, 21 percent of African American, 30 percent of Hispanic / Latino, 17 percent of Asian, and 21 percent of Other children were classified as obese during 2012-13 school year.
PAGE FOUR
H E A LT H Y S M I L E S / H E A LT H Y G R O W T H
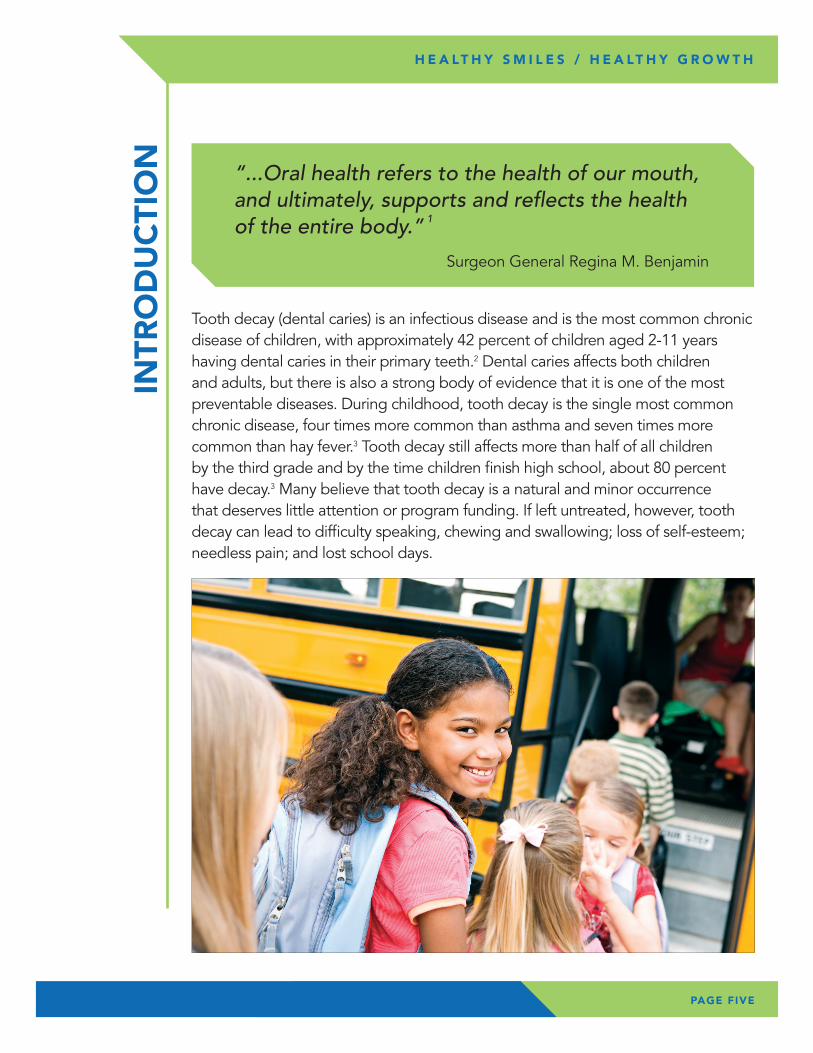
Tooth decay (dental caries) is an infectious disease and is the most common chronic disease of children, with approximately 42 percent of children aged 2-11 years having dental caries in their primary teeth.2 Dental caries affects both children and adults, but there is also a strong body of evidence that it is one of the most preventable diseases. During childhood, tooth decay is the single most common chronic disease, four times more common than asthma and seven times more common than hay fever.3 Tooth decay still affects more than half of all children by the third grade and by the time children finish high school, about 80 percent have decay.3 Many believe that tooth decay is a natural and minor occurrence that deserves little attention or program funding. If left untreated, however, tooth decay can lead to difficulty speaking, chewing and swallowing; loss of self-esteem; needless pain; and lost school days.
INTR
OD
UC
TIO
N
PAGE FIVE
H E A LT H Y S M I L E S / H E A LT H Y G R O W T H
“...Oral health refers to the health of our mouth, and ultimately, supports and reflects the health of the entire body.” 1
Surgeon General Regina M. Benjamin
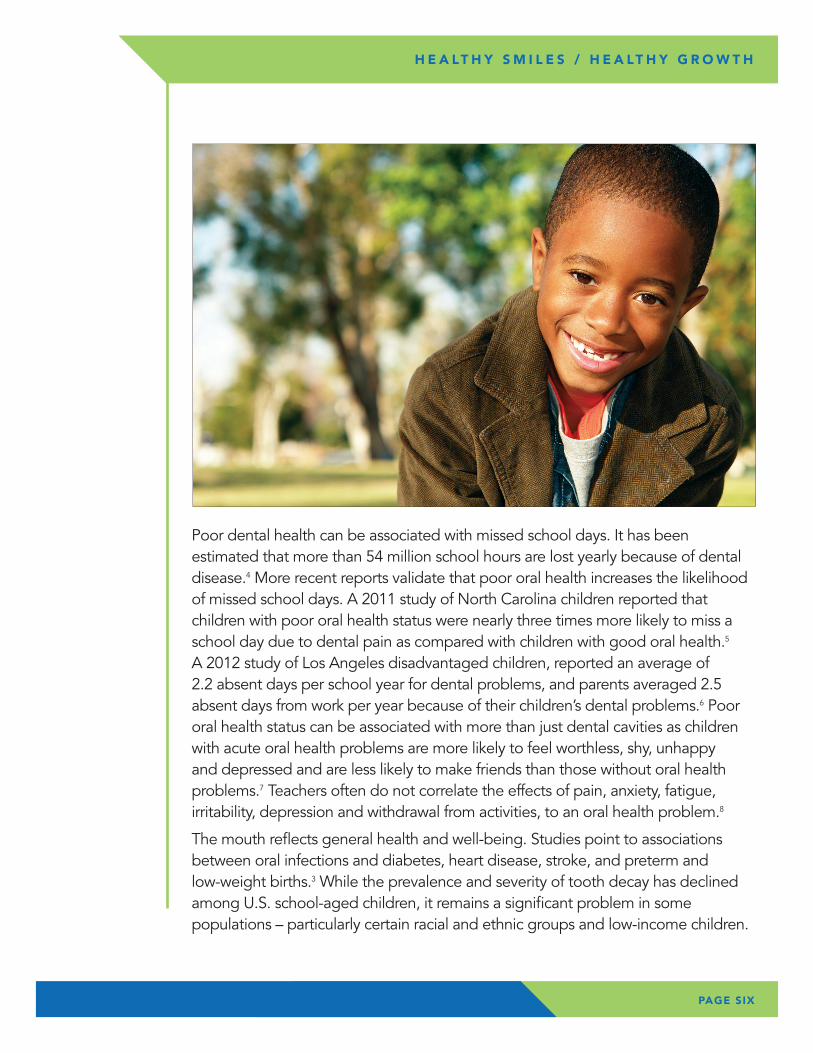
Poor dental health can be associated with missed school days. It has been estimated that more than 54 million school hours are lost yearly because of dental disease.4 More recent reports validate that poor oral health increases the likelihood of missed school days. A 2011 study of North Carolina children reported that children with poor oral health status were nearly three times more likely to miss a school day due to dental pain as compared with children with good oral health.5 A 2012 study of Los Angeles disadvantaged children, reported an average of 2.2 absent days per school year for dental problems, and parents averaged 2.5 absent days from work per year because of their children’s dental problems.6 Poor oral health status can be associated with more than just dental cavities as children with acute oral health problems are more likely to feel worthless, shy, unhappy and depressed and are less likely to make friends than those without oral health problems.7 Teachers often do not correlate the effects of pain, anxiety, fatigue, irritability, depression and withdrawal from activities, to an oral health problem.8
The mouth reflects general health and well-being. Studies point to associations between oral infections and diabetes, heart disease, stroke, and preterm and low-weight births.3 While the prevalence and severity of tooth decay has declined among U.S. school-aged children, it remains a significant problem in some populations – particularly certain racial and ethnic groups and low-income children.
PAGE SIX
H E A LT H Y S M I L E S / H E A LT H Y G R O W T H
PAGE SEVEN
H E A LT H Y S M I L E S / H E A LT H Y G R O W T H
Low-income children and racial and ethnic minority groups have more untreated decay than the U.S. population as a whole. National data for the combined years of 2007 to 2010 indicate that 15.6 percent of children ages 6 to19 years have untreated dental caries in the U.S. White children have the lowest rates of 12.8 percent while 22.4 percent of African American children and 21.9 percent for Mexican American children have untreated dental caries. Additionally those below 100 percent of the poverty level have a rate of 24.7 percent.9
In addition to untreated decay, the survey assessed the presence of dental sealants on first molars. Dental sealants are an evidence-based preventive procedure that the Wisconsin Oral Health Program supports. The Wisconsin Seal-A-Smile program is a collaborative effort between Children’s Health Alliance of Wisconsin (CHAW) and the Wisconsin Department of Health Services (DHS). The mission of the Wisconsin Seal-A-Smile Program is to improve the oral health of Wisconsin children through school-based / school-linked dental sealant programs. There are numerous meta-analyses and systematic reviews that confirm the effectiveness of dental sealants in preventing cavities in the occlusal (biting) surfaces of molar teeth.10-11
Oral health is an integral part of overall health. Not all children experience the same levels of dental health, even though most dental disease is preventable and there are evidence-based strategies to prevent dental disease. The school-based sealant programs have been shown to be effective by removing barriers to accessing dental sealants and providing fluoride varnish to children at increased risk for dental disease.
“Obesity continues to be a major public health problem. We need intensive, comprehensive and ongoing efforts to address obesity. If we don’t, more people will get sick and die from obesity-related conditions, such as heart disease, stroke, type 2 diabetes and certain types of cancer – some of the leading causes of death.” 12
Thomas R. Frieden, MD, MPH Director, Centers for Disease Control and Prevention
PAGE EIGHT
H E A LT H Y S M I L E S / H E A LT H Y G R O W T H
Wisconsin mirrors the nation in the childhood overweight and obesity public health crisis. Childhood obesity has more than doubled in children and tripled in adolescents in the past 30 years.13-14 Two measurements of Wisconsin third grade children’s weight (2008, 2013) indicate overweight and obesity is a public health problem in Wisconsin. Studies reveal that being overweight or obese has a profound impact on children’s health throughout their lives.
The immediate problems caused by obesity include high blood pressure, high cholesterol, impaired glucose tolerance, insulin resistance and type 2 diabetes. All of the complications associated with obesity are risk factors for heart disease and diabetes. Obese children and adolescents have a greater risk of social and psychological problems such as discrimination and poor self-esteem, which can continue into adulthood.15 Obese children are more likely to become obese adults.16-18 Children who are overweight or obese as preschoolers are five times as likely, as normal-weight children, to be overweight or obese as adults. Adult obesity is associated with a number of serious health conditions including heart disease, diabetes, and some cancers. If children are overweight, obesity in adulthood is likely to be more severe.19-20
The third grade survey of children’s height and weight measurements provided an opportunity to monitor overweight and obesity rates in Wisconsin. There are surveillance systems in place to monitor younger and older children, but a gap existed for school-aged children. Low income children enrolled in the Women, Infants and Children Supplemental Nutrition Program (WIC), have routine height and weight measurements. In 2011, 17 percent of these children aged 2 to 4 years were classified as overweight, while 14 percent were classified as obese, with wide variation among racial and ethnic groups.21 The Youth Risk Behavior Survey (YRBS) found that 15 percent of high school students reported information that classified them as overweight, and 10 percent were classified as obese.22 The Nutrition, Physical Activity, and Obesity Prevention Program staff welcomed an opportunity to partner with the Oral Health Program to add a height and weight measurement as a component of the third grade survey to have a sample of overweight and obesity trends for school-aged children.
Healthy Smiles / Healthy Growth included a representative sample of third grade students in Wisconsin public schools. All public schools with at least 10 children enrolled in third grade during the 2011-12 school year were included in the sampling frame, which contained 1,055 schools and 59,336 students. The sampling frame was stratified by the Wisconsin DHS five public health regions (Appendix A) and ordered within each region by the percent of students eligible for the Free / Reduced Meals Program (FRMP) program. FRMP participation rates are used as a surrogate for income. Probability proportional to size sampling was used to randomly select programs within each region. In all regions except the Northern region, eight percent of schools were selected. The Northern region is less populated and was oversampled, with ten percent of schools selected instead of eight, to ensure an adequate sample size for regional estimates. Passive consent was used for all schools except for three, which required active consent to participate. Parents were able to opt out of either portion of the survey or out of both.
If a school refused to participate, another school in that region with a similar FRMP eligibility rate was randomly selected as the replacement. If the replacement school refused to participate, there were no additional efforts to replace that school. Initially 90 schools were selected to participate and each school represented a strata.
ME
THO
DS
PAGE NINE
H E A LT H Y S M I L E S / H E A LT H Y G R O W T H
PAGE TEN
H E A LT H Y S M I L E S / H E A LT H Y G R O W T H
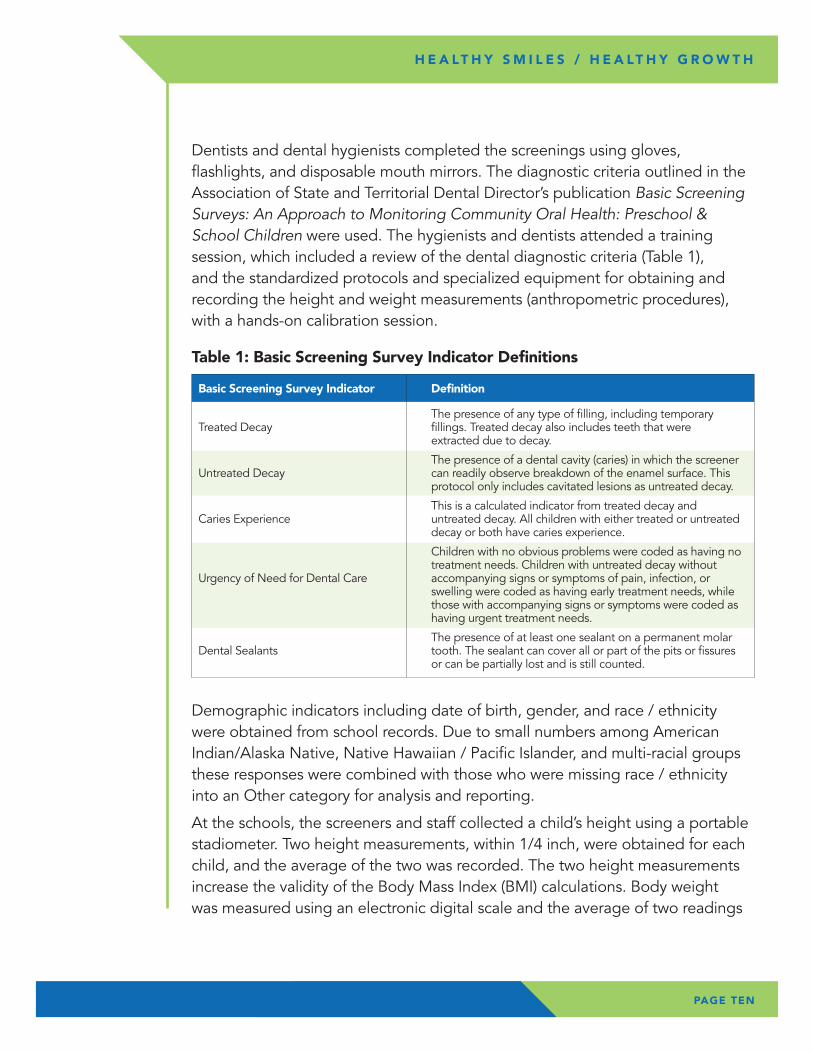
Dentists and dental hygienists completed the screenings using gloves, flashlights, and disposable mouth mirrors. The diagnostic criteria outlined in the Association of State and Territorial Dental Director’s publication Basic Screening Surveys: An Approach to Monitoring Community Oral Health: Preschool & School Children were used. The hygienists and dentists attended a training session, which included a review of the dental diagnostic criteria (Table 1), and the standardized protocols and specialized equipment for obtaining and recording the height and weight measurements (anthropometric procedures), with a hands-on calibration session.
Demographic indicators including date of birth, gender, and race / ethnicity were obtained from school records. Due to small numbers among American Indian/Alaska Native, Native Hawaiian / Pacific Islander, and multi-racial groups these responses were combined with those who were missing race / ethnicity into an Other category for analysis and reporting.
At the schools, the screeners and staff collected a child’s height using a portable stadiometer. Two height measurements, within 1/4 inch, were obtained for each child, and the average of the two was recorded. The two height measurements increase the validity of the Body Mass Index (BMI) calculations. Body weight was measured using an electronic digital scale and the average of two readings
Table 1: Basic Screening Survey Indicator Definitions
Basic Screening Survey Indicator Definition
The presence of any type of filling, including temporary Treated Decay fillings. Treated decay also includes teeth that were extracted due to decay.
The presence of a dental cavity (caries) in which the screener Untreated Decay can readily observe breakdown of the enamel surface. This protocol only includes cavitated lesions as untreated decay.
This is a calculated indicator from treated decay and Caries Experience untreated decay. All children with either treated or untreated decay or both have caries experience.
Children with no obvious problems were coded as having no treatment needs. Children with untreated decay without Urgency of Need for Dental Care accompanying signs or symptoms of pain, infection, or swelling were coded as having early treatment needs, while those with accompanying signs or symptoms were coded as having urgent treatment needs.
The presence of at least one sealant on a permanent molar Dental Sealants tooth. The sealant can cover all or part of the pits or fissures or can be partially lost and is still counted.
PAGE ELEVEN
H E A LT H Y S M I L E S / H E A LT H Y G R O W T H
within 0.2 pounds was recorded. Children removed shoes, coats, and bulky outerwear for weight measurements. DPH staff calculated the children’s BMI categories from the height and weight measurements. BMI is a reliable indicator of body fatness for most children; it is age-and sex-specific. BMI does not measure body fat directly, but can be considered an alternative for direct measures of body fat.
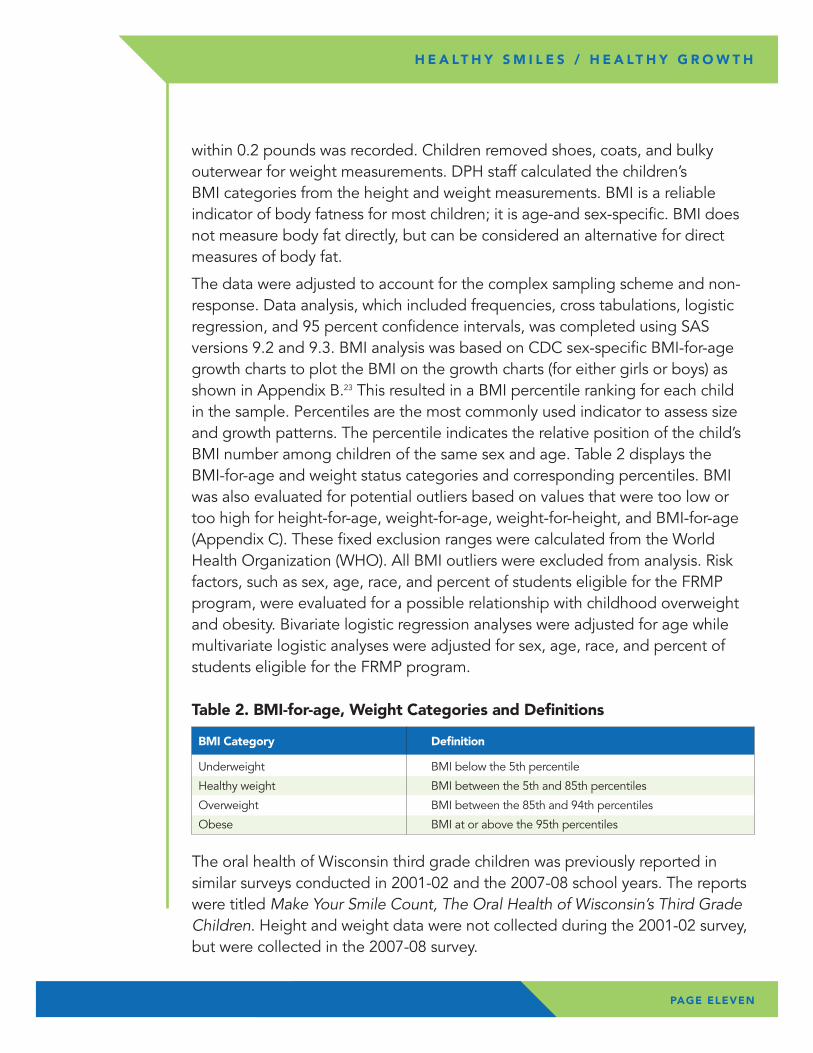
The data were adjusted to account for the complex sampling scheme and non-response. Data analysis, which included frequencies, cross tabulations, logistic regression, and 95 percent confidence intervals, was completed using SAS versions 9.2 and 9.3. BMI analysis was based on CDC sex-specific BMI-for-age growth charts to plot the BMI on the growth charts (for either girls or boys) as shown in Appendix B.23 This resulted in a BMI percentile ranking for each child in the sample. Percentiles are the most commonly used indicator to assess size and growth patterns. The percentile indicates the relative position of the child’s BMI number among children of the same sex and age. Table 2 displays the BMI-for-age and weight status categories and corresponding percentiles. BMI was also evaluated for potential outliers based on values that were too low or too high for height-for-age, weight-for-age, weight-for-height, and BMI-for-age (Appendix C). These fixed exclusion ranges were calculated from the World Health Organization (WHO). All BMI outliers were excluded from analysis. Risk factors, such as sex, age, race, and percent of students eligible for the FRMP program, were evaluated for a possible relationship with childhood overweight and obesity. Bivariate logistic regression analyses were adjusted for age while multivariate logistic analyses were adjusted for sex, age, race, and percent of students eligible for the FRMP program.
The oral health of Wisconsin third grade children was previously reported in similar surveys conducted in 2001-02 and the 2007-08 school years. The reports were titled Make Your Smile Count, The Oral Health of Wisconsin’s Third Grade Children. Height and weight data were not collected during the 2001-02 survey, but were collected in the 2007-08 survey.
Table 2. BMI-for-age, Weight Categories and Definitions
BMI Category Definition
Underweight BMI below the 5th percentile
Healthy weight BMI between the 5th and 85th percentiles
Overweight BMI between the 85th and 94th percentiles
Obese BMI at or above the 95th percentiles
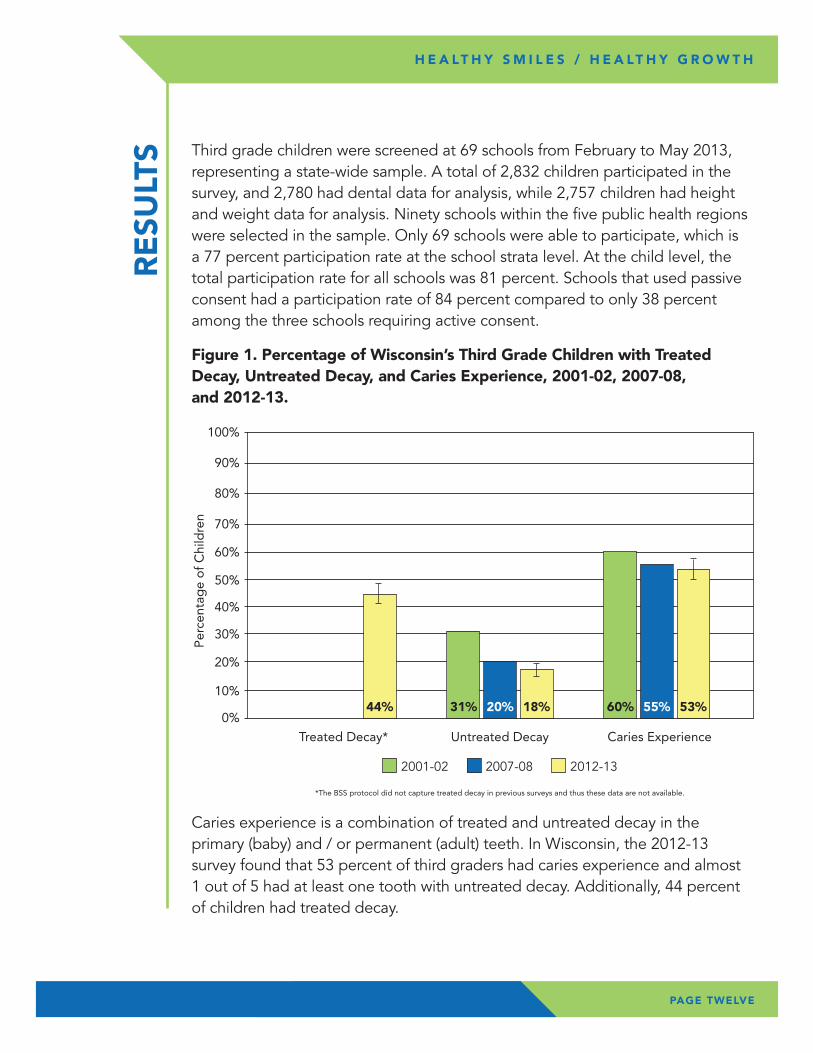
Caries experience is a combination of treated and untreated decay in the primary (baby) and / or permanent (adult) teeth. In Wisconsin, the 2012-13 survey found that 53 percent of third graders had caries experience and almost 1 out of 5 had at least one tooth with untreated decay. Additionally, 44 percent of children had treated decay.
Third grade children were screened at 69 schools from February to May 2013, representing a state-wide sample. A total of 2,832 children participated in the survey, and 2,780 had dental data for analysis, while 2,757 children had height and weight data for analysis. Ninety schools within the five public health regions were selected in the sample. Only 69 schools were able to participate, which is a 77 percent participation rate at the school strata level. At the child level, the total participation rate for all schools was 81 percent. Schools that used passive consent had a participation rate of 84 percent compared to only 38 percent among the three schools requiring active consent.
RE
SULT
S
PAGE TWELVE
H E A LT H Y S M I L E S / H E A LT H Y G R O W T H
Per
cent
age
of
Chi
ldre
n
Treated Decay*
*The BSS protocol did not capture treated decay in previous surveys and thus these data are not available.
0%
10%
20%
30%
40%
50%
60%
70%
80%
� 2001-02 � 2007-08 � 2012-13
90%
100%
Untreated Decay Caries Experience
44% 31% 20% 18% 60% 55% 53%
Figure 1. Percentage of Wisconsin’s Third Grade Children with Treated Decay, Untreated Decay, and Caries Experience, 2001-02, 2007-08, and 2012-13.
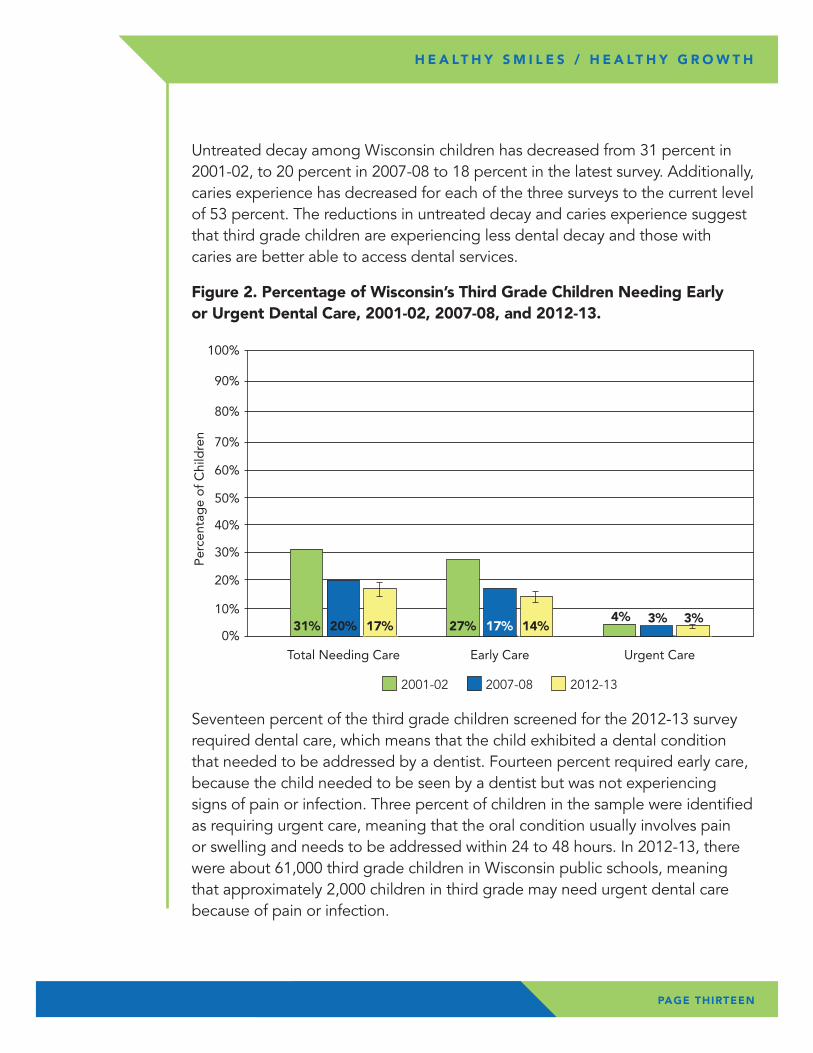
Seventeen percent of the third grade children screened for the 2012-13 survey required dental care, which means that the child exhibited a dental condition that needed to be addressed by a dentist. Fourteen percent required early care, because the child needed to be seen by a dentist but was not experiencing signs of pain or infection. Three percent of children in the sample were identified as requiring urgent care, meaning that the oral condition usually involves pain or swelling and needs to be addressed within 24 to 48 hours. In 2012-13, there were about 61,000 third grade children in Wisconsin public schools, meaning that approximately 2,000 children in third grade may need urgent dental care because of pain or infection.
Figure 2. Percentage of Wisconsin’s Third Grade Children Needing Early or Urgent Dental Care, 2001-02, 2007-08, and 2012-13.
PAGE THIRTEEN
H E A LT H Y S M I L E S / H E A LT H Y G R O W T H
Total Needing Care
0%
10%
20%
30%
40%
50%
60%
70%
80%
� 2001-02 � 2007-08 � 2012-13
90%
100%
Early Care Urgent Care
31% 20% 17% 27% 14%17%4% 3%3%
Per
cent
age
of
Chi
ldre
n
Untreated decay among Wisconsin children has decreased from 31 percent in 2001-02, to 20 percent in 2007-08 to 18 percent in the latest survey. Additionally, caries experience has decreased for each of the three surveys to the current level of 53 percent. The reductions in untreated decay and caries experience suggest that third grade children are experiencing less dental decay and those with caries are better able to access dental services.
PAGE FOURTEEN
H E A LT H Y S M I L E S / H E A LT H Y G R O W T H
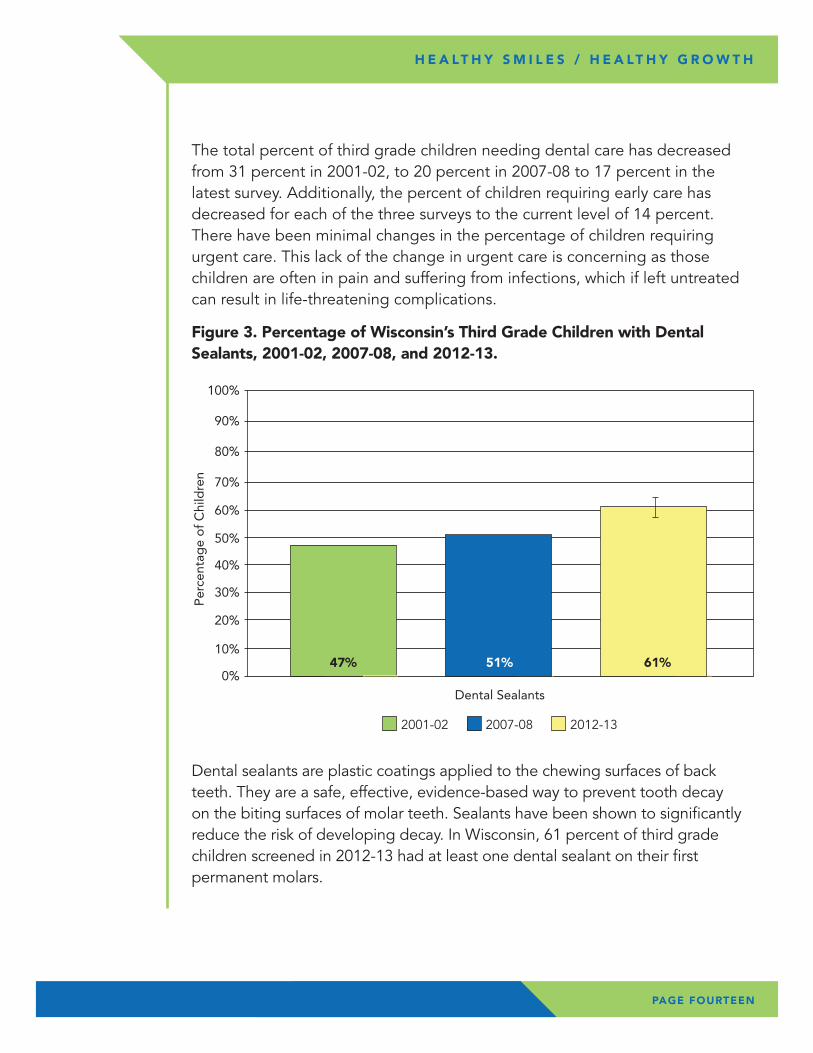
Dental sealants are plastic coatings applied to the chewing surfaces of back teeth. They are a safe, effective, evidence-based way to prevent tooth decay on the biting surfaces of molar teeth. Sealants have been shown to significantly reduce the risk of developing decay. In Wisconsin, 61 percent of third grade children screened in 2012-13 had at least one dental sealant on their first permanent molars.
Figure 3. Percentage of Wisconsin’s Third Grade Children with Dental Sealants, 2001-02, 2007-08, and 2012-13.
0%
10%
20%
30%
40%
50%
60%
70%
80%
� 2001-02 � 2007-08 � 2012-13
90%
100%
Dental Sealants
47% 51% 61%
Per
cent
age
of
Chi
ldre
n
The total percent of third grade children needing dental care has decreased from 31 percent in 2001-02, to 20 percent in 2007-08 to 17 percent in the latest survey. Additionally, the percent of children requiring early care has decreased for each of the three surveys to the current level of 14 percent. There have been minimal changes in the percentage of children requiring urgent care. This lack of the change in urgent care is concerning as those children are often in pain and suffering from infections, which if left untreated can result in life-threatening complications.
PAGE FIFTEEN
H E A LT H Y S M I L E S / H E A LT H Y G R O W T H
The sharp increase in dental sealants from 47 percent in 2001-02 to the current level of 61 percent suggests that Wisconsin third grade children have increased access to dental sealants from both private and public programs.
The Wisconsin Seal-A-Smile Program is a collaboration between the Department of Health Services Oral Health Program and CHAW. The Wisconsin Seal-A-Smile Program provides dental sealants to children in schools where at least 35 percent of the children qualify for FRMP. In 2012-13, approximately 23,000 dental sealants were placed in the Wisconsin Seal-A-Smile Programs.
The Wisconsin Seal-A-Smile Program has expanded dramatically since the 2000-01 school year. In 2000-01, the program received $54,000 in funding from General Purpose Revenue (GPR). Total funding for the 2013-14 school year was $627,212. Just over $370,000 of funding for the program is from GPR and $250,000 from Delta Dental of Wisconsin foundation. Additionally, code changes that allow dental hygienists working in public health settings to bill Medicaid have allowed programs to require less Seal-A-Smile Program funding. Accordingly, the number of schools served by the Wisconsin Seal-A-Smile Program has increased from approximately 280 in the 2008-09 school year to almost 550 in the 2012-13 school year.
PAGE SIXTEEN
H E A LT H Y S M I L E S / H E A LT H Y G R O W T H
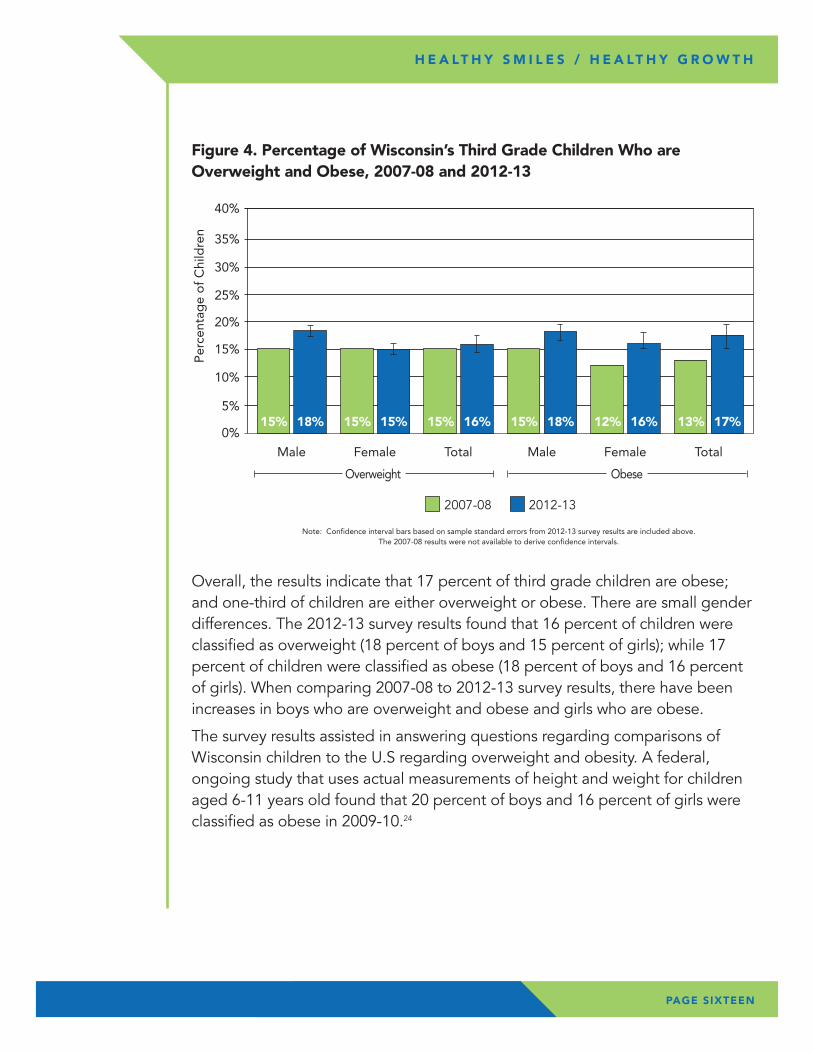
Overall, the results indicate that 17 percent of third grade children are obese; and one-third of children are either overweight or obese. There are small gender differences. The 2012-13 survey results found that 16 percent of children were classified as overweight (18 percent of boys and 15 percent of girls); while 17 percent of children were classified as obese (18 percent of boys and 16 percent of girls). When comparing 2007-08 to 2012-13 survey results, there have been increases in boys who are overweight and obese and girls who are obese.
The survey results assisted in answering questions regarding comparisons of Wisconsin children to the U.S regarding overweight and obesity. A federal, ongoing study that uses actual measurements of height and weight for children aged 6-11 years old found that 20 percent of boys and 16 percent of girls were classified as obese in 2009-10.24
Figure 4. Percentage of Wisconsin’s Third Grade Children Who are Overweight and Obese, 2007-08 and 2012-13
Note: Confidence interval bars based on sample standard errors from 2012-13 survey results are included above. The 2007-08 results were not available to derive confidence intervals.
0%
5%
10%
15%
20%
25%
30%
35%
40%
� 2007-08 � 2012-13
Male
15% 18%
Female
15% 15%
Total
15% 16%
Male
15% 18%
Female
12% 16%
Total
13% 17%
Per
cent
age
of
Chi
ldre
n
Overweight Obese
PAGE SEVENTEEN
H E A LT H Y S M I L E S / H E A LT H Y G R O W T H
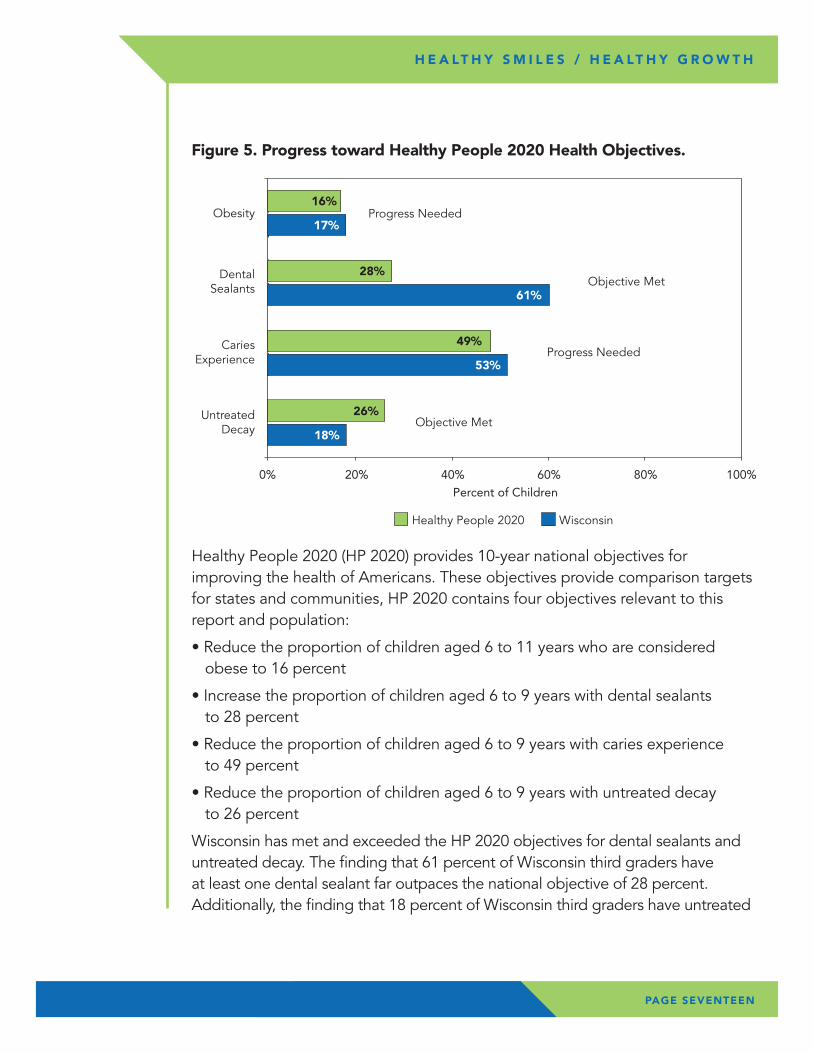
Healthy People 2020 (HP 2020) provides 10-year national objectives for improving the health of Americans. These objectives provide comparison targets for states and communities, HP 2020 contains four objectives relevant to this report and population:
• Reduce the proportion of children aged 6 to 11 years who are considered obese to 16 percent
• Increase the proportion of children aged 6 to 9 years with dental sealants to 28 percent
• Reduce the proportion of children aged 6 to 9 years with caries experience to 49 percent
• Reduce the proportion of children aged 6 to 9 years with untreated decay to 26 percent
Wisconsin has met and exceeded the HP 2020 objectives for dental sealants and untreated decay. The finding that 61 percent of Wisconsin third graders have at least one dental sealant far outpaces the national objective of 28 percent. Additionally, the finding that 18 percent of Wisconsin third graders have untreated
Figure 5. Progress toward Healthy People 2020 Health Objectives.
0% 100%
DentalSealants
� Healthy People 2020 � Wisconsin
20% 40% 60% 80%
Percent of Children
Objective Met
Obesity Progress Needed
CariesExperience Progress Needed
UntreatedDecay Objective Met
18%
26%
53%
49%
61%
28%
17%
16%
PAGE EIGHTEEN
H E A LT H Y S M I L E S / H E A LT H Y G R O W T H
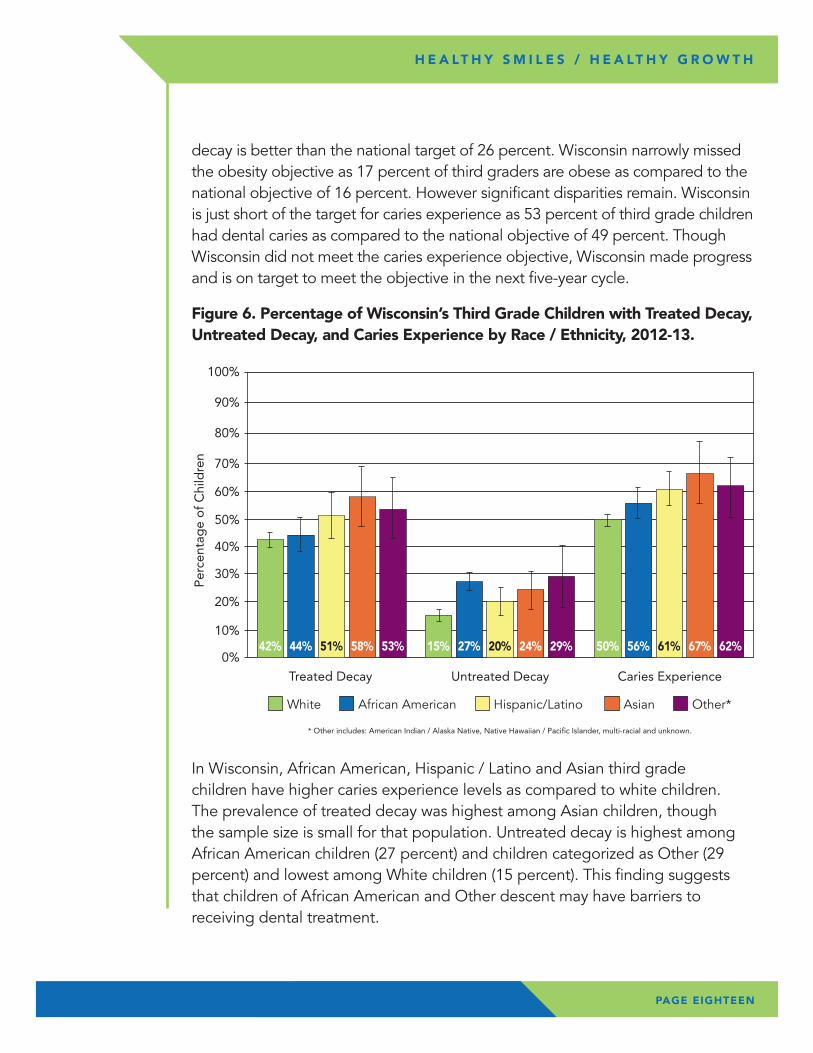
In Wisconsin, African American, Hispanic / Latino and Asian third grade children have higher caries experience levels as compared to white children. The prevalence of treated decay was highest among Asian children, though the sample size is small for that population. Untreated decay is highest among African American children (27 percent) and children categorized as Other (29 percent) and lowest among White children (15 percent). This finding suggests that children of African American and Other descent may have barriers to receiving dental treatment.
decay is better than the national target of 26 percent. Wisconsin narrowly missed the obesity objective as 17 percent of third graders are obese as compared to the national objective of 16 percent. However significant disparities remain. Wisconsin is just short of the target for caries experience as 53 percent of third grade children had dental caries as compared to the national objective of 49 percent. Though Wisconsin did not meet the caries experience objective, Wisconsin made progress and is on target to meet the objective in the next five-year cycle.
Figure 6. Percentage of Wisconsin’s Third Grade Children with Treated Decay, Untreated Decay, and Caries Experience by Race / Ethnicity, 2012-13.
* Other includes: American Indian / Alaska Native, Native Hawaiian / Pacific Islander, multi-racial and unknown.
0%
10%
20%
30%
40%
50%
60%
70%
80%
� White � African American � Hispanic/Latino � Asian � Other*
90%
100%
Treated Decay Untreated Decay Caries Experience
42% 44% 51% 58% 53% 50% 56% 61% 67% 62%15% 27% 20% 24% 29%
Per
cent
age
of
Chi
ldre
n
PAGE NINETEEN
H E A LT H Y S M I L E S / H E A LT H Y G R O W T H
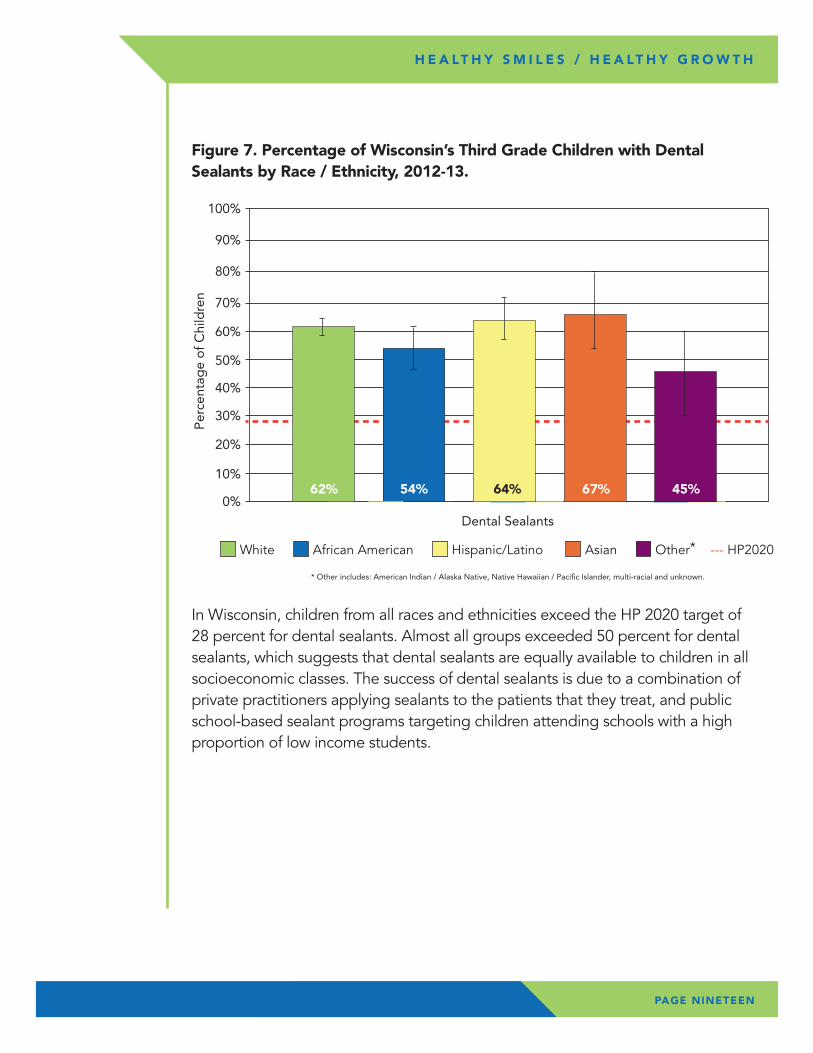
In Wisconsin, children from all races and ethnicities exceed the HP 2020 target of 28 percent for dental sealants. Almost all groups exceeded 50 percent for dental sealants, which suggests that dental sealants are equally available to children in all socioeconomic classes. The success of dental sealants is due to a combination of private practitioners applying sealants to the patients that they treat, and public school-based sealant programs targeting children attending schools with a high proportion of low income students.
Figure 7. Percentage of Wisconsin’s Third Grade Children with Dental Sealants by Race / Ethnicity, 2012-13.
0%
10%
20%
30%
40%
50%
60%
70%
80%
90%
100%
Dental Sealants
62% 54% 67%64% 45%
* Other includes: American Indian / Alaska Native, Native Hawaiian / Pacific Islander, multi-racial and unknown.
� White � African American � Hispanic/Latino � Asian � Other* --- HP2020
Per
cent
age
of
Chi
ldre
n
PAGE TWENTY
H E A LT H Y S M I L E S / H E A LT H Y G R O W T H
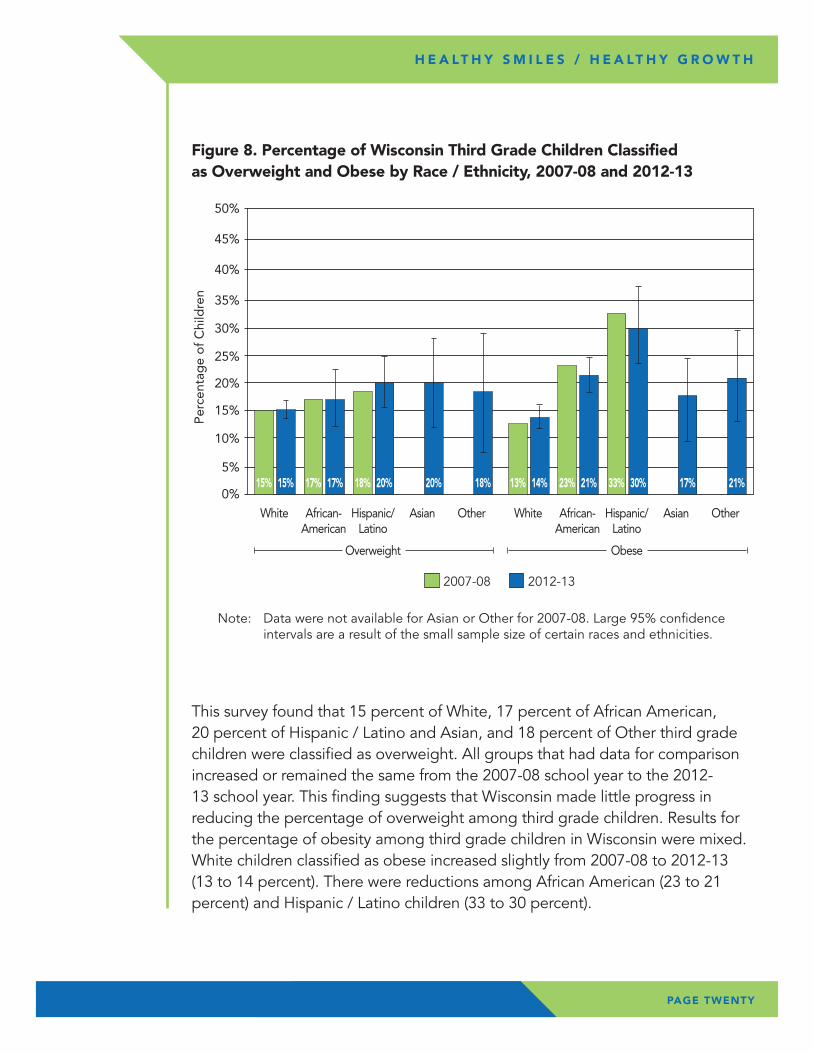
This survey found that 15 percent of White, 17 percent of African American, 20 percent of Hispanic / Latino and Asian, and 18 percent of Other third grade children were classified as overweight. All groups that had data for comparison increased or remained the same from the 2007-08 school year to the 2012-13 school year. This finding suggests that Wisconsin made little progress in reducing the percentage of overweight among third grade children. Results for the percentage of obesity among third grade children in Wisconsin were mixed. White children classified as obese increased slightly from 2007-08 to 2012-13 (13 to 14 percent). There were reductions among African American (23 to 21 percent) and Hispanic / Latino children (33 to 30 percent).
Figure 8. Percentage of Wisconsin Third Grade Children Classified as Overweight and Obese by Race / Ethnicity, 2007-08 and 2012-13
0%
5%
10%
15%
20%
25%
30%
35%
40%
� 2007-08 � 2012-13
45%
50%
White
15% 15%
African-American
17% 17%
Hispanic/Latino
Overweight
18% 20%
Asian
20%
Other
18%
White
13% 14%
African-American
23% 21%
Hispanic/Latino
Obese
33% 30%
Asian
17%
Other
21%
Per
cent
age
of
Chi
ldre
n
Note: Data were not available for Asian or Other for 2007-08. Large 95% confidence intervals are a result of the small sample size of certain races and ethnicities.
PAGE TWENTY-ONE
H E A LT H Y S M I L E S / H E A LT H Y G R O W T H
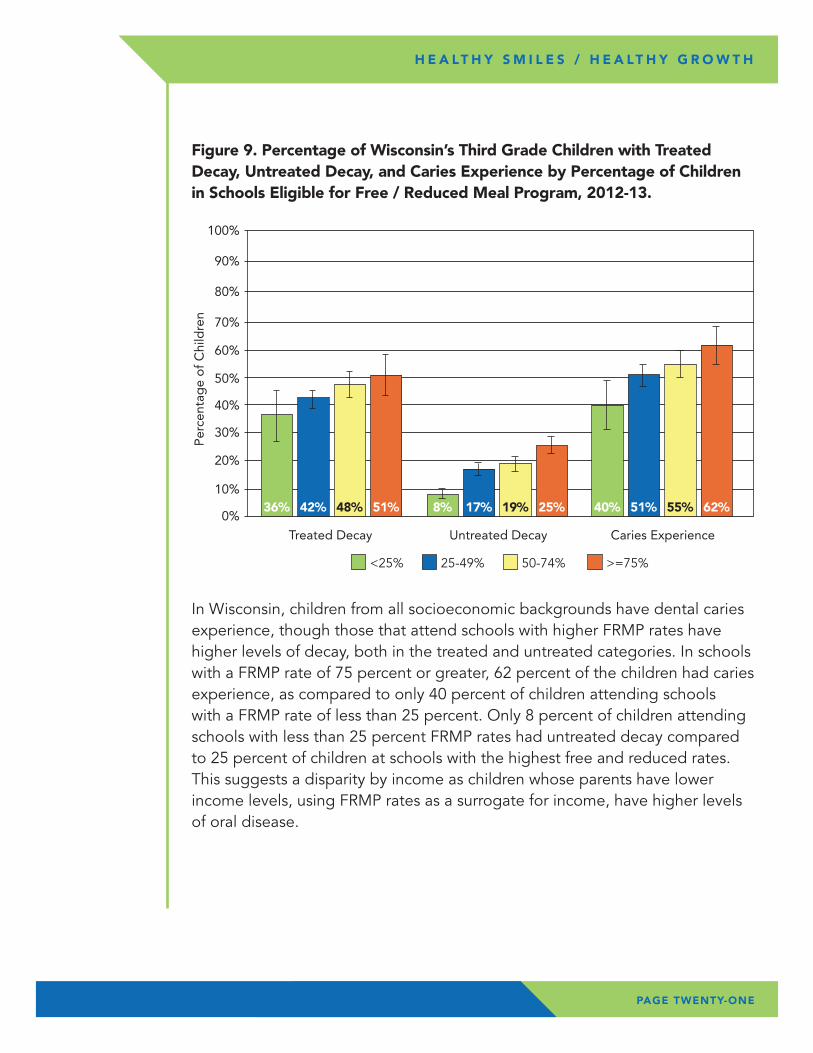
In Wisconsin, children from all socioeconomic backgrounds have dental caries experience, though those that attend schools with higher FRMP rates have higher levels of decay, both in the treated and untreated categories. In schools with a FRMP rate of 75 percent or greater, 62 percent of the children had caries experience, as compared to only 40 percent of children attending schools with a FRMP rate of less than 25 percent. Only 8 percent of children attending schools with less than 25 percent FRMP rates had untreated decay compared to 25 percent of children at schools with the highest free and reduced rates. This suggests a disparity by income as children whose parents have lower income levels, using FRMP rates as a surrogate for income, have higher levels of oral disease.
Figure 9. Percentage of Wisconsin’s Third Grade Children with Treated Decay, Untreated Decay, and Caries Experience by Percentage of Children in Schools Eligible for Free / Reduced Meal Program, 2012-13.
0%
10%
20%
30%
40%
50%
60%
70%
80%
� <25% � 25-49% � 50-74% � >=75%
90%
100%
Treated Decay Untreated Decay Caries Experience
36% 42% 48% 51% 8% 17% 19% 25% 40% 51% 55% 62%
Per
cent
age
of
Chi
ldre
n
PAGE TWENTY-TWO
H E A LT H Y S M I L E S / H E A LT H Y G R O W T H
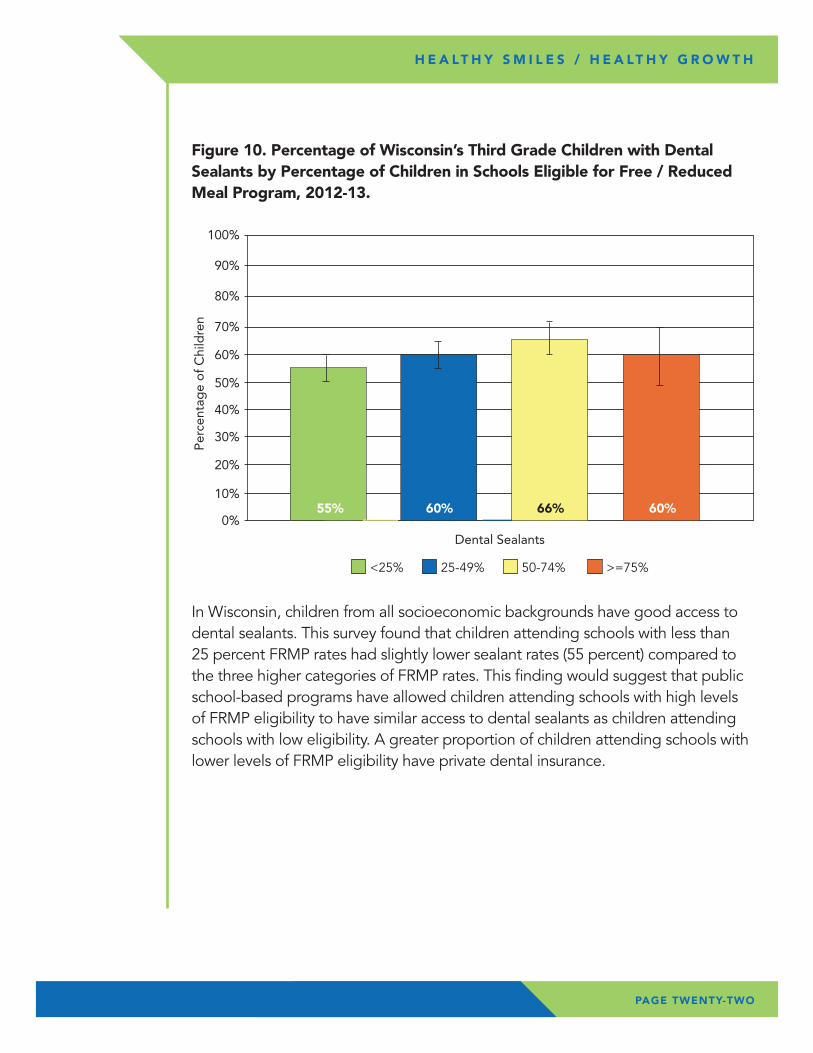
In Wisconsin, children from all socioeconomic backgrounds have good access to dental sealants. This survey found that children attending schools with less than 25 percent FRMP rates had slightly lower sealant rates (55 percent) compared to the three higher categories of FRMP rates. This finding would suggest that public school-based programs have allowed children attending schools with high levels of FRMP eligibility to have similar access to dental sealants as children attending schools with low eligibility. A greater proportion of children attending schools with lower levels of FRMP eligibility have private dental insurance.
Figure 10. Percentage of Wisconsin’s Third Grade Children with Dental Sealants by Percentage of Children in Schools Eligible for Free / Reduced Meal Program, 2012-13.
0%
10%
20%
30%
40%
50%
60%
70%
80%
90%
100%
Dental Sealants
55% 60% 66% 60%
� <25% � 25-49% � 50-74% � >=75%
Per
cent
age
of
Chi
ldre
n
PAGE TWENTY-THREE
H E A LT H Y S M I L E S / H E A LT H Y G R O W T H
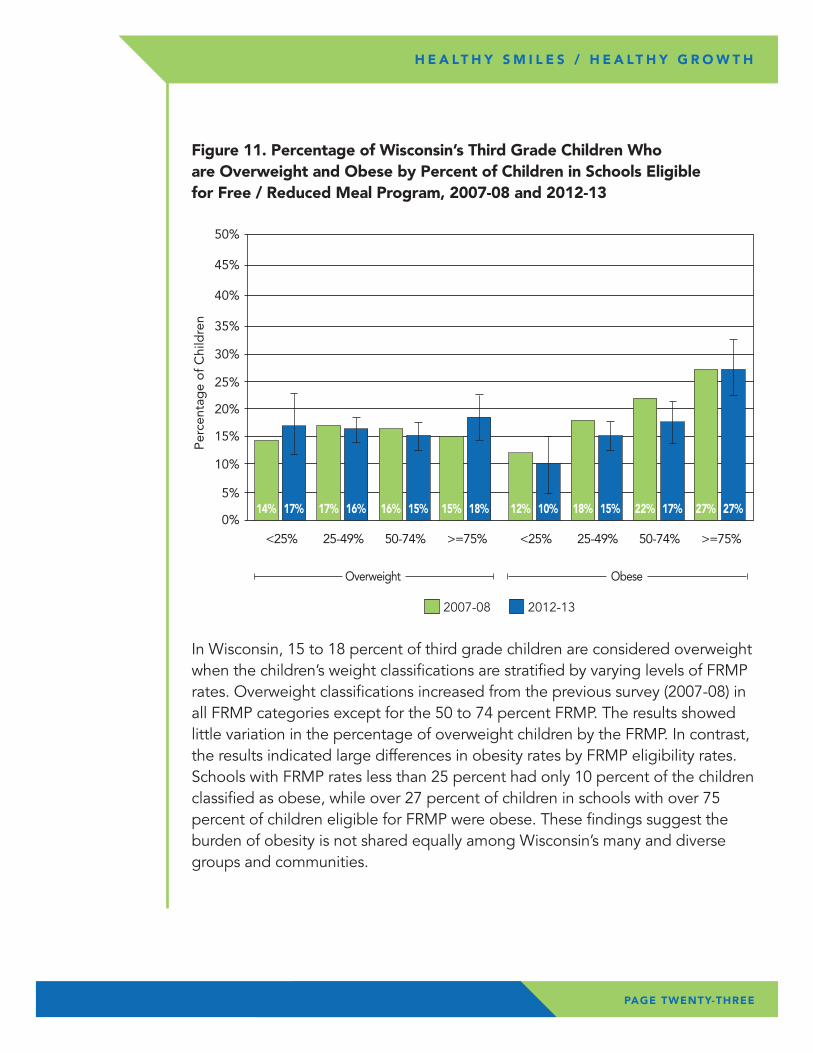
In Wisconsin, 15 to 18 percent of third grade children are considered overweight when the children’s weight classifications are stratified by varying levels of FRMP rates. Overweight classifications increased from the previous survey (2007-08) in all FRMP categories except for the 50 to 74 percent FRMP. The results showed little variation in the percentage of overweight children by the FRMP. In contrast, the results indicated large differences in obesity rates by FRMP eligibility rates. Schools with FRMP rates less than 25 percent had only 10 percent of the children classified as obese, while over 27 percent of children in schools with over 75 percent of children eligible for FRMP were obese. These findings suggest the burden of obesity is not shared equally among Wisconsin’s many and diverse groups and communities.
Figure 11. Percentage of Wisconsin’s Third Grade Children Who are Overweight and Obese by Percent of Children in Schools Eligible for Free / Reduced Meal Program, 2007-08 and 2012-13
0%
5%
10%
15%
20%
25%
30%
35%
40%
� 2007-08 � 2012-13
45%
50%
<25%
14% 17%
25-49%
17% 16%
50-74%
Overweight
16% 15%
>=75%
Obese
15% 18%
<25%
12% 10%
25-49%
18% 15%
50-74%
22% 17%
>=75%
27% 27%
Per
cent
age
of
Chi
ldre
n
PAGE TWENTY-FOUR
H E A LT H Y S M I L E S / H E A LT H Y G R O W T H
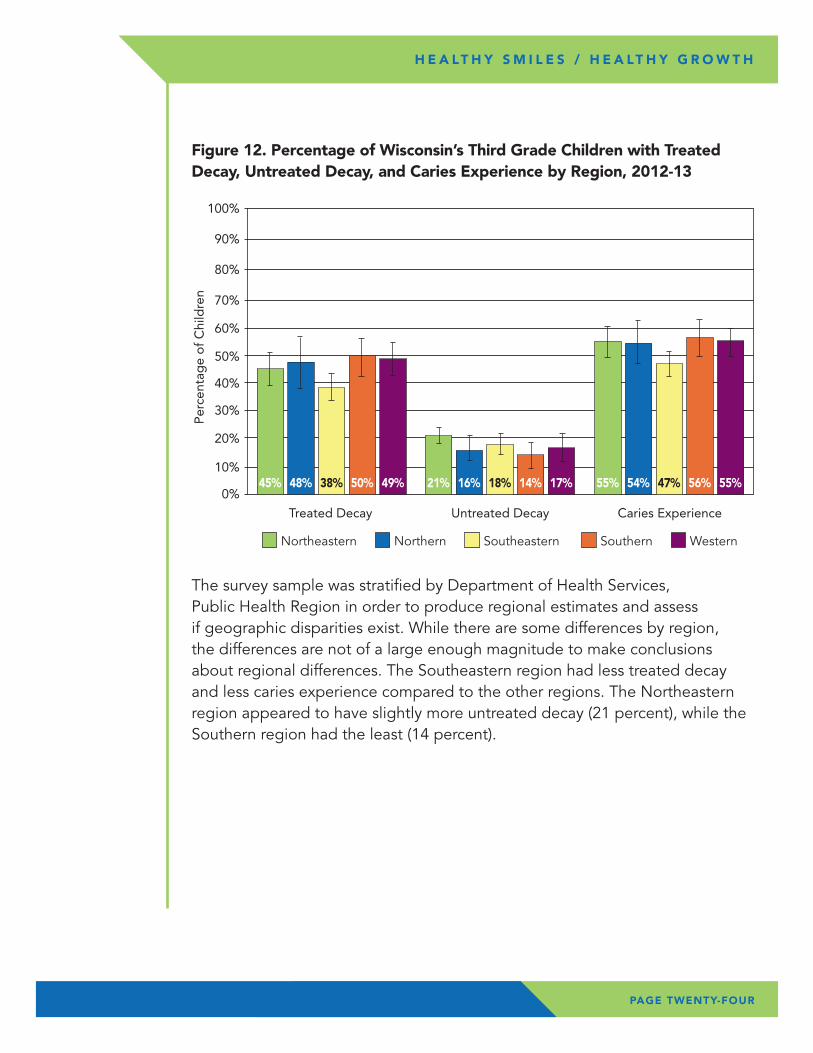
The survey sample was stratified by Department of Health Services, Public Health Region in order to produce regional estimates and assess if geographic disparities exist. While there are some differences by region, the differences are not of a large enough magnitude to make conclusions about regional differences. The Southeastern region had less treated decay and less caries experience compared to the other regions. The Northeastern region appeared to have slightly more untreated decay (21 percent), while the Southern region had the least (14 percent).
Figure 12. Percentage of Wisconsin’s Third Grade Children with Treated Decay, Untreated Decay, and Caries Experience by Region, 2012-13
0%
10%
20%
30%
40%
50%
60%
70%
80%
� Northeastern � Northern � Southeastern � Southern � Western
90%
100%
Treated Decay Untreated Decay Caries Experience
45% 48% 38% 50% 49% 55% 54% 47% 56% 55%21% 16% 18% 14% 17%
Per
cent
age
of
Chi
ldre
n
PAGE TWENTY-FIVE
H E A LT H Y S M I L E S / H E A LT H Y G R O W T H
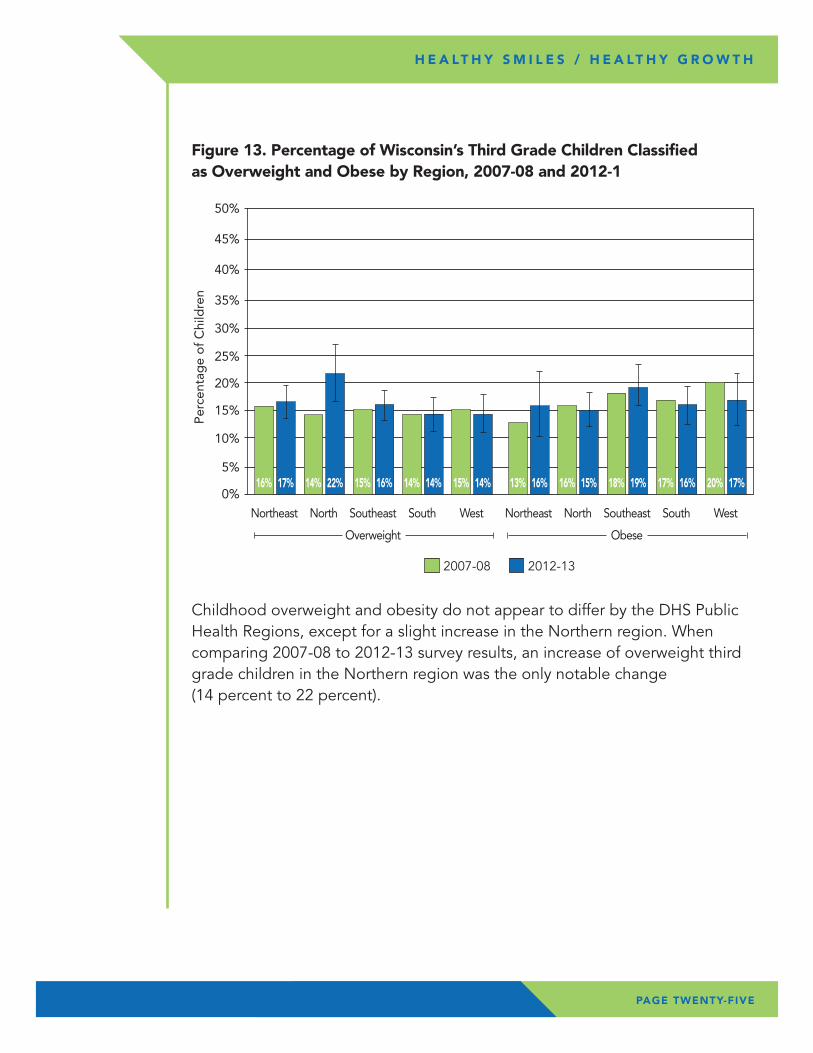
Childhood overweight and obesity do not appear to differ by the DHS Public Health Regions, except for a slight increase in the Northern region. When comparing 2007-08 to 2012-13 survey results, an increase of overweight third grade children in the Northern region was the only notable change (14 percent to 22 percent).
Figure 13. Percentage of Wisconsin’s Third Grade Children Classified as Overweight and Obese by Region, 2007-08 and 2012-1
0%
5%
10%
15%
20%
25%
30%
35%
40%
� 2007-08 � 2012-13
45%
50%
Northeast
16% 17%
North
14% 22%
Southeast
Overweight
15% 16%
South West Northeast North Southeast South West
13% 16% 16% 15%
Obese
18% 19%14% 14% 15% 14% 17% 16% 20% 17%
Per
cent
age
of
Chi
ldre
n
Wisconsin’s Healthy Smiles / Healthy Growth survey of third grade children revealed positive trends. Caries experience has decreased over previous surveys and the prevalence of dental sealants has increased. Though caries experience levels demonstrate that dental decay is still a problem for Wisconsin children, the decrease in caries experience suggests that prevention programs are working. The most visible prevention programs are the school-based dental sealant programs. The finding that 61 percent of third grade children have access to dental sealants is important, but even more important is the finding that children of all socioeconomic classes have nearly equal access to sealants. However, even with equal access to dental sealants, the burden of oral disease is higher among children from minority populations and schools with higher rates of FRMP eligibility.
The dental sealant findings in this report directly support the oral health objectives of Healthiest Wisconsin 2020: Everyone Living Better, Longer (HW 2020).25 HW 2020 is the public health agenda for the State of Wisconsin and includes the following oral health objective. “By 2020, assure access to ongoing oral health education and comprehensive prevention, screening, and early intervention and the treatment of disease in order to promote healthy behaviors and improve and maintain oral health.” One of the indicators for this objective is the percentage of third graders with dental sealants and untreated decay.
CO
NC
LUSI
ON
S
PAGE TWENTY-SIX
H E A LT H Y S M I L E S / H E A LT H Y G R O W T H
Although these survey results show that 17 percent of children are considered obese, there are disparities among children that warrant widespread and sustained action to accelerate progress in obesity prevention efforts. The disparities are seen by race and by income, when using FRMP eligibility rates as a surrogate for income.
HW2020 includes an objective on obesity prevention. “By 2020, Wisconsin will reduce disparities in obesity rates for populations of differing races, ethnicities, sexual identities and orientations, gender identities, and educational or economic status.” Reviewing the survey results in light of this objective, Wisconsin faces challenges to reduce disparities among third grade children. In recent years, Wisconsin public and private partnerships have supported many initiatives that address childhood overweight and obesity. Such initiatives include school and community-based programs to provide at least 60 minutes of physical activity per day; access to healthy and affordable foods and beverages in childcare, schools and communities; standards-based nutrition and physical education; and school health advisory councils and wellness policies. The Wisconsin Nutrition, Physical Activity and Obesity State Plan provides guidance and resources for obesity prevention as it is imperative that all sectors work together for a comprehensive approach to preventing and reducing overweight and obesity.
By recognizing and understanding the health needs of Wisconsin’s children, key stakeholders can work to develop environments, systems and policies that will ensure all children receive the preventive services and treatment they need for optimal oral health and growth. This survey demonstrates that there continue to be barriers to improving the health of Wisconsin’s children; especially low-income and minority children. In order to reverse these trends, preventive services, through both public and private health care providers, must be emphasized.
The results will help guide the next steps to strengthen prevention efforts and implement strategies that lead to increased treatment access for underserved populations. It is important to work with key partners and stakeholders to increase the utilization of dental sealants in the public and private dental sector. Opportunities to expand school-based dental sealant programs should be identified in order to provide comprehensive dental treatment in areas where access continues to be an issue.
Future analysis of this data may be conducted to explore possible connections between oral health and growth status.
H E A LT H Y S M I L E S / H E A LT H Y G R O W T H
PAGE TWENTY-SEVEN
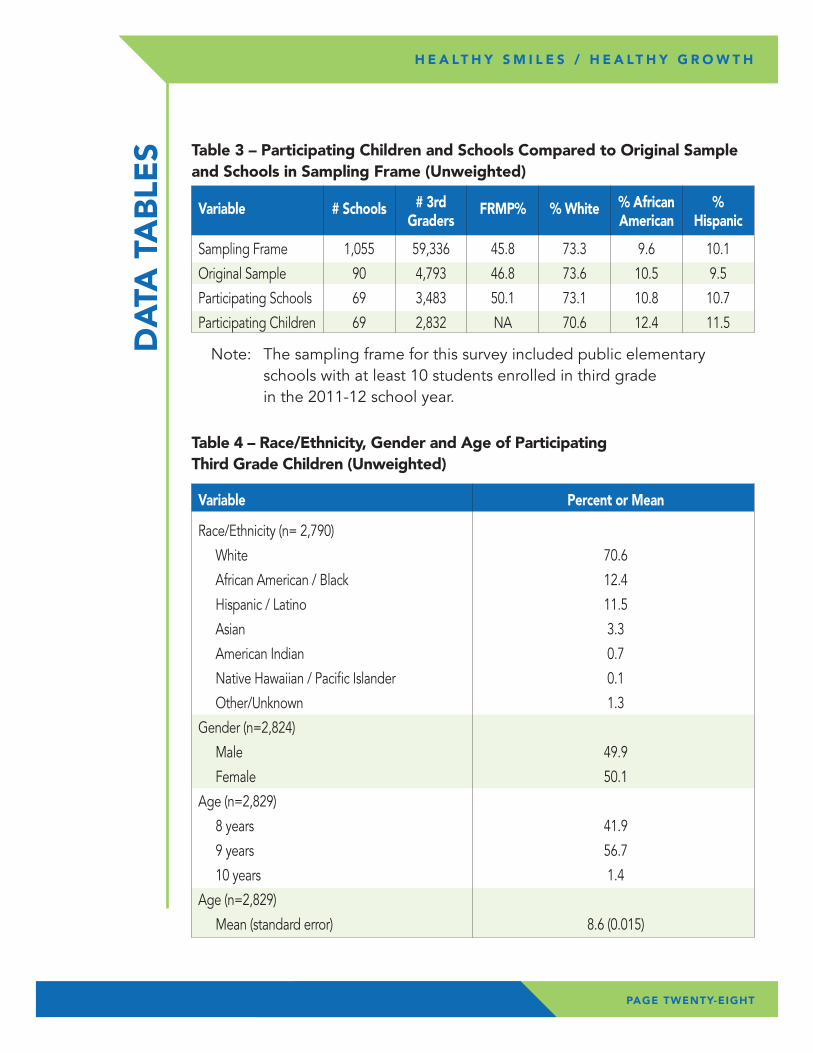
Note: The sampling frame for this survey included public elementary schools with at least 10 students enrolled in third grade in the 2011-12 school year.
Table 3 – Participating Children and Schools Compared to Original Sample and Schools in Sampling Frame (Unweighted)
Table 4 – Race/Ethnicity, Gender and Age of Participating Third Grade Children (Unweighted)
Variable # Schools # 3rd FRMP% % White % African % Graders American Hispanic
Sampling Frame 1,055 59,336 45.8 73.3 9.6 10.1
Original Sample 90 4,793 46.8 73.6 10.5 9.5
Participating Schools 69 3,483 50.1 73.1 10.8 10.7
Participating Children 69 2,832 NA 70.6 12.4 11.5
DA
TA T
AB
LES
Variable Percent or Mean
Race/Ethnicity (n= 2,790)
White 70.6
African American / Black 12.4
Hispanic / Latino 11.5
Asian 3.3
American Indian 0.7
Native Hawaiian / Pacific Islander 0.1
Other/Unknown 1.3
Gender (n=2,824)
Male 49.9
Female 50.1
Age (n=2,829)
8 years 41.9
9 years 56.7
10 years 1.4
Age (n=2,829)
Mean (standard error) 8.6 (0.015)
H E A LT H Y S M I L E S / H E A LT H Y G R O W T H
PAGE TWENTY-EIGHT
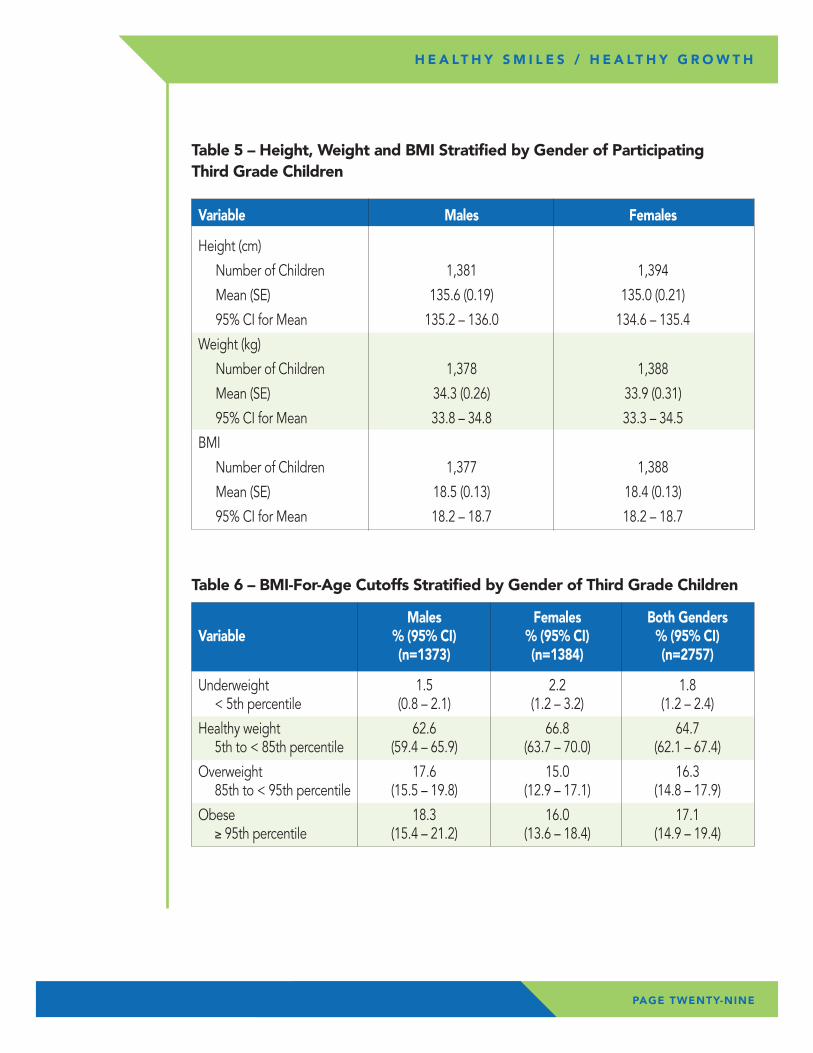
Table 5 – Height, Weight and BMI Stratified by Gender of Participating Third Grade Children
Table 6 – BMI-For-Age Cutoffs Stratified by Gender of Third Grade Children
Variable Males Females
Height (cm)
Number of Children 1,381 1,394
Mean (SE) 135.6 (0.19) 135.0 (0.21)
95% CI for Mean 135.2 – 136.0 134.6 – 135.4
Weight (kg)
Number of Children 1,378 1,388
Mean (SE) 34.3 (0.26) 33.9 (0.31)
95% CI for Mean 33.8 – 34.8 33.3 – 34.5
BMI
Number of Children 1,377 1,388
Mean (SE) 18.5 (0.13) 18.4 (0.13)
95% CI for Mean 18.2 – 18.7 18.2 – 18.7
H E A LT H Y S M I L E S / H E A LT H Y G R O W T H
Males Females Both Genders Variable % (95% CI) % (95% CI) % (95% CI) (n=1373) (n=1384) (n=2757)
Underweight 1.5 2.2 1.8 < 5th percentile (0.8 – 2.1) (1.2 – 3.2) (1.2 – 2.4)
Healthy weight 62.6 66.8 64.7 5th to < 85th percentile (59.4 – 65.9) (63.7 – 70.0) (62.1 – 67.4)
Overweight 17.6 15.0 16.3 85th to < 95th percentile (15.5 – 19.8) (12.9 – 17.1) (14.8 – 17.9)
Obese 18.3 16.0 17.1 ≥ 95th percentile (15.4 – 21.2) (13.6 – 18.4) (14.9 – 19.4)
PAGE TWENTY-NINE
H E A LT H Y S M I L E S / H E A LT H Y G R O W T H
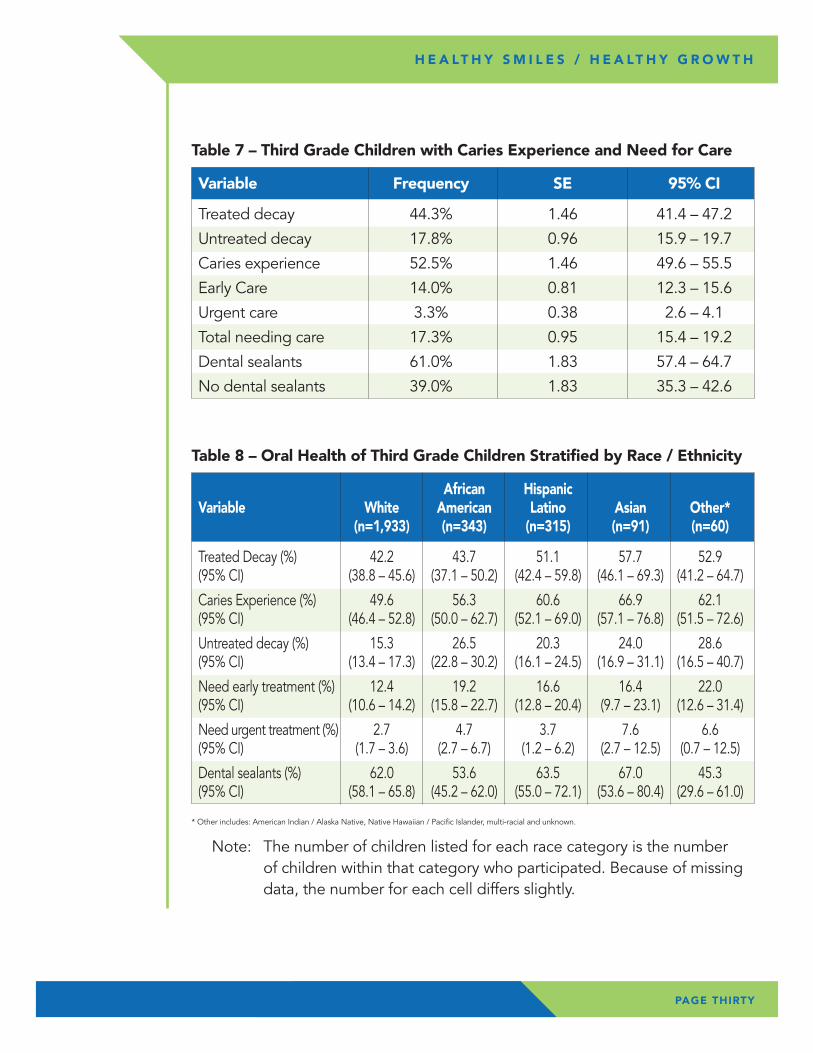
Table 7 – Third Grade Children with Caries Experience and Need for Care
Variable Frequency SE 95% CI
Treated decay 44.3% 1.46 41.4 – 47.2
Untreated decay 17.8% 0.96 15.9 – 19.7
Caries experience 52.5% 1.46 49.6 – 55.5
Early Care 14.0% 0.81 12.3 – 15.6
Urgent care 3.3% 0.38 2.6 – 4.1
Total needing care 17.3% 0.95 15.4 – 19.2
Dental sealants 61.0% 1.83 57.4 – 64.7
No dental sealants 39.0% 1.83 35.3 – 42.6
Table 8 – Oral Health of Third Grade Children Stratified by Race / Ethnicity
African Hispanic Variable White American Latino Asian Other* (n=1,933) (n=343) (n=315) (n=91) (n=60)
Treated Decay (%) 42.2 43.7 51.1 57.7 52.9 (95% CI) (38.8 – 45.6) (37.1 – 50.2) (42.4 – 59.8) (46.1 – 69.3) (41.2 – 64.7)
Caries Experience (%) 49.6 56.3 60.6 66.9 62.1 (95% CI) (46.4 – 52.8) (50.0 – 62.7) (52.1 – 69.0) (57.1 – 76.8) (51.5 – 72.6)
Untreated decay (%) 15.3 26.5 20.3 24.0 28.6 (95% CI) (13.4 – 17.3) (22.8 – 30.2) (16.1 – 24.5) (16.9 – 31.1) (16.5 – 40.7)
Need early treatment (%) 12.4 19.2 16.6 16.4 22.0 (95% CI) (10.6 – 14.2) (15.8 – 22.7) (12.8 – 20.4) (9.7 – 23.1) (12.6 – 31.4)
Need urgent treatment (%) 2.7 4.7 3.7 7.6 6.6 (95% CI) (1.7 – 3.6) (2.7 – 6.7) (1.2 – 6.2) (2.7 – 12.5) (0.7 – 12.5)
Dental sealants (%) 62.0 53.6 63.5 67.0 45.3 (95% CI) (58.1 – 65.8) (45.2 – 62.0) (55.0 – 72.1) (53.6 – 80.4) (29.6 – 61.0)
* Other includes: American Indian / Alaska Native, Native Hawaiian / Pacific Islander, multi-racial and unknown.
Note: The number of children listed for each race category is the number of children within that category who participated. Because of missing data, the number for each cell differs slightly.
PAGE THIRTY
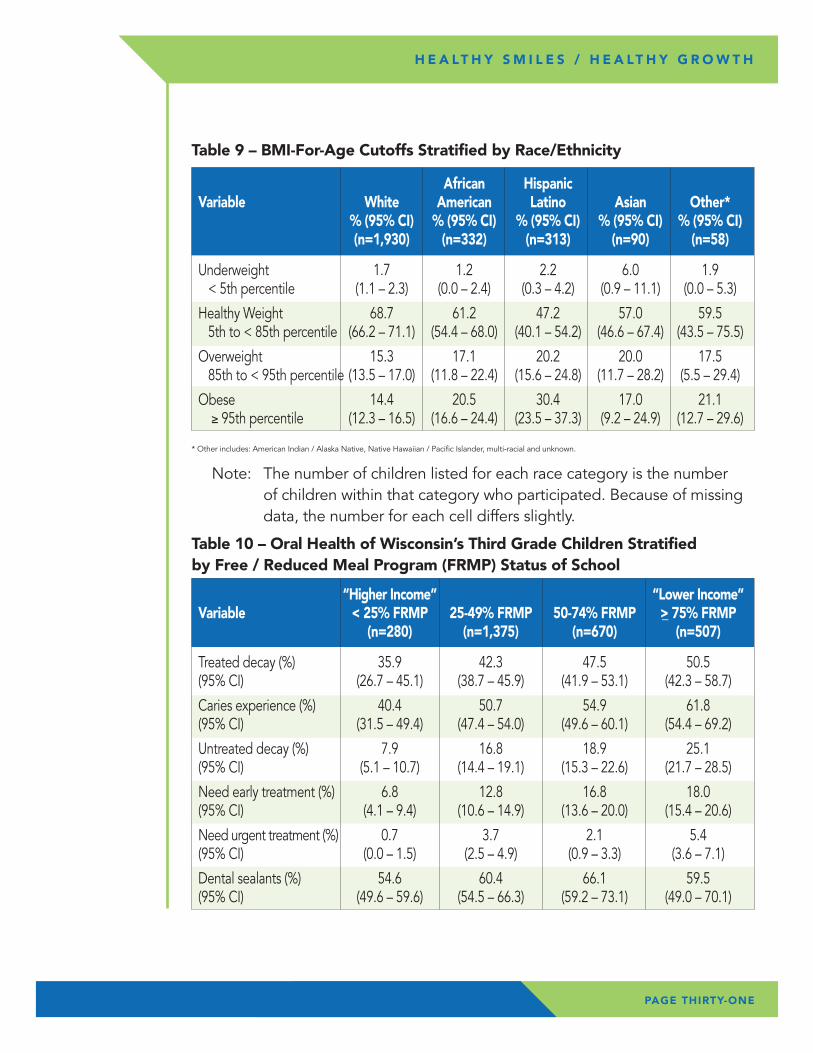
Table 9 – BMI-For-Age Cutoffs Stratified by Race/Ethnicity
African Hispanic Variable White American Latino Asian Other* % (95% CI) % (95% CI) % (95% CI) % (95% CI) % (95% CI) (n=1,930) (n=332) (n=313) (n=90) (n=58)
Underweight 1.7 1.2 2.2 6.0 1.9 < 5th percentile (1.1 – 2.3) (0.0 – 2.4) (0.3 – 4.2) (0.9 – 11.1) (0.0 – 5.3)
Healthy Weight 68.7 61.2 47.2 57.0 59.5 5th to < 85th percentile (66.2 – 71.1) (54.4 – 68.0) (40.1 – 54.2) (46.6 – 67.4) (43.5 – 75.5)
Overweight 15.3 17.1 20.2 20.0 17.5 85th to < 95th percentile (13.5 – 17.0) (11.8 – 22.4) (15.6 – 24.8) (11.7 – 28.2) (5.5 – 29.4)
Obese 14.4 20.5 30.4 17.0 21.1 ≥ 95th percentile (12.3 – 16.5) (16.6 – 24.4) (23.5 – 37.3) (9.2 – 24.9) (12.7 – 29.6)
H E A LT H Y S M I L E S / H E A LT H Y G R O W T H
Table 10 – Oral Health of Wisconsin’s Third Grade Children Stratified by Free / Reduced Meal Program (FRMP) Status of School
“Higher Income” “Lower Income” Variable < 25% FRMP 25-49% FRMP 50-74% FRMP >_ 75% FRMP (n=280) (n=1,375) (n=670) (n=507)
Treated decay (%) 35.9 42.3 47.5 50.5 (95% CI) (26.7 – 45.1) (38.7 – 45.9) (41.9 – 53.1) (42.3 – 58.7)
Caries experience (%) 40.4 50.7 54.9 61.8 (95% CI) (31.5 – 49.4) (47.4 – 54.0) (49.6 – 60.1) (54.4 – 69.2)
Untreated decay (%) 7.9 16.8 18.9 25.1 (95% CI) (5.1 – 10.7) (14.4 – 19.1) (15.3 – 22.6) (21.7 – 28.5)
Need early treatment (%) 6.8 12.8 16.8 18.0 (95% CI) (4.1 – 9.4) (10.6 – 14.9) (13.6 – 20.0) (15.4 – 20.6)
Need urgent treatment (%) 0.7 3.7 2.1 5.4 (95% CI) (0.0 – 1.5) (2.5 – 4.9) (0.9 – 3.3) (3.6 – 7.1)
Dental sealants (%) 54.6 60.4 66.1 59.5 (95% CI) (49.6 – 59.6) (54.5 – 66.3) (59.2 – 73.1) (49.0 – 70.1)
PAGE THIRTY-ONE
* Other includes: American Indian / Alaska Native, Native Hawaiian / Pacific Islander, multi-racial and unknown.
Note: The number of children listed for each race category is the number of children within that category who participated. Because of missing data, the number for each cell differs slightly.
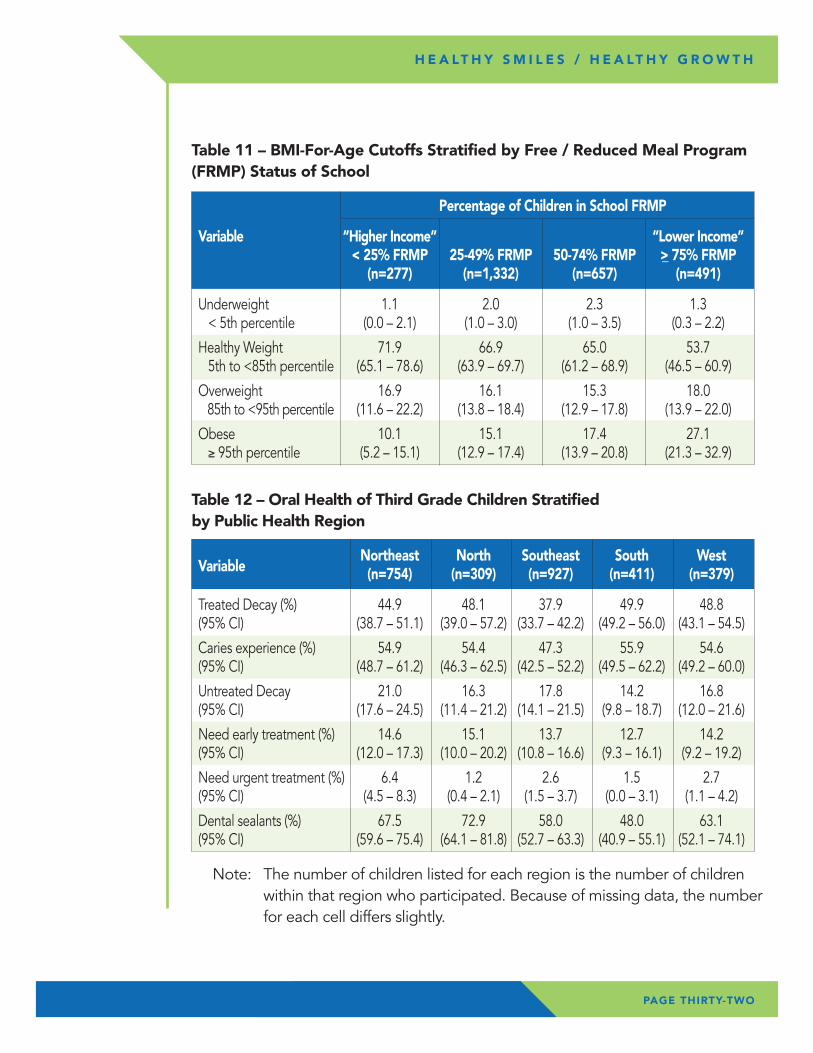
Variable
Northeast North Southeast South West (n=754) (n=309) (n=927) (n=411) (n=379)
Treated Decay (%) 44.9 48.1 37.9 49.9 48.8 (95% CI) (38.7 – 51.1) (39.0 – 57.2) (33.7 – 42.2) (49.2 – 56.0) (43.1 – 54.5)
Caries experience (%) 54.9 54.4 47.3 55.9 54.6 (95% CI) (48.7 – 61.2) (46.3 – 62.5) (42.5 – 52.2) (49.5 – 62.2) (49.2 – 60.0)
Untreated Decay 21.0 16.3 17.8 14.2 16.8 (95% CI) (17.6 – 24.5) (11.4 – 21.2) (14.1 – 21.5) (9.8 – 18.7) (12.0 – 21.6)
Need early treatment (%) 14.6 15.1 13.7 12.7 14.2 (95% CI) (12.0 – 17.3) (10.0 – 20.2) (10.8 – 16.6) (9.3 – 16.1) (9.2 – 19.2)
Need urgent treatment (%) 6.4 1.2 2.6 1.5 2.7 (95% CI) (4.5 – 8.3) (0.4 – 2.1) (1.5 – 3.7) (0.0 – 3.1) (1.1 – 4.2)
Dental sealants (%) 67.5 72.9 58.0 48.0 63.1 (95% CI) (59.6 – 75.4) (64.1 – 81.8) (52.7 – 63.3) (40.9 – 55.1) (52.1 – 74.1)
H E A LT H Y S M I L E S / H E A LT H Y G R O W T H
Table 12 – Oral Health of Third Grade Children Stratified by Public Health Region
Note: The number of children listed for each region is the number of children within that region who participated. Because of missing data, the number for each cell differs slightly.
PAGE THIRTY-TWO
Table 11 – BMI-For-Age Cutoffs Stratified by Free / Reduced Meal Program (FRMP) Status of School
Percentage of Children in School FRMP
Variable “Higher Income” “Lower Income” < 25% FRMP 25-49% FRMP 50-74% FRMP >_ 75% FRMP (n=277) (n=1,332) (n=657) (n=491)
Underweight 1.1 2.0 2.3 1.3 < 5th percentile (0.0 – 2.1) (1.0 – 3.0) (1.0 – 3.5) (0.3 – 2.2)
Healthy Weight 71.9 66.9 65.0 53.7 5th to <85th percentile (65.1 – 78.6) (63.9 – 69.7) (61.2 – 68.9) (46.5 – 60.9)
Overweight 16.9 16.1 15.3 18.0 85th to <95th percentile (11.6 – 22.2) (13.8 – 18.4) (12.9 – 17.8) (13.9 – 22.0)
Obese 10.1 15.1 17.4 27.1 ≥ 95th percentile (5.2 – 15.1) (12.9 – 17.4) (13.9 – 20.8) (21.3 – 32.9)
PAGE THIRTY-THREE
H E A LT H Y S M I L E S / H E A LT H Y G R O W T H
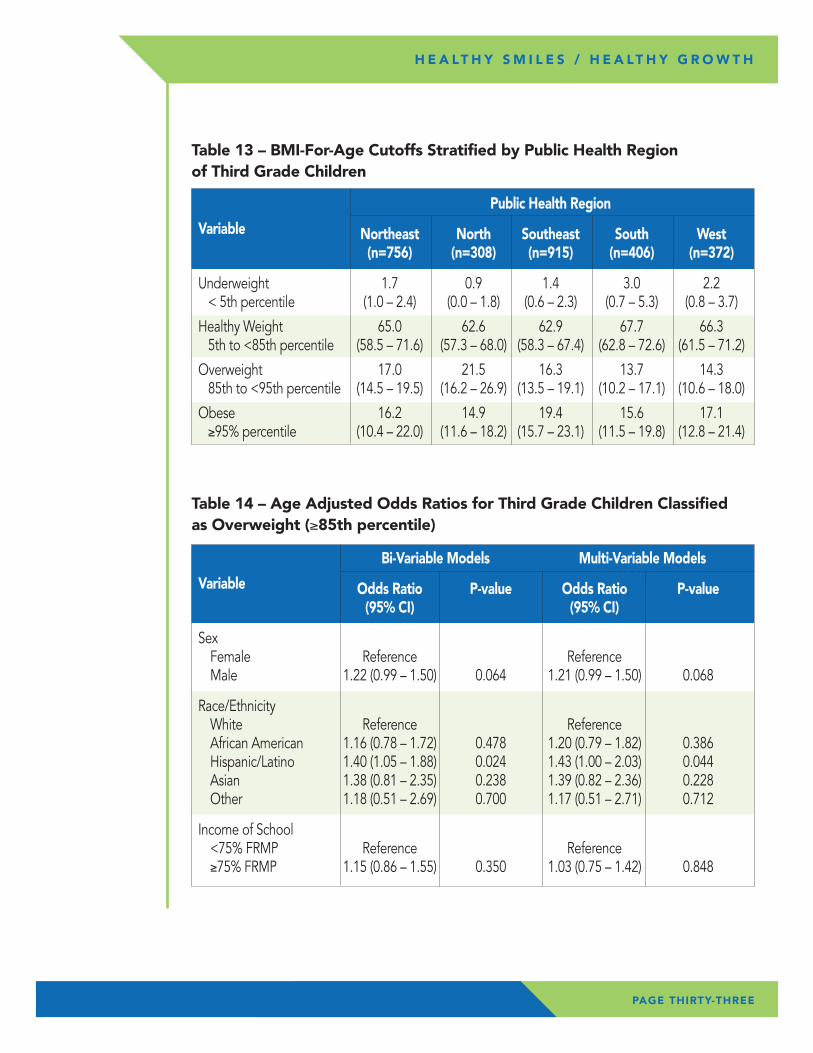
Table 14 – Age Adjusted Odds Ratios for Third Grade Children Classified as Overweight (≥85th percentile)
Bi-Variable Models Multi-Variable Models
Variable Odds Ratio P-value Odds Ratio P-value (95% CI) (95% CI)
Sex Female Reference Reference Male 1.22 (0.99 – 1.50) 0.064 1.21 (0.99 – 1.50) 0.068
Race/Ethnicity White Reference Reference African American 1.16 (0.78 – 1.72) 0.478 1.20 (0.79 – 1.82) 0.386 Hispanic/Latino 1.40 (1.05 – 1.88) 0.024 1.43 (1.00 – 2.03) 0.044 Asian 1.38 (0.81 – 2.35) 0.238 1.39 (0.82 – 2.36) 0.228 Other 1.18 (0.51 – 2.69) 0.700 1.17 (0.51 – 2.71) 0.712
Income of School <75% FRMP Reference Reference ≥75% FRMP 1.15 (0.86 – 1.55) 0.350 1.03 (0.75 – 1.42) 0.848
Public Health Region
Variable Northeast North Southeast South West (n=756) (n=308) (n=915) (n=406) (n=372)
Underweight 1.7 0.9 1.4 3.0 2.2 < 5th percentile (1.0 – 2.4) (0.0 – 1.8) (0.6 – 2.3) (0.7 – 5.3) (0.8 – 3.7)
Healthy Weight 65.0 62.6 62.9 67.7 66.3 5th to <85th percentile (58.5 – 71.6) (57.3 – 68.0) (58.3 – 67.4) (62.8 – 72.6) (61.5 – 71.2)
Overweight 17.0 21.5 16.3 13.7 14.3 85th to <95th percentile (14.5 – 19.5) (16.2 – 26.9) (13.5 – 19.1) (10.2 – 17.1) (10.6 – 18.0)
Obese 16.2 14.9 19.4 15.6 17.1 ≥95% percentile (10.4 – 22.0) (11.6 – 18.2) (15.7 – 23.1) (11.5 – 19.8) (12.8 – 21.4)
Table 13 – BMI-For-Age Cutoffs Stratified by Public Health Region of Third Grade Children
PAGE THIRTY-FOUR
H E A LT H Y S M I L E S / H E A LT H Y G R O W T H
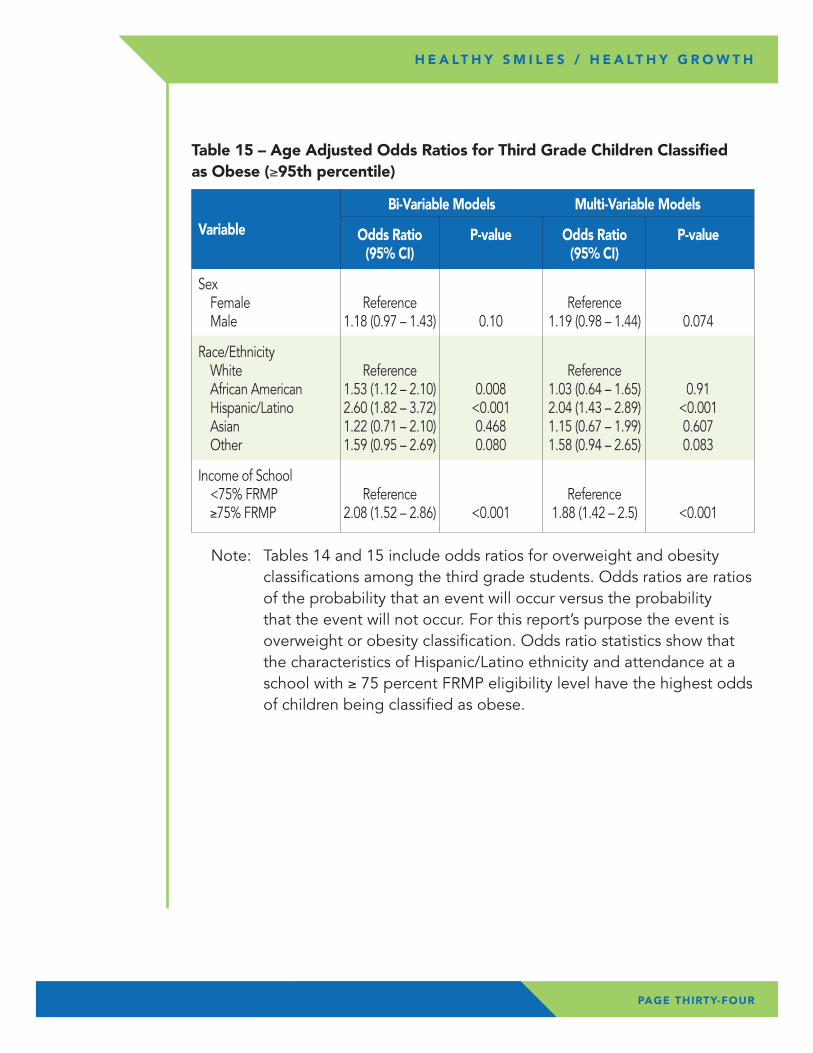
Table 15 – Age Adjusted Odds Ratios for Third Grade Children Classified as Obese (≥95th percentile)
Bi-Variable Models Multi-Variable Models
Variable Odds Ratio P-value Odds Ratio P-value (95% CI) (95% CI)
Sex Female Reference Reference Male 1.18 (0.97 – 1.43) 0.10 1.19 (0.98 – 1.44) 0.074
Race/Ethnicity White Reference Reference African American 1.53 (1.12 – 2.10) 0.008 1.03 (0.64 – 1.65) 0.91 Hispanic/Latino 2.60 (1.82 – 3.72) <0.001 2.04 (1.43 – 2.89) <0.001 Asian 1.22 (0.71 – 2.10) 0.468 1.15 (0.67 – 1.99) 0.607 Other 1.59 (0.95 – 2.69) 0.080 1.58 (0.94 – 2.65) 0.083
Income of School <75% FRMP Reference Reference ≥75% FRMP 2.08 (1.52 – 2.86) <0.001 1.88 (1.42 – 2.5) <0.001
Note: Tables 14 and 15 include odds ratios for overweight and obesity classifications among the third grade students. Odds ratios are ratios of the probability that an event will occur versus the probability that the event will not occur. For this report’s purpose the event is overweight or obesity classification. Odds ratio statistics show that the characteristics of Hispanic/Latino ethnicity and attendance at a school with ≥ 75 percent FRMP eligibility level have the highest odds of children being classified as obese.
1 Benjamin, RM. Surgeon General’s Perspectives. Oral Health: The silent epidemic. Public Health Reports 2010, 125:158-159.
2 National Center for Health Statistics. Healthy People 2010 Final Review. Hyattsville, MD: National Center for Health Statistics; 2012. Accessed at http://www.cdc.gov/nchs/healthy_people/hp2010/hp2010_final_review.htm on 12 September 2013.
3 Dye BA, Tan S, Smith V, Lewis BG, Barker LK, Thornton-Evans G, et al. Trends in oral health status: United States, 1988–1994 and 1999–2004. Vital Health Stat 11. 2007;(248):1-92.
4 U.S. Department of Health and Human Services. Oral Health in America: A Report of the Surgeon General. Rockville, MD: U.S. Department of Health and Human Services, National Institute of Dental and Craniofacial Research, National Institutes of Health; 2000. Accessed at http://www2.nidcr.nih.gov/sgr/sgrohweb/home.htm on 3 May 2013.
5 Jackson SL, Vann WF, Kotch JB, Pahel BT, Lee JY. Impact of poor oral health on children’s school attendance and performance. Am J Public Health 2011, 101(10) 1900-6.
6 Seirawan H, Faust S, Mulligan. The impact of oral health on the academic performance of disadvantaged children. Am J Public Health 2012, 102(9): 1729-34.
7 Guarnizo-Herreno CC, Wehby Gl. Children’s dental health, school performance, and psychosocial well-being. J of Pediatrics 2012, 161(6): 1153-59.
8 Ramage S. The impact of dental disease on school performance. The view of the school nurse. J of the Southeastern Society of Pediatric Dentistry. 2000, 6(2): 26.
9 National Center for Health Statistics. Health, United States, 2012, Hyattsville, MD 2013.
10 Griffin SO, Oong E, et al. The effectiveness of sealants in managing caries lesions. J Dent Res 2008, 87(2): 169-74.
11 Ahovuo-Saloranta A, Forss H, Walsh T, Hiiri A, Nordblad A, Mäkelä M, Worthington HV. (2013) Sealants for preventing dental decay in the permanent teeth. ‘Cochrane Database of Systematic Reviews 2013’, Issue 3. Art. No.: CD001830. DOI: 10.1002/14651858.CD001830.pub4.
12 Frieden, T. Winnable Battles 101 Nutrition, Physical Activity and Obesity Video. Centers for Disease Control and Prevention. http://www.cdc.gov/winnablebattles/101/Nutrition/index.html. (Accessed 11/26/2013).
13 Ogden CL, Carroll MD, Kit BK, Flegal KM. Prevalence of obesity and trends in body mass index among US children and adolescents, 1999-2010. Journal of the American Medical Association 2012;307(5):483-490.
RE
FER
EN
CE
S
PAGE THIRTY-FIVE
H E A LT H Y S M I L E S / H E A LT H Y G R O W T H
14 National Center for Health Statistics. Health, United States, 2011: With Special Features on Socioeconomic Status and Health. Hyattsville, MD; U.S. Department of Health and Human Services; 2012.
15 Whitlock EP, Williams SB, Gold R, Smith PR, Shipman SA. Screening and interventions for childhood overweight: a summary of evidence for the US Preventive Services Task Force. Pediatrics. 2005;116(1):e125—144.
16 Freedman DS, Mei Z, Srinivasan SR, Berenson GS, Dietz WH. Cardiovascular risk factors and excess adiposity among overweight children and adolescents: the Bogalusa Heart Study. J Pediatr. 2007;150(1):12-17.e2.
17 Dietz W. Health consequences of obesity in youth: Childhood predictors of adult disease. Pediatrics 1998;101:518-525.
18 Swartz MB and Puhl R. Childhood obesity: a societal problem to solve. Obesity Reviews 2003; 4(1):57-71.
19 Whitaker RC, Wright JA, Pepe MS, Seidel KD, Dietz WH. Predicting obesity in young adulthood from childhood and parental obesity. N Engl J Med 1997;37(13):869-873.
20 Serdula MK, Ivery D, Coates RJ, Freedman DS, Williamson DF, Byers T. Do obese children become obese adults? A review of the literature. Prev Med 1993;22:167-177.
21 WIC http://www.dhs.wisconsin.gov/wic/WICPRO/data/PedNSS/11state.pdf (Accessed 10/28/2013)
22 YRBS http://sspw.dpi.wi.gov/files/sspw/pdf/yrbs11execsumm.pdf (Accessed 10/25/2013)
23 CDC sex-specific BMI-for-age growth charts (http://www.cdc.gov/healthyweight/assessing/bmi/) (Accessed 10/25/2013)
24 NHANES http://www.cdc.gov/nchs/data/hestat/obesity_child_07_08/obesity_child_07_08.htm (Accessed 10/25/2013)
25 Wisconsin Department of Health Services, Division of Public Health, Office of Policy and Practice Alignment, Healthiest Wisconsin 2020: Everyone Living Better, Longer. A State Health Plan to Improve Health Across the Life Span, and Eliminate Health Disparities and Achieve Health Equity. P-00187. July 2010
PAGE THIRTY-SIX
H E A LT H Y S M I L E S / H E A LT H Y G R O W T H
AP
PE
ND
IX A
PAGE THIRTY-SEVEN
H E A LT H Y S M I L E S / H E A LT H Y G R O W T H
Wisconsin Department of Health ServicesRegions by County
� Northeastern � Northern � Southeastern � Southern � Western
AP
PE
ND
IX B
PAGE THIRTY-EIGHT
H E A LT H Y S M I L E S / H E A LT H Y G R O W T H
PAGE THIRTY-NINE
H E A LT H Y S M I L E S / H E A LT H Y G R O W T H
AP
PE
ND
IX C
PAGE FORTY
H E A LT H Y S M I L E S / H E A LT H Y G R O W T H
Number of Outlier Values (based on WHO fixed exclusion ranges) Among Participating Third Grade Children
Variable Too Low Too High
Height-for-age 1 14
Weight-for-age 0 14
Weight-for-height 0 1
BMI-for-age 4 9
Wisconsin Division of Public Health
1 West Wilson Street • Madison, WI 53701
P-00589 (01/2014)