2013 Financial Review
39
www.eia.gov U.S. Energy Information Administration Independent Statistics & Analysis Markets and Financial Analysis Team May, 2015 Financial Review of the Global Oil and Natural Gas Industry 2014
-
Upload
nguyendang -
Category
Documents
-
view
217 -
download
0
Transcript of 2013 Financial Review
www.eia.gov U.S. Energy Information Administration Independent Statistics & Analysis
Markets and Financial Analysis Team
May, 2015
Financial Review of the Global Oil and
Natural Gas Industry 2014
Overview
2
• This analysis focuses on the financial and operating trends of 75 oil and natural gas
companies (“energy companies”).
• The data come from public financial statements each company submits to the U.S.
Securities and Exchange Commission, which Evaluate Energy (a data service)
aggregates for ease of data analysis.
• For consistency, companies that were later acquired by another company in the
group were kept in the prior year data. For example, ExxonMobil and XTO’s
individual numbers were kept through 2009.
• Cash flow statements list various sources and uses of cash; this analysis focuses
on three main sources (operations, net debt, and net sales of assets) and three
main uses (capital expenditure, dividends to shareholders, and net share issuance).
• Several charts show comparisons between these upstream companies and the U.S.
manufacturing industry, collected from U.S. Census Bureau’s Quarterly Financial
Report.
Brief description of terms
3
• Cash from operations is a measure of income.
• Capital expenditures represent cash used for property, plant, and equipment
(investing activities).
• Financing activities measure inflows/outflows in debt or equity markets including
dividends, share issuance or repurchases, and debt issuance or repayments.
• Return on equity is a measure of the profit a company earns on money shareholders
have invested.
• Market capitalization is the total value of all of a company’s publicly traded shares
outstanding.
• Net income or earnings represent profit after taxes and depreciation.
• Asset impairments are when a company writes down the value of a property to
reflect current market value, which may decline from loss of production potential or
price declines.
• “Upstream” refers to crude oil exploration, production, and other operations prior to
refining.
Key takeaways
4
• Price declines in the second half of 2014 contributed to reduced profitability for these
companies compared to previous years.
• Free cash flow remained low compared to previous years. Share repurchases and
dividends were met by increasing debt and sales of assets.
• Lower prices contributed to lower proved reserve additions compared to previous
years.
• Some companies increased cash balances given the volatile price environment.
• First-quarter 2015 results could show significant reductions in profits, cash flow, and
capital expenditure because of low oil prices.
• In refining, geographic differences in refining margins continued in 2014.
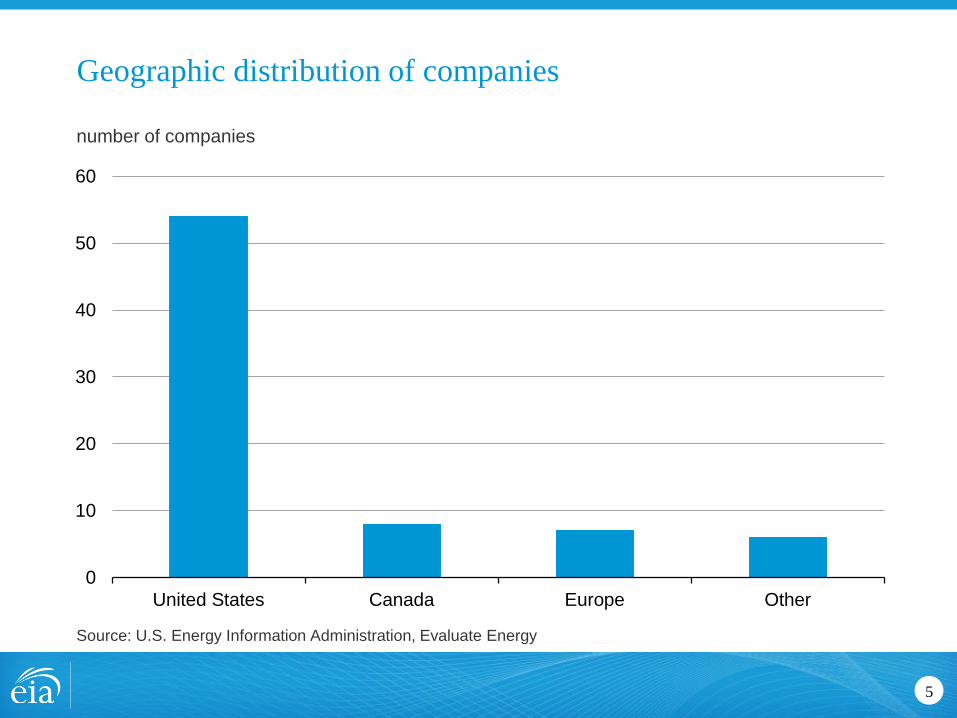
Geographic distribution of companies
5
number of companies
Source: U.S. Energy Information Administration, Evaluate Energy
0
10
20
30
40
50
60
United States Canada Europe Other
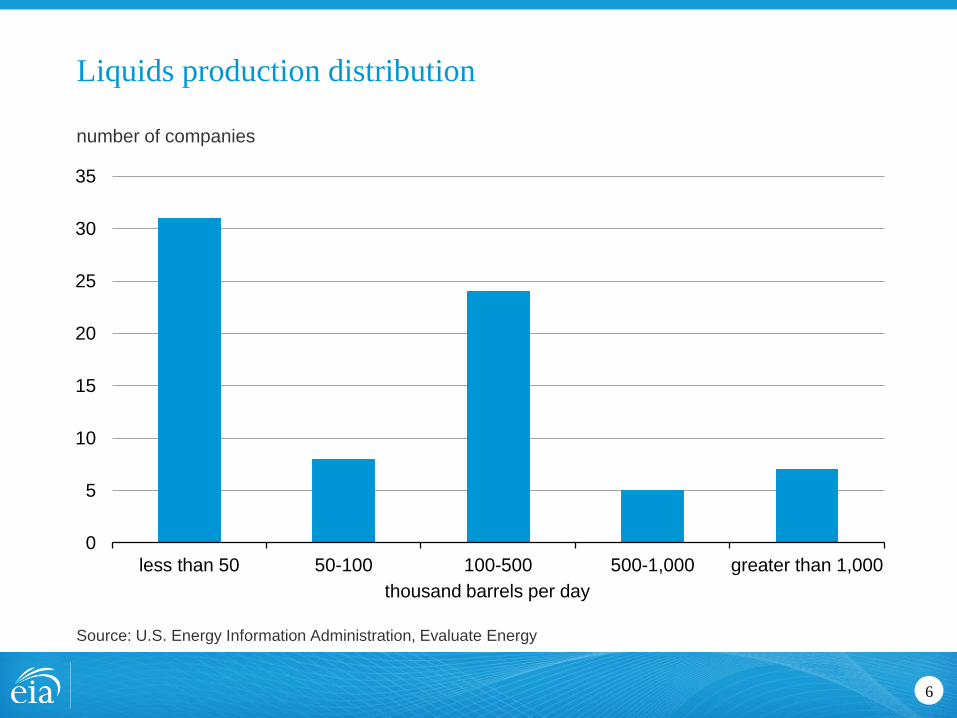
Liquids production distribution
6
number of companies
Source: U.S. Energy Information Administration, Evaluate Energy
0
5
10
15
20
25
30
35
less than 50 50-100 100-500 500-1,000 greater than 1,000
thousand barrels per day
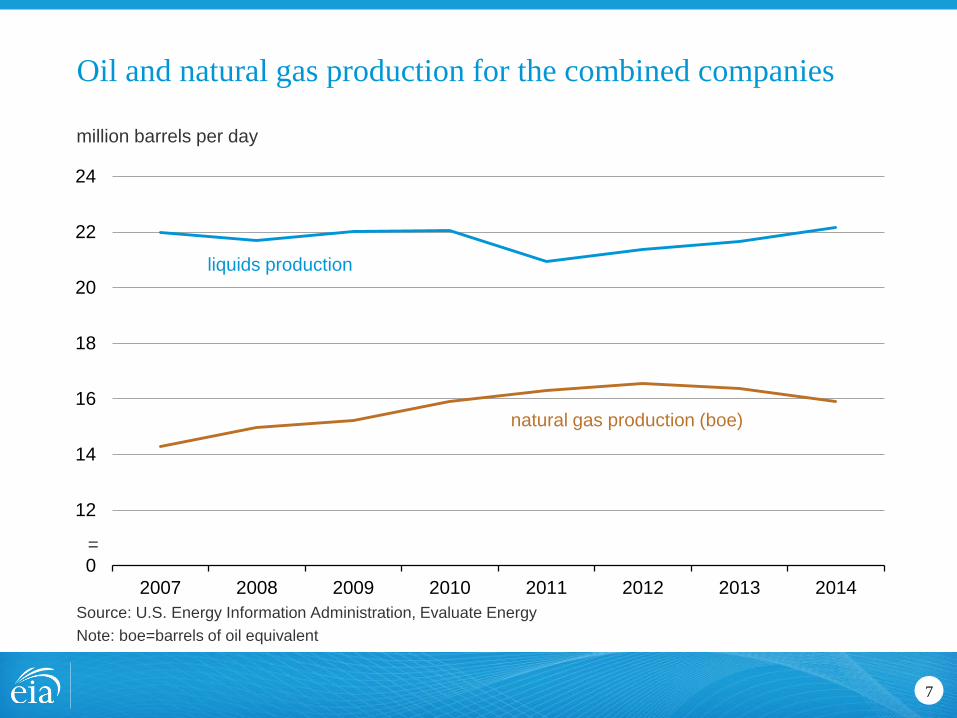
Oil and natural gas production for the combined companies
7
million barrels per day
Source: U.S. Energy Information Administration, Evaluate Energy
Note: boe=barrels of oil equivalent
10
12
14
16
18
20
22
24
2007 2008 2009 2010 2011 2012 2013 2014
liquids production
natural gas production (boe)
=
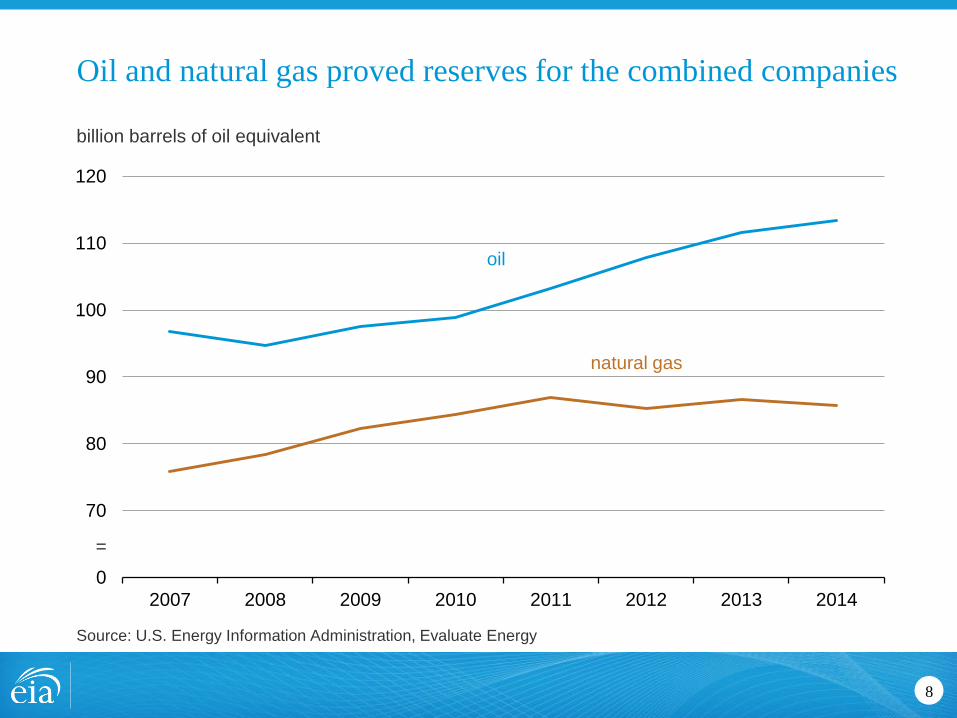
Oil and natural gas proved reserves for the combined companies
8
billion barrels of oil equivalent
Source: U.S. Energy Information Administration, Evaluate Energy
60
70
80
90
100
110
120
2007 2008 2009 2010 2011 2012 2013 2014
oil
natural gas
=
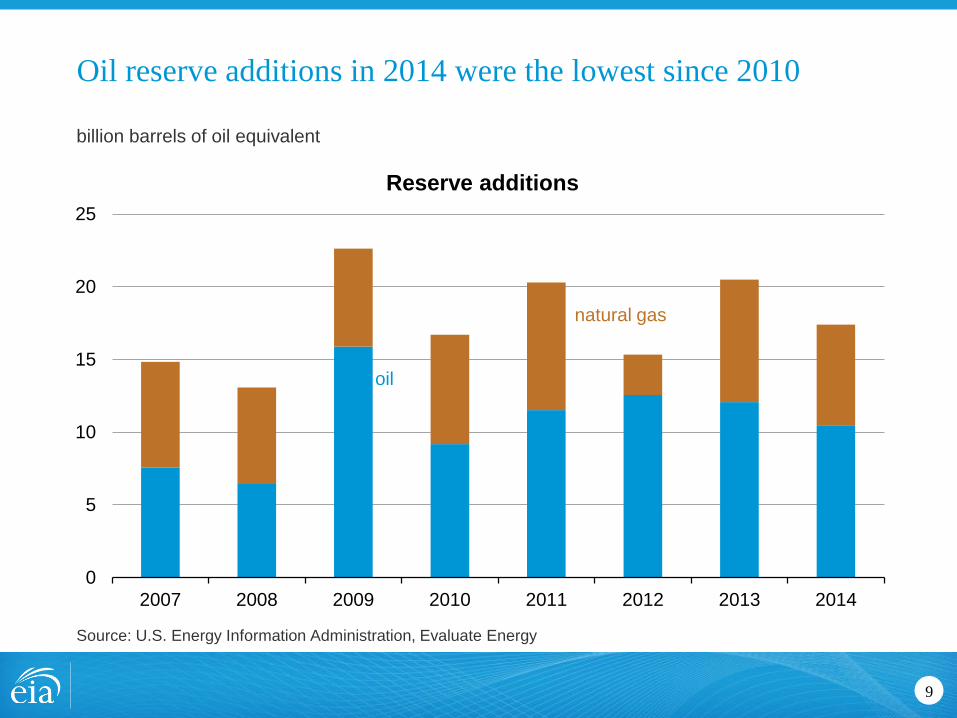
Oil reserve additions in 2014 were the lowest since 2010
9
billion barrels of oil equivalent
Source: U.S. Energy Information Administration, Evaluate Energy
0
5
10
15
20
25
2007 2008 2009 2010 2011 2012 2013 2014
Reserve additions
oil
natural gas
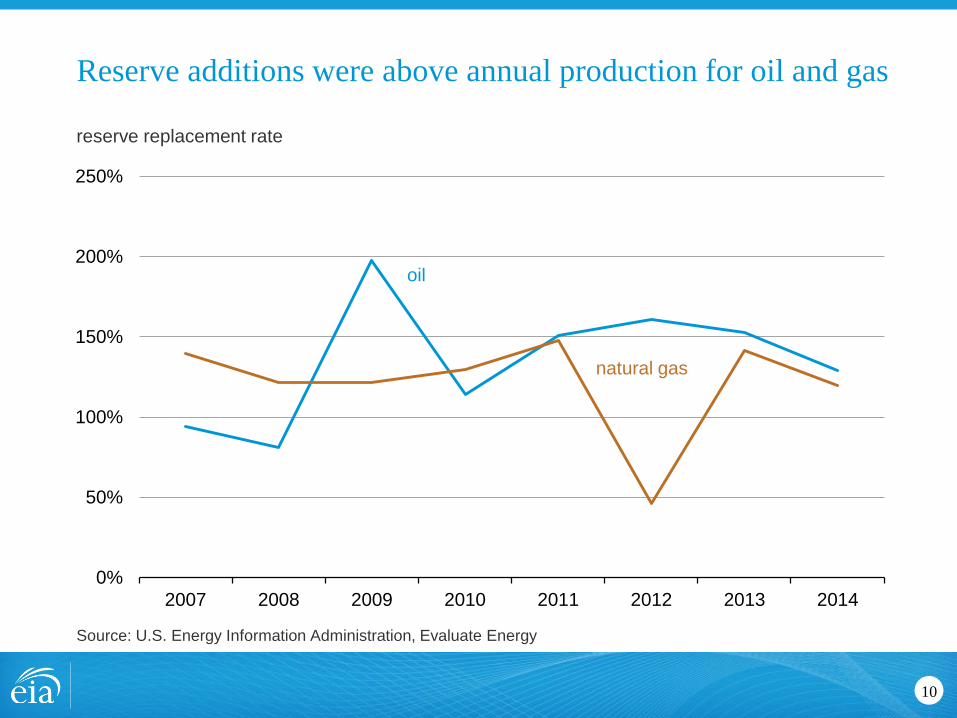
Reserve additions were above annual production for oil and gas
10
reserve replacement rate
Source: U.S. Energy Information Administration, Evaluate Energy
0%
50%
100%
150%
200%
250%
2007 2008 2009 2010 2011 2012 2013 2014
oil
natural gas
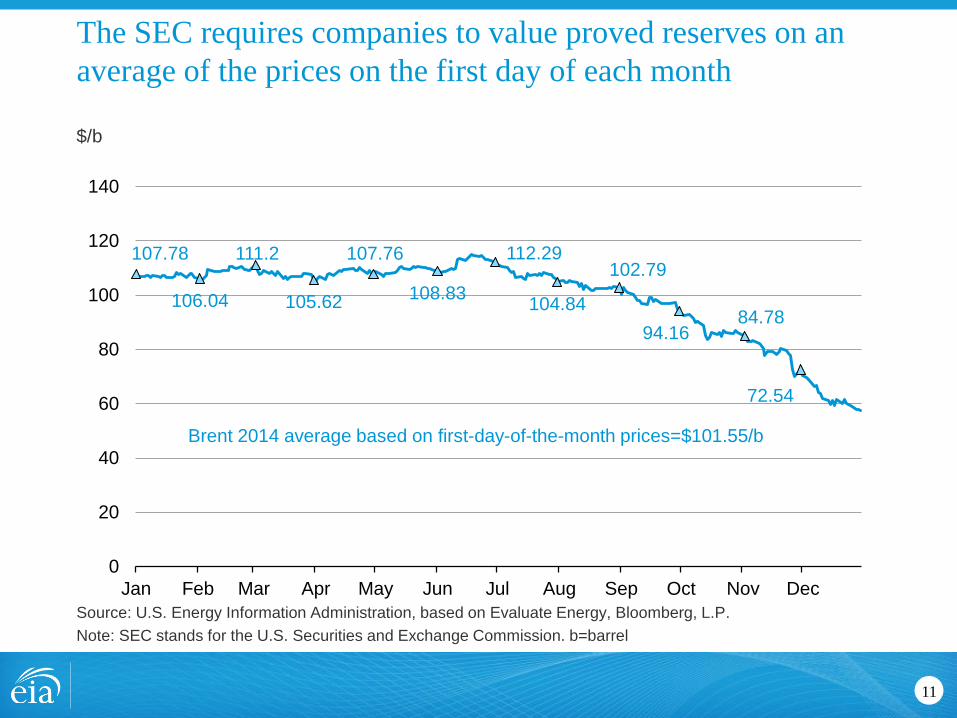
The SEC requires companies to value proved reserves on an
average of the prices on the first day of each month
11
$/b
Source: U.S. Energy Information Administration, based on Evaluate Energy, Bloomberg, L.P.
Note: SEC stands for the U.S. Securities and Exchange Commission. b=barrel
107.78
106.04
111.2
105.62
107.76
108.83
112.29
104.84
102.79
94.16 84.78
72.54
0
20
40
60
80
100
120
140
Jan Feb Mar Apr May Jun Jul Aug Sep Oct Nov Dec
Brent 2014 average based on first-day-of-the-month prices=$101.55/b
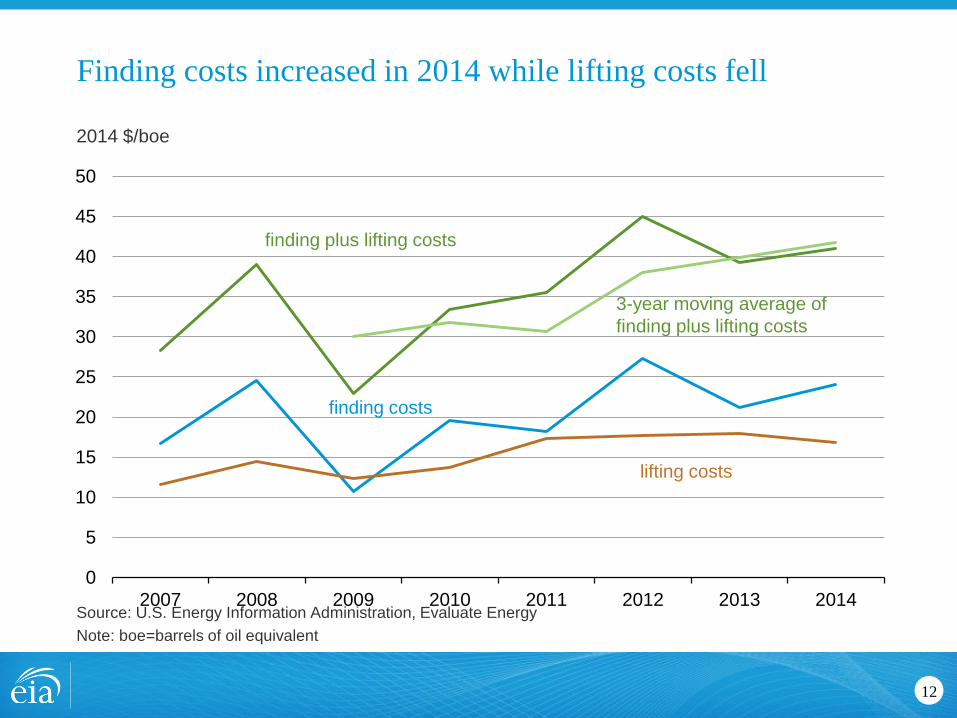
Finding costs increased in 2014 while lifting costs fell
12
2014 $/boe
Source: U.S. Energy Information Administration, Evaluate Energy
Note: boe=barrels of oil equivalent
0
5
10
15
20
25
30
35
40
45
50
2007 2008 2009 2010 2011 2012 2013 2014
finding plus lifting costs
3-year moving average of
finding plus lifting costs
finding costs
lifting costs
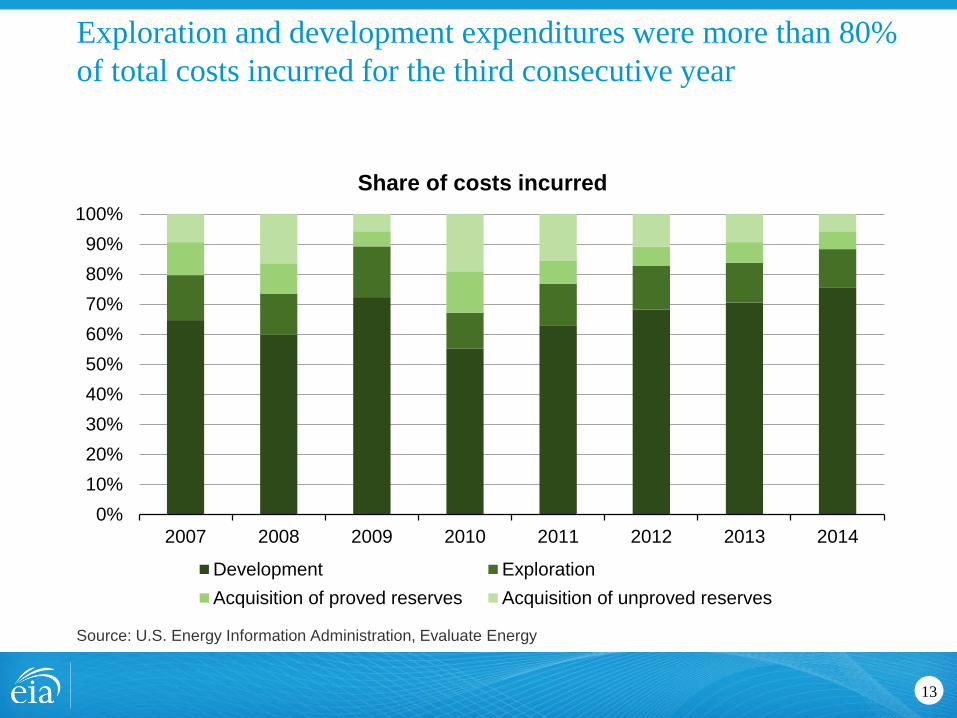
Exploration and development expenditures were more than 80%
of total costs incurred for the third consecutive year
13
Source: U.S. Energy Information Administration, Evaluate Energy
0%
10%
20%
30%
40%
50%
60%
70%
80%
90%
100%
2007 2008 2009 2010 2011 2012 2013 2014
Share of costs incurred
Development Exploration
Acquisition of proved reserves Acquisition of unproved reserves
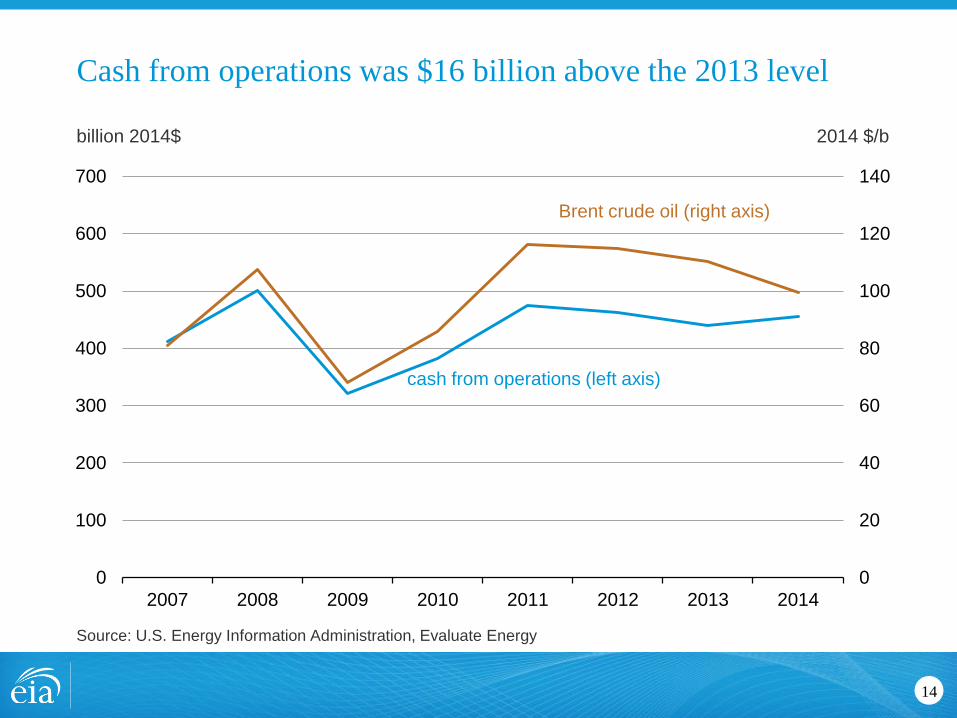
Cash from operations was $16 billion above the 2013 level
14
billion 2014$ 2014 $/b
Source: U.S. Energy Information Administration, Evaluate Energy
0
20
40
60
80
100
120
140
0
100
200
300
400
500
600
700
2007 2008 2009 2010 2011 2012 2013 2014
cash from operations (left axis)
Brent crude oil (right axis)
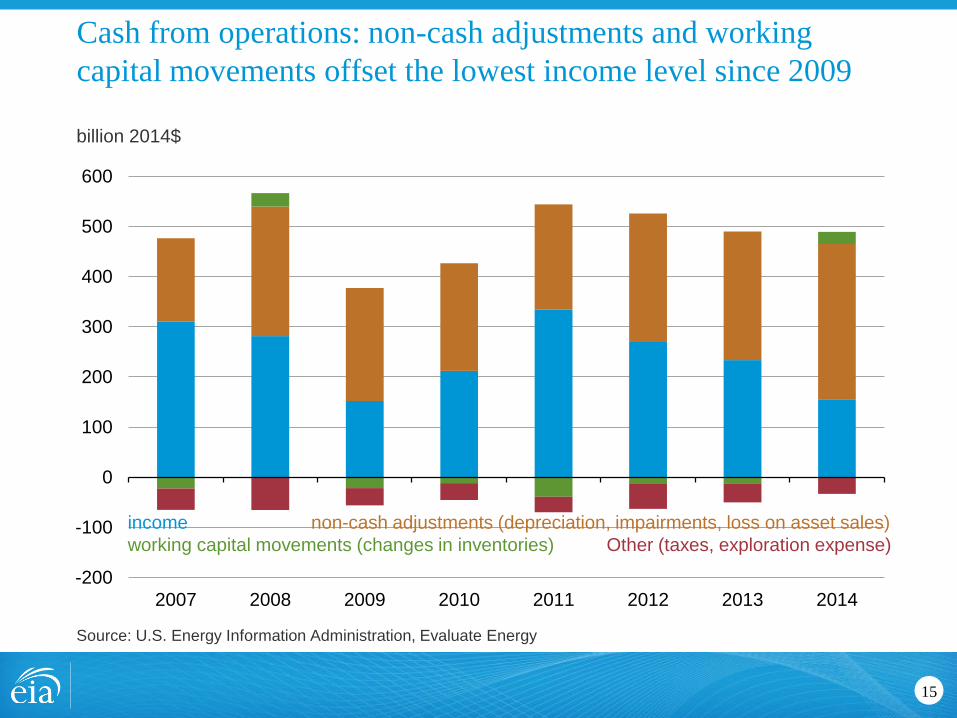
Cash from operations: non-cash adjustments and working
capital movements offset the lowest income level since 2009
15
billion 2014$
Source: U.S. Energy Information Administration, Evaluate Energy
-200
-100
0
100
200
300
400
500
600
2007 2008 2009 2010 2011 2012 2013 2014
income non-cash adjustments (depreciation, impairments, loss on asset sales)
working capital movements (changes in inventories) Other (taxes, exploration expense)
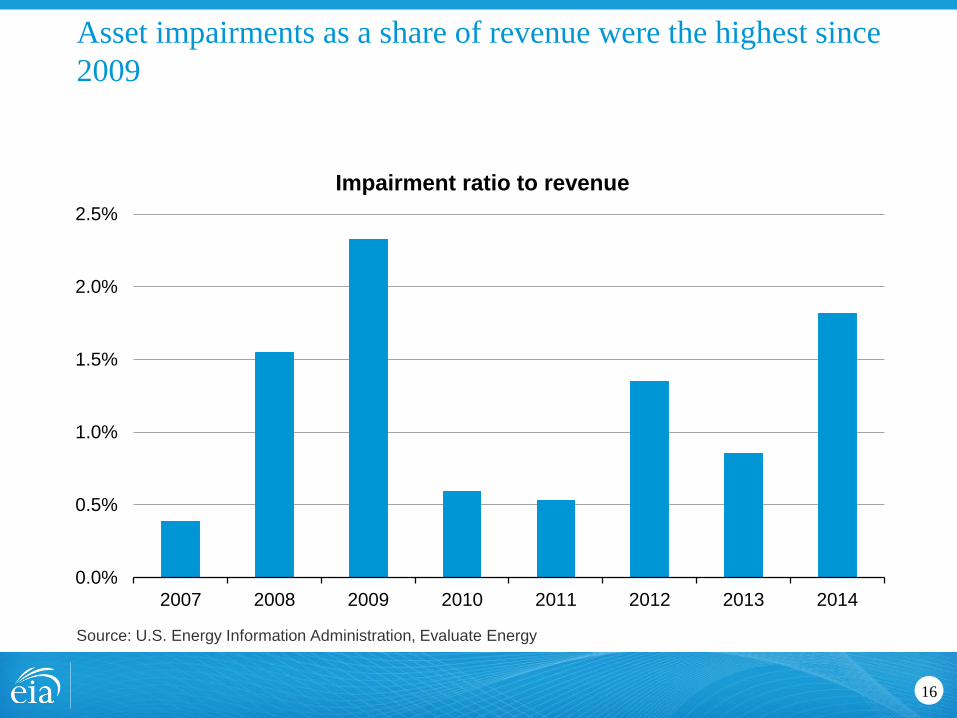
Asset impairments as a share of revenue were the highest since
2009
16
Source: U.S. Energy Information Administration, Evaluate Energy
0.0%
0.5%
1.0%
1.5%
2.0%
2.5%
2007 2008 2009 2010 2011 2012 2013 2014
Impairment ratio to revenue
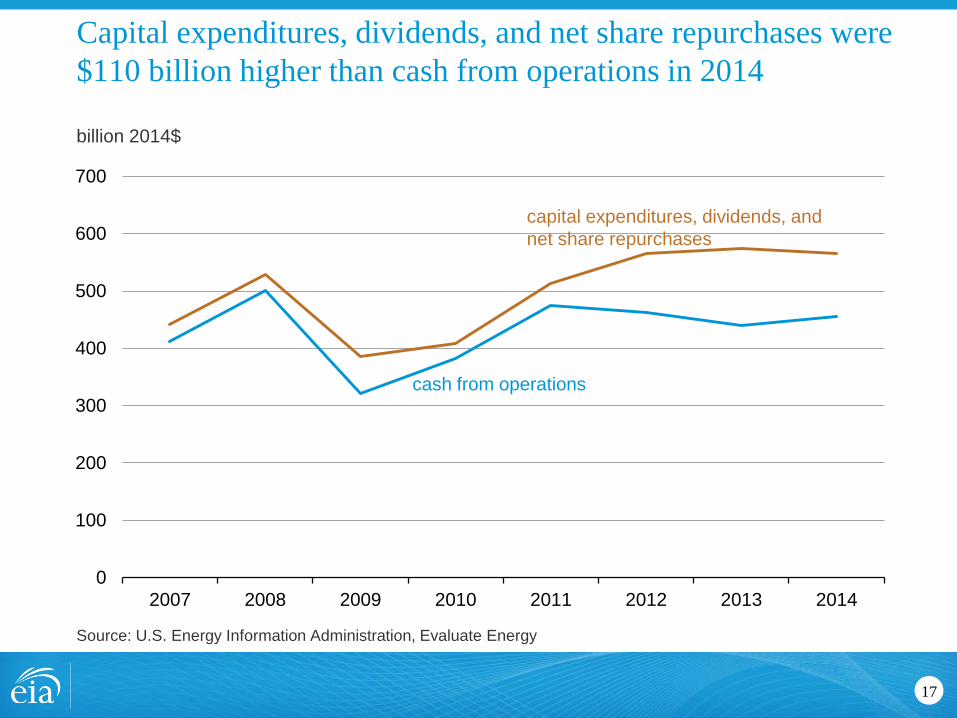
Capital expenditures, dividends, and net share repurchases were
$110 billion higher than cash from operations in 2014
17
billion 2014$
Source: U.S. Energy Information Administration, Evaluate Energy
0
100
200
300
400
500
600
700
2007 2008 2009 2010 2011 2012 2013 2014
cash from operations
capital expenditures, dividends, and
net share repurchases
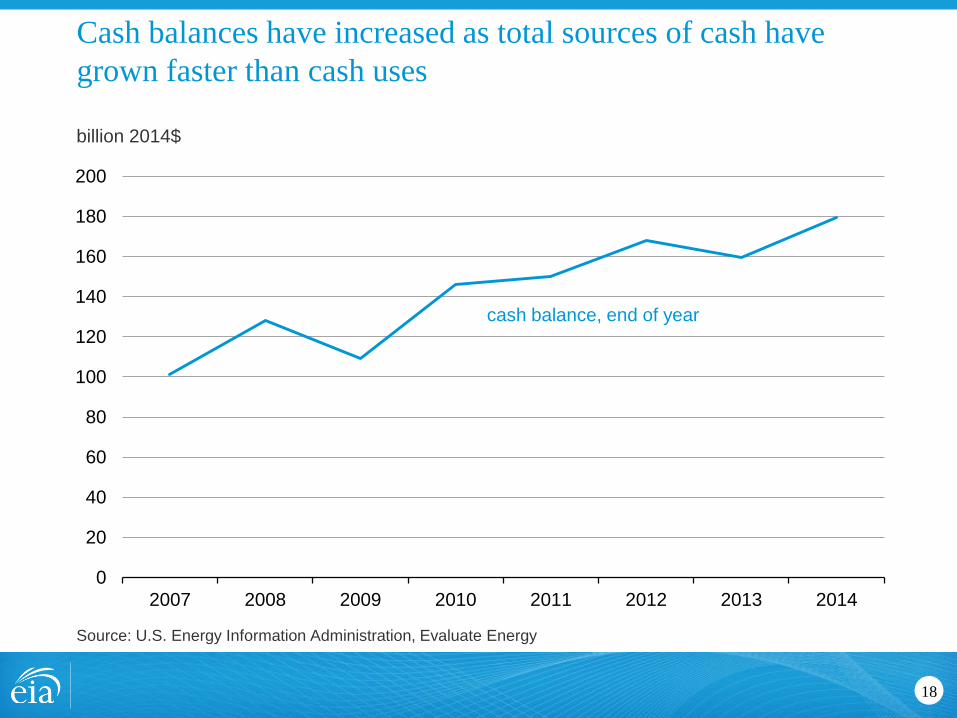
Cash balances have increased as total sources of cash have
grown faster than cash uses
18
billion 2014$
Source: U.S. Energy Information Administration, Evaluate Energy
0
20
40
60
80
100
120
140
160
180
200
2007 2008 2009 2010 2011 2012 2013 2014
cash balance, end of year
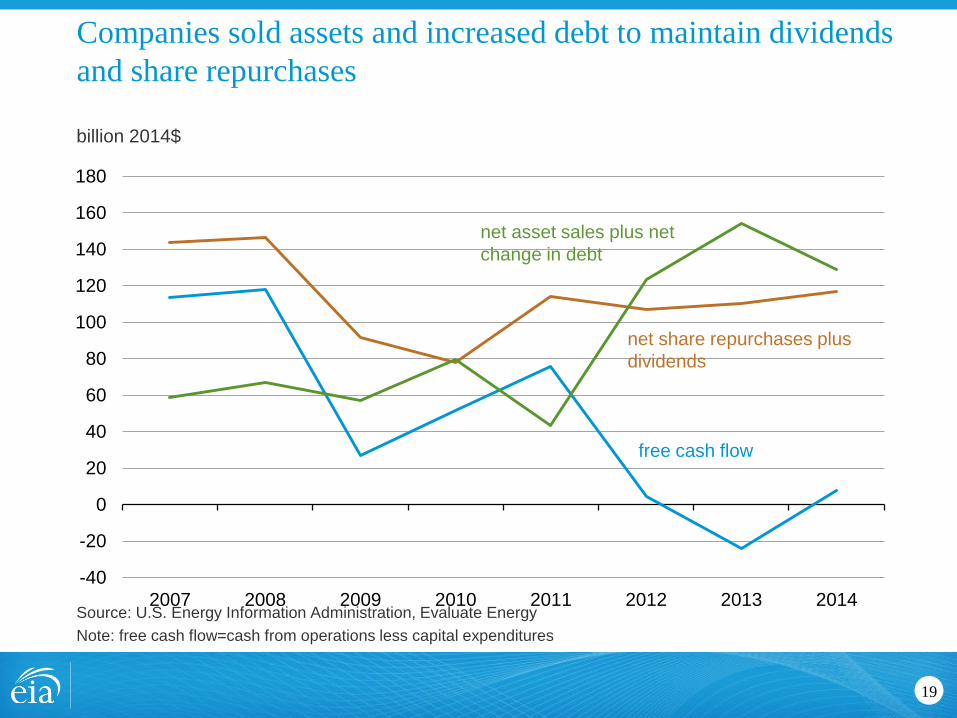
Companies sold assets and increased debt to maintain dividends
and share repurchases
19
billion 2014$
Source: U.S. Energy Information Administration, Evaluate Energy
Note: free cash flow=cash from operations less capital expenditures
-40
-20
0
20
40
60
80
100
120
140
160
180
2007 2008 2009 2010 2011 2012 2013 2014
net asset sales plus net
change in debt
net share repurchases plus
dividends
free cash flow
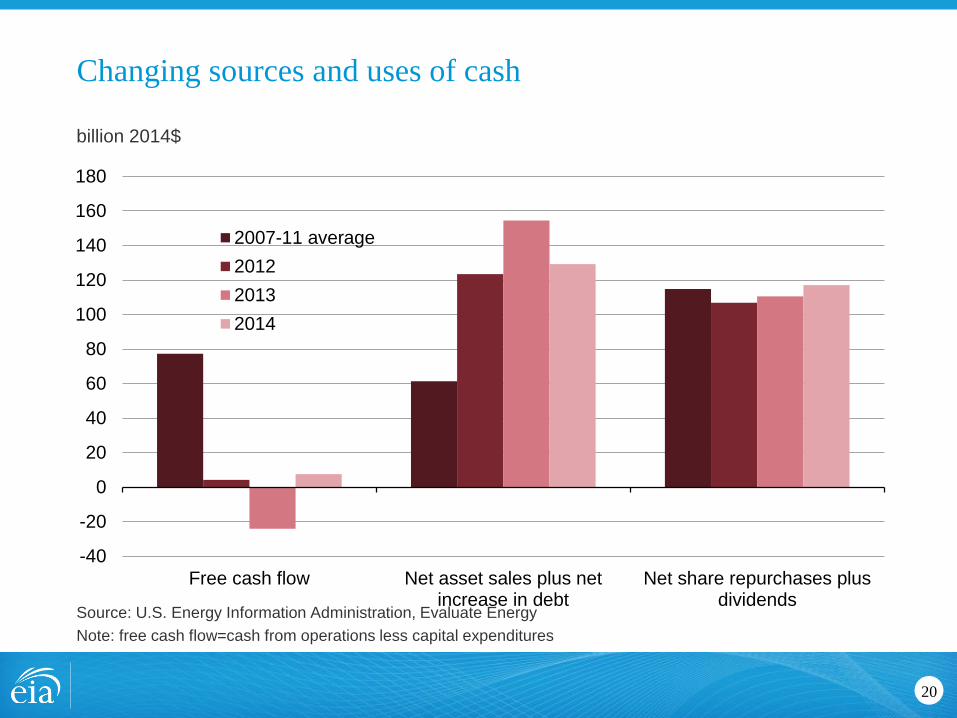
Changing sources and uses of cash
20
billion 2014$
Source: U.S. Energy Information Administration, Evaluate Energy
Note: free cash flow=cash from operations less capital expenditures
-40
-20
0
20
40
60
80
100
120
140
160
180
Free cash flow Net asset sales plus netincrease in debt
Net share repurchases plusdividends
2007-11 average
2012
2013
2014
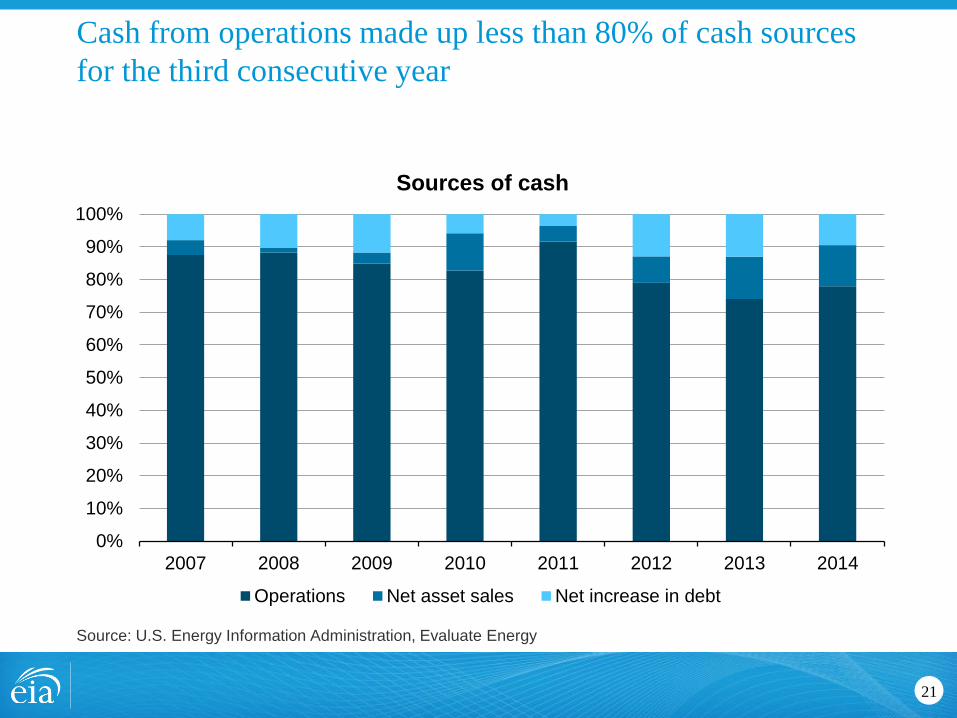
Cash from operations made up less than 80% of cash sources
for the third consecutive year
21
Source: U.S. Energy Information Administration, Evaluate Energy
0%
10%
20%
30%
40%
50%
60%
70%
80%
90%
100%
2007 2008 2009 2010 2011 2012 2013 2014
Sources of cash
Operations Net asset sales Net increase in debt
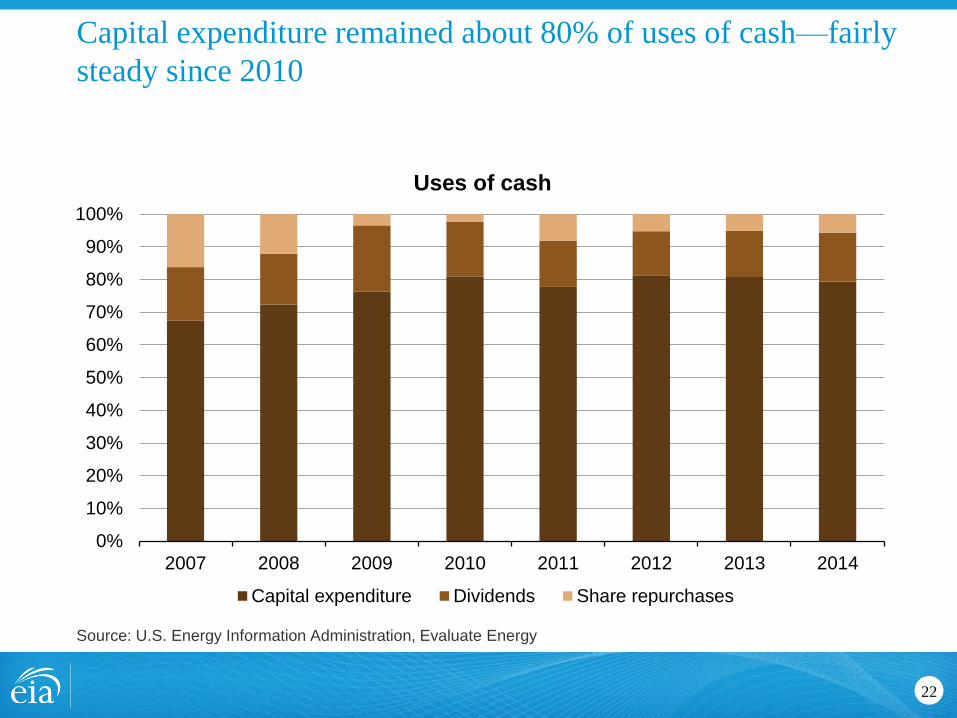
Capital expenditure remained about 80% of uses of cash—fairly
steady since 2010
22
Source: U.S. Energy Information Administration, Evaluate Energy
0%
10%
20%
30%
40%
50%
60%
70%
80%
90%
100%
2007 2008 2009 2010 2011 2012 2013 2014
Uses of cash
Capital expenditure Dividends Share repurchases
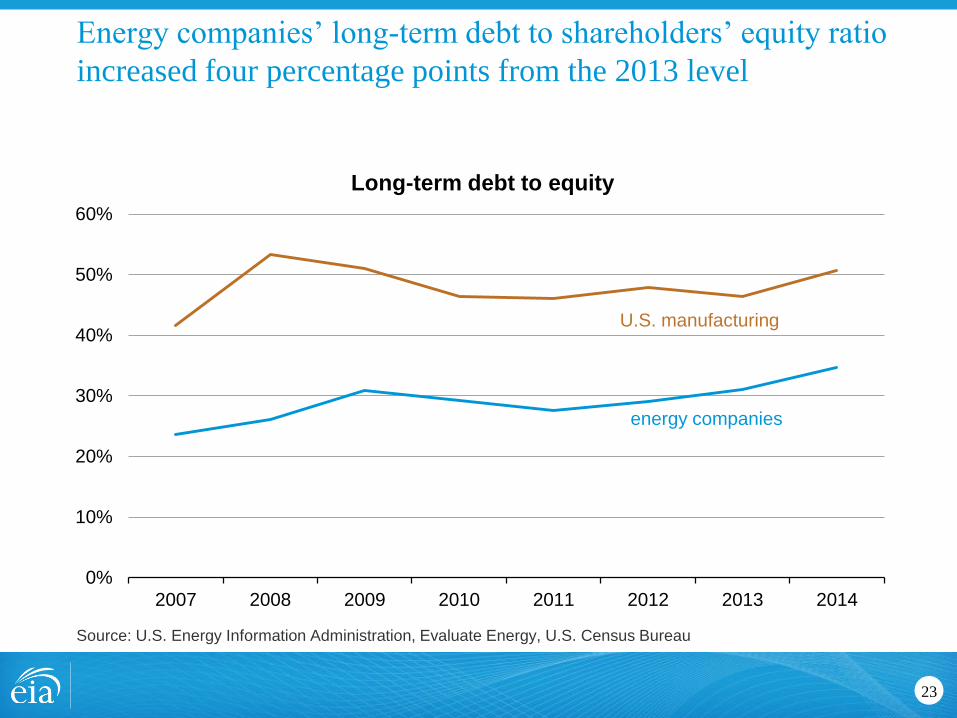
Energy companies’ long-term debt to shareholders’ equity ratio
increased four percentage points from the 2013 level
23
Source: U.S. Energy Information Administration, Evaluate Energy, U.S. Census Bureau
0%
10%
20%
30%
40%
50%
60%
2007 2008 2009 2010 2011 2012 2013 2014
Long-term debt to equity
energy companies
U.S. manufacturing
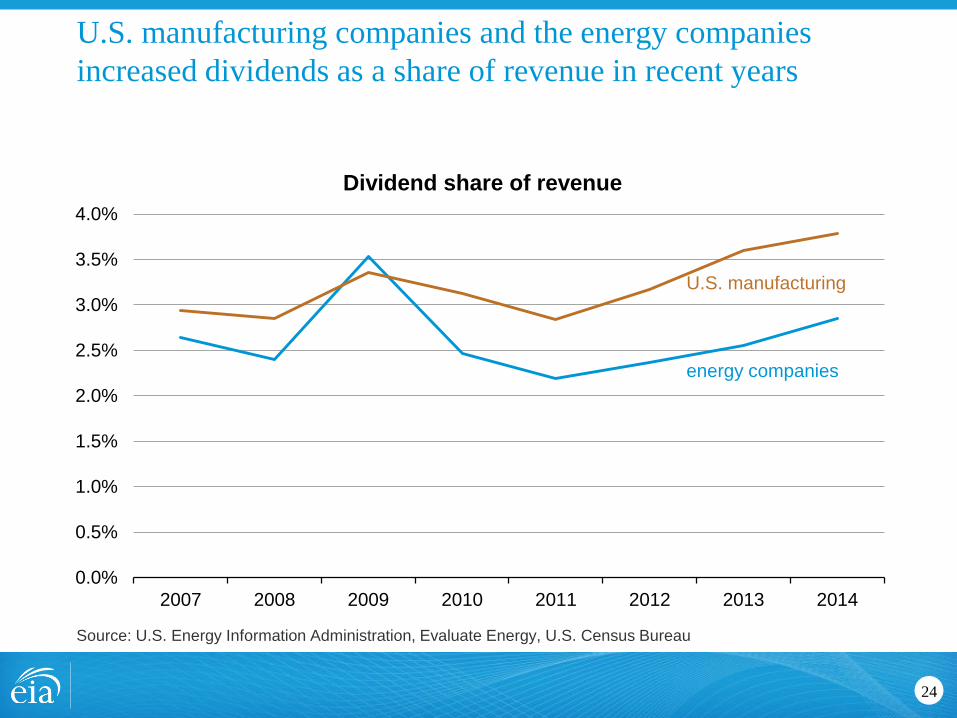
U.S. manufacturing companies and the energy companies
increased dividends as a share of revenue in recent years
24
Source: U.S. Energy Information Administration, Evaluate Energy, U.S. Census Bureau
0.0%
0.5%
1.0%
1.5%
2.0%
2.5%
3.0%
3.5%
4.0%
2007 2008 2009 2010 2011 2012 2013 2014
Dividend share of revenue
U.S. manufacturing
energy companies
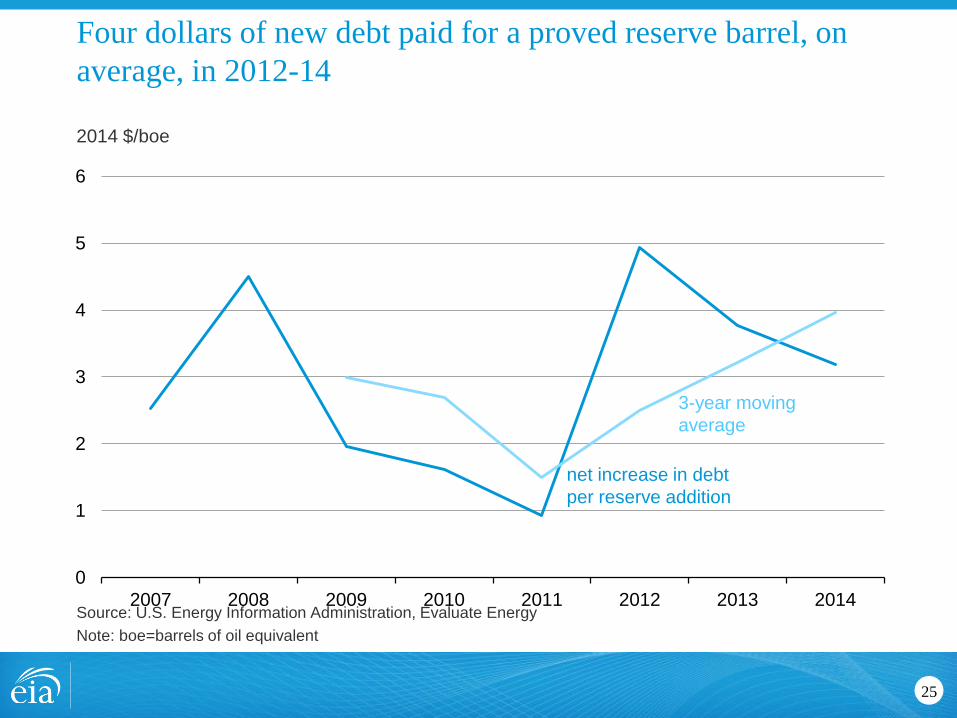
Four dollars of new debt paid for a proved reserve barrel, on
average, in 2012-14
25
2014 $/boe
Source: U.S. Energy Information Administration, Evaluate Energy
Note: boe=barrels of oil equivalent
0
1
2
3
4
5
6
2007 2008 2009 2010 2011 2012 2013 2014
net increase in debt
per reserve addition
3-year moving
average
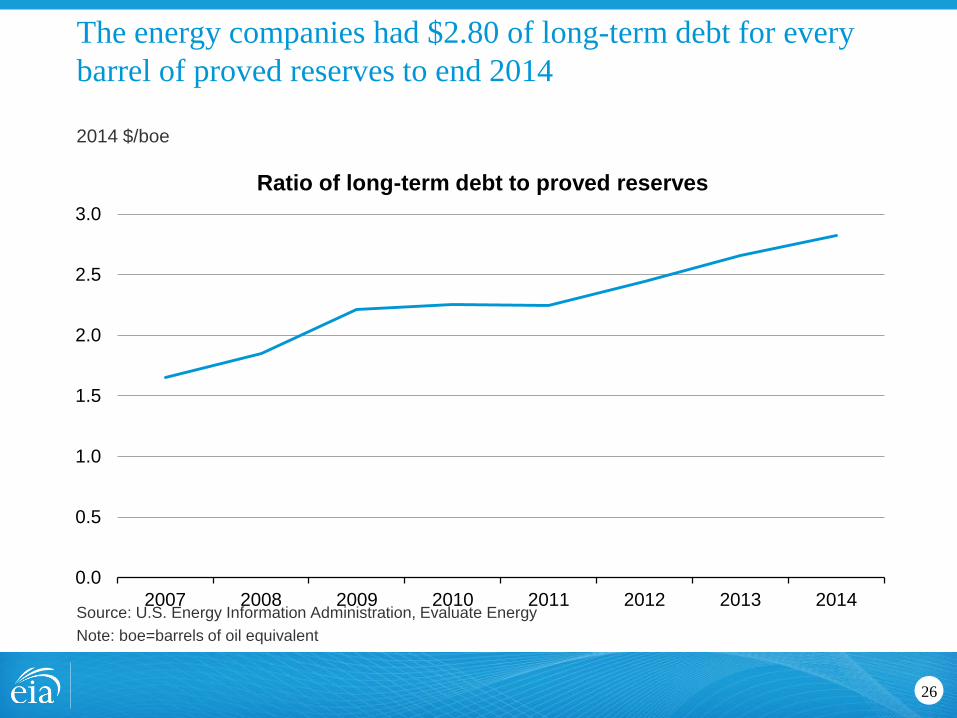
The energy companies had $2.80 of long-term debt for every
barrel of proved reserves to end 2014
26
2014 $/boe
Source: U.S. Energy Information Administration, Evaluate Energy
Note: boe=barrels of oil equivalent
0.0
0.5
1.0
1.5
2.0
2.5
3.0
2007 2008 2009 2010 2011 2012 2013 2014
Ratio of long-term debt to proved reserves
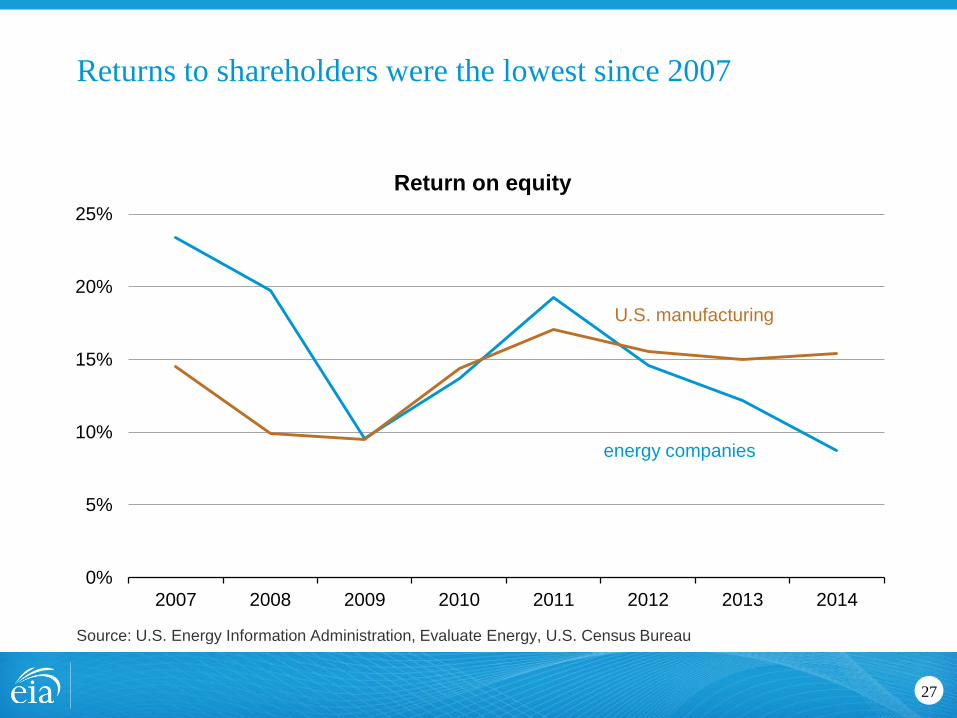
Returns to shareholders were the lowest since 2007
27
Source: U.S. Energy Information Administration, Evaluate Energy, U.S. Census Bureau
0%
5%
10%
15%
20%
25%
2007 2008 2009 2010 2011 2012 2013 2014
Return on equity
energy companies
U.S. manufacturing
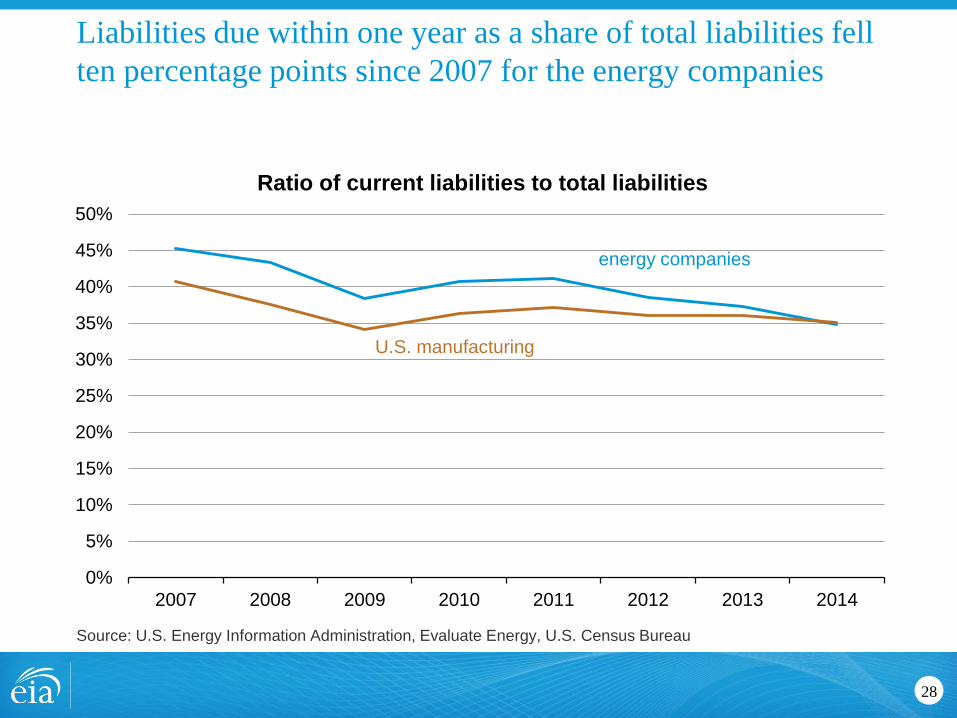
Liabilities due within one year as a share of total liabilities fell
ten percentage points since 2007 for the energy companies
28
Source: U.S. Energy Information Administration, Evaluate Energy, U.S. Census Bureau
0%
5%
10%
15%
20%
25%
30%
35%
40%
45%
50%
2007 2008 2009 2010 2011 2012 2013 2014
Ratio of current liabilities to total liabilities
U.S. manufacturing
energy companies
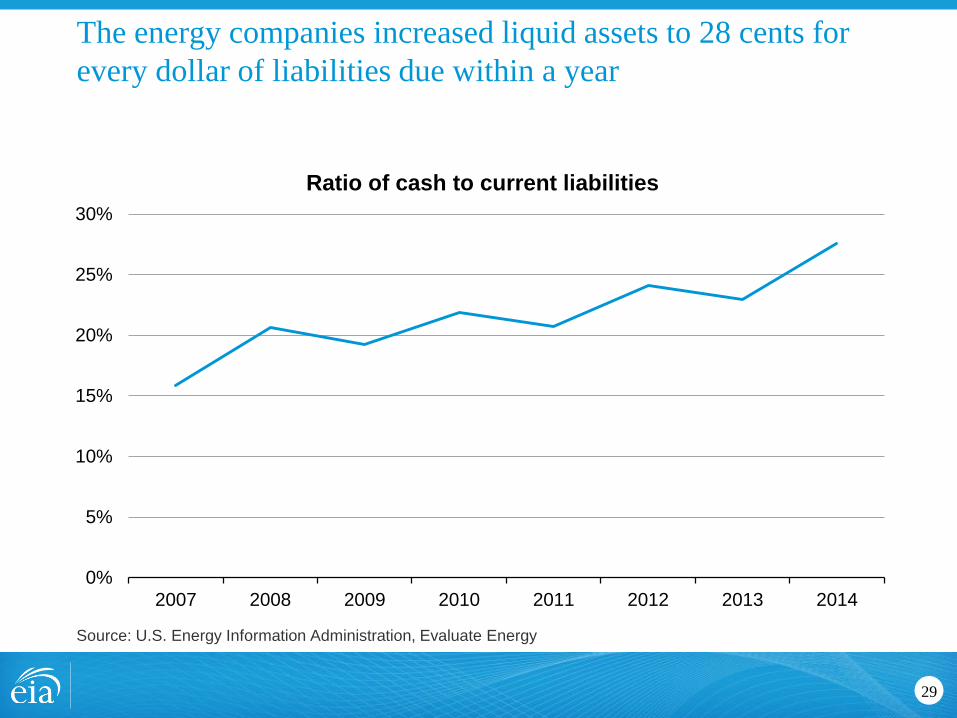
The energy companies increased liquid assets to 28 cents for
every dollar of liabilities due within a year
29
Source: U.S. Energy Information Administration, Evaluate Energy
0%
5%
10%
15%
20%
25%
30%
2007 2008 2009 2010 2011 2012 2013 2014
Ratio of cash to current liabilities
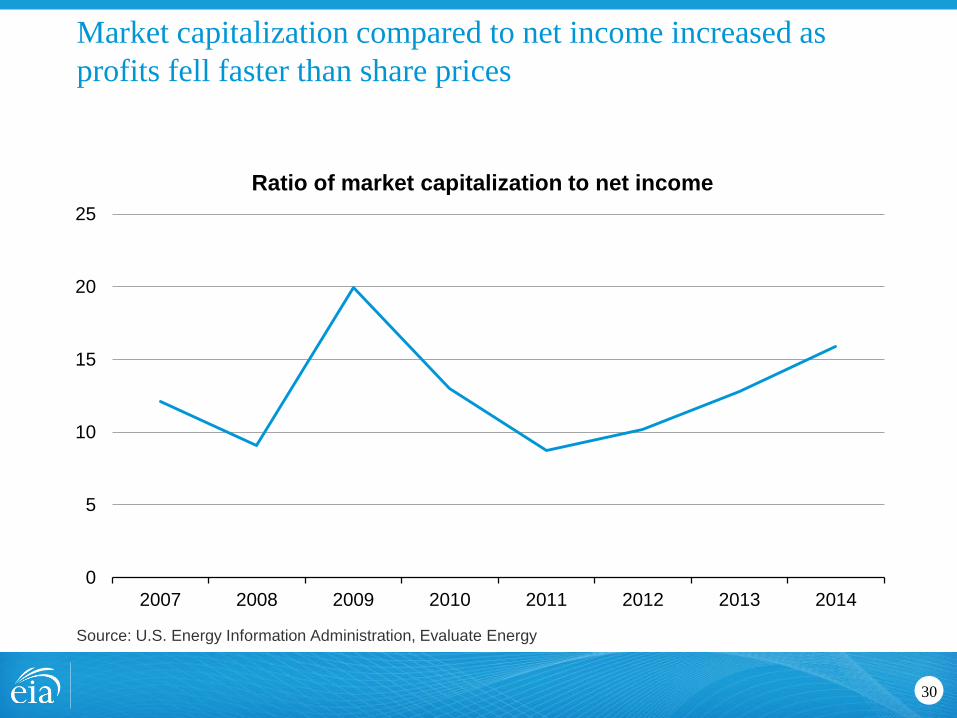
Market capitalization compared to net income increased as
profits fell faster than share prices
30
Source: U.S. Energy Information Administration, Evaluate Energy
0
5
10
15
20
25
2007 2008 2009 2010 2011 2012 2013 2014
Ratio of market capitalization to net income
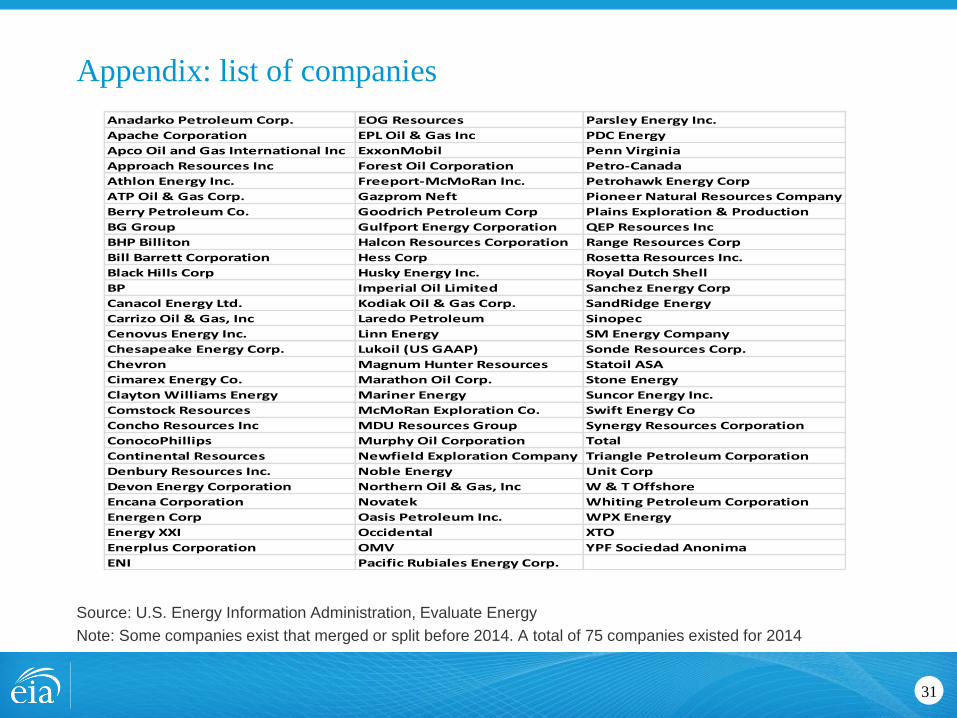
Appendix: list of companies
31
Source: U.S. Energy Information Administration, Evaluate Energy
Note: Some companies exist that merged or split before 2014. A total of 75 companies existed for 2014
Anadarko Petroleum Corp. EOG Resources Parsley Energy Inc.
Apache Corporation EPL Oil & Gas Inc PDC Energy
Apco Oil and Gas International Inc ExxonMobil Penn Virginia
Approach Resources Inc Forest Oil Corporation Petro-Canada
Athlon Energy Inc. Freeport-McMoRan Inc. Petrohawk Energy Corp
ATP Oil & Gas Corp. Gazprom Neft Pioneer Natural Resources Company
Berry Petroleum Co. Goodrich Petroleum Corp Plains Exploration & Production
BG Group Gulfport Energy Corporation QEP Resources Inc
BHP Billiton Halcon Resources Corporation Range Resources Corp
Bill Barrett Corporation Hess Corp Rosetta Resources Inc.
Black Hills Corp Husky Energy Inc. Royal Dutch Shell
BP Imperial Oil Limited Sanchez Energy Corp
Canacol Energy Ltd. Kodiak Oil & Gas Corp. SandRidge Energy
Carrizo Oil & Gas, Inc Laredo Petroleum Sinopec
Cenovus Energy Inc. Linn Energy SM Energy Company
Chesapeake Energy Corp. Lukoil (US GAAP) Sonde Resources Corp.
Chevron Magnum Hunter Resources Statoil ASA
Cimarex Energy Co. Marathon Oil Corp. Stone Energy
Clayton Williams Energy Mariner Energy Suncor Energy Inc.
Comstock Resources McMoRan Exploration Co. Swift Energy Co
Concho Resources Inc MDU Resources Group Synergy Resources Corporation
ConocoPhillips Murphy Oil Corporation Total
Continental Resources Newfield Exploration Company Triangle Petroleum Corporation
Denbury Resources Inc. Noble Energy Unit Corp
Devon Energy Corporation Northern Oil & Gas, Inc W & T Offshore
Encana Corporation Novatek Whiting Petroleum Corporation
Energen Corp Oasis Petroleum Inc. WPX Energy
Energy XXI Occidental XTO
Enerplus Corporation OMV YPF Sociedad Anonima
ENI Pacific Rubiales Energy Corp.

Refining
32
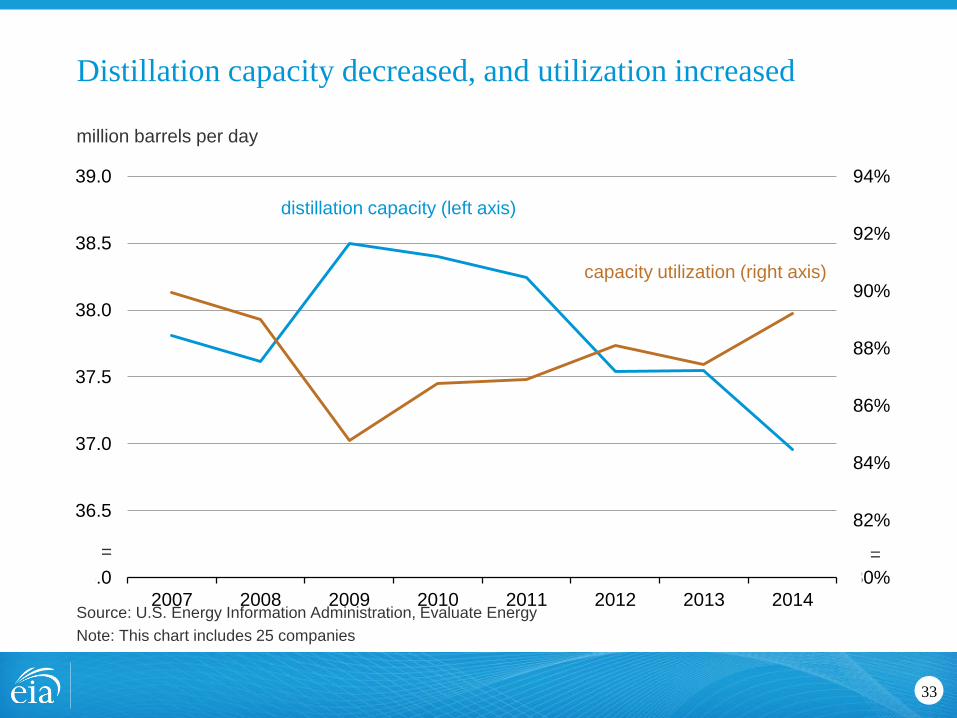
Distillation capacity decreased, and utilization increased
33
million barrels per day
Source: U.S. Energy Information Administration, Evaluate Energy
Note: This chart includes 25 companies
80%
82%
84%
86%
88%
90%
92%
94%
36.0
36.5
37.0
37.5
38.0
38.5
39.0
2007 2008 2009 2010 2011 2012 2013 2014
distillation capacity (left axis)
capacity utilization (right axis)
= =
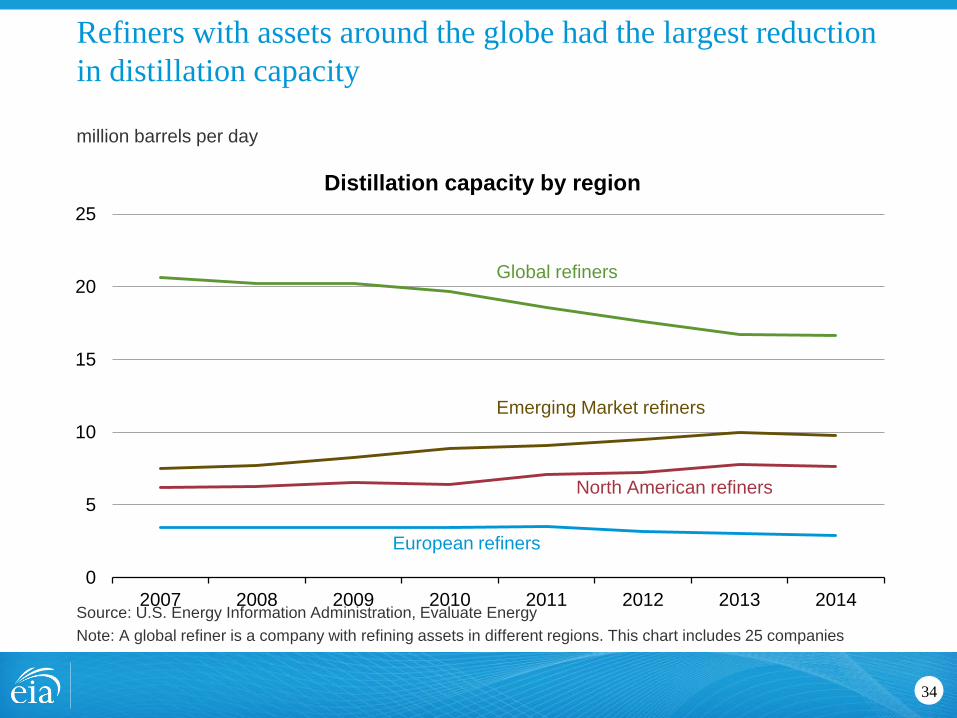
Refiners with assets around the globe had the largest reduction
in distillation capacity
34
million barrels per day
Source: U.S. Energy Information Administration, Evaluate Energy
Note: A global refiner is a company with refining assets in different regions. This chart includes 25 companies
0
5
10
15
20
25
2007 2008 2009 2010 2011 2012 2013 2014
Distillation capacity by region
North American refiners
Global refiners
European refiners
Emerging Market refiners
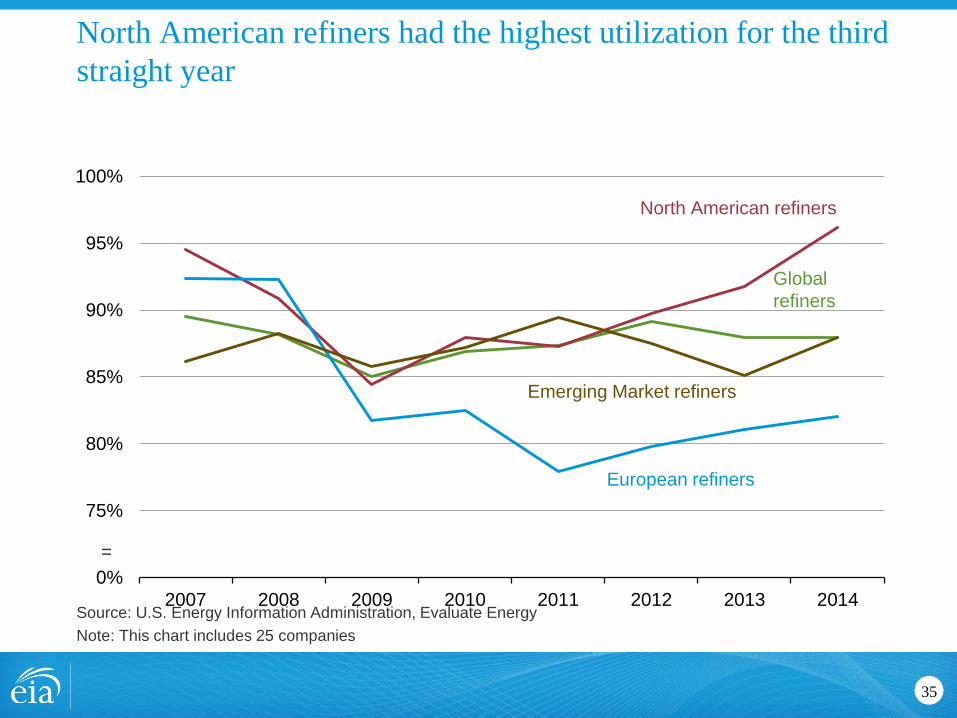
North American refiners had the highest utilization for the third
straight year
35
Source: U.S. Energy Information Administration, Evaluate Energy
Note: This chart includes 25 companies
70%
75%
80%
85%
90%
95%
100%
2007 2008 2009 2010 2011 2012 2013 2014
North American refiners
Emerging Market refiners
Global
refiners
European refiners
=

Refining capital expenditures declined, although they increased
as a share of total capital expenditures
36
billion 2014 dollars
Source: U.S. Energy Information Administration, Evaluate Energy
Note: This chart includes 31 companies
0%
4%
8%
12%
16%
20%
24%
28%
32%
36%
0
10
20
30
40
50
60
70
80
90
2007 2008 2009 2010 2011 2012 2013 2014
refining capital expenditures (left axis)
share of total capital expenditures (right axis)
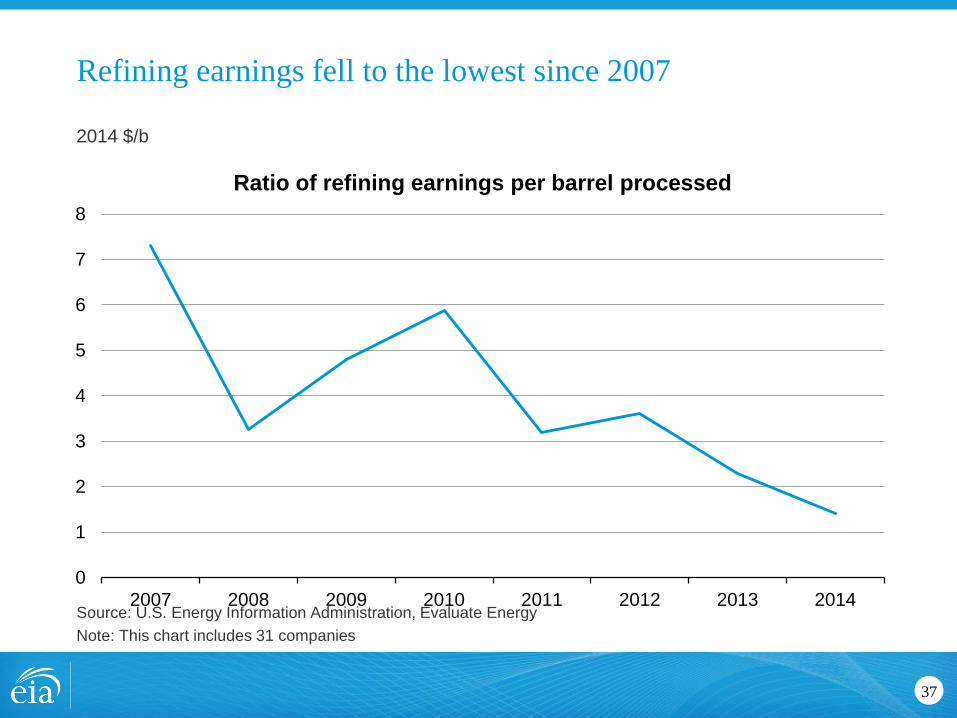
Refining earnings fell to the lowest since 2007
37
2014 $/b
Source: U.S. Energy Information Administration, Evaluate Energy
Note: This chart includes 31 companies
0
1
2
3
4
5
6
7
8
2007 2008 2009 2010 2011 2012 2013 2014
Ratio of refining earnings per barrel processed
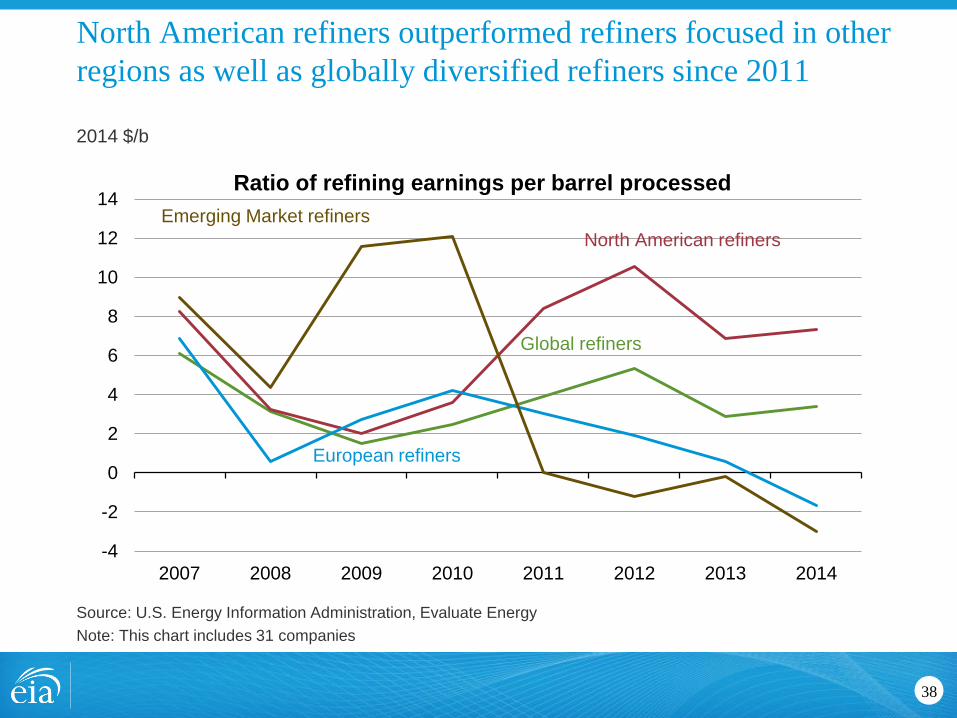
North American refiners outperformed refiners focused in other
regions as well as globally diversified refiners since 2011
38
2014 $/b
Source: U.S. Energy Information Administration, Evaluate Energy
Note: This chart includes 31 companies
-4
-2
0
2
4
6
8
10
12
14
2007 2008 2009 2010 2011 2012 2013 2014
Ratio of refining earnings per barrel processed
North American refiners
Global refiners
European refiners
Emerging Market refiners
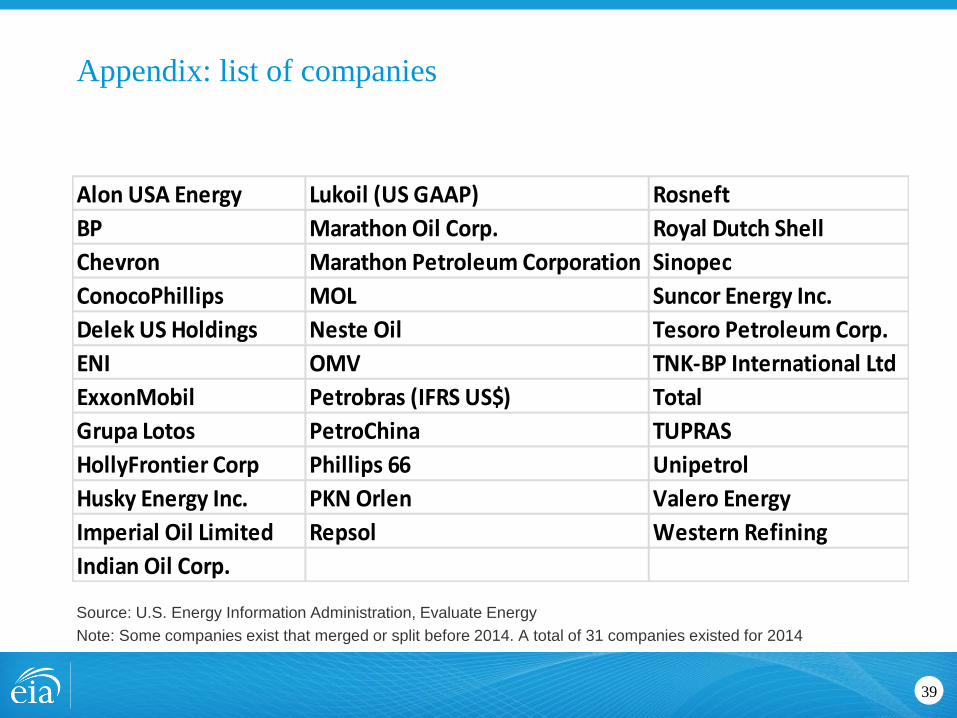
Appendix: list of companies
39
Source: U.S. Energy Information Administration, Evaluate Energy
Note: Some companies exist that merged or split before 2014. A total of 31 companies existed for 2014
Alon USA Energy Lukoil (US GAAP) Rosneft
BP Marathon Oil Corp. Royal Dutch Shell
Chevron Marathon Petroleum Corporation Sinopec
ConocoPhillips MOL Suncor Energy Inc.
Delek US Holdings Neste Oil Tesoro Petroleum Corp.
ENI OMV TNK-BP International Ltd
ExxonMobil Petrobras (IFRS US$) Total
Grupa Lotos PetroChina TUPRAS
HollyFrontier Corp Phillips 66 Unipetrol
Husky Energy Inc. PKN Orlen Valero Energy
Imperial Oil Limited Repsol Western Refining
Indian Oil Corp.


![Financial Results & Limited Review for March 31, 2013 [Result]](https://static.fdocuments.us/doc/165x107/577ca8101a28abea748cb398/financial-results-limited-review-for-march-31-2013-result.jpg)