2013 Duke Energy “F” Technology Users Groupccug.users-groups.com/AnnualMeetings/2013... ·...
37
M&D Center
Transcript of 2013 Duke Energy “F” Technology Users Groupccug.users-groups.com/AnnualMeetings/2013... ·...

M&D Center

About Duke Energy
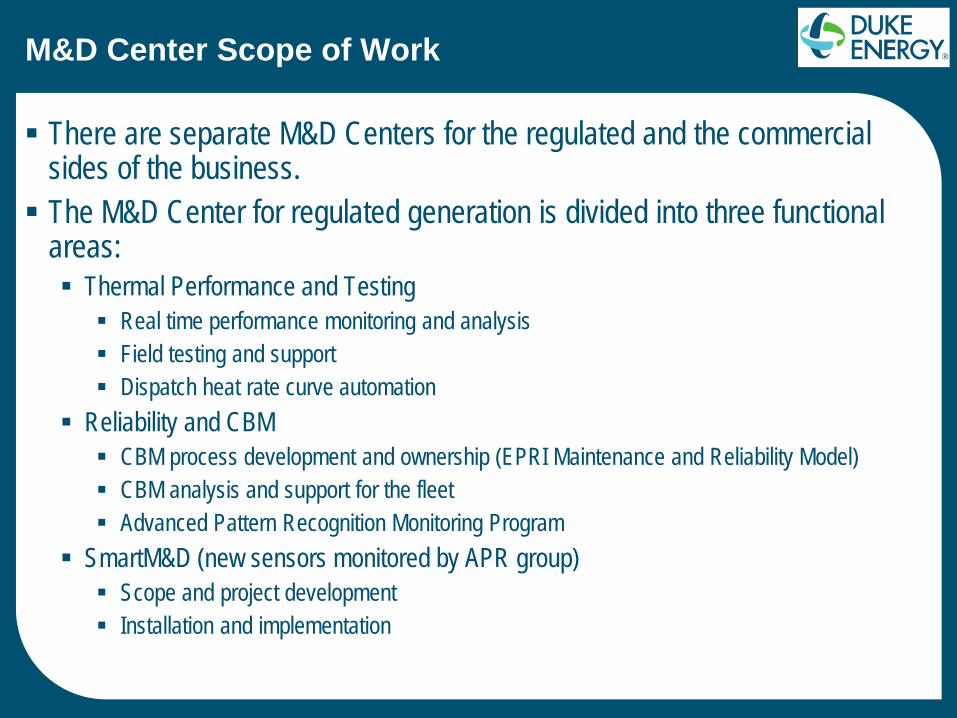
M&D Center Scope of Work
There are separate M&D Centers for the regulated and the commercial sides of the business. The M&D Center for regulated generation is divided into three functional
areas: Thermal Performance and Testing Real time performance monitoring and analysis Field testing and support Dispatch heat rate curve automation
Reliability and CBM CBM process development and ownership (EPRI Maintenance and Reliability Model) CBM analysis and support for the fleet Advanced Pattern Recognition Monitoring Program
SmartM&D (new sensors monitored by APR group) Scope and project development Installation and implementation

M&D Center Thermal Performance Team Mission
We help the plants maintain a competitive position in the market by providing real time heat rate monitoring, on-site testing and in-depth analysis of plant performance. We use first principles modeling software to monitor plant and system thermal
performance. The software compares actual plant efficiency to their desired targets. We provide turnkey expertise and resources to test equipment and system
performance on site. Our service ranges from individual components to total systems.
We partner with the stations to help them understand what factors are hurting performance and what they can do to restore it to the desired level.
We perform studies for the plants to determine the efficiency and operating performance impact of proposed changes in the plant configuration.
We ensure that the unit heat rate curves used for dispatching accurately reflect unit performance and seasonal conditions.

Real Time Cycle Performance Summary
Cycle Performance: • Heat balance • Component Drill
Down

Standard CT Screens
Performance Parameters: • Gross MW • Heat Rate • Compressor Efficiency • Pressure Ratio

Real Time Controllable Loss Summary
Controllable Loses: • MW Impact • $/hour

Compressor Performance Curve
Baseload Efficiency: • Red – Target • Yellow – Clean • Blue - Actual

BOP Equipment - Pump Performance Curve
• Performance of equipment can be monitored • Design head and design efficiency are compared to current operation

Dispatch Curve Automation Project
Moves from an annually updated dispatch curve to being performance driven
Uses thermodynamic modeling software to estimate energy input to cycle
Reflects current equipment
performance and ambient conditions.
Trend of Input-Output Curves VirtualPlant vs. EtaPRO Calculation
Yellow – Dispatch Curve Cyan – Current Operation

M&D Center Thermal Performance Deliverables
Real-time controllable loss and cycle performance reports will be readily available to any plant user. Monthly controllable loss summaries will be provided at the unit level and
the region level. Dispatch curve review and adjustment is triggered when the notified and
the real time heat rate curves deviate by 1% or more. The center is developing more rigorous cooling tower and heat
exchanger models. The virtual plant model is capable of “what-if” parametric studies.
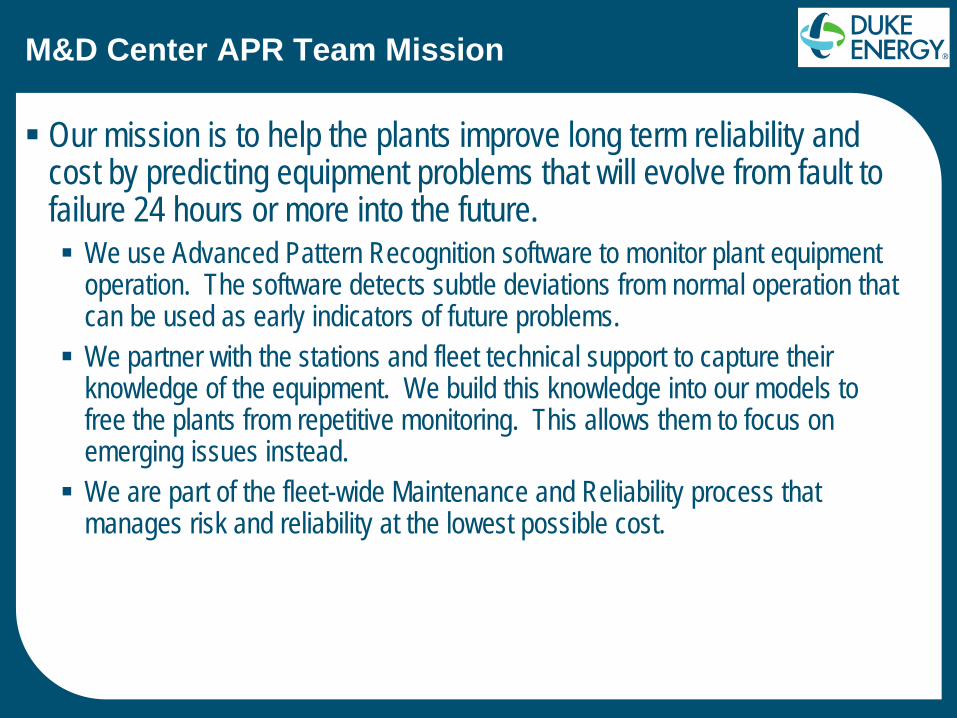
M&D Center APR Team Mission
Our mission is to help the plants improve long term reliability and cost by predicting equipment problems that will evolve from fault to failure 24 hours or more into the future. We use Advanced Pattern Recognition software to monitor plant equipment
operation. The software detects subtle deviations from normal operation that can be used as early indicators of future problems. We partner with the stations and fleet technical support to capture their
knowledge of the equipment. We build this knowledge into our models to free the plants from repetitive monitoring. This allows them to focus on emerging issues instead. We are part of the fleet-wide Maintenance and Reliability process that
manages risk and reliability at the lowest possible cost.

Evolution of the APR Program
Legacy Progress Started with the CT fleet in 2004 Expanded to the fossil fleet in 2007 Process Data – Prism APR tool Legacy Progress – 27 Fossil Units (now
15), 10 CC’s, 140+ CT’s >3500 APR Models >35,000 points monitored every 5
minutes Dedicated resources assigned to APR
and Thermal Performance monitoring
13

Evolution of the APR Program
Expansion After the Duke merger Legacy Duke – 29 Fossil Units, 4 CC’s,
63 CT’s, 8 PS, 9 Hydro >3000 APR Models >30,000 Points monitored every 5
minutes Regional Locations, Charlotte, Raleigh,
Indianapolis 5 team members dedicated to APR. Mix
of new employees, field support and plant experience.
Roughly 35 unique model types
14

Evolution of the APR Program
15

APR Philosophy
Maintain credibility by reviewing and screening all APR alarms before sharing with the stations Focus on reliability finds Avoid any commitment to operational finds that would evolve in less than 24 hours We are not an extension of the operators. We are an extension of CBM.
Integrate with the plant Maintenance and Reliability process
16

• Vibration
•Thrust Position
• Bearing Temps
• Oil Temps • Disc Cavity Temps
• Cooling Air Valve Positions
• Rotor Cooling Air Temp
• MW Output
• Ambient Temp
• Humidity
• Lube Oil Parameters
• Generator Data
Plot-0
4/6/2008 4:39:21.791 PM 4/9/2008 4:39:21.791 PM3.00 days
60
62
64
66
68
70
72
74
76
58
78
96
108
86
102
107
113
94
102
46
64
0
14
110
170
52
70
25
75• Exhaust Temps
• Exhaust Pressure
• Examples of data available
• Compressor Pres
• Compressor Temps
• Gas Temps
• Gas Pres

• Pull raw data from Pi • Typically data sets will be 5 min samples for 1 year

APR Modeling Process – Cleaned Data Set
• Cleaned data set represents operation during all ambient / MW loading conditions
Summer
Winter Spring Fall

Plot-0
10/7/2007 9:17:30.977 AM 10/10/2007 9:17:30.977 AM3.00 day s
80
85
90
95
75
100
108
126
100
125
114
123
101
111
55
90
0
160
100
400
72
92
0
90
•Feed historical data to algorithm •Feed Real-time values to algorithm every 5 minutes •Algorithm compares Real-time with historical and outputs predicted values
Predicted values • Fan OB Bearing Temp • Fan IB Bearing Temp • Motor IB Bearing Temp • Motor OB Bearing Temp • Motor Winding Temp • Amps • Discharge Press
APR Modeling Process – Model Algorithm
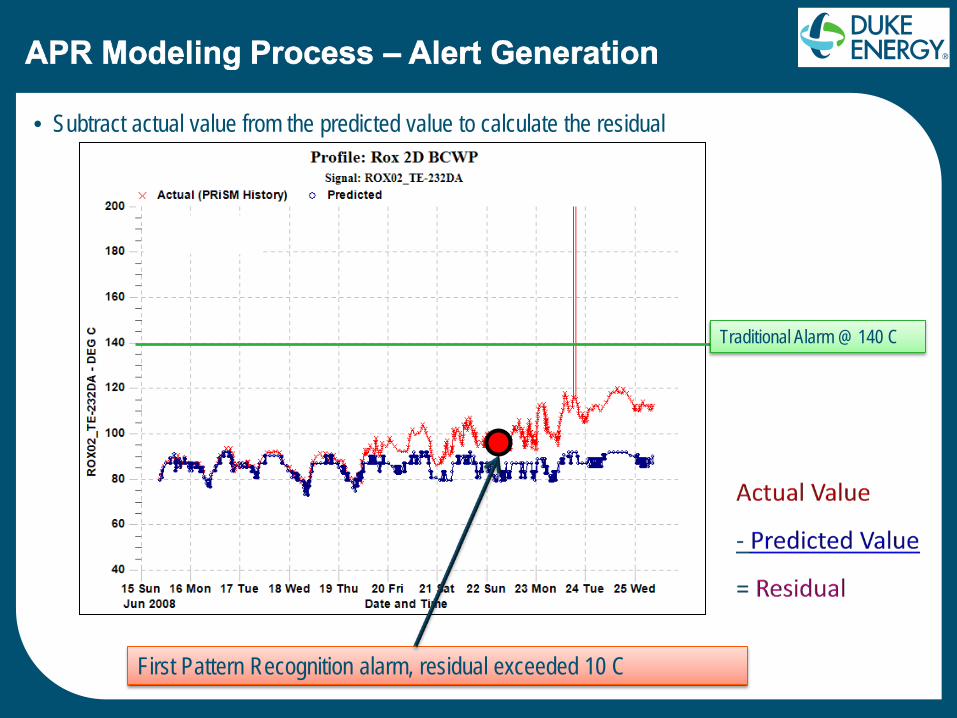
First Pattern Recognition alarm, residual exceeded 10 C
• Subtract actual value from the predicted value to calculate the residual
Traditional Alarm @ 140 C

M&D Center Issue Notification Process
In the long term, the M&D Center will initiate Tech Exams for all finds as part of the EPRI Maintenance and Reliability Process. Owners at the stations will utilize these Tech Exams to determine what needs to be done to the equipment. In the short term, the M&D Center uses Email and a notification matrix to
determine who to notify at each station. The center is developing a report tool that can customize reports to users
based on attributes such as region, unit, system, component or technology type. The Thermal Performance group issues monthly Controllable Loss
reports for major plant systems and provides real time thermal performance displays to the plants. Performance testing groups provide turnkey testing and analysis for a
wide range of performance issues.

CR 1&2 Fire & Major Damage – Jan 2010
Major Catastrophic Failure $MM’s+ 4 months loss generation
SmartM&D Technology could have prevented this failure
23
$200 RF Bus Temp Device on SmartM&D Network

Existing Program Gaps
Equipment Specialists Current specialists spread too thin – hard to replace Current manual predictive programs 80% data collection, 20% diagnostic 60,000 manual vibration data collections per month!!
M&D Center Limitations Currently limited only to DCS available data Need more instrumentation to expand capabilities
Industry Gap – lack of cost effective automated
monitoring technologies on critical equipment.
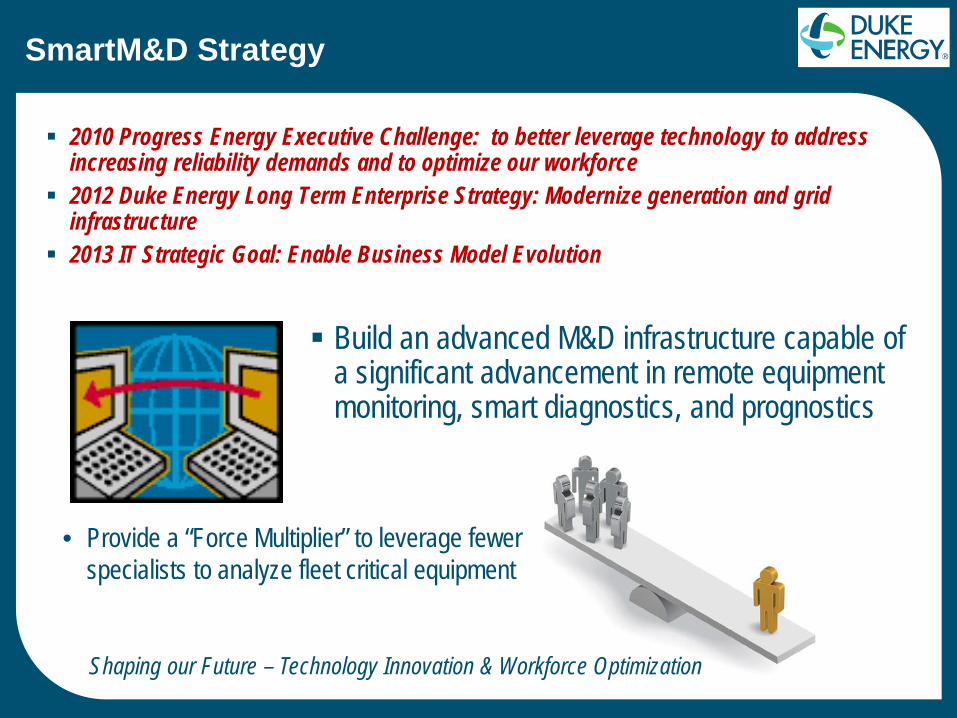
2010 Progress Energy Executive Challenge: to better leverage technology to address increasing reliability demands and to optimize our workforce
2012 Duke Energy Long Term Enterprise Strategy: Modernize generation and grid infrastructure
2013 IT Strategic Goal: Enable Business Model Evolution Build an advanced M&D infrastructure capable of
a significant advancement in remote equipment monitoring, smart diagnostics, and prognostics
• Provide a “Force Multiplier” to leverage fewer
specialists to analyze fleet critical equipment
Shaping our Future – Technology Innovation & Workforce Optimization
SmartM&D Strategy

Evolution of the APR Program – SmartM&D
Additional Expansion planned for Phase 2 (SmartM&D) implementation
>5000 APR Models for SmartM&D Advanced Sensor Types
– Vibration – Temperature – Electromagnetic Interference (EMI) – Motor Diagnostics – Thermography – Visual Cameras – Additional sensors for performance
monitoring (press, flow, etc.) – National Instruments Compact
Remote I/O Devices (CRIO) >65 new model types
26

Avoided Cost Chart Tracks Value
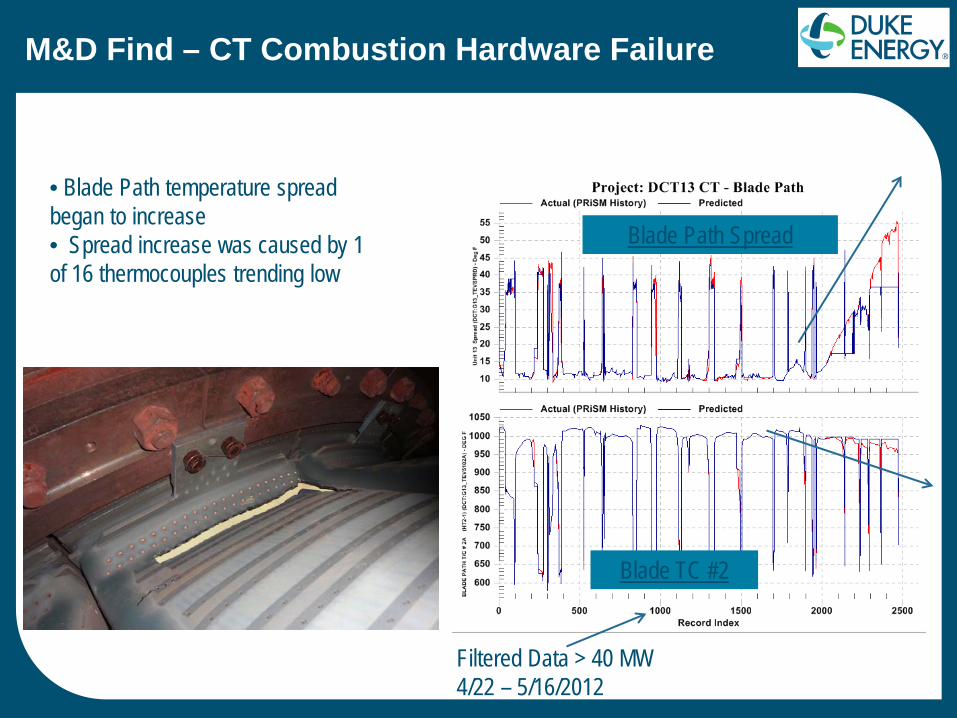
M&D Find – CT Combustion Hardware Failure
• Blade Path temperature spread began to increase • Spread increase was caused by 1 of 16 thermocouples trending low
Filtered Data > 40 MW 4/22 – 5/16/2012
Blade Path Spread
Blade TC #2

M&D Find – Boiler Feed Pump Motor Bearing
• Increasing temperature detected on NDE Motor bearing on BFP (alert set to +/- 15F) • Site contacted with issue • PdM tech determined the oil flow was restricted to the bearing • The diverter stack was closed on the CT and the pump was shutdown
Site contacted and pump was shutdown
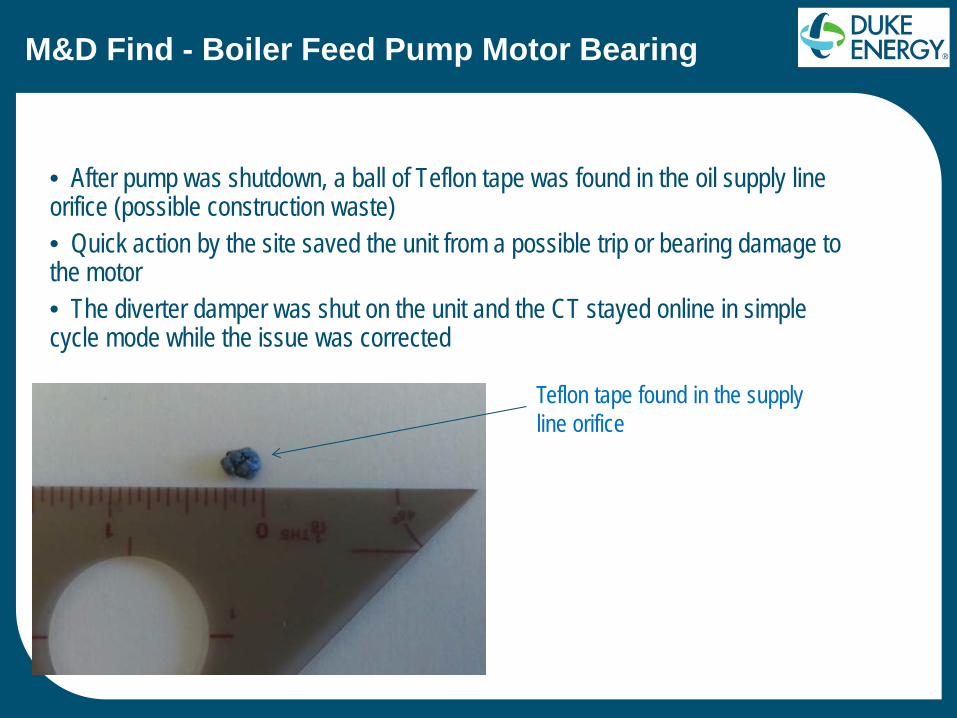
M&D Find - Boiler Feed Pump Motor Bearing
• After pump was shutdown, a ball of Teflon tape was found in the oil supply line orifice (possible construction waste) • Quick action by the site saved the unit from a possible trip or bearing damage to the motor • The diverter damper was shut on the unit and the CT stayed online in simple cycle mode while the issue was corrected
Teflon tape found in the supply line orifice

32
M&D Find - CT Generator ‘J strap’ failure
• APR detected a 2X shift in vibration on all the generator proximity and seismic probes • Occurred on the last run before the Fall outage• DCS does not alarm until 8.66 mils on the Bently proximity probes
Typical Run High Vibration Run
X - Normal X - After Y - Normal Y - After
Gen Brg1 0.95 2.60 0.56 1.10
Gen Brg2 0.70 1.81 0.81 1.40

M&D Find - CT Generator ‘J strap’ failure
• Site decided to remove manhole cover to inspect (not in original outage scope) • Both J-straps were found damaged • Site decided to remove field and repair J-straps • Had issue not been addressed, high probability of failure of J-Strap during winter run season
2 Visible Leads
1 Visible Leads

M&D Find - CT Generator ‘J strap’ failure
• Found shorted #1 coil, shorted #6 coil

M&D Find – Gore Filter Performance Analysis
Conventional filters at one CC site required frequent washing due to contamination from the cooling tower Gore filters were tested as an alternative M&D Center compared filter performance over time to find that the Gore
filters were cost justified in this application

M&D Find – CC Ambient Air Correction Factor
Third Party PPA supplier to Duke Performance test based on
loosely related ambient air sensors M&D review of test results
revealed the need for additional ambient air and RH temp sensors. Station installed the sensors
identified by the M&D Center The second test was satisfactory
and Duke accepted the results. The revised ambient temperature
will reduce our annual capacity costs from the plant by $250K.
36