
2013 Colorado Health Access...
28
COLORADO HEALTH ACCESS SURVEY 2013 Colorado Health Access Survey 20 High-Level Findings Colorado Health Institute NOVEMBER 2013
Transcript of 2013 Colorado Health Access...

COLORADO HEALTH ACCESS SURVEY
2013 Colorado Health
Access Survey20 High-Level Findings
Colorado Health Institute
NOVEMBER 2013

CHAS Analysis:
coloradohealthinstitute.org CHAS Data:
coloradohealthinstitute.org/data-repository/category/colorado-health-access-survey
The CHAS is fielded, analyzed and managed by the Colorado Health Institute.
It is funded by The Colorado Trust.

OVERALL INSURANCE
WHAT’S NEW
THE UNINSURED
AFFORDABILITY AND THE UNDERINSURED
UTILIZATION AND HEALTH STATUS
Acknowledgments
CHI staff members contributing to this report:
Natalie Triedman, lead editor
Rebecca Crepin, lead data analyst
Jeff Bontrager
Brian Clark
Amy Downs
Cliff Foster
Deborah Goeken
Megan Lane
Michele Lueck
Shana Montrose
Sara Schmitt
Tasia Sinn
Anna Vigran
The Colorado Health Institute thanks Dr. Ned Calonge and The Colorado Trust for ongoing support of the Colorado Health Access Survey. In particular, input from Gwyn Barley, PhD, Director of Programs, and Nancy Csuti, DrPH, Director of Research, Evaluation & Strategic Learning, was of great help as we analyzed the 2013 data and considered how to present it.
The Colorado Health Institute also thanks Tracy Johnson, PhD, who served as a consultant to develop questions for the 2013 Colorado Health Access Survey, with a focus on questions that would yield data to help measure implementation of the Affordable Care Act in Colorado.
About The CHASThe 2013 CHAS was a telephone survey of 10,224 randomly selected households in Colorado. It was administered between April 15 and July 27. Survey data were weighted to accurately reflect the demographics and distribution of the state’s population.
5 Health Insurance Coverage6 Health Insurance Coverage by Region
7 Mental Health8 Long-Term Care Insurance9 Oral Health10 Barriers to Receiving Health Care11 Churn
12 Length of Time Uninsured13 Reasons for Being Uninsured14 Uninsured Rates by Age15 Uninsured Rates by Race/Ethnicity16 Uninsured Rates by Income17 Uninsured Rates by Employment
18 Underinsurance19 Problems Paying Medical Bills20 Coloradans’ Views on the Health Care System
21 Health Care Use and Usual Source of Care22 Usual Source of Care by Region23 Emergency Department Use24 Health Status
Contents
3

Data from the 2013 Colorado Health Access Survey (CHAS) – highlighted in this report – help to answer these questions and many more.
The CHAS is the premier source of information on health insurance coverage, access to health care and how health care is used in Colorado.
With this survey, we now have data from 2009 through 2013 that contributes to a deeper insight into the reasons Coloradans have or don’t have health insurance. We better understand how they obtain the care they need, and why they sometimes can’t obtain the care they need. We see how – and when – they use health care.
And as Colorado and the rest of the nation set about fully implementing the Affordable Care Act (ACA), the CHAS stands as a unique community resource to measure its impact.
The 2013 CHAS provides the baseline for coverage, health care access and health care use in Colorado. Subsequent surveys will help to measure whether the goals of health reform – more people with health insurance, more affordable insurance and greater access to health care – are being met.
This year’s CHAS features a number of new questions. For the first time, Coloradans were asked about their oral health, their mental health and their mental health care needs, and whether they have long-term care insurance. In addition, this CHAS takes a deeper look at the barriers to receiving health care.
Also new this year is an accompanying data supplement that provides frequencies and percentages for each graphic in this report.
How many Coloradans are going without health insurance? How many have trouble getting an
appointment to see a doctor, even with insurance? Where do Coloradans get their health care?
How do they use that care?
COLORADO HEALTH ACCESS SURVEY
4

5NOVEMBER 2013
1. Health Insurance CoverageHaving health insurance can contribute to better health and financial stability. It can be the deciding factor in getting preventive care that could head off medical problems down the road. The central aim of the ACA is to ensure that most Americans have access to adequate, affordable health insurance. This new data helps Colorado to better understand where it stands in relation to that goal.
• ThepercentageofColoradanswithouthealthinsurancein2013is14.3percent compared with 15.8 percent in 2011 and 13.5 percent in 2009. The 2013 rate is not statistically different from either 2011 or 2009. It is interesting to note that an improving economy has yet to translate into significantly higher levels of health insurance coverage in Colorado.
• About741,000Coloradansdonothavehealthinsurancein2013–oroneofseven residents.
• Employer-sponsoredinsurance,thebackboneofcoverageformostColoradans, has not returned to 2009 levels. That year, 63.7 percent of Coloradans were covered by health insurance obtained through an employer. That percentage fell to 57.8 percent in 2011 and climbed 1.2 percentage points to 59.0 percent in 2013.
• NearlyoneoffiveColoradanshaspublichealthinsurance.ThepercentageofColoradans covered by public insurance programs – Medicare, Medicaid and Child Health Plan Plus (CHP+) – was unchanged in 2013 at 17.8 percent after a jump of 3.7 percentage points between 2009 and 2011.
High-Level Findings
OVERALL INSURANCE
Health Insurance Coverage, All Ages, 2009-2013
2009
2011
2013
n Employer-Sponsored Insurance n Medicare n Medicaid n CHP+ n Individual Insurance n Other Insurance n Uninsured
The ACA aims to get more people covered by some type of health insurance. The CHAS will show changes in the rates of coverage, as well as changes in the types of insurance obtained by Coloradans.
Health Reform
0.9% 0.8%
1.2% 0.8%
63.7% 7.3% 5.5%
1.3% 1.4%
13.5%7.3%
57.8% 9.2% 7.7% 7.7% 15.8%
59.0% 9.3% 7.3% 8.2% 14.3%

6 COLORADO HEALTH ACCESS SURVEY
2. Health Insurance Coverage by RegionWhere you live matters when it comes to health insurance coverage. CHAS results – broken down by Colorado’s 21 health statistics regions (HSRs) – reveal a wide range of coverage, from the highest levels of uninsurance in northwest Colorado to the lowest in affluent Douglas County. Looking below the surface allows an examination of levels of private insurance and public insurance, which often factor into whether a person has access to health care.
• Thenorthwestcornerofthestate(HSR11)hasthehighestpercentageof residents without coverage at 24.8 percent, meaning that one of four people is without health insurance. HSR 3 – Douglas County – has the lowest percentage of residents without health insurance at 5.4 percent.
• Only10.9percentofresidentsinHSR7–PuebloCounty–donothavehealth insurance, the fourth lowest uninsured rate in Colorado. But HSR 7 ranks second when it comes to the percentage of residents covered by public insurance – Medicare, Medicaid and CHP+ – at 26.5 percent. In this case, the high level of coverage is tied to the high rate of public insurance.
• Nearlyoneofthreeresidents(31.6percent)oftheSanLuisValley– HSR 8 – is covered by public insurance, the highest rate in the state.
• DouglasCountyhasthehighestpercentageofresidentscoveredbyprivateinsurance, which includes employer-sponsored insurance: 88.0 percent.
High-Level Findings
OVERALL INSURANCE
These data can help target efforts to educate Coloradans who may be eligible to purchase health insurance through Connect for Health Colorado. As more people gain insurance coverage, it will be important to monitor whether there are enough medical providers to provide adequate care.
Uninsured Rates by Health Statistics Region, 2013
Health Reform
HSRUninsured
# %1 9,480 15.3%
2 47,153 15.1%
3 16,474 5.4%
4 84,832 13.1%
5 3,689 9.3%
6 11,748 16.7%
7 17,643 10.9%
8 7,253 16.8%
9 14,232 15.2%
10 23,729 22.7%
11 10,919 24.8%
HSRUninsured
# %12 30,933 19.4%
13 10,148 12.8%
14 70,386 15.3%
15 100,013 16.9%
16 41,720 11.8%
17 7,522 13.8%
18 24,702 9.3%
19 26,853 18.5%
20 116,406 18.4%
21 65,024 11.6%
Colo. 740,862 14.3%
By the Numbers

7NOVEMBER 2013
3. Mental Health
75.0%
14.9%
3.2%
4.9%
2.0%
Mental health is essential to overall health. Across Colorado, providers are working to integrate primary and behavioral health care in an effort to help their patients achieve better health outcomes. The 2013 CHAS includes, for the first time, questions on mental health and access to care.
• Twenty-fivepercent–oneoffour–Coloradansexperiencedoneormoredays of poor mental health during the past 30 days. The survey defines poor mental health as including stress, depression or problems with emotions.
• Nearly8percentofColoradanssaidtheyneededmentalhealthservicesorcounseling services in the 12 months before the survey, but did not get them.
• Themostfrequentreasonsfornotgettingneededmentalhealthcarearerelated to cost – being uninsured, being worried about what insurance would cover and general concern about the cost of treatment. Respondents could identify more than one reason.
• Amongthosewhosaidtheydidnotgetneededmentalhealthservices,nearly one of three (31.0 percent) did not feel comfortable talking about personal problems with a health professional, indicating an ongoing stigma related to mental health.
You were uninsured*
You were concerned
about the cost of treatment
You did not think
your health insurance
would cover it**
Mental health and substance abuse disorder services are defined as essential health benefits in the ACA, meaning that most health plans will be required to cover these services starting in 2014. The CHAS will allow us to monitor changes in the number of people who report not getting needed mental health services and the reasons why.
n None n 1-9 Days n 10-19 Days
n 20-29 Days n All 30 Days
WHAT’S NEW
High-Level Findings
Number of Poor Mental Health Days During the Past 30 Days, Ages 5 and Older, 2013 If you didn’t seek needed mental health
care over the past 12 months, why?
77.5% 75.6% 53.3%
* Asked only of respondents who were uninsured at some point in the 12 months before the survey ** Asked only of respondents who were insured at some point in the 12 months before the survey
(all that apply)
Health Reform

8 COLORADO HEALTH ACCESS SURVEY
4. Long-Term Care Insurance At least 70 percent of people over the age of 65 will need long-term care – anything from help getting dressed to around-the-clock supervision in a nursing home, according to the Centers for Medicare & Medicaid Services. The 2013 CHAS, for the first time, asks Coloradans who are 50 and older whether they have long-term care insurance.
• AboutoneoffiveolderColoradans(22.1percent)report purchasing long-term care insurance. This is significantly higher than national estimates.
• Ofthe77.9percentofolderColoradanswhosaidtheydo not have long-term care insurance, the primary reason is cost (39.1 percent).
• Thesecondmostcitedreasonfornothavinglong-termcare insurance is the belief by older Coloradans that they will never need services (18.3 percent).
The ACA created a national long-term care insurance program called the Community Living Assistance Services and Support program, or CLASS Act. It was later repealed because of the challenges of financing such a large-scale effort. Still, with heightened awareness of long-term care insurance, coupled with aging of the Baby Boomers, policy discussions may return to this topic.
High-Level Findings
Do you currently have long-term care insurance from a private company?
YES22.1%
• Long-term care insurance costs too much 39.1% • You don’t think you will ever need services 18.3% • You don’t mind using your own income and assets to pay for the care you may need 1.7%
• You are not aware of this type of insurance/Don’t know what it is 1.6%
• You believe that Medicare will pay for long-term care services when you need them 1.4%
• You are waiting for better policies 1.2%
• If you need services, your family will take care of you 1.1%
• You currently get long-term care services through Medicare 0.7%
• You currently get long-term care services through Medicaid 0.7%
• You believe that Medicaid will pay for long-term care services when you need them 0.3%
NO77.9%
Reasons for not having long-term care insurance (all that apply)
WHAT’S NEW
Health Reform

9NOVEMBER 2013
5. Oral HealthOralhealthisstronglytiedtooverallhealth.Poororalhealthposeshealthrisks,especiallyforpregnantwomen and people with chronic disease. Colorado organizations have worked to deliver oral health services to vulnerable populations, especially children, while lawmakers have voted to extend oral health services to many Medicaid enrollees. The CHAS allows us to measure the impact of these efforts.
• ThepercentageofColoradanswhohavedentalinsurancein2013is61.6percent compared with 60.1 percent in 2011 and 63.0 percent in 2009. The 2013 rate is not statistically different from either 2011 or 2009.
• ThepercentageofColoradanswhouseddentalservicesin2013–65.2percent – is not statistically different from 2011 or 2009. However, the suggestion of a small uptick in both dental coverage and dental usage since 2011 reflects the association between having dental insurance and using dental services.
• ThemajorityofColoradansarecoveredbyemployer-sponsoredinsurance,which typically offers a separate dental insurance plan. Since 2011, coverage under CHP+, which has an oral health benefit, increased as well. This trend may be having a positive impact on dental coverage and use.
• Peoplewithoutdentalinsurance,aswellasthosewhosaidtheyhadn’tbeen to a dental professional in the 12 months before the survey, are more likely to rate their oral health as fair or poor – the two lowest options.Ofthe17.0percentofColoradanswhoratedthehealthoftheirteeth and gums as fair or poor, about four of 10 (41.7 percent) had dental insurance, 20 percentage points below the state average.
Two developments intended to increase dental insurance coverage and access to dental services will be important to measure with the CHAS data. The ACA requires most health insurance to offer pediatric dental options. Colorado will expand dental benefits for adults covered by Medicaid beginning in 2014.
High-Level Findings
WHAT’S NEW
2009 2011 2013
Oral Health Utilization and Insurance Status, 2009-2013
63.5% 65.2%
63.0% 60.1% 61.6%
Visited a dentist or dental hygienist in the prior 12 months Currently has dental insurance
66.4%
0%
20%
40%
60%
80%
100%
Health Reform

10 COLORADO HEALTH ACCESS SURVEY
6. Barriers to Receiving Health CareHaving a health insurance card makes it more likely that a person will get needed health care. But it is not a guarantee. The CHAS explores challenges faced by Coloradans – even insured Coloradans – in accessing health care, such as being unable to take time off work, having trouble finding a doctor who accepts their insurance, or simply not being able to pay for it.
• Somepeoplemaydecidenottoseekcarebecausetheydon’thaveinsurance. Nearly half (47.3 percent) of Coloradans who were uninsured at some point in the 12 months before the survey report that they did not try to make a medical appointment for this reason.
• ThehighcostofhealthcaredetersmanyColoradansfromreceivingtreatment when they need it. Citing cost, about one of five Coloradans (19.3 percent) report foregoing needed dental care, 12.3 percent did not seek a doctor’s care and 11.2 percent did not fill a prescription.
• Oneof10workingColoradans–CHASplacesadultsaswellaschildrenwith working parents in this category – report being unable to take time off work for an appointment at a doctor’s office or clinic.
The ACA aims to make health insurance more affordable, so future CHAS data will help measure the impact of the health reform law on affordability.
High-Level Findings
Barriers to Receiving Health Care, 2009-2013 (all that apply)
You couldn’t . . . 2009 2011 2013Fill a prescription that you needed due to cost 11.7% 12.0% 11.2%
Get doctor care that you needed due to cost 11.6% 13.3% 12.3%
Get specialist care that you needed due to cost 11.7% 12.5% 11.9%
Get dental care that you needed due to cost 21.9% 22.9% 19.3%
Get an appointment at the doctor’s office when you needed one
16.8% 16.4% 15.0%
Get an appointment because the doctor’s office wasn’t accepting patients with your type of health insurance
8.0% 9.4% 8.2%
Get an appointment because the doctor’s office wasn’t accepting new patients
8.0% 9.2% 8.4%
Find transportation to the doctor’s office/ it was too far away
NA NA 4.4%
Take off from work (asked of employed*) NA NA 10.1%
Find child care (asked only if had one child 14 or younger)
NA NA 4.0%
WHAT’S NEW
$COST
Health Reform
Of Coloradans uninsured at
some point in the year before
the survey didn’t seek an appointment
because they were uninsured.
47.3%
* CHAS places adults as well as children with working parents in this category

11NOVEMBER 2013
7. ChurnA lost job. A drop in income. Getting married. Changing life circumstances can affect health insurance eligibility and lead to “churn” – becoming insured or uninsured or changing types of insurance over the course of a year. Measuring how many Coloradans switch insurance types and status is important because it indicates how successful the health care system is at keeping people covered during transitions that can leave them vulnerable.
• ThreeoffourColoradans(76.7percent)indicatedthattheywerecoveredconsistently by the same health insurance in the 12 months prior to the survey.
• Morethanoneof10Coloradans(11.7percent)experiencedachangeinhealth insurance during the 12 months before the survey – 8.6 percent moving from insured to uninsured or from uninsured to insured and 3.1 percent changing insurance sources.
• Morethanoneof10(11.6percent)didnothavehealthinsuranceduringthe year before the survey. Many said they had been uninsured at least five years.
Churning will potentially become even more complex with new coverage sources that are based on income. The CHAS will be useful in monitoring churn as the ACA is implemented.
High-Level Findings
WHAT’S NEW
11.6%
2.5%
6.1%
3.1%
76.7%
Health Insurance Changes in the 12 Months Before the Survey, 2013
n Insured all of prior 12 months (same coverage)
n Currently insured, switched insurance at some point in the prior 12 months
n Currently insured, uninsured at some point in the prior 12 months
n Currently uninsured, insured at some point in the prior 12 months
n Uninsured all of prior 12 months
Health Reform

12 COLORADO HEALTH ACCESS SURVEY
8. Length of Time UninsuredProviding affordable insurance for people who have been chronically uninsured – either never having health insurance or going without health insurance for an extended period of time – is an aim of health reform efforts. People who are chronically uninsured often receive less preventive care, receive fewer early detection services and experience more complications from chronic conditions.
• Nearlyoneoffive(18.5percent)uninsuredColoradansreportthey were without health insurance for less than a year. These shorter gaps in coverage often occur as a result of waiting periods after changing jobs. Fluctuations in income and other life events may lead to lost or gained eligibility for public insurance, such as Medicaid, for short periods of time.
• Beingwithouthealthinsuranceonalong-termbasisismorecommon than short gaps in coverage. It is also a more difficult problem to solve. Four of five uninsured Coloradans have been without coverage for at least a year.
• AmonguninsuredColoradans,10.0percentreportneverhavingcoverage. This has declined from 14.3 percent in 2011.
CHAS will help measure how long-term uninsured Coloradans react to the individual mandate – the requirement that most Americans obtain health insurance or pay a penalty.Overtime,theCHASresultswill also measure the success of outreach and enrollment efforts, particularly for the chronically uninsured.
High-Level Findings
THE UNINSURED
Length of Time Without Health Insurance Coverage Among Uninsured Coloradans, 2009-2013
n 0-11 Months n 1-2 Years n 3+ Years n Never had coverage
21.2% 19.9% 18.5%
23.2% 18.4% 20.9%
47.4%42.4% 50.6%
13.2% 14.3% 10.0%
0%
20%
40%
60%
80%
100%
2009 2011 2013
Health Reform
13NOVEMBER 2013
THE UNINSURED
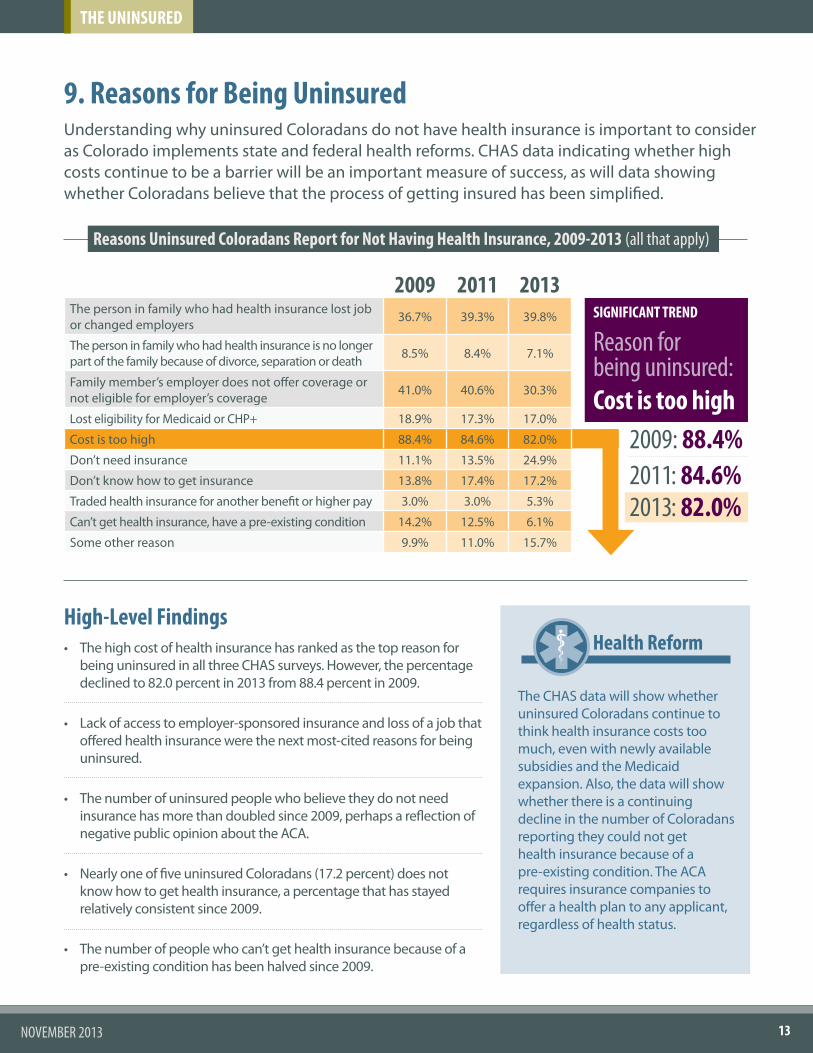
9. Reasons for Being UninsuredUnderstanding why uninsured Coloradans do not have health insurance is important to consider as Colorado implements state and federal health reforms. CHAS data indicating whether high costs continue to be a barrier will be an important measure of success, as will data showing whether Coloradans believe that the process of getting insured has been simplified.
• Thehighcostofhealthinsurancehasrankedasthetopreasonforbeing uninsured in all three CHAS surveys. However, the percentage declined to 82.0 percent in 2013 from 88.4 percent in 2009.
• Lackofaccesstoemployer-sponsoredinsuranceandlossofajobthatoffered health insurance were the next most-cited reasons for being uninsured.
• Thenumberofuninsuredpeoplewhobelievetheydonotneedinsurance has more than doubled since 2009, perhaps a reflection of negative public opinion about the ACA.
• NearlyoneoffiveuninsuredColoradans(17.2percent)doesnotknow how to get health insurance, a percentage that has stayed relatively consistent since 2009.
• Thenumberofpeoplewhocan’tgethealthinsurancebecauseofapre-existing condition has been halved since 2009.
High-Level Findings
Reasons Uninsured Coloradans Report for Not Having Health Insurance, 2009-2013 (all that apply)
The CHAS data will show whether uninsured Coloradans continue to think health insurance costs too much, even with newly available subsidies and the Medicaid expansion. Also, the data will show whether there is a continuing decline in the number of Coloradans reporting they could not get health insurance because of a pre-existing condition. The ACA requires insurance companies to offer a health plan to any applicant, regardless of health status.
SIGNIFICANT TREND
Reason for being uninsured:Cost is too high
2009: 88.4% 2011: 84.6% 2013: 82.0%
Reason 2009 2011 2013The person in family who had health insurance lost job or changed employers 36.7% 39.3% 39.8%
The person in family who had health insurance is no longer part of the family because of divorce, separation or death 8.5% 8.4% 7.1%
Family member’s employer does not offer coverage or not eligible for employer’s coverage 41.0% 40.6% 30.3%
Lost eligibility for Medicaid or CHP+ 18.9% 17.3% 17.0%
Cost is too high 88.4% 84.6% 82.0%
Don’t need insurance 11.1% 13.5% 24.9%
Don’t know how to get insurance 13.8% 17.4% 17.2%
Traded health insurance for another benefit or higher pay 3.0% 3.0% 5.3%
Can’t get health insurance, have a pre-existing condition 14.2% 12.5% 6.1%
Some other reason 9.9% 11.0% 15.7%
Health Reform

14 COLORADO HEALTH ACCESS SURVEY
10. Uninsured Rates by AgeHealth needs vary over a lifetime, making age an important factor to consider when looking at who is uninsured. Younger adults with fewer health concerns may feel less need for health care – and health insurance – than older adults. Age also influences access to health insurance, with working-age adults more likely to get coverage through an employer, and children and seniors often eligible for public programs.
• Colorado’schildrencontinuetoshowlowratesofuninsurance, dropping to 7.0 percent in 2013 from 8.2 percent in 2011. A number of policy decisions contribute to this trend, including generous state Medicaid eligibility guidelines for children and a 2009 state law that made more low-income children eligible for CHP+ coverage.
• Morethanoneoffouryoungadultsbetween19and26(27.1percent)do not have health insurance, meaning that this group, often called the “young invincibles,” has the highest rate of uninsurance in Colorado.
• Since2011,adultsbetween27and34experienceda6.4percentagepoint decline in their uninsured rate to 22.8 percent. Adults between 35 and 54 had a more modest decrease of 1.8 percentage points to 20.1 percent. A recovering economy and decreasing, but uneven, unemployment rates may explain this trend.
• Only1.0percentofColorado’sseniors,aged65andabove,donothavehealth insurance. This is a slight increase from 2009, but shows the continued impact of the Medicare program.
Much attention will be paid to the “young invincibles” to see if they decide to obtain health insurance or opt to pay a penalty. This will be important for the success of Connect for Health Colorado because younger, healthier people diversify the risk pool and offset some costs of insuring the chronically ill.
High-Level Findings
Uninsured Rates by Age, 2009-2013 Age Distribution, Uninsured Coloradans Versus All Coloradans, 2013
7.9%
22.6
%
22.9
%
18.0
%
10.7
%
0.2%
8.2%
26.3
% 29.2
%
21.9
%
13.6
%
0.8%
7.0%
27.1
%
22.8
%
20.1
%
13.7
%
1.0%
26.4%12.9%
10.1%19.2%
10.7% 17.1%
22.7% 32.0%
18.8%18.0%11.4%
2009 2011 2013
0.8%
10%
0%0%0-18 Years 19-26 Years 27-34 Years 35-54 Years 55-64 Years 65+ Years
All Coloradans Uninsured Coloradans
20%
20%
40%
60%
80%
100%30%
n 0-18 Years n 19-26 Years
n 27-34 Years n 35-54 Years
n 55-64 Years n 65+ Years
THE UNINSURED
Health Reform

15NOVEMBER 2013
11. Uninsured Rates by Race/Ethnicity Because people with health insurance are more likely to receive timely health services and tend to experience better health outcomes than those who are uninsured, analyzing health insurance coverage by race/ethnicity can provide important information about what drives health disparities in Colorado.
• Aboutoneof10non-Hispanicwhites(11.7percent)donothavehealthinsurance, a decline from 13.0 percent in 2011.
• HispanicColoradansaredisproportionatelyuninsured.Approximately 26 percent of the population identifies as Hispanic, but Hispanics represent 38.6 percent of the uninsured population.
• Whilenon-HispanicwhiteColoradanshavethelargestnumberofuninsured, Hispanics have the highest rates of uninsurance. More than one of five Hispanics (21.8 percent) are uninsured. This is not a significant difference from 2011.
Targeted approaches to outreach and enrollment will be an important factor in decreasing uninsured rates among racial/ethnic minorities.
High-Level Findings
THE UNINSURED
10.9
%
12.0
%
26.3
%
21.8
%
14.3
%
19.6
%
13.0
%
11.7
%
Race/Ethnicity Distribution, Uninsured Coloradans versus All Coloradans, 2013
Uninsured Rates by Race/Ethnicity, Colorado, 2009-2013
Non-Hispanic BlackNon-Hispanic White Hispanic
2009 2011 2013
0%
20%
40%
60%
80%
100%
10%
0%
20%
30%
24.1
%
All Coloradans Uninsured Coloradans
65.9%
3.0%
25.5%
5.6% 3.9%
38.6%
4.1%
53.4%
n Non-Hispanic White n Non-Hispanic Black n Hispanic n Other
Health Reform

16 COLORADO HEALTH ACCESS SURVEY
12. Uninsured Rates By IncomeIncome is strongly correlated with insurance status, and those living in poverty continue to have a much higher risk of being uninsured. While Colorado’s economy is improving, there have been major shifts in Coloradans’ income levels in recent years, with far more people falling below the poverty line since the CHAS was first administered in 2009.
• Lower-incomeColoradansaremorelikelytobeuninsured than Coloradans in higher income brackets. Coloradans up to 200 percent of FPL comprise 44.6 percent of the population, but 70.0 percent of the uninsured.
• Uninsuranceratesdroppedformostincomelevelsbetween 2011 and 2013. The biggest dip was for people at or below the poverty level, with the uninsurance rate declining to 22.0 percent from 28.3 percent, perhaps because Colorado passed legislation to expand Medicaid eligibility for adults in 2009. The one income bracket that saw uninsured rates rise was the group earning between 201 percent and 300 percent of FPL, with an increase to 15.1 percent from 11.4 percent.
The ACA aims to increase access to affordable health insurance for those at or below 400 percent of FPL by subsidizing plans purchased through Connect for Health Colorado. In addition, Colorado voted to expand Medicaid eligibility beginning January 1, 2014. It will be important to track whether these measures increase the rate of insurance among lower-income Coloradans.
High-Level Findings
27.2
%28
.3%
22.0
%
20.0
% 23.9
%23
.0%
11.6
%11
.4% 15
.1%
6.5% 8.
9%8.
0%
4.0%
3.7%
3.0%
Uninsured Rates by Federal Poverty Level, 2009-2013
Income Distribution, Uninsured Coloradans Versus All Coloradans, 2013
At or below 100% FPL
201- 300% FPL
301- 400% FPL
> 400% FPL
101- 200% FPL
2009 2011 2013
10%
0%
20%
30%
0%
20%
40%
60%
80%
100%
24.0%
20.6%
15.4%
14.8%
25.1%5.3%
8.3%16.3%
33.1%
36.9%
n At or below 100% FPL n 101-200% FPL n 201-300% FPL n 301-400% FPL n >400% FPL
All Coloradans Uninsured Coloradans
THE UNINSURED
Health Reform

17NOVEMBER 2013
13. Uninsured Rates by EmploymentBecause most Coloradans receive insurance through their employer, employment plays an important role in determining health insurance status. The CHAS data show that it often makes a difference whether a person works for a large or small employer.
• UnemployedColoradansaretwiceaslikelytobeuninsuredasthosewithjobs. Nearly half (43.5 percent) of Coloradans who are unemployed and looking for work do not have health insurance, compared to 19.3 percent of employed Coloradans and 12.6 percent of Coloradans not in the workforce.
• ThepercentageofemployedColoradanswithouthealthinsuranceincreased to 19.3 percent in 2013 from 14.8 percent in 2009, a possible indication that fewer employers offered coverage or that workers found they could not afford the coverage that was offered.
• Coloradanswhoworkforsmallbusinesseswith50orfeweremployeesare far more likely to be uninsured (32.5 percent) than those working for large businesses (10.9 percent).
• TheuninsurancerateofunemployedColoradansdroppedto43.5percent from 52.4 percent in 2009. The uninsurance rate of those not in the workforce declined to 12.6 percent from 18.2 percent.
How employers react to the ACA provisions relating to providing health insurance to their employees will be a crucial test for health reform efforts, particularly actions taken by small employers.
High-Level Findings
THE UNINSURED
9.0% 11
.0%
10.9
%
24.1
% 30.4
%
32.5
%
Uninsured Rates by Employment Status, Ages 19-64, 2009-2013
16.7
%
18.2
%
12.6
%
47.0
% 52.4
%
43.5
%
14.8
% 18.6
%
19.3
%
0%
20%
40%
60%
Unemployed, Looking for Work
Employed by Large Employer (>50 Employees)
Not in Workforce Employed
2009 2011 2013
Uninsured Rates by Employer Size, Ages 19-64, 2009-2013
Employed by Small Employer (0-50 Employees)
Health Reform

18 COLORADO HEALTH ACCESS SURVEY
14. UnderinsuranceUnderinsurance occurs when health insurance does not cover the costs of necessary medical expenses, leaving policy-holders with out-of-pocket costs that they can’t afford. For families earning at least 200 percent of FPL, the CHAS defines underinsurance as spending at least 10 percent of annual income on out-of-pocket medical expenses. For families below 200 percent of FPL, underinsurance is defined as spending at least five percent of annual income on out-of-pocket medical expenses.
• ThepercentageofunderinsuredColoradans has grown slightly to 13.9 percent in 2013 from 12.8 percent in 2011.
• Ruralpopulations–particularlythoseontheEastern Plains and in the southwest corner of the state – have the highest rates of underinsurance in Colorado. Denver County – HSR 20 – has one of the lowest rates of underinsurance at 11.1 percent.
High-Level Findings
AFFORDABILITY AND THE UNDERINSURED
The ACA requires individual and small group market plans to include coverage for a set of basic services known as essential health benefits, but the most basic plans could still leave policy-holders with large out-of-pocket expenses. In that case, the problem of underinsurance would continue. The CHAS will help to measure any changes in underinsurance in Colorado.
Underinsurance Rates by Health Statistics Region, 2013
Health Reform
HSRUnderinsured
# %1 14,055 22.7%
2 40,334 12.9%
3 44,880 14.7%
4 77,408 12.0%
5 8,262 20.8%
6 14,388 20.4%
7 21,113 13.1%
8 6,356 14.7%
9 19,645 20.9%
10 11,185 10.7%
11 5,495 12.5%
HSRUnderinsured
# %12 20,726 13.0%
13 12,314 15.5%
14 74,782 16.3%
15 72,701 12.3%
16 43,448 12.3%
17 9,167 16.8%
18 34,777 13.1%
19 22,559 15.6%
20 70,407 11.1%
21 96,361 17.2%
Colo. 720,361 13.9%
By the Numbers

19NOVEMBER 2013
AFFORDABILITY AND THE UNDERINSURED
Among those Coloradans who did face challenges in paying their medical bills, the 2013 CHAS asks how those challenges were addressed (all that apply)
15. Problems Paying Medical BillsLack of health insurance can put households at financial risk if costly medical services are needed. People who are underinsured – meaning their health insurance does not adequately protect against health care expenses – can also face challenges in accessing care. The CHAS data shed light on the extent of this phenomenon in Colorado.
• Since2009,theproportionofColoradanswhofacedproblemsor were unable to pay their medical bills has remained relatively stable. Around one-fifth of the population experiences these problems each year.
• However,amongColoradanswhoareuninsuredorunderinsuredthe rate was 35.1 percent and 27.5 percent, respectively, in 2013 (data not shown). These data suggest that addressing uninsurance and underinsurance would reduce the number of Coloradans who face challenges in paying medical bills.
• ThemostcommonwayinwhichColoradansattempttopaythesebills is by cutting back on savings or tapping their nest eggs. Among Coloradans who had problems paying their medical bills, 69.2 percent say they trimmed their savings. Nearly 43 percent were unable to pay for food, heat or rent due to their medical bills.
The ACA seeks to address underinsurance by requiring plans in the individual and small group markets to provide Essential Health Benefits and putting caps on cost sharing. Future CHAS data will help to show if these federal policy changes succeed in limiting Coloradans’ financial exposure to medical expenses.
High-Level Findings
Cut back on or took funds out
of savings
Were unable to pay for basic necessities like
food, heat or rent
Took on credit card debt
Added hours at their current job or took on
another job
69.2% 42.8% 42.6% 28.3%
Percentage of Coloradans Who Had Problems or Were Unable to Pay Their Medical Bills During the 12 Months Before the Survey, 2009-2013
200921.9%
201121.2%
201318.1%
1234 5678 1234 5678
JOECARDHOLDER12/15
12 123
4567
8910
11
Health Reform

20 COLORADO HEALTH ACCESS SURVEY
16. Coloradans’ Views on the Health Care SystemAs health care continues to evolve under state and federal health reforms, it is important to understand how Coloradans view the health care system – both in meeting the needs of their families and the needs of most Coloradans.
• ThemajorityofColoradans(69.1percent)agreethatthehealthcaresystem is meeting the needs of their families. These sentiments did not significantly change between 2011 and 2013.
• HealthinsurancestatusinfluencesColoradans’opinionsofthehealthcare system. Uninsured Coloradans are far more dissatisfied with the current health care system. Nearly two of three (65.5 percent) of the uninsured disagreed that the system is meeting the needs of their family, compared with 25.2 percent of insured Coloradans.
• Significantlyfewerpeople(44.1percent)feelthatthehealthcaresystem is meeting the needs of most Coloradans.
• However,between2011and2013therewasasignificantincreaseinthenumber of people who agreed that the current system is meeting the needs of most Coloradans, rising to 44.1 percent from 35.5 percent.
Because insured Coloradans tend to have more favorable perceptions of the health care system, it will be interesting to monitor whether perceptions of the health care system improve as more people gain coverage.
High-Level Findings
Coloradans’ Views on Whether the Health Care System Meets the Needs of Their Families, by Health Insurance Status, 2013
n Strongly Disagree
n Somewhat Disagree
n Somewhat Agree
n Strongly Agree
37.6%
12.1%
37.2%
22.3%
11.1%
17.8%
14.1%
47.7%
0%
20%
40%
60%
80%
100%
Insured Population Uninsured Population
AFFORDABILITY AND THE UNDERINSURED
Health Reform

21NOVEMBER 2013
17. Health Care Use and Usual Source of CarePeople who have a usual source of care – a place they go when they are sick, such as a doctor’s office or community health clinic – tend to have better access to timely health care. People who have a usual source of care also are less likely to be hospitalized for non-emergency care and more likely to see a primary care provider.
• FouroffiveColoradans(83.1percent)reportthattheyhaveausualsourceof care – a place they usually go when they are sick.
• Amongthosewithausualsourceofcare,morethanthreequartersindicatethat it is a doctor’s office or private clinic. Thirteen percent indicated that they normally go to a community health center or public health clinic.
• Sevenof10Coloradans(70.0percent)visitedageneraldoctorduringthe12monthsbeforethesurvey.Ofthosewhosawageneraldoctor,88.7percentsaid it was for a check-up, physical examination or other preventive care.
• InsuredColoradansaremuchmorelikelytohaveausualsourceofcareanduse health services compared to the uninsured. For example, 82.8 percent of insured Coloradans visited a health care professional in the 12 months before the survey compared to 51.1 percent of the uninsured.
The CHAS data show that insured Coloradans tend to use health services more frequently than the uninsured. If this trend continues as more Coloradans gain coverage under health reform, Colorado’s health care workforce may be challenged to provide adequate care.
High-Level Findings
Usual Source of Care by Place, 2013
83.1%Have Usual
Source of Care
78.6%Doctor’s office or private clinic
13.1%Community health center or public health clinic
0.5%A retail clinic like WalMart
3.1%Urgent care center
4.6%Some other place
0.2%Does not go to one place most often
16.9%No
Usual Source of Care
UTILIZATION AND HEALTH STATUS
Health Reform

22 COLORADO HEALTH ACCESS SURVEY
18. Usual Source of Care by RegionCHAS data help us to better understand whether Coloradans have access to care as opposed to simply having health insurance. Coloradans told us whether they have a place where they usually go when they are sick or need advice about their health, a place referred to as a usual source of care. The usual source of care indicator may help identify geographic health inequities in Colorado.
• ThepercentageofColoradanswhoreporthavingausualsourceofcaredeclined to 83.1 percent in 2013 from 87.4 percent in 2009.
• Thenortheastcornerofthestate–HSR1–hasthehighestreportedusualsource of care at 92.8 percent. This may be explained by the large proportion ofseniorsinthenortheast.Olderadultstendtoreportausualsourceofcaremore often than younger people.
• Incontrast,DenverCounty–HSR20–hasthelowestreportedratesofusualsource of care at 74.7 percent.
• Twoofthree(66.4percent)youngadultsbetweenages19and34reporthaving a usual source of care, compared to 87.8 percent of adults between 55 and 64 and 92.8 percent of seniors who are at least 65.
• Racialandethnicminoritiesarelesslikelytoreporthavingausualsourceofcare. Statewide, 85.4 percent of non-Hispanic whites report having a usual source of care, compared to 78.8 percent of Hispanics and 74.1 percent of non-Hispanic blacks.
High-Level Findings
UTILIZATION AND HEALTH STATUS
The ACA includes funding for a number of pilot projects to transform the delivery of health care, including testing models that provide incentives for providers to serve as medical homes. CHAS data will help to track whether more Coloradans get their care this way and whether it impacts access to care across the state.
Usual Source of Care Rates by Health Statistics Region, 2013
Health Reform
HSRUsual Source of Care
# %1 56,972 92.8%
2 55,303 82.3%
3 270,707 88.6%
4 539,938 83.9%
5 33,468 85.2%
6 61,951 88.1%
7 139,890 86.9%
8 33,211 77.3%
9 77,682 83.1%
10 84,838 81.2%
11 35,453 80.9%
HSRUsual Source of Care
# %12 133,326 83.6%
13 68,688 86.3%
14 382,664 83.4%
15 483,322 81.6%
16 291,610 82.6%
17 48,373 89.2%
18 221,778 84.0%
19 128,017 88.3%
20 466,819 74.7%
21 479,831 86.1%
Colo. 4,294,973 83.1%
By the Numbers

23NOVEMBER 2013
UTILIZATION AND HEALTH STATUS
19. Emergency Department UseEmergency departments (EDs) are a unique source of urgent medical care. They operate 24 hours a day, offer a wide variety of services and are legally required to examine each person who seeks care. While medical emergencies often require the resources available at an ED, non-emergency services often can be provided more cost-effectively, and with greater continuity of care, in other medical settings. Reducing use of the ED for non-emergency services is an important component of efforts to improve the health care system.
• ApproximatelyoneoffiveColoradans(19.5percent)reportedgettingcareatahospitalEDinthe12monthsbeforethesurvey.Ofthose,morethanhalf said this only happened once.
• Fourof10peoplewhoweretreatedinahospitalED(41.1percent)saidtheircondition could have been treated by a regular doctor.
• Ofthosewhosaidtheirconditioncouldhavebeentreatedbyaregulardoctor, more than one third (35.2 percent) said they called their doctor’s office or clinic first and were told to go to the ED.
• Approximatelytwoofthree(69.4percent)ColoradanssaidtheywenttotheED because they needed care after normal operating hours at the doctor’s office. Not being able to get a timely appointment and convenience were also cited as top reasons for visiting the ED for non-emergencies. Respondents could identify more than one reason why they went to the ED.
As providers work to control costs, many are focusing on patients who are frequent ED users, working with them to control their medical conditions and to encourage more preventive care. The CHAS will help us to measure whether these efforts are paying off with fewer ED visits.
High-Level Findings
Number of Visits to the Emergency Department in the 12 Months Before the Survey
1 OR MORE19.5%
NONE80.5%
58.9%Last visit was for an emergency
You were unable to get an appointment at the doctor’s office or clinic as soon as you
thought one was needed
You needed care after normal operating hours
at the doctor’s office
54.1% 69.4%
You called the doctor’s office or clinic and they told you to go to the emergency room
It was more convenient to go to
the emergency room
35.2% 56.1%
Last visit was for a condition that you thought could have been treated by a regular doctor*41.1%
* All that apply
Health Reform

24 COLORADO HEALTH ACCESS SURVEY
20. Health StatusColorado enjoys a reputation as a healthy state with healthy residents. Health status has implications for health insurance coverage and health care use. Health status can also impact decisions about whether to obtain health insurance coverage or seek treatment.
• Inmanyways,Coloradolivesuptoitsreputationasahealthystate. More than four of five (86.9 percent) Coloradans report their general health status as excellent, very good or good.
• ThepercentageofColoradansreportingtheirhealthasfairorpoor – the two worst statuses – declined to 13.1 percent from 15.2 percent in 2011.
• Examiningself-reportedhealthstatusbyrace/ethnicitycanprovide additional information on health disparities in Colorado. Two-thirds of non-Hispanic whites (66.9 percent) report their general health status as excellent or very good, compared to half of non-Hispanic blacks (53.0 percent).
The ACA includes a number of provisions intended to increase coverage and improve the quality of health care services, all designed to ultimately improve health status. The CHAS will allow us to monitor the impact these initiatives have on health status and health inequities in Colorado.
High-Level Findings
Self-Reported General Health Status, 2009-2013
Self-Reported General Health Status by Race/Ethnicity, 2013
2009 2011 2013
33.6%33.8%35.2%
30.9%29.7%30.4%
22.4%21.3%21.4%
9.4%11.0%9.3%3.7%4.2%3.7%
n Excellent n Very Good n Good n Fair n Poor
UTILIZATION AND HEALTH STATUS
0 0% %
20 20% %
40 40% %
60 60% %
80 80% %
100 100% %
34.9%16.7%
30.9%
32.0%
36.3%27.2%
21.7%31.1% 24.0%
8.2% 10.1% 13.1%3.2% 5.8% 4.9%
Non-Hispanic Black
Non-Hispanic White
Hispanic
Health Reform

25 COLORADO HEALTH ACCESS SURVEY
Notes

Notes


INFO
RMING
POLICY • ADVANCING
HEALT
H
COLO
RADO
HEALTH INSTITUTE
The Colorado Health Institute is a trusted source of independent and objective health information, data and analysis for the state’s health care leaders. Colorado Health Institute is funded by the Caring for Colorado Foundation, Rose Community Foundation, The Colorado Trust and The Colorado Health Foundation.
303 E. 17th Ave., Suite 930, Denver, CO 80203 • 303.831.4200 coloradohealthinstitute.org