2013 CEO Compensation Study
23
Current Developments in Association Compensation May 15, 2013 National Association of Manufacturers Council of Manufacturing Associations Charles W. Quatt, Ph.D. President Quatt Associates, Inc. 2233 Wisconsin Avenue, NW Suite 501 Washington, DC 20007 (202) 342 1000 x. 103 [email protected]
-
Upload
council-of-manufacturing-associations -
Category
Business
-
view
144 -
download
0
Transcript of 2013 CEO Compensation Study

Current Developments in Association Compensation
May 15, 2013
National Association of Manufacturers Council of Manufacturing Associations
Charles W. Quatt, Ph.D.PresidentQuatt Associates, Inc.2233 Wisconsin Avenue, NWSuite 501Washington, DC 20007(202) 342 1000 x. [email protected]

2
Discussion Topics
NAM CMA Survey Trends NAM CMA Survey New Data – CEO Compensation and Benefits Approaches to Market Pricing: Defining the Marketplace Using Survey Data Current Trends in Executive Compensation Governance Trends

3
NAM CMA Survey Trends Participation decreased slightly between 2012 and 2013 but still remains
high.
Number of Participants (by Year)
57
71 70 68
12 10 96
2010 2011 2012 2013
Operating Associations
Organizations Represented byAssociation ManagementCompanies

4
NAM CMA Survey Trends The participant group’s median operating budget increased dramatically in
2013. This change is primarily due to number of new participants.
Median Budget Among All Participants (by Year)
$4,500,000
$3,307,594$3,538,925
$5,300,000
2010 2011 2012 2013

5
NAM CMA Survey Trends Among organizations that participated for the last four years budgets have
steadily increased since 2010.
Median Budgets Among Common Participants (by Year)
2010 2011 2012 2013
$3,750,894
$4,237,849$4,424,700
$4,541,890
2010 to 2011 Change: 13%
2011 to 2012 Change: 4%
2012 to 2013 Change: 3%
Overall Change 2010-2013:
21%

6NAM Survey Trends among Four Year Survey Participants
Change in Average Total Cash Compensation 2010-2013 (Among 19
Common Participants)
Change/ 2010 to 2011
Change/ 2011 to 2012
Change/ 2012 to 2013
Overall Change 2010 to 2013
Chief Executive Officer 1.6% 5.9% 4.9% 12.4%
Second Highest Paid 4.8% 4.4% 3.4% 12.6%
Third Highest Paid 3.3% 5.7% 3.9% 12.9%

7NAM Survey Trends – Incentive Compensation Practices
Percentage Awarding Incentive Compensation 2010-2013 (All Participants
by Budgetary Category)
2010 2011 2012 2013 2010 2011 2012 2013 2010 2011 2012 2013
Chief Executive Officer 43% 67% 71% 79% 67% 65% 75% 79% 86% 88% 95% 95%
All Survey Positions 39% 60% 59% 63% 62% 61% 69% 74% 72% 82% 83% 87%
$2.5 to $7.5 MillionLess than $2.5 MillionGreater than $7.5
Million
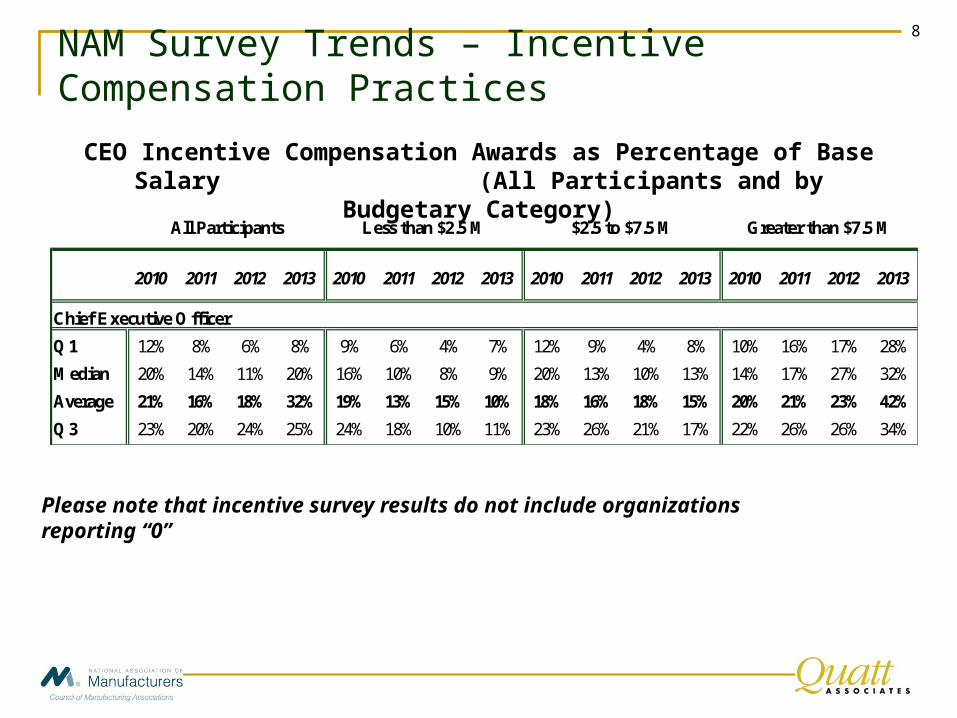
8NAM Survey Trends – Incentive Compensation Practices
CEO Incentive Compensation Awards as Percentage of Base Salary (All Participants and by Budgetary
Category)
Please note that incentive survey results do not include organizations reporting “0”
2010 2011 2012 2013 2010 2011 2012 2013 2010 2011 2012 2013 2010 2011 2012 2013
Chief Executive Officer
Q1 12% 8% 6% 8% 9% 6% 4% 7% 12% 9% 4% 8% 10% 16% 17% 28%
Median 20% 14% 11% 20% 16% 10% 8% 9% 20% 13% 10% 13% 14% 17% 27% 32%
Average 21% 16% 18% 32% 19% 13% 15% 10% 18% 16% 18% 15% 20% 21% 23% 42%
Q3 23% 20% 24% 25% 24% 18% 10% 11% 23% 26% 21% 17% 22% 26% 26% 34%
Greater than $7.5 M$2.5 to $7.5 MLess than $2.5 MAll Participants

9NAM Survey Trends – Incentive Compensation Practices
Executive Incentive Compensation Awards as Percentage of Base Salary (All Participants and by Budgetary
Category)
Please note that incentive survey results do not include organizations reporting “0”
2010 2011 2012 2013 2010 2011 2012 2013 2010 2011 2012 2013 2010 2011 2012 2013
Executives
Q1 4% 5% 4% 6% 2% 2% 2% 3% 4% 4% 3% 4% 9% 5% 12% 15%
Median 8% 7% 10% 11% 3% 4% 4% 5% 7% 6% 6% 7% 11% 8% 13% 17%
Average 13% 14% 16% 21% 6% 5% 7% 8% 10% 12% 14% 16% 16% 16% 19% 21%
Q3 14% 9% 14% 16% 6% 8% 9% 9% 11% 8% 10% 12% 15% 18% 17% 20%
All Participants Less than $2.5 M $2.5 to $7.5 M Greater than $7.5 M

10NAM Survey Trends – CEO Deferred Compensation
Percentage Awarding Deferred Compensation 2013 (All Participants
and by Budgetary Category)All Participants Less than $2.5
Million$2.5 to $7.5 Million Greater than $7.5
Million
n 16 of 58 2 of 19 4 of 19 10 of 20
Percentage Providing 28% 7% 21% 50%
Median Award $30,000 na* $34,625 $72,840
Median Award as Percentage of Salary 13% na* 15% 17%
Average Award $65,473 na* $28,917 $87,207
Average Award as Percentage of Salary 20% na* 12% 16%
*Insufficient data to report
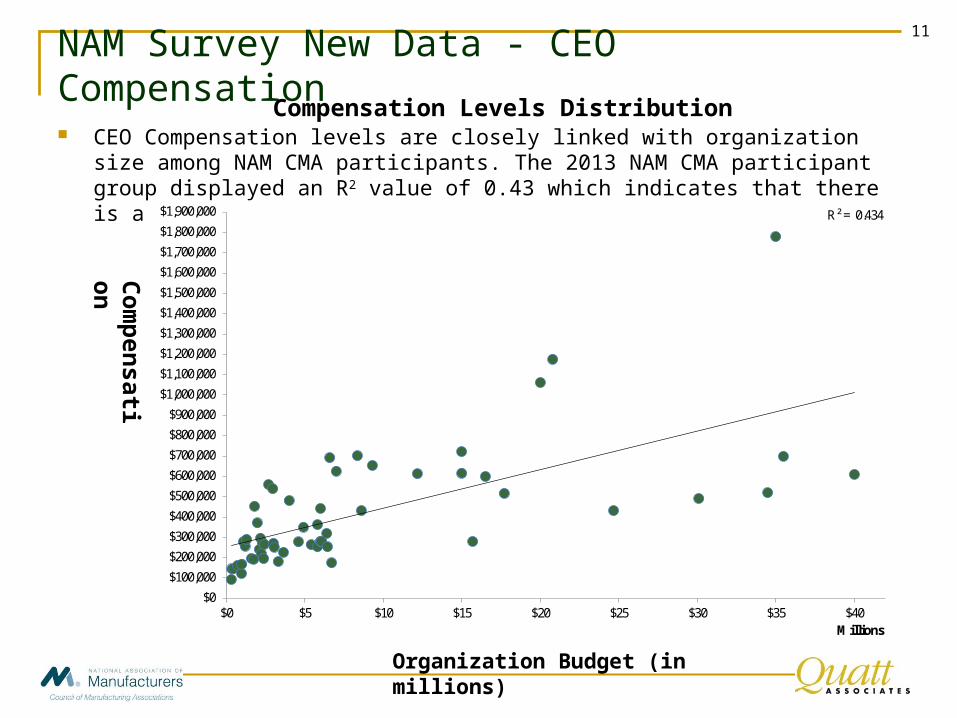
11NAM Survey New Data - CEO Compensation
Compensation Levels Distribution CEO Compensation levels are closely linked with organization size among
NAM CMA participants. The 2013 NAM CMA participant group displayed an R2 value of 0.43 which indicates that there is a correlation between budget size and compensation levels.
Com
pen
sat
ion
Organization Budget (in millions)
R² = 0.434
$0
$100,000
$200,000
$300,000
$400,000
$500,000
$600,000
$700,000
$800,000
$900,000
$1,000,000
$1,100,000
$1,200,000
$1,300,000
$1,400,000
$1,500,000
$1,600,000
$1,700,000
$1,800,000
$1,900,000
$0 $5 $10 $15 $20 $25 $30 $35 $40Millions

12NAM Survey New Data - CEO Compensation
CEO Total Compensation 2013 marks the first time we are able to report on CEO total
compensation which includes the value of all benefits and perquisites in addition to cash awards and salary.
n Median Average
Total Compensation ** 56 $293,029 $416,692
Total Compensation ** 19 $218,467 $229,494
Total Compensation ** 19 $280,594 $339,668
Total Compensation ** 18 $613,976 $695,593
** Total Compensation includes base salary, extra cash compensation (incentive or bonus), as well as the reported value of all benefits and perquisites provided by the organization on the CEO's behalf.
All Associations (Median Budget = $5,059,075)
Budgets less than $2.7 million (Median Budget = $1,600,000)
Budgets from $2.7 to $6.9 million (Median Budget = $5,200,000)
Budgets greater than $6.9 million (Median Budget = $20,000,000)

13
NAM Survey New Data - CEO BenefitsCEO Benefits
2013 also marks the first time we are able to report on CEO benefits and their associated value.
The data provided by participants for defined benefit and defined contribution plans is of particular interest.
All Associations (Median Budget = $5,059,075)n % Q1 Median Q3 Average
Defined Benefit (Pension) Plans
Does your organization provide a defined benefit (pension) plan?Yes 6 11%No 50 89%
Defined Contribution Plans
Does your organization provide a defined contribution plan to the CEO?
Yes 54 95%
No 3 5%
Total defined retirement contribution from organization as percentage of base salary-All Respondents
48 84% 4.1% 6.5% 10.0% 7.1%
Among organizations with budgets less than $2.7 million 15 26% 5.0% 8.0% 10.0% 7.2%
Among organizations with between $2.7 and $6.9 million 16 28% 3.3% 6.0% 9.0% 6.5%
Among organizations with budgets greater than $6.9 million 17 30% 5.3% 8.0% 10.0% 7.5%

14
Approaches to Market Pricing: Defining the Marketplace Defining the peer group of market comparators is the most crucial step in
market pricing as the selection of the peer group has received increasing scrutiny by Board members, the public, and other stakeholders.
Factors in developing an accurate and defensible comparator peer group: Organizations with similar
Mission Location Scope
Budget Staff size
Impact Similar talent pool for executive attraction/retention
Specific characteristics of the executive Work history, professional background, other (e.g., political
background) Education and experience requirements Time in position

15
Approaches to Market Pricing: Defining the Marketplace Peer group selection in not-for-profit organizations can be challenging Starting with specific criteria is essential when creating an appropriate
and relevant peer group
Typically it is helpful to develop a market pricing protocol tailored to the position or category of positions reflective of the labor market for talent
Element Potential Approaches
Mission and Sector
Potential organizations should be within similar industry sector and they should have comparable types of operations
Scope The peer group should reflect the size of the organization in:
Revenue/operating budget
Number of employees
The selected group may reflect the organization’s current size as well as its projected size
Labor Market Labor markets in which the organization currently (or in the future) competes for talent may be taken into consideration in the peer group
This may result in different peer groups for different types and levels of positions in an organization
Geographic Locations
Where the organization is located may also be a consideration in developing a peer group:
Note that executive positions typically have a national reference market; geographic location is more relevant below the executive level
Degree of Complexity
The peer group should also reflect the organization’s mission and the complexity of fulfilling that mission

16
Using Survey Data Understand the database Ensure sufficient number of data points Identify the most comparable positions in the survey Understand use of base salary versus total cash compensation in selecting
survey data

17
Setting Executive Compensation Levels When setting compensation levels for the CEO and other senior positions,
consider:
Compensation philosophy
Organization financial status and affordability of executive compensation
Internal pay practices among executives and staff
Board opinion

18
Broader Marketplace Trends vs. NAM CMA Members – Base Salary
Projected Salary Increase Comparison (2011-2013):
Total Salary Increases 2 2011 Projected Data (Obtained in October 2010)
2012 Projected Data (Obtained in October 2011)
2013 Projected Data (Obtained in October 2012)
General NFP Chief Executive 3.0% 3.0% 3.0%
NAM CMA Members Only 3.0% 3.0% 3.5%
General NFP Executives 3.0% 3.0% 3.0%
NAM CMA Members Only 3.0% 3.0% 3.0%
General NFP Staff 3.0% 3.0% 3.0%
NAM CMA Members Only 3.0% 3.0% 3.5%
Percentage of NFP Organizations Holding Salaries Flat
8.8% 5.9% 5.7%
NAM CMA Members Only 6.4% 4.7% 3.1%
Median Results of Quatt Associates Salary Planning Survey1
1 Data are salary increases measured as a percentage of salary budget, not as a percentage of incumbent salary.2 Results include organizations reporting holding salaries flat.

19Broader Marketplace Trends – Annual Incentive Continued and growing use of incentive compensation plans. Focus on ensuring:
Goals are defined relative to mission and strategy.
Incentive levels are supported by meeting financial goals
Plan is driving the right types of results and leadership behaviors
Incentive payouts (individually and in total) correspond to the level of performance achieved
More organizations are using formal, objective-based, formula-driven plans rather than subjective methodologies to determine awards
The best formula-driven plans have formal plan documents and define:
Formal tie between performance goals and the compensation plan
Measurements for success – both an institutional “scorecard” and a leadership assessment score

20
Broader Marketplace Trends – Governance
Increased level and demands of governance related to executive compensation and performance assessment due to:
Increased availability of compensation information through the new 990 reporting requirement
Significantly greater scrutiny of compensation data by the public, stakeholders, the press, government and internal staff
Board Committees, not individual Board Chair, making decisions
Greater engagement of full Board
New 990’s ask if all Board members have received the 990.
Greater practice in documenting compensation philosophy, system, annual performance and decision processes
Documented defensibility

21Board Compensation Decision Making Factors Factors for determining appropriate executive compensation
Market value of the position
Pay trends in the sector in which board members and stakeholders operate
Compensation trends among peer organizations and in the geographical area
Contract terms and compliance with the established compensation philosophy and compensation system, including the pay for performance system
The performance of the organization, including its financial performance
Staff compensation practice, for example the differential between executive compensation and staff compensation
Perceived fairness on the part of observers, including:
The Board members
The stakeholders
The public

22
Quatt Associates Background Information Quatt Associates is a management consulting firm dedicated to serving the not-for-
profit sector. Our practice includes:
Executive compensation systems, including performance-based award plans and deferred compensation plans. We also conduct intermediate sanctions reviews, including analysis of compensation and benefits practices. We have published a book on executive compensation for not-for-profit organizations, Nonprofit Executive Compensation: Planning, Performance, and Pay.
Executive performance systems. We assist organizations in establishing institutional and executive performance objectives and measures, including development of leadership assessment processes and tools. We also develop guidelines and processes for boards of directors to assess and manage executive performance.
Job classification, salary administration, and compensation systems, including career pathing systems, customized reward systems, and performance-based compensation systems. We conduct annual compensation surveys of not-for-profit organizations.
Assisting organizations in establishing staff performance objectives measures and systems. We provide training on performance management and coaching to ensure effective program implementation.
Conducting strategic and business process planning and working with boards on effective board management and development.
Working with both individual executives and leadership teams to improve their effectiveness in managing the organization. We develop succession planning programs to support effective institutional development and management succession.

23
Quatt Associates Contact Information
Charles W. Quatt, Ph.D.
President
Quatt Associates, Inc.
2233 Wisconsin Avenue, NW
Suite 501
Washington, DC 20007
(202) 342 1000 x. 103
Jonathan Covington
Consultant
Quatt Associates, Inc.
2233 Wisconsin Avenue, NW
Suite 501
Washington, DC 20007
(202) 386 7624