2013 Bicycle Collision Summary - City of Phoenix Home Home 2013 BICYCLE COLLISION SUMMARY 3 The 2013...
29
2016 Bicycle Collision Summary TRAFFIC SERVICES DIVISION TRAFFIC SAFETY SECTION DECEMBER 2017 2016 BICYCLE COLLISION SUMMARY
-
Upload
nguyenkiet -
Category
Documents
-
view
217 -
download
2
Transcript of 2013 Bicycle Collision Summary - City of Phoenix Home Home 2013 BICYCLE COLLISION SUMMARY 3 The 2013...
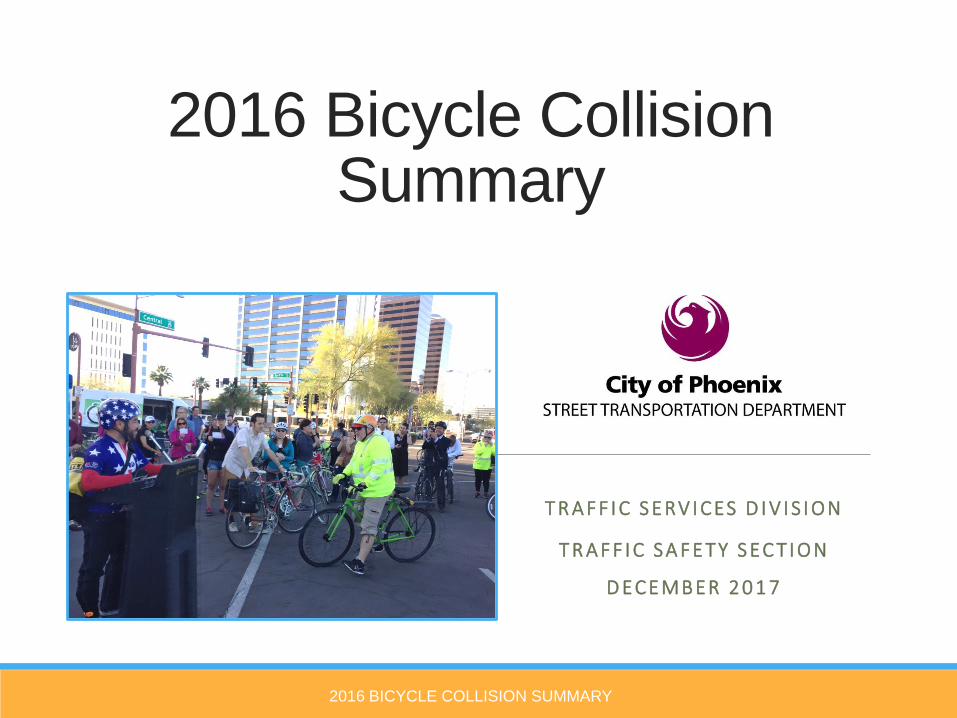
2016 Bicycle Collision Summary
T R A F F I C S E RV I CES D I V I S I ON
T R A F F I C S A F E T Y S EC T I O N
D ECEMB ER 2 0 1 7
2016 BICYCLE COLLISION SUMMARY
2016 BICYCLE COLLISION SUMMARY
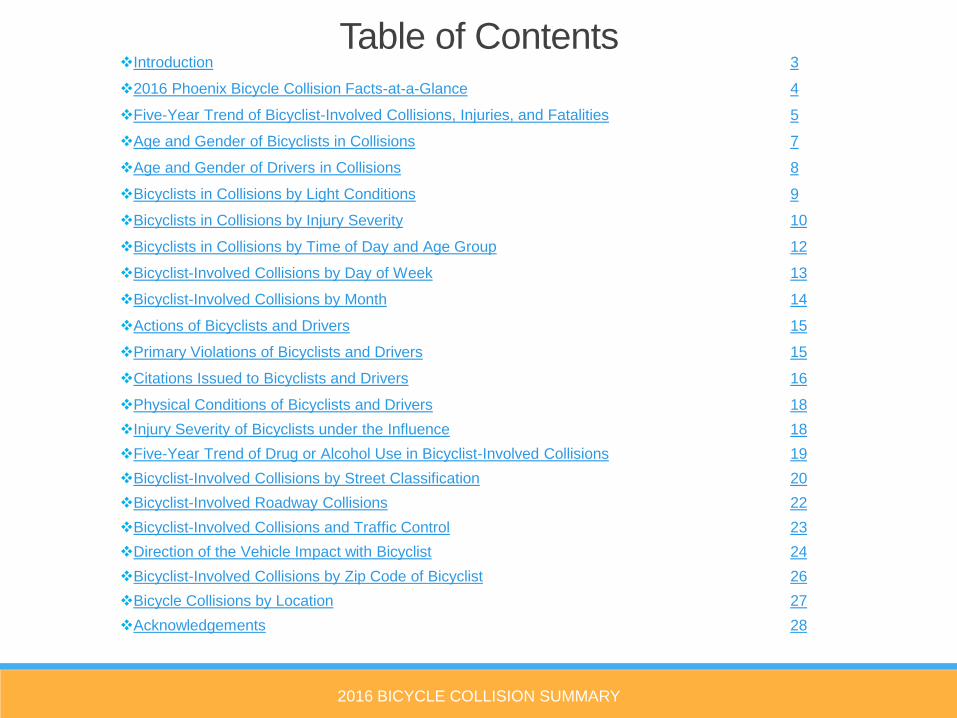
Introduction 3
2016 Phoenix Bicycle Collision Facts-at-a-Glance 4
Five-Year Trend of Bicyclist-Involved Collisions, Injuries, and Fatalities 5
Age and Gender of Bicyclists in Collisions 7
Age and Gender of Drivers in Collisions 8
Bicyclists in Collisions by Light Conditions 9
Bicyclists in Collisions by Injury Severity 10
Bicyclists in Collisions by Time of Day and Age Group 12
Bicyclist-Involved Collisions by Day of Week 13
Bicyclist-Involved Collisions by Month 14
Actions of Bicyclists and Drivers 15
Primary Violations of Bicyclists and Drivers 15
Citations Issued to Bicyclists and Drivers 16
Physical Conditions of Bicyclists and Drivers 18
Injury Severity of Bicyclists under the Influence 18
Five-Year Trend of Drug or Alcohol Use in Bicyclist-Involved Collisions 19
Bicyclist-Involved Collisions by Street Classification 20
Bicyclist-Involved Roadway Collisions 22
Bicyclist-Involved Collisions and Traffic Control 23
Direction of the Vehicle Impact with Bicyclist 24
Bicyclist-Involved Collisions by Zip Code of Bicyclist 26
Bicycle Collisions by Location 27
Acknowledgements 28
Table of Contents

Introduction
2016 BICYCLE COLLISION SUMMARY 3Home
The 2016 Bicycle Collision Summary provides a brief analysis of bicycle collision statistics related to demographics,
accident types, and locations. The report also includes collision data from 2012 through 2016 to identify and track
bicycle collision trends that have emerged during the past five years. These statistics provide a strong indication of
roadway behaviors that negatively impact bicyclists’ safety and helps identify which violations should be prioritized
for increased education and enforcement.
The 2016 collision summary includes a reported 515 bicycle-related collisions resulting in 468 injuries and 8
fatalities. These bicycle-related collisions accounted for nearly 2 percent of all collisions, 3 percent of all injuries,
and 4 percent of all fatalities occurring on City Streets. Statistics show the number of collisions has increased (13
percent) as compared to the 2015 collisions, the 5-year trend is increasing. Consistent with previous years, male
bicyclists were involved in more collisions at a male:female ratio of 3.3:1. Also, the age groups with the highest
number of bicycle-related collisions were adults between the ages of 26 and 35. The majority (74 percent) of
collisions occurred within 150 feet of an intersection.
The findings in this report are used to inform and influence the design of new bicycle facilities, the redesign of
existing roadways, the development of education programs and enforcement campaigns for bicyclists and motorists.
In an effort to identify locations and collision trends that may require special attention, this report also identifies
intersections and street segments with the highest annual bicycle injury collisions.
NOTE: Some figures in the 2016 Bicycle Collision Summary differ from the 2016 Traffic Collision Summary due to the detailed analysis of
crash reports.
2016 Phoenix Bicycle Collision Facts-at-a-Glance
2016 BICYCLE COLLISION SUMMARY 4Home
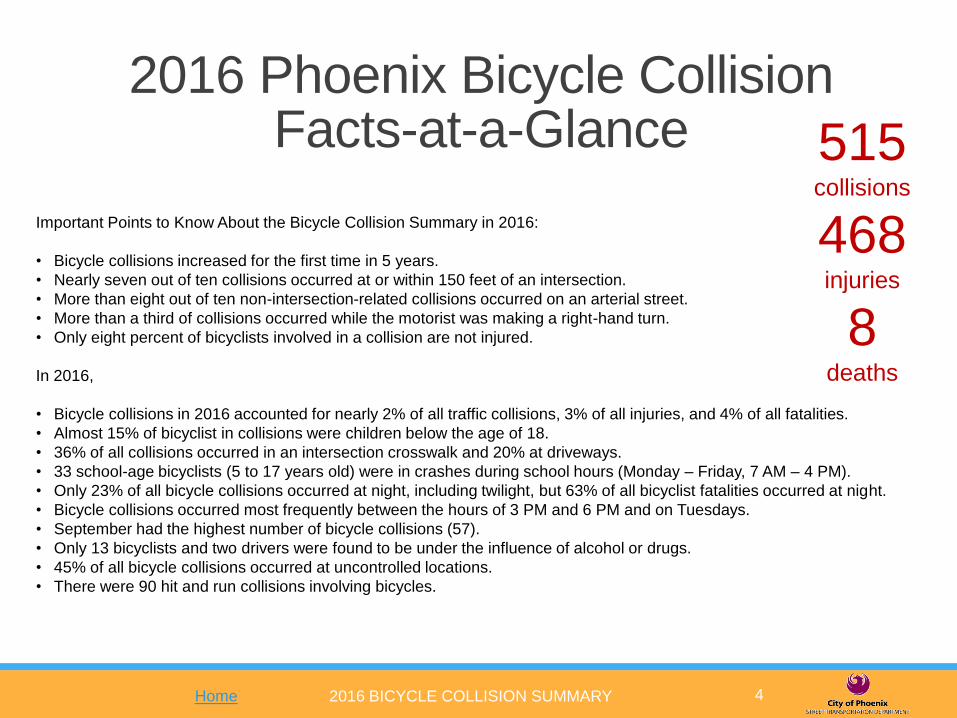
Important Points to Know About the Bicycle Collision Summary in 2016:
• Bicycle collisions increased for the first time in 5 years.
• Nearly seven out of ten collisions occurred at or within 150 feet of an intersection.
• More than eight out of ten non-intersection-related collisions occurred on an arterial street.
• More than a third of collisions occurred while the motorist was making a right-hand turn.
• Only eight percent of bicyclists involved in a collision are not injured.
In 2016,
• Bicycle collisions in 2016 accounted for nearly 2% of all traffic collisions, 3% of all injuries, and 4% of all fatalities.
• Almost 15% of bicyclist in collisions were children below the age of 18.
• 36% of all collisions occurred in an intersection crosswalk and 20% at driveways.
• 33 school-age bicyclists (5 to 17 years old) were in crashes during school hours (Monday – Friday, 7 AM – 4 PM).
• Only 23% of all bicycle collisions occurred at night, including twilight, but 63% of all bicyclist fatalities occurred at night.
• Bicycle collisions occurred most frequently between the hours of 3 PM and 6 PM and on Tuesdays.
• September had the highest number of bicycle collisions (57).
• Only 13 bicyclists and two drivers were found to be under the influence of alcohol or drugs.
• 45% of all bicycle collisions occurred at uncontrolled locations.
• There were 90 hit and run collisions involving bicycles.
515collisions
468injuries
8deaths

Five Year Trend All CrashesIn thousands
2016 BICYCLE COLLISION SUMMARY 5Home
Key Note:
The 10 year average
is 477 collisions.
Five-Year Trend of Bicyclist-Involved Collisions, Injuries, and Fatalities
21.7 22.725.9
27.730.3
0.0
10.0
20.0
30.0
40.0
2012 2013 2014 2015 2016
2016 BICYCLE COLLISION SUMMARY 6Home
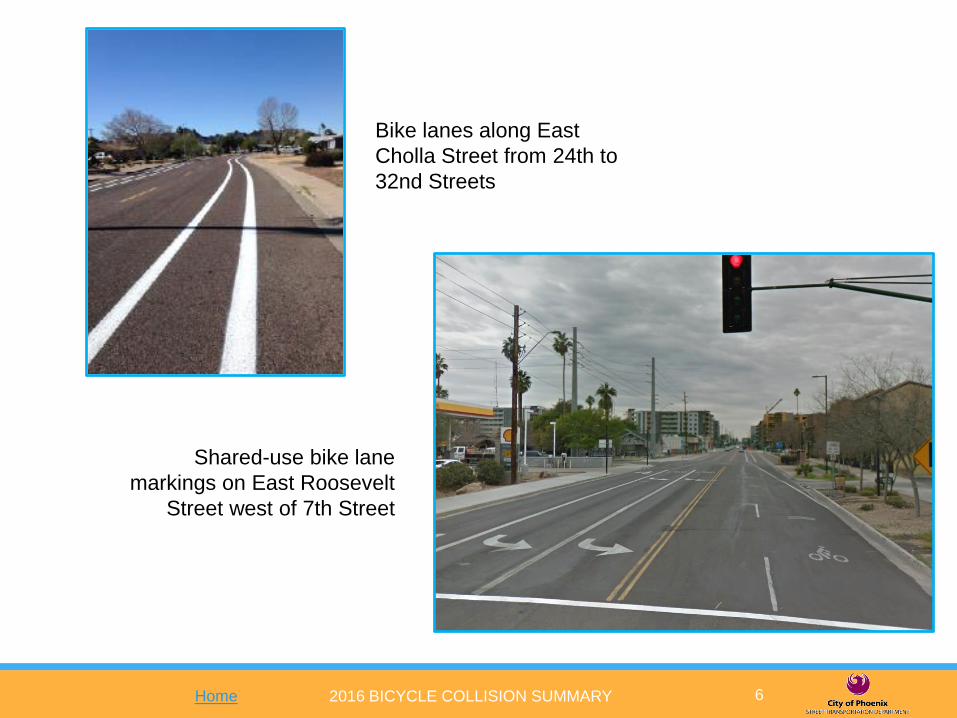
Bike lanes along East
Cholla Street from 24th to
32nd Streets
Shared-use bike lane
markings on East Roosevelt
Street west of 7th Street

2016 BICYCLE COLLISION SUMMARY 7Home
Age and Gender of Bicyclists in Collisions
No Injury Injury Fatal Total
Unknown 1 0 0 1
Female 4 115 1 120
Male 34 353 7 394
Total 39 468 8 515
Key Note:Children (below 18 years of age) account for 15% of all bicycle
collision victims

4
40
48
45
53
42
19
16
3
35
42
40
32
15
19
7 55
0 10 20 30 40 50 60 70 80 90 100
Up to
17
18
- 2
526
- 3
536
- 4
546
- 5
556
- 6
566
- U
pU
nkno
wn
Driver
Male : Female
1.4 : 1
Note: There were 90 hit and runs.
UnknownFemaleMale
2016 BICYCLE COLLISION SUMMARY 8Home
Age and Gender of Drivers in Collisions

Bicyclists in Collisions by Light Conditions
2016 BICYCLE COLLISION SUMMARY 9Home
Citywide Total Collisions

Minor, 44%
Possible, 32%
None 7%
Serious, 15%
Fatal, 2%
2016 BICYCLE COLLISION SUMMARY 10Home
Bicyclists in Collisions by
Injury SeverityKey Note:
There were 229 minor
injuries, 75 serious injuries,
and 8 fatalities.
Note: This collision summary accounts for bicycle collisions with vehicles, not single bicycle collisions or two-bicycle collisions.

2016 BICYCLE COLLISION SUMMARY 11Home
North 12th Street south of East Camelback Road
Before / After Buffered Bike Lanes – March 2016

2016 BICYCLE COLLISION SUMMARY 12Home
Bicyclist-Involved Collisions by Time of Day
and Age Group
1
168 13
2213
18 12
62
61
76
118
70
26
2
1
3
1
0
20
40
60
80
100
120
140
12AM - 3AM 3AM - 6AM 6AM - 9AM 9AM - 12PM 12PM - 3PM 3PM - 6PM 6PM - 9PM 9PM - 12AM
Bic
yc
lis
ts
Time of Day
Unknown Age
Adults (18 years old and up)
Children (17 year old and under)
1
Key Note: 1/8 fatalities occurred after 5PM.
2016 BICYCLE COLLISION SUMMARY 13Home
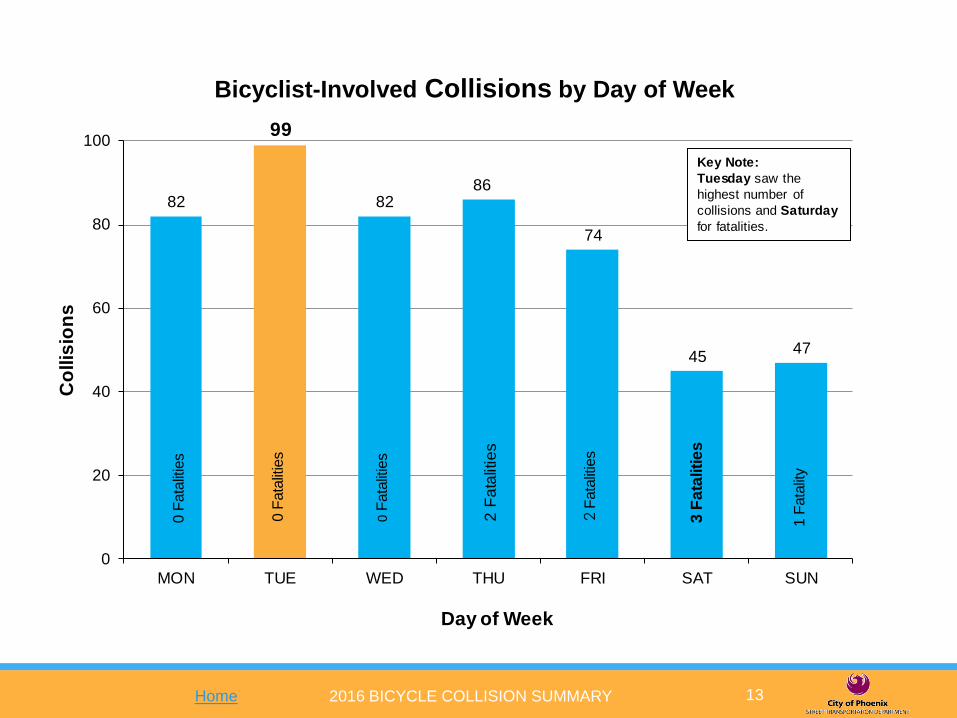
Bicyclist-Involved Collisions by Day of Week
82
99
8286
74
4547
0
20
40
60
80
100
MON TUE WED THU FRI SAT SUN
Co
llis
ion
s
Day of Week
0 F
ata
litie
s
0 F
ata
litie
s
0 F
ata
litie
s
2 F
ata
litie
s
1 F
ata
lity
2 F
ata
litie
s
3 F
ata
liti
es
Key Note:
Tuesday saw the
highest number of
collisions and Saturday
for fatalities.

2016 BICYCLE COLLISION SUMMARY 14Home
Bicyclist-Involved Collisions by Month
48
44
51
44
35
46
24
48
57
4244
32
0
10
20
30
40
50
60
70
JAN FEB MAR APR MAY JUN JUL AUG SEP OCT NOV DEC
Co
llis
ion
s
Month
0 F
ata
litie
s
1 F
ata
lity
2 F
ata
liti
es
1 F
ata
lity
0 F
ata
litie
s
2 F
ata
liti
es
1 F
ata
lity
0 F
ata
litie
s
1 F
ata
lity
0 F
ata
litie
s
0 F
ata
litie
s
0 F
ata
litie
s
Key Note:
36% increased collisions
in September from
2015.
2016 BICYCLE COLLISION SUMMARY 15
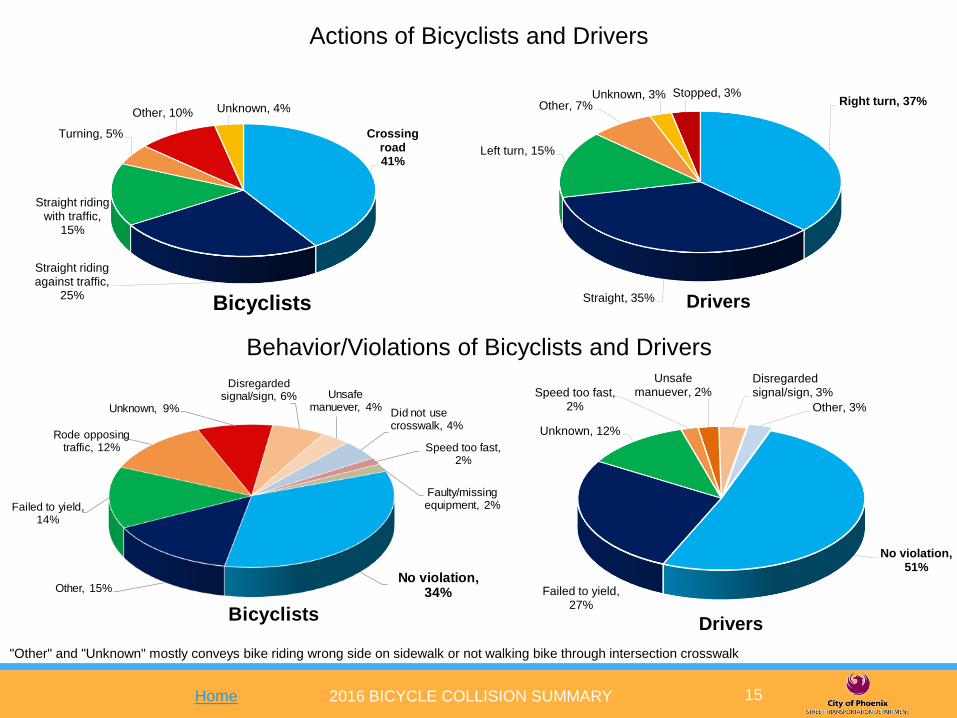
Actions of Bicyclists and Drivers
Home
"Other" and "Unknown" mostly conveys bike riding wrong side on sidewalk or not walking bike through intersection crosswalk
Crossing road41%
Straight riding against traffic,
25%
Straight riding with traffic,
15%
Turning, 5%
Other, 10% Unknown, 4%
Bicyclists
Right turn, 37%
Straight, 35%
Left turn, 15%
Other, 7%Unknown, 3% Stopped, 3%
Drivers
No violation, 51%
Failed to yield, 27%
Unknown, 12%
Speed too fast, 2%
Unsafe manuever, 2%
Disregarded signal/sign, 3%
Other, 3%
Drivers
No violation, 34%Other, 15%
Failed to yield, 14%
Rode opposing traffic, 12%
Unknown, 9%
Disregarded signal/sign, 6% Unsafe
manuever, 4%Did not use crosswalk, 4%
Speed too fast, 2%
Faulty/missing equipment, 2%
Bicyclists
Behavior/Violations of Bicyclists and Drivers
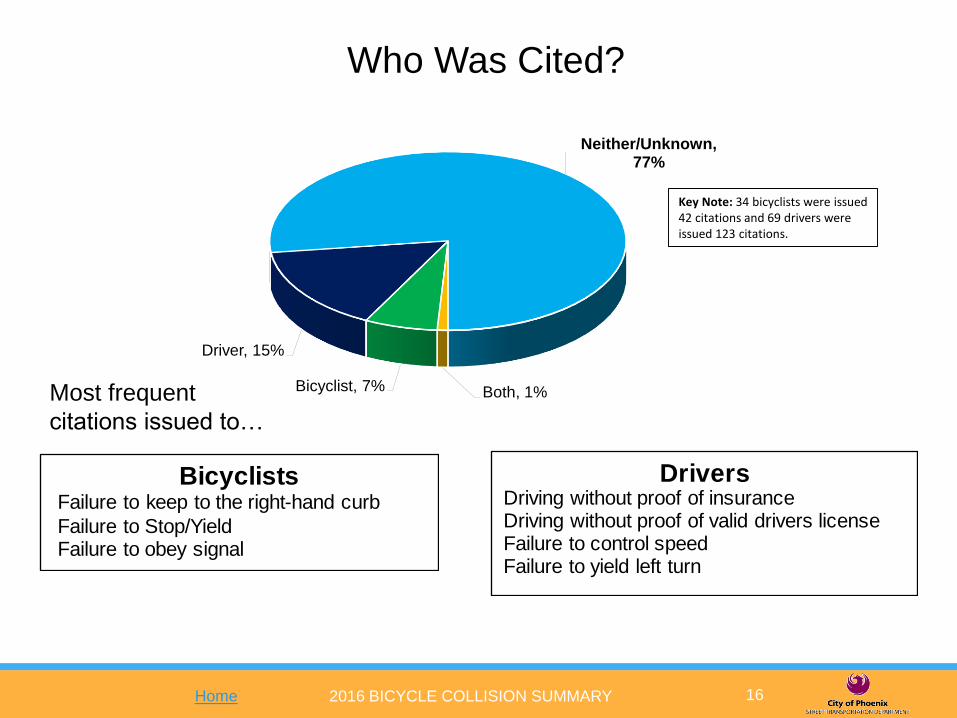
Both, 1%Bicyclist, 7%
Driver, 15%
Neither/Unknown, 77%
2016 BICYCLE COLLISION SUMMARY 16
Who Was Cited?
Most frequent
citations issued to…
Home
BicyclistsFailure to keep to the right-hand curb
Failure to Stop/YieldFailure to obey signal
DriversDriving without proof of insuranceDriving without proof of valid drivers licenseFailure to control speedFailure to yield left turn
Key Note: 34 bicyclists were issued 42 citations and 69 drivers were issued 123 citations.

2016 BICYCLE COLLISION SUMMARY 17Home
Bike to School Events - April / May 2016
District 7 Community Bike and
Safety Event in April 2016 at Food
City Shopping Center located on
SWC of 7th / Southern Avenues.
Eagle Ridge Elementary “Bike to
School Day” Event in May 2016 at
12th Street / Wahalla Lane.
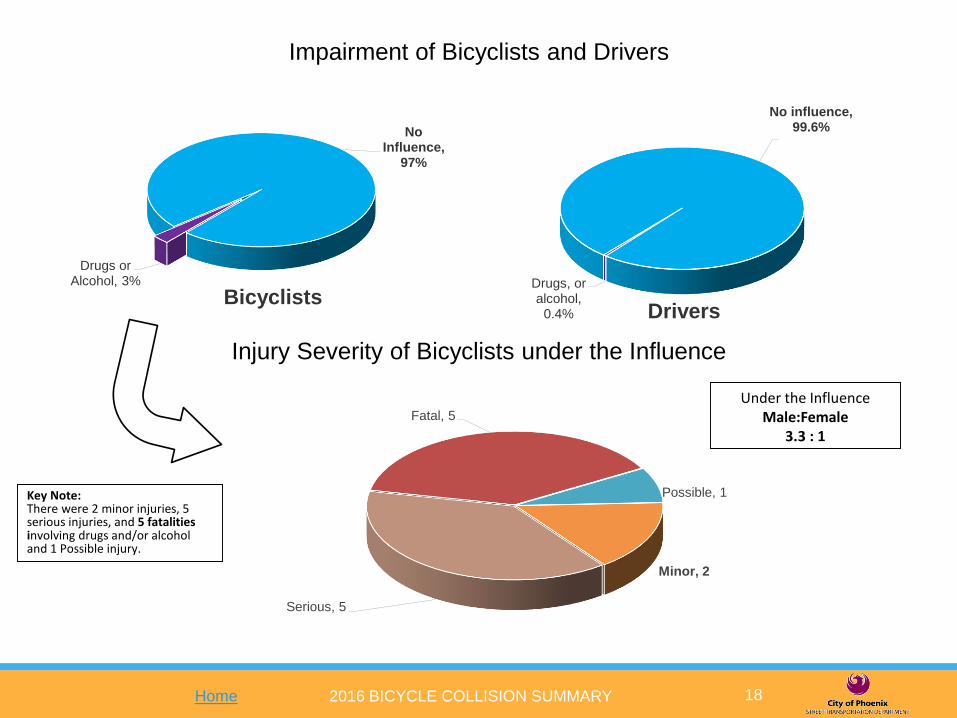
2016 BICYCLE COLLISION SUMMARY 18
Impairment of Bicyclists and Drivers
Injury Severity of Bicyclists under the Influence
Home
No Influence,
97%
Drugs or Alcohol, 3%
Bicyclists
No influence, 99.6%
Drugs, or alcohol,
0.4% Drivers
Key Note:There were 2 minor injuries, 5 serious injuries, and 5 fatalities involving drugs and/or alcohol and 1 Possible injury.
Possible, 1
Minor, 2
Serious, 5
Fatal, 5
Under the InfluenceMale:Female
3.3 : 1
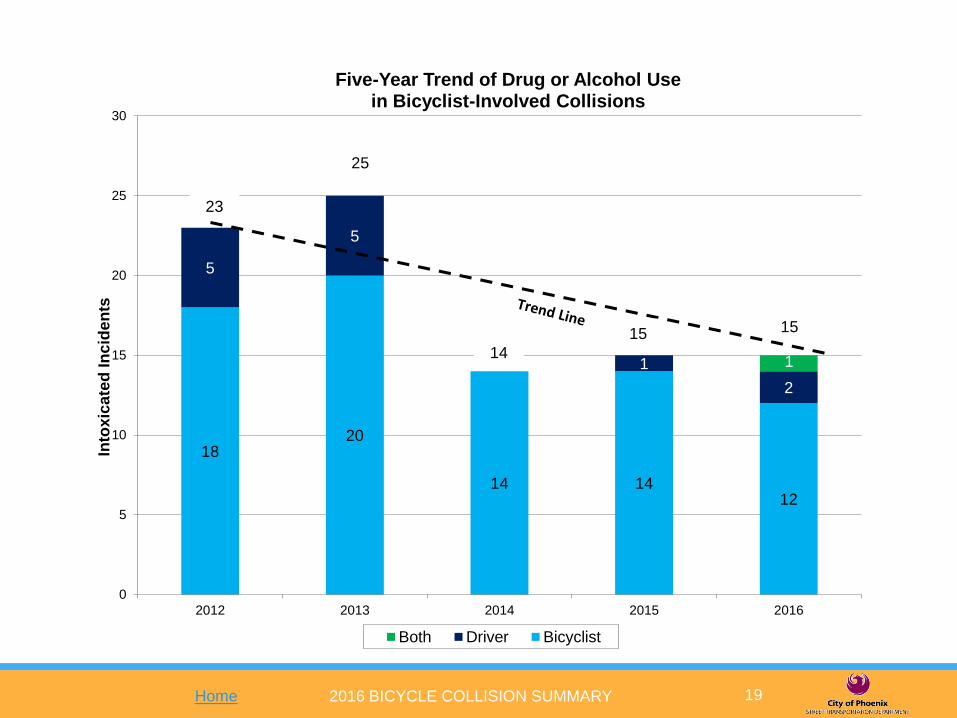
2016 BICYCLE COLLISION SUMMARY 19Home
1820
14 1412
5
5
1
0
5
10
15
20
25
30
2012 2013 2014 2015 2016
Into
xic
ate
d In
cid
en
ts
Five-Year Trend of Drug or Alcohol Use in Bicyclist-Involved Collisions
Both Driver Bicyclist
15
14
25
23
15
1
1820
14 1412
5
5
1
2
1
0
5
10
15
20
25
30
2012 2013 2014 2015 2016
Into
xic
ate
d In
cid
en
ts
Five-Year Trend of Drug or Alcohol Use in Bicyclist-Involved Collisions
Both Driver Bicyclist
15
14
25
23
15
1

2016 BICYCLE COLLISION SUMMARY 20
Bicyclist-Involved Collisions by Street Classification
Home
Non-Intersection-Related
26% of all bicycle collisions
Street Classification Examples
Freeways are I-17 (Black Canyon Freeway), I-10, Loop 202, on-ramps, access roads, etc.
Arterial streets are typically the mile-line streets such as 7th Ave, 16th St, Camelback Rd, and Union Hills Dr as defined on the Phoenix Street Classification Map.
Collector streets are typically the half-mile-line streets such as 39th Ave, 28th St, Roeser Rd, and Maryland Ave as defined on the Phoenix Street Classification Map.
Local streets are typically the neighborhood streets such as 88th Ln, Dromedary Rd, Holly St, 21st St, and Glenn Dr and are not defined as arterial or collector streets.
Intersection-Related
74% of all bicycle collisions

2016 BICYCLE COLLISION SUMMARY 21
2016 Bicycle Lane Improvements
Home
• Cholla Street from 40th to 44th Streets
• Roosevelt Street from 4th to 7th Streets
• Nevitt Bridge Path at 46th Place from Western Canal to Vineyard Road
• Indian School Road from 7th Avenue to 3rd Street
• Hearn Road from 7th to 12th Streets
• Virginia Avenue from 7th Street to Central Avenue
• Acoma Drive from 44th Street to Tatum Boulevard
• 55th Avenue from Dobbins to Baseline Roads
• Cholla Street from 24th to 32nd Streets
• 28th Street from Bell Road to Union Hills Drive
• 63rd Avenue from Durango to Sonora Streets
• 111th Avenue from Campbell Avenue to Indian School Road
• 39th Avenue from Greenway to Bell Roads for Safe Routes to School
• Durango Street from 63rd to 67th Avenues
• South Mountain Avenue from 51st Avenue to Mansa Drive
• Mansa Drive from South Mountain to 47th Avenues
• Lincoln Street from 7th to 2nd Avenues
• 48th Street from Washington to Van Buren Streets
• 39th Avenue from Missouri Avenue to Bethany Home Road

2016 BICYCLE COLLISION SUMMARY 22
Bicyclist-Involved Roadway Collisions
Total Roadway Related Crashes
Home
Unmarked Crosswalks50 Collisions
48 Injuries - 1 Fatality10% of all collisions
Travel Lanes24 Collisions
22 Injuries – 1 Fatality5% of all collisions
Mid-Block 41 Collisions
37 Injuries - 2 Fatalities8 % of all collisions
Intersection Crosswalks185 Collisions
166 Injuries - 1 Fatality36% of all collisions
Within Intersection39 Collisions
35 Injuries – 1 Fatality8% of all collisions
Driveways55 Collisions
48 Injuries – 1 Fatality11% of all collisions
NOTE: There were 94 bicyclists hit on
sidewalks resulting in 86 injuries, 0 fatalities,
18% of all collisions
Bike Lanes22 Collisions
22 Injuries - 0 Fatalities4% of all collisions
2016 BICYCLE COLLISION SUMMARY 23
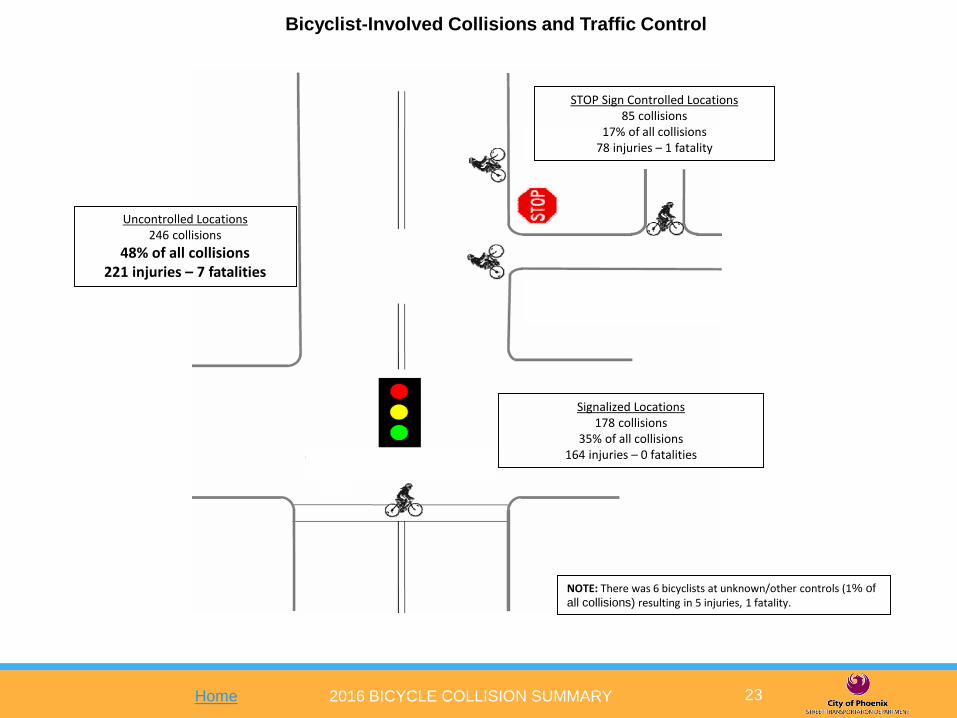
Bicyclist-Involved Collisions and Traffic Control
Home
STOP Sign Controlled Locations85 collisions
17% of all collisions78 injuries – 1 fatality
Signalized Locations178 collisions
35% of all collisions164 injuries – 0 fatalities
NOTE: There was 6 bicyclists at unknown/other controls (1% of
all collisions) resulting in 5 injuries, 1 fatality.
Uncontrolled Locations246 collisions
48% of all collisions221 injuries – 7 fatalities
2016 BICYCLE COLLISION SUMMARY 24Home
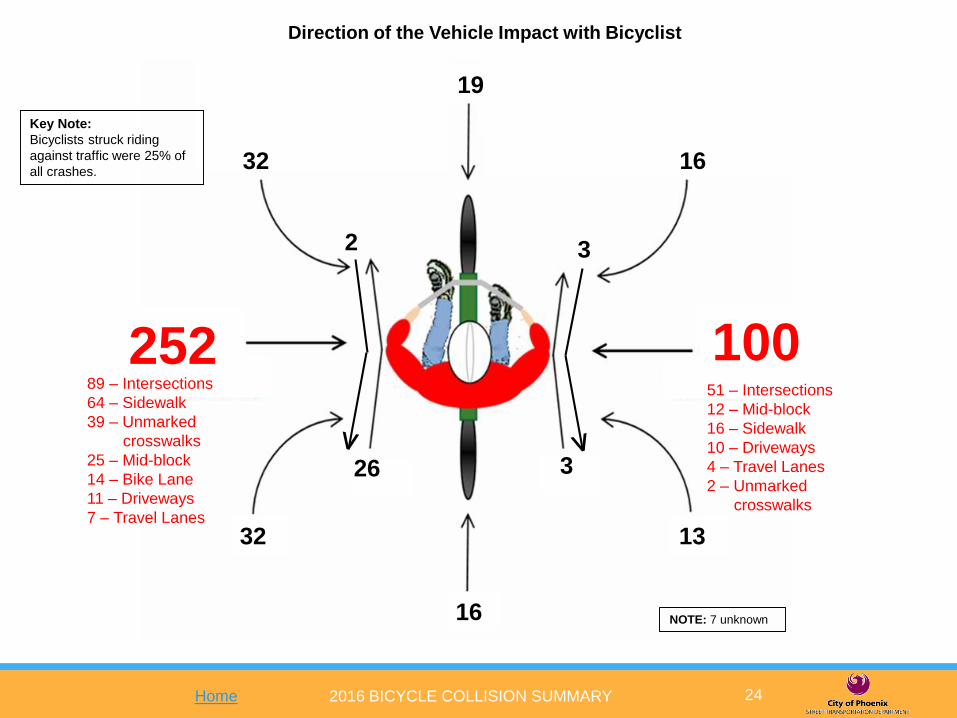
Direction of the Vehicle Impact with Bicyclist
NOTE: There were 18 collisions involving unknown pedestrian or vehicle directions.
10
48 7
3524
0
10
5
12
19
13
16
32
1632
26
2
3
3
252 10051 – Intersections
12 – Mid-block
16 – Sidewalk
10 – Driveways
4 – Travel Lanes
2 – Unmarked
crosswalks
89 – Intersections
64 – Sidewalk
39 – Unmarked
crosswalks
25 – Mid-block
14 – Bike Lane
11 – Driveways
7 – Travel Lanes
NOTE: 7 unknown
Key Note:
Bicyclists struck riding
against traffic were 25% of
all crashes.

2016 BICYCLE COLLISION SUMMARY 25Home
2016 Bicycle Detection Improvements
Bicycle detection improvements were added to seventeen signalized
intersections in 2016. The intersection detection systems included inductive
loops, bicycle signals, video cameras, and FLIR (Forward Looking Infrared).
Example locations: • 15th Avenue and Camelback Road
• 12th Street and Campbell Avenue
• 32nd Street at Cactus, Greenway, Thunderbird
Roads, and Shea Boulevard
2016 BICYCLE COLLISION SUMMARY 26Home
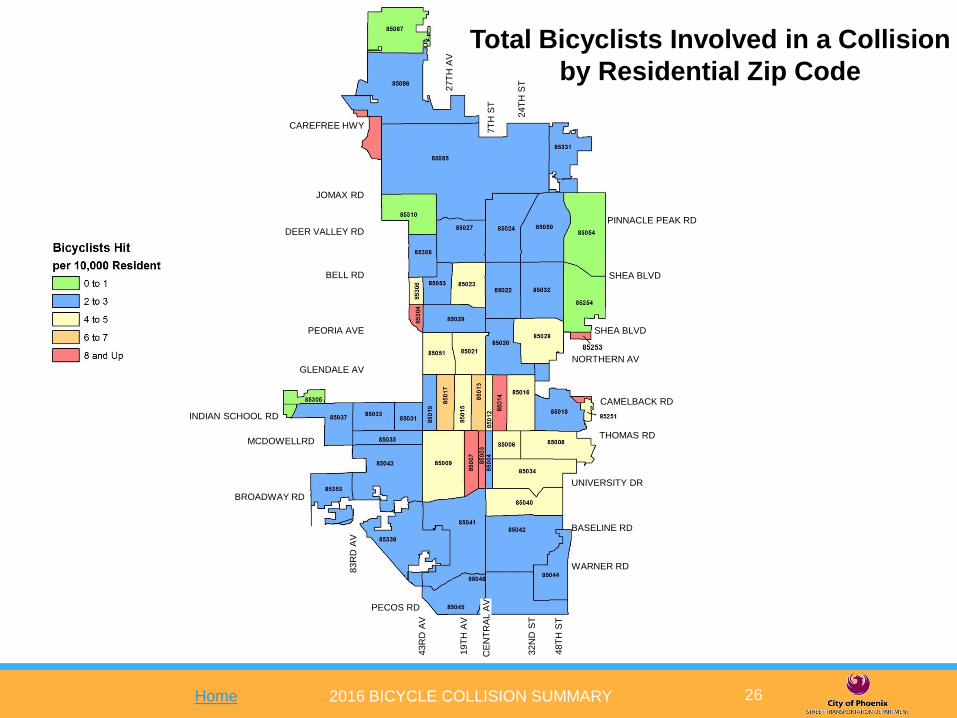
Total Bicyclists Involved in a Collision
by Residential Zip Code
CAREFREE HWY
JOMAX RD
DEER VALLEY RD
BELL RD
PEORIA AVE
GLENDALE AVNORTHERN AV
SHEA BLVD
SHEA BLVD
PINNACLE PEAK RD
UNIVERSITY DR
BASELINE RD
WARNER RD
INDIAN SCHOOL RD
MCDOWELLRD
BROADWAY RD
PECOS RD
43R
D A
V
19T
H A
V
CE
NT
RA
L A
V
32N
D S
T
48T
H S
T
7T
H S
T
83R
D A
V
27T
H A
V
24T
H S
T
CAMELBACK RD
THOMAS RD
2016 BICYCLE COLLISION SUMMARY 27Home
Bicycle Collisions
by Location
4 Collisions
3 Collisions
1-2 Collisions

2016 BICYCLE COLLISION SUMMARY 28
Acknowledgements
Home
The 2016 Phoenix Bicycle Collision Summary documents the collisions
involving bicyclists in the City of Phoenix throughout the 2016 calendar year.
Collision data utilized for this report was acquired through Phoenix Police
records and the database maintained by the Arizona Department of
Transportation (ADOT) known as Safety Data Mart (SDM). The 2016 Phoenix
Bicycle Collision Summary was prepared by Ramkiran Krishnakumar (ASU
Intern) with assistance from Traffic Safety Section staff Richard Russ (Principal
Engineering Technician) and Jacob Martinez (Senior Engineering Technician).
The SDM database includes motor vehicle crashes involving bicyclists that
occurred on public right of way where someone was injured or killed or where
property damage exceeded $1,000.
Cover photograph: Phoenix Bike to Work day 2016
Photograph courtesy Joseph Perez (Bicycle Coordinator)
Presentation photographs courtesy Joseph Perez (Bicycle Coordinator), Don
Cross (School Safety) and James Baker (Signal Systems)
This publication can be made available in an alternative format upon request.
Contact the Street Transportation Department at 602-262-6284 if you would
like any of these services. Our TTY phone number is 711.

Questions?Please contact Street Transportation Department at
602-262-6284 or TTY 711
2016 BICYCLE COLLISION SUMMARY 29Home