2013 asia pacific-global_hotel_chain_growth_strategy
75
Development of Growth & Expansion Strategy for Client X in Asia Pacific Final Report John Gregg, Principal, Navigate Consulting Paul Davies, Director Tourism Consulting, Australia 9 June 2013
-
Upload
john-gregg -
Category
Travel
-
view
61 -
download
0
Transcript of 2013 asia pacific-global_hotel_chain_growth_strategy
Development of Growth & Expansion
Strategy for Client X in Asia Pacific
Final Report John Gregg, Principal, Navigate ConsultingPaul Davies, Director Tourism Consulting, Australia
9 June 2013
2
Agenda
1. Approach
2. Industry overview
3. Sector analysis
4. Strategic options
5. Selected strategy
6. Next steps
3
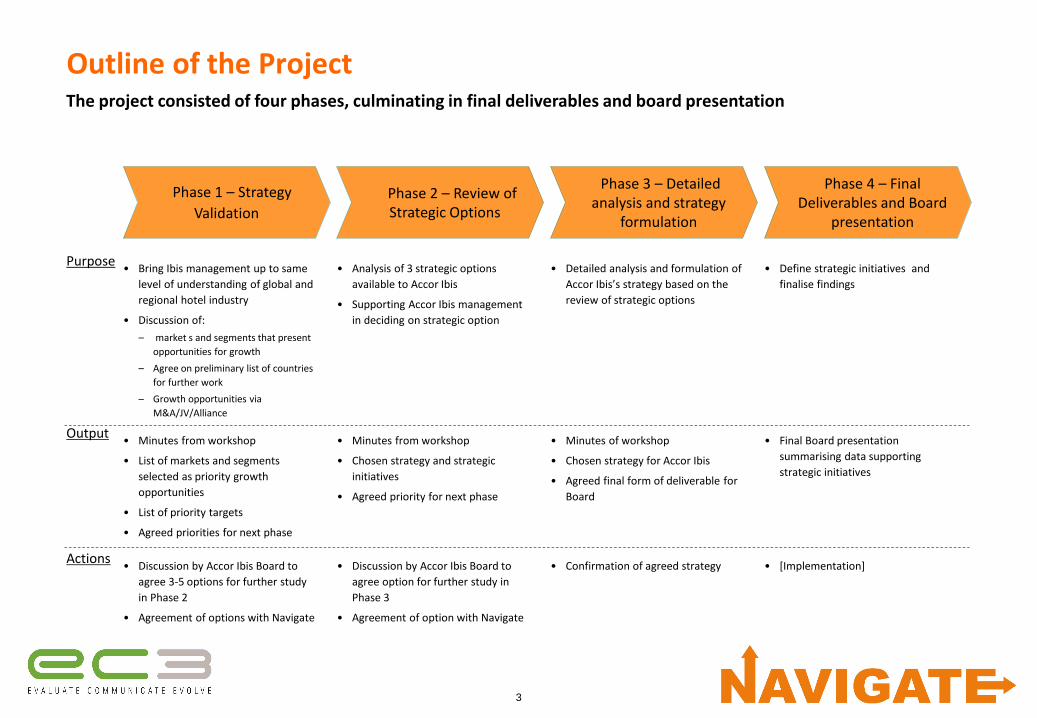
Outline of the ProjectThe project consisted of four phases, culminating in final deliverables and board presentation
Purpose
Output
Actions
Phase 1 – Strategy
ValidationPhase 2 – Review of Strategic Options
Phase 3 – Detailed analysis and strategy
formulation
Phase 4 – Final Deliverables and Board
presentation
• Bring Ibis management up to same
level of understanding of global and
regional hotel industry
• Discussion of:
– market s and segments that present
opportunities for growth
– Agree on preliminary list of countries
for further work
– Growth opportunities via
M&A/JV/Alliance
• Analysis of 3 strategic options
available to Accor Ibis
• Supporting Accor Ibis management
in deciding on strategic option
• Detailed analysis and formulation of
Accor Ibis’s strategy based on the
review of strategic options
• Define strategic initiatives and
finalise findings
• Discussion by Accor Ibis Board to
agree 3-5 options for further study
in Phase 2
• Agreement of options with Navigate
• Discussion by Accor Ibis Board to
agree option for further study in
Phase 3
• Agreement of option with Navigate
• Confirmation of agreed strategy • [Implementation]
• Minutes from workshop
• List of markets and segments
selected as priority growth
opportunities
• List of priority targets
• Agreed priorities for next phase
• Minutes from workshop
• Chosen strategy and strategic
initiatives
• Agreed priority for next phase
• Minutes of workshop
• Chosen strategy for Accor Ibis
• Agreed final form of deliverable for
Board
• Final Board presentation
summarising data supporting
strategic initiatives

4
Agenda1. Approach
2. Industry overview
• Market overview
• Key considerations
3. Sector analysis
4. Strategic options
5. Selected strategy
6. Next steps
5
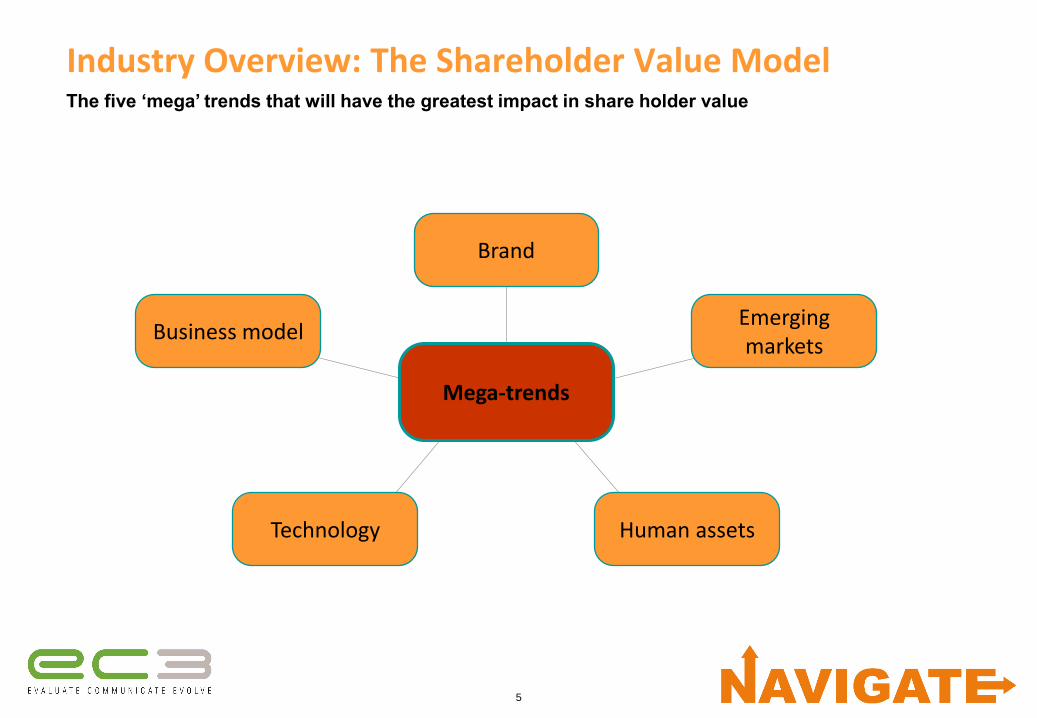
Industry Overview: The Shareholder Value Model
Brand
Human assetsTechnology
Emerging markets
Business model
Mega-trends
The five ‘mega’ trends that will have the greatest impact in share holder value
6
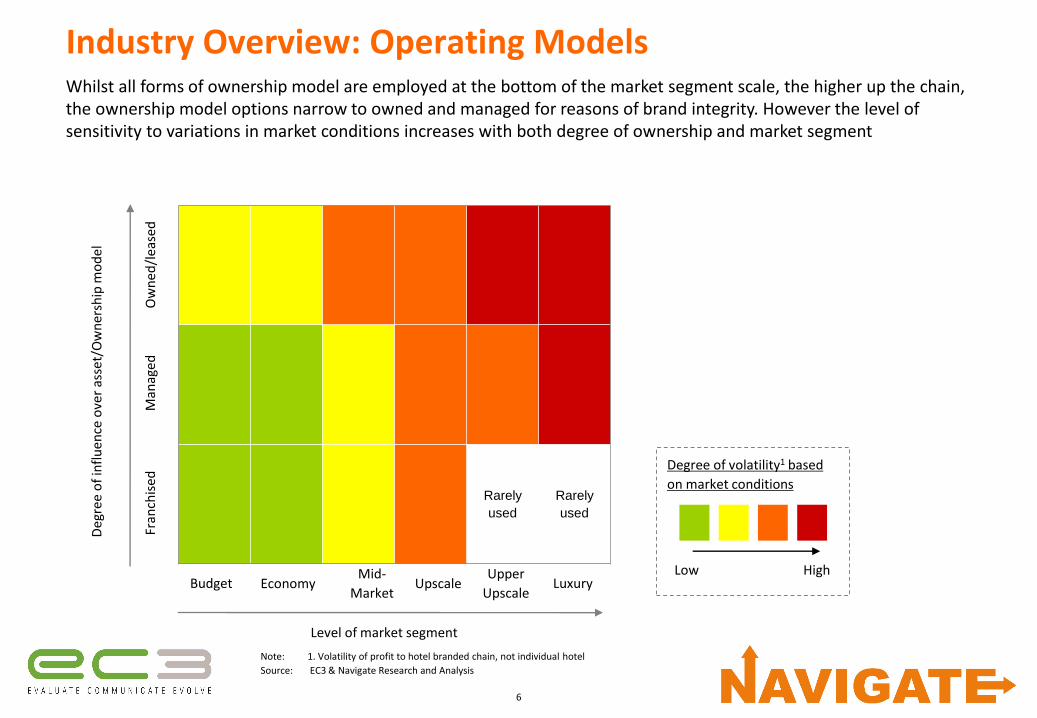
Industry Overview: Operating Models
Note: 1. Volatility of profit to hotel branded chain, not individual hotel
Source: EC3 & Navigate Research and Analysis
Whilst all forms of ownership model are employed at the bottom of the market segment scale, the higher up the chain, the ownership model options narrow to owned and managed for reasons of brand integrity. However the level of sensitivity to variations in market conditions increases with both degree of ownership and market segment
Rarely
used
Rarely
used
Budget Luxury
Ow
ned
/lea
sed
Fran
chis
ed
EconomyMid-
MarketUpscale
Upper
Upscale
Man
aged
Low High
Degree of volatility1 based
on market conditions
Deg
ree
of
infl
uen
ce o
ver
asse
t/O
wn
ersh
ip m
od
el
Level of market segment
7
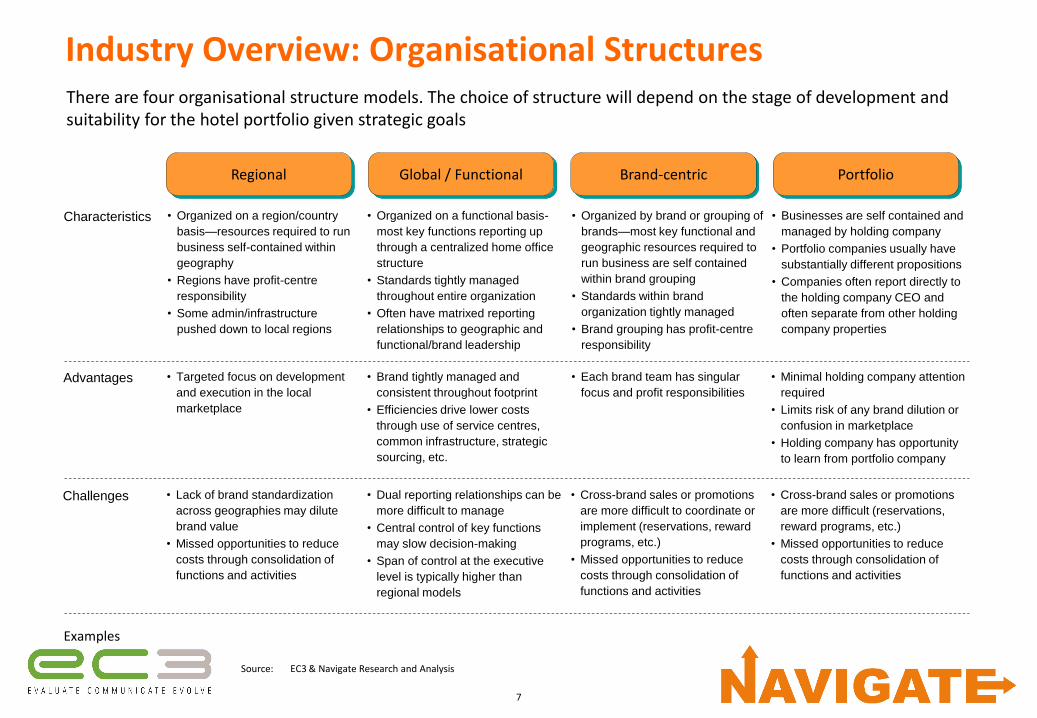
Industry Overview: Organisational Structures
Source: EC3 & Navigate Research and Analysis
There are four organisational structure models. The choice of structure will depend on the stage of development and suitability for the hotel portfolio given strategic goals
Characteristics • Organized on a region/country
basis—resources required to run
business self-contained within
geography
• Regions have profit-centre
responsibility
• Some admin/infrastructure
pushed down to local regions
• Organized on a functional basis-
most key functions reporting up
through a centralized home office
structure
• Standards tightly managed
throughout entire organization
• Often have matrixed reporting
relationships to geographic and
functional/brand leadership
• Organized by brand or grouping of
brands—most key functional and
geographic resources required to
run business are self contained
within brand grouping
• Standards within brand
organization tightly managed
• Brand grouping has profit-centre
responsibility
• Businesses are self contained and
managed by holding company
• Portfolio companies usually have
substantially different propositions
• Companies often report directly to
the holding company CEO and
often separate from other holding
company properties
Advantages • Targeted focus on development
and execution in the local
marketplace
• Brand tightly managed and
consistent throughout footprint
• Efficiencies drive lower costs
through use of service centres,
common infrastructure, strategic
sourcing, etc.
• Each brand team has singular
focus and profit responsibilities
• Minimal holding company attention
required
• Limits risk of any brand dilution or
confusion in marketplace
• Holding company has opportunity
to learn from portfolio company
Challenges • Lack of brand standardization
across geographies may dilute
brand value
• Missed opportunities to reduce
costs through consolidation of
functions and activities
• Dual reporting relationships can be
more difficult to manage
• Central control of key functions
may slow decision-making
• Span of control at the executive
level is typically higher than
regional models
• Cross-brand sales or promotions
are more difficult to coordinate or
implement (reservations, reward
programs, etc.)
• Missed opportunities to reduce
costs through consolidation of
functions and activities
• Cross-brand sales or promotions
are more difficult (reservations,
reward programs, etc.)
• Missed opportunities to reduce
costs through consolidation of
functions and activities
Examples
Regional Global / Functional PortfolioBrand-centric
8
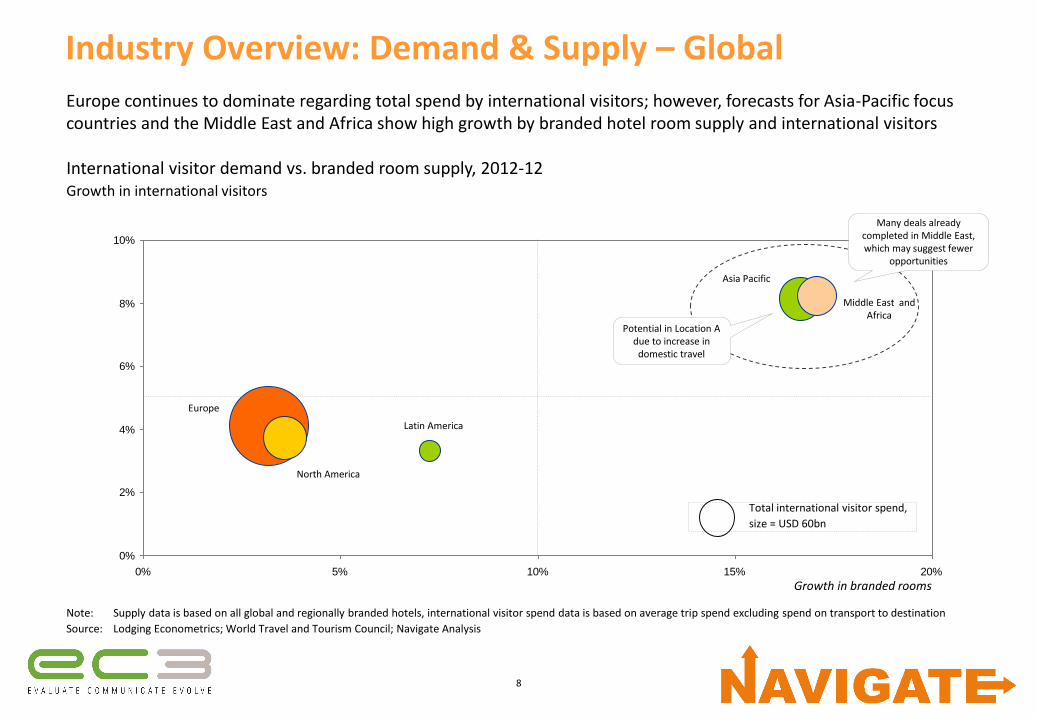
Industry Overview: Demand & Supply – Global
Europe continues to dominate regarding total spend by international visitors; however, forecasts for Asia-Pacific focus countries and the Middle East and Africa show high growth by branded hotel room supply and international visitors
0%
2%
4%
6%
8%
10%
0% 5% 10% 15% 20%
Europe
North America
Latin America
Asia Pacific
Middle East and Africa
Growth in branded rooms
Note: Supply data is based on all global and regionally branded hotels, international visitor spend data is based on average trip spend excluding spend on transport to destination
Source: Lodging Econometrics; World Travel and Tourism Council; Navigate Analysis
Total international visitor spend,
size = USD 60bn
International visitor demand vs. branded room supply, 2012-12 Growth in international visitors
Potential in Location A due to increase in
domestic travel
Many deals already completed in Middle East, which may suggest fewer
opportunities
9
China
Malaysia
Phillipines
Indonesia
Thailand
Maldives
Singapore
0%
2%
4%
6%
8%
10%
12%
14%
16%
18%
0% 10% 20% 30% 40%
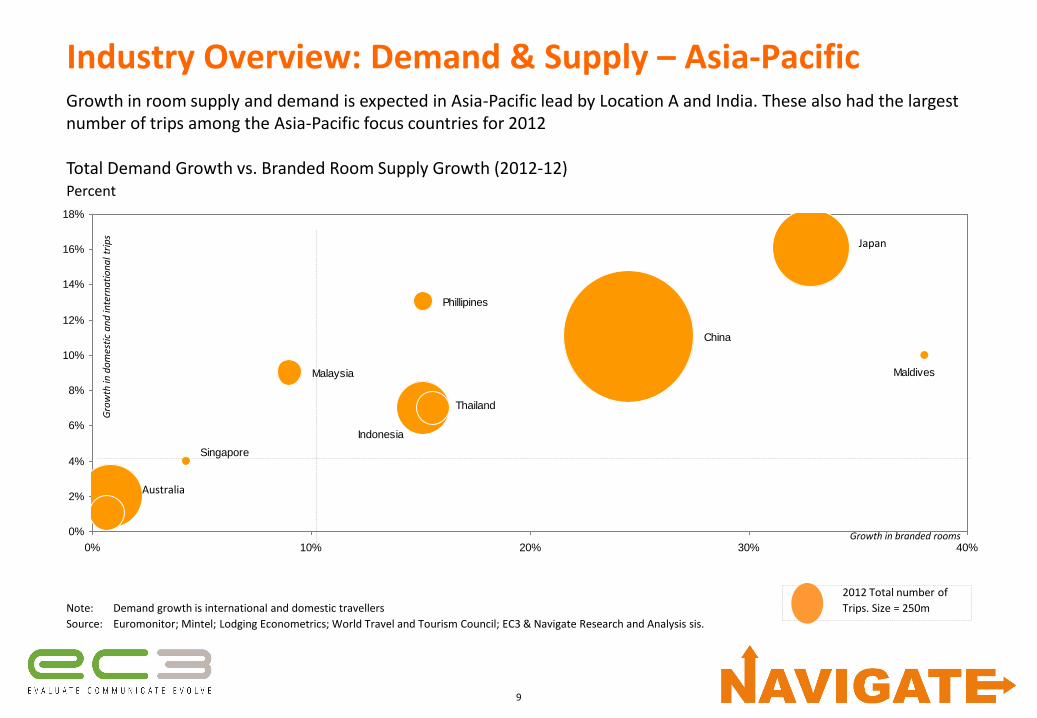
Industry Overview: Demand & Supply – Asia-PacificGrowth in room supply and demand is expected in Asia-Pacific lead by Location A and India. These also had the largest number of trips among the Asia-Pacific focus countries for 2012
Total Demand Growth vs. Branded Room Supply Growth (2012-12)Percent
Growth in branded rooms
2012 Total number of
Trips. Size = 250mNote: Demand growth is international and domestic travellers
Source: Euromonitor; Mintel; Lodging Econometrics; World Travel and Tourism Council; EC3 & Navigate Research and Analysis sis.
Gro
wth
in d
om
esti
c a
nd
inte
rna
tio
na
l tr
ips
Australia
Japan

10
Industry Overview: Demand & Supply – Int’l Overnight and Dom. Trips
0
200
400
600
800
1,000
1,200
1,400
1,600
International 75 8.3 21 14 5.0 6.4 5.5 0.7 3.1 8.3 2.9 56 30
Domestic 1,387 346 43 92 512 105 240 - 37 1.0 19 1,199 121
Total 1,461 355 64 106 517 112 245 0.7 40 9.3 22 1,255 151
% Domestic 95% 98% 67% 86% 99% 94% 98% 0% 92% 11% 87% 96% 80%
Greater
ChinaJapan Malaysia Thailand India Korea Indonesia Maldives Philippines Singapore Vietnam
United
States
United
Kingdom
Location A leads Asia-Pacific with the largest number of both domestic and international trips
Domestic and International Trips by Country (2012)Million Trips
Note: International demand is determined by international overnight trips for 2012. Domestic trips are for 2012 and are defined as travel of 50 miles or more, each way, which includes an overnight stay. *Due to rounding of decimal places, totals might not always correspond exactly to the sum.
Source: Euromonitor; World Travel and Tourism Council; EC3 & Navigate Research and AnalysisDomestic International
*
Benchmark

11
0
200
400
600
800
1,000
1,200
1,400
1,600
Business 121 41 5.5 44 122 9.2 82 4 0.2 13 312 20
Leisure 1,265 305 37 48 390 96 158 33 0.8 6.4 887 101
Total 1,387 346 43 92 512 105 240 - 37 1 19 1,199 121
Greater
ChinaJapan Malaysia Thailand India Korea Indonesia Maldives Philippines Singapore Vietnam
United
States
United
Kingdom
Industry Overview: Demand & Supply – Domestic TripsLeisure is the main driver for domestic travellers
Domestic Business and Leisure Trips (2012)Million Trips
Leisure Business
Data not available
Note: International demand is determined by international overnight trips for 2012. Domestic trips are for 2012 and are defined as travel of 50 miles or more, each way, which includes an overnight stay.
Source: Euromonitor; World Travel and Tourism Council; Navigate Research & Analysis.
Benchmark
12
0.4
0.1 0.0 0.0 0.1 0.0 0.0 0.0 0.0 0.0 0.0
6.1
1.8
0.5
0.80.6
0.3
1.2
0.1 0.1 0.0
0
1
2
3
4
5
6
7
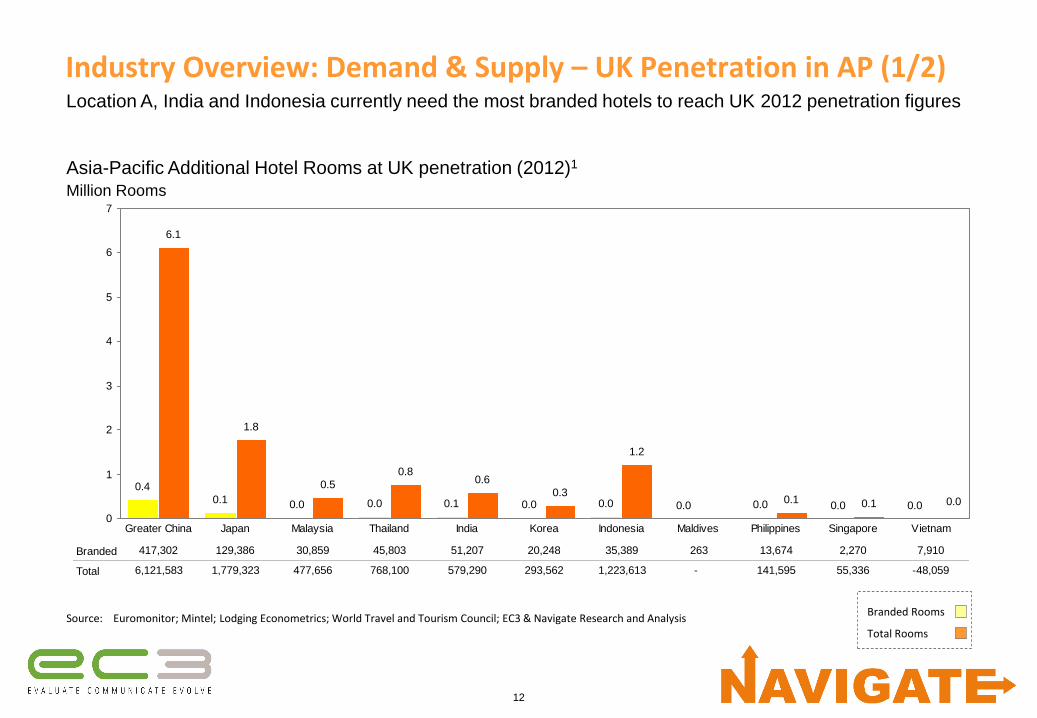
Branded 417,302 129,386 30,859 45,803 51,207 20,248 35,389 263 13,674 2,270 7,910
Total 6,121,583 1,779,323 477,656 768,100 579,290 293,562 1,223,613 - 141,595 55,336 -48,059
Greater China Japan Malaysia Thailand India Korea Indonesia Maldives Philippines Singapore Vietnam
Asia-Pacific Additional Hotel Rooms at UK penetration (2012)1
Million Rooms
Industry Overview: Demand & Supply – UK Penetration in AP (1/2)Location A, India and Indonesia currently need the most branded hotels to reach UK 2012 penetration figures
Source: Euromonitor; Mintel; Lodging Econometrics; World Travel and Tourism Council; EC3 & Navigate Research and AnalysisBranded Rooms
Total Rooms

13
0.5
0.1 0.0 0.1 0.1 0.0 0.0 0.0 0.0 0.0 0.0
7.2
3.0
0.6
1.2
0.60.3
1.4
0.2 0.1 0.3
0
1
2
3
4
5
6
7
8
Branded 479,411 146,249 36,856 53,652 57,420 22,554 39,631 712 16,077 7,316 9,366
Total 7,174,542 2,956,606 646,215 1,193,828 649,996 328,277 1,442,008 - 165,754 95,425 292,867
Greater China Japan Malaysia Thailand India Korea Indonesia Maldives Philippines Singapore Vietnam
Asia-Pacific Additional Hotel Rooms at UK penetration (2012)1
Million Rooms
Industry Overview: Demand & Supply – UK Penetration in AP (2/2)Looking forward to the year 2014, there is still a gap to reach UK 2013 penetration for branded rooms among
several of the Asia-Pacific countries, lead by Location A, India and Location D
Source: Euromonitor; Mintel; Lodging Econometrics; World Travel and Tourism Council; EC3 & Navigate Research and AnalysisBranded Rooms
Total Rooms
14
0.6
0.20.0 0.1 0.1 0.0 0.0 0.0 0.0 0.0 0.0
3.5
-1.3
0.20.1
0.40.2
0.7
0.1 0.0-0.3
-2
-1
0
1
2
3
4
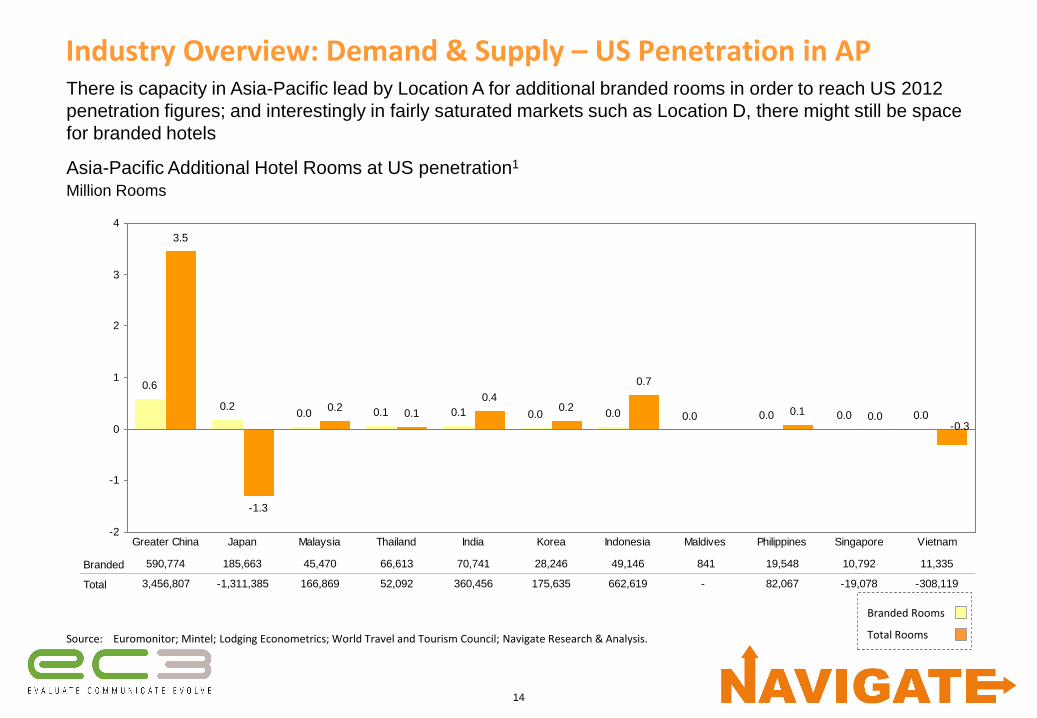
Branded 590,774 185,663 45,470 66,613 70,741 28,246 49,146 841 19,548 10,792 11,335
Total 3,456,807 -1,311,385 166,869 52,092 360,456 175,635 662,619 - 82,067 -19,078 -308,119
Greater China Japan Malaysia Thailand India Korea Indonesia Maldives Philippines Singapore Vietnam
Asia-Pacific Additional Hotel Rooms at US penetration1
Million Rooms
Industry Overview: Demand & Supply – US Penetration in APThere is capacity in Asia-Pacific lead by Location A for additional branded rooms in order to reach US 2012
penetration figures; and interestingly in fairly saturated markets such as Location D, there might still be space
for branded hotels
Source: Euromonitor; Mintel; Lodging Econometrics; World Travel and Tourism Council; Navigate Research & Analysis.
Branded Rooms
Total Rooms
15
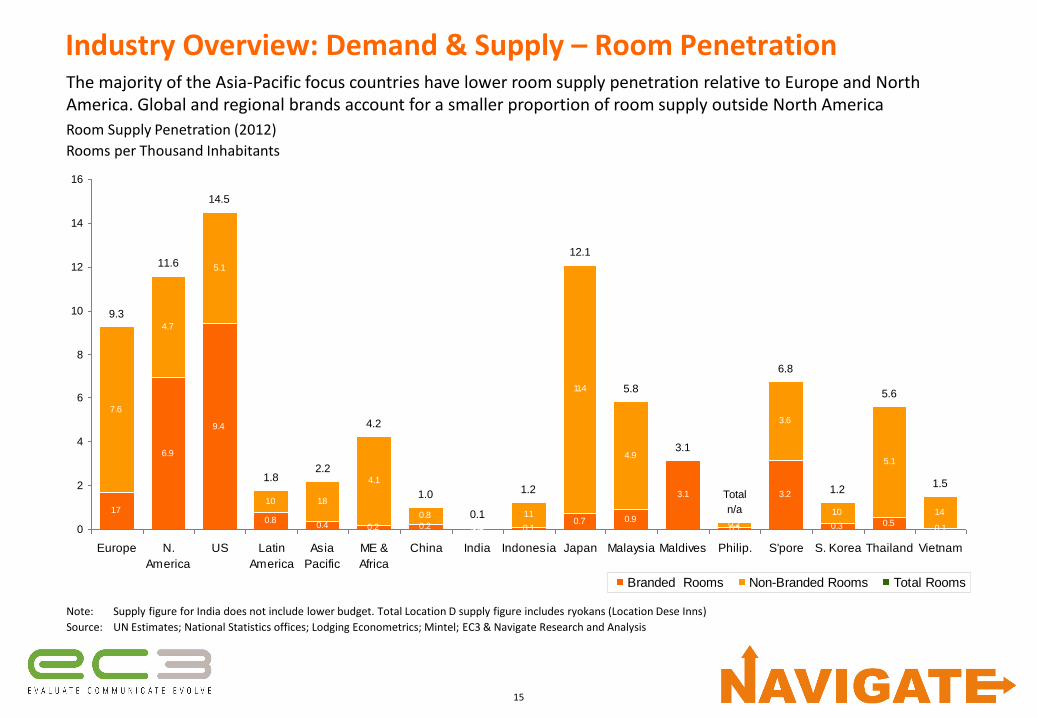
Industry Overview: Demand & Supply – Room Penetration
1.7
6.9
9.4
0.80.4 0.2 0.2 0.0 0.1
0.7 0.9
3.1
0.1
3.2
0.3 0.50.1
7.6
4.7
5.1
1.0 1.8
4.1
0.8
0.1
1.1
11.4
4.9
0.2
3.6
1.0
5.1
1.4
9.3
11.6
14.5
1.82.2
4.2
1.0
0.1
1.2
12.1
5.8
3.1
6.8
1.2
5.6
1.5Total
n/a
0
2
4
6
8
10
12
14
16
Europe N.
America
US Latin
America
Asia
Pacific
ME &
Africa
China India Indonesia Japan Malaysia Maldives Philip. S'pore S. Korea Thailand Vietnam
Branded Rooms Non-Branded Rooms Total Rooms
The majority of the Asia-Pacific focus countries have lower room supply penetration relative to Europe and North America. Global and regional brands account for a smaller proportion of room supply outside North America
Room Supply Penetration (2012)
Rooms per Thousand Inhabitants
Note: Supply figure for India does not include lower budget. Total Location D supply figure includes ryokans (Location Dese Inns)
Source: UN Estimates; National Statistics offices; Lodging Econometrics; Mintel; EC3 & Navigate Research and Analysis
16
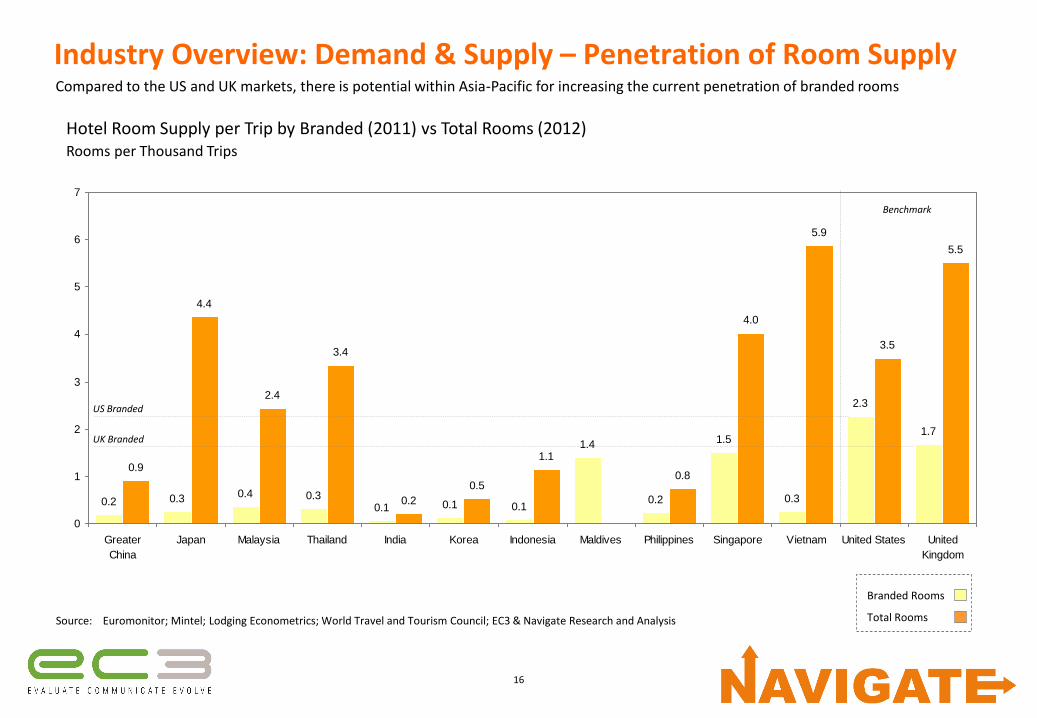
0.2 0.3 0.4 0.30.1 0.1 0.1
1.4
0.2
1.5
0.3
2.3
1.7
0.9
4.4
2.4
3.4
0.2
0.5
1.1
0.8
4.0
5.9
3.5
5.5
0
1
2
3
4
5
6
7
Greater
China
Japan Malaysia Thailand India Korea Indonesia Maldives Philippines Singapore Vietnam United States United
Kingdom
Compared to the US and UK markets, there is potential within Asia-Pacific for increasing the current penetration of branded rooms
Hotel Room Supply per Trip by Branded (2011) vs Total Rooms (2012)Rooms per Thousand Trips
Branded Rooms
Total Rooms
Industry Overview: Demand & Supply – Penetration of Room Supply
Source: Euromonitor; Mintel; Lodging Econometrics; World Travel and Tourism Council; EC3 & Navigate Research and Analysis
US Branded
UK Branded
Benchmark
17
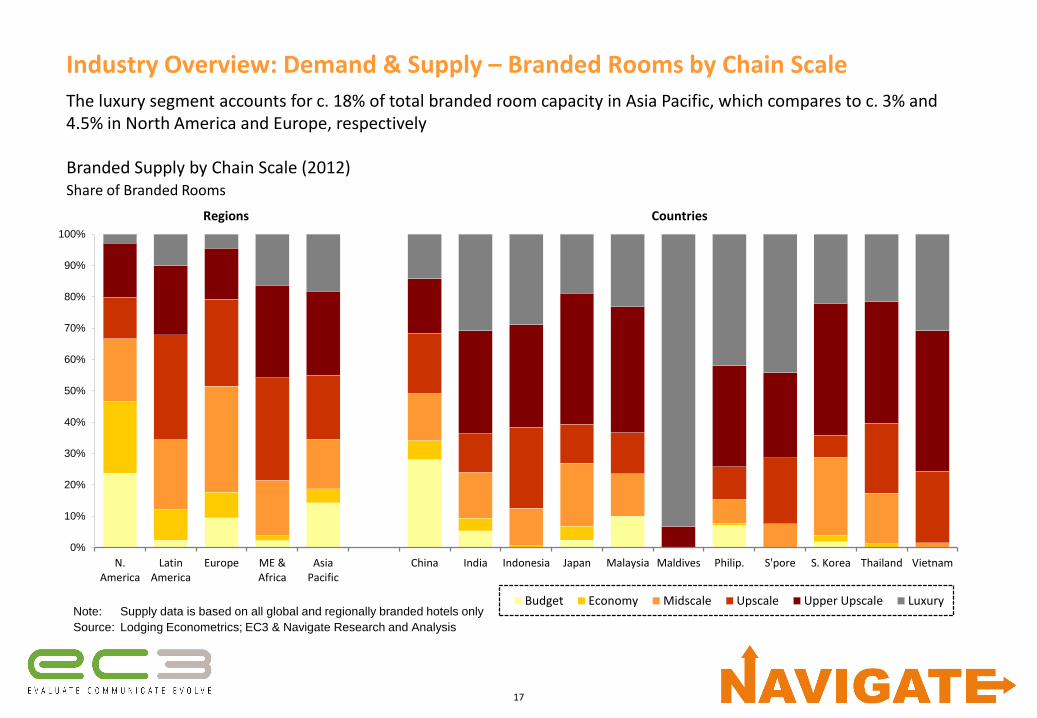
Industry Overview: Demand & Supply – Branded Rooms by Chain Scale
0%
10%
20%
30%
40%
50%
60%
70%
80%
90%
100%
N.America
LatinAmerica
Europe ME &Africa
AsiaPacific
China India Indonesia Japan Malaysia Maldives Philip. S'pore S. Korea Thailand Vietnam
Budget Economy Midscale Upscale Upper Upscale Luxury
The luxury segment accounts for c. 18% of total branded room capacity in Asia Pacific, which compares to c. 3% and 4.5% in North America and Europe, respectively
Branded Supply by Chain Scale (2012)Share of Branded Rooms
Note: Supply data is based on all global and regionally branded hotels only
Source: Lodging Econometrics; EC3 & Navigate Research and Analysis
CountriesRegions

18
Industry Overview: Demand & Supply – Upper Upscale / Luxury ValuationHotel values have increased on average nearly 6% p.a. between 2002-06, with cities in Location A, Malaysia,
Indonesia and Singapore
Tokyo
Hong Kong
Seoul Singapore
Shanghai
Beijing
BangkokPhuket Taipei
Bali Kuala Lumpur
Manila Jakarta
0
100
200
300
400
500
600
700
800
900
-2% 0% 2% 4% 6% 8% 10% 12%
Upper Upscale / Luxury Valuation per Key (2012)USD Thousands 2012 vs CAGR 2008-2012
$292k
Source: 2012 Asia Hotel Valuation Index; Navigate Research & Analysis
5.6%
19
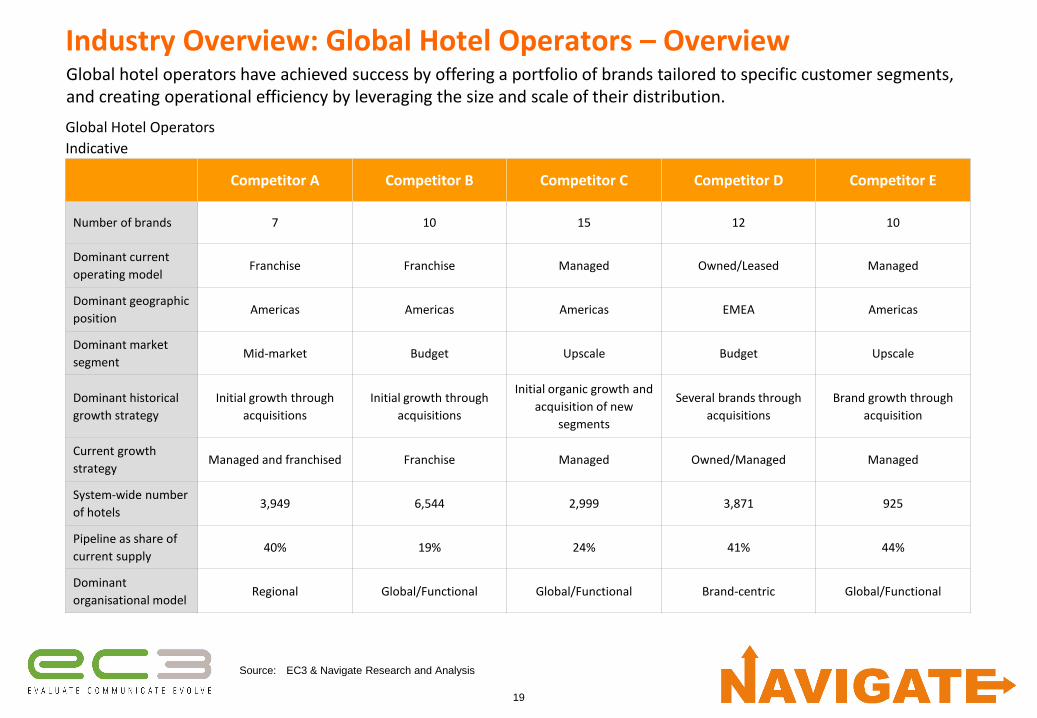
Global hotel operators have achieved success by offering a portfolio of brands tailored to specific customer segments, and creating operational efficiency by leveraging the size and scale of their distribution.
Industry Overview: Global Hotel Operators – Overview
Competitor A Competitor B Competitor C Competitor D Competitor E
Number of brands 7 10 15 12 10
Dominant current
operating modelFranchise Franchise Managed Owned/Leased Managed
Dominant geographic
positionAmericas Americas Americas EMEA Americas
Dominant market
segmentMid-market Budget Upscale Budget Upscale
Dominant historical
growth strategy
Initial growth through
acquisitions
Initial growth through
acquisitions
Initial organic growth and
acquisition of new
segments
Several brands through
acquisitions
Brand growth through
acquisition
Current growth
strategyManaged and franchised Franchise Managed Owned/Managed Managed
System-wide number
of hotels3,949 6,544 2,999 3,871 925
Pipeline as share of
current supply40% 19% 24% 41% 44%
Dominant
organisational modelRegional Global/Functional Global/Functional Brand-centric Global/Functional
Source: EC3 & Navigate Research and Analysis
Global Hotel Operators
Indicative

20
Industry Overview: Global Hotel Operators – Financial SummaryGlobal hotel operators have achieved high return on capital invested by focussing on management contracts and real-estate transformation.
Financial Results and Key Performance Indicators (2012)
Indicative
Competitor A Competitor B Competitor C Competitor Dl Competitor E
Financial Results
Total Revenue, $m 1,768 4,360 4,415 6,153 11,132
Market Cap, $m 4,470 3,864 12,777 10,469 15,837
EV / EBITDA 10.5x 5.7x 12.0x 11.4x 9.2x
P / E 12.0x 10.3x 18.8x 19.8x 11.9x
Return on capital
invested1, %17 9 25 13 13.6
Key Performance
Indicators2
RevPAR, $ 72 871 121 110 77
Occupancy, % 69.6 73.31 73.2 70.1 67.6
ADR, $ 103 1181 165 157 114
EBITDA, $m 437 892 1,385 1,164 1,905
EBITDA Margin, % 27.0 20.5 31.4 18.9 17.0
Note: 1 Due to information availability the figure is based upon the financial statements as at 2012 year end.
Source: EC3 & Navigate Research and Analysis
21
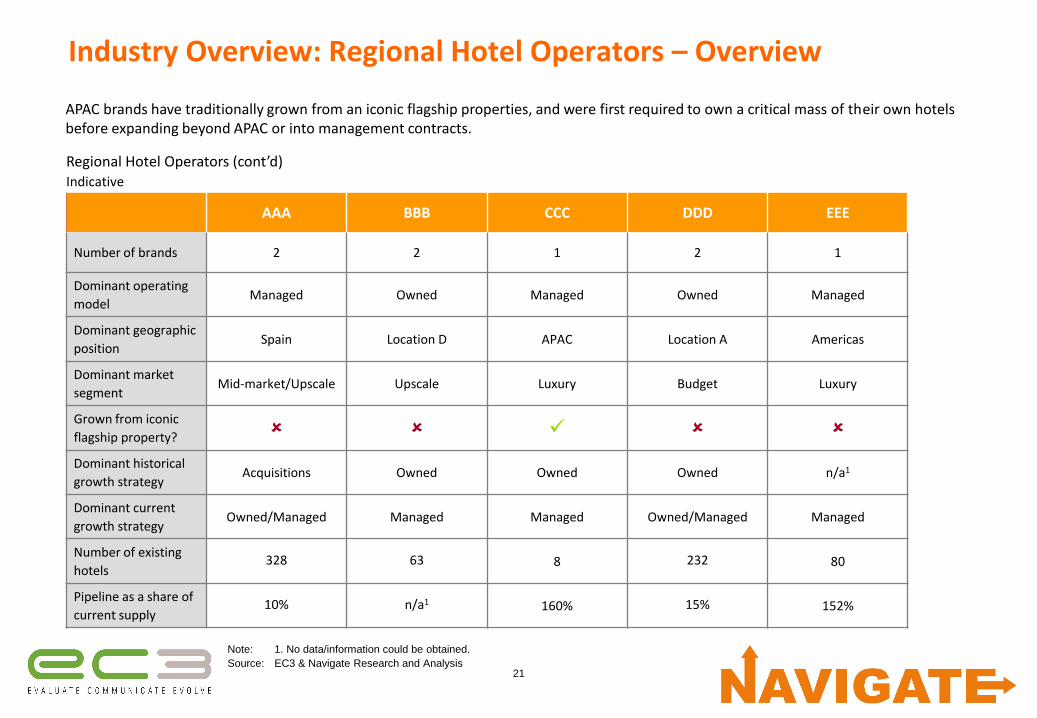
Industry Overview: Regional Hotel Operators – Overview
Note: 1. No data/information could be obtained.
Source: EC3 & Navigate Research and Analysis
APAC brands have traditionally grown from an iconic flagship properties, and were first required to own a critical mass of their own hotels before expanding beyond APAC or into management contracts.
AAA BBB CCC DDD EEE
Number of brands 2 2 1 2 1
Dominant operating
modelManaged Owned Managed Owned Managed
Dominant geographic
positionSpain Location D APAC Location A Americas
Dominant market
segmentMid-market/Upscale Upscale Luxury Budget Luxury
Grown from iconic
flagship property?
Dominant historical
growth strategyAcquisitions Owned Owned Owned n/a1
Dominant current
growth strategyOwned/Managed Managed Managed Owned/Managed Managed
Number of existing
hotels328 63 8 232 80
Pipeline as a share of
current supply10% n/a1 160% 15% 152%
Regional Hotel Operators (cont’d)Indicative

22
Industry Overview: Regional Hotel Operators – Financial SummaryAsia Pacific chains have relatively high EV/EBITDA multiples and relatively low return on capital invested as a result of their asset heavy strategies.
Financial Results and Key Performance Indicators (2012 unless otherwise stated)Indicative
AAA BBB CCC DDD EEE
Financial Results
Total Revenue, $m 1,002* 558 582 211* 430*
Market Cap, $m 8,341 1,635 2,095 696 1,873
EV / EBITDA 23.6x 12.8x 19.3x 17.9x 14.7x
P / E 22.4x 15.2x 5.1x 12.1x 38.7x
Return on capital invested1, % 7* 8 4 8* 10.1*
Key Performance Indicators2
RevPAR, $ 102* 215 316 178* 34**
Occupancy, % 70 74 68 65* 71**
ADR, $ 146* 291 465 274* 48**
EBITDA, $m 350* 190 194 70* 111
EBITDA Margin, % 34.9* 34.1 33 33* 26
Note: 1 Based on continuing operations, excluding special items; 2 Company operated; 3 Relevant data is not available for JAL, Raffles, and Four Seasons. * Figure is based on 2006 figures due to information availability. ** Jin Jiang figures are based upon their 3-Star brand. This provides a best estimate given the width of their offerings
Source: Company Data; EC3 & Navigate Research and Analysis

23
Agenda1. Approach
2. Industry overview
• Market overview
• Key considerations
3. Sector analysis
4. Strategic options
5. Selected strategy
6. Next steps

2424
Key Considerations: Strategic Framework Initial Thoughts
LocationPortfolio
Approaches
Play to your
Strengths
Most significant driver of
guest hotel choice
– Very few people choose a hotel
brand and then choose a
location
Returns first, brand fit
second
– Led to most development
approaches being more tactical
than strategic
– Organisations will have their
desired location lists but
market opportunity often
overtakes
– Organic growth focused on
locations where there is
capacity within a segment
– Can create tension between
Brand and Development
– Led to most brands having
significant range of quality and
locations
– Only strongest brands can
adopt more strategic approach
– In the absence of property
asset value increases, new
management contracts are one
of the key sources of
increasing financial return
– Development pipeline now THE
most important KPI for the
major listed hotel operators
Single segment approach
– With the exception of Four
Seasons, all luxury single
segment operators have built
growth on the foundation of
one or two iconic properties
Luxury brands
– Almost all luxury brands have
extended into resorts and
residences (both owned and
fractional)
– Resort developments are
aimed at capturing the leisure
market of their customers
– In the past 2 years the
incorporation of a residential
element has been required to
make new builds financially
viable
Multi segment approach
– Many organisations have a
luxury brand to deliver a ‘halo’
effect
– The core business is mid-
market and the luxury brand
delivers an aspiration for these
guests
– Few organisations have mid-
tier resort brands
Many hospitality
organisations have natural
strengths
– Iconic properties
– Strong brand names
– Deep heritage
– Strong cultural links
– Corporate owners
– Access to capital
Successful organisations
have developed ways of
harnessing these strengths
Operational
Excellence
A critical driver in delivering
financial return
– No value in delivering low
profitability on high occupancy
and ADR
– Poor performance can destroy
benefits of strong brand and
location
– A key consideration for owners
when selecting operators
Number 1 core competency
– Vital that have strong core
operations to support future
growth – organic or acquisition
– All successful operators have
either CEO or COO with many
years operational experience
often with same organisation
and often starting from very
low level
– Need stable central ‘system’ to
support growth to enable new
properties to be transitioned
into the organisational
smoothly
– Create pool of expertise that
can be exported to new
properties to ensure rapid
adoption of standard
processes and procedures
Growth Patterns
Home comfort
– With the exception of Four
Seasons, all the major global
and regional players have
expanded close to home
before significant global
expansion
– This is reflected in the
percentage of property
portfolios in their domestic
markets
– Second stage expansion is
often in overseas regions with
strong brand or cultural
recognition
Home advantage
– Easier to support new hotels
from a logistical perspective as
can leverage current suppliers,
staff redeployment is easier
and management can maintain
closer oversight role. There are
also obvious time zone
advantages.
– Need to build critical scale of
operations before adding
additional strains of distant
operations
– It is likely that there is stronger
brand awareness in countries
closer to home and also easier
to build this brand awareness
in weaker countries due to
cultural similarities
Talent
Global and regional
hospitality organisations
invest significantly in their
talent
– One of most significant assets
particularly since property
assets typically disposed
– At the heart of operational
efficiency
– At the heart of delivering the
branded experience
– Becomes more significant the
higher the segment
– Large, high quality talent pool
required to support growth
– Increasingly in short supply
and predicted to get more so
– Recruitment and retention
Its not just about operational
training
– Staff engagement is just as
important – feeling emotionally
connected to the organisation
– Structured career development
Source: EC3 & Navigate Research and Analysis
We have identified a range of key considerations for Client X, which fall broadly into six categories
25
Agenda1. Approach
2. Industry overview
3. Sector analysis
• Region
• Country
• City
4. Strategic options
5. Selected strategy
6. Next steps

26
Region Analysis: Summary (1/2)
Source: EC3 & Navigate Research and Analysis
Requirements Europe North AmericaMiddle East &
AfricaAsia Pacific
Ability to develop management skills, detailed operating
procedures and central shared services
Ability for Client X to oversee operations from Location X
Ability to generate efficiencies from increased scale of
operations
Summary
Ability for Client X to Enter Region in Short to Medium TermIndicative
On a regional level, the ability for Client X to enter region in the short to medium term is high only in Asia-Pacific

27
Region Analysis: Summary (2/2)
Source: EC3 & Navigate Research and Analysis
Key Drivers Europe North AmericaMiddle East &
AfricaAsia Pacific
Demand drivers
Supply drivers
Historical performance
Ability for Client X to enter region in short to medium term
Investigate further?
Summary of Key DriversIndicative
Demand and supply drivers are positive in both Asia-Pacific and the Middle East & Africa
28
55%
60%
65%
70%
75%
-2% -1% 0% 1% 2% 3% 4%
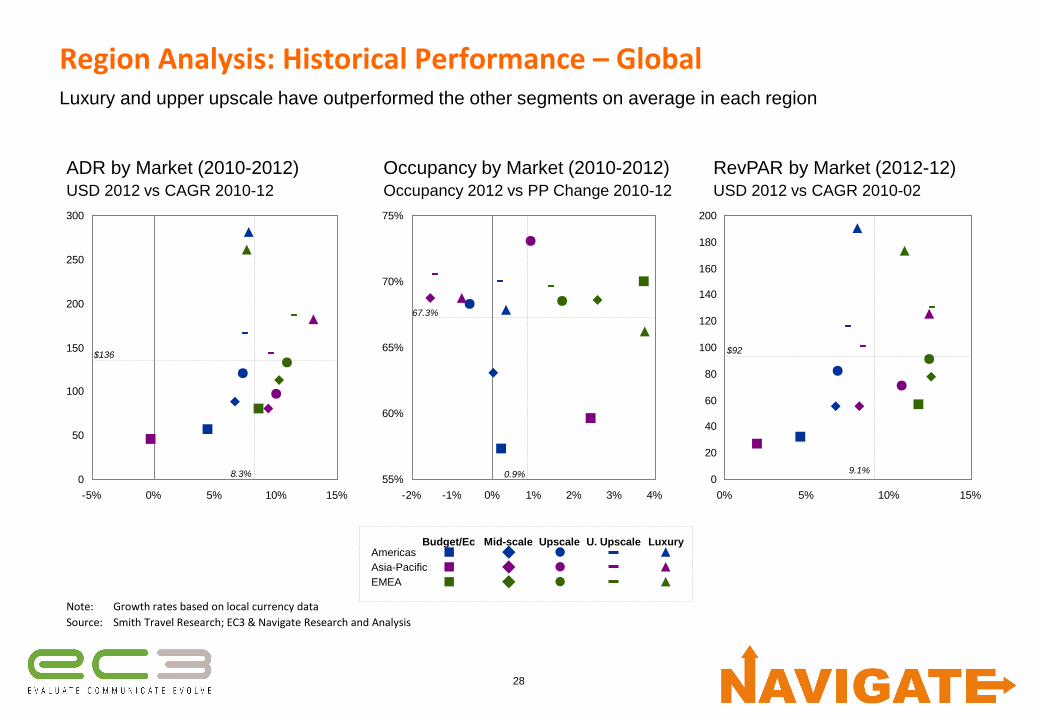
Region Analysis: Historical Performance – GlobalLuxury and upper upscale have outperformed the other segments on average in each region
0
50
100
150
200
250
300
-5% 0% 5% 10% 15%
ADR by Market (2010-2012)USD 2012 vs CAGR 2010-12
0.9%
67.3%
Note: Growth rates based on local currency data
Source: Smith Travel Research; EC3 & Navigate Research and Analysis
UpscaleMid-scale U. UpscaleBudget/EcAmericas
Asia-Pacific
EMEA
Luxury
RevPAR by Market (2012-12)USD 2012 vs CAGR 2010-02
Occupancy by Market (2010-2012)Occupancy 2012 vs PP Change 2010-12
8.3%
$136
0
20
40
60
80
100
120
140
160
180
200
0% 5% 10% 15%
$92
9.1%
29
Agenda1. Approach
2. Industry overview
3. Sector analysis
• Region
• Country
• City
4. Strategic options
5. Selected strategy
6. Next steps
30
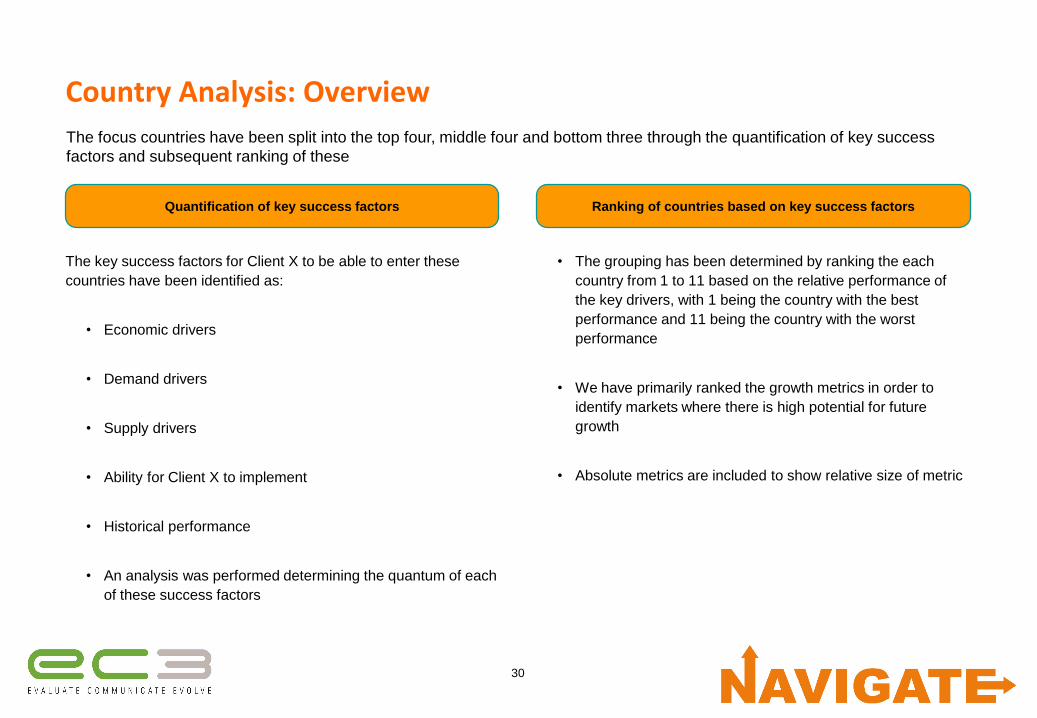
Country Analysis: Overview
The key success factors for Client X to be able to enter these
countries have been identified as:
• Economic drivers
• Demand drivers
• Supply drivers
• Ability for Client X to implement
• Historical performance
• An analysis was performed determining the quantum of each
of these success factors
The focus countries have been split into the top four, middle four and bottom three through the quantification of key success
factors and subsequent ranking of these
Quantification of key success factors Ranking of countries based on key success factors
• The grouping has been determined by ranking the each
country from 1 to 11 based on the relative performance of
the key drivers, with 1 being the country with the best
performance and 11 being the country with the worst
performance
• We have primarily ranked the growth metrics in order to
identify markets where there is high potential for future
growth
• Absolute metrics are included to show relative size of metric
31
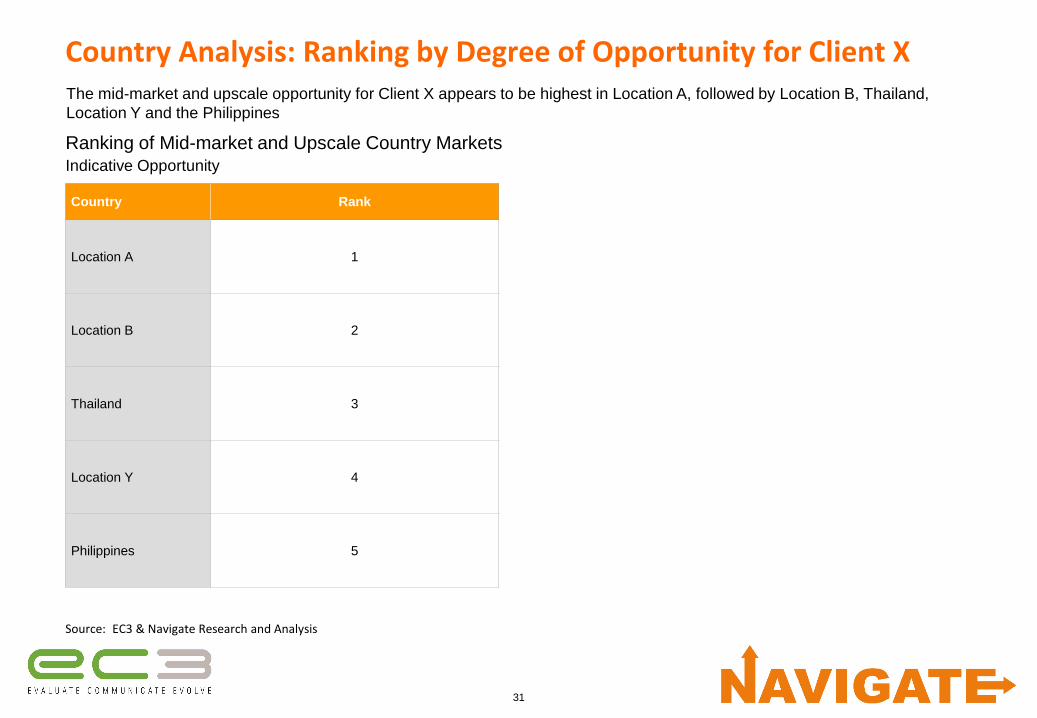
Country Analysis: Ranking by Degree of Opportunity for Client X
Source: EC3 & Navigate Research and Analysis
Country Rank
Location A 1
Location B 2
Thailand 3
Location Y 4
Philippines 5
Ranking of Mid-market and Upscale Country MarketsIndicative Opportunity
The mid-market and upscale opportunity for Client X appears to be highest in Location A, followed by Location B, Thailand,
Location Y and the Philippines

32
Country Analysis: Country Focus – Location Summary (1/2)
Country
Economy Demand DriversLocation Z
Dep.Supply Drivers
GDP Growth
2012-17
(%)
Int’l Trips
2012
(Million)
Int’l Trips
Growth
2012-17
(%)
Domestic
Trips
2012
(Million)
Domestic
Trips Growth
2011-12
(%)
Dom. Tourism
Spend1
2012
($bn)
Dom. tourism
spend growth
2012-17
(%)
Location Z
departures
2012
(Thousands)
Penetration
(Rooms per
thousand trips)
Penetration
(Rooms per
Million
Inhabitants)
Location Y 4.9% 6.4 3.0% 102 1% 19.6 5.5% n/a 0.1 1.2k
Location D 2.3% 8.3 3.2% 341 1% 216.5 4.6% 1,908 0.3 12.1k
Location A 13.3% 74.7 6.4% 1,196 10% 105.4 16.8% 361 0.2 1.0k
India 11.8% 5.0 6.7% 445 17% 22.4 10.4% n/a 0.1 0.1k
Singapore 5.5% 8.3 4.3% 906 11% 1.2 7.1% 230 1.5 6.8k
Thailand 5.9% 14.4 4.2% 85 8% 8.5 7.0% 825 0.3 5.6k
Philippines 9% 3.1 5.8% 33 15% 3.6 7.1% 485 0.3 0.3k
Location B 13.8% 2.9 8.8% 17 16% 1.5 8.5% 299 0.3 1.5k
Malaysia 6.2% 21.0 7.7% 39 6% 2.1 8.9% 111 0.4 5.8k
Indonesia 12.3% 5.5 7.5% 226 7% 7.7 12.1% 100 0.1 1.2k
Maldives n/a 0.7 4.7% n/a n/a 0.01 0% n/a 1.4 n/a
Ranked
Summary of Key Forward-looking DriversIndicative
Note: 1. Excludes business spend as data unavailable
Source: See reference pack
Key forward-looking looking drivers have been assessed for each country…

33
Country Analysis: Country Focus – Location Summary (2/2)
CountryAbility to
implement
RevPAR Performance1 RevPAR Growth in local currencies Profitability Valuation
Key Cities
2012
(USD)
Key Cities
Growth
2011-12
(%)
Luxury
2012-12
(CAGR)
Upscale /
U. Upscale
2012-12
(CAGR)
Mid-market
2012-12
(CAGR)
Budget
2012-12
(CAGR)
GOP Margin2
2012
(%)
Valuation
per Key
2012
(USD ‘000s)
Val. Growth
per Key
2008-12
(CAGR)
Location Y Very high 138 6% 3% -4% n/a n/a n/a 387 4%
Location D High 119 8% 8% -2% 2% 4% 28% 831 5%
Location A High 118 3% n/a 0% -2% n/a 44 – 50% 389 8%
India Low 207 32% 28% 30% n/a n/a 56% n/a n/a
Singapore Medium 141 22% 23% 21% 31% n/a 42% 384 10%
Thailand High 80 1% 2% 8% 14% n/a 46% 194 (0.4)%
Philippines High 79 15% 16% 11% n/a n/a n/a 96 4%
Location B High 96 35% n/a 30% n/a n/a n/a n/a n/a
Malaysia High 63 10% 11% 15% n/a n/a 30% 131 9%
Indonesia High 56 34% 16% 12% 17% n/a 26-26% 116 4%
Maldives Medium 4301 n/a n/a n/a n/a n/a n/a n/a n/a
Ranked
Summary of Key Historic DriversIndicative
Note: 1. Maldives figures for RevPAR and RevPAR growth are based upon Luxury and Upper Upscale hotels only; 2. GOP Margin is Income Before Fixed Charges based upon capital city
figures with the following exceptions: Location A (Beijing, Hong Kong and Shanghai), India (Mumbai), Indonesia (Jakarta, Bali)
Source: See reference pack
…followed by key historic drivers such as valuations, key performance indicators and profitability, and Client X’s ability to
implement

34
Country Analysis: Recap – Location Drivers Ranking (1/2)
CountryAbility to
implement
Location Z
Dep.Economy Demand Drivers Supply Drivers
Location Z
departures
2012
(Rank)
GDP
Growth
2012-17
(Rank)
Int’l Trips
2012
(Million)
Int’l Trips
Growth
2012-17
(Rank)
Domestic
Trips
2012
(Million)
Domestic
Trips Growth
2008-12
(Rank)
Dom.
Tourism
Spend1
2012
($bn)
Dom. tourism
spend growth
2012-15
(Rank)
Penetration
Rooms/Trip
(Rank)
Penetration
Rooms/Pop’n
(Rank)
Weighting Critical Very High High High High
Top 2
Location A High 4 2 74.7 5 1,1961 5 105.4 1 4 3
Location Y Very high n/a 9 6.4 11 102 10 19.6 9 2 4
Middle 5
Location B High 5 1 2.9 1 17 2 1.5 5 7 6
Philippines High 3 5 3.1 6 33 3 3.6 6 6 2
Thailand High 2 7 14.4 9 85 7 8.5 8 8 7
Indonesia High 8 3 5.5 3 226 6 7.7 2 3 5
Malaysia High 7 6 21 2 39 8 2.1 4 9 8
Bottom 4
India Low n/a 4 5 4 445 1 22.4 3 1 1
Singapore Medium 6 8 8.3 8 1 4 1.2 7 12 9
Location D High 1 10 8.3 10 341 9 216.5 10 5 10
Maldives Medium n/a n/a 0.7 7 n/a n/a 0.01 11 11 n/a
Ranking of Key Forward-looking DriversIndicative
Note: Location A figures for phase 1 based on Greater Location A; 1. Domestic trips for Location A includes mainland Location A only
Source: See reference pack
Location A and Location Y appears to provide the best opportunities for Client X
35
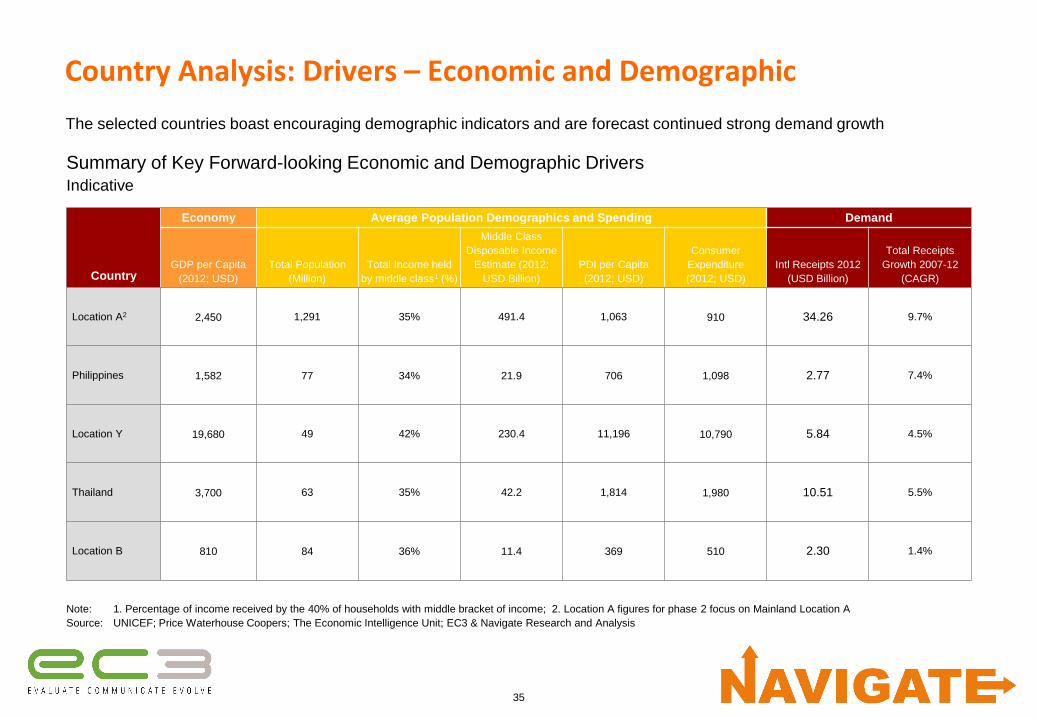
Country Analysis: Drivers – Economic and Demographic
Summary of Key Forward-looking Economic and Demographic DriversIndicative
Note: 1. Percentage of income received by the 40% of households with middle bracket of income; 2. Location A figures for phase 2 focus on Mainland Location A
Source: UNICEF; Price Waterhouse Coopers; The Economic Intelligence Unit; EC3 & Navigate Research and Analysis
Country
Economy Average Population Demographics and Spending Demand
GDP per Capita
(2012; USD)
Total Population
(Million)
Total Income held
by middle class1 (%)
Middle Class
Disposable Income
Estimate (2012;
USD Billion)
PDI per Capita
(2012; USD)
Consumer
Expenditure
(2012; USD)
Intl Receipts 2012
(USD Billion)
Total Receipts
Growth 2007-12
(CAGR)
Location A2 2,450 1,291 35% 491.4 1,063 910 34.26 9.7%
Philippines 1,582 77 34% 21.9 706 1,098 2.77 7.4%
Location Y 19,680 49 42% 230.4 11,196 10,790 5.84 4.5%
Thailand 3,700 63 35% 42.2 1,814 1,980 10.51 5.5%
Location B 810 84 36% 11.4 369 510 2.30 1.4%
The selected countries boast encouraging demographic indicators and are forecast continued strong demand growth

36
0
50
100
150
200
250
300
350
400
450
2000 2004 2008 2012 2016 2020
Country Analysis: Drivers – Investment in TourismChinese investment in travel and tourism is both significantly larger and forecast to grow more quickly than other focus countries
Note: Private capital investment includes foreign investment
Source: World Travel and Tourism Council; EC3 & Navigate Research and Analysis
Historic Forecast
CAGR
Capital Investment (2000-20)1
$ Billions
113.0
1.312.7 3.2
1.5
12.8
0.42.6 0.6
0.04
0%
10%
20%
30%
40%
50%
60%
70%
80%
90%
100%
China Philippines South Korea Thai Vietnam
Capital Investment (2012): Public vs PrivatePercent
Private
Public2000-07 2007-20
Location A 19.0% 10.1%
Location Y 2.5% 6.4%
Thailand 4.5% 6.9%
Philippines (0.8)% 5.7%
Location B 14.0% 6.5%
125.8 1.7 15.3 3.8 1.5

37
Country Analysis: Historical Performance – RevPARRevPAR performance varies, both in absolute level and growth CAGR (2012-12), by both geography and market segment
0
50
100
150
200
250
300
-10% -5% 0% 5% 10% 15% 20% 25% 30% 35% 40%
RevPAR by Market (2010-12)USD 2012 vs CAGR 2010-12
12.1%
$123
Note: Location D Budget/Economy, Malaysia Upscale / Upper Upscale, and Philippines Upscale / Upper Upscale are all 2006-07 Percentage Change; Growth rates based on local currency data
Source: Smith Travel Research; ; EC3 & Navigate Research and Analysis
Upscale /
Upper UpscaleMid-/scale Luxury
Budget /
Economy
Indonesia
Location A
Hong Kong
India
Location D
Malaysia
Philippines
Singapore
Location Y
Thailand
Location B
38
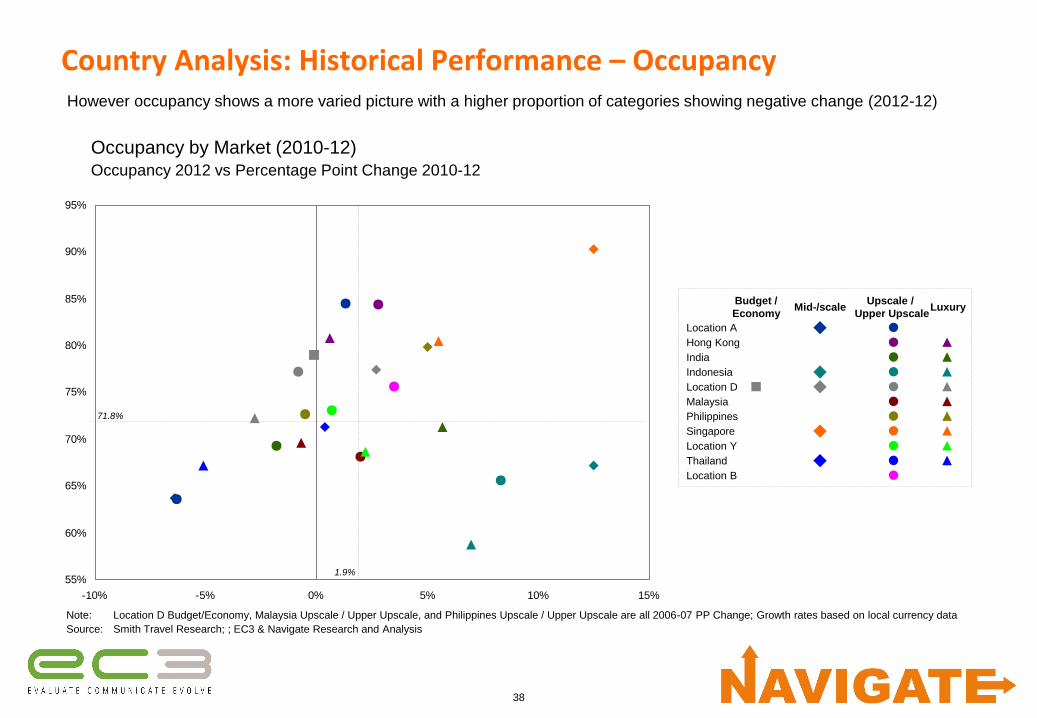
Country Analysis: Historical Performance – OccupancyHowever occupancy shows a more varied picture with a higher proportion of categories showing negative change (2012-12)
55%
60%
65%
70%
75%
80%
85%
90%
95%
-10% -5% 0% 5% 10% 15%
Occupancy by Market (2010-12)Occupancy 2012 vs Percentage Point Change 2010-12
1.9%
71.8%
Upscale /
Upper UpscaleMid-/scale Luxury
Budget /
Economy
Indonesia
Location A
Hong Kong
India
Location D
Malaysia
Philippines
Singapore
Location Y
Thailand
Location B
Note: Location D Budget/Economy, Malaysia Upscale / Upper Upscale, and Philippines Upscale / Upper Upscale are all 2006-07 PP Change; Growth rates based on local currency data
Source: Smith Travel Research; ; EC3 & Navigate Research and Analysis
39
Note: 1. The business environment rankings model examines ten separate criteria or categories, covering the political environment, the macroeconomic environment, market opportunities,
policy towards free enterprise and competition, policy towards foreign investment, foreign trade and exchange controls, taxes, financing, the labour market and infrastructure.
Government prioritization examines the level of government consideration given to travel and tourism in comparison to other industries. 2. The effectiveness of marketing and
branding relates to that used to attract tourists into the country. In both cases, the scale is from 1 to 7; The Business Environment rating scale is from 1 to 10
Source: World Economic Forum: The Travel & Tourism Competitiveness Report 2008; Economic Intelligence Unit: Country Forecast February 2008; ; EC3 & Navigate Research and Analysis
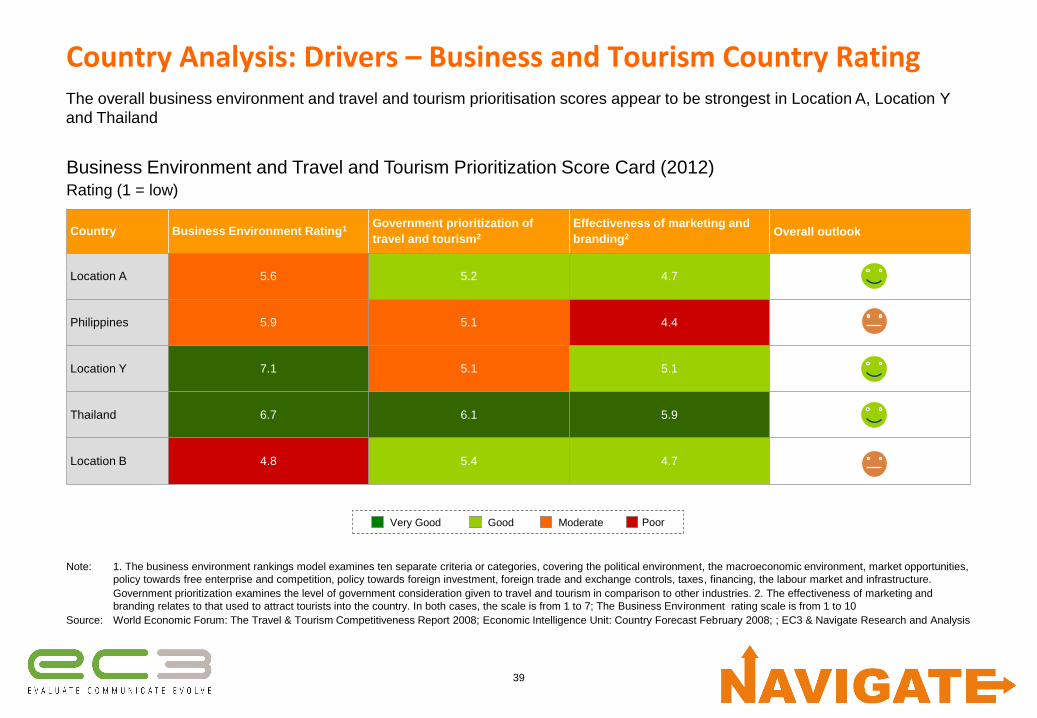
Country Analysis: Drivers – Business and Tourism Country Rating
Business Environment and Travel and Tourism Prioritization Score Card (2012)Rating (1 = low)
Good PoorModerateVery Good
Country Business Environment Rating1Government prioritization of
travel and tourism2
Effectiveness of marketing and
branding2 Overall outlook
Location A 5.6 5.2 4.7
Philippines 5.9 5.1 4.4
Location Y 7.1 5.1 5.1
Thailand 6.7 6.1 5.9
Location B 4.8 5.4 4.7
The overall business environment and travel and tourism prioritisation scores appear to be strongest in Location A, Location Y
and Thailand
40
3.5%
2.1%
5.1%
1.8%
0.2%
0%
1%
2%
3%
4%
5%
6%
7%
8%
China Philippines South Korea Thailand Vietnam
Note: Supply data is based on all global and regionally branded hotels only
Source: Lodging Econometrics; ; EC3 & Navigate Research and Analysis
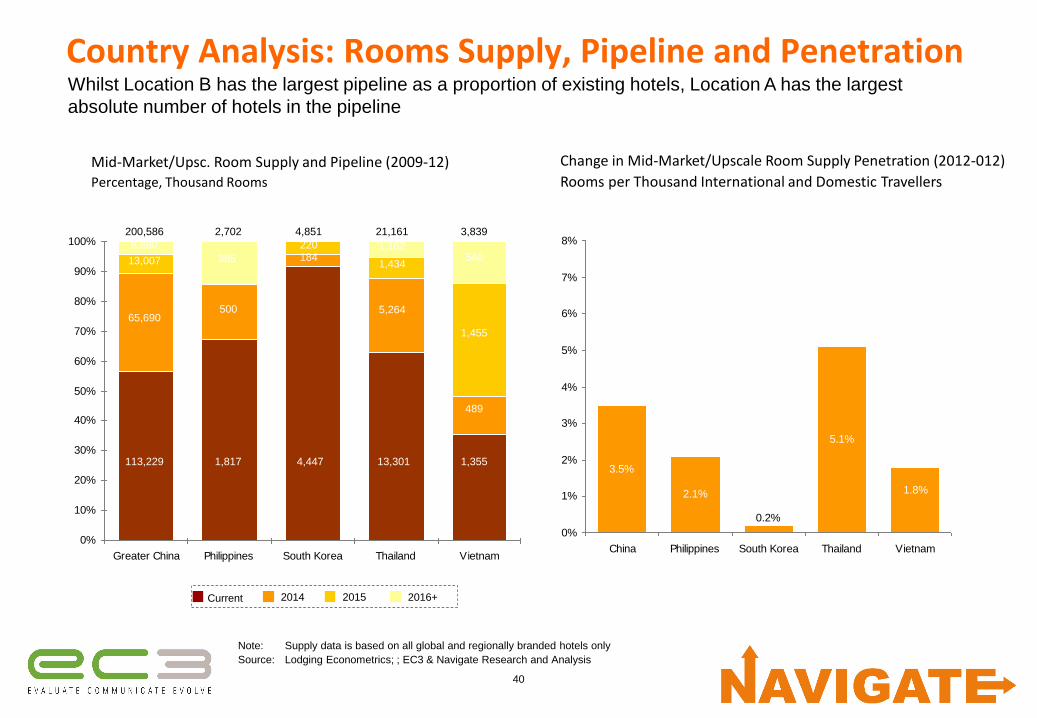
Whilst Location B has the largest pipeline as a proportion of existing hotels, Location A has the largest
absolute number of hotels in the pipeline
Mid-Market/Upsc. Room Supply and Pipeline (2009-12)Percentage, Thousand Rooms
Current 2014 2015 2016+
0%
10%
20%
30%
40%
50%
60%
70%
80%
90%
100%
Greater China Philippines South Korea Thailand Vietnam
113,229
65,690
13,007
8,660
1,817
385
4,447
184220
13,301
5,264
1,434
1,162
1,455
200,586 2,702 4,851 21,161 3,839
Country Analysis: Rooms Supply, Pipeline and Penetration
Change in Mid-Market/Upscale Room Supply Penetration (2012-012)
Rooms per Thousand International and Domestic Travellers
500
1,355
489
540
41
3.2k
21.6k 20.6k
0.9k0
5
10
15
20
25
30
35
40
45
50
China Philippines South Korea Thailand Vietnam
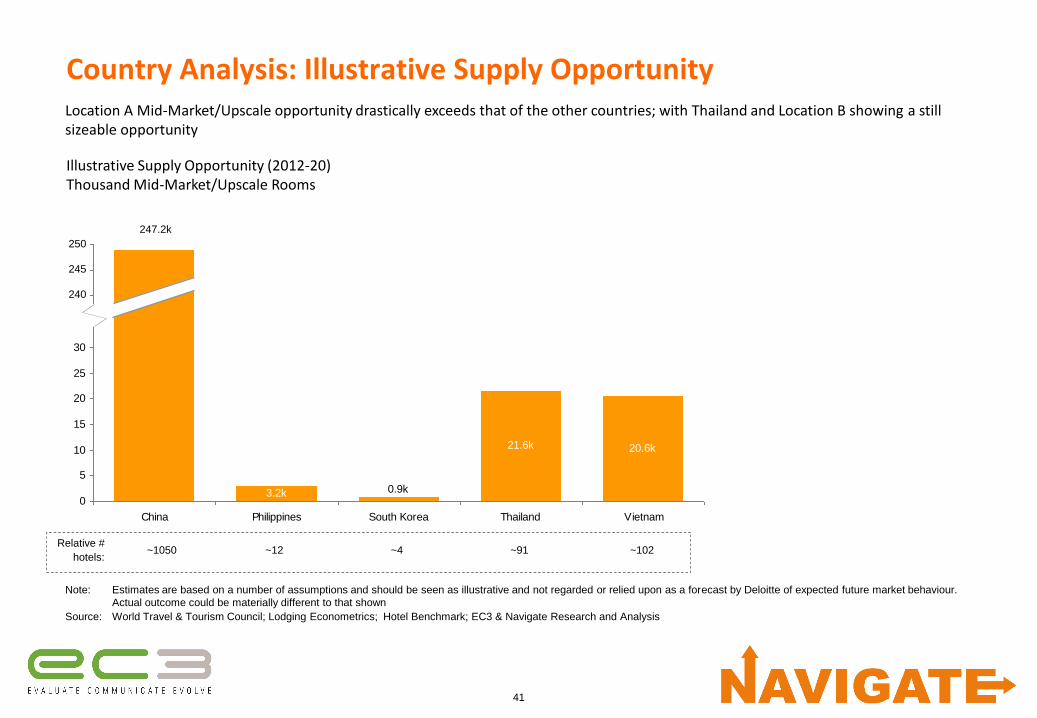
Location A Mid-Market/Upscale opportunity drastically exceeds that of the other countries; with Thailand and Location B showing a still sizeable opportunity
Illustrative Supply Opportunity (2012-20)Thousand Mid-Market/Upscale Rooms
Note: Estimates are based on a number of assumptions and should be seen as illustrative and not regarded or relied upon as a forecast by Deloitte of expected future market behaviour.
Actual outcome could be materially different to that shown
Source: World Travel & Tourism Council; Lodging Econometrics; Hotel Benchmark; EC3 & Navigate Research and Analysis
Country Analysis: Illustrative Supply Opportunity
240
245
250
247.2k
Relative #
hotels:~1050 ~12 ~4 ~91 ~102
42
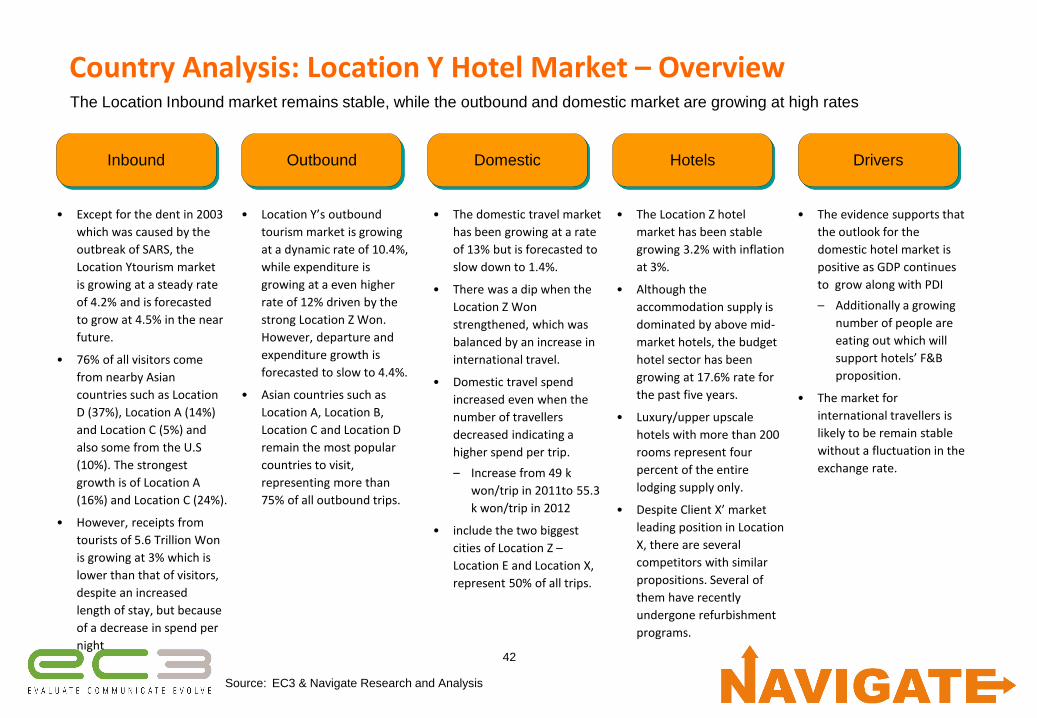
Country Analysis: Location Y Hotel Market – Overview
Source: EC3 & Navigate Research and Analysis
The Location Inbound market remains stable, while the outbound and domestic market are growing at high rates
Inbound Outbound Hotels
• Except for the dent in 2003
which was caused by the
outbreak of SARS, the
Location Ytourism market
is growing at a steady rate
of 4.2% and is forecasted
to grow at 4.5% in the near
future.
• 76% of all visitors come
from nearby Asian
countries such as Location
D (37%), Location A (14%)
and Location C (5%) and
also some from the U.S
(10%). The strongest
growth is of Location A
(16%) and Location C (24%).
• However, receipts from
tourists of 5.6 Trillion Won
is growing at 3% which is
lower than that of visitors,
despite an increased
length of stay, but because
of a decrease in spend per
night
• Location Y’s outbound
tourism market is growing
at a dynamic rate of 10.4%,
while expenditure is
growing at a even higher
rate of 12% driven by the
strong Location Z Won.
However, departure and
expenditure growth is
forecasted to slow to 4.4%.
• Asian countries such as
Location A, Location B,
Location C and Location D
remain the most popular
countries to visit,
representing more than
75% of all outbound trips.
• The Location Z hotel
market has been stable
growing 3.2% with inflation
at 3%.
• Although the
accommodation supply is
dominated by above mid-
market hotels, the budget
hotel sector has been
growing at 17.6% rate for
the past five years.
• Luxury/upper upscale
hotels with more than 200
rooms represent four
percent of the entire
lodging supply only.
• Despite Client X’ market
leading position in Location
X, there are several
competitors with similar
propositions. Several of
them have recently
undergone refurbishment
programs.
Domestic
• The domestic travel market
has been growing at a rate
of 13% but is forecasted to
slow down to 1.4%.
• There was a dip when the
Location Z Won
strengthened, which was
balanced by an increase in
international travel.
• Domestic travel spend
increased even when the
number of travellers
decreased indicating a
higher spend per trip.
– Increase from 49 k
won/trip in 2011to 55.3
k won/trip in 2012
• include the two biggest
cities of Location Z –
Location E and Location X,
represent 50% of all trips.
Drivers
• The evidence supports that
the outlook for the
domestic hotel market is
positive as GDP continues
to grow along with PDI
– Additionally a growing
number of people are
eating out which will
support hotels’ F&B
proposition.
• The market for
international travellers is
likely to be remain stable
without a fluctuation in the
exchange rate.

43
Country Analysis: Summary – Key Decision-making Drivers
Key metricsDemand
Drivers
Location Z
Arrivals
Illustrative
opportunity
Historical
Performance
(KPIs and
profitability)
Investment in
Tourism
Business
Environment
Illustrative
Yield
Ability to
implement
Weighting Medium Medium High Medium Low Low High High
Location A
Philippines
Location Y
Thailand
Location B
Summary of Key Decision-making DriversIndicative
Source: EC3 & Navigate Research and Analysis
The summary of key decision-making drivers shows medium to high results for most countries
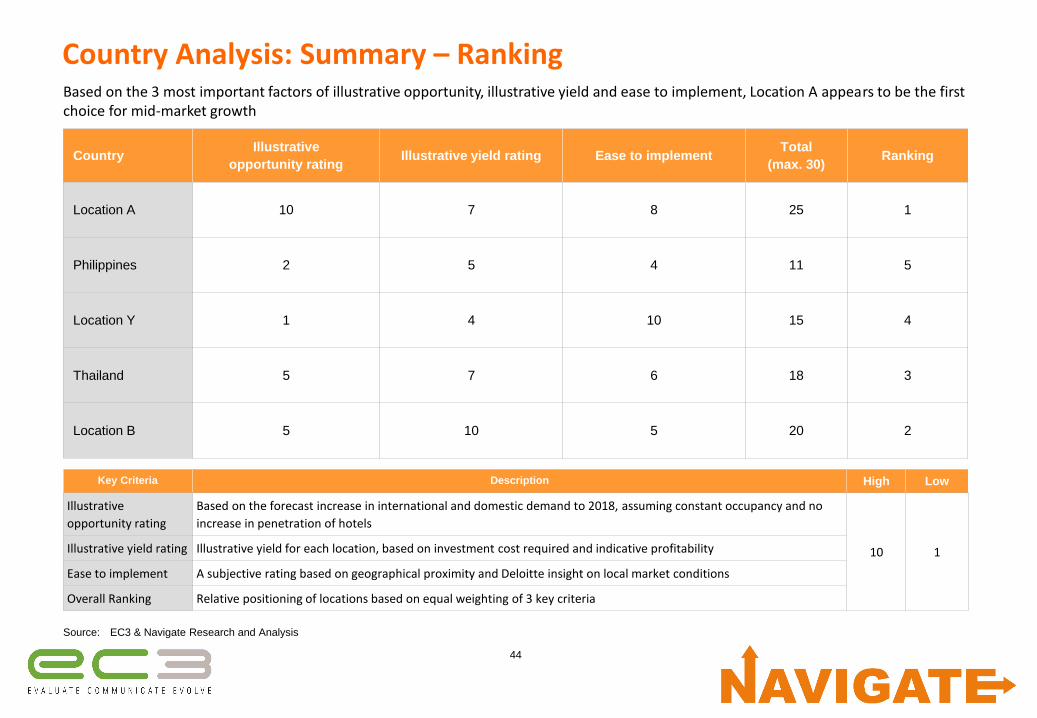
44
Country Analysis: Summary – RankingBased on the 3 most important factors of illustrative opportunity, illustrative yield and ease to implement, Location A appears to be the first choice for mid-market growth
CountryIllustrative
opportunity ratingIllustrative yield rating Ease to implement
Total
(max. 30)Ranking
Location A 10 7 8 25 1
Philippines 2 5 4 11 5
Location Y 1 4 10 15 4
Thailand 5 7 6 18 3
Location B 5 10 5 20 2
Source: EC3 & Navigate Research and Analysis
Key Criteria Description High Low
Illustrative
opportunity rating
Based on the forecast increase in international and domestic demand to 2018, assuming constant occupancy and no
increase in penetration of hotels
10 1Illustrative yield rating Illustrative yield for each location, based on investment cost required and indicative profitability
Ease to implement A subjective rating based on geographical proximity and Deloitte insight on local market conditions
Overall Ranking Relative positioning of locations based on equal weighting of 3 key criteria
45
Agenda1. Approach
2. Industry overview
3. Sector analysis
• Region
• Country
• City
4. Strategic options
5. Selected strategy
6. Next steps
46
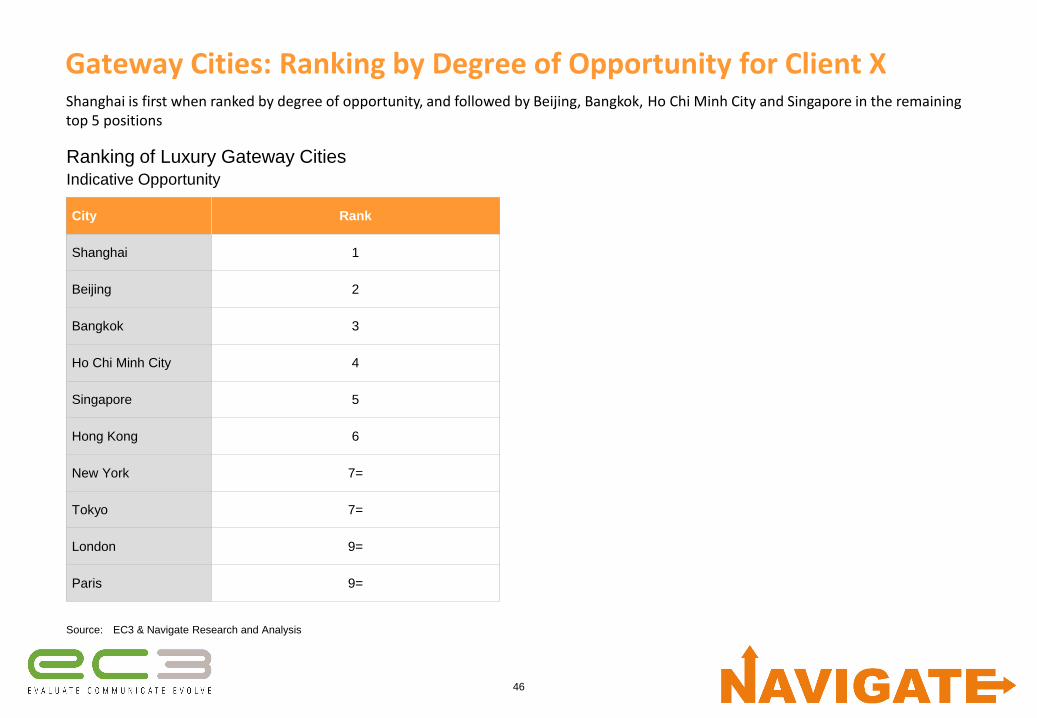
Gateway Cities: Ranking by Degree of Opportunity for Client X
City Rank
Shanghai 1
Beijing 2
Bangkok 3
Ho Chi Minh City 4
Singapore 5
Hong Kong 6
New York 7=
Tokyo 7=
London 9=
Paris 9=
Source: EC3 & Navigate Research and Analysis
Ranking of Luxury Gateway CitiesIndicative Opportunity
Shanghai is first when ranked by degree of opportunity, and followed by Beijing, Bangkok, Ho Chi Minh City and Singapore in the remaining top 5 positions
47
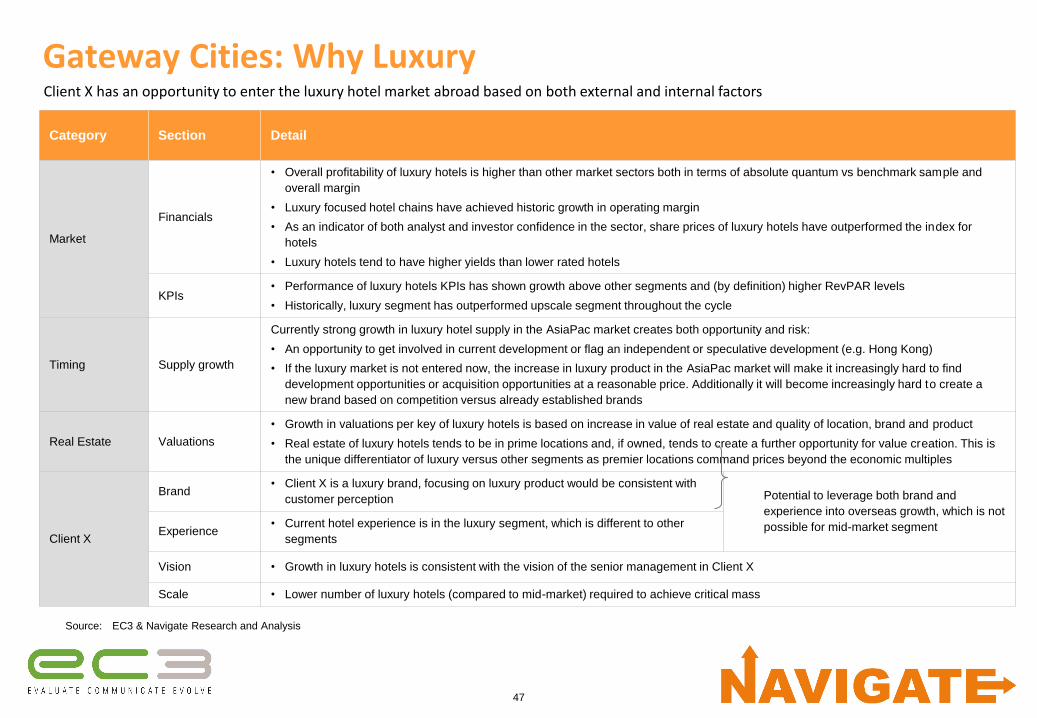
Gateway Cities: Why Luxury
Category Section Detail
Market
Financials
• Overall profitability of luxury hotels is higher than other market sectors both in terms of absolute quantum vs benchmark sample and
overall margin
• Luxury focused hotel chains have achieved historic growth in operating margin
• As an indicator of both analyst and investor confidence in the sector, share prices of luxury hotels have outperformed the index for
hotels
• Luxury hotels tend to have higher yields than lower rated hotels
KPIs• Performance of luxury hotels KPIs has shown growth above other segments and (by definition) higher RevPAR levels
• Historically, luxury segment has outperformed upscale segment throughout the cycle
Timing Supply growth
Currently strong growth in luxury hotel supply in the AsiaPac market creates both opportunity and risk:
• An opportunity to get involved in current development or flag an independent or speculative development (e.g. Hong Kong)
• If the luxury market is not entered now, the increase in luxury product in the AsiaPac market will make it increasingly hard to find
development opportunities or acquisition opportunities at a reasonable price. Additionally it will become increasingly hard to create a
new brand based on competition versus already established brands
Real Estate Valuations
• Growth in valuations per key of luxury hotels is based on increase in value of real estate and quality of location, brand and product
• Real estate of luxury hotels tends to be in prime locations and, if owned, tends to create a further opportunity for value creation. This is
the unique differentiator of luxury versus other segments as premier locations command prices beyond the economic multiples
Client X
Brand• Client X is a luxury brand, focusing on luxury product would be consistent with
customer perception Potential to leverage both brand and
experience into overseas growth, which is not
possible for mid-market segmentExperience• Current hotel experience is in the luxury segment, which is different to other
segments
Vision • Growth in luxury hotels is consistent with the vision of the senior management in Client X
Scale • Lower number of luxury hotels (compared to mid-market) required to achieve critical mass
Client X has an opportunity to enter the luxury hotel market abroad based on both external and internal factors
Source: EC3 & Navigate Research and Analysis

48
Gateway Cities: Current and Pipeline Supply
Source: Lodging Econometrics; EC3 & Navigate Research and Analysis
The largest pipelines – both in terms of total rooms and as share of current supply – are found in the Chinese cities
29.1k
51.1k
4.5k
23.2k
29.5k
54.6k
19.3k
35.9k
12.7k
26.7k
2.5k
8.1k
7.8k
6.2k
8.7k
0.2k
0.3k
0.5k
1.6k
0.6k
0
10
20
30
40
50
60
70
Bangkok Beijing Ho Chi Minh City Hong Kong London New York Paris Shanghai Singapore Tokyo
Current (2012) and Pipeline (c. 2012-20) Upper Upscale / Luxury Supply by City
Thousand Rooms
Current Supply Pipeline
Pipeline: 8.7% 15.9% 12.8% 33.6% 5.5% 11.3% 2.8% 24.1% 2.1% 0.8%
Predominantly
independents
49
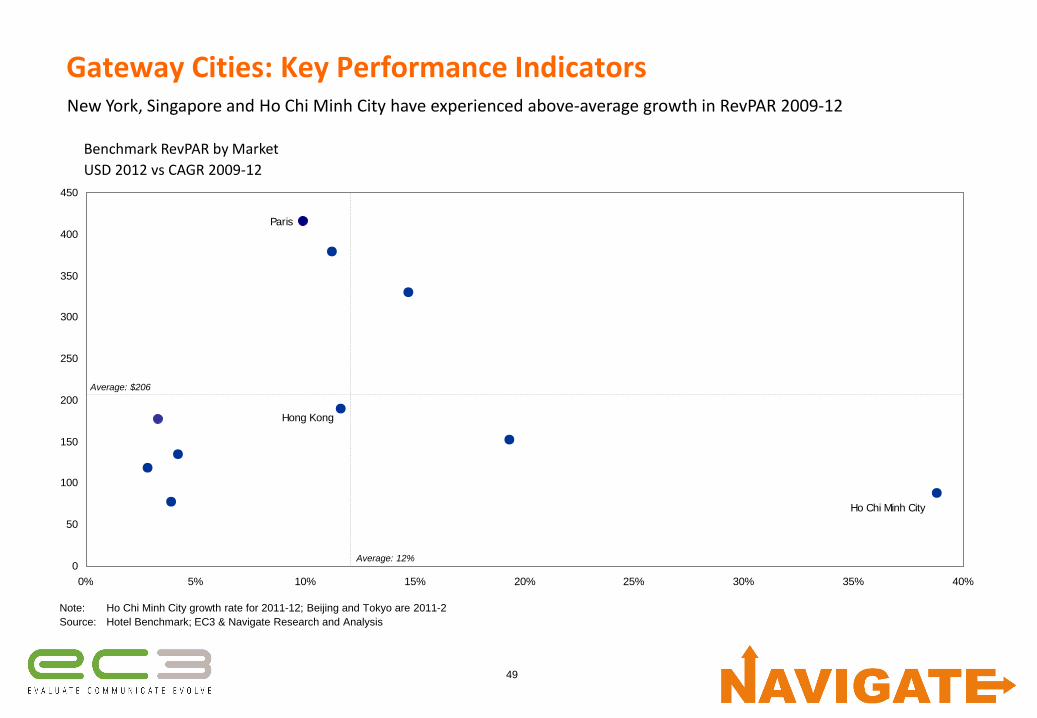
Paris
Ho Chi Minh City
Hong Kong
0
50
100
150
200
250
300
350
400
450
0% 5% 10% 15% 20% 25% 30% 35% 40%
Gateway Cities: Key Performance IndicatorsNew York, Singapore and Ho Chi Minh City have experienced above-average growth in RevPAR 2009-12
Benchmark RevPAR by Market
USD 2012 vs CAGR 2009-12
Note: Ho Chi Minh City growth rate for 2011-12; Beijing and Tokyo are 2011-2
Source: Hotel Benchmark; EC3 & Navigate Research and Analysis
Average: 12%
Average: $206
50
0
50
100
150
200
250
300
350
400
450
500
25% 30% 35% 40% 45% 50% 55%
Singapore
Hong Kong
Bangkok
Shanghai
Beijing
Ho Chi Minh City
Tokyo
Paris
London
New York
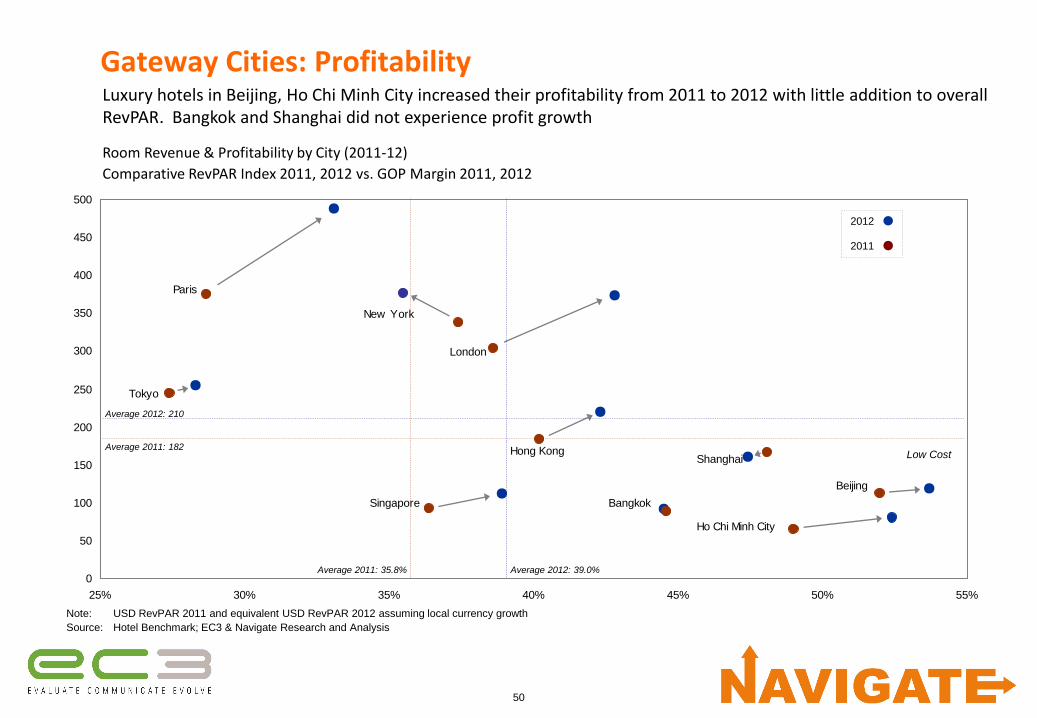
Gateway Cities: ProfitabilityLuxury hotels in Beijing, Ho Chi Minh City increased their profitability from 2011 to 2012 with little addition to overall RevPAR. Bangkok and Shanghai did not experience profit growth
Room Revenue & Profitability by City (2011-12)
Comparative RevPAR Index 2011, 2012 vs. GOP Margin 2011, 2012
Average 2012: 210
Note: USD RevPAR 2011 and equivalent USD RevPAR 2012 assuming local currency growth
Source: Hotel Benchmark; EC3 & Navigate Research and Analysis
Average 2012: 39.0%
2012
2011
Average 2011: 182
Average 2011: 35.8%
Low Cost

51
Gateway Cities: Illustrative Supply OpportunityThe Chinese gateways appear to have the largest opportunity, driven by growth in demand
43.2k
4.0k
19.7k
9.2k
19.2k
6.5k
32.5k
6.5k9.1k
17.3k
0
5
10
15
20
25
30
35
40
45
50
Bangkok Beijing HCMC Hong Kong London New York Paris Shanghai Singapore Tokyo
Illustrative Supply Opportunity (2012-20)Thousand Upper Upscale / Luxury Rooms
Note: Estimates are based on a number of assumptions and should be seen as illustrative and not regarded or relied upon as a forecast by Navigate of expected future market behaviour.
Actual outcome could be materially different to that shown
Source: World Travel & Tourism Council; Lodging Econometrics; Hotel Benchmark; EC3 & Navigate Research and Analysis
Relative #
hotels:~53 ~123 ~15 ~46 ~58 ~62 ~44 ~115 ~14 ~20
52
New York
New York 2010-12
0
100
200
300
400
500
600
700
800
900
0% 1% 2% 3% 4% 5% 6% 7% 8%
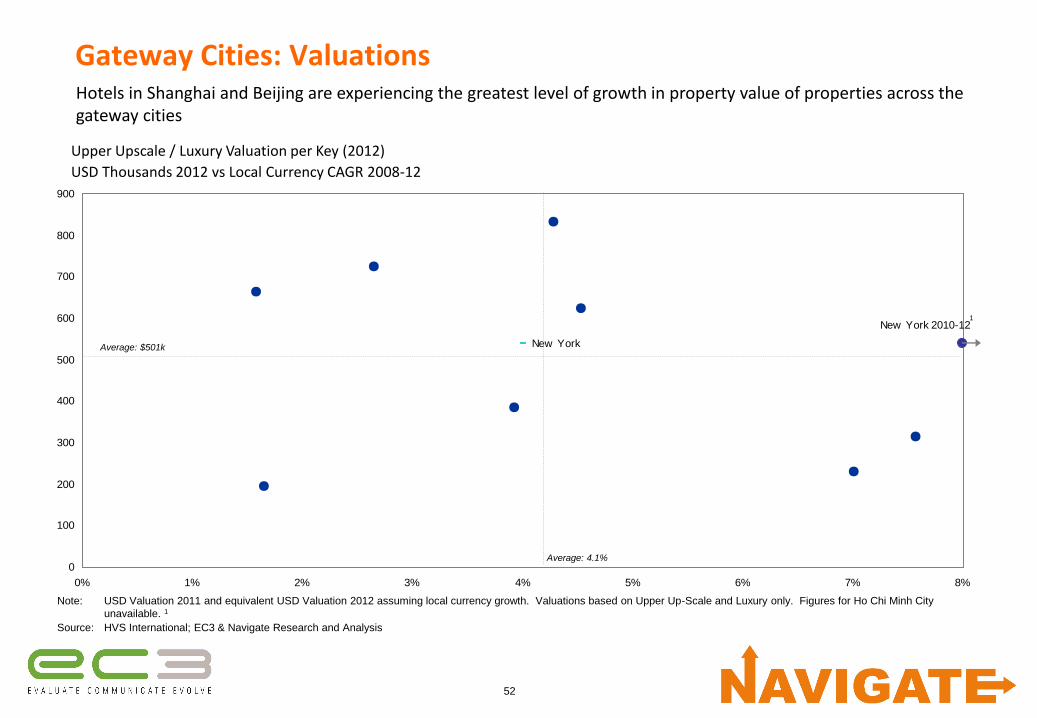
Gateway Cities: ValuationsHotels in Shanghai and Beijing are experiencing the greatest level of growth in property value of properties across the gateway cities
Upper Upscale / Luxury Valuation per Key (2012)
USD Thousands 2012 vs Local Currency CAGR 2008-12
Note: USD Valuation 2011 and equivalent USD Valuation 2012 assuming local currency growth. Valuations based on Upper Up-Scale and Luxury only. Figures for Ho Chi Minh City
unavailable. 1
Source: HVS International; EC3 & Navigate Research and Analysis
Average: 4.1%
Average: $501k
1

53
2012
2011
Singapore
Bangkok
Shanghai
Beijing
Tokyo
New York
Relatively high return and low investment costs
Gateway Cities: Yields – AcquisitionThailand and Chinese cities offer the highest yields at relatively low investment levels
Illustrative Acquisition Upper Upscale / Luxury Yield by City (2011-12)
Valuation Thousand USD vs. Benchmark Percentage Return per Annum
Note: Valuation figures not available for Ho Chi Minh City; IBFC excludes ownership costs (rates, insurance, rent, interest,
management fees, depreciation and taxes). Relative yield equals IBFC per key divided by valuation per key
Source: Hotel Benchmark; HVS International; ; EC3 & Navigate Research and Analysis
Annual Income before Fixed Charges per available room,
expressed as a percentage of valuation per Room
Locati
on X
0
100
200
300
400
500
600
700
800
900
5% 7% 9% 11% 13% 15% 17% 19% 21%
Market valuations increasing faster
than increases in hotel IBFC
Market valuations increasing less
than increases in hotel IBFC
Hong Kong
Paris
54
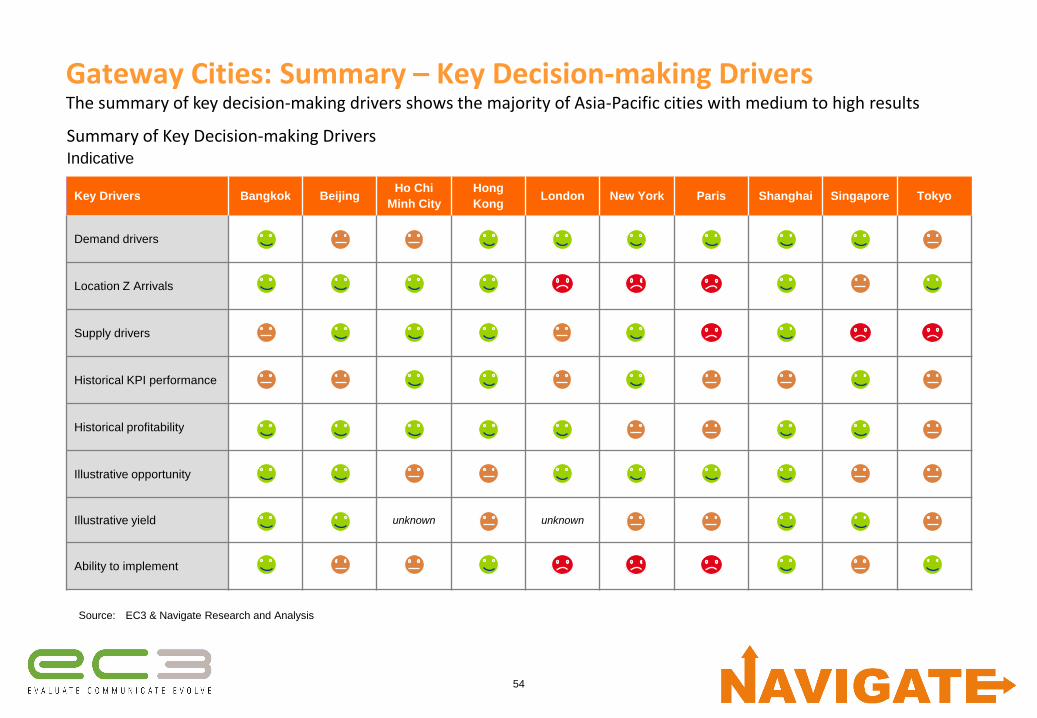
Gateway Cities: Summary – Key Decision-making Drivers
Source: EC3 & Navigate Research and Analysis
Key Drivers Bangkok BeijingHo Chi
Minh City
Hong
KongLondon New York Paris Shanghai Singapore Tokyo
Demand drivers
Location Z Arrivals
Supply drivers
Historical KPI performance
Historical profitability
Illustrative opportunity
Illustrative yield unknown unknown
Ability to implement
Summary of Key Decision-making DriversIndicative
The summary of key decision-making drivers shows the majority of Asia-Pacific cities with medium to high results
55
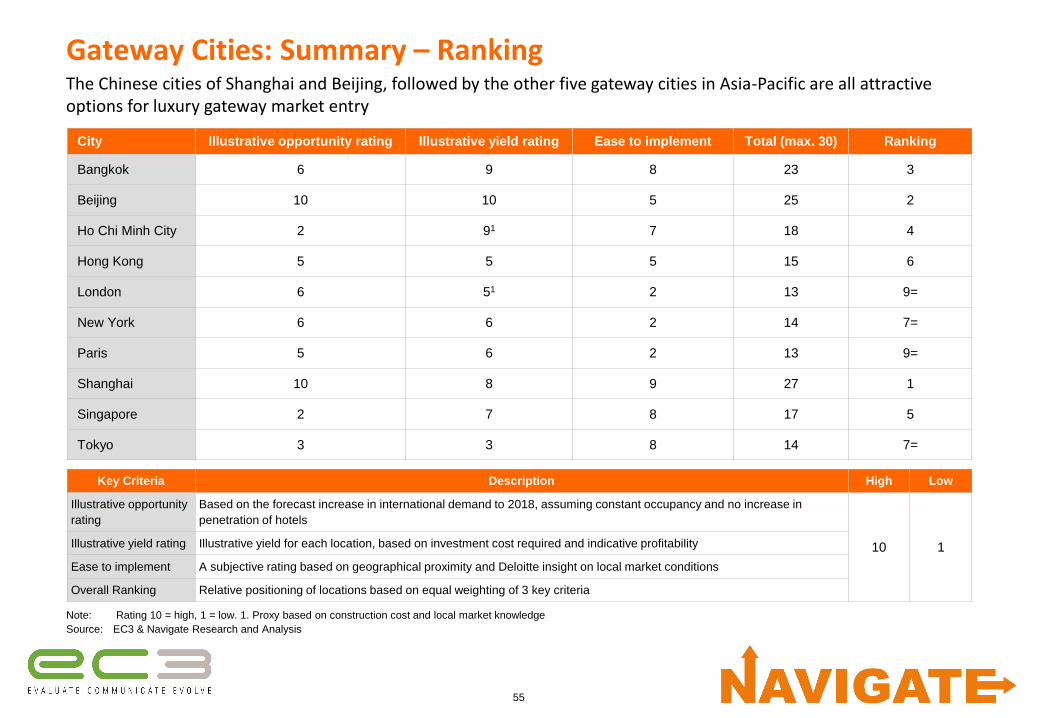
Gateway Cities: Summary – RankingThe Chinese cities of Shanghai and Beijing, followed by the other five gateway cities in Asia-Pacific are all attractive options for luxury gateway market entry
City Illustrative opportunity rating Illustrative yield rating Ease to implement Total (max. 30) Ranking
Bangkok 6 9 8 23 3
Beijing 10 10 5 25 2
Ho Chi Minh City 2 91 7 18 4
Hong Kong 5 5 5 15 6
London 6 51 2 13 9=
New York 6 6 2 14 7=
Paris 5 6 2 13 9=
Shanghai 10 8 9 27 1
Singapore 2 7 8 17 5
Tokyo 3 3 8 14 7=
Note: Rating 10 = high, 1 = low. 1. Proxy based on construction cost and local market knowledge
Source: EC3 & Navigate Research and Analysis
Key Criteria Description High Low
Illustrative opportunity
rating
Based on the forecast increase in international demand to 2018, assuming constant occupancy and no increase in
penetration of hotels
10 1Illustrative yield rating Illustrative yield for each location, based on investment cost required and indicative profitability
Ease to implement A subjective rating based on geographical proximity and Deloitte insight on local market conditions
Overall Ranking Relative positioning of locations based on equal weighting of 3 key criteria
56
Agenda1. Approach
2. Industry overview
3. Sector analysis
4. Strategic options
• Overview
• Organic
• M&A
5. Selected strategy
6. Next steps
57
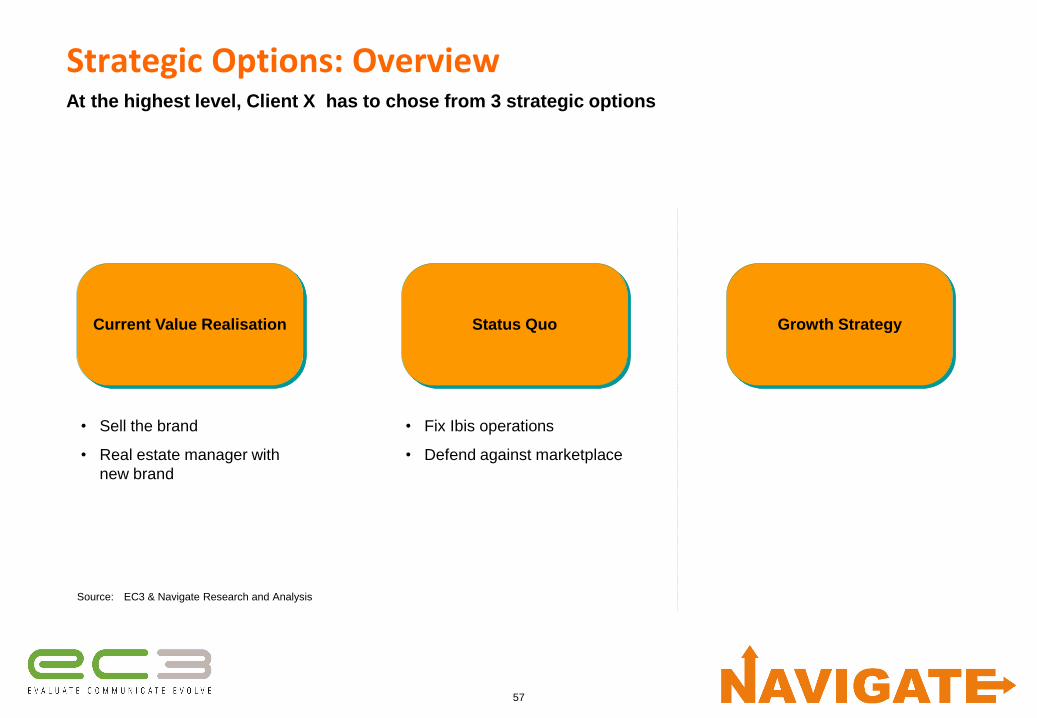
Strategic Options: Overview
Current Value Realisation Status Quo Growth Strategy
At the highest level, Client X has to chose from 3 strategic options
Source: EC3 & Navigate Research and Analysis
• Sell the brand
• Real estate manager with
new brand
• Fix Ibis operations
• Defend against marketplace
58
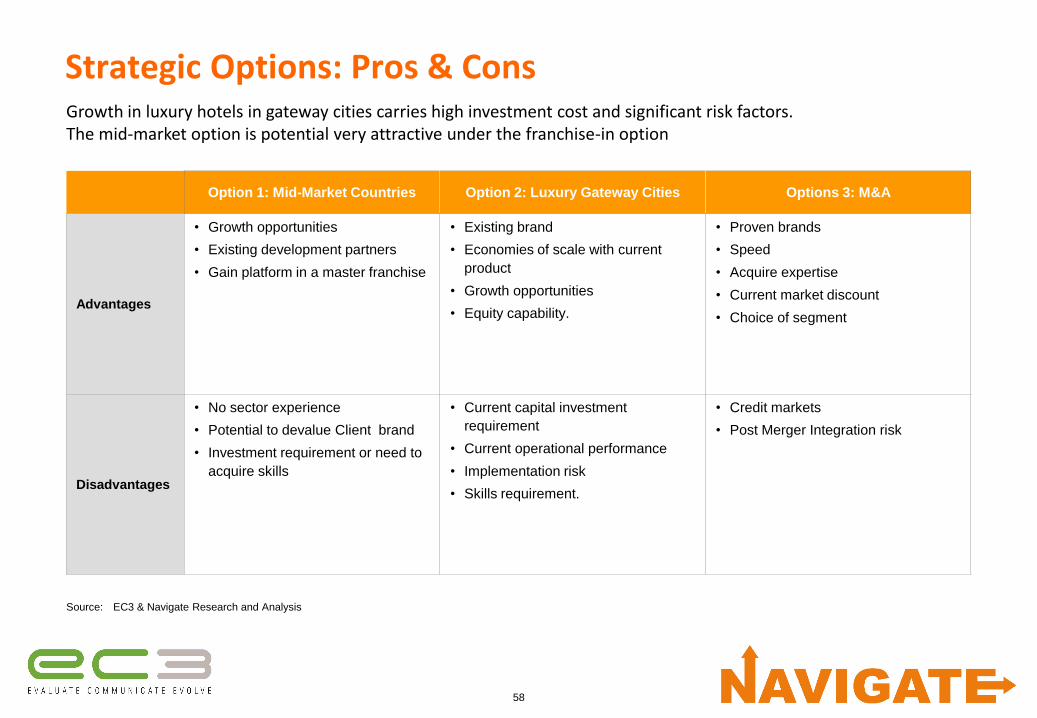
Strategic Options: Pros & ConsGrowth in luxury hotels in gateway cities carries high investment cost and significant risk factors.The mid-market option is potential very attractive under the franchise-in option
Option 1: Mid-Market Countries Option 2: Luxury Gateway Cities Options 3: M&A
Advantages
• Growth opportunities
• Existing development partners
• Gain platform in a master franchise
• Existing brand
• Economies of scale with current
product
• Growth opportunities
• Equity capability.
• Proven brands
• Speed
• Acquire expertise
• Current market discount
• Choice of segment
Disadvantages
• No sector experience
• Potential to devalue Client brand
• Investment requirement or need to
acquire skills
• Current capital investment
requirement
• Current operational performance
• Implementation risk
• Skills requirement.
• Credit markets
• Post Merger Integration risk
Source: EC3 & Navigate Research and Analysis

59
Strategic Options: Organic Growth – Available Operating ModelsClient X will need to follow an owned/leased operating model in both the mid-market and luxury sector in the short to medium term, until it is able to prove its ability to operate hotels profitably to owners
Owned/Leased
under Client X Brand
or Client X Brand
Family
Entering the mid-market with a Client X brand would
be high risk due to the lack of an existing brand, and
lack of experience and skills in the mid-market.
If Client X is willing to commit significant investment
capital into owned/leased hotels, it will be able to
enter gateway cities in the luxury sector
Managed
under Client X Brand
or Client X Brand
Family
For the above reasons it would be highly risky to
attempt to manage hotels under a Client X mid-
market brand. Furthermore, returns are likely to be
higher under a franchised in brand.
Client X will only be able to secure management
contracts in the luxury sector in gateway cities (other
than potentially in Location X) once it has a proven
track record. This will be in the medium to long term.
Owned/Leased
under franchised in
brand
Depending availability within each country, Client X
has the potential to franchise in a global brand and
capitalise on their brand, operational experience and
procedures, sales and marketing platform, etc.
Not applicable as luxury operators do not franchise
out their brands.
Managed
under franchised in
brand
Not applicable in short to medium term until Client X
can prove to owners that it can operate effectively.
Not applicable as luxury operators do not franchise
out their brands.
Mid-market in focus countries Luxury in gateway cities
= Operating models available to Client X in the short to medium term
Source: EC3 & Navigate Research and Analysis
60
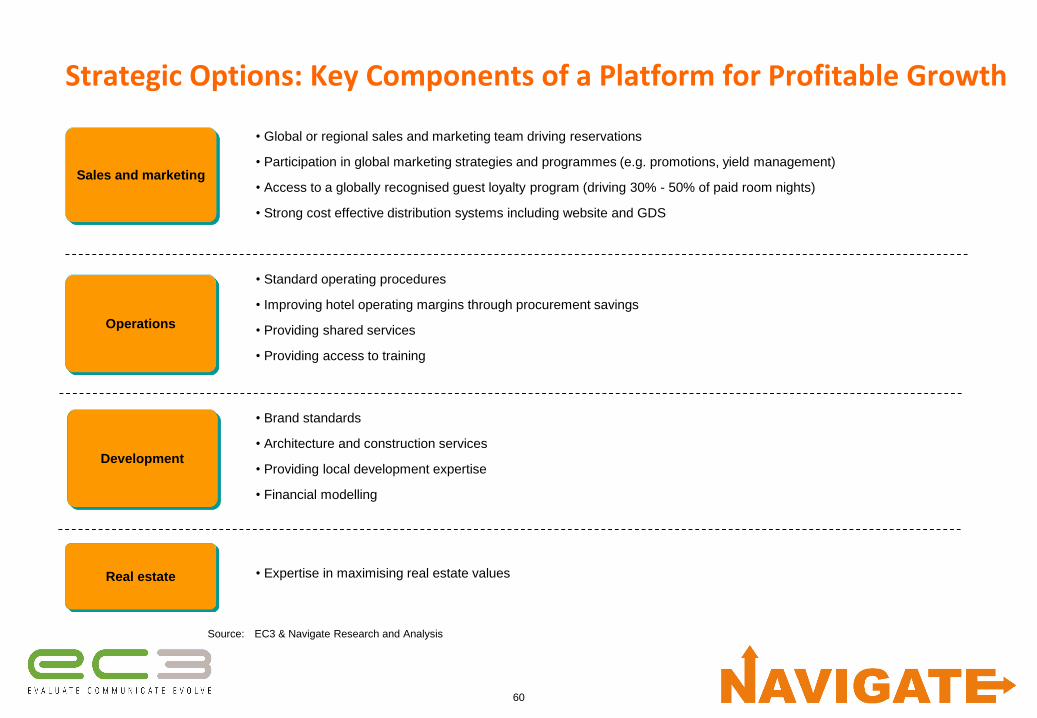
Strategic Options: Key Components of a Platform for Profitable Growth
Sales and marketing
• Global or regional sales and marketing team driving reservations
• Participation in global marketing strategies and programmes (e.g. promotions, yield management)
• Access to a globally recognised guest loyalty program (driving 30% - 50% of paid room nights)
• Strong cost effective distribution systems including website and GDS
• Standard operating procedures
• Improving hotel operating margins through procurement savings
• Providing shared services
• Providing access to training
• Brand standards
• Architecture and construction services
• Providing local development expertise
• Financial modelling
• Expertise in maximising real estate values
Operations
Development
Source: EC3 & Navigate Research and Analysis
Real estate

61
Strategic Options: Focus Country International ArrivalsBased on number of international arrivals (line width) and historical growth (%), Location A and Location B appear to be the most attractive country options. However, this will depend on risk/reward aptitude
Note: Reflects major population flows between focus countries only
Source: Euromonitor; EC3 & Navigate Research and Analysis
Location ALocation B
ThailandPhilippines
Rep. of
Location Z 30%15%
16%
18%
16%
22%
3%
51%
20%
4%
13%
11%
12%
Suggested countries of focus
3%Historical growth &
International Arrivals
2008-12
Approx. # Int’l Arrivals
3.0m
1.0m
0.5m
62
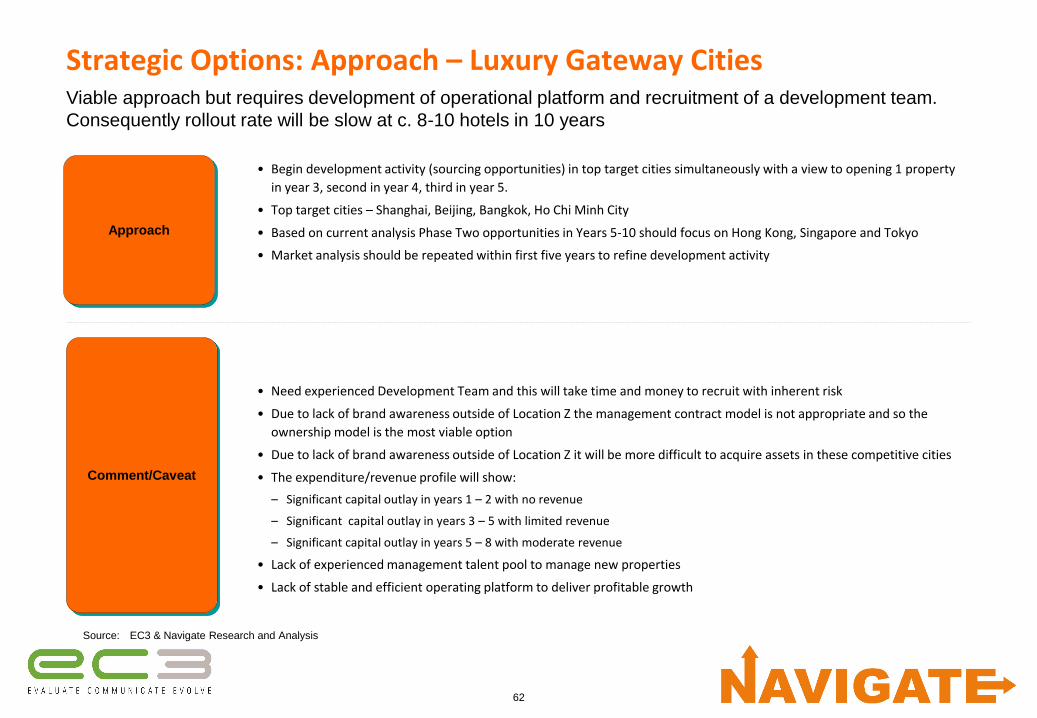
Strategic Options: Approach – Luxury Gateway CitiesViable approach but requires development of operational platform and recruitment of a development team.
Consequently rollout rate will be slow at c. 8-10 hotels in 10 years
Approach
• Begin development activity (sourcing opportunities) in top target cities simultaneously with a view to opening 1 property
in year 3, second in year 4, third in year 5.
• Top target cities – Shanghai, Beijing, Bangkok, Ho Chi Minh City
• Based on current analysis Phase Two opportunities in Years 5-10 should focus on Hong Kong, Singapore and Tokyo
• Market analysis should be repeated within first five years to refine development activity
• Need experienced Development Team and this will take time and money to recruit with inherent risk
• Due to lack of brand awareness outside of Location Z the management contract model is not appropriate and so the
ownership model is the most viable option
• Due to lack of brand awareness outside of Location Z it will be more difficult to acquire assets in these competitive cities
• The expenditure/revenue profile will show:
– Significant capital outlay in years 1 – 2 with no revenue
– Significant capital outlay in years 3 – 5 with limited revenue
– Significant capital outlay in years 5 – 8 with moderate revenue
• Lack of experienced management talent pool to manage new properties
• Lack of stable and efficient operating platform to deliver profitable growth
Comment/Caveat
Source: EC3 & Navigate Research and Analysis
63
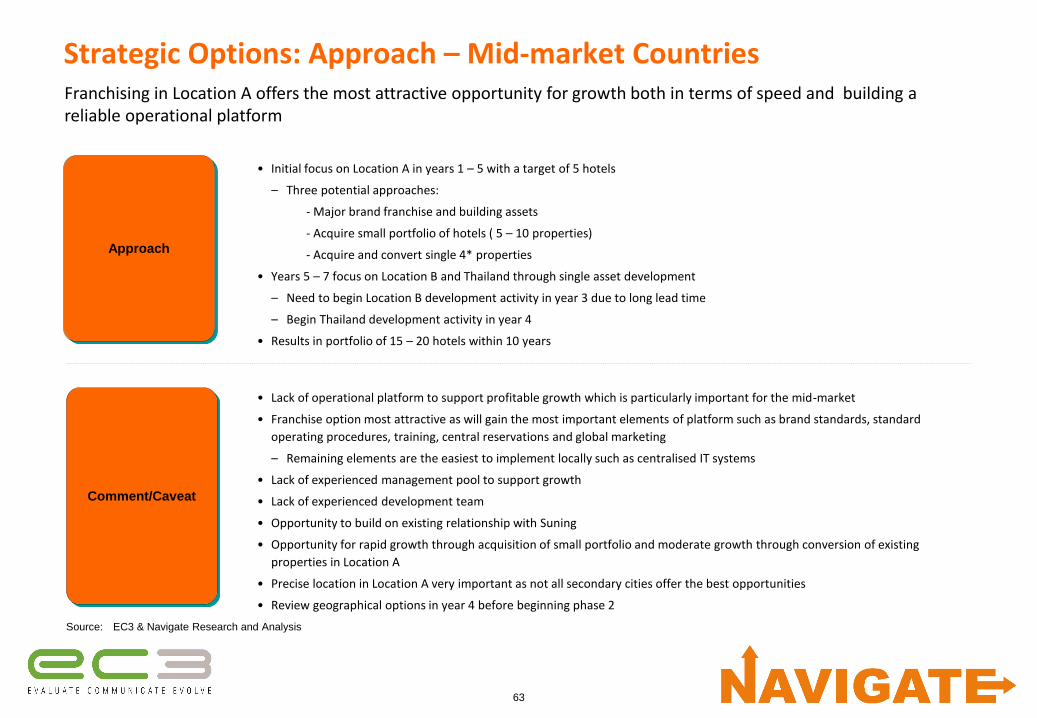
Strategic Options: Approach – Mid-market CountriesFranchising in Location A offers the most attractive opportunity for growth both in terms of speed and building a reliable operational platform
Approach
• Initial focus on Location A in years 1 – 5 with a target of 5 hotels
– Three potential approaches:
- Major brand franchise and building assets
- Acquire small portfolio of hotels ( 5 – 10 properties)
- Acquire and convert single 4* properties
• Years 5 – 7 focus on Location B and Thailand through single asset development
– Need to begin Location B development activity in year 3 due to long lead time
– Begin Thailand development activity in year 4
• Results in portfolio of 15 – 20 hotels within 10 years
• Lack of operational platform to support profitable growth which is particularly important for the mid-market
• Franchise option most attractive as will gain the most important elements of platform such as brand standards, standard
operating procedures, training, central reservations and global marketing
– Remaining elements are the easiest to implement locally such as centralised IT systems
• Lack of experienced management pool to support growth
• Lack of experienced development team
• Opportunity to build on existing relationship with Suning
• Opportunity for rapid growth through acquisition of small portfolio and moderate growth through conversion of existing
properties in Location A
• Precise location in Location A very important as not all secondary cities offer the best opportunities
• Review geographical options in year 4 before beginning phase 2
Comment/Caveat
Source: EC3 & Navigate Research and Analysis
64
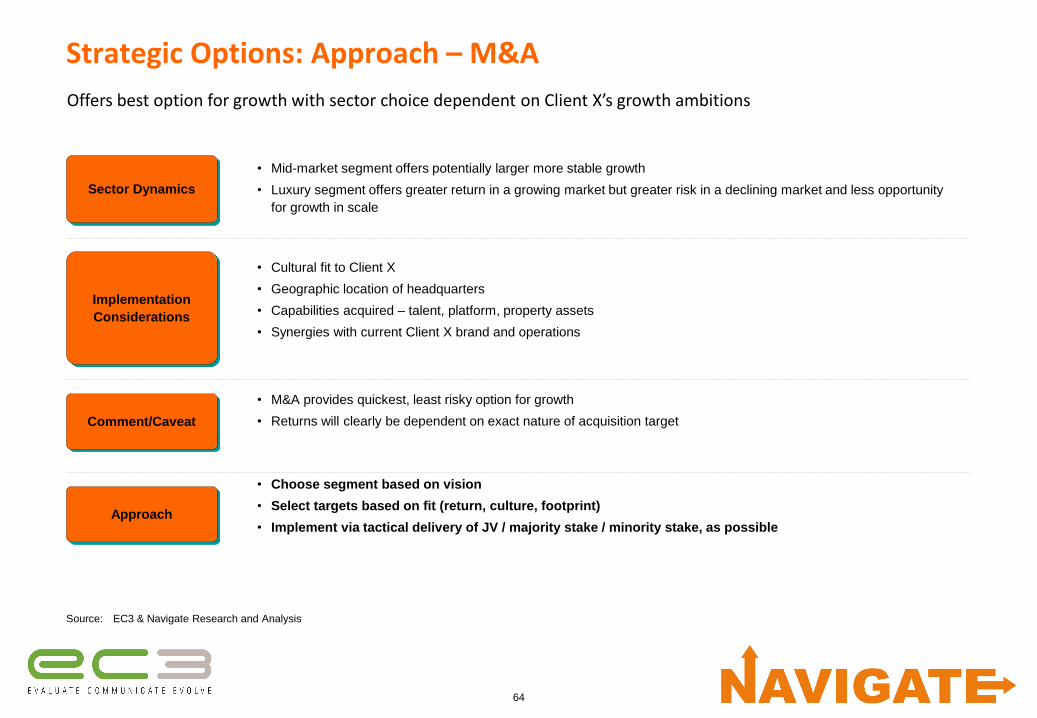
Strategic Options: Approach – M&A
Offers best option for growth with sector choice dependent on Client X’s growth ambitions
Sector Dynamics
• Mid-market segment offers potentially larger more stable growth
• Luxury segment offers greater return in a growing market but greater risk in a declining market and less opportunity
for growth in scale
• Cultural fit to Client X
• Geographic location of headquarters
• Capabilities acquired – talent, platform, property assets
• Synergies with current Client X brand and operations
• M&A provides quickest, least risky option for growth
• Returns will clearly be dependent on exact nature of acquisition target
• Choose segment based on vision
• Select targets based on fit (return, culture, footprint)
• Implement via tactical delivery of JV / majority stake / minority stake, as possible
Implementation
Considerations
Comment/Caveat
Source: EC3 & Navigate Research and Analysis
Approach
65
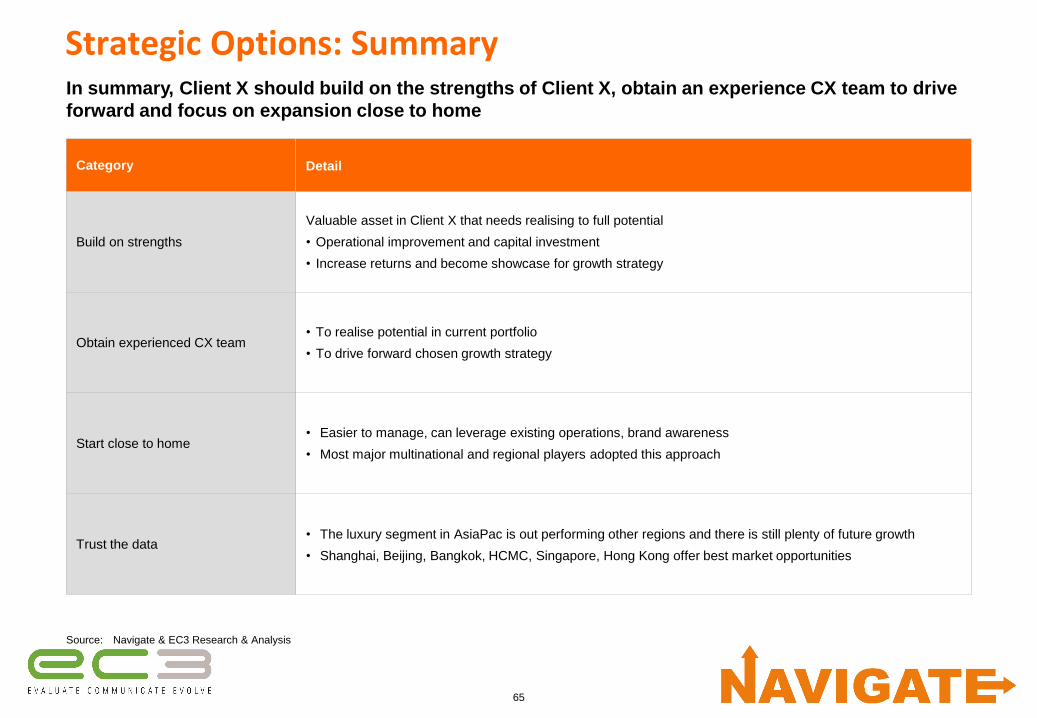
Strategic Options: Summary
Category Detail
Build on strengths
Valuable asset in Client X that needs realising to full potential
• Operational improvement and capital investment
• Increase returns and become showcase for growth strategy
Obtain experienced CX team• To realise potential in current portfolio
• To drive forward chosen growth strategy
Start close to home• Easier to manage, can leverage existing operations, brand awareness
• Most major multinational and regional players adopted this approach
Trust the data• The luxury segment in AsiaPac is out performing other regions and there is still plenty of future growth
• Shanghai, Beijing, Bangkok, HCMC, Singapore, Hong Kong offer best market opportunities
Source: Navigate & EC3 Research & Analysis
In summary, Client X should build on the strengths of Client X, obtain an experience CX team to drive
forward and focus on expansion close to home
66
Agenda
1. Approach
2. Industry overview
3. Sector analysis
4. Strategic options
5. Selected strategy
• Foundation stage
• Growth stage
• Financial implications
6. Next steps
67
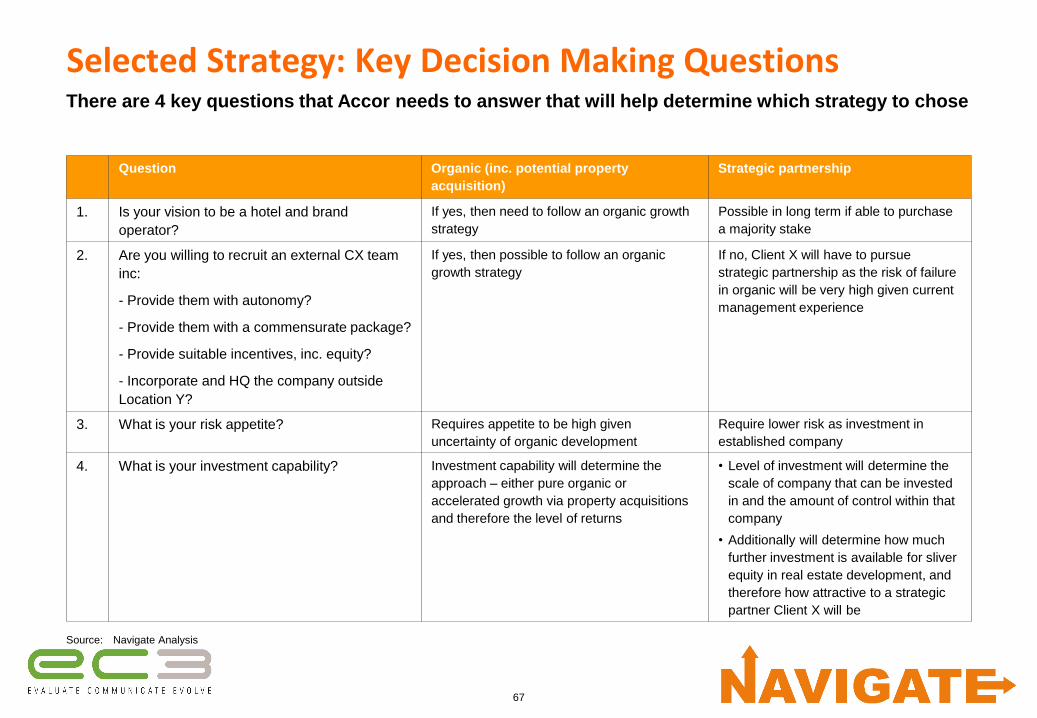
Selected Strategy: Key Decision Making QuestionsThere are 4 key questions that Accor needs to answer that will help determine which strategy to chose
Source: Navigate Analysis
Question Organic (inc. potential property
acquisition)
Strategic partnership
1. Is your vision to be a hotel and brand
operator?
If yes, then need to follow an organic growth
strategy
Possible in long term if able to purchase
a majority stake
2. Are you willing to recruit an external CX team
inc:
- Provide them with autonomy?
- Provide them with a commensurate package?
- Provide suitable incentives, inc. equity?
- Incorporate and HQ the company outside
Location Y?
If yes, then possible to follow an organic
growth strategy
If no, Client X will have to pursue
strategic partnership as the risk of failure
in organic will be very high given current
management experience
3. What is your risk appetite? Requires appetite to be high given
uncertainty of organic development
Require lower risk as investment in
established company
4. What is your investment capability? Investment capability will determine the
approach – either pure organic or
accelerated growth via property acquisitions
and therefore the level of returns
• Level of investment will determine the
scale of company that can be invested
in and the amount of control within that
company
• Additionally will determine how much
further investment is available for sliver
equity in real estate development, and
therefore how attractive to a strategic
partner Client X will be
68
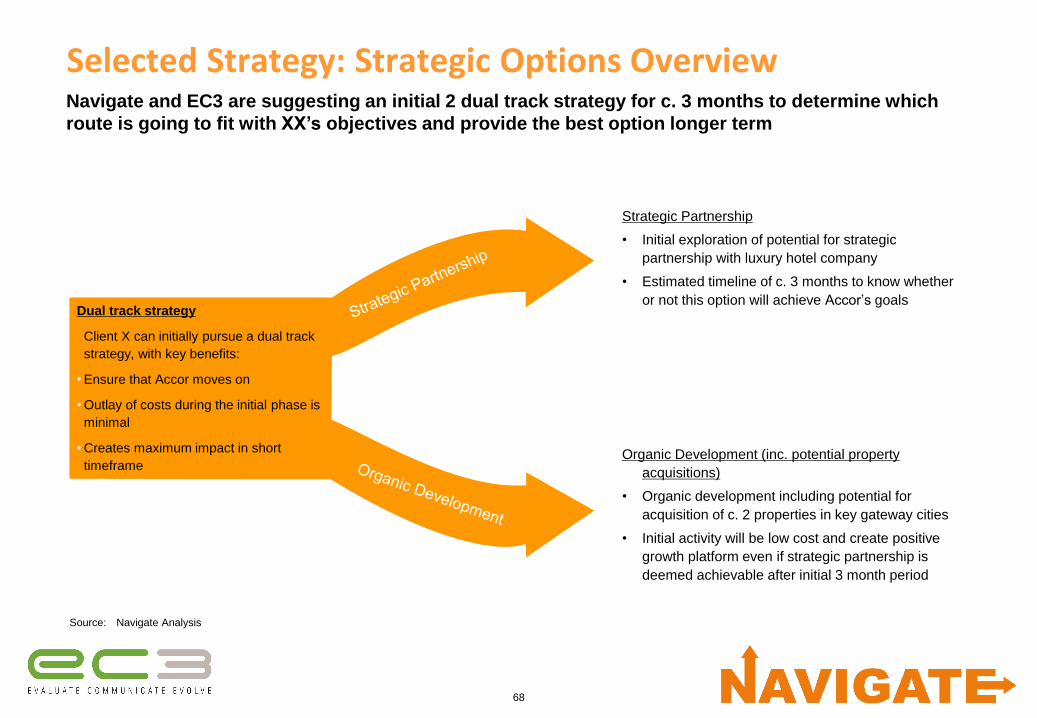
Selected Strategy: Strategic Options OverviewNavigate and EC3 are suggesting an initial 2 dual track strategy for c. 3 months to determine which
route is going to fit with XX’s objectives and provide the best option longer term
Source: Navigate Analysis
Dual track strategy
Client X can initially pursue a dual track
strategy, with key benefits:
• Ensure that Accor moves on
• Outlay of costs during the initial phase is
minimal
• Creates maximum impact in short
timeframe
Strategic Partnership
• Initial exploration of potential for strategic
partnership with luxury hotel company
• Estimated timeline of c. 3 months to know whether
or not this option will achieve Accor’s goals
Organic Development (inc. potential property
acquisitions)
• Organic development including potential for
acquisition of c. 2 properties in key gateway cities
• Initial activity will be low cost and create positive
growth platform even if strategic partnership is
deemed achievable after initial 3 month period
69
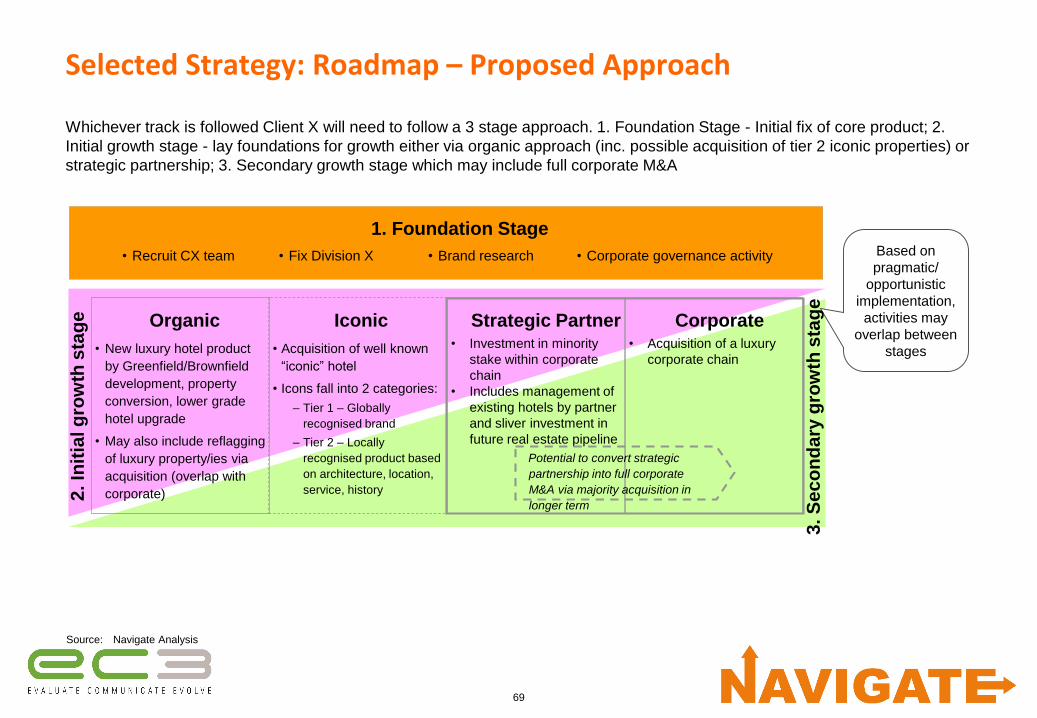
Selected Strategy: Roadmap – Proposed Approach
Whichever track is followed Client X will need to follow a 3 stage approach. 1. Foundation Stage - Initial fix of core product; 2.
Initial growth stage - lay foundations for growth either via organic approach (inc. possible acquisition of tier 2 iconic properties) or
strategic partnership; 3. Secondary growth stage which may include full corporate M&A
Organic Iconic Corporate
1. Foundation Stage
• Recruit CX team • Fix Division X • Brand research • Corporate governance activity Based on
pragmatic/
opportunistic
implementation,
activities may
overlap between
stages
2. In
itia
l g
row
th s
tag
e
3. S
ec
on
da
ry g
row
th s
tag
e
Source: Navigate Analysis
• New luxury hotel product
by Greenfield/Brownfield
development, property
conversion, lower grade
hotel upgrade
• May also include reflagging
of luxury property/ies via
acquisition (overlap with
corporate)
• Acquisition of well known
“iconic” hotel
• Icons fall into 2 categories:
– Tier 1 – Globally
recognised brand
– Tier 2 – Locally
recognised product based
on architecture, location,
service, history
• Acquisition of a luxury
corporate chain
• Investment in minority
stake within corporate
chain
• Includes management of
existing hotels by partner
and sliver investment in
future real estate pipeline
Strategic Partner
Potential to convert strategic
partnership into full corporate
M&A via majority acquisition in
longer term

70
Agenda
1. Approach
2. Industry overview
3. Sector analysis
4. Strategic options
5. Selected strategy
• Foundation stage
• Growth stage
• Financial implications
6. Next steps
71
Agenda
1. Approach
2. Industry overview
3. Sector analysis
4. Strategic options
5. Selected strategy
• Foundation stage
• Growth stage
• Financial implications
6. Next steps
72
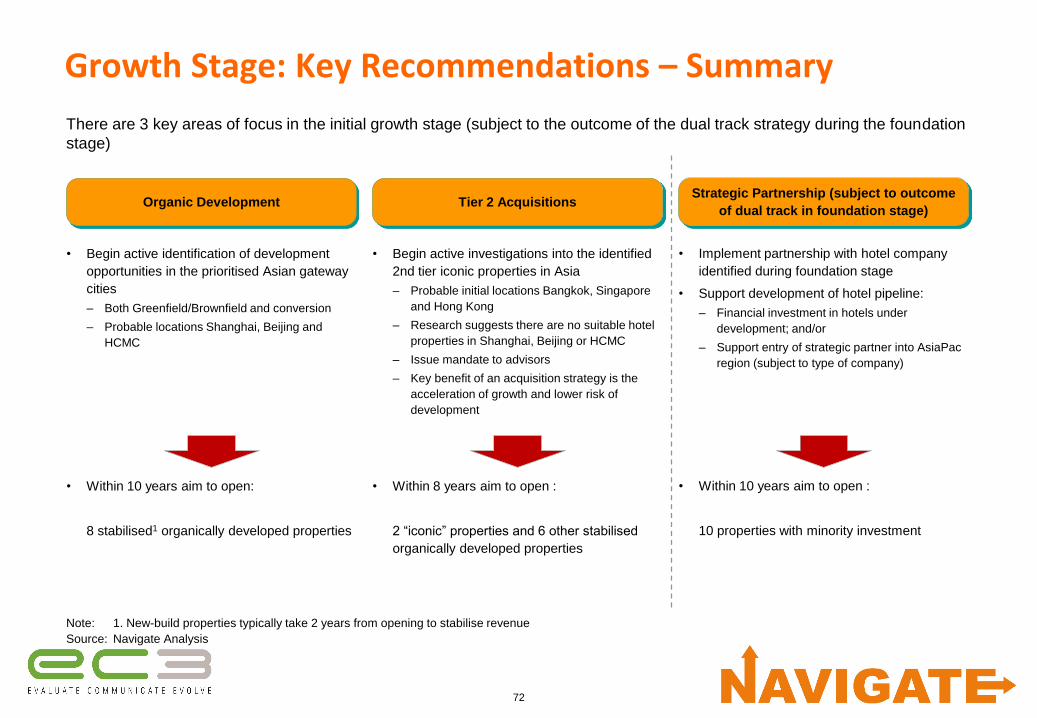
Growth Stage: Key Recommendations – Summary
There are 3 key areas of focus in the initial growth stage (subject to the outcome of the dual track strategy during the foundation
stage)
Organic Development Tier 2 Acquisitions
Note: 1. New-build properties typically take 2 years from opening to stabilise revenue
Source: Navigate Analysis
Strategic Partnership (subject to outcome
of dual track in foundation stage)
• Begin active investigations into the identified
2nd tier iconic properties in Asia
– Probable initial locations Bangkok, Singapore
and Hong Kong
– Research suggests there are no suitable hotel
properties in Shanghai, Beijing or HCMC
– Issue mandate to advisors
– Key benefit of an acquisition strategy is the
acceleration of growth and lower risk of
development
• Begin active identification of development
opportunities in the prioritised Asian gateway
cities
– Both Greenfield/Brownfield and conversion
– Probable locations Shanghai, Beijing and
HCMC
• Implement partnership with hotel company
identified during foundation stage
• Support development of hotel pipeline:
– Financial investment in hotels under
development; and/or
– Support entry of strategic partner into AsiaPac
region (subject to type of company)
• Within 8 years aim to open :
2 “iconic” properties and 6 other stabilised
organically developed properties
• Within 10 years aim to open:
8 stabilised1 organically developed properties
• Within 10 years aim to open :
10 properties with minority investment
73
Agenda1. Approach
2. Industry overview
3. Sector analysis
4. Strategic options
5. Selected strategy
6. Next steps
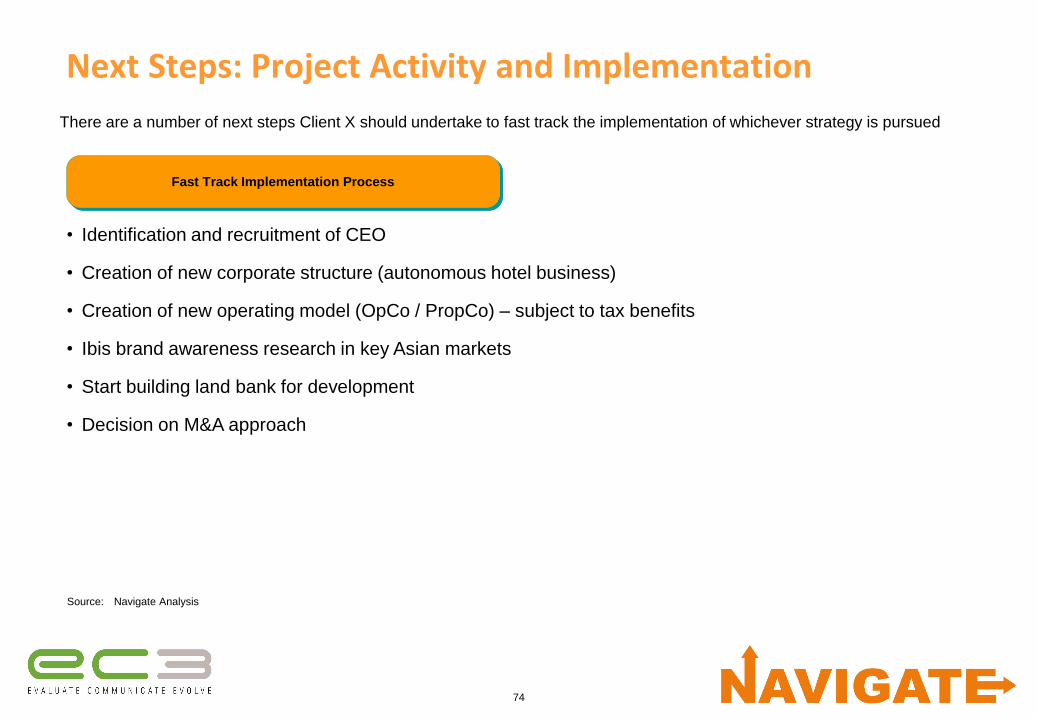
74
Next Steps: Project Activity and Implementation
• Identification and recruitment of CEO
• Creation of new corporate structure (autonomous hotel business)
• Creation of new operating model (OpCo / PropCo) – subject to tax benefits
• Ibis brand awareness research in key Asian markets
• Start building land bank for development
• Decision on M&A approach
Fast Track Implementation Process
There are a number of next steps Client X should undertake to fast track the implementation of whichever strategy is pursued
Source: Navigate Analysis