2013 ANNUAL REPORT - Zimmer Biomet/media/Files/Z/Zimmer...Zimmer Holdings, Inc., 345 East Main...
84
2013 ANNUAL REPORT PERSONA ® THE PERSONALIZED KNEE SYSTEM
Transcript of 2013 ANNUAL REPORT - Zimmer Biomet/media/Files/Z/Zimmer...Zimmer Holdings, Inc., 345 East Main...

Zimmer Holdings, Inc., 345 East Main Street, P.O. Box 708, Warsaw, IN 46580, U.S.A.
2 0 1 3 A N N U A L R E P O R T
P E R S O N A®
T H E P E R S O N A L I Z E D K N E E S Y S T E M

Operating ProfitZimmer continued to deliver
solid operating profit margins
in 2013 on an adjusted basis
through leveraged sales
acceleration and disciplined
expense management.
Operating Cash FlowZimmer’s operating cash flows
provided flexibility to support
ongoing commercialization of
new products as well as funds to
enhance stockholder value
through dividend and share
repurchase programs.
Diluted Earnings per ShareZimmer produced steady adjusted
earnings per share growth of 8%,
reflecting the Company’s accelerated
top line coupled with the ongoing,
disciplined execution of Zimmer’s
operational excellence initiatives.
Net SalesZimmer drove sales growth
in 2013, recording constant
currency net sales growth of 5%
fueled by a number of new
product and technology
introductions from across the
Company’s portfolio. The
performance was highlighted by
the successful commercialization
of Zimmer’s flagship knee offering,
Persona® The Personalized Knee
System, during the year.
(1) “Constant Currency” refers to sales growth resulting from translating current and prior-period sales at the same predetermined foreign currency exchange rate. The translated results are then used to determine year-over-year percentage increases or decreases that exclude the effect of changes in foreign currency exchange rates. See the reconciliation of this non-GAAP financial measure to the most directly comparable GAAP measure on page 75.
(2) “Adjusted” refers to performance measures that exclude inventory step-up and other inventory and manufacturing charges, special items, the provision for certain Durom® Acetabular Component product claims, goodwill impairment, and net curtailment and settlement and related tax benefits and other certain tax adjustments. See the reconciliations of these non-GAAP financial measures to the most directly comparable GAAP measures on page 75.
% Change 2012-2013
ConstantSales b y Geographic Segment 2009 2010 2011 2012 2013 Reported Currency(1)
Americas $2,372 $2,432 $2,441 $2,476 $2,620 6% 6%
Europe 1,119 1,099 1,214 1,178 1,212 3% 1%
Asia Pacific 604 689 797 818 791 -3% 7%
Consolidated $4,095 $4,220 $4,452 $4,472 $4,623 3% 5%
% Change 2012-2013
ConstantSales b y Product Category 2009 2010 2011 2012 2013 Reported Currency(1)
Reconstructive $3,125 $3,210 $3,355 $3,350 $3,434 3% 4%
Knees 1,761 1,798 1,836 1,834 1,910 4% 5%
Hips 1,228 1,262 1,356 1,342 1,330 -1% 1%
Extremities 136 150 163 174 194 11% 12%
Dental 205 219 248 238 239 1% 0%
Trauma 235 246 286 308 316 2% 5%
Spine 253 234 225 209 202 -3% -3%
Surgical & Other 277 311 338 367 432 18% 21%
Consolidated $4,095 $4,220 $4,452 $4,472 $4,623 3% 5%
Financial Highlights (Dollars in millions except per-share amounts)
26%
17%
57%
9% 5%7%
5%
41%
29%
4%
111009
3.94
3.32
4.33
2.97
111009
1,11
8
1,19
4
111009
1,18
31,
019
1,23
291
7
111009
4,09
5
4,22
0
12
1,26
91,
024
12
1,17
7
12
4.80
4.03
12
5.30
4.29
4,45
2
4,47
2
1,31
91,
047
1,15
2
13
4,62
3
13
1,37
01,
036
13
963
13
5.75
4.43
3% Reported
4% Adjusted(2)
-1% Reported
-16% Reported
8% Adjusted(2)
3% Reported
26%
17%
57%
9% 5%7%
5%
41%
29%
4%

To Our Stockholders:
Zimmer has been committed to restoring mobility, alleviating pain and improving the
quality of life for patients for over 85 years. In that time, the Zimmer brand has come to
stand for leadership through innovation, exceptional customer service and high quality
standards. Our business results in 2013 have continued that legacy, while strengthening
our position as a global leader in musculoskeletal health.
We achieved accelerated revenue growth in 2013, while delivering on our financial
commitments and producing expanded operating leverage. Our 2013 sales totaled $4.62
billion, and our fully diluted adjusted earnings per share were $5.75, which was an
increase of 8.5% over the prior year. Our 2013 results were driven by strong performances
in a number of geographies and product categories. While new offerings, such as
Persona® The Personalized Knee System, continued to build on the strength of our market-
leading joint reconstruction business, we extended our reach across the continuum of
musculoskeletal care with innovative treatments and solutions to address new markets
and anatomical sites. We believe that this comprehensive portfolio both defines and
distinguishes Zimmer, and positions us to continue capturing global sales growth.
We continue to apply the kind of innovate and improve thinking that has proved
successful in our product development efforts to our operations as well. In 2013, we
continued to strengthen the foundations of our future success through our ongoing,
company-wide quality and operational excellence initiatives.
Meeting the Needs of Patients and Providers, Expanding Leadership Across the Continuum of Care
Zimmer’s reputation has been built on a record of enabling positive patient outcomes
through a broad-based approach to product innovation. We are proud to offer a
comprehensive portfolio of clinically-relevant treatments, implant solutions and surgical
technologies. Over the last year, we have introduced a range of innovative new offerings,
and we are extremely excited about the future of our pipeline. Through a combination
of internal and external development, we are focused on solutions that address unmet
clinical needs in musculoskeletal care, with a particular focus on personalized solutions, new
product categories and interventions that reach patients earlier in the continuum of care.
As the innovation and market leader in knee replacement technology, Zimmer’s knee
implant systems have been the most widely used in operating rooms around the world
for more than a decade. In 2013, we continued that legacy with the ongoing introduction
of Persona The Personalized Knee System. Featuring revolutionary advances in implant
science, this next-generation total knee system has performed promisingly and garnered
positive clinical feedback from the surgeon community.

The Persona system builds upon the clinical heritage of the NexGen® and Natural-
Knee® families with design innovations that enable high levels of performance and
personalization. In addition, the Persona system uses Zimmer’s proprietary Trabecular
Metal™ Technology and Vivacit-E® Polyethylene, our advanced vitamin E infused bearing
material. This intuitive, next-generation total knee system also integrates with our suite of
intelligent surgical instruments. The iASSIST® Knee, The Personalized Guidance System™,
delivers intraoperative feedback and alignment validation to surgeons. Designed to
increase the precision and efficiency of joint replacement procedures, the iASSIST
system offers innovation in the operating room without the need for costly and complex
capital equipment. The iASSIST system joins our other advanced surgical solutions that
support the Persona knee system, including Zimmer® Patient Specific Instruments and
the eLIBRA® Dynamic Knee Balancing SystemTM. Together, these differentiated offerings
demonstrate that high-precision surgery can be adopted by healthcare institutions
economically, and can deliver other ongoing benefits.
In 2013, we continued to expand our portfolio into new anatomical sites and adjacent
musculoskeletal product categories. In addition to the ongoing introduction of the
Nexel® Total Elbow system to build-out our upper extremities portfolio, in August we
received 510(k) clearance from the Food and Drug Administration for commercial
distribution in the U.S. of the Zimmer® PSI Shoulder, Patient Specific Instruments to
complement and differentiate the Trabecular Metal Reverse Shoulder system. In lower
extremities, the Zimmer Trabecular Metal Total Ankle continued to gather customer
acceptance amid positive feedback from the surgeon community in 2013. In support
of this total ankle solution, we added to our portfolio with the acquisition of Germany-
based NORMED Medizin-Technik GmbH (Normed) in the second quarter of 2013. This
acquisition has added new product offerings, as well as design capabilities to help
strengthen our lower extremity and total ankle portfolio.
As we have communicated previously, in the years ahead we will strive to build a position
as the single solution-provider with the broadest offering of innovative and personalized
solutions. Our growing joint preservation range of products is central to that vision, and
we will continue to bring to market personalized and appropriate therapies for various
disease conditions. In 2013, we added the Subchondroplasty® Procedure to our growing
joint preservation portfolio. We believe this technology addresses an unmet need for
millions of new patients, and represents our entry into a previously untapped market.
The Subchondroplasty Procedure joins our single-injection hyaluronic acid treatment,
Gel-One® Cross-linked Hyaluronate, the Chondrofix® Osteochondral Allograft, DeNovo® NT
Natural Tissue Graft and the Zimmer Unicompartmental High-Flex Knee System designed
to deliver effective solutions to improve quality of life and potentially lower costs for
patients and healthcare institutions.

Transformation Initiatives: Driving Growth, Deepening our Investment in Quality
We continued to make steady progress in 2013 in executing our quality and operational
excellence initiatives. This transformative agenda is designed to build a leaner and
more efficient sales, distribution and manufacturing operation while promoting
superior designs across our product portfolio. For example, in 2013 we implemented
a global brand rationalization effort to right-size our field inventory, in concert with the
modernization of our global logistics infrastructure. We also achieved significant savings
in 2013 through the centralization of raw and indirect material purchasing, as well as the
sourcing of service providers. These programs and others remain on-track to achieve a
targeted $400 million in operating cost savings opportunities by 2016. We will continue
directing these savings into the funding of growth investments, and towards initiatives
related to the delivery of expanded operating improvement efforts and enhanced returns
on invested capital for our stockholders. Additionally, we will continue to focus on the
expansion of these programs to our emerging businesses and markets.
At the same time, these initiatives have enabled us to respond to external challenges to
our business. The most notable example of this is the inclusion in the U.S. Affordable
Care Act of an onerous new excise tax imposed on the medical device industry that went
into effect in 2013. Our intent is to offset the impact of the medical device excise tax
with the savings from our transformation programs. However, paying this tax draws upon
resources that would otherwise be deployed in innovation programs and other job-
creating initiatives that could contribute to our growth and the broader economy. We will
continue to work with our peers to petition for repeal of the medical device excise tax.
Disciplined Capital Management: Returning Value to Stockholders
Our disciplined capital deployment philosophy has become one of the hallmarks of our
business. This strategy has supported our ability to allocate significant free cash flow for
return to stockholders. In 2013, we returned more than $850 million to stockholders in
the form of cash dividends and share repurchases. Also, by following a prudent approach
to external development, we added a number of highly valuable businesses to our
portfolio. These included our acquisition of Normed to strengthen our Extremities and
Trauma product portfolios, as well as our exclusive distribution agreements for the Lateral
Interbody System and APEX Spine System™ in an effort to increase the competitiveness
of our Spine business. We plan to continue to employ rigorous strategic and financial
evaluation metrics in identifying new technologies that have the potential to meaningfully
contribute to future value creation.

A Platform for Success
Musculoskeletal treatments and solutions remain an exciting market with strong growth
potential. In addition to supportive demographics aiding our performance globally, we
have seen economic expansion internationally, as well as investments to modernize
and increase access to healthcare services in less developed markets. As the global
healthcare landscape continues to evolve, we plan to be positioned to offer a compelling
value proposition to patients, surgeons and healthcare institutions with solutions that
generate savings relative to the management of chronic, advanced-stage osteoarthritis.
As we endeavor to further expand our portfolio of differentiated musculoskeletal
solutions, we believe that Zimmer is well-positioned to take advantage of present and
future opportunities.
As evidenced by our 2013 results, we have remained focused on sustaining the strategic
growth of our portfolio, optimizing the way we approach quality and operational
excellence and growing our footprint in key markets around the world. We are proud
of our achievements throughout the year, and will work to enhance stockholder value
while serving with pride the doctors, other healthcare providers and patients who use
our products. Our success would not be possible without the personal dedication of
our 9,000 employees worldwide. We are fortunate to work at a company that is driven
to develop innovative products that make a difference, an organization that strives to
deliver restored mobility, ease pain and improve the quality of life for millions of people
around the globe. The people of Zimmer remain dedicated to this noble purpose.
David C. Dvorak President and Chief Executive Officer
Larry C. Glasscock Chairman of the Board

UNITED STATES SECURITIES AND EXCHANGE COMMISSIONWashington, D.C. 20549
FORM 10-KANNUAL REPORT PURSUANT TO SECTION 13 OR 15(d)
OF THE SECURITIES EXCHANGE ACT OF 1934For year ended December 31, 2013
Commission file number 001-16407
ZIMMER HOLDINGS, INC.(Exact name of registrant as specified in its charter)
Delaware 13-4151777(State of Incorporation) (IRS Employer Identification No.)
345 East Main Street Warsaw, Indiana 46580
(Address of principal executive offices) (Zip Code)
Registrant’s telephone number, including area code: (574) 267-6131
Securities registered pursuant to Section 12(b) of the Act:
Title of each class Name of each exchange on which registeredCommon Stock, $.01 par value New York Stock Exchange
Securities registered pursuant to Section 12(g) of the Act: None
Indicate by check mark if the registrant is a well-known seasoned issuer, as defined in Rule 405 of the SecuritiesAct. Yes Í No ‘
Indicate by check mark if the registrant is not required to file reports pursuant to Section 13 or Section 15(d) of theAct. Yes ‘ No Í
Indicate by check mark whether the registrant (1) has filed all reports required to be filed by Section 13 or 15(d) of the SecuritiesExchange Act of 1934 during the preceding 12 months (or for such shorter period that the registrant was required to file suchreports), and (2) has been subject to such filing requirements for the past 90 days. Yes Í No ‘
Indicate by check mark whether the registrant has submitted electronically and posted on its corporate Web site, if any, everyInteractive Data File required to be submitted and posted pursuant to Rule 405 of Regulation S-T (§ 232.405 of this chapter) duringthe preceding 12 months (or for such shorter period that the registrant was required to submit and post suchfiles). Yes Í No ‘
Indicate by check mark if disclosure of delinquent filers pursuant to Item 405 of Regulation S-K is not contained herein, and will notbe contained, to the best of the registrant’s knowledge, in definitive proxy or information statements incorporated by reference inPart III of this Form 10-K or any amendment to this Form 10-K. Í
Indicate by checkmark whether the registrant is a large accelerated filer, an accelerated filer, a non-accelerated filer or a smallerreporting company. See the definitions of “large accelerated filer”, “accelerated filer” and “smaller reporting company” in Rule12b-2 of the Exchange Act. (Check One):
Large accelerated filer Í Accelerated filer ‘ Non-accelerated filer ‘ Smaller reporting company ‘
(Do not check if a smaller reporting company)
Indicate by checkmark whether the registrant is a shell company (as defined Exchange Act Rule 12b-2). Yes ‘ No Í
The aggregate market value of shares held by non-affiliates was $12,648,249,024 (based on the closing price of these shares on theNew York Stock Exchange on June 28, 2013 and assuming solely for the purpose of this calculation that all directors and executiveofficers of the registrant are “affiliates”). As of February 14, 2014, 169,316,092 shares of the registrant’s $.01 par value commonstock were outstanding.
Documents Incorporated by ReferenceDocument Form 10-K
Portions of the Proxy Statement with respect to the 2014 Annual Meeting of Stockholders Part III

ZIMMER HOLDINGS, INC. 2013 FORM 10-K ANNUAL REPORT
Cautionary Note About Forward-Looking StatementsThis Annual Report on Form 10-K includes “forward-looking” statements within the meaning of federal securities laws.
Forward-looking statements can be identified by the fact that they do not relate strictly to historical or current facts. They ofteninclude words such as “may,” “will,” “should,” “would,” “could,” “anticipate,” “expect,” “plan,” “seek,” “believe,” “predict,”“estimate,” “potential,” “project,” “target,” “forecast,” “intend,” “strategy,” “future,” “opportunity,” and similar expressions.Forward-looking statements are based on current expectations and assumptions that are subject to risks and uncertainties whichmay cause actual results to differ materially from the forward-looking statements. A detailed discussion of risks and uncertaintiesthat could cause actual results and events to differ materially from such forward-looking statements is included in the section titled“Risk Factors” (refer to Part I, Item 1A of this report). Readers of this report are cautioned not to place undue reliance on theseforward-looking statements. While we believe the assumptions on which the forward-looking statements are based are reasonable,there can be no assurance that these forward-looking statements will prove to be accurate. We expressly disclaim any obligation toupdate or revise any forward-looking statements, whether as a result of new information, future events or otherwise. You areadvised, however, to consult any further disclosures we make on related subjects in our Quarterly Reports on Form 10-Q andCurrent Reports on Form 8-K.
Table of Contents Page
PART I 3
Item 1. Business 3
Item 1A. Risk Factors 9
Item 1B. Unresolved Staff Comments 14
Item 2. Properties 15
Item 3. Legal Proceedings 15
Item 4. Mine Safety Disclosures 15
PART II 16
Item 5. Market for the Registrant’s Common Equity, Related Stockholder Matters and Issuer Purchases of EquitySecurities 16
Item 6. Selected Financial Data 17
Item 7. Management’s Discussion and Analysis of Financial Condition and Results of Operations 18
Item 7A. Quantitative and Qualitative Disclosures About Market Risk 28
Item 8. Financial Statements and Supplementary Data 32
Item 9. Changes in and Disagreements with Accountants on Accounting and Financial Disclosure 67
Item 9A. Controls and Procedures 67
Item 9B. Other Information 67
PART III 68
Item 10. Directors, Executive Officers and Corporate Governance 68
Item 11. Executive Compensation 68
Item 12. Security Ownership of Certain Beneficial Owners and Management and Related Stockholder Matters 68
Item 13. Certain Relationships and Related Transactions and Director Independence 68
Item 14. Principal Accounting Fees and Services 68
PART IV 69
Item 15. Exhibits, Financial Statement Schedules 69
2

ZIMMER HOLDINGS, INC. 2013 FORM 10-K ANNUAL REPORT
PART I
ITEM 1. Business
OVERVIEW
We are a global leader in the design, development,manufacture and marketing of orthopaedic reconstructive,spinal and trauma devices, biologics, dental implants andrelated surgical products. We also provide other healthcarerelated services. In this report, “Zimmer,” “we,” “us,” “our” andsimilar words refer collectively to Zimmer Holdings, Inc. and itssubsidiaries. Zimmer Holdings refers to the parent companyonly.
Zimmer Holdings was incorporated in Delaware in 2001.Our history dates to 1927, when Zimmer ManufacturingCompany, a predecessor, was founded in Warsaw, Indiana. OnAugust 6, 2001, Zimmer Holdings was spun off from its formerparent and became an independent public company.
CUSTOMERS, SALES AND MARKETING
Our primary customers include orthopaedic surgeons,neurosurgeons, oral surgeons, dentists, hospitals, stockingdistributors, healthcare dealers and, in their capacity asagents, healthcare purchasing organizations or buying groups.These customers range from large multinational enterprises toindependent clinicians and dentists.
We have operations in more than 25 countries and marketproducts in more than 100 countries. We manage ouroperations through three major geographic segments – theAmericas, which is comprised principally of the U.S. andincludes other North, Central and South American markets;Europe, which is comprised principally of Europe and includesthe Middle East and Africa markets; and Asia Pacific, which iscomprised primarily of Japan and Australia and includes otherAsian and Pacific markets.
We market and sell products through three principalchannels: 1) direct to healthcare institutions, such as hospitals,referred to as direct channel accounts; 2) through stockingdistributors and healthcare dealers; and 3) directly to dentalpractices and dental laboratories. With direct channelaccounts, inventory is generally consigned to sales agents orcustomers. With sales to stocking distributors, healthcaredealers, dental practices and dental laboratories, title toproduct passes upon shipment or upon implantation of theproduct. Direct channel accounts represented approximately80 percent of our net sales in 2013. No individual directchannel account, stocking distributor, healthcare dealer, dentalpractice or dental laboratory accounted for more than1 percent of our net sales for 2013.
We stock inventory in our warehouse facilities and retaintitle to consigned inventory in sufficient quantities so thatproducts are available when needed for surgical procedures.Safety stock levels are determined based on a number offactors, including demand, manufacturing lead times andquantities required to maintain service levels. We also carrytrade accounts receivable balances based on credit terms thatare generally consistent with local market practices.
We utilize a network of sales associates, sales managersand support personnel, some of whom are employed orcontracted by independent distributors and sales agencies. Weinvest a significant amount of time and expense in trainingsales associates in how to use specific products and how tobest inform surgeons of product features and uses. Sales forcerepresentatives must have strong technical selling skills andmedical education to provide technical support for surgeons.
In response to the different healthcare systemsthroughout the world, our sales and marketing strategies andorganizational structures differ by region. We utilize a globalapproach to sales force training, marketing and medicaleducation to provide consistent, high quality service.Additionally, we keep current with key surgical developmentsand other issues related to orthopaedic surgeons,neurosurgeons, dentists and oral surgeons and the medicalprocedures they perform.
The following is a summary of our three reportablesegments. See Note 17 to the consolidated financial statementsfor more information regarding our segments.
Americas. The Americas is our largest geographicsegment, accounting for $2,619.8 million, or 57 percent, of2013 net sales, with the U.S. accounting for 92 percent of netsales in this region. The U.S. sales force consists of acombination of employees and independent sales agents, mostof whom sell products exclusively for Zimmer. The sales forcein the U.S. receives a commission on product sales and isresponsible for many operating decisions and costs.
In this region, we contract with group purchasingorganizations and managed care accounts and have promotedunit growth by offering volume discounts to customerhealthcare institutions within a specified group. Generally, weare designated as one of several preferred purchasing sourcesfor specified products, although members are not obligated topurchase our products. Contracts with group purchasingorganizations generally have a term of three years, withextensions as warranted.
In the Americas, we monitor and rank independent salesagents and our direct sales force across a range of performancemetrics, including the achievement of sales targets andmaintenance of efficient levels of working capital.
Europe. The European geographic segment accountedfor $1,212.6 million, or 26 percent, of 2013 net sales, withFrance, Germany, Italy, Spain, Switzerland and the UnitedKingdom collectively accounting for 70 percent of net sales inthe region. This segment also includes other key markets,including Benelux, Nordic, Central and Eastern Europe, theMiddle East and Africa. Our sales force in this segment iscomprised of direct sales associates, commissioned agents,independent distributors and sales support personnel. Weemphasize the advantages of our clinically proven, establisheddesigns and innovative solutions and new and enhancedmaterials and surfaces. In most European countries, healthcareis sponsored by the government and therefore government
3

ZIMMER HOLDINGS, INC. 2013 FORM 10-K ANNUAL REPORT
budgets impact healthcare spending, which can affect our salesin this segment.
Asia Pacific. The Asia Pacific geographic segmentaccounted for $791.0 million, or 17 percent, of 2013 net sales,with Japan being the largest market within this segment,accounting for 44 percent of the region’s sales. This segmentalso includes key markets such as Australia, New Zealand,Korea, China, Taiwan, India, Thailand, Singapore, Hong Kongand Malaysia. In Japan and most countries in the Asia Pacificregion, we maintain a network of dealers, who act as orderagents on behalf of hospitals in the region, and salesassociates, who build and maintain relationships withorthopaedic surgeons, neurosurgeons and dental surgeons intheir markets. These sales associates cover over 7,000hospitals in the region. The knowledge and skills of these salesassociates play a critical role in providing service, productinformation and support to surgeons. In 2012, we opened aresearch and development center in Beijing, China, whichfocuses on products and technologies designed to meet theunique needs of Asian patients and their healthcare providers.
SEASONALITY
Our business is seasonal in nature to some extent, asmany of our products are used in elective procedures, whichtypically decline during the summer months and can increaseat the end of the year once annual deductibles have been meton health insurance plans.
DISTRIBUTION
We operate distribution facilities domestically in Warsaw,Indiana; Southaven, Mississippi; and Carlsbad, California andinternationally in Australia, Austria, Belgium, Canada, theCzech Republic, China, Finland, France, Germany, Hong Kong,India, Italy, Japan, Korea, Malaysia, the Netherlands, NewZealand, Portugal, Russia, Singapore, South Africa, Spain,Sweden, Switzerland, Taiwan, Thailand and the UnitedKingdom.
We generally ship our orders via expedited courier. We donot consider our backlog of firm orders to be material to anunderstanding of our business.
PRODUCTS
Our products include orthopaedic reconstructiveimplants, spinal and trauma devices, biologics, dental implantsand related surgical products.
Orthopaedic Reconstructive Implants
Knees
Total knee replacement surgeries typically include afemoral component, a patella (knee cap), a tibial tray and anarticular surface (placed on the tibial tray). Knee replacementsurgeries include first-time, or primary, joint replacementprocedures and revision procedures for the replacement,repair or enhancement of an implant or component from aprevious procedure. There are also procedures for partialreconstruction of the knee, which treat limited knee
degeneration and involve the replacement of only one side, orcompartment, of the knee with a unicompartmental kneeprosthesis. Our knee portfolio also includes early interventionand joint preservation products, which seek to preserve thejoint by repairing or regenerating damaged tissues and bytreating osteoarthritis.
Our significant knee brands include the following:• Persona® The Personalized Knee System• NexGen® Complete Knee Solution• Natural-Knee® II System• Innex® Total Knee System• Zimmer® Unicompartmental Knee System• Zimmer® Patient Specific Instruments• Zimmer® Segmental System• Gel-One®1 Cross-linked Hyaluronate• DeNovo® NT Natural Tissue Graft
Hips
Total hip replacement surgeries replace both the head ofthe femur and the socket portion of the pelvis (acetabulum) ofthe natural hip. Hip procedures include first time, or primary,joint replacement as well as revision procedures. Hip implantprocedures involve the use of bone cement to attach or affixthe prosthetic components to the surrounding bone, or arepress-fit into bone, which means that they have a surface thatbone affixes to through either ongrowth or ingrowthtechnologies.
Our significant hip brands include the following:• Zimmer® M/L Taper Hip Prosthesis and Zimmer M/L Taper
Hip Prosthesis with Kinectiv® Technology• Alloclassic® (Zweymüller®) Hip System• CLS® Spotorno® Hip System and CLS Brevius® Hip Stem
with Kinectiv Technology• Fitmore® Hip Stem• Avenir® Müller Stem• Continuum® Acetabular System• Trilogy® IT Acetabular System• Allofit® IT Alloclassic® Acetabular System• Trabecular MetalTM Modular Acetabular System
Extremities
Our extremity portfolio, primarily shoulder and elbowproducts, is designed to treat arthritic conditions, soft tissueinjuries and fractures.
Our significant extremity brands include the following:• Trabecular Metal Reverse Shoulder System• Bigliani/Flatow® Complete Shoulder Solution Family• Zimmer® Anatomical Shoulder™ System• Zimmer® Trabecular Metal Total Ankle• Coonrad/Morrey Total Elbow• Nexel® Total Elbow
Dental
Our dental products division manufactures and/ordistributes: (1) dental reconstructive implants – for individualswho are totally without teeth or are missing one or more teeth;
1 Registered trademark of Seikagaku Corporation
4

ZIMMER HOLDINGS, INC. 2013 FORM 10-K ANNUAL REPORT
(2) dental prosthetic products – aimed at providing a morenatural restoration to resemble the original teeth; and (3) dentalregenerative products – for soft tissue and bone rehabilitation.
Our significant dental brands include the following:• Tapered Screw-Vent® Implant System• Zimmer® Hex-Lock® Contour Abutment and Restorative
Products• Puros® Allograft Products2
Trauma
Trauma products include devices used to stabilizedamaged or broken bones and their surrounding tissues tosupport the body’s natural healing processes. Fractures aremost often stabilized using internal fixation devices such asplates, screws, nails, wires and pins, but may also be stabilizedusing external fixation devices. Biologics treatments are usedin conjunction with traditional trauma devices to encouragehealing and replace bone lost during an injury.
Our significant trauma brands include the following:• Zimmer® Natural Nail® System• NCB® Polyaxial Locking Plate System• XtraFix® External Fixation System• Zimmer® Periarticular Locking Plate System• Zimmer® Universal Locking System• Zimmer® Cable-Ready® System
Spine
Our Spine products division designs, manufactures anddistributes medical devices and surgical instruments to delivercomprehensive solutions for those with back or neck paincaused by degenerative conditions, deformities or traumaticinjury of the spine.
Our significant spine brands include the following:• PathFinder NXT® Minimally Invasive Pedicle Screw System• Trabecular Metal Implants• Sequoia® Pedicle Screw System• Trinica® Select Anterior Cervical Plating System• Dynesys® Dynamic Stabilization System
Surgical
We develop, manufacture and market products thatsupport reconstructive, trauma, spine and dental implantprocedures, with a focus on bone cements, surgical wound sitemanagement, blood management and fluid waste management.
Our significant surgical brands include the following:• Transposal® and Transposal Ultra® Fluid Waste
Management Systems• PALACOS®3 Bone Cement• A.T.S.® Automatic Tourniquet Systems• Pulsavac® Plus, Pulsavac Plus AC and Pulsavac Plus LP
Wound Debridement Systems• Zimmer® Universal Power System
2 Manufactured for Zimmer Dental Inc. by RTI Biologics in Alachua, FLand Tutogen Medical GmbH, Germany (an RTI Biologics, Inc.company)3 Registered trademark of Heraeus Medical GmbH
RESEARCH AND DEVELOPMENT
We have extensive research and development activities todevelop new surgical techniques, materials, biologics andproduct designs. The research and development teams workclosely with our strategic brand marketing function. The rapidcommercialization of innovative new materials, biologicsproducts, implant and instrument designs and surgicaltechniques remains one of our core strategies and continues tobe an important driver of sales growth.
We are broadening our offerings in each of our productcategories and exploring new technologies with possibleapplications in multiple areas. Our primary research anddevelopment facility is located in Warsaw, Indiana. We haveother research and development personnel based in, amongother places, Montreal, Canada; Beijing, China; Winterthur,Switzerland; Austin, Texas; Minneapolis, Minnesota; Carlsbad,California; Philadelphia, Pennsylvania; Dover, Ohio; andParsippany, New Jersey. As of December 31, 2013, we employednearly 1,000 research and development employees worldwide.
We expect to continue to identify innovative technologies,which may include acquiring complementary products orbusinesses, establishing technology licensing arrangements orstrategic alliances.
GOVERNMENT REGULATION AND COMPLIANCE
We are subject to government regulation in the countries inwhich we conduct business. In the U.S., numerous laws andregulations govern all the processes by which medical devicesare brought to market. These include, among others, the FederalFood, Drug and Cosmetic Act and regulations issued orpromulgated thereunder. The Food and Drug Administration(FDA) has enacted regulations that control all aspects of thedevelopment, manufacture, advertising, promotion andpostmarket surveillance of medical products, including medicaldevices. In addition, the FDA controls the access of products tomarket through processes designed to ensure that only productsthat are safe and effective are made available to the public.
Most of our new products fall into an FDA classificationthat requires the submission of a Premarket Notification(510(k)) to the FDA. This process requires us to demonstratethat the device to be marketed is at least as safe and effectiveas, that is, substantially equivalent to, a legally marketeddevice. We must submit information that supports oursubstantial equivalency claims. Before we can market the newdevice, we must receive an order from the FDA findingsubstantial equivalence and clearing the new device forcommercial distribution in the U.S.
Other devices we develop and market are in a category(class) for which the FDA has implemented stringent clinicalinvestigation and Premarket Approval (PMA) requirements.The PMA process requires us to provide clinical and laboratorydata that establishes that the new medical device is safe andeffective. The FDA will approve the new device for commercialdistribution if it determines that the data and information inthe PMA application constitute valid scientific evidence andthat there is reasonable assurance that the device is safe andeffective for its intended use(s).
5

ZIMMER HOLDINGS, INC. 2013 FORM 10-K ANNUAL REPORT
All of our devices marketed in the U.S. have been clearedor approved by the FDA, with the exception of some deviceswhich were in commercial distribution prior to May 28, 1976.The FDA has grandfathered these devices, so new FDAsubmissions are not required.
Both before and after a product is commercially released,we have ongoing responsibilities under FDA regulations. TheFDA reviews design and manufacturing practices, labeling andrecord keeping, and manufacturers’ required reports ofadverse experiences and other information to identify potentialproblems with marketed medical devices. We are also subjectto periodic inspection by the FDA for compliance with theFDA’s Quality System regulations among other FDArequirements, such as restrictions on advertising andpromotion. The Quality System regulations govern themethods used in, and the facilities and controls used for, thedesign, manufacture, packaging and servicing of all finishedmedical devices intended for human use. If the FDA were toconclude that we are not in compliance with applicable laws orregulations, or that any of our medical devices are ineffectiveor pose an unreasonable health risk, the FDA could require usto notify healthcare professionals and others that the devicespresent unreasonable risks of substantial harm to the publichealth, order a recall, repair, replacement, or refund paymentof such devices, detain or seize adulterated or misbrandedmedical devices, or ban such medical devices.
The FDA may also impose operating restrictions, enjoinand/or restrain certain conduct resulting in violations ofapplicable law pertaining to medical devices, and assess civil orcriminal penalties against our officers, employees or us. TheFDA may also recommend prosecution to the U.S. Departmentof Justice.
The FDA, in cooperation with U.S. Customs and BorderProtection (CBP), administers controls over the import ofmedical devices into the U.S. The CBP imposes its ownregulatory requirements on the import of our products,including inspection and possible sanctions for noncompliance.We are also subject to foreign trade controls administered bycertain U.S. government agencies, including the Bureau ofIndustry and Security within the Commerce Department andthe Office of Foreign Assets Control within the TreasuryDepartment.
There are also requirements of state, local and foreigngovernments that we must comply with in the manufactureand marketing of our products.
In many of the foreign countries in which we market ourproducts, we are subject to local regulations affecting, amongother things, design and product standards, packagingrequirements and labeling requirements. Many of theregulations applicable to our devices and products in thesecountries are similar to those of the FDA. The membercountries of the European Union have adopted the EuropeanMedical Device Directive, which creates a single set of medicaldevice regulations for products marketed in all membercountries. Compliance with the Medical Device Directive andcertification to a quality system enable the manufacturer toplace a CE mark on its products. To obtain authorization toaffix the CE mark to a product, a recognized European
Notified Body must assess a manufacturer’s quality systemsand the product’s conformity to the requirements of theMedical Device Directive. We are subject to inspection by theNotified Bodies for compliance with these requirements.
Further, we are subject to various federal, state andforeign laws concerning healthcare fraud and abuse, includingfalse claims and anti-kickback laws, as well as the PhysicianPayments Sunshine Act and similar state and healthcareprofessional payment transparency laws. These laws areadministered by, among others, the U.S. Department ofJustice, the Office of Inspector General of the Department ofHealth and Human Services, state attorneys general andvarious foreign government agencies. Many of these agencieshave increased their enforcement activities with respect tomedical device manufacturers in recent years. Violations ofthese laws are punishable by criminal and/or civil sanctions,including, in some instances, fines, imprisonment and, withinthe U.S., exclusion from participation in governmenthealthcare programs, including Medicare, Medicaid andVeterans Administration (VA) health programs.
Our operations in foreign countries are subject to theextraterritorial application of the U.S. Foreign CorruptPractices Act. Our global operations are also subject to foreignanti-corruption laws, such as the UK Bribery Act, amongothers. As part of our global compliance program, we seek toaddress anti-corruption risks proactively.
Our facilities and operations are also subject to complexfederal, state, local and foreign environmental andoccupational safety laws and regulations, including thoserelating to discharges of substances in the air, water and land,the handling, storage and disposal of wastes and the clean-upof properties by pollutants. We do not expect that the ongoingcosts of compliance with these environmental requirementswill have a material impact on our consolidated earnings,capital expenditures or competitive position.
COMPETITION
The orthopaedics and broader musculoskeletal careindustry is highly competitive. In the global markets forreconstructive implants, trauma and related surgical products,our major competitors include: the DePuy Synthes Companiesof Johnson & Johnson, Stryker Corporation, Biomet, Inc., andSmith & Nephew plc.
In the Americas geographic segment, we and the DePuySynthes Companies, Stryker Corporation, Biomet, Inc., andSmith & Nephew, Inc. (a subsidiary of Smith & Nephew plc)account for a large majority of the total reconstructive andtrauma implant sales. There are also many smaller competitorsactively engaging in this market. Some of these smallercompetitors have success by focusing on smaller subsegmentsof the industry.
The European reconstructive implant and trauma productmarkets are more fragmented than those markets in theAmericas or the Asia Pacific segments. The variety ofphilosophies held by European surgeons regarding hipreconstruction, for example, has fostered the existence ofmany regional European companies, including Aesculap AG
6

ZIMMER HOLDINGS, INC. 2013 FORM 10-K ANNUAL REPORT
(a subsidiary of B. Braun), Waldemar LINK GmbH & Co., KGand Mathys AG, which, in addition to the global competitors,compete with us. Many hip implants sold in Europe areproducts developed specifically for the European market. Weintend to continue to develop and produce specially tailoredproducts to meet specific European needs.
In the Asia Pacific market for reconstructive implant andtrauma products, we compete primarily with the DePuySynthes Companies, Stryker Corporation, Smith & Nephew plcand Biomet, Inc., as well as regional companies, includingJapan Medical Materials Corporation and Japan MedicalDynamic Marketing, Inc. Factors, such as the dealer systemand complex regulatory environments, make it difficult forsmaller companies, particularly those that are non-regional, tocompete effectively with the market leaders in the moredeveloped healthcare markets in the Asia Pacific region.
In the spinal implant category, we compete globallyprimarily with the spinal and biologic business of Medtronic,Inc., the DePuy Synthes Companies, Stryker Corporation,Biomet Spine (a subsidiary of Biomet, Inc.), NuVasive, Inc. andGlobus Medical, Inc.
In the dental implant category, we compete primarily withNobel Biocare Holding AG, Straumann Holding AG, DentsplyInternational and Biomet 3i (a subsidiary of Biomet, Inc.).
Competition within the industry is primarily based ontechnology, innovation, quality, price, reputation and customerservice. A key factor in our continuing success in the futurewill be our ability to develop new products and improveexisting products and technologies.
MANUFACTURING AND RAW MATERIALS
We manufacture our products at various sites. Oursignificant manufacturing locations include Warsaw, Indiana;Winterthur, Switzerland; Ponce, Puerto Rico; Dover, Ohio;Carlsbad, California; Parsippany, New Jersey; Shannon,Ireland; and Beijing, China. We also strategically outsourcesome manufacturing to qualified suppliers who are highlycapable of producing components.
We believe that our manufacturing facilities are among thebest in our industry in terms of automation and productivityand have the flexibility to accommodate future growth. Themanufacturing operations at these facilities are designed toincorporate the cellular concept for production and toimplement tenets of a manufacturing philosophy focused oncontinuous improvement efforts in product quality, lead timereduction and capacity optimization. Our continuousimprovement efforts are driven by Lean and Six Sigmamethodologies. In addition, at certain of our manufacturingfacilities, many of the employees are cross-trained to perform abroad array of operations.
We generally target operating our manufacturing facilitiesat optimal levels of total capacity. We continually evaluate thepotential to in-source and out-source production as part of ourmanufacturing strategy to provide value to our stakeholders.
We have improved our manufacturing processes to protectour profitability and offset the impact of inflationary costs. Wehave, for example, employed computer-assisted robots andmulti-axis grinders to precision polish medical devices;automated certain manufacturing and inspection processes,including on-machine inspection and processcontrols; purchased state-of-the-art equipment; in-sourcedcore products and processes; and negotiated cost reductionsfrom third-party suppliers.
We use a diverse and broad range of raw materials in themanufacturing of our products. We purchase all of our rawmaterials and select components used in manufacturing ourproducts from external suppliers. In addition, we purchasesome supplies from single sources for reasons of qualityassurance, sole source availability, cost effectiveness orconstraints resulting from regulatory requirements. We workclosely with our suppliers to assure continuity of supply whilemaintaining high quality and reliability. To date, we have notexperienced any significant difficulty in locating and obtainingthe materials necessary to fulfill our production schedules.
INTELLECTUAL PROPERTY
Patents and other proprietary rights are important to thecontinued success of our business. We also rely upon tradesecrets, know-how, continuing technological innovation andlicensing opportunities to develop and maintain ourcompetitive position. We protect our proprietary rightsthrough a variety of methods, including confidentialityagreements and proprietary information agreements withvendors, employees, consultants and others who may haveaccess to proprietary information. We own or control throughlicensing arrangements more than 4,500 issued patents andpatent applications throughout the world that relate to aspectsof the technology incorporated in many of our products.
EMPLOYEES
As of December 31, 2013, we employed approximately9,500 employees worldwide, including nearly 1,000 employeesdedicated to research and development. Approximately 5,200employees are located within the U.S. and approximately4,300 employees are located outside of the U.S., primarilythroughout Europe and in Japan. We have approximately 3,900employees dedicated to manufacturing our productsworldwide. The Warsaw, Indiana production facility employsapproximately 1,600 employees.
Approximately 180 U.S. employees are members of a tradeunion covered by a collective bargaining agreement. We have acollective bargaining agreement with the United Steel, Paperand Forestry, Rubber, Manufacturing, Energy, Allied Industrialand Service Workers International Union, AFL-CIO, CLC forand on behalf of Local 2737-15 covering employees at theDover, Ohio facility, which continues in effect until May 15,2015.
7

ZIMMER HOLDINGS, INC. 2013 FORM 10-K ANNUAL REPORT
EXECUTIVE OFFICERS
The following table sets forth certain information with respect to our executive officers as of February 20, 2014.
Name Age Position
David C. Dvorak 50 President and Chief Executive Officer
James T. Crines 54 Executive Vice President, Finance and Chief Financial Officer
Joseph A. Cucolo 54 President, Americas
Derek M. Davis 45 Vice President, Finance and Corporate Controller and Chief Accounting Officer
Katarzyna Mazur-Hofsaess, M.D., Ph.D. 50 President, Europe, Middle East and Africa
Stephen H.L. Ooi 60 President, Asia Pacific
Chad F. Phipps 42 Senior Vice President, General Counsel and Secretary
Mr. Dvorak was appointed President, Chief Executive Officerand a member of the Board of Directors in May 2007. FromDecember 2005 to April 2007, he served as Group President,Global Businesses and Chief Legal Officer. Prior to that, he hadserved as Executive Vice President, Corporate Services, ChiefCounsel and Secretary, as well as Chief Compliance Officer,since October 2003. Mr. Dvorak joined Zimmer in 2001.
Mr. Crines was appointed Executive Vice President, Financeand Chief Financial Officer in May 2007. From December 2005to April 2007, he served as Senior Vice President, Finance,Operations and Corporate Controller and Chief AccountingOfficer. Prior to that, he had served as Senior Vice President,Finance/Controller and Information Technology since October2003. Mr. Crines joined Zimmer in 1995.
Mr. Cucolo was appointed President, Americas in September2012. He is responsible for sales and management of the directand indirect sales channels in the Americas region, includingthe United States, Canada and Latin America. From 1997 untilhe joined Zimmer as President, Americas, Mr. Cucolo was soleowner and President of Zimmer New England, Inc., anindependent third-party distributor of Zimmer products in thenortheast region of the United States. Prior to that, Mr. Cucolowas employed by Zimmer as a sales representative andterritory manager in the New York area from 1987 to 1997.
Mr. Davis was appointed Vice President, Finance and CorporateController and Chief Accounting Officer in May 2007. He hasresponsibility for internal and external reporting, planning andanalysis, and corporate and business unit accounting. FromMarch 2006 to May 2007, he served as Director, FinancialPlanning and Accounting. Prior to that, he had served asDirector, Finance, Operations and Logistics since December2003. Mr. Davis joined Zimmer in 2003.
Dr. Mazur-Hofsaess was appointed President, Europe, MiddleEast and Africa in April 2013. She is responsible for the sales,marketing and distribution of products in the European,Middle Eastern and African (EMEA) regions. Dr. Mazur-Hofsaess joined Zimmer in February 2010 as Senior VicePresident, EMEA Sales and Marketing and was appointedPresident, EMEA Reconstructive in February 2012. She hasapproximately 20 years’ experience within the pharmaceutical,diagnostics and medical device sectors. Prior to joiningZimmer, Dr. Mazur-Hofsaess served as Vice President,Diagnostics – Europe of Abbott Laboratories from 2001.
Mr. Ooi was appointed President, Asia Pacific in December2005. He is responsible for the sales, marketing anddistribution of products in the Asia Pacific region. Prior tothat, he had served as President, Australasia since September2003. Mr. Ooi joined Zimmer in 1986.
Mr. Phipps was appointed Senior Vice President, GeneralCounsel and Secretary in May 2007. He has globalresponsibility for our legal affairs and he serves as Secretary tothe Board of Directors. Mr. Phipps also oversees our CorporateCompliance, Government Affairs, Corporate Marketing andCommunications and Public Relations activities. FromDecember 2005 to May 2007, he served as Associate GeneralCounsel and Corporate Secretary. Prior to that, he had servedas Associate Counsel and Assistant Secretary since September2003. Mr. Phipps joined Zimmer in 2003.
AVAILABLE INFORMATION
Our Internet address is www.zimmer.com. We routinelypost important information for investors on our website in the“Investor Relations” section, which may be accessed from ourhomepage at www.zimmer.com or directly at http://investor.zimmer.com. We use this website as a means ofdisclosing material, non-public information and for complyingwith our disclosure obligations under Regulation FD.Accordingly, investors should monitor the Investor Relationssection of our website, in addition to following our pressreleases, Securities and Exchange Commission (SEC) filings,public conference calls, presentations and webcasts. Our goalis to maintain the Investor Relations website as a portalthrough which investors can easily find or navigate topertinent information about us, free of charge, including:• our Annual Reports on Form 10-K, Quarterly Reports on
Form 10-Q, Current Reports on Form 8-K and amendmentsto those reports filed or furnished pursuant to Section 13(a)or 15(d) of the Securities Exchange Act of 1934, asamended (Exchange Act), as soon as reasonably practicableafter we electronically file that material with or furnish it tothe SEC;
• announcements of investor conferences and events at whichour executives talk about our products and competitivestrategies. Podcasts and archives of these events are alsoavailable;
• press releases on quarterly earnings, productannouncements, legal developments and other materialnews that we may post from time to time;
• corporate governance information including our CorporateGovernance Guidelines, Code of Business Conduct, Code ofEthics for Chief Executive Officer and Senior FinancialOfficers, information concerning our Board of Directors andits committees, including the charters of the Audit
8
ZIMMER HOLDINGS, INC. 2013 FORM 10-K ANNUAL REPORT
Committee, Compensation and Management DevelopmentCommittee, Corporate Governance Committee andResearch, Innovation and Technology Committee, and othergovernance-related policies;
• stockholder services information, including ways to contactour transfer agent and information on how to sign up fordirect deposit of dividends or enroll in our dividendreinvestment plan; and
• opportunities to sign up for email alerts and RSS feeds tohave information provided in real time.
The information available on our website is notincorporated by reference in, or a part of, this or any otherreport we file with or furnish to the SEC.
ITEM 1A. Risk Factors
Risk factors which could cause actual results to differ
from our expectations and which could negatively impact
our financial condition and results of operations are
discussed below and elsewhere in this report. Additional
risks and uncertainties not presently known to us or that
are currently not believed to be significant to our business
may also affect our actual results and could harm our
business, financial condition and results of operations. If
any of the risks or uncertainties described below or any
additional risks and uncertainties actually occur, our
business, results of operations and financial condition
could be materially and adversely affected.
Our success depends on our ability to effectively
develop and market our products against those of our
competitors.
We operate in a highly competitive environment. Ourpresent or future products could be rendered obsolete oruneconomical by technological advances by one or more of ourpresent or future competitors or by other therapies, includingbiological therapies. To remain competitive, we must continueto develop and acquire new products and technologies.Competition is primarily on the basis of:• technology;• innovation;• quality;• reputation; and• customer service.
In markets outside of the U.S., other factors influencecompetition as well, including:• local distribution systems;• complex regulatory environments; and• differing medical philosophies and product preferences.
Our competitors may:• have greater financial, marketing and other resources than
us;• respond more quickly to new or emerging technologies;• undertake more extensive marketing campaigns;• adopt more aggressive pricing policies; or• be more successful in attracting potential customers,
employees and strategic partners.
Any of these factors, alone or in combination, could causeus to have difficulty maintaining or increasing sales of ourproducts.
If we do not introduce new products in a timely
manner, our products may become obsolete over time,
customers may not buy our products and our revenue
and profitability may decline.
Demand for our products may change, in certain cases, inways we may not anticipate because of:• evolving customer needs;• changing demographics;• slowing industry growth rates;• declines in the reconstructive implant market;• the introduction of new products and technologies;• evolving surgical philosophies; and• evolving industry standards.
Without the timely introduction of new products andenhancements, our products may become obsolete over time.If that happens, our revenue and operating results wouldsuffer. The success of our new product offerings will dependon several factors, including our ability to:• properly identify and anticipate customer needs;• commercialize new products in a timely manner;• manufacture and deliver instruments and products in
sufficient volumes on time;• differentiate our offerings from competitors’ offerings;• achieve positive clinical outcomes for new products;• satisfy the increased demands by healthcare payors,
providers and patients for shorter hospital stays, faster post-operative recovery and lower-cost procedures;
• innovate and develop new materials, product designs andsurgical techniques; and
• provide adequate medical education relating to newproducts.
In addition, new materials, product designs and surgicaltechniques that we develop may not be accepted quickly, insome or all markets, because of, among other factors:• entrenched patterns of clinical practice;• the need for regulatory clearance; and• uncertainty with respect to third-party reimbursement.
Moreover, innovations generally require a substantialinvestment in research and development before we candetermine their commercial viability and we may not have thefinancial resources necessary to fund the production. Inaddition, even if we are able to successfully developenhancements or new generations of our products, theseenhancements or new generations of products may notproduce revenue in excess of the costs of development andthey may be quickly rendered obsolete by changing customerpreferences or the introduction by our competitors of productsembodying new technologies or features.
If third-party payors decline to reimburse our
customers for our products or reduce reimbursement
levels, the demand for our products may decline and our
ability to sell our products profitably may be harmed.
We sell our products and services to hospitals, doctors,dentists and other healthcare providers, all of which receivereimbursement for the healthcare services provided to their
9

ZIMMER HOLDINGS, INC. 2013 FORM 10-K ANNUAL REPORT
patients from third-party payors, such as domestic andinternational government programs, private insurance plansand managed care programs. These third-party payors maydeny reimbursement if they determine that a device used in aprocedure was not in accordance with cost-effective treatmentmethods, as determined by the third-party payor, or was usedfor an unapproved indication. Third-party payors may alsodecline to reimburse for experimental procedures and devices.
In addition, third-party payors are increasingly attemptingto contain healthcare costs by limiting both coverage and thelevel of reimbursement for medical products and services. Ifthird-party payors reduce reimbursement levels to hospitalsand other healthcare providers for our products, demand forour products may decline, or we may experience increasedpressure to reduce the prices of our products, which couldhave a material adverse effect on our sales and results ofoperations.
We have also experienced downward pressure on productpricing and other effects of healthcare reform in ourinternational markets. If key participants in governmenthealthcare systems reduce the reimbursement levels for ourproducts, our sales and results of operations may be adverselyaffected.
The U.S. healthcare reform legislation includes
provisions that may materially adversely affect our
business and results of operations.
The Patient Protection and Affordable Care Act of 2010,as amended by the Health Care and Education AffordabilityReconciliation Act of 2010 (collectively, the Affordable CareAct), was signed into law in March 2010 and mandates healthinsurance coverage and other healthcare reforms withstaggered effective dates from 2010 to 2018. As part of theAffordable Care Act, in January 2013 we began paying a 2.3percent medical device excise tax on the vast majority of ourU.S sales. We continue to identify ways to reduce spending inother areas to offset the earnings impact due to the tax. We arenot able to pass along the cost of the tax to hospitals, whichcontinue to face cuts to their Medicare reimbursement underthe Affordable Care Act and other legislation. Nor are we ableto offset the cost of the tax through higher sales volumesresulting from the expansion of health insurance coveragebecause of the demographics of the current uninsuredpopulation. The medical device excise tax regulations andsubsequent guidance from the U.S. Department of Treasuryhave not lessened the burden of complying with the excise taxstatute. In addition, without the implementation of propersafeguards, the Affordable Care Act’s Medicare paymentreforms, such as accountable care organizations and bundledpayments, could provide additional incentives for healthcareproviders to reduce spending on some of our medical deviceproducts and reduce utilization of hospital procedures that useour products. Accordingly, while it is still too early to fullyunderstand and predict the full impact of the Affordable CareAct on our business, ongoing implementation could have amaterial adverse effect on our results of operations and cashflows.
The ongoing cost-containment efforts of healthcare
purchasing organizations may have a material adverse
effect on our results of operations.
Many customers for our products have formed grouppurchasing organizations in an effort to contain costs. Grouppurchasing organizations negotiate pricing arrangements withmedical supply manufacturers and distributors, and thesenegotiated prices are made available to a group purchasingorganization’s affiliated hospitals and other members. If we arenot one of the providers selected by a group purchasingorganization, affiliated hospitals and other members may beless likely to purchase our products, and, if the grouppurchasing organization has negotiated a strict compliancecontract for another manufacturer’s products, we may beprecluded from making sales to members of the grouppurchasing organization for the duration of the contractualarrangement. Our failure to respond to the cost-containmentefforts of group purchasing organizations may cause us to losemarket share to our competitors and could have a materialadverse effect on our sales and results of operations.
We are subject to various governmental regulations
relating to the manufacturing, labeling and marketing of
our products, non-compliance with which could
adversely affect our business, financial condition and
results of operations.
The medical devices we design, develop, manufacture andmarket are subject to rigorous regulation by the FDA andnumerous other federal, state and foreign governmentalauthorities. The process of obtaining regulatory approvals tomarket a medical device can be costly and time consuming andapprovals might not be granted for future products on a timelybasis, if at all. Delays in receipt of, or failure to obtain,approvals for future products could result in delayedrealization of product revenues or in substantial additionalcosts.
Both before and after a product is commercially released,we have ongoing responsibilities under FDA regulations.Compliance with the FDA’s requirements, including theQuality System regulation, recordkeeping regulations, labelingand promotional requirements and adverse event reportingregulations, is subject to continual review and is monitoredrigorously through periodic inspections by the FDA, which mayresult in observations on Form 483, and in some cases warningletters, that require corrective action, or other forms ofenforcement. If the FDA were to conclude that we are not incompliance with applicable laws or regulations, or that any ofour medical devices are ineffective or pose an unreasonablehealth risk, the FDA could ban such medical devices, detain orseize adulterated or misbranded medical devices, order arecall, repair, replacement, or refund of payment of suchdevices, refuse to grant pending premarket approvalapplications, refuse to provide certificates to foreigngovernments for exports, and/or require us to notify healthcareprofessionals and others that the devices present unreasonablerisks of substantial harm to the public health. The FDA mayalso impose operating restrictions on a company-wide basis,enjoin and restrain certain violations of applicable lawpertaining to medical devices and assess civil or criminal
10

ZIMMER HOLDINGS, INC. 2013 FORM 10-K ANNUAL REPORT
penalties against our officers, employees or us. The FDA mayalso recommend prosecution to the U.S. Department ofJustice. Any adverse regulatory action, depending on itsmagnitude, may restrict us from effectively marketing andselling our products and could have a material adverse effecton our business, financial condition and results of operations.
Our products and operations are also often subject to therules of industrial standards bodies, such as the InternationalStandards Organization. If we fail to adequately address any ofthese regulations, our business could be harmed.
If we fail to comply with healthcare fraud and abuse
laws and regulations, we could face substantial
penalties and our business, operations and financial
condition could be adversely affected.
Our industry is subject to various federal, state andforeign laws and regulations pertaining to healthcare fraud andabuse, including the federal False Claims Act, the federal Anti-Kickback Statute, the federal Stark law, the federal PhysicianPayments Sunshine Act and similar state and foreign laws.Violations of these laws are punishable by criminal and/or civilsanctions, including, in some instances, fines, imprisonmentand, within the U.S., exclusion from participation ingovernment healthcare programs, including Medicare,Medicaid and Veterans Administration (VA) health programs.The interpretation and enforcement of these laws andregulations are uncertain and subject to rapid change.
The “conflict minerals” rule may adversely affect
the sourcing, availability and pricing of materials used
in the manufacture of our products, may increase our
costs, cause our profitability to decline and harm our
reputation.
We are subject to the SEC’s rule regarding disclosure ofthe use of certain minerals, known as “conflict minerals”(tantalum, tin and tungsten (or their ores) and gold), whichare mined from the Democratic Republic of the Congo andadjoining countries. U.S. public companies that manufactureproducts that contain conflict minerals that are necessary tothe functionality or production of their products must annuallydisclose whether the minerals in their products originated fromone of these countries and the procedures employed todetermine the sourcing of such minerals. These requirementsbecame effective for the 2013 calendar year, with initialdisclosure reports due in May 2014. We are incurring costs tocomply with this rule, including for diligence in regard to thesources of any conflict minerals used in our products. Wecannot be sure that we will be able to obtain the necessaryinformation on conflict minerals from our suppliers or that wewill be able to determine that all of our products are conflict-free. As a result, we may face reputational challenges if wedetermine that certain of our products contain minerals notdetermined to be conflict-free or if we are unable tosufficiently verify the origin of all conflict minerals used in ourproducts. This rule also could have the effect of limiting thepool of suppliers from which we source these minerals, and wemay be unable to obtain conflict-free minerals at competitiveprices, which could increase our costs and adversely affect ourmanufacturing operations and our profitability.
We conduct a significant amount of our sales
activity outside of the U.S., which subjects us to
additional business risks and may cause our
profitability to decline due to increased costs.
We sell our products in more than 100 countries andderived almost 50 percent of our net sales in 2013 from outsidethe U.S. We intend to continue to pursue growth opportunitiesin sales internationally, including in emerging markets, whichcould expose us to additional risks associated withinternational sales and operations. Our international operationsare, and will continue to be, subject to a number of risks andpotential costs, including:• changes in foreign medical reimbursement policies and
programs;• unexpected changes in foreign regulatory requirements;• differing local product preferences and product
requirements;• fluctuations in foreign currency exchange rates;• diminished protection of intellectual property in some
countries outside of the U.S.;• trade protection measures and import or export
requirements that may prevent us from shipping products toa particular market and may increase our operating costs;
• foreign exchange controls that might prevent us fromrepatriating cash earned in countries outside the U.S.;
• complex data privacy requirements and labor relations laws;• extraterritorial effects of U.S. laws such as the Foreign
Corrupt Practices Act;• effects of foreign anti-corruption laws, such as the UK
Bribery Act;• difficulty in staffing and managing foreign operations;• labor force instability;• potentially negative consequences from changes in tax laws;
and• political and economic instability.
Violations of foreign laws or regulations could result infines, criminal sanctions against us, our officers or ouremployees, prohibitions on the conduct of our business anddamage to our reputation.
We may have additional tax liabilities.
We are subject to income taxes in the U.S. and manyforeign jurisdictions. Significant judgment is required indetermining our worldwide provision for income taxes. In theordinary course of our business, there are many transactionsand calculations where the ultimate tax determination isuncertain. We regularly are under audit by tax authorities.Although we believe our tax estimates are reasonable, the finaldetermination of tax audits and any related litigation could bematerially different from our historical income tax provisionsand accruals. The results of an audit or litigation could have amaterial effect on our financial statements in the period orperiods for which that determination is made.
We earn a significant amount of our operating incomefrom outside the U.S., and any repatriation of fundsrepresenting earnings of foreign subsidiaries may significantlyimpact our effective tax rates. In addition, there have beenproposals to change U.S. tax laws that would significantlyimpact how U.S. multinational corporations are taxed on
11

ZIMMER HOLDINGS, INC. 2013 FORM 10-K ANNUAL REPORT
foreign earnings. Although we cannot predict whether or inwhat form this proposed legislation will pass, if enacted itcould have a material adverse impact on our tax expense andcash flow.
Challenging global economic conditions could
adversely affect our results of operations.
Since 2008, the global economy has been impacted by anongoing series of financial crises. Although the U.S. economy isrecovering, unemployment remains high and consumerconfidence remains low, resulting in reduced numbers ofinsured patients and the deferral of elective reconstructiveprocedures. Global economic conditions, particularly inEurope, our second-largest operating segment, remainuncertain. We believe that European austerity measuresimplemented to address the ongoing financial crisiscontributed to decreased healthcare utilization and increasedpricing pressure for some of our products. We cannot assureyou that challenges in the global economy will not continue tonegatively impact procedure volumes, average selling pricesand reimbursement rates from third-party payors, any of whichcould adversely affect our results of operations. In addition, wehave experienced delays in the collection of receivables fromhospitals in certain countries that have national healthcaresystems, including certain regions in Spain, Italy, Greece andPortugal, which are the countries most directly affected by theEuro zone crisis. Repayment of these receivables is dependentupon the financial stability of the economies of those countries.Further, there are concerns for the overall stability andsuitability of the Euro as a single currency. Continuing highunemployment in the U.S., a worsening of the Europeanfinancial situation or a failure to receive payment of all or asignificant portion of our European receivables could adverselyaffect our results of operations.
We are subject to risks arising from currency
exchange rate fluctuations, which can increase our
costs, cause our profitability to decline and expose us
to counterparty risks.
A substantial portion of our foreign revenues is generatedin Europe and Japan. The U.S. dollar value of our foreign-generated revenues varies with currency exchange ratefluctuations. Significant increases in the value of the U.S. dollarrelative to the Euro or the Japanese Yen, as well as othercurrencies, could have a material adverse effect on our resultsof operations. Although we address currency risk managementthrough regular operating and financing activities, and, on alimited basis, through the use of derivative financialinstruments, those actions may not prove to be fully effective.
Pending and future product liability claims and
litigation could adversely impact our financial condition
and results of operations and impair our reputation.
Our business exposes us to potential product liability risksthat are inherent in the design, manufacture and marketing ofmedical devices. In the ordinary course of business, we are thesubject of product liability lawsuits alleging that componentfailures, manufacturing flaws, design defects or inadequatedisclosure of product-related risks or product-relatedinformation resulted in an unsafe condition or injury topatients. As previously reported, we temporarily suspended
the marketing and distribution of our Durom® AcetabularComponent (Durom Cup) in the U.S. in July 2008.Subsequently, a number of product liability lawsuits and otherclaims have been asserted against us. We have settled some ofthese claims and the others are still pending. Additional claimsmay be asserted in the future. We are also currently defendinga number of other product liability lawsuits and claims relatedto various other products. Any product liability claim broughtagainst us, with or without merit, can be costly to defend.Product liability lawsuits and claims, safety alerts or productrecalls, regardless of their ultimate outcome, could have amaterial adverse effect on our business and reputation and onour ability to attract and retain customers.
Although we maintain third-party product liabilityinsurance coverage, we have substantial self-insured retentionamounts that we must pay in full before obtaining anyinsurance proceeds to satisfy a judgment or settlement.Furthermore, even if any product liability loss is covered byour insurance, it is possible that claims against us may exceedthe coverage limits of our insurance policies and we wouldhave to pay the amount of any settlement or judgment that isin excess of our policy limits. Product liability claims in excessof applicable insurance could have a material adverse effect onour business, financial condition and results of operations.
We are substantially dependent on patent and other
proprietary rights, and failing to protect such rights or
to be successful in litigation related to our rights or the
rights of others may result in our payment of significant
monetary damages and/or royalty payments, negatively
impact our ability to sell current or future products, or
prohibit us from enforcing our patent and other
proprietary rights against others.
Claims of intellectual property infringement and litigationregarding patent and other intellectual property rights arecommonplace in our industry and are frequently timeconsuming and costly. At any given time, we may be involvedas either plaintiff or defendant in a number of patentinfringement actions, the outcomes of which may not beknown for prolonged periods of time. While it is not possible topredict the outcome of patent and other intellectual propertylitigation, such litigation could result in our payment ofsignificant monetary damages and/or royalty payments,negatively impact our ability to sell current or future products,or prohibit us from enforcing our patent and proprietary rightsagainst others, which could have a material adverse effect onour business and results of operations.
Patents and other proprietary rights are essential to ourbusiness. We rely on a combination of patents, trade secretsand non-disclosure and other agreements to protect ourproprietary intellectual property, and we will continue to do so.While we intend to defend against any threats to ourintellectual property, these patents, trade secrets and otheragreements may not adequately protect our intellectualproperty. Further, our currently pending or future patentapplications may not result in patents being issued to us,patents issued to or licensed by us in the past or in the futuremay be challenged or circumvented by competitors, and suchpatents may be found invalid, unenforceable or insufficiently
12

ZIMMER HOLDINGS, INC. 2013 FORM 10-K ANNUAL REPORT
broad to protect our technology or to provide us with anycompetitive advantage. Third parties could obtain patents thatmay require us to negotiate licenses to conduct our business,and the required licenses may not be available on reasonableterms or at all.
In addition, intellectual property rights may be unavailableor of limited effect in some foreign countries. If we do notobtain sufficient international protection for our intellectualproperty, our competitiveness in international markets couldbe impaired, which could limit our growth and revenue.
We also attempt to protect our trade secrets, proprietaryknow-how and continuing technological innovation withsecurity measures, including the use of non-disclosure andother agreements with our employees, consultants andcollaborators. We cannot be certain that these agreements willnot be breached, that we will have adequate remedies for anybreach, that others will not independently developsubstantially equivalent proprietary information, or that thirdparties will not otherwise gain access to our trade secrets orproprietary knowledge.
We are involved in legal proceedings that may
result in adverse outcomes.
In addition to intellectual property and product liabilityclaims and lawsuits, we are involved in various commerciallitigation and claims and other legal proceedings that arisefrom time to time in the ordinary course of our business.Although we believe we have substantial defenses in thesematters, litigation and other claims are subject to inherentuncertainties and management’s view of these matters maychange in the future. Given the uncertain nature of legalproceedings generally, we are not able in all cases to estimatethe amount or range of loss that could result from anunfavorable outcome. We could in the future incur judgmentsor enter into settlements of claims that could have a materialadverse effect on our results of operations in any particularperiod.
If we fail to retain the independent agents and
distributors upon whom we rely heavily to market our
products, customers may not buy our products and our
revenue and profitability may decline.
Our marketing success in the U.S. and abroad dependssignificantly upon our agents’ and distributors’ sales andservice expertise in the marketplace. Many of these agentshave developed professional relationships with existing andpotential customers because of the agents’ detailed knowledgeof products and instruments. A loss of a significant number ofthese agents could have a material adverse effect on ourbusiness and results of operations.
We depend on a limited number of suppliers for
some key raw materials and outsourced activities.
We use a number of suppliers for raw materials that weneed to manufacture our products and to outsource some keymanufacturing activities. These suppliers must provide thematerials and perform the activities to our standards for us tomeet our quality and regulatory requirements. Some key rawmaterials and outsourced activities can only be obtained from asingle source or a limited number of sources. A prolongeddisruption or other inability to obtain these materials or
outsource key manufacturing activities could materially andadversely affect our ability to satisfy demand for our products.
Future material impairments in the carrying value
of our intangible assets, including goodwill, would
negatively affect our operating results.
Our assets include intangible assets, primarily goodwill.The goodwill results from our acquisition activity andrepresents the excess of the consideration transferred over thefair value of the net assets acquired. We assess at leastannually whether events or changes in circumstances indicatethat the carrying value of our intangible assets may not berecoverable. If the operating performance at one or more ofour business units falls significantly below current levels, ifcompeting or alternative technologies emerge, or if marketconditions or future cash flow estimates for one or more of ourbusinesses decline, we could be required, under current U.S.accounting rules, to record a non-cash charge to operatingearnings for the amount of the impairment. Any write-off of amaterial portion of our unamortized intangible assets wouldnegatively affect our results of operations.
We are increasingly dependent on sophisticated
information technology and if we fail to effectively
maintain or protect the integrity of our information
systems and data, our business could be adversely
affected.
We are increasingly dependent on sophisticatedinformation technology for our products and infrastructure. Asa result of technology initiatives, recently enacted regulations,changes in our system platforms and integration of newbusiness acquisitions, we have been consolidating andintegrating the number of systems we operate and haveupgraded and expanded our information systems capabilities.Our information systems require an ongoing commitment ofsignificant resources to maintain, protect, and enhanceexisting systems and develop new systems to keep pace withcontinuing changes in information technology, evolvingsystems and regulatory standards, and the increasing need toprotect patient and customer information. In addition, thirdparties may attempt to hack into our products or systems andmay obtain data relating to patients with our products or ourproprietary information. If we fail to maintain or protect ourinformation systems and data integrity effectively, we couldlose existing customers, have difficulty attracting newcustomers, have problems in determining product costestimates and establishing appropriate pricing, have difficultypreventing, detecting, and controlling fraud, have disputeswith customers, physicians, and other healthcare professionals,have regulatory sanctions or penalties imposed, have increasesin operating expenses, incur expenses or lose revenues as aresult of a data privacy breach, or suffer other adverseconsequences. While we have invested heavily in theprotection of data and information technology, there can be noassurance that our process of consolidating the number ofsystems we operate, upgrading and expanding our informationsystems capabilities, protecting and enhancing our systemsand developing new systems to keep pace with continuingchanges in information processing technology will besuccessful or that systems issues will not arise in the future.
13

ZIMMER HOLDINGS, INC. 2013 FORM 10-K ANNUAL REPORT
Any significant breakdown, intrusion, interruption, corruption,or destruction of these systems could have a material adverseeffect on our business.
We may make additional acquisitions or enter into
strategic alliances that could increase our costs or
liabilities or be disruptive.
We intend to continue to look for additional strategicacquisitions of other businesses that are complementary to ourbusinesses and other companies with whom we could formstrategic alliances or enter into other arrangements to developor exploit intellectual property rights. These activities involverisks, including the following:• we may need to divert more management resources to
integration than we planned, which may adversely affect ourability to pursue other more profitable activities;
• the difficulties of integrating acquired businesses may beincreased if we need to integrate geographically separatedorganizations, personnel with disparate businessbackgrounds and companies with different corporatecultures;
• we may not recognize expected cost savings or theanticipated benefits of acquisitions or strategic alliances;
• our acquisition candidates or strategic partners may haveunexpected liabilities or prove unable to meet theirobligations to us or the joint venture; and
• the priorities of our strategic partners may proveincompatible with ours.
ITEM 1B. Unresolved Staff Comments
Not Applicable.
14

ZIMMER HOLDINGS, INC. 2013 FORM 10-K ANNUAL REPORT
ITEM 2. Properties
We have the following properties:Location Use Owned /Leased Square Feet
Warsaw, Indiana Research & Development, Manufacturing, Warehousing, Marketing &
Administration . . . . . . . . . . . . . . . . . . . . . . . . . . . . . . . . . . . . . . . . . . . . . . . . . . . . Owned 1,400,000
Warsaw, Indiana Corporate Headquarters & The Zimmer Institute . . . . . . . . . . . . . . . . . . . . . . . Owned 117,000
Warsaw, Indiana Offices, Manufacturing & Warehousing . . . . . . . . . . . . . . . . . . . . . . . . . . . . . . . . Leased 83,000
Carlsbad, California Offices, Research & Development & Manufacturing . . . . . . . . . . . . . . . . . . . . . Leased 125,000
Minneapolis, Minnesota Offices & Research & Development . . . . . . . . . . . . . . . . . . . . . . . . . . . . . . . . . . . Owned 51,000
Southaven, Mississippi Distribution Center . . . . . . . . . . . . . . . . . . . . . . . . . . . . . . . . . . . . . . . . . . . . . . . . Leased 189,000
Dover, Ohio Research & Development, Manufacturing & . . . . . . . . . . . . . . . . . . . . . . . . . . . . Owned 138,000
Warehousing . . . . . . . . . . . . . . . . . . . . . . . . . . . . . . . . . . . . . . . . . . . . . . . . . . . . . Leased 64,000
Parsippany, New Jersey Office, Research & Development, Manufacturing, Warehousing & The
Zimmer Institute . . . . . . . . . . . . . . . . . . . . . . . . . . . . . . . . . . . . . . . . . . . . . . . . . . Leased 132,000
Memphis, Tennessee Offices & Warehousing . . . . . . . . . . . . . . . . . . . . . . . . . . . . . . . . . . . . . . . . . . . . . Leased 30,000
Austin, Texas Offices, Administration, Research & Development . . . . . . . . . . . . . . . . . . . . . . Leased 71,000
Sydney, Australia Offices & Warehousing . . . . . . . . . . . . . . . . . . . . . . . . . . . . . . . . . . . . . . . . . . . . . Leased 60,000
Mississauga, Canada Offices & Warehousing . . . . . . . . . . . . . . . . . . . . . . . . . . . . . . . . . . . . . . . . . . . . . Leased 52,000
Beijing, China Offices & Manufacturing . . . . . . . . . . . . . . . . . . . . . . . . . . . . . . . . . . . . . . . . . . . . Leased 89,000
Shanghai, China Offices & Warehousing . . . . . . . . . . . . . . . . . . . . . . . . . . . . . . . . . . . . . . . . . . . . . Leased 52,000
Etupes, France Offices, Manufacturing & Warehousing . . . . . . . . . . . . . . . . . . . . . . . . . . . . . . . . Owned 90,000
Saint Priest, France Offices & Warehousing . . . . . . . . . . . . . . . . . . . . . . . . . . . . . . . . . . . . . . . . . . . . . Leased 13,000
Eschbach, Germany Distribution Center . . . . . . . . . . . . . . . . . . . . . . . . . . . . . . . . . . . . . . . . . . . . . . . . Owned 94,000
Freiburg, Germany Offices & Warehousing . . . . . . . . . . . . . . . . . . . . . . . . . . . . . . . . . . . . . . . . . . . . . Leased 75,000
Shannon, Ireland Offices & Manufacturing . . . . . . . . . . . . . . . . . . . . . . . . . . . . . . . . . . . . . . . . . . . . Owned 125,000
Milan, Italy Offices & Warehousing . . . . . . . . . . . . . . . . . . . . . . . . . . . . . . . . . . . . . . . . . . . . . Leased 55,000
Gotemba, Japan Offices, Service Center & Warehousing . . . . . . . . . . . . . . . . . . . . . . . . . . . . . . . . Owned 87,000
Tokyo, Japan Offices & Warehousing . . . . . . . . . . . . . . . . . . . . . . . . . . . . . . . . . . . . . . . . . . . . . Leased 20,000
Seoul, Korea Offices & Warehousing . . . . . . . . . . . . . . . . . . . . . . . . . . . . . . . . . . . . . . . . . . . . . Leased 34,000
Ponce, Puerto Rico Offices, Manufacturing & Warehousing . . . . . . . . . . . . . . . . . . . . . . . . . . . . . . . . Owned 225,000
Singapore Offices & Warehousing . . . . . . . . . . . . . . . . . . . . . . . . . . . . . . . . . . . . . . . . . . . . . Leased 19,000
Barcelona, Spain Offices & Warehousing . . . . . . . . . . . . . . . . . . . . . . . . . . . . . . . . . . . . . . . . . . . . . Leased 30,000
Winterthur, Switzerland Offices, Research & Development & Manufacturing . . . . . . . . . . . . . . . . . . . . . Leased 425,000
Münsingen, Switzerland Offices & Warehousing . . . . . . . . . . . . . . . . . . . . . . . . . . . . . . . . . . . . . . . . . . . . . Owned 76,000
Swindon, United Kingdom Offices & Warehousing . . . . . . . . . . . . . . . . . . . . . . . . . . . . . . . . . . . . . . . . . . . . . Leased 10,000
We believe the current facilities, including manufacturing, warehousing, research and development and office space, providesufficient capacity to meet ongoing demands.
In addition to the above, we maintain more than 100 other offices and warehouse facilities in more than 25 countries aroundthe world, including the U.S., Japan, Australia, France, Russia, India, Germany, Italy, Switzerland and China. We believe that all ofthe facilities and equipment are in good condition, well maintained and able to operate at present levels.
ITEM 3. Legal Proceedings
Information pertaining to legal proceedings in which we are involved can be found in Note 19 to our consolidated financialstatements (see Part II, Item 8 of this report).
ITEM 4. Mine Safety Disclosures
Not Applicable.
15

ZIMMER HOLDINGS, INC. 2013 FORM 10-K ANNUAL REPORT
PART II
ITEM 5. Market for the Registrant’s Common Equity, Related Stockholder Matters and Issuer Purchases of
Equity Securities
Our common stock is traded on the New York Stock Exchange and the SIX Swiss Exchange under the symbol “ZMH.” The highand low sales prices for our common stock on the New York Stock Exchange and the dividends declared for the calendar quartersof fiscal years 2013 and 2012 are set forth as follows:
Quarterly High-Low Share Prices and Declared Dividends High LowDeclaredDividends
Year Ended December 31, 2013:First Quarter $76.75 $67.34 $0.20Second Quarter $81.92 $72.31 $0.20Third Quarter $85.08 $74.85 $0.20Fourth Quarter $93.70 $80.55 $0.20
Year Ended December 31, 2012:First Quarter $64.81 $52.70 $ –Second Quarter $66.41 $58.23 $0.18Third Quarter $67.90 $57.46 $0.18Fourth Quarter $69.09 $61.97 $0.18
We expect to continue paying cash dividends on a quarterly basis; however, future dividends are subject to approval of theBoard of Directors and may be adjusted as business needs or market conditions change.
The number of holders of our common stock on February 14, 2014 was approximately 233,201. On February 14, 2014, theclosing price of the common stock, as reported on the New York Stock Exchange, was $96.07 per share.
The information required by this Item concerning equity compensation plans is incorporated by reference to Item 12 of thisreport.
The following table summarizes repurchases of common stock settled during the three months ended December 31, 2013:
Total Number ofShares Purchased
Average PricePaid per Share
Total Number of SharesPurchased as Part ofPublicly Announced
Plans or Programs (1)
Approximate Dollar Value ofShares that May Yet Be
Purchased Under Plans orPrograms (1)
October 2013 245,000 $87.95 245,000 $514,828,590November 2013 791,099 89.39 791,099 444,111,051December 2013 1,631,684 90.90 1,631,684 295,789,806
Total 2,667,783 $90.18 2,667,783 $295,789,806
(1) Includes repurchases made under a program authorizing $1.5 billion of repurchases through December 31, 2014. In December 2013, our Board ofDirectors authorized a new share repurchase program effective January 1, 2014. The new share repurchase program authorizes purchases of up to $1.0 billionwith no expiration date. No further purchases will be made under the previous share repurchase program.
16

ZIMMER HOLDINGS, INC. 2013 FORM 10-K ANNUAL REPORT
ITEM 6. Selected Financial Data
The financial information for each of the past five years ended December 31 is set forth below (in millions, except per shareamounts):
2013 2012 2011 2010 2009
STATEMENT OF EARNINGS DATA
Net sales $4,623.4 $4,471.7 $4,451.8 $4,220.2 $4,095.4Net earnings of Zimmer Holdings, Inc. 761.0 755.0 760.8 596.9 717.4Earnings per common share
Basic $ 4.49 $ 4.32 $ 4.05 $ 2.98 $ 3.34Diluted 4.43 4.29 4.03 2.97 3.32
Dividends declared per share of common stock $ 0.80 $ 0.54 $ 0.18 $ – $ –Average common shares outstanding
Basic 169.6 174.9 187.6 200.0 215.0Diluted 171.8 176.0 188.7 201.1 215.8
BALANCE SHEET DATA
Total assets $9,580.6 $9,012.4 $8,515.3 $7,999.9 $7,785.5Long-term debt 1,672.3 1,720.8 1,576.0 1,142.1 1,127.6Other long-term obligations 576.6 559.3 557.4 384.0 328.5Stockholders’ equity 6,300.1 5,866.3 5,514.8 5,771.3 5,638.7
17

ZIMMER HOLDINGS, INC. 2013 FORM 10-K ANNUAL REPORT
ITEM 7. Management’s Discussion and Analysis of Financial Condition and Results of Operations
The following discussion and analysis should be read inconjunction with the consolidated financial statements and thecorresponding notes included elsewhere in this Form 10-K.Certain percentages presented in this discussion and analysis arecalculated from the underlying whole-dollar amounts andtherefore may not recalculate from the rounded numbers usedfor disclosure purposes. Certain amounts in the 2012 and 2011consolidated financial statements have been reclassified toconform to the 2013 presentation.
EXECUTIVE LEVEL OVERVIEW
2013 Results
Our 2013 sales results reflected increased growth ascompared with 2012 trends. Sales from new productintroductions, such as Persona The Personalized Knee Systemand the Transposal Fluid Waste Management System, as wellas a stable or slightly improved joint replacement market,drove sales volume and product mix growth. This was partiallyoffset by continued pricing pressure, as well as negativeeffects from changes in foreign currency exchange rates.
Our gross profit declined slightly in 2013 compared to2012. We realized lower gross margins caused by excess andobsolete inventory charges for products we intend todiscontinue, as well as a higher mix of lower margin productand geographic revenues.
Operating expenses increased by $2.6 million in 2013, whileoperating expenses as a percentage of sales decreased in 2013relative to 2012. We incurred higher selling expenses, “Certainclaims” and “Special items” in 2013 relative to 2012, but we did notincur a goodwill impairment charge in 2013, whereas in 2012 werecorded a $96.0 million goodwill impairment charge. The sellingexpense increase was due to sales growth. “Certain claims”expense is a provision for estimated liabilities to Durom Cuppatients undergoing revision surgeries. “Special items” areprimarily related to our quality and operational excellenceinitiatives, which are intended to improve our future operatingresults and include centralizing or outsourcing certain functionsand improving quality, distribution, sourcing, manufacturing andinformation technology systems.
Our effective tax rate (ETR) benefited from changes inthe mix of income between taxing jurisdictions. The significantexpenses for our excess and obsolete inventory charges,“Certain claims” and “Special items” were primarily incurred injurisdictions with higher rates of tax, which lowered taxableincome in those jurisdictions.
Sales increased 3 percent in 2013 relative to 2012, whilenet earnings increased 1 percent. Net earnings grew at aslower pace than sales primarily due to lower gross profit.
2014 Outlook
We estimate our net sales will grow between 2.5 and 4.5percent in 2014. This assumes the market for knee and hipprocedures will remain stable and grow in the low to mid-
single digits. We expect pricing to have a negative effect onsales growth of between 2 and 3 percent, and foreign currencyexchange rates to have a negative effect on sales growth ofbetween 0 and 1 percent based upon December 31, 2013 rates.
Assuming currency rates remain at December 31, 2013levels, we expect our gross margin to be between 73 and 74percent of sales in 2014. This range assumes that foreigncurrency hedge gains will be higher in 2014 than in 2013. Therange also takes into consideration the full year impact of the2.3 percent medical device excise tax on a majority of our U.S.sales. Pursuant to the tax regulations, the excise tax isimposed on the first sale in the U.S. by the manufacturer,producer or importer of a medical device to either a thirdparty or an affiliated distribution entity. We distribute amajority of our musculoskeletal products through an affiliateddistribution entity. Under U.S. Generally Accepted AccountingPrinciples (GAAP), excise taxes incurred to transfer inventoryto its current location can be included in the cost of theinventory. Accordingly, a majority of the excise tax will becapitalized in inventory and the expense will be deferred untilthat inventory is sold on a first-in first-out basis. Based uponthe levels of inventory we were carrying before the medicaldevice excise tax was effective, we did not recognize any ofthe excise tax until the fourth quarter of 2013. The excise taxis derived from a constructive sales price, as defined by U.S.tax law and Internal Revenue Service (IRS) guidance. Prior tothe medical device excise tax effective date, the IRS issuedinterim rules (see IRS Notice 2012-77) that provide, amongother things, that medical device manufacturers selling to anaffiliated distribution entity may apply a 28.75% discount offretail selling prices when computing the tax base. We are indiscussions with the IRS as to what an appropriateconstructive sales price should be under IRS excise taxregulations and our specific business model. As a result of ourdiscussions with the IRS, our ultimate medical device excisetax may differ from the amount determined under Notice2012-77. We estimate the cost in 2014 will be approximately$10 million per quarter. Since we recognize the medical deviceexcise tax as a part of the cost of inventory, the amountexpensed in any particular quarter will vary according to U.S.sales levels in that quarter.
We expect to continue making investments in research anddevelopment (R&D) of between 4 and 4.5 percent of sales in 2014.Selling, general and administrative expenses (SG&A) as apercentage of sales is expected to be between 38.5 and 39 percentin 2014 as we realize efficiencies from our quality and operationalexcellence initiatives and further leverage revenue growth.
We expect to incur approximately $250 million ofexpenses in 2014 related to our quality and operationalexcellence initiatives and integration costs from recentacquisitions. The quality and operational excellence programsare intended to improve our future operating results andinclude centralizing or outsourcing certain functions andimproving quality, distribution, sourcing, manufacturing andinformation technology systems. We expect to recognize the
18

ZIMMER HOLDINGS, INC. 2013 FORM 10-K ANNUAL REPORT
majority of these expenses in “Special items” on our statementof earnings, but some will be related to inventory and bereflected in costs of products sold.
Assuming variable interest rates remain at December 31,2013 levels, we expect interest income and expense, net, to besimilar to 2013.
We expect our ETR to increase in 2014 relative to 2013,as we do not anticipate certain significant costs, such asexcess and obsolete inventory charges and “Certain claims”
that were incurred in jurisdictions with higher tax rates, torecur, thus increasing the profit in those higher taxjurisdictions.
Based upon the above, we expect reported net earningsand diluted earnings per share to increase in a range ofapproximately 13 to 17 percent in 2014 relative to 2013,stemming from anticipated higher sales and an improved grossmargin.
RESULTS OF OPERATIONS
Net Sales by Reportable Segment
The following tables present net sales by reportable segment and the components of the percentage changes (dollars inmillions):
Year Ended December 31,Volume/
Mix
Foreign
Exchange2013 2012 % Inc/(Dec) Price
Americas $2,619.8 $2,476.3 6% 8% (2)% –%
Europe 1,212.6 1,177.4 3 2 (1) 2
Asia Pacific 791.0 818.0 (3) 8 (1) (10)
Total $4,623.4 $4,471.7 3 7 (2) (2)
Year Ended December 31,Volume/
Mix
Foreign
Exchange2012 2011 % Inc/(Dec) Price
Americas $2,476.3 $2,440.8 1% 4% (2)% (1)%
Europe 1,177.4 1,214.5 (3) 4 (1) (6)
Asia Pacific 818.0 796.5 3 5 (2) –
Total $4,471.7 $4,451.8 – 4 (2) (2)
“Foreign Exchange” as used in the tables in this report represents the effect of changes in foreign currency exchange rates onsales growth.
Net Sales by Product Category
The following tables present net sales by product category and the components of the percentage changes (dollars in millions):
Year Ended December 31,Volume/
Mix
Foreign
Exchange2013 2012 % Inc (Dec) Price
ReconstructiveKnees $1,909.9 $1,833.8 4% 7% (2)% (1)%Hips 1,330.5 1,342.0 (1) 3 (2) (2)Extremities 193.8 173.8 11 14 (2) (1)
Total 3,434.2 3,349.6 3 6 (2) (1)
Dental 239.3 237.7 1 – – 1Trauma 315.6 307.9 2 6 (1) (3)Spine 202.3 208.9 (3) (1) (2) –Surgical and other 432.0 367.6 18 21 – (3)
Total $4,623.4 $4,471.7 3 7 (2) (2)
Year Ended December 31,Volume/
Mix
Foreign
Exchange2012 2011 % Inc (Dec) Price
ReconstructiveKnees $1,833.8 $1,835.9 –% 4% (2)% (2)%Hips 1,342.0 1,355.6 (1) 4 (3) (2)Extremities 173.8 163.4 6 9 (1) (2)
Total 3,349.6 3,354.9 – 4 (3) (1)
Dental 237.7 248.1 (4) (4) 2 (2)Trauma 307.9 285.8 8 10 (1) (1)Spine 208.9 225.0 (7) (2) (4) (1)Surgical and other 367.6 338.0 9 10 – (1)
Total $4,471.7 $4,451.8 – 4 (2) (2)
19

ZIMMER HOLDINGS, INC. 2013 FORM 10-K ANNUAL REPORT
Beginning in 2013, our Knees product category net sales include certain early intervention products that are primarily used inknee procedures. In 2012 and 2011, these products were included in the Surgical and other product category. Net sales in the yearsended December 31, 2012 and 2011 related to these products have been reclassified to conform to the 2013 presentation.
The following table presents net sales by product category by region (dollars in millions):
Year Ended December 31, 2013 2012 2011
2013 vs. 2012
% Inc (Dec)
2012 vs. 2011
% Inc (Dec)
ReconstructiveKnees
Americas $1,135.3 $1,077.9 $1,078.3 5% –Europe 468.3 447.3 462.6 5 (3)Asia Pacific 306.3 308.6 295.0 (1) 5
HipsAmericas 621.0 606.7 600.7 2 1Europe 445.0 446.0 470.5 – (5)Asia Pacific 264.5 289.3 284.4 (9) 2
ExtremitiesAmericas 148.1 133.8 125.0 11 7Europe 34.0 29.0 27.5 17 6Asia Pacific 11.7 11.0 10.9 7 1
Total 3,434.2 3,349.6 3,354.9 3 –
DentalAmericas 141.6 137.8 134.7 3 2Europe 78.6 79.8 85.3 (2) (6)Asia Pacific 19.1 20.1 28.1 (5) (29)
TraumaAmericas 155.6 155.2 145.5 – 7Europe 76.4 69.5 63.5 10 10Asia Pacific 83.6 83.2 76.8 – 8
SpineAmericas 129.6 140.0 150.9 (7) (7)Europe 49.8 49.3 53.5 1 (8)Asia Pacific 22.9 19.6 20.6 17 (5)
Surgical and otherAmericas 288.6 224.9 205.7 28 9Europe 60.5 56.5 51.6 7 10Asia Pacific 82.9 86.2 80.7 (4) 7
Total $4,623.4 $4,471.7 $4,451.8 3 –
20

ZIMMER HOLDINGS, INC. 2013 FORM 10-K ANNUAL REPORT
Demand (Volume and Mix) Trends
Increased volume and changes in the mix of product salescontributed 7 percentage points of year-over-year sales growthin 2013, which is a higher growth rate than experienced in2012 compared to 2011. In 2013, accelerated growth wasfueled by the introduction of new products, such as Persona
The Personalized Knee System and the Transposal FluidWaste Management System.
We believe procedure volumes in the broadermusculoskeletal market remained stable or improved slightlyin 2013 relative to 2012. We believe long-term indicators pointtoward sustained growth driven by an aging global population,growth in emerging markets, obesity, proven clinical benefits,new material technologies, advances in surgical techniques andmore active lifestyles, among other factors. In addition,demand for clinically proven premium products and patientspecific devices will continue to positively affect sales growthin markets that recognize the value in these advancedtechnologies.
Pricing Trends
Global selling prices had a negative effect of 2 percent onyear-over-year sales during 2013. Our Americas and Europereporting segments and certain countries in our Asia Pacificreporting segment continued to experience pricing pressurefrom governmental healthcare cost containment efforts andfrom local hospitals and health systems. For 2014, we estimatethat selling prices will decline slightly more than they did in2013 due to a biennial price adjustment in Japan in the secondquarter of 2014 along with some moderately weaker pricing inEurope. Overall, we estimate prices will have a negative effectof 2 to 3 percent on year-over-year sales in 2014.
Foreign Currency Exchange Rates
For 2013, foreign currency exchange rates resulted in a 2percent decrease in sales, primarily from the strengthening ofthe U.S. Dollar versus the Japanese Yen in the period. Ifforeign currency exchange rates remain consistent withDecember 31, 2013 rates, we estimate that a stronger dollarversus foreign currency exchange rates will have a negativeeffect on sales in 2014 of 0 to 1 percent. We address currencyrisk through regular operating and financing activities andthrough the use of forward contracts and foreign currencyoptions solely to manage foreign currency volatility and risk.Changes to foreign currency exchange rates affect salesgrowth, but due to offsetting gains/losses on hedge contractsand options, which are recorded in cost of products sold, theeffect on net earnings in the near term is expected to beminimal.
Knees
Knee sales increased 4 percent in 2013 compared to flatsales in 2012. Our Knee product category has benefited fromnew product introductions, such as Persona The PersonalizedKnee System and early intervention products, as well asincreased procedure volumes in the market. We are cautiouslyoptimistic that volume/mix trends will continue to remainstable in 2014.
In 2013, we continued a broader launch of Persona ThePersonalized Knee System. We intend to continue to deployimplant and instrument sets to all geographic regions during2014 and beyond. In the meantime, our NexGen CompleteKnee Solution product line is still our leading knee system interms of sales. Products driving growth in this category in 2013in addition to Persona The Personalized Knee Systemincluded Zimmer Patient Specific Instruments, the Zimmer
Unicompartmental High Flex Knee and our early interventionproducts.
In Europe, changes in foreign currency exchange ratesaffected knee sales in 2013 and 2012 by positive 2 percent andnegative 6 percent, respectively. In Asia Pacific, changes inforeign currency exchange rates had a negative 9 percenteffect on knee sales in 2013 and a minimal effect in 2012.
Hips
Hip sales declined by 1 percent in each of the last twoyears. We believe that industry procedure volumes were stableor improved slightly in 2013, while pricing was negative. Ascompared to our Knee product category, our overall Hipproduct category is more exposed to certain negative factors inEurope and Asia Pacific, as we derive a higher percentage oftotal hip sales in those regions when compared to our Kneebusiness. More specifically, Europe continues to be a difficultmarket with government budget constraints. In Asia Pacific,the strengthening of the U.S. Dollar versus the Japanese Yencaused a significant decline in Asia Pacific hip sales in 2013.
In Europe, changes in foreign currency exchange ratesaffected hip sales in 2013 and 2012 by positive 2 percent andnegative 6 percent, respectively. In Asia Pacific, changes inforeign currency exchange rates affected hip sales in 2013 and2012 by negative 11 percent and positive 1 percent,respectively.
Leading hip stem sales were the Zimmer M/L Taper HipProsthesis, the Zimmer M/L Taper Hip Prosthesis withKinectiv Technology, the CLS Spotorno Stem from the CLS
Hip System and the Alloclassic Zweymüller Hip Stem.Products experiencing growth in this category included theWagner SL Revision® Hip Stem, the Continuum AcetabularSystem, the Trilogy IT Acetabular System, the Allofit ITAlloclassic Acetabular System, Vivacit-E® Highly CrosslinkedPolyethylene Liners and BIOLOX®4 delta Heads.
Extremities
Extremities delivered solid sales growth the past twoyears. The Zimmer Trabecular Metal Reverse ShoulderSystem, the Sidus® Stem-Free Shoulder and the Zimmer
Trabecular Metal Total Ankle drove sales growth. Trabecular
Metal Technology continues to be an effective way to addressclinical needs in the extremities market. Additionally, ouracquisition of NORMED Medizin-Technik GmbH in June 2013contributed to growth in this product category.
4 Registered trademark of CeramTec GmbH
21

ZIMMER HOLDINGS, INC. 2013 FORM 10-K ANNUAL REPORT
Dental
Dental sales increased 1 percent in 2013 after a 4 percentdecline in 2012. While the Americas dental sales increased in2012, the overall performance of our dental franchise wasimpacted by several factors, including softening in certaininternational markets and lower inventory levels maintained byour stocking distributors. In 2013, the effects of those negativefactors in 2012 were less pronounced which resulted in slightlyimproved sales of dental reconstructive implants and digitalsolutions, offset by decreases in restorative products andregenerative products. We believe the dental market continuesto be challenged both in the U.S. and internationally. Dentalsales in 2013 were led by the Tapered Screw-Vent ImplantSystem.
Trauma
Trauma sales increased by 2 percent and 8 percent in2013 and 2012, respectively, compared to the same prior yearperiods. In this product category, changes in foreign exchangerates had a greater negative impact on 2013 sales than in ourother product categories due to the geographic mix of ourTrauma sales revenue. The Zimmer Natural Nail Systemcontinued to increase sales significantly. However, thisincrease was partially at the expense of our otherintramedullary nail systems. In addition to the Zimmer
Natural Nail System, the Zimmer Periarticular LockingPlates System led trauma sales.
Spine
We experienced mid-single digit sales declines in Spineeach of the past two years. This product category continues toface challenges related to pricing pressure and payor approval.In 2013, solid sales of the PathFinder NXT Minimally InvasivePedicle Screw System and Trabecular Metal Technologyproducts partly offset a decline in sales of the Dynesys
Dynamic Stabilization System, the Trinica Select AnteriorCervical Plate System and other spine products.
Surgical and other
Surgical and other jumped to an 18 percent sales increasein 2013 after a 9 percent increase in 2012. The primary driverof sales growth in this product category was the Transposal
Fluid Waste Management System, which we acquired throughour acquisition of Dornoch Medical Systems, Inc. in October2012. Other contributing products were PALACOS®5 BoneCement, tourniquets and wound debridement devices.
5 Registered trademark of Heraeus Medical GmbH
The following table presents estimated* 2013 globalmarket size and market share information (dollars in billions):
Global
Market
Size
Global Market
% Growth**
Zimmer
Market
Share
Zimmer
Market
Position
ReconstructiveKnees $ 7.5 3% 26% 1Hips 6.4 3 21 2Extremities 1.7 11 12 5
Total $15.6 4 22 1
Dental $ 3.3 1 7 5Trauma $ 5.7 3 6 4Spine*** $ 8.8 1 2 7
* Estimates are not precise and are based on competitor annual filings, WallStreet equity research and Company estimates** Excludes the effect of changes in foreign currency exchange rates onsales growth*** Spine includes related orthobiologics
Expenses as a Percent of Net Sales
Year Ended December 31,
2013 2012 2011
2013 vs. 2012
Inc (Dec)
2012 vs. 2011
Inc (Dec)
Cost of products sold 27.8% 25.2% 25.2% 2.6 –Research and
development 4.4 5.0 5.4 (0.6) (0.4)Selling, general and
administrative 39.7 40.4 41.2 (0.7) (0.8)Certain claims 1.0 0.3 3.5 0.7 (3.2)Goodwill impairment – 2.1 – (2.1) 2.1Special items 4.7 3.5 1.7 1.2 1.8Operating margin 22.4 23.4 23.0 (1.0) 0.4
Cost of Products Sold
The following table sets forth the factors that contributedto the gross margin changes in each of 2013 and 2012compared to the prior year:
Year Ended December 31, 2013 2012
Prior year gross margin 74.8% 74.8%Lower average selling prices (0.4) (0.5)Average cost per unit (1.2) (0.1)Excess and obsolete inventory (0.2) (0.1)Discontinued products and other certain excess and
obsolete inventory charges (1.0) –Certain inventory and manufacturing related charges
related to quality (0.3) –Foreign currency exchange impact, net 0.5 0.4Inventory step-up (0.1) 0.2Other 0.1 0.1
Current year gross margin 72.2% 74.8%
The decrease in gross margin in 2013 was primarily due tohigher average costs per unit sold as a result of changes inproduct and geographic mix and increased excess andobsolescence charges related to products we intend todiscontinue. Additionally, lower average selling prices andcertain inventory and manufacturing related chargesconnected to quality enhancement and remediation effortsreduced gross margin. These negative effects were partially
22

ZIMMER HOLDINGS, INC. 2013 FORM 10-K ANNUAL REPORT
offset by hedge gains recorded in 2013 from our foreigncurrency hedging program versus hedge losses recorded in2012. The gains were primarily the result of the U.S. Dollarstrengthening against the Japanese Yen. Under the program,for derivatives which qualify as hedges of future cash flows, theeffective portion of changes in fair value is temporarilyrecorded in other comprehensive income and then recognizedin cost of products sold when the hedged item affects earnings.
Gross margin was the same in 2012 compared to 2011.Our foreign currency hedging program also had a favorableimpact on gross margin in 2012. Additionally, lower inventorystep-up charges from acquisitions were recognized in 2012when compared to 2011 based on the timing of acquisitions.This favorability was offset by the effect of lower prices ongross margin.
Operating Expenses
R&D expenses and R&D as a percentage of sales havedeclined in the last three years. The lower spending reflected anatural decline from certain large projects that achieved fullcommercialization, including Persona The Personalized KneeSystem, and a dedication of resources to our quality andoperational excellence initiatives. We expect R&D spending in2014 to be between 4 and 4.5 percent of sales.
SG&A expenses increased, but SG&A as a percentage ofsales decreased in 2013 compared to 2012. The dollar increasewas primarily due to higher selling and distribution expensesfrom higher sales and increased intangible asset amortizationfrom acquisitions. This was partially offset by lower bad debtexpenses as well as lower legal expenses due to the conclusionof certain matters for which we are no longer incurring legalexpenses, as well as normal variations in the phases oflitigation, including product liability litigation. As a percentageof sales, SG&A decreased 70 basis points in 2013 as our qualityand operational excellence initiatives have produced lowervariable and fixed costs in SG&A as well as the naturalleverage that occurs when sales increase against our fixedcosts, such as fixed intangible asset amortization from pastacquisitions.
In 2012, SG&A decreased in dollar terms and as a percentof sales. Changes in foreign currency exchange rates due tothe strengthening of the U.S. Dollar relative to 2011 rateslowered SG&A expense, especially in Europe. Absent theeffects of foreign currency exchange rates, selling anddistribution expenses were higher due to higher sales. Otherunfavorable items included increased intangible assetamortization from business combinations, higher employeerecruiting and relocation costs, increased legal costs andhigher bad debt expense. These were offset by favorableproduct liability claims, lower instrument excess andobsolescence charges and lower advertising spend. SG&A as apercent of sales decreased 80 basis points in 2012 compared to2011 for similar reasons noted in 2013.
“Certain claims” expense is for estimated liabilities toDurom Cup patients undergoing revision surgeries. Werecorded expense of $15.0 million, $157.8 million, $75.0million, $35.0 million and $69.0 million during 2012, 2011,
2010, 2009 and 2008, respectively. We recorded additionalexpense of $47.0 million in 2013, bringing the total recordedexpense to $398.8 million for these claims, excluding a subsetof Durom Cup claims that were recorded in SG&A. Theadditional expense recorded in 2013 was driven primarily bymore estimated claims than were previously expected. Theadditional expense in 2012 was primarily for more estimatedclaims outside the U.S. than were previously expected, as wellas higher estimated legal costs. For more informationregarding these claims, see Note 19 to the consolidatedfinancial statements.
In connection with our annual goodwill impairment testperformed in the fourth quarter of 2012, we noted that thecarrying values of the net assets of our U.S. Spine reportingunit were in excess of the reporting unit’s estimated fair value.As a result, we recorded a goodwill impairment charge of $96.0million in 2012. We did not record a goodwill impairmentcharge in 2013, as our annual goodwill impairment testrevealed that the carrying values of the net assets of our U.S.Spine reporting unit were less than their estimated fair value.For more information regarding goodwill impairment and thefactors that led to the 2012 impairment, see Note 8 to theconsolidated financial statements.
“Special items” have increased significantly in the pastthree years. We continue to implement our quality andoperational excellence initiatives, which are intended toimprove our future operating results by centralizing oroutsourcing certain functions and improving quality,distribution, sourcing, manufacturing and our informationtechnology systems. “Special items” expenses includeconsulting and professional fees, dedicated personnel costs,severance benefits as well as other costs for those programs. Inaddition to expenses for our quality and operational excellenceprograms, we recognize expenses related to integration ofacquired businesses, impairment of assets, certain R&Dagreements, certain litigation settlements, contracttermination expenses and other items as “Special items.” SeeNote 2 to the consolidated financial statements for moreinformation regarding “Special items” charges.
Interest Income, Interest Expense, Income Taxes and
Net Earnings
Interest income and expense, net, were similar in 2013and 2012 after an increase from 2011. Interest expenseincreased in 2012 compared to 2011 primarily due to the $550million offering of senior notes we completed in November2012.
Our ETR on earnings before income taxes for the yearsended December 31, 2013, 2012 and 2011 was 22.6 percent,24.0 percent and 22.4 percent, respectively. The variation ofour ETR has largely been affected by “Special items”, “Certainclaims”, goodwill impairment charges and a $34.3 millionbenefit in 2012 from the recognition of deferred tax assetsrelated to a legal entity restructuring. Higher “Special items”and “Certain claims” expense favorably affect our ETR becausethese expenses have mostly been incurred within jurisdictionswith higher tax rates, resulting in lower taxable income in
23

ZIMMER HOLDINGS, INC. 2013 FORM 10-K ANNUAL REPORT
these higher tax jurisdictions. Goodwill impairment negativelyaffects our ETR because no tax benefit is recorded on thecharge. In 2013, in addition to the effect of “Special items” and“Certain claims,” our ETR benefited from the retroactivereinstatement of the R&D tax credit and other tax benefitsapplicable to us that applied to the 2012 and 2013 periods. Dueto the timing of the extension and the applicable GAAP rules,we recognized the 2012 benefit in the 2013 period.Additionally, in 2011 our ETR was favorably impacted by theresolution of certain tax contingencies. The items discussedaccounted for the majority of the variation in our ETRs in thepast three years.
As a result of the revenues and expenses discussedpreviously, net earnings in 2013 increased 1 percent comparedto 2012. In 2012, net earnings decreased 1 percent comparedto 2011. Basic and diluted earnings per share increased 4percent and 3 percent, respectively, in 2013 compared to 2012,while 2012 basic and diluted earnings per share increased 7percent and 6 percent, respectively, compared to 2011. Thedisproportionate changes in earnings per share as compared tonet earnings are attributed to the effect of share repurchases.
For our reporting segments, operating profit increasedeach year in the Americas and Asia Pacific while in Europe ithas decreased over those same time periods. The increase inthe Americas is indicative of increasing sales in the geographicregion. In Europe and Asia Pacific, operating profit is impactedby foreign currency exchange rates. In Europe, the decline inoperating profit from 2011 to 2012 was primarily related to a 3percent decline in sales (a 6 percent decline due to changes inforeign currency exchange rates offset by a 3 percent increasefrom the combination of volume/mix and price). In 2013, whilesales did increase by 3 percent (a 2 percent increase fromchanges in foreign currency exchange rates and 1 percentincrease from the combination of volume/mix and price) thehigher sales were largely offset by hedge losses recorded in the2013 period versus hedge gains recorded in the 2012 period.Additionally, operating profit in Europe declined due tocontinuing price pressure in those markets as well as a changein the mix of sales to higher growth markets with loweroperating profit margins. In Asia Pacific, the increase inoperating profit from 2011 to 2012 was driven by higher sales.The increase in operating profit in Asia Pacific from 2012 to2013 was driven by the 8 percent increase in sales fromvolume/mix. While changes in foreign currency exchange ratesdecreased sales by 10 percent in 2013 compared to 2012, thisdecline was largely offset by hedge gains recorded in 2013versus hedge losses recorded in 2012.
Non-GAAP operating performance measures
We use financial measures that differ from financialmeasures determined in accordance with GAAP to evaluateour operating performance. These non-GAAP financialmeasures exclude the impact of inventory step-up, certaininventory and manufacturing related charges connected toquality enhancement and remediation efforts, inventoryobsolescence charges associated with products we intend todiscontinue, “Certain claims,” “Special items,” and any relatedeffects on our income tax provision associated with these items
in addition to certain other tax adjustments. We use thisinformation internally and believe it is helpful to investorsbecause it allows more meaningful period-to-periodcomparisons of our ongoing operating results, it helps toperform trend analysis and to better identify operating trendsthat may otherwise be masked or distorted by these types ofitems, and it provides a higher degree of transparency ofcertain items. Certain of these non-GAAP financial measuresare used as metrics for our incentive compensation programs.
Our non-GAAP adjusted net earnings used for internalmanagement purposes for the years ended December 31, 2013,2012 and 2011 were $988.4 million, $932.5 million, and $905.6million, respectively, and our non-GAAP adjusted dilutedearnings per share were $5.75, $5.30, and $4.80, respectively.
The following are reconciliations from our GAAP netearnings and diluted earnings per share to our non-GAAPadjusted net earnings and non-GAAP adjusted diluted earningsper share used for internal management purposes (in millions,except per share amounts).
Year ended December 31, 2013 2012 2011
Net Earnings of Zimmer Holdings, Inc. $ 761.0 $755.0 $760.8Inventory step-up and other inventory
and manufacturing related charges 70.5 4.8 11.4Certain claims 47.0 15.0 157.8Goodwill impairment – 96.0 –Special items 216.7 155.4 75.2Taxes on above items and other certain
tax adjustments* (106.8) (93.7) (99.6)
Adjusted Net Earnings $ 988.4 $932.5 $905.6
* The tax effect is calculated based upon the statutory rates for thejurisdictions where the items were incurred.
Year ended December 31, 2013 2012 2011
Diluted EPS $ 4.43 $ 4.29 $ 4.03Inventory step-up and other inventory and
manufacturing related charges 0.41 0.03 0.06Certain claims 0.27 0.09 0.84Goodwill impairment – 0.54 –Special items 1.26 0.88 0.40Taxes on above items and other certain tax
adjustments* (0.62) (0.53) (0.53)
Adjusted Diluted EPS $ 5.75 $ 5.30 $ 4.80
* The tax effect is calculated based upon the statutory rates for thejurisdictions where the items were incurred.
LIQUIDITY AND CAPITAL RESOURCES
Cash flows provided by operating activities were$963.1 million in 2013, compared to $1,151.9 million in 2012.The principal source of cash from operating activities in 2013was net earnings. Non-cash charges included in net earningsaccounted for another $288.8 million of operating cash. Allother items of operating cash flows in 2013 were outflows of$84.9 million of cash. The lower cash flows provided byoperating activities in the 2013 period were primarily due toincreases in inventory caused by the medical device excise taxand inventory investments to support new product launches.Additionally, cash flows were unfavorable compared to the
24

ZIMMER HOLDINGS, INC. 2013 FORM 10-K ANNUAL REPORT
prior year due to spending on our quality and operationalexcellence initiatives. These unfavorable items were partiallyoffset by lower product liability payments for Durom Cupclaims, and lower funding required on our U.S. pension plansfor 2013.
At December 31, 2013, we had 65 days of salesoutstanding in trade accounts receivable, which was higher byone day compared to December 31, 2012. At December 31,2013, we had 285 days of inventory on hand, a decrease of 16days compared to December 31, 2012. We consider thechanges in days of sales outstanding and days of inventory onhand as normal fluctuations for our business.
Cash flows used in investing activities were $282.5 millionin 2013, compared to $592.1 million in 2012. Additions toinstruments increased in 2013 due to purchases for significantproduct launches, such as Persona The Personalized KneeSystem. Spending on other property, plant and equipment wasrelatively consistent in 2013 relative to 2012, reflecting cashoutlays necessary to complete new product-relatedinvestments and replace older machinery and equipment. In2014, instrument additions are expected to be in a range of$200 to $210 million as part of our ongoing launch of Persona
The Personalized Knee System. Property, plant and equipmentadditions are expected to be approximately $150 million in2014, reflecting the cash outlays necessary to update andmodernize our manufacturing capabilities and support newproduct developments and commercialization activities. Weinvest some of our cash and cash equivalents in highly-rateddebt securities. The purchases and any sales or maturities ofthese investments are reflected as cash flows from investingactivities. The timing of these investments can vary from yearto year depending on the maturity of the debt securities andother cash and cash equivalent needs. In the past three years,we have made a number of business acquisitions includingKnee Creations, LLC, NORMED Medizin-Technik GmbH,Dornoch Medical Systems, Inc., Synvasive Technology, Inc.,ExtraOrtho, Inc., and certain foreign-based distributors.
Cash flows used in financing activities were $467.3 millionin 2013, compared to $436.5 million in 2012. In 2013, wereturned cash to our stockholders in the form of cashdividends of $132.4 million and share repurchases of$719.0 million. Additionally, an increase in our stock price in2013 resulted in many employees exercising stock options,which provided us with additional cash. In 2012, we convertedsome of the outstanding debt under our senior credit facility toa term loan and we borrowed $100.0 million to repurchaseshares as well as fund other corporate cash needs. In 2013, wepaid off the amount we had borrowed under our senior creditfacility.
In 2013, we declared cash dividends in each quarter of$0.20 per share. We expect to continue paying cash dividendson a quarterly basis; however, future dividends are subject toapproval of the Board of Directors and may be adjusted asbusiness needs or market conditions change. The 2013dividend declarations equate to an annual rate of $0.80per share, which represents an 11 percent increase over the2012 annualized rate.
As discussed more completely in Note 15 to ourconsolidated financial statements, the IRS has issued proposedadjustments for years 2006 through 2009 reallocating profitsbetween certain of our U.S. and foreign subsidiaries. We havedisputed these proposed adjustments and continue to pursueresolution with the IRS. Although the ultimate timing forresolution of the disputed tax issues is uncertain, we anticipatethat within the next twelve months we may settle certain taxmatters with the IRS, and pay amounts for other unresolvedtax matters in order to limit the potential impact of IRSinterest charges. Such payments may be significant to our 2014operating cash flows.
As discussed in Note 19 to the consolidated financialstatements, we are defending a patent infringement lawsuit inwhich the trial court awarded the plaintiff $210.0 million indamages plus interest and attorneys’ fees. We have filed aNotice of Appeal and have not recorded a liability because wedo not believe it is probable that we have incurred a loss.Although we believe we have strong grounds to reverse thetrial court’s judgment, we could be required to pay$210.0 million plus interest and attorneys’ fees in the future.
Also as discussed in Note 19 to the consolidated financialstatements, we have recorded a short-term liability of$50.0 million and long-term liability of $329.0 million related toDurom Cup product liability claims. We expect to continuepaying these claims over the next five years. We have alsorecorded a long-term receivable of $218.0 million that weexpect to receive from insurance carriers once we reach ourself-insured retention under our insurance programs.
We have four tranches of senior notes outstanding:$250 million aggregate principal amount of 1.4 percent notesdue November 30, 2014, $500 million aggregate principalamount of 4.625 percent notes due November 30, 2019, $300million aggregate principal amount of 3.375 percent notes dueNovember 30, 2021 and $500 million aggregate principalamount of 5.75 percent notes due November 30, 2039. Intereston each series is payable on May 30 and November 30 of eachyear until maturity.
We may redeem the senior notes at our election in wholeor in part at any time prior to maturity at a redemption priceequal to the greater of 1) 100 percent of the principal amountof the notes being redeemed; or 2) the sum of the presentvalues of the remaining scheduled payments of principal andinterest (not including any portion of such payments ofinterest accrued as of the date of redemption), discounted tothe date of redemption on a semi-annual basis at the TreasuryRate (as defined in the debt agreement), plus 15 basis pointsin the case of the 2014 notes, 20 basis points in the case of the2019 and 2021 notes, and 25 basis points in the case of the2039 notes. We would also pay the accrued and unpaid intereston the senior notes to the redemption date.
Before our senior notes due November 30, 2014 becomepayable, we intend to issue new senior notes in order to paythe $250 million owed. If we are not able to issue new seniornotes, we intend to borrow against our senior credit facility topay these notes.
25

ZIMMER HOLDINGS, INC. 2013 FORM 10-K ANNUAL REPORT
We have a five year $1,350 million revolving, multi-currency, senior unsecured credit facility maturing May 9,2017 (Senior Credit Facility). There were no borrowingsoutstanding under the Senior Credit Facility at December 31,2013.
We and certain of our wholly owned foreign subsidiariesare the borrowers under the Senior Credit Facility. Borrowingsunder the Senior Credit Facility bear interest at a LIBOR-basedrate plus an applicable margin determined by reference to oursenior unsecured long-term credit rating and the amountsdrawn under the Senior Credit Facility, at an alternate baserate, or at a fixed-rate determined through a competitive bidprocess. The Senior Credit Facility contains customaryaffirmative and negative covenants and events of default for anunsecured financing arrangement, including, among otherthings, limitations on consolidations, mergers and sales ortransfers of assets. Financial covenants include a maximumleverage ratio of 3.0 to 1.0. If we fall below an investment gradecredit rating, additional restrictions would result, includingrestrictions on investments, payment of dividends and stockrepurchases. We were in compliance with all covenants underthe Senior Credit Facility as of December 31, 2013.Commitments under the Senior Credit Facility are subject tocertain fees, including a facility fee and a utilization fee.
We have a term loan agreement (Term Loan) with one ofthe lenders under the Senior Credit Facility for 11.7 billionJapanese Yen that will mature on May 31, 2016. Borrowingsunder the Term Loan bear interest at a fixed rate of 0.61percent per annum until maturity.
We also have available uncommitted credit facilitiestotaling $50.7 million.
We place our cash and cash equivalents in highly-ratedfinancial institutions and limit the amount of credit exposure toany one entity. We invest only in high-quality financialinstruments in accordance with our internal investment policy.
As of December 31, 2013, we had short-term and long-term investments in debt securities with a fair value of $807.7million. These investments are in debt securities of manydifferent issuers and therefore we believe we have nosignificant concentration of risk with a single issuer. All ofthese debt securities remain highly-rated and we believe therisk of default by the issuers is low.
As of December 31, 2013, $891.9 million of our cash andcash equivalents and short-term and long-term investmentswere held in jurisdictions outside of the U.S. and are expectedto be indefinitely reinvested for continued use in foreignoperations. Repatriation of these assets to the U.S. may havetax consequences. $478.8 million of this amount isdenominated in U.S. Dollars and therefore bears no foreigncurrency translation risk. The balance of these assets isdenominated in currencies of the various countries where weoperate.
We may use excess cash to repurchase common stockunder our share repurchase program. Effective January 1,2014, we have a new share repurchase program that authorizespurchases of up to $1.0 billion with no expiration date. Nofurther purchases will be made under the previous sharerepurchase program.
Management believes that cash flows from operations andavailable borrowings under the Senior Credit Facility or fromthe public and private debt markets are sufficient to meet ourworking capital, capital expenditure and debt service needs, aswell as return cash to stockholders in the form of dividendsand share repurchases. Should investment opportunities arise,we believe that our earnings, balance sheet and cash flows willallow us to obtain additional capital, if necessary.
CONTRACTUAL OBLIGATIONS
We have entered into contracts with various third partiesin the normal course of business that will require futurepayments. The following table illustrates our contractualobligations (in millions):
Contractual Obligations Total 2014
2015
and
2016
2017
and
2018
2019
and
Thereafter
Long-term debt $1,664.5 $250.0 $112.4 $ 2.1 $1,300.0
Interest payments 1,045.5 68.1 131.7 126.4 719.3
Operating leases 192.1 47.6 66.9 36.4 41.2
Purchaseobligations 8.0 8.0 – – –
Other long-termliabilities 398.2 – 136.4 103.2 158.6
Total contractualobligations $3,308.3 $373.7 $447.4 $268.1 $2,219.1
$21.4 million of the other long-term liabilities on ourbalance sheet as of December 31, 2013 are liabilities related todefined benefit pension plans. Defined benefit plan liabilitiesare based upon the underfunded status of the respective plans;they are not based upon future contributions. Due touncertainties regarding future plan asset performance,changes in interest rates and our intentions with respect tovoluntary contributions, we are unable to reasonably estimatefuture contributions beyond 2014. Therefore, this table doesnot include any amounts related to future contributions to ourplans. See Note 14 to our consolidated financial statements forfurther information on our defined benefit plans.
Also included in other long-term liabilities on our balancesheet are liabilities related to unrecognized tax benefits andcorresponding interest and penalties thereon. Due to theuncertainties inherent in these liabilities, such as the ultimatetiming and resolution of tax audits, we are unable toreasonably estimate the amount or period in which potentialtax payments related to these positions will be made.Therefore, this table does not include any obligations relatedto unrecognized tax benefits. Additionally, other long-termliabilities on our balance sheet include long-term deferred taxliabilities, primarily related to intangible assets acquired inbusiness combinations and fixed assets. We have excludedthese liabilities from this table as well, as they do not representliabilities that will be settled in cash. See Note 15 to ourconsolidated financial statements for further information onthese tax-related accounts.
26

ZIMMER HOLDINGS, INC. 2013 FORM 10-K ANNUAL REPORT
We have entered into various agreements that may resultin future payments dependent upon various events such as theachievement of certain product R&D milestones, salesmilestones, or, at our discretion, to maintain exclusive rights todistribute a product. Since there is uncertainty on the timingor whether such payments will have to be made, we have notincluded them in this table. These payments could range from$0 to $45 million.
CRITICAL ACCOUNTING ESTIMATES
Our financial results are affected by the selection andapplication of accounting policies and methods. Significantaccounting policies which require management’s judgment arediscussed below.
Excess Inventory and Instruments – We must determineas of each balance sheet date how much, if any, of ourinventory may ultimately prove to be unsaleable or unsaleableat our carrying cost. Similarly, we must also determine ifinstruments on hand will be put to productive use or remainundeployed as a result of excess supply. Accordingly,inventory and instruments are written down to their netrealizable value. To determine the appropriate net realizablevalue, we evaluate current stock levels in relation to historicaland expected patterns of demand for all of our products andinstrument systems and components. The basis for thedetermination is generally the same for all inventory andinstrument items and categories except for work-in-processinventory, which is recorded at cost. Obsolete or discontinueditems are generally destroyed and completely written off.Management evaluates the need for changes to inventory andinstruments net realizable values based on market conditions,competitive offerings and other factors on a regular basis.
Income Taxes – Our income tax expense, deferred taxassets and liabilities and reserves for unrecognized tax benefitsreflect management’s best assessment of estimated futuretaxes to be paid. We are subject to income taxes in the U.S.and numerous foreign jurisdictions. Significant judgments andestimates are required in determining the consolidated incometax expense.
We estimate income tax expense and income tax liabilitiesand assets by taxable jurisdiction. Realization of deferred taxassets in each taxable jurisdiction is dependent on our abilityto generate future taxable income sufficient to realize thebenefits. We evaluate deferred tax assets on an ongoing basisand provide valuation allowances unless we determine it is“more likely than not” that the deferred tax benefit will berealized. Federal income taxes are provided on the portion ofthe income of foreign subsidiaries that is expected to beremitted to the U.S.
The calculation of our tax liabilities involves dealing withuncertainties in the application of complex tax laws andregulations in a multitude of jurisdictions across our globaloperations. We are subject to regulatory review or audit invirtually all of those jurisdictions and those reviews and auditsmay require extended periods of time to resolve. We recordour income tax provisions based on our knowledge of all
relevant facts and circumstances, including existing tax laws,our experience with previous settlement agreements, thestatus of current examinations and our understanding of howthe tax authorities view certain relevant industry andcommercial matters.
We recognize tax liabilities in accordance with theFinancial Accounting Standards Board’s (FASB) guidance onincome taxes and we adjust these liabilities when our judgmentchanges as a result of the evaluation of new information notpreviously available. Due to the complexity of some of theseuncertainties, the ultimate resolution may result in a paymentthat is materially different from our current estimate of the taxliabilities. These differences will be reflected as increases ordecreases to income tax expense in the period in which theyare determined.
Commitments and Contingencies – Accruals for productliability and other claims are established with the assistance ofinternal and external legal counsel based on currentinformation and historical settlement information for claims,related legal fees and for claims incurred but not reported. Weuse an actuarial model to assist management in determining anappropriate level of accruals for product liability claims.Historical patterns of claim loss development over time arestatistically analyzed to arrive at factors which are then appliedto loss estimates in the actuarial model.
In addition to our general product liability, we haverecorded provisions totaling $450.2 million related to theDurom Cup, including $47.0 million in 2013. See Note 19 toour consolidated financial statements for further discussion ofthe Durom Cup.
Goodwill and Intangible Assets – We evaluate thecarrying value of goodwill and indefinite life intangible assetsannually, or whenever events or circumstances indicate thecarrying value may not be recoverable. We evaluate thecarrying value of finite life intangible assets whenever eventsor circumstances indicate the carrying value may not berecoverable. Significant assumptions are required to estimatethe fair value of goodwill and intangible assets, most notablyestimated future cash flows generated by these assets. Assuch, these fair value measurements use significantunobservable inputs. Changes to these assumptions couldrequire us to record impairment charges on these assets.
In the fourth quarter of 2012, we determined our U.S.Spine reporting unit’s carrying value was in excess of itsestimated fair value. Fair value was determined using an equalweighting of income and market approaches. Fair value underthe income approach was determined by discounting topresent value the estimated future cash flows of the reportingunit. Fair value under the market approach utilized theguideline public company methodology, which uses valuationindicators determined from other businesses that are similar toour U.S. Spine reporting unit.
As a result, we recorded a goodwill impairment charge forthe U.S. Spine reporting unit of $96.0 million in 2012. See Note8 to our consolidated financial statements for furtherdiscussion and the factors that contributed to theseimpairment charges and the factors that could lead to furtherimpairment. In 2013, we employed a similar combination of
27

ZIMMER HOLDINGS, INC. 2013 FORM 10-K ANNUAL REPORT
income and market approaches to estimate this reportingunit’s fair value and determined there was no impairmentcharge in 2013.
We have five other reporting units with goodwill assignedto them. We estimated the fair value of those reporting unitsusing the income approach by discounting to present value theestimated future cash flows of the reporting unit, or by doing aqualitative assessment of changes in fair value from the prioryear’s income approach. Since in the past we have incurredgoodwill impairment charges for our U.S. Spine reporting unit,which required us to decrease goodwill to its implied fair value,the estimated fair value of this reporting unit did notsubstantially exceed its carrying value. Additionally, due tochallenging market conditions associated with our U.S. Dentalreporting unit, that reporting unit’s estimated fair value did notsubstantially exceed its carrying value either. These tworeporting units remain sensitive to changes in marketconditions which could result in goodwill being impaired in thefuture. For each of our other four reporting units, theestimated fair value substantially exceeded the carrying value.
Share-based Payment – We measure share-basedpayment expense at the grant date based on the fair value ofthe award and recognize expense over the requisite serviceperiod. Determining the fair value of share-based awards at thegrant date requires judgment, including estimating theexpected life of stock options and the expected volatility of ourstock. Additionally, we must estimate the amount of share-based awards that are expected to be forfeited. We estimateexpected volatility based upon the implied volatility of activelytraded options on our stock. The expected life of stock optionsand estimated forfeitures are based upon our employees’historical exercise and forfeiture behaviors. The assumptionsused in determining the grant date fair value and the expectedforfeitures represent management’s best estimates.
RECENT ACCOUNTING PRONOUNCEMENTS
See Note 2 to our consolidated financial statements to seehow recent accounting pronouncements have affected or mayaffect our financial position, results of operations or cash flows.
ITEM 7A. Quantitative and Qualitative Disclosures
About Market Risk
MARKET RISK
We are exposed to certain market risks as part of ourongoing business operations, including risks from changes inforeign currency exchange rates, interest rates and commodityprices that could affect our financial condition, results ofoperations and cash flows. We manage our exposure to theseand other market risks through regular operating and financingactivities and through the use of derivative financialinstruments. We use derivative financial instruments solely asrisk management tools and not for speculative investmentpurposes.
FOREIGN CURRENCY EXCHANGE RISK
We operate on a global basis and are exposed to the riskthat our financial condition, results of operations and cashflows could be adversely affected by changes in foreigncurrency exchange rates. We are primarily exposed to foreigncurrency exchange rate risk with respect to transactions andnet assets denominated in Euros, Swiss Francs, Japanese Yen,British Pounds, Canadian Dollars, Australian Dollars, KoreanWon, Swedish Krona, Czech Koruna, Thai Baht, TaiwanDollars, South African Rand, Russian Rubles and IndianRupees. We manage the foreign currency exposure centrally,on a combined basis, which allows us to net exposures and totake advantage of any natural offsets. To reduce theuncertainty of foreign currency exchange rate movements ontransactions denominated in foreign currencies, we enter intoderivative financial instruments in the form of foreign currencyexchange forward contracts and options with major financialinstitutions. These forward contracts and options are designedto hedge anticipated foreign currency transactions, primarilyintercompany sale and purchase transactions, for periodsconsistent with commitments. Realized and unrealized gainsand losses on these contracts and options that qualify as cashflow hedges are temporarily recorded in other comprehensiveincome, then recognized in cost of products sold when thehedged item affects net earnings.
For contracts outstanding at December 31, 2013, we hadobligations to purchase U.S. Dollars and sell Euros, JapaneseYen, British Pounds, Canadian Dollars, Australian Dollars,Korean Won, Swedish Krona, Czech Koruna, Thai Baht, TaiwanDollars, South African Rand, Russian Rubles and IndianRupees and purchase Swiss Francs and sell U.S. Dollars at setmaturity dates ranging from January 2014 through June 2016.The notional amounts of outstanding forward contractsentered into with third parties to purchase U.S. Dollars atDecember 31, 2013 were $1,574.6 million. The notionalamounts of outstanding forward contracts entered into withthird parties to purchase Swiss Francs at December 31, 2013were $353.3 million. The weighted average contract ratesoutstanding at December 31, 2013 were Euro:USD 1.32, SwissFranc:USD 1.09, USD:Japanese Yen 88.13, British Pound:USD1.56, USD:Canadian Dollar 1.04, Australian Dollar:USD 0.94,USD:Korean Won 1,154, USD:Swedish Krona 6.78, USD:CzechKoruna 19.41, USD:Thai Baht 32.06, USD:Taiwan Dollar 29.22,USD:South African Rand 10.05, USD:Russian Ruble 34.47 andUSD:Indian Ruppee 62.58.
We maintain written policies and procedures governingour risk management activities. Our policy requires that criticalterms of hedging instruments be the same as hedgedforecasted transactions. On this basis, with respect to cashflow hedges, changes in cash flows attributable to hedgedtransactions are generally expected to be completely offset bychanges in the fair value of hedge instruments. As part of ourrisk management program, we also perform sensitivity analysesto assess potential changes in revenue, operating results, cashflows and financial position relating to hypothetical movementsin currency exchange rates. A sensitivity analysis of changes inthe fair value of foreign currency exchange forward contracts
28

ZIMMER HOLDINGS, INC. 2013 FORM 10-K ANNUAL REPORT
outstanding at December 31, 2013 indicated that, if theU.S. Dollar uniformly changed in value by 10 percent relativeto the various currencies, with no change in the interestdifferentials, the fair value of those contracts would increase ordecrease earnings before income taxes in periods through June2016, depending on the direction of the change, by thefollowing average approximate amounts (in millions):
Currency
Average
Amount
Euro $69.1Swiss Franc 35.9Japanese Yen 33.6British Pound 14.6Canadian Dollar 12.1Australian Dollar 13.5Korean Won 4.1Swedish Krona 3.2Czech Koruna 0.5Thai Baht 1.2Taiwan Dollars 2.4South African Rand 0.8Russian Rubles 2.2Indian Rupees 0.9
Any change in the fair value of foreign currency exchangeforward contracts as a result of a fluctuation in a currencyexchange rate is expected to be largely offset by a change inthe value of the hedged transaction. Consequently, foreigncurrency exchange contracts would not subject us to materialrisk due to exchange rate movements because gains and losseson these contracts offset gains and losses on the assets,liabilities and transactions being hedged.
We have net assets in legal entities with non-U.S. Dollarfunctional currencies of $2,295.6 million at December 31, 2013,primarily in Euros, Japanese Yen and Australian Dollars.$1,354.3 million of the net asset exposure at December 31,2013 relates to goodwill recorded in the Europe and AsiaPacific geographic segments.
We enter into foreign currency forward exchangecontracts with terms of one month to manage currencyexposures for monetary assets and liabilities denominated in acurrency other than an entity’s functional currency. As aresult, foreign currency remeasurement gains/lossesrecognized in earnings are generally offset with gains/losses onthe foreign currency forward exchange contracts in the samereporting period.
COMMODITY PRICE RISK
We purchase raw material commodities such as cobaltchrome, titanium, tantalum, polymer and sterile packaging. Weenter into supply contracts generally with terms of 12 to 24months, where available, on these commodities to alleviate theeffect of market fluctuation in prices. As part of our riskmanagement program, we perform sensitivity analyses relatedto potential commodity price changes. A 10 percent price
change across all these commodities would not have a materialeffect on our consolidated financial position, results ofoperations or cash flows.
INTEREST RATE RISK
In the normal course of business, we are exposed tomarket risk from changes in interest rates that could affect ourresults of operations and financial condition. We manage ourexposure to interest rate risks through our regular operationsand financing activities.
We invest our cash and cash equivalents primarily inhighly-rated corporate commercial paper and bank deposits.We also have short-term and long-term investments in highly-rated corporate debt securities, U.S. government and agencydebt securities, U.S. government treasury funds, municipalbonds, foreign government debt securities, commercial paperand certificates of deposit. The primary investment objective isto ensure capital preservation of our invested principal funds.Currently, we do not use derivative financial instruments inour investment portfolio.
We are exposed to interest rate risk on our debtobligations and our cash and cash equivalents.
We have multiple fixed-to-variable interest rate swapagreements that we have designated as fair value hedges of thefixed interest rate obligations on our Senior Notes due 2019and 2021. The total notional amounts are $250 million and$300 million for the Senior Notes due 2019 and 2021,respectively. On the interest rate swap agreements for theSenior Notes due 2019, we receive a fixed interest rate of 4.625percent and pay variable interest equal to the three-monthLIBOR plus an average of 133 basis points. On the interest rateswap agreements for the Senior Notes due 2021, we receive afixed interest rate of 3.375 percent and pay variable interestequal to the three-month LIBOR plus an average of 99 basispoints.
The interest rate swap agreements are intended tomanage our exposure to interest rate movements byconverting fixed-rate debt into variable-rate debt. Theobjective of the instruments is to more closely align interestexpense with interest income received on cash and cashequivalents.
These derivative instruments are designated as fair valuehedges under GAAP. Changes in the fair value of the derivativeinstrument are recorded in earnings and are offset by gains orlosses on the underlying debt instrument.
Based upon our overall interest rate exposure as ofDecember 31, 2013, a change of 10 percent in interest rates,assuming the principal amount outstanding remains constant,would not have a material effect on net interest expense. Thisanalysis does not consider the effect of the change in the levelof overall economic activity that could exist in such anenvironment.
CREDIT RISK
Financial instruments, which potentially subject us toconcentrations of credit risk, are primarily cash and cash
29

ZIMMER HOLDINGS, INC. 2013 FORM 10-K ANNUAL REPORT
equivalents, short-term and long-term investments, derivativeinstruments, counterparty transactions and accountsreceivable.
We place our investments in highly-rated financialinstitutions or highly-rated debt securities and limit theamount of credit exposure to any one entity. We believe we donot have any significant credit risk on our cash and cashequivalents and investments.
We are exposed to credit loss if the financial institutionsor counterparties issuing the debt security fail to perform.However, this loss is limited to the amounts, if any, by whichthe obligations of the counterparty to the financial instrumentcontract exceed our obligation. We also minimize exposure tocredit risk by dealing with a diversified group of major financialinstitutions. We manage credit risk by monitoring the financialcondition of our counterparties using standard creditguidelines. We do not anticipate any nonperformance by any ofthe counterparties.
Our concentrations of credit risks with respect to tradeaccounts receivable is limited due to the large number ofcustomers and their dispersion across a number of geographicareas and by frequent monitoring of the creditworthiness ofthe customers to whom credit is granted in the normal courseof business. Substantially all of our trade receivables areconcentrated in the public and private hospital and healthcareindustry in the U.S. and internationally or with distributors ordealers who operate in international markets and, accordingly,are exposed to their respective business, economic andcountry specific variables.
Our ability to collect accounts receivable in somecountries depends in part upon the financial stability of these
hospital and healthcare sectors and the respective countries’national economic and healthcare systems. Most notably, inEurope healthcare is typically sponsored by the government.Since we sell products to public hospitals in those countries,we are indirectly exposed to government budget constraints.The ongoing financial uncertainties in the Euro zone impactthe indirect credit exposure we have to those governmentsthrough their public hospitals. As of December 31, 2013, inGreece, Italy, Portugal and Spain, countries that have beenwidely recognized as presenting the highest risk, our grossshort-term and long-term trade accounts receivable combinedwere $226.4 million. With allowances for doubtful accounts of$9.5 million recorded in those countries, the net balance was$216.9 million, representing 24 percent of our totalconsolidated short-term and long-term trade accountsreceivable balance, net. Italy and Spain accounted for $209.7million of that net amount. We are actively monitoring thesituations in these countries. We maintain contact withcustomers in these countries on a regular basis. We continue toreceive payments, albeit at a slower rate than in the past. Webelieve our allowance for doubtful accounts is adequate inthese countries, as ultimately we believe the governments inthese countries will be able to pay. To the extent therespective governments’ ability to fund their public hospitalprograms deteriorates, we may have to record significant baddebt expenses in the future.
While we are exposed to risks from the broader healthcareindustry in Europe and around the world, there is nosignificant net exposure due to any individual customer.Exposure to credit risk is controlled through credit approvals,credit limits and monitoring procedures and we believe thatreserves for losses are adequate.
30

ZIMMER HOLDINGS, INC. 2013 FORM 10-K ANNUAL REPORT
Management’s Report on Internal Control Over Financial Reporting
The management of Zimmer Holdings, Inc. is responsible for establishing and maintaining adequate internal control overfinancial reporting. Internal control over financial reporting is defined in Rules 13a-15(f) or 15d-15(f) promulgated under theSecurities Exchange Act of 1934 as a process designed by, or under the supervision of, the company’s principal executive andprincipal financial officers and effected by the company’s Board of Directors, management and other personnel, to providereasonable assurance regarding the reliability of financial reporting and the preparation of financial statements for externalpurposes in accordance with U.S. generally accepted accounting principles and includes those policies and procedures that:
• Pertain to the maintenance of records that in reasonable detail accurately and fairly reflect the transactions and dispositionsof the assets of the company;
• Provide reasonable assurance that transactions are recorded as necessary to permit preparation of financial statements inaccordance with U.S. generally accepted accounting principles, and that receipts and expenditures of the company are beingmade only in accordance with authorizations of management and directors of the company; and
• Provide reasonable assurance regarding prevention or timely detection of unauthorized acquisition, use or disposition of thecompany’s assets that could have a material effect on the financial statements.
Because of its inherent limitations, the company’s internal control over financial reporting may not prevent or detectmisstatements. Also, projections of any evaluation of effectiveness to future periods are subject to the risk that controls maybecome inadequate because of changes in conditions, or that the degree of compliance with the policies or procedures maydeteriorate.
The company’s management assessed the effectiveness of the company’s internal control over financial reporting as ofDecember 31, 2013. In making this assessment, the company’s management used the criteria set forth by the Committee ofSponsoring Organizations of the Treadway Commission (COSO) in Internal Control-Integrated Framework (1992).
Based on that assessment, management has concluded that, as of December 31, 2013, the company’s internal control overfinancial reporting is effective based on those criteria.
The company’s independent registered public accounting firm has audited the effectiveness of the company’s internal controlover financial reporting as of December 31, 2013, as stated in its report which appears in Item 8 of this Annual Report onForm 10-K.
31

ZIMMER HOLDINGS, INC. 2013 FORM 10-K ANNUAL REPORT
ITEM 8. Financial Statements and Supplementary Data
Zimmer Holdings, Inc.Index to Consolidated Financial Statements
Financial Statements: Page
Report of Independent Registered Public Accounting Firm 33
Consolidated Statements of Earnings for the Years Ended December 31, 2013, 2012 and 2011 34
Consolidated Statements of Comprehensive Income for the Years Ended December 31, 2013, 2012 and 2011 35
Consolidated Balance Sheets as of December 31, 2013 and 2012 36
Consolidated Statements of Stockholders’ Equity for the Years Ended December 31, 2013, 2012 and 2011 37
Consolidated Statements of Cash Flows for the Years Ended December 31, 2013, 2012 and 2011 38
Notes to Consolidated Financial Statements 39
32

ZIMMER HOLDINGS, INC. 2013 FORM 10-K ANNUAL REPORT
Report of Independent Registered Public Accounting Firm
To the Stockholders and Board of Directors of Zimmer Holdings, Inc.:
In our opinion, the consolidated financial statements listed in the index appearing under Item 15(a)(1) present fairly, in allmaterial respects, the financial position of Zimmer Holdings, Inc. and its subsidiaries at December 31, 2013 and 2012, and theresults of their operations and their cash flows for each of the three years in the period ended December 31, 2013 in conformitywith accounting principles generally accepted in the United States of America. In addition, in our opinion, the financial statementschedule listed in the accompanying index appearing under Item 15(a)(2) presents fairly, in all material respects, the informationset forth therein when read in conjunction with the related consolidated financial statements. Also in our opinion, the Companymaintained, in all material respects, effective internal control over financial reporting as of December 31, 2013, based on criteriaestablished in Internal Control - Integrated Framework 1992 issued by the Committee of Sponsoring Organizations of theTreadway Commission (COSO). The Company’s management is responsible for these financial statements and financial statementschedule, for maintaining effective internal control over financial reporting and for its assessment of the effectiveness of internalcontrol over financial reporting, included in Management’s Report on Internal Control over Financial Reporting appearingunder Part II, Item 7A. Our responsibility is to express opinions on these financial statements, on the financial statement schedule,and on the Company’s internal control over financial reporting based on our integrated audits. We conducted our audits inaccordance with the standards of the Public Company Accounting Oversight Board (United States). Those standards require thatwe plan and perform the audits to obtain reasonable assurance about whether the financial statements are free of materialmisstatement and whether effective internal control over financial reporting was maintained in all material respects. Our audits ofthe financial statements included examining, on a test basis, evidence supporting the amounts and disclosures in the financialstatements, assessing the accounting principles used and significant estimates made by management, and evaluating the overallfinancial statement presentation. Our audit of internal control over financial reporting included obtaining an understanding ofinternal control over financial reporting, assessing the risk that a material weakness exists, and testing and evaluating the designand operating effectiveness of internal control based on the assessed risk. Our audits also included performing such otherprocedures as we considered necessary in the circumstances. We believe that our audits provide a reasonable basis for ouropinions.
A company’s internal control over financial reporting is a process designed to provide reasonable assurance regarding thereliability of financial reporting and the preparation of financial statements for external purposes in accordance with generallyaccepted accounting principles. A company’s internal control over financial reporting includes those policies and procedures that(i) pertain to the maintenance of records that, in reasonable detail, accurately and fairly reflect the transactions and dispositions ofthe assets of the company; (ii) provide reasonable assurance that transactions are recorded as necessary to permit preparation offinancial statements in accordance with generally accepted accounting principles, and that receipts and expenditures of thecompany are being made only in accordance with authorizations of management and directors of the company; and (iii) providereasonable assurance regarding prevention or timely detection of unauthorized acquisition, use, or disposition of the company’sassets that could have a material effect on the financial statements.
Because of its inherent limitations, internal control over financial reporting may not prevent or detect misstatements. Also,projections of any evaluation of effectiveness to future periods are subject to the risk that controls may become inadequate becauseof changes in conditions, or that the degree of compliance with the policies or procedures may deteriorate.
PricewaterhouseCoopers LLPChicago, IllinoisFebruary 28, 2014
33

ZIMMER HOLDINGS, INC. 2013 FORM 10-K ANNUAL REPORT
Consolidated Statements of Earnings
(in millions, except per share amounts)
For the Years Ended December 31, 2013 2012 2011
Net Sales $4,623.4 $4,471.7 $4,451.8Cost of products sold 1,286.1 1,125.2 1,122.0
Gross Profit 3,337.3 3,346.5 3,329.8
Research and development 204.2 225.6 238.4Selling, general and administrative 1,833.8 1,807.1 1,834.3Certain claims (Note 19) 47.0 15.0 157.8Goodwill impairment (Note 8) – 96.0 –Special items (Note 2) 216.7 155.4 75.2
Operating expenses 2,301.7 2,299.1 2,305.7
Operating Profit 1,035.6 1,047.4 1,024.1Interest income 15.6 15.6 10.1Interest expense (70.1) (72.9) (55.3)
Earnings before income taxes 981.1 990.1 978.9Provision for income taxes 221.9 237.2 218.9
Net earnings 759.2 752.9 760.0Less: Net loss attributable to noncontrolling interest (1.8) (2.1) (0.8)
Net Earnings of Zimmer Holdings, Inc. $ 761.0 $ 755.0 $ 760.8
Earnings Per Common Share – Basic $ 4.49 $ 4.32 $ 4.05Earnings Per Common Share – Diluted $ 4.43 $ 4.29 $ 4.03Weighted Average Common Shares Outstanding
Basic 169.6 174.9 187.6
Diluted 171.8 176.0 188.7Cash Dividends Declared Per Common Share $ 0.80 $ 0.54 $ 0.18
The accompanying notes are an integral part of these consolidated financial statements.
34

ZIMMER HOLDINGS, INC. 2013 FORM 10-K ANNUAL REPORT
Consolidated Statements of Comprehensive Income
(in millions)
For the Years Ended December 31, 2013 2012 2011
Net Earnings $759.2 $752.9 $760.0
Other Comprehensive Income (Loss):
Foreign currency cumulative translation adjustments (44.4) 46.1 4.6
Unrealized cash flow hedge gains/(losses), net of tax 33.4 10.9 (30.6)
Reclassification adjustments on cash flow hedges, net of tax (4.4) 3.3 24.5
Unrealized gains/(losses) on securities, net of tax 0.1 0.4 0.2
Adjustments to prior service cost and unrecognized actuarial assumptions, net of tax 38.5 11.8 (48.3)
Total Other Comprehensive Income (Loss) 23.2 72.5 (49.6)
Comprehensive Income 782.4 825.4 710.4
Comprehensive Loss Attributable to Noncontrolling Interest (2.0) (2.2) (0.9)
Comprehensive Income Attributable to Zimmer Holdings, Inc. $784.4 $827.6 $711.3
The accompanying notes are an integral part of these consolidated financial statements.
35
ZIMMER HOLDINGS, INC. 2013 FORM 10-K ANNUAL REPORT
Consolidated Balance Sheets
(in millions)
As of December 31, 2013 2012
ASSETS
Current Assets:Cash and cash equivalents $ 1,080.6 $ 884.3Short-term investments 727.0 671.6Accounts receivable, less allowance for doubtful accounts 936.6 884.6Inventories 1,074.5 995.3Prepaid expenses and other current assets 107.1 76.3Deferred income taxes 271.9 196.6
Total Current Assets 4,197.7 3,708.7Property, plant and equipment, net 1,224.7 1,210.7Goodwill 2,611.2 2,571.8Intangible assets, net 707.7 740.7Other assets 839.3 780.5
Total Assets $ 9,580.6 $ 9,012.4
LIABILITIES AND STOCKHOLDERS’ EQUITYCurrent Liabilities:
Accounts payable $ 146.3 $ 184.1Income taxes 221.2 22.8Short-term debt 0.5 100.1Other current liabilities 663.6 559.0
Total Current Liabilities 1,031.6 866.0
Other long-term liabilities 576.6 559.3
Long-term debt 1,672.3 1,720.8
Total Liabilities 3,280.5 3,146.1
Commitments and Contingencies (Note 19)Stockholders’ Equity:
Common stock, $0.01 par value, one billion shares authorized,264.3 million (257.1 million in 2012) issued 2.6 2.6
Paid-in capital 4,000.6 3,500.6Retained earnings 7,712.7 7,085.9Accumulated other comprehensive income 367.1 343.9Treasury stock, 94.5 million shares (85.5 million shares in 2012) (5,785.7) (5,072.1)
Total Zimmer Holdings, Inc. stockholders’ equity 6,297.3 5,860.9Noncontrolling interest 2.8 5.4
Total Stockholders’ Equity 6,300.1 5,866.3
Total Liabilities and Stockholders’ Equity $ 9,580.6 $ 9,012.4
The accompanying notes are an integral part of these consolidated financial statements.
36

ZIMMER HOLDINGS, INC. 2013 FORM 10-K ANNUAL REPORT
Consolidated Statements of Stockholders’ Equity
(in millions)
Zimmer Holdings, Inc. Stockholders
AccumulatedOther Total
Common Shares Paid-in Retained Comprehensive Treasury Shares Noncontrolling Stockholders’
Number Amount Capital Earnings Income Number Amount Interest Equity
Balance January 1, 2011 254.6 $2.5 $3,293.5 $5,699.4 $321.0 (59.0) $(3,545.1) $ – $ 5,771.3Net earnings – – – 760.8 – – – (0.8) 760.0Other comprehensive loss – – – – (49.6) – – (0.1) (49.7)Business combination with a
noncontrolling interest – – – – – – – 8.5 8.5Cash dividends declared – – – (32.1) – – – – (32.1)Stock compensation plans,
including tax benefits 1.3 – 105.7 (1.3) – – 2.4 – 106.8Share repurchases – – – – – (18.9) (1,050.0) – (1,050.0)
Balance December 31, 2011 255.9 2.5 3,399.2 6,426.8 271.4 (77.9) (4,592.7) 7.6 5,514.8Net earnings – – – 755.0 – – – (2.1) 752.9Other comprehensive income – – – – 72.5 – – (0.1) 72.4Cash dividends declared – – – (93.3) – – – – (93.3)Stock compensation plans,
including tax benefits 1.2 0.1 101.4 (2.6) – 0.1 6.2 – 105.1Share repurchases – – – – – (7.7) (485.6) – (485.6)
Balance December 31, 2012 257.1 2.6 3,500.6 7,085.9 343.9 (85.5) (5,072.1) 5.4 5,866.3Net earnings – – – 761.0 – – – (1.8) 759.2Other comprehensive income – – – – 23.2 – – (0.2) 23.0Purchase of additional shares
from noncontrolling interest – – (1.1) – – – – (0.6) (1.7)Cash dividends declared – – – (135.4) – – – – (135.4)Stock compensation plans,
including tax benefits 7.2 – 501.1 1.2 – 0.1 5.4 – 507.7Share repurchases – – – – – (9.1) (719.0) – (719.0)
Balance December 31, 2013 264.3 $2.6 $4,000.6 $7,712.7 $367.1 (94.5) $(5,785.7) $ 2.8 $ 6,300.1
The accompanying notes are an integral part of these consolidated financial statements.
37

ZIMMER HOLDINGS, INC. 2013 FORM 10-K ANNUAL REPORT
Consolidated Statements of Cash Flows
(in millions)
For the Years Ended December 31, 2013 2012 2011
Cash flows provided by (used in) operating activities:
Net earnings $ 759.2 $ 752.9 $ 760.0
Adjustments to reconcile net earnings to net cash provided by operating activities:
Depreciation and amortization 358.5 363.1 359.9
Goodwill impairment – 96.0 –
Share-based compensation 48.5 55.0 60.5
Income tax benefit from stock option exercises 38.4 11.0 12.9
Excess income tax benefit from stock option exercises (8.6) (2.7) (5.0)
Inventory step-up 8.0 4.8 11.4
Deferred income tax provision (126.2) (64.8) (19.7)
Changes in operating assets and liabilities, net of acquired assets and liabilitiesIncome taxes payable 96.8 59.2 14.6Receivables (74.3) (45.5) (63.2)Inventories (128.4) (67.5) 7.2Accounts payable and accrued liabilities 38.3 47.8 20.0Other assets and liabilities (47.1) (57.4) 18.3
Net cash provided by operating activities 963.1 1,151.9 1,176.9
Cash flows provided by (used in) investing activities:
Additions to instruments (192.9) (148.9) (155.4)
Additions to other property, plant and equipment (100.0) (114.7) (113.8)
Purchases of investments (732.7) (1,130.1) (662.1)
Sales of investments 830.8 878.5 394.8
Business combination investments (74.2) (59.0) (56.8)
Investments in other assets (13.5) (17.9) (31.1)
Net cash used in investing activities (282.5) (592.1) (624.4)
Cash flows provided by (used in) financing activities:
Proceeds from issuance of notes – – 549.3
Net proceeds (payments) under revolving credit facilities (97.5) (50.1) 0.5
Proceeds from term loans – 147.3 –
Dividends paid to stockholders (132.4) (94.4) –
Debt issuance costs – (3.3) (4.0)
Proceeds from employee stock compensation plans 474.8 46.9 43.4
Excess income tax benefit from stock option exercises 8.6 2.7 5.0
Purchase of additional shares from noncontrolling interest (1.8) – –
Repurchase of common stock (719.0) (485.6) (1,050.0)
Net cash used in financing activities (467.3) (436.5) (455.8)
Effect of exchange rates on cash and cash equivalents (17.0) (7.3) 2.7
Increase in cash and cash equivalents 196.3 116.0 99.4Cash and cash equivalents, beginning of year 884.3 768.3 668.9
Cash and cash equivalents, end of year $1,080.6 $ 884.3 $ 768.3
The accompanying notes are an integral part of these consolidated financial statements.
38

ZIMMER HOLDINGS, INC. 2013 FORM 10-K ANNUAL REPORT
Notes to Consolidated Financial Statements
1. BUSINESS
We design, develop, manufacture and market orthopaedicreconstructive, spinal and trauma devices, biologics, dentalimplants and related surgical products. We also provide otherhealthcare related services. Orthopaedic reconstructivedevices restore function lost due to disease or trauma in jointssuch as knees, hips, shoulders and elbows. Dentalreconstructive implants restore function and aesthetics inpatients who have lost teeth due to trauma or disease. Spinaldevices are utilized by orthopaedic surgeons andneurosurgeons in the treatment of degenerative diseases,deformities and trauma in all regions of the spine. Traumaproducts are devices used primarily to reattach or stabilizedamaged bone and tissue to support the body’s natural healingprocess. Our related surgical products include surgicalsupplies and instruments designed to aid in orthopaedicsurgical procedures and post-operation rehabilitation. We haveoperations in more than 25 countries and market our productsin more than 100 countries. We operate in a single industry buthave three reportable geographic segments, the Americas,Europe and Asia Pacific.
The words “we,” “us,” “our” and similar words refer toZimmer Holdings, Inc. and its subsidiaries. Zimmer Holdingsrefers to the parent company only.
2. SIGNIFICANT ACCOUNTING POLICIES
Basis of Presentation – The consolidated financialstatements include the accounts of Zimmer Holdings and itssubsidiaries in which it holds a controlling financial interest.All significant intercompany accounts and transactions areeliminated. The consolidated financial statements for some ofour international subsidiaries are for an annual period thatended on December 25, 2013, 2012 and 2011. Certain amountsin the 2012 and 2011 consolidated financial statements havebeen reclassified to conform to the 2013 presentation.
Use of Estimates – The consolidated financialstatements are prepared in conformity with accountingprinciples generally accepted in the U.S. which require us tomake estimates and assumptions that affect the reportedamounts of assets and liabilities and disclosure of contingentassets and liabilities at the date of the financial statements andthe reported amounts of revenues and expenses during thereporting period. Actual results could differ from thoseestimates.
Foreign Currency Translation – The financialstatements of our foreign subsidiaries are translated into U.S.dollars using period-end exchange rates for assets andliabilities and average exchange rates for operating results.Unrealized translation gains and losses are included inaccumulated other comprehensive income in stockholders’equity. When a transaction is denominated in a currency otherthan the subsidiary’s functional currency, we recognize atransaction gain or loss when the transaction is settled.
Foreign currency transaction gains and losses included in netearnings for the years ended December 31, 2013, 2012 and2011 were not significant.
Revenue Recognition – We sell product through threeprincipal channels: 1) direct to healthcare institutions, referredto as direct channel accounts; 2) through stocking distributorsand healthcare dealers; and 3) directly to dental practices anddental laboratories. The direct channel accounts representedapproximately 80 percent of our net sales in 2013. Throughthis channel, inventory is generally consigned to sales agentsor customers so that products are available when needed forsurgical procedures. No revenue is recognized upon theplacement of inventory into consignment as we retain title andmaintain the inventory on our balance sheet. Uponimplantation, we issue an invoice and revenue is recognized.Pricing for products is generally predetermined by contractswith customers, agents acting on behalf of customer groups orby government regulatory bodies, depending on the market.Price discounts under group purchasing contracts aregenerally linked to volume of implant purchases by customerhealthcare institutions within a specified group. At negotiatedthresholds within a contract buying period, price discountsmay increase.
Sales to stocking distributors, healthcare dealers, dentalpractices and dental laboratories accounted for approximately20 percent of our net sales in 2013. With these types of sales,revenue is recognized when title to product passes, eitherupon shipment of the product or in some cases uponimplantation of the product. Product is generally sold atcontractually fixed prices for specified periods. Payment termsvary by customer, but are typically less than 90 days.
If sales incentives are earned by a customer forpurchasing a specified amount of our product, we estimatewhether such incentives will be achieved and, if so, recognizethese incentives as a reduction in revenue in the same periodthe underlying revenue transaction is recognized. Occasionallyproducts are returned and, accordingly, we maintain anestimated sales return reserve that is recorded as a reductionin revenue. Product returns were not significant for the yearsended December 31, 2013, 2012 and 2011.
Taxes collected from customers and remitted togovernmental authorities are presented on a net basis andexcluded from revenues.
Shipping and Handling – Amounts billed to customersfor shipping and handling of products are reflected in net salesand are not significant. Expenses incurred related to shippingand handling of products are reflected in selling, general andadministrative and were $163.6 million, $139.5 million and$142.1 million for the years ended December 31, 2013, 2012and 2011, respectively.
Research and Development – We expense all researchand development costs as incurred. Research and developmentcosts include salaries, prototypes, depreciation of equipmentused in research and development, consultant fees and service
39

ZIMMER HOLDINGS, INC. 2013 FORM 10-K ANNUAL REPORT
Notes to Consolidated Financial Statements (Continued)
fees paid to collaborative partners. Where contingentmilestone payments are due to third parties under researchand development arrangements, the milestone paymentobligations are expensed when the milestone results areachieved.
Litigation – We record a liability for contingent losses,including future legal costs, settlements and judgments, whenwe consider it is probable that a liability has been incurred andthe amount of the loss can be reasonably estimated.
Special Items – We recognize expenses resulting directlyfrom our business combinations, employee terminationbenefits, certain R&D agreements, certain contractterminations, consulting and professional fees and assetimpairment or loss on disposal charges connected with globalrestructuring, operational and quality excellence initiatives,and other items as “Special items” in our consolidatedstatement of earnings. “Special items” included (in millions):
For the Years Ended December 31, 2013 2012 2011
Impairment/loss on disposal of assets $ 10.9 $ 14.6 $ 8.4Consulting and professional fees 99.1 90.1 26.0Employee severance and retention, including
share-based compensation acceleration 14.2 8.2 23.1Dedicated project personnel 34.0 15.1 3.2Certain R&D agreements 0.8 – –Relocated facilities 3.6 1.8 –Distributor acquisitions 0.4 0.8 2.0Certain litigation matters 26.9 13.7 0.1Contract terminations 3.9 6.6 6.3Contingent consideration adjustments 9.0 (2.8) –Accelerated software amortization 6.0 4.5 –Other 7.9 2.8 6.1
Special items $216.7 $155.4 $75.2
Impairment/ loss on disposal of assets relates toimpairment of intangible assets that were acquired in businesscombinations or impairment of or a loss on the disposal ofother assets.
Consulting and professional fees relate to third-partyconsulting, professional fees and contract labor related to ourquality and operational excellence initiatives, third-partyconsulting fees related to certain information systemimplementations, third-party integration consulting performedin a variety of areas such as tax, compliance, logistics andhuman resources for our business combinations, third-partyfees related to severance and termination benefits matters andlegal fees related to certain product liability matters. Ourquality and operational excellence initiatives are company-wide and include improvements in quality, distribution,sourcing, manufacturing and information technology, amongother areas.
In 2013, 2012 and 2011, we eliminated positions as wereduced management layers, restructured certain areas,announced closures of certain facilities, and commencedinitiatives to focus on business opportunities that best supportour strategic priorities. In 2013, 2012 and 2011, approximately170, 400 and 500 positions, respectively, from across the globewere affected by these actions. As a result of these changes inour work force and headcount reductions in connection with
acquisitions, we incurred expenses related to severancebenefits, redundant salaries as we worked through transitionperiods, share-based compensation acceleration and otheremployee termination-related costs. The majority of thesetermination benefits were provided in accordance with ourexisting or local government policies and are consideredongoing benefits. These costs were accrued when they becameprobable and estimable and were recorded as part of othercurrent liabilities. The majority of these costs were paid duringthe year they were incurred.
Dedicated project personnel expenses include the salary,benefits, travel expenses and other costs directly associatedwith employees who are 100 percent dedicated to ouroperational and quality excellence initiatives or integration ofacquired businesses.
Certain R&D agreements relate to agreements with upfrontpayments to obtain intellectual property to be used in R&Dprojects that have no alternative future use in other projects.
Relocated facilities expenses are the moving costs and thelease expenses incurred during the relocation period inconnection with relocating certain facilities.
Over the past few years we have acquired a number ofU.S. and foreign-based distributors. We have incurred variouscosts related to the consummation and integration of thosebusinesses.
Certain litigation matters relate to costs and adjustmentsrecognized during the year for the estimated or actualsettlement of various legal matters, including royalty disputes,patent litigation matters, commercial litigation matters andmatters arising from our acquisitions of certain competitivedistributorships in prior years.
Contract termination costs relate to terminatedagreements in connection with the integration of acquiredcompanies and changes to our distribution model as part ofbusiness restructuring and operational excellence initiatives.The terminated contracts primarily relate to sales agents anddistribution agreements.
Contingent consideration adjustments represent thechanges in the fair value of contingent considerationobligations to be paid to the prior owners of acquiredbusinesses.
Accelerated software amortization is the incrementalamortization resulting from a reduction in the estimated life ofcertain software. In 2012, we approved a plan to replacecertain software. As a result, the estimated economic usefullife of the existing software was decreased to represent theperiod of time expected to implement replacement software.As a result, the amortization from the shortened life of thissoftware is substantially higher than the previous amortizationbeing recognized.
Cash and Cash Equivalents – We consider all highlyliquid investments with an original maturity of three months orless to be cash equivalents. The carrying amounts reported inthe balance sheet for cash and cash equivalents are valued atcost, which approximates their fair value.
40

ZIMMER HOLDINGS, INC. 2013 FORM 10-K ANNUAL REPORT
Notes to Consolidated Financial Statements (Continued)
Investments – We invest our excess cash and cashequivalents in debt securities. Our investments includecorporate debt securities, U.S. government and agency debtsecurities, foreign government debt securities, commercialpaper and certificates of deposit, and are classified andaccounted for as available-for-sale. Available-for-sale debtsecurities are recorded at fair value on our consolidatedbalance sheet. Investments with a contractual maturity of lessthan one year are classified as short-term investments on ourconsolidated balance sheet, or in other non-current assets ifthe contractual maturity is greater than one year. Changes infair value for available-for-sale securities are recorded, net oftaxes, as a component of accumulated other comprehensiveloss on our consolidated balance sheet. We review ourinvestments for other-than-temporary impairment at eachreporting period. If an unrealized loss for any investment isconsidered to be other-than-temporary, the loss will berecognized in the consolidated statement of earnings in theperiod the determination is made. See Note 7 for moreinformation regarding our investments.
Accounts Receivable – Accounts receivable consists oftrade and other miscellaneous receivables. We grant credit tocustomers in the normal course of business and maintain anallowance for doubtful accounts for potential credit losses. Wedetermine the allowance for doubtful accounts by geographicmarket and take into consideration historical creditexperience, creditworthiness of the customer and otherpertinent information. We make concerted efforts to collect allaccounts receivable, but sometimes we have to write-off theaccount against the allowance when we determine the accountis uncollectible. The allowance for doubtful accounts was $22.7million and $22.8 million as of December 31, 2013 and 2012,respectively.
Inventories – Inventories are stated at the lower of cost ormarket, with cost determined on a first-in first-out basis.
Property, Plant and Equipment – Property, plant andequipment is carried at cost less accumulated depreciation.Depreciation is computed using the straight-line method basedon estimated useful lives of ten to forty years for buildings andimprovements and three to eight years for machinery andequipment. Maintenance and repairs are expensed as incurred.We review property, plant and equipment for impairmentwhenever events or changes in circumstances indicate that thecarrying value of an asset may not be recoverable. Animpairment loss would be recognized when estimated futureundiscounted cash flows relating to the asset are less than itscarrying amount. An impairment loss is measured as the amountby which the carrying amount of an asset exceeds its fair value.
Software Costs – We capitalize certain computer softwareand software development costs incurred in connection withdeveloping or obtaining computer software for internal usewhen both the preliminary project stage is completed and it isprobable that the software will be used as intended.Capitalized software costs generally include external directcosts of materials and services utilized in developing or
obtaining computer software and compensation and relatedbenefits for employees who are directly associated with thesoftware project. Capitalized software costs are included inproperty, plant and equipment on our balance sheet andamortized on a straight-line or weighted average estimateduser basis when the software is ready for its intended use overthe estimated useful lives of the software, which approximatethree to fifteen years.
Instruments – Instruments are hand-held devices used bysurgeons during total joint replacement and other surgicalprocedures. Instruments are recognized as long-lived assetsand are included in property, plant and equipment.Undeployed instruments are carried at cost or realizable value.Instruments in the field are carried at cost less accumulateddepreciation. Depreciation is computed using the straight-linemethod based on average estimated useful lives, determinedprincipally in reference to associated product life cycles,primarily five years. We review instruments for impairmentwhenever events or changes in circumstances indicate that thecarrying value of an instrument may not be recoverable.Depreciation of instruments is recognized as selling, generaland administrative expense.
Goodwill – Goodwill is not amortized but is subject toannual impairment tests. Goodwill has been assigned toreporting units. We perform annual impairment tests by eithercomparing a reporting unit’s estimated fair value to its carryingamount or doing a qualitative assessment of a reporting unit’sfair value from the last quantitative assessment to determine ifthere is potential impairment. We may do a qualitativeassessment when the results of the previous quantitative testindicated the reporting unit’s estimated fair value wassignificantly in excess of the carrying value of its net assetsand we do not believe there have been significant changes inthe reporting unit’s operations that would significantlydecrease its estimated fair value or significantly increase itsnet assets. If a quantitative assessment is performed, the fairvalue of the reporting unit and the implied fair value ofgoodwill are determined based upon a discounted cash flowanalysis and/or use of a market approach by looking at marketvalues of comparable companies. Significant assumptions areincorporated into our discounted cash flow analyses such asestimated growth rates and risk-adjusted discount rates. Weperform this test in the fourth quarter of the year or wheneverevents or changes in circumstances indicate that the carryingvalue of the reporting unit’s assets may not be recoverable. Ifthe fair value of the reporting unit is less than its carryingvalue, an impairment loss is recorded to the extent that theimplied fair value of the reporting unit goodwill is less than thecarrying value of the reporting unit goodwill. During the yearended December 31, 2012, we recorded a goodwill impairmentcharge of $96.0 million related to our U.S. Spine reporting unit.We did not record a goodwill impairment charge during theyear ended December 31, 2013. See Notes 8 and 9 for moreinformation regarding goodwill and goodwill impairment.
41
ZIMMER HOLDINGS, INC. 2013 FORM 10-K ANNUAL REPORT
Notes to Consolidated Financial Statements (Continued)
Intangible Assets – Intangible assets are initiallymeasured at their fair value. We have determined the fair valueof our intangible assets either by the fair value of theconsideration exchanged for the intangible asset or theestimated after-tax discounted cash flows expected to begenerated from the intangible asset. Intangible assets with anindefinite life, including certain trademarks and trade names,are not amortized. Indefinite life intangible assets are assessedannually to determine whether events and circumstancescontinue to support an indefinite life. Intangible assets with afinite life, including core and developed technology, certaintrademarks and trade names, customer-related intangibles,intellectual property rights and patents and licenses areamortized on a straight-line basis over their estimated usefullife, ranging from less than one year to 40 years. Intangibleassets with a finite life are tested for impairment wheneverevents or circumstances indicate that the carrying amount maynot be recoverable.
Intangible assets with an indefinite life are tested forimpairment annually or whenever events or circumstancesindicate that the carrying amount may not be recoverable. Animpairment loss is recognized if the carrying amount exceedsthe estimated fair value of the asset. The amount of theimpairment loss to be recorded would be determined basedupon the excess of the asset’s carrying value over its fair value.The fair values of indefinite lived intangible assets aredetermined based upon a discounted cash flow analysis usingthe relief from royalty method or a qualitative assessment maybe performed for any changes to the asset’s fair value from thelast quantitative assessment. The relief from royalty methodestimates the cost savings associated with owning, rather thanlicensing, assets. Significant assumptions are incorporated intothese discounted cash flow analyses such as estimated growthrates, royalty rates and risk-adjusted discount rates. We maydo a qualitative assessment when the results of the previousquantitative test indicated that the asset’s fair value wassignificantly in excess of its carrying value.
In determining the useful lives of intangible assets, weconsider the expected use of the assets and the effects ofobsolescence, demand, competition, anticipated technologicaladvances, changes in surgical techniques, market influencesand other economic factors. For technology-based intangibleassets, we consider the expected life cycles of products, absentunforeseen technological advances, which incorporate thecorresponding technology. Trademarks and trade names thatdo not have a wasting characteristic (i.e., there are no legal,regulatory, contractual, competitive, economic or other factorswhich limit the useful life) are assigned an indefinite life.Trademarks and trade names that are related to productsexpected to be phased out are assigned lives consistent withthe period in which the products bearing each brand areexpected to be sold. For customer relationship intangibleassets, we assign useful lives based upon historical levels ofcustomer attrition. Intellectual property rights are assigneduseful lives that approximate the contractual life of any related
patent or the period for which we maintain exclusivity over theintellectual property.
Income Taxes – We account for income taxes under theasset and liability method, which requires the recognition ofdeferred tax assets and liabilities for the expected future taxconsequences of events that have been included in thefinancial statements. Under this method, deferred tax assetsand liabilities are determined based on the differencesbetween the financial statements and tax basis of assets andliabilities using enacted tax rates in effect for the year in whichthe differences are expected to reverse. The effect of a changein tax rates on deferred tax assets and liabilities is recognizedin income in the period that includes the enactment date.
We reduce our deferred tax assets by a valuationallowance if it is more likely than not that we will not realizesome portion or all of the deferred tax assets. In making suchdetermination, we consider all available positive and negativeevidence, including future reversals of existing taxabletemporary differences, projected future taxable income, taxplanning strategies and recent financial operations. In theevent we were to determine that we would be able to realizeour deferred income tax assets in the future in excess of theirnet recorded amount, we would make an adjustment to thevaluation allowance which would reduce the provision forincome taxes. Federal income taxes are provided on theportion of the income of foreign subsidiaries that is expectedto be remitted to the U.S.
We operate on a global basis and are subject to numerousand complex tax laws and regulations. Our income tax filingsare regularly under audit in multiple federal, state and foreignjurisdictions. Income tax audits may require an extendedperiod of time to reach resolution and may result in significantincome tax adjustments when interpretation of tax laws orallocation of company profits is disputed. Because income taxadjustments in certain jurisdictions can be significant, werecord accruals representing management’s best estimate ofthe probable resolution of these matters. To the extentadditional information becomes available, such accruals areadjusted to reflect the revised estimated probable outcome.
Derivative Financial Instruments – We measure allderivative instruments at fair value and report them on ourconsolidated balance sheet as assets or liabilities. We maintainwritten policies and procedures that permit, under appropriatecircumstances and subject to proper authorization, the use ofderivative financial instruments solely for hedging purposes. Theuse of derivative financial instruments for trading or speculativepurposes is prohibited by our policy. See Note 13 for moreinformation regarding our derivative and hedging activities.
Other Comprehensive Income – Other comprehensiveincome refers to revenues, expenses, gains and losses thatunder generally accepted accounting principles are included incomprehensive income but are excluded from net earnings asthese amounts are recorded directly as an adjustment tostockholders’ equity. Other comprehensive income iscomprised of foreign currency translation adjustments,
42

ZIMMER HOLDINGS, INC. 2013 FORM 10-K ANNUAL REPORT
Notes to Consolidated Financial Statements (Continued)
unrealized gains and losses on cash flow hedges, unrealizedgains and losses on available-for-sale securities andamortization of prior service costs and unrecognized gains andlosses in actuarial assumptions.
Treasury Stock – We account for repurchases of commonstock under the cost method and present treasury stock as areduction of stockholders’ equity. We reissue common stockheld in treasury only for limited purposes.
Noncontrolling Interest – In 2011, we made aninvestment in a company in which we acquired a controllingfinancial interest, but not 100 percent of the equity. In 2013,we purchased additional shares of the company from theminority shareholders. Further information related to thenoncontrolling interests of that investment has not beenprovided as it is not significant to our consolidated financialstatements.
Accounting Pronouncements – Effective January 1, 2013,we adopted the FASB’s Accounting Standard Updates (ASUs)requiring reporting of amounts reclassified out of accumulatedother comprehensive income (OCI) and balance sheetoffsetting between derivative assets and liabilities. These ASUsonly change financial statement disclosure requirements andtherefore do not impact our financial position, results ofoperations or cash flows. See Note 12 for disclosures relatingto OCI. See Note 13 for disclosures relating to balance sheetoffsetting.
There are no other recently issued accountingpronouncements that we have not yet adopted that areexpected to have a material effect on our financial position,results of operations or cash flows.
3. SHARE-BASED COMPENSATION
Our share-based payments primarily consist of stockoptions, restricted stock, restricted stock units (RSUs), and anemployee stock purchase plan. Share-based compensationexpense is as follows (in millions):
For the Years Ended December 31, 2013 2012 2011
Stock options $ 24.7 $ 32.4 $ 41.7
RSUs and other 23.8 22.6 18.8
Total expense, pre-tax 48.5 55.0 60.5
Tax benefit related to awards (15.6) (16.6) (17.8)
Total expense, net of tax $ 32.9 $ 38.4 $ 42.7
Share-based compensation cost capitalized as part ofinventory for the years ended December 31, 2013, 2012 and2011 was $4.1 million, $6.1 million, and $8.8 million,respectively. As of December 31, 2013 and 2012,approximately $2.4 million and $3.3 million of capitalized costsremained in finished goods inventory.
Stock Options
We had two equity compensation plans in effect atDecember 31, 2013: the 2009 Stock Incentive Plan (2009 Plan)and the Stock Plan for Non-Employee Directors. The 2009 Plansucceeded the 2006 Stock Incentive Plan (2006 Plan) and theTeamShare Stock Option Plan (TeamShare Plan). No furtherawards have been granted under the 2006 Plan or under theTeamShare Plan since May 2009, and shares remainingavailable for grant under those plans have been merged intothe 2009 Plan. Vested and unvested stock options andunvested restricted stock and RSUs previously granted underthe 2006 Plan, the TeamShare Plan and another prior plan, the2001 Stock Incentive Plan, remained outstanding as ofDecember 31, 2013. We have reserved the maximum numberof shares of common stock available for award under the termsof each of these plans. We have registered 57.9 million sharesof common stock under these plans. The 2009 Plan providesfor the grant of nonqualified stock options and incentive stockoptions, long-term performance awards in the form ofperformance shares or units, restricted stock, RSUs and stockappreciation rights. The Compensation and ManagementDevelopment Committee of the Board of Directors determinesthe grant date for annual grants under our equitycompensation plans. The date for annual grants under the2009 Plan to our executive officers is expected to occur in thefirst quarter of each year following the earningsannouncements for the previous quarter and full year. TheStock Plan for Non-Employee Directors provides for awards ofstock options, restricted stock and RSUs to non-employeedirectors. It has been our practice to issue shares of commonstock upon exercise of stock options from previously unissuedshares, except in limited circumstances where they are issuedfrom treasury stock. The total number of awards which may begranted in a given year and/or over the life of the plan undereach of our equity compensation plans is limited. AtDecember 31, 2013, an aggregate of 10.4 million shares wereavailable for future grants and awards under these plans.
Stock options granted to date under our plans generallyvest over four years and generally have a maximum contractuallife of 10 years. As established under our equity compensationplans, vesting may accelerate upon retirement after the firstanniversary date of the award if certain criteria are met. Werecognize expense related to stock options on a straight-linebasis over the requisite service period, less awards expected tobe forfeited using estimated forfeiture rates. Due to theaccelerated retirement provisions, the requisite service periodof our stock options range from one to four years. Stockoptions are granted with an exercise price equal to the marketprice of our common stock on the date of grant, except inlimited circumstances where local law may dictate otherwise.
43

ZIMMER HOLDINGS, INC. 2013 FORM 10-K ANNUAL REPORT
Notes to Consolidated Financial Statements (Continued)
A summary of stock option activity for the year ended December 31, 2013 is as follows (options in thousands):
Stock Options
Weighted
Average
Exercise
Price
Weighted
Average
Remaining
Contractual
Life
Intrinsic
Value
(in millions)
Outstanding at January 1, 2013 16,638 $68.74
Options granted 1,603 73.40
Options exercised (7,008) 67.67
Options forfeited (304) 65.68
Options expired (188) 76.09
Outstanding at December 31, 2013 10,741 $70.06 5.0 $248.4
Vested or expected to vest as of December 31, 2013 10,329 $70.12 4.9 $238.3
Exercisable at December 31, 2013 7,375 $71.44 3.5 $160.4
We use a Black-Scholes option-pricing model todetermine the fair value of our stock options. For stockoptions granted in 2012 and 2011, expected volatility wasderived from the implied volatility of traded options on ourstock that were actively traded around the grant date of thestock options with exercise prices similar to the stock optionsand maturities of over one year. In 2013, we used acombination of historical volatility and implied volatilitybecause the traded options that were actively traded aroundthe grant date of our stock options did not have maturities ofover one year. The expected term of the stock options hasbeen derived from historical employee exercise behavior. Therisk-free interest rate was determined using the implied yieldcurrently available for zero-coupon U.S. government issueswith a remaining term approximating the expected life of theoptions. We began paying dividends in 2012. Accordingly,prior to 2012 we assumed no dividend yield. Starting in 2012,the dividend yield was determined by using an estimatedannual dividend and dividing it by the market price of ourstock on the grant date.
The following table presents information regarding theweighted average fair value for stock options granted, theassumptions used to determine fair value, and the intrinsicvalue of options exercised in the indicated year:
For the Years Ended December 31, 2013 2012 2011
Dividend yield 1.1% 1.1% –%
Volatility 24.5% 25.6% 26.1%
Risk-free interest rate 1.1% 1.5% 2.2%
Expected life (years) 6.1 6.1 6.1
Weighted average fair value of optionsgranted $16.33 $15.40 $18.33
Intrinsic value of options exercised (inmillions) $ 97.9 $ 17.1 $ 27.5
As of December 31, 2013, there was $33.5 million ofunrecognized share-based payment expense related tononvested stock options granted under our plans. Thatexpense is expected to be recognized over a weighted averageperiod of 2.7 years.
RSUs
We have awarded RSUs to our employees. The terms ofthe awards have been three to five years. Some of the awardshave only service conditions while some have performance andmarket conditions as well. The service condition awards vestratably on the anniversary date of the award. The awards thathave performance and market conditions vest all at once onthe third anniversary date. Future service conditions may bewaived if an employee retires after the first anniversary date ofthe award, but performance and market conditions continue toapply. Accordingly, the requisite service period used for share-based payment expense on our RSUs range from one to fiveyears.
44

ZIMMER HOLDINGS, INC. 2013 FORM 10-K ANNUAL REPORT
Notes to Consolidated Financial Statements (Continued)
A summary of nonvested RSU activity for the year endedDecember 31, 2013 is as follows (RSUs in thousands):
RSUs
Weighted Average
Grant Date
Fair Value
Outstanding at January 1, 2013 1,445 $61.11
Granted 581 74.22
Vested (434) 55.80
Forfeited (138) 65.03
Outstanding at December 31, 2013 1,454 67.42
For the RSUs with service conditions only, the fair value ofthe awards was determined based upon the fair market valueof our common stock on the date of grant. For the RSUs withmarket conditions, a Monte Carlo valuation technique was usedto simulate the market conditions of the awards. The outcomeof the simulation was used to determine the fair value of theawards.
We are required to estimate the number of RSUs that willvest and recognize share-based payment expense on a straight-line basis over the requisite service period. As of December 31,2013, we estimate that approximately 875,900 outstandingRSUs will vest. If our estimate were to change in the future,the cumulative effect of the change in estimate will berecorded in that period. Based upon the number of RSUs thatwe expect to vest, the unrecognized share-based paymentexpense as of December 31, 2013 was $34.0 million and isexpected to be recognized over a weighted-average period of2.2 years. The fair value of RSUs vesting during the yearsended December 31, 2013, 2012 and 2011 based upon ourstock price on the date of vesting was $32.5 million, $18.9million and $11.8 million, respectively.
4. INVENTORIES
Inventories consisted of the following (in millions):
As of December 31, 2013 2012
Finished goods $ 817.0 $786.3
Work in progress 77.4 52.3
Raw materials 180.1 156.7
Inventories $1,074.5 $995.3
Amounts charged to the consolidated statement ofearnings for excess and obsolete inventory in the yearsended December 31, 2013, 2012 and 2011 were $112.0 million,$55.1 million and $47.6 million, respectively. The increase inthe 2013 period primarily resulted from our decision todiscontinue certain products.
5. PROPERTY, PLANT AND EQUIPMENT
Property, plant and equipment consisted of the following(in millions):
As of December 31, 2013 2012
Land $ 21.7 $ 22.1
Building and equipment 1,353.1 1,232.8
Capitalized software costs 272.6 241.8
Instruments 1,610.6 1,579.8
Construction in progress 58.2 117.8
3,316.2 3,194.3
Accumulated depreciation (2,091.5) (1,983.6)
Property, plant and equipment, net $ 1,224.7 $ 1,210.7
Depreciation expense was $262.6 million, $266.0 millionand $266.1 million for the years ended December 31, 2013,2012 and 2011, respectively.
6. ACQUISITIONS
We made a number of business acquisitions during theyears 2013, 2012 and 2011. In May 2013, we acquired thebusiness assets of Knee Creations, LLC (Knee Creations). TheKnee Creations acquisition enhances our product portfolio ofearly intervention knee treatments. In June 2013, we acquiredNORMED Medizin-Technik GmbH (Normed). The Normedacquisition strengthens our Extremities and Trauma productportfolios and brings new product development capabilities inthe foot and ankle and hand and wrist markets. In January2012, we acquired Synvasive Technology, Inc. (Synvasive).The Synvasive acquisition enhances our product portfoliothrough the addition of the STABLECUT® surgical saw blades,as well as the eLIBRA® Dynamic Knee Balancing SystemTM forsoft tissue balancing. In October 2012, we acquired DornochMedical Systems, Inc. (Dornoch). The Dornoch acquisitionenhances our product portfolio through the addition of amedical waste fluid management and disposal technology. InNovember 2011, we acquired ExtraOrtho, Inc. (ExtraOrtho).The ExtraOrtho acquisition enhances our position in theexternal fixation market.
The results of operations of the acquired companies havebeen included in our consolidated results of operationssubsequent to the transaction dates, and the respective assetsand liabilities of the acquired companies have been recorded attheir estimated fair values in our consolidated statement offinancial position as of the transaction dates, with any excesspurchase price being recorded as goodwill. Pro forma financialinformation and other information required have not beenincluded as the acquisitions, individually and in the aggregate,did not have a material impact upon our financial position orresults of operations.
45

ZIMMER HOLDINGS, INC. 2013 FORM 10-K ANNUAL REPORT
Notes to Consolidated Financial Statements (Continued)
7. INVESTMENTS
We invest in short and long-term investments classified asavailable-for-sale securities. Information regarding ourinvestments is as follows (in millions):
Gross Unrealized
Fair
value
Amortized
Cost Gains Losses
As of December 31, 2013Corporate debt securities $457.6 $0.4 $(0.1) $457.9U.S. government and agency debt
securities 211.1 0.1 – 211.2Foreign government debt
securities 3.1 – – 3.1Commercial paper 68.3 – – 68.3Certificates of deposit 67.2 – – 67.2
Total short and long-terminvestments $807.3 $0.5 $(0.1) $807.7
As of December 31, 2012Corporate debt securities $383.6 $0.3 $(0.1) $383.8U.S. government and agency debt
securities 295.8 0.1 – 295.9Foreign government debt
securities 5.0 – – 5.0Commercial paper 138.7 – – 138.7Certificates of deposit 92.2 0.1 – 92.3
Total short and long-terminvestments $915.3 $0.5 $(0.1) $915.7
The amortized cost and fair value of our available-for-salefixed-maturity securities by contractual maturity are as follows(in millions):
As of December 31, 2013 Amortized Cost
Fair
Value
Due in one year or less $726.7 $727.0Due after one year through two years 80.6 80.7
Total $807.3 $807.7
In January 2014, we sold certain debt securities withamortized cost and fair values as of December 31, 2013 of$567.5 million and $567.8 million, respectively. Included in thattotal were $161.2 million of securities at fair value withmaturities of one year through two years that we classified asshort-term investments on our consolidated balance sheet. Thetable above reflects these securities in the due in one year orless category even though their contractual maturities werelonger.
8. FAIR VALUE MEASUREMENTS OF ASSETS AND LIABILITIES
The following financial assets and liabilities are recordedat fair value on a recurring basis (in millions):
As of December 31, 2013
Fair Value Measurements
at Reporting Date Using:
Description
Recorded
Balance
Quoted Prices
in Active
Markets for
Identical
Assets
(Level 1)
Significant Other
Observable
Inputs
(Level 2)
Significant
Unobservable
Inputs
(Level 3)
Assets
Available-for-sale securities
Corporate debt securities $457.9 $– $457.9 $–
U.S. government andagency debtsecurities 211.2 – 211.2 –
Foreign government debtsecurities 3.1 – 3.1 –
Commercial paper 68.3 – 68.3 –
Certificates of deposit 67.2 – 67.2 –
Total available-for-salesecurities 807.7 – 807.7 –
Derivatives, current andlong-term
Foreign currencyforward contracts andoptions 68.7 – 68.7 –
Interest rate swaps 16.3 – 16.3 –
$892.7 $– $892.7 $–
Liabilities
Derivatives, current andlong-term
Foreign currencyforward contracts andoptions 20.6 – 20.6 –
Interest rate swaps 7.0 – 7.0 –
$ 27.6 $– $ 27.6 $–
46

ZIMMER HOLDINGS, INC. 2013 FORM 10-K ANNUAL REPORT
Notes to Consolidated Financial Statements (Continued)
As of December 31, 2012
Fair Value Measurements at Reporting Date
Using:
Description
Recorded
Balance
Quoted Prices
in Active
Markets for
Identical
Assets
(Level 1)
Significant Other
Observable
Inputs
(Level 2)
Significant
Unobservable
Inputs
(Level 3)
Assets
Available-for-sale securities
Corporate debt securities $383.8 $– $383.8 $–
U.S. government andagency debt securities 295.9 – 295.9 –
Foreign government debtsecurities 5.0 – 5.0 –
Commercial paper 138.7 – 138.7 –
Certificates of deposit 92.3 – 92.3 –
Total available-for-salesecurities 915.7 – 915.7 –
Derivatives, current andlong-term
Foreign currencyforward contracts andoptions 28.4 – 28.4 –
Interest rate swaps 33.9 – 33.9 –
$978.0 $– $978.0 $–
Liabilities
Derivatives, current andlong-term
Foreign currencyforward contracts $ 10.8 $– $ 10.8 $–
We value our available-for-sale securities using a marketapproach based on broker prices for identical assets in over-the-counter markets and we perform ongoing assessments ofcounterparty credit risk.
We value our foreign currency forward contracts andforeign currency options using a market approach based onforeign currency exchange rates obtained from active marketsand we perform ongoing assessments of counterparty creditrisk.
We value our interest rate swaps using a market approachbased on publicly available market yield curves and the termsof our swaps and we perform ongoing assessments ofcounterparty credit risk.
The following nonfinancial assets were measured at fairvalue on a nonrecurring basis (in millions):
Fair Value Measurements Using:
Description Total
Quoted Prices
in Active
Markets for
Identical
Assets
(Level 1)
Significant
Other
Observable
Inputs
(Level 2)
Significant
Unobservable
Inputs
(Level 3)
Total
Losses
Year Ended December 31, 2013
Indefinite-livedintangibleassets $21.0 $– $– $21.0 $ 2.8
Year Ended December 31, 2012
Goodwill $41.0 $– $– $41.0 $96.0
Indefinite-livedintangibleassets 24.2 – – 24.2 11.6
We conduct our annual goodwill impairment testing in thefourth quarter of every year or whenever events occur orcircumstances change that would more likely than not reducethe fair value of a reporting unit below its carrying amount. In2012, it was determined that our U.S. Spine reporting unit’scarrying value was in excess of its fair value. The goodwill forthis reporting unit was written down to its implied fair value of$41.0 million from its previous carrying value of $137.0 million,resulting in a $96.0 million non-cash impairment charge. Theimplied fair value of goodwill equals the estimated fair value ofa reporting unit minus the fair value of the reporting unit’s netassets. In determining the implied fair value of the U.S. Spinereporting unit’s goodwill, we used unobservable inputs toestimate the fair value of the reporting unit and its assets andliabilities. Fair value was determined using an equal weightingof income and market approaches.
Fair value under the income approach was determined bydiscounting to present value the estimated future cash flows ofthe reporting unit. Fair value under the market approachutilized the guideline public company methodology, which usesvaluation indicators from publicly traded companies that aresimilar to our U.S. Spine reporting unit and considers controlpremiums that would result from a sale of the reporting unitand the level of assets in the reporting unit versus thecomparable companies.
In estimating the future cash flows of the reporting unit,we utilized a combination of market and company specificinputs that a market participant would use in assessing the fairvalue of the reporting unit. The primary market input wasrevenue growth rates. These rates were based upon historicaltrends and estimated future growth drivers such as an agingglobal population, obesity and more active lifestyles.Significant company specific inputs included assumptionsregarding how the reporting unit could leverage operatingexpenses as revenue grows and the impact any new productswill have on revenues.
47

ZIMMER HOLDINGS, INC. 2013 FORM 10-K ANNUAL REPORT
Notes to Consolidated Financial Statements (Continued)
Under the guideline public company methodology, wetook into consideration specific risk differences between ourreporting unit and the comparable companies, such as recentfinancial performance, size risks and product portfolios, amongother considerations. Based upon our reporting unit’s recentfinancial performance, market share and product portfolio, wevalued the reporting unit near the bottom of the valuationindicators of the comparable companies.
The fair value of the reporting unit’s assets and liabilitieswere determined by using the same methods that are used inbusiness combination purchase accounting.
Factors that contributed to impairment of the U.S. Spinereporting unit included broader market issues as well ascompany specific issues. The U.S. spine market was andcontinues to be under pressure due to a constrained economicenvironment leading to continuing high unemployment andpayer pushback on the necessity of certain procedures.Additionally, pricing was and continues to decline across theindustry. Company specific issues included turnover with ourindependent sales agents and lack of execution in developingnew, competitive products which resulted in a less thanoptimal product portfolio in our U.S. Spine reporting unit.
Before the economic downturn in 2008, we estimated theU.S. spine market was growing in the low double digits, butdeclined to flat or in the low single digits in 2012. Previousgoodwill impairment tests forecasted some recovery in themarket which did not occur. As we completed our annualoperating plan in the fourth quarter of 2012, it became clearerthat the U.S. spine market recovery may take longer than weplanned, including the persistence of significant negativepricing pressures. Additionally, we concluded that newproduct introductions made in 2012 would not have assignificant of a positive effect as we had previously forecasted.As a result, we tempered our expectations of recovery in theU.S. market and for our U.S. Spine reporting unit andrecognized an impairment charge.
In our 2013 annual goodwill impairment test of our U.S.Spine reporting unit, we concluded no impairment charge wasnecessary. While our estimated fair value of the reporting unitdeclined slightly, the net assets of the reporting unit declinedby more. The decrease in the net assets was primarily due tocontinued amortization of intangible assets acquired inbusiness combinations and lower working capital needs.However, the estimated fair value of the reporting unit did notsubstantially exceed its carrying value.
We have five other reporting units with goodwill assignedto them. We estimate the fair value of those reporting unitsusing the income approach by discounting to present value theestimated future cash flows of the reporting unit. Due tochallenging market conditions associated with our U.S. Dentalreporting unit, that reporting unit’s estimated fair value did notsubstantially exceed its carrying value in our 2013 goodwillimpairment test. For each of the other four reporting units, theestimated fair value substantially exceeded its carrying value.
We will continue to monitor the fair value of our U.S.Spine and U.S. Dental reporting units as well as our other fourreporting units in our interim and annual reporting periods. Ifestimated cash flows for these reporting units decrease, wemay be required to record further impairment charges in thefuture. Factors that could result in our cash flows being lowerthan our current estimates include: 1) decreased revenuescaused by unforeseen changes in the healthcare market, or ourinability to generate new product revenue from our researchand development activities, and 2) our inability to achieve theestimated operating margins in our forecasts due tounforeseen factors. Additionally, changes in the broadereconomic environment could cause changes to our estimateddiscount rates or comparable company valuation indicators,which may impact our estimated fair values.
In 2013 and 2012, we also recorded $2.8 million and $11.6million, respectively, of impairment charges in “Special items”related to certain indefinite lived intangible assets. Theimpairment was a result of lower future estimated revenuesfrom products using certain trademarks. The lower futureestimated revenue resulted from negative publicity in themarketplace related to certain hip devices and our challengesin the global spine market that have adversely affected sales ofthese products. Further information regarding how the fairvalue of these indefinite lived trademarks was determined hasnot been provided as we do not believe this non-cash chargewas significant to our results for 2013 and 2012.
48

ZIMMER HOLDINGS, INC. 2013 FORM 10-K ANNUAL REPORT
Notes to Consolidated Financial Statements (Continued)
9. GOODWILL AND OTHER INTANGIBLE ASSETS
The following table summarizes the changes in the carrying amount of goodwill (in millions):
Americas Europe Asia Pacific Total
Balance at January 1, 2012
Goodwill $1,595.3 $1,111.8 $195.9 $2,903.0
Accumulated impairment losses (277.0) – – (277.0)
1,318.3 1,111.8 195.9 2,626.0
U.S. Spine reporting unit impairment (96.0) – – (96.0)
Acquisitions 25.9 – – 25.9
Currency translation 2.7 16.8 (3.6) 15.9
Balance at December 31, 2012
Goodwill 1,623.9 1,128.6 192.3 2,944.8
Accumulated impairment losses (373.0) – – (373.0)
1,250.9 1,128.6 192.3 2,571.8
Acquisitions 11.0 24.0 – 35.0
Currency translation (5.0) 34.5 (25.1) 4.4
Balance at December 31, 2013
Goodwill 1,629.9 1,187.1 167.2 2,984.2
Accumulated impairment losses (373.0) – – (373.0)
$1,256.9 $1,187.1 $167.2 $2,611.2
The components of identifiable intangible assets are as follows (in millions):
Technology
Intellectual
Property
Rights
Trademarks
and Trade
Names
Customer
Relationships Other Total
As of December 31, 2013:
Intangible assets subject to amortization:
Gross carrying amount $ 700.4 $ 173.4 $ 43.3 $216.2 $ 95.1 $1,228.4
Accumulated amortization (401.4) (142.5) (33.9) (76.4) (43.9) (698.1)
Intangible assets not subject to amortization:
Gross carrying amount – – 177.4 – – 177.4
Total identifiable intangible assets $ 299.0 $ 30.9 $186.8 $139.8 $ 51.2 $ 707.7
As of December 31, 2012:
Intangible assets subject to amortization:
Gross carrying amount $ 695.1 $ 173.4 $ 47.4 $177.0 $ 95.7 $1,188.6
Accumulated amortization (362.5) (124.2) (31.1) (61.7) (46.0) (625.5)
Intangible assets not subject to amortization:
Gross carrying amount – – 177.6 – – 177.6
Total identifiable intangible assets $ 332.6 $ 49.2 $193.9 $115.3 $ 49.7 $ 740.7
49
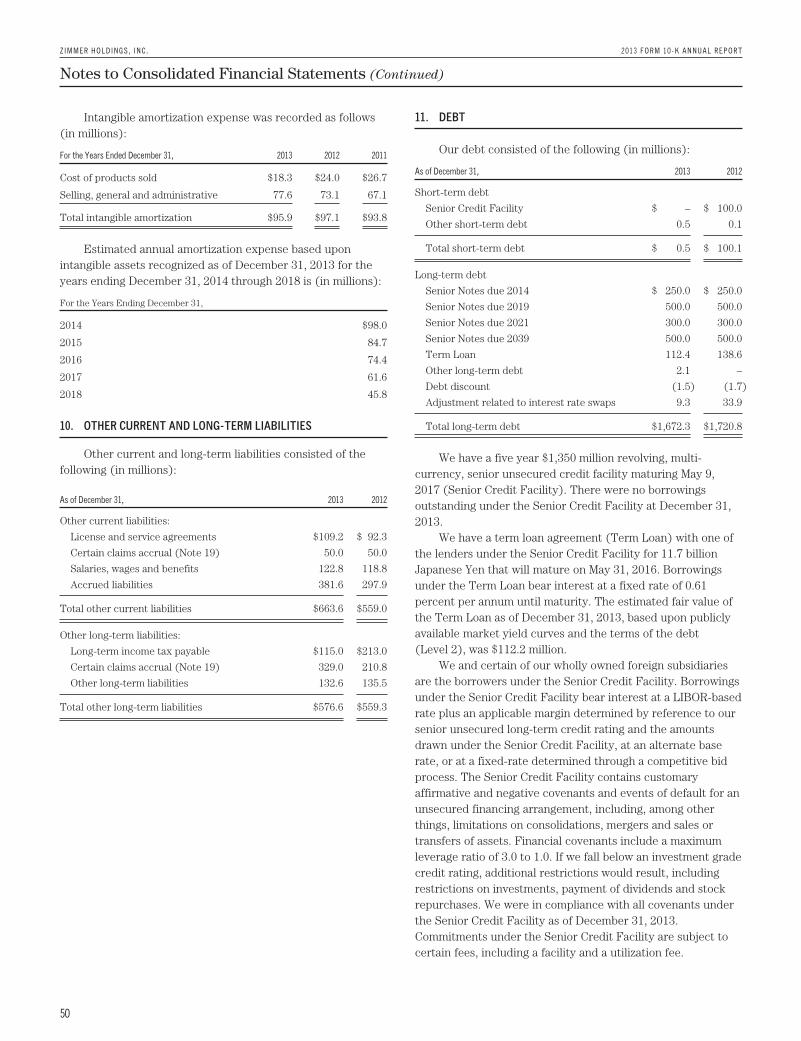
ZIMMER HOLDINGS, INC. 2013 FORM 10-K ANNUAL REPORT
Notes to Consolidated Financial Statements (Continued)
Intangible amortization expense was recorded as follows(in millions):
For the Years Ended December 31, 2013 2012 2011
Cost of products sold $18.3 $24.0 $26.7
Selling, general and administrative 77.6 73.1 67.1
Total intangible amortization $95.9 $97.1 $93.8
Estimated annual amortization expense based uponintangible assets recognized as of December 31, 2013 for theyears ending December 31, 2014 through 2018 is (in millions):
For the Years Ending December 31,
2014 $98.0
2015 84.7
2016 74.4
2017 61.6
2018 45.8
10. OTHER CURRENT AND LONG-TERM LIABILITIES
Other current and long-term liabilities consisted of thefollowing (in millions):
As of December 31, 2013 2012
Other current liabilities:
License and service agreements $109.2 $ 92.3
Certain claims accrual (Note 19) 50.0 50.0
Salaries, wages and benefits 122.8 118.8
Accrued liabilities 381.6 297.9
Total other current liabilities $663.6 $559.0
Other long-term liabilities:
Long-term income tax payable $115.0 $213.0
Certain claims accrual (Note 19) 329.0 210.8
Other long-term liabilities 132.6 135.5
Total other long-term liabilities $576.6 $559.3
11. DEBT
Our debt consisted of the following (in millions):
As of December 31, 2013 2012
Short-term debt
Senior Credit Facility $ – $ 100.0
Other short-term debt 0.5 0.1
Total short-term debt $ 0.5 $ 100.1
Long-term debt
Senior Notes due 2014 $ 250.0 $ 250.0
Senior Notes due 2019 500.0 500.0
Senior Notes due 2021 300.0 300.0
Senior Notes due 2039 500.0 500.0
Term Loan 112.4 138.6
Other long-term debt 2.1 –
Debt discount (1.5) (1.7)
Adjustment related to interest rate swaps 9.3 33.9
Total long-term debt $1,672.3 $1,720.8
We have a five year $1,350 million revolving, multi-currency, senior unsecured credit facility maturing May 9,2017 (Senior Credit Facility). There were no borrowingsoutstanding under the Senior Credit Facility at December 31,2013.
We have a term loan agreement (Term Loan) with one ofthe lenders under the Senior Credit Facility for 11.7 billionJapanese Yen that will mature on May 31, 2016. Borrowingsunder the Term Loan bear interest at a fixed rate of 0.61percent per annum until maturity. The estimated fair value ofthe Term Loan as of December 31, 2013, based upon publiclyavailable market yield curves and the terms of the debt(Level 2), was $112.2 million.
We and certain of our wholly owned foreign subsidiariesare the borrowers under the Senior Credit Facility. Borrowingsunder the Senior Credit Facility bear interest at a LIBOR-basedrate plus an applicable margin determined by reference to oursenior unsecured long-term credit rating and the amountsdrawn under the Senior Credit Facility, at an alternate baserate, or at a fixed-rate determined through a competitive bidprocess. The Senior Credit Facility contains customaryaffirmative and negative covenants and events of default for anunsecured financing arrangement, including, among otherthings, limitations on consolidations, mergers and sales ortransfers of assets. Financial covenants include a maximumleverage ratio of 3.0 to 1.0. If we fall below an investment gradecredit rating, additional restrictions would result, includingrestrictions on investments, payment of dividends and stockrepurchases. We were in compliance with all covenants underthe Senior Credit Facility as of December 31, 2013.Commitments under the Senior Credit Facility are subject tocertain fees, including a facility and a utilization fee.
50

ZIMMER HOLDINGS, INC. 2013 FORM 10-K ANNUAL REPORT
Notes to Consolidated Financial Statements (Continued)
We have four tranches of senior notes outstanding: $250million aggregate principal amount of 1.4 percent notes dueNovember 30, 2014, $500 million aggregate principal amount of4.625 percent notes due November 30, 2019, $300 millionaggregate principal amount of 3.375 percent notes dueNovember 30, 2021 and $500 million aggregate principalamount of 5.75 percent notes due November 30, 2039. Intereston each series is payable on May 30 and November 30 of eachyear until maturity. The estimated fair value of our SeniorNotes as of December 31, 2013, based on quoted prices for thespecific securities from transactions in over-the-countermarkets (Level 2), was $1,649.5 million.
We may redeem the Senior Notes at our election in wholeor in part at any time prior to maturity at a redemption priceequal to the greater of 1) 100 percent of the principal amountof the notes being redeemed; or 2) the sum of the presentvalues of the remaining scheduled payments of principal andinterest (not including any portion of such payments ofinterest accrued as of the date of redemption), discounted tothe date of redemption on a semi-annual basis at the TreasuryRate (as defined in the debt agreement), plus 15 basis pointsin the case of the 2014 Notes, 20 basis points in the case of the2019 Notes and 2021 Notes, and 25 basis points in the case ofthe 2039 Notes. We would also pay the accrued and unpaidinterest on the Senior Notes to the redemption date.
We have entered into interest rate swap agreementswhich we designated as fair value hedges of underlying fixed-rate obligations on our Senior Notes due 2019 and 2021. SeeNote 13 for additional information regarding the interest rateswap agreements.
Before our senior notes due November 30, 2014 becomepayable, we intend to issue new senior notes in order to paythe $250 million owed. If we are not able to issue new seniornotes, we intend to borrow against our Senior Credit Facility topay these notes. Since we have the ability and intent torefinance these senior notes on a long-term basis with newnotes or through our Senior Credit Facility, we have classifiedthese senior notes as long-term debt as of December 31, 2013.
We also have available uncommitted credit facilitiestotaling $50.7 million.
At December 31, 2013, the weighted average interest ratefor our long-term borrowings was 3.3 percent. AtDecember 31, 2012, the weighted average interest rate forshort-term and long-term borrowings was 1.1 percent and 3.5percent, respectively. We paid $68.1 million, $67.8 million and$55.0 million in interest during 2013, 2012 and 2011,respectively.
12. ACCUMULATED OTHER COMPREHENSIVE INCOME
OCI refers to certain gains and losses that under GAAPare included in comprehensive income but are excluded fromnet earnings as these amounts are initially recorded as anadjustment to stockholders’ equity. Amounts in OCI may bereclassified to net earnings upon the occurrence of certainevents.
Our OCI is comprised of foreign currency translationadjustments, unrealized gains and losses on cash flow hedges,unrealized gains and losses on available-for-sale securities, andamortization of prior service costs and unrecognized gains andlosses in actuarial assumptions on our defined benefit plans.Foreign currency translation adjustments are reclassified tonet earnings upon sale or upon a complete or substantiallycomplete liquidation of an investment in a foreign entity.Unrealized gains and losses on cash flow hedges arereclassified to net earnings when the hedged item affects netearnings. Unrealized gains and losses on available-for-salesecurities are reclassified to net earnings if we sell the securitybefore maturity or if the unrealized loss is considered to beother-than-temporary. We typically hold our available-for-salesecurities until maturity and are able to realize their amortizedcost and therefore we do not have reclassification adjustmentsto net earnings on these securities. Amounts related to definedbenefit plans that are in OCI are reclassified over the serviceperiods of employees in the plan. The reclassification amountsare allocated to all employees in the plans and therefore thereclassified amounts may become part of inventory to theextent they are considered direct labor costs. See Note 14 formore information on our defined benefit plans.
The following table shows the changes in the componentsof OCI, net of tax (in millions):
Foreign
Currency
Translation
Cash
Flow
Hedges
Unrealized
Gains on
Securities
Defined
Benefit
Plan
Items
Balance December 31, 2012 $445.5 $ 4.1 $0.4 $(106.1)OCI before reclassifications (44.4) 33.4 0.1 30.6Reclassifications – (4.4) – 7.9
Balance December 31, 2013 $401.1 $33.1 $0.5 $ (67.6)
51

ZIMMER HOLDINGS, INC. 2013 FORM 10-K ANNUAL REPORT
Notes to Consolidated Financial Statements (Continued)
The following table shows the reclassification adjustments from OCI (in millions):
Amount of Gain / (Loss)
Reclassified from OCI
Location on Statement of Earnings
For the Years Ended December 31,
Component of OCI 2013 2012 2011
Cash flow hedges
Foreign exchange forward contracts $ 8.0 $(12.0) $(32.9) Cost of products soldForeign exchange options (0.2) (0.4) – Cost of products soldCross-currency interest rate swaps – 0.2 (8.3) Interest expense
7.8 (12.2) (41.2) Total before tax3.4 (8.9) (16.7) Provision for income taxes
$ 4.4 $ (3.3) $(24.5) Net of tax
Defined benefit plans
Prior service cost $ 3.9 $ 2.9 $ 0.8 *Unrecognized actuarial (loss) (16.6) (13.3) (7.4) *
(12.7) (10.4) (6.6) Total before tax(4.8) (3.9) (2.6) Provision for income taxes
$ (7.9) $ (6.5) $ (4.0) Net of tax
Total reclassifications $ (3.5) $ (9.8) $(28.5) Net of tax
* These OCI components are included in the computation of net periodic pension expense (see Note 14).
The following table shows the tax effects on each component of OCI recognized in our consolidated statements ofcomprehensive income (in millions):
Before Tax Tax Net of Tax
For the Years Ended December 31, 2013 2012 2011 2013 2012 2011 2013 2012 2011
Foreign currency cumulative translation adjustments $(44.4) $46.1 $ 4.6 $ – $ – $ – $(44.4) $46.1 $ 4.6Unrealized cash flow hedge gains/(losses) 63.6 15.2 (34.9) 30.2 4.3 (4.3) 33.4 10.9 (30.6)Reclassification adjustments on foreign currency hedges (7.8) 12.2 41.2 (3.4) 8.9 16.7 (4.4) 3.3 24.5Unrealized gains on securities 0.1 0.4 0.2 – – – 0.1 0.4 0.2Adjustments to prior service cost and unrecognized actuarial
assumptions 50.3 20.3 (71.3) 11.8 8.5 (23.0) 38.5 11.8 (48.3)
Total Other Comprehensive Gain/(Loss) $ 61.8 $94.2 $(60.2) $38.6 $21.7 $(10.6) $ 23.2 $72.5 $(49.6)
13. DERIVATIVE INSTRUMENTS AND HEDGING ACTIVITIES
We are exposed to certain market risks relating to ourongoing business operations, including foreign currencyexchange rate risk, commodity price risk, interest rate risk andcredit risk. We manage our exposure to these and othermarket risks through regular operating and financingactivities. Currently, the only risks that we manage throughthe use of derivative instruments are interest rate risk andforeign currency exchange rate risk.
Interest Rate Risk
Derivatives Designated as Fair Value Hedges
We use interest rate derivative instruments to manage ourexposure to interest rate movements by converting fixed-ratedebt into variable-rate debt. Under these agreements, weagree to exchange, at specified intervals, the differencebetween fixed and variable interest amounts calculated by
reference to an agreed-upon notional principal amount. Theobjective of the instruments is to more closely align interestexpense with interest income received on cash and cashequivalents. These derivative instruments are designated asfair value hedges under GAAP. Changes in the fair value of thederivative instrument are recorded in current earnings and areoffset by gains or losses on the underlying debt instrument.
We have multiple fixed-to-variable interest rate swapagreements that we have designated as fair value hedges of thefixed interest rate obligations on our Senior Notes due 2019and 2021. The total notional amounts are $250 million and $300million for the Senior Notes due 2019 and 2021, respectively.On the interest rate swap agreements for the Senior Notes due2019, we receive a fixed interest rate of 4.625 percent and payvariable interest equal to the three-month LIBOR plus anaverage of 133 basis points. On the interest rate swapagreements for the Senior Notes due 2021, we receive a fixedinterest rate of 3.375 percent and pay variable interest equal tothe three-month LIBOR plus an average of 99 basis points.
52

ZIMMER HOLDINGS, INC. 2013 FORM 10-K ANNUAL REPORT
Notes to Consolidated Financial Statements (Continued)
Foreign Currency Exchange Rate Risk
We operate on a global basis and are exposed to the riskthat our financial condition, results of operations and cashflows could be adversely affected by changes in foreigncurrency exchange rates. To reduce the potential effects offoreign currency exchange rate movements on net earnings,we enter into derivative financial instruments in the form offoreign currency exchange forward contracts and options withmajor financial institutions. We are primarily exposed toforeign currency exchange rate risk with respect totransactions and net assets denominated in Euros, SwissFrancs, Japanese Yen, British Pounds, Canadian Dollars,Australian Dollars, Korean Won, Swedish Krona, CzechKoruna, Thai Baht, Taiwan Dollars, South African Rand,Russian Rubles and Indian Rupees. We do not use derivativefinancial instruments for trading or speculative purposes.
Derivatives Designated as Cash Flow Hedges
Our revenues are generated in various currenciesthroughout the world. However, a significant amount of ourinventory is produced in U.S. Dollars. Therefore, movements inforeign currency exchange rates may have differentproportional effects on our revenues compared to our cost ofproducts sold. To minimize the effects of foreign currencyexchange rate movements on cash flows, we hedgeintercompany sales of inventory expected to occur within thenext 30 months with foreign currency exchange forwardcontracts and options. We designate these derivativeinstruments as cash flow hedges.
We perform quarterly assessments of hedge effectivenessby verifying and documenting the critical terms of the hedgeinstrument and that forecasted transactions have not changedsignificantly. We also assess on a quarterly basis whether therehave been adverse developments regarding the risk of acounterparty default. For derivatives which qualify as hedgesof future cash flows, the effective portion of changes in fairvalue is temporarily recorded in other comprehensive incomeand then recognized in cost of products sold when the hedgeditem affects net earnings. The ineffective portion of aderivative’s change in fair value, if any, is immediately reportedin cost of products sold.
For foreign currency exchange forward contracts andoptions outstanding at December 31, 2013, we had obligationsto purchase U.S. Dollars and sell Euros, Japanese Yen, BritishPounds, Canadian Dollars, Australian Dollars, Korean Won,Swedish Krona, Czech Koruna, Thai Baht, Taiwan Dollars,South African Rand, Russian Rubles and Indian Rupees and
obligations to purchase Swiss Francs and sell U.S. Dollars.These derivatives mature at dates ranging from January 2014through June 2016. As of December 31, 2013, the notionalamounts of outstanding forward contracts and options enteredinto with third parties to purchase U.S. Dollars were $1,574.6million. As of December 31, 2013, the notional amounts ofoutstanding forward contracts and options entered into withthird parties to purchase Swiss Francs were $353.3 million.
Derivatives Not Designated as Hedging Instruments
We enter into foreign currency forward exchangecontracts with terms of one month to manage currencyexposures for monetary assets and liabilities denominated in acurrency other than an entity’s functional currency. As aresult, any foreign currency remeasurement gains/lossesrecognized in earnings are generally offset with gains/losses onthe foreign currency forward exchange contracts in the samereporting period. These offsetting gains/losses are recorded incost of products sold as the underlying assets and liabilitiesexposed to remeasurement include inventory-relatedtransactions. These contracts are settled on the last day ofeach reporting period. Therefore, there is no outstandingbalance related to these contracts recorded on the balancesheet as of the end of the reporting period. The notionalamounts of these contracts are typically in a range of $1.2billion to $1.7 billion per quarter.
Foreign Currency Exchange and Interest Rate Risk
Derivatives Designated as Cash Flow Hedges
In 2011, our subsidiary in Japan, with a functionalcurrency of Japanese Yen, borrowed variable-rate debt of$143.0 million denominated in U.S. Dollars under our previouscredit facility. To manage the foreign currency exchange riskassociated with remeasuring the debt to Japanese Yen and theinterest rate risk associated with the variable-rate debt, weentered into multiple cross-currency interest rate swapagreements with a total notional amount of 11,798 millionJapanese Yen. We designated these swaps as cash flow hedgesof the foreign currency exchange and interest rate risks. Theeffective portion of changes in fair value of the cross-currencyinterest rate swaps was temporarily recorded in othercomprehensive income and then recognized in interestexpense when the hedged item affected net earnings. Thecross-currency interest rate swap agreements matured in 2012and we paid off the subsidiary’s U.S. Dollar debt with JapaneseYen debt borrowed under our previous credit facility.
53

ZIMMER HOLDINGS, INC. 2013 FORM 10-K ANNUAL REPORT
Notes to Consolidated Financial Statements (Continued)
Income Statement Presentation
Derivatives Designated as Fair Value Hedges
Derivative instruments designated as fair value hedges had the following effects on our consolidated statements of earnings (inmillions):
Gain / (Loss) on Instrument Gain / (Loss) on Hedged Item
Derivative Instrument Location on Statement of Earnings
Year Ended December 31, Year Ended December 31,
2013 2012 2011 2013 2012 2011
Interest rate swaps Interest expense $(24.6) $6.1 $26.3 $24.6 $(6.1) $(26.3)
We had no ineffective fair value hedging instruments nor any amounts excluded from the assessment of hedge effectivenessduring the years ended December 31, 2013, 2012 and 2011.
Derivatives Designated as Cash Flow Hedges
Derivative instruments designated as cash flow hedges had the following effects, before taxes, on OCI and net earnings on ourconsolidated statements of earnings, consolidated statements of comprehensive income and consolidated balance sheets (inmillions):
Amount of Gain / (Loss)
Recognized in OCI
Amount of Gain / (Loss)
Reclassified from OCI
Year Ended December 31, Year Ended December 31,
Derivative Instrument 2013 2012 2011 Location on Statement of Earnings 2013 2012 2011
Foreign exchange forward contracts $63.9 $16.3 $(34.9) Cost of products sold $ 8.0 $(12.0) $(32.9)
Foreign exchange options (0.3) (1.1) (0.2) Cost of products sold (0.2) (0.4) –
Cross-currency interest rate swaps – – 0.2 Interest expense – 0.2 (8.3)
$63.6 $15.2 $(34.9) $ 7.8 $(12.2) $(41.2)
The net amount recognized in earnings during the years ended December 31, 2013, 2012 and 2011 due to ineffectiveness andamounts excluded from the assessment of hedge effectiveness were not significant.
The fair value of outstanding derivative instruments designated as cash flow hedges and recorded on the balance sheet atDecember 31, 2013, together with settled derivatives where the hedged item has not yet affected earnings, was a net unrealizedgain of $60.8 million, or $33.1 million after taxes, which is deferred in accumulated other comprehensive income. Of the netunrealized gain, $23.9 million, or $10.0 million after taxes, is expected to be reclassified to earnings over the next twelve months.
Derivatives Not Designated as Hedging Instruments
The following gains/(losses) from these derivative instruments were recognized on our consolidated statements of earnings (inmillions):
Derivative Instrument
Location on
Statement of Earnings
Year Ended December 31,
2013 2012 2011
Foreign exchange forward contracts Cost of products sold $– $(2.0) $2.7
This impact does not include any offsetting gains/losses recognized in earnings as a result of foreign currency remeasurementof monetary assets and liabilities denominated in a currency other than an entity’s functional currency.
54

ZIMMER HOLDINGS, INC. 2013 FORM 10-K ANNUAL REPORT
Notes to Consolidated Financial Statements (Continued)
Balance Sheet Presentation
As of December 31, 2013 and December 31, 2012, all derivative instruments designated as fair value hedges and cash flowhedges are recorded at fair value on the balance sheet. On our consolidated balance sheets, we recognize individual forwardcontracts and options with the same counterparty on a net asset/liability basis if we have a master netting agreement with thecounterparty. Under these master netting agreements, we are able to settle derivative instrument assets and liabilities with thesame counterparty in a single transaction, instead of settling each derivative instrument separately. We have master nettingagreements with all of our counterparties. The fair value of derivative instruments on a gross basis is as follows (in millions):
As of December 31, 2013 As of December 31, 2012
Balance Sheet Location
Fair
Value Balance Sheet Location
Fair
Value
Asset Derivatives
Foreign exchange forward contracts Other current assets $ 60.2 Other current assets $29.7
Foreign exchange options Other current assets – Other current assets 0.6
Foreign exchange forward contracts Other assets 30.2 Other assets 19.8
Interest rate swaps Other assets 16.3 Other assets 33.9
Total asset derivatives $106.7 $84.0
Liability Derivatives
Foreign exchange forward contracts Other current liabilities $ 26.4 Other current liabilities $20.2
Foreign exchange forward contracts Other long-term liabilities 15.9 Other current liabilities 12.3
Interest rate swaps Other long-term liabilities 7.0 Other long-term liabilities –
Total liability derivatives $ 49.3 $32.5
The table below presents the effects of our master netting agreements on our consolidated balance sheets (in millions):
As of December 31, 2013 As of December 31, 2012
Description Location
Gross
Amount Offset
Net Amount
in Balance
Sheet
Gross
Amount Offset
Net Amount
in Balance
Sheet
Asset Derivatives
Cash flow hedges Other current assets $60.2 $13.5 $46.7 $30.3 $15.2 $15.1
Cash flow hedges Other assets 30.2 8.2 22.0 19.8 6.5 13.3
Liability Derivatives
Cash flow hedges Other current liabilities 26.4 13.5 12.9 20.2 15.2 5.0
Cash flow hedges Other long-term liabilities 15.9 8.2 7.7 12.3 6.5 5.8
14. RETIREMENT BENEFIT PLANS
We have defined benefit pension plans covering certain U.S. and Puerto Rico employees. The employees who are notparticipating in the defined benefit plans receive additional benefits under our defined contribution plans. Plan benefits areprimarily based on years of credited service and the participant’s average eligible compensation. In addition to the U.S. and PuertoRico defined benefit pension plans, we sponsor various foreign pension arrangements, including retirement and termination benefitplans required by local law or coordinated with government sponsored plans.
We use a December 31 measurement date for our benefit plans.
55

ZIMMER HOLDINGS, INC. 2013 FORM 10-K ANNUAL REPORT
Notes to Consolidated Financial Statements (Continued)
Defined Benefit Plans
The components of net pension expense for our defined benefit retirement plans are as follows (in millions):
U.S. and Puerto Rico Foreign
For the Years Ended December 31, 2013 2012 2011 2013 2012 2011
Service cost $ 11.9 $ 11.4 $ 11.4 $16.1 $15.0 $16.8
Interest cost 13.2 13.3 13.0 5.6 6.1 7.3
Expected return on plan assets (28.7) (25.5) (21.9) (6.7) (7.6) (9.6)
Settlement – 0.7 – – – –
Amortization of prior service cost (2.6) (2.0) – (1.3) (0.9) (0.8)
Amortization of unrecognized actuarial loss 14.8 11.4 6.2 1.8 1.9 1.2
Net periodic benefit cost $ 8.6 $ 9.3 $ 8.7 $15.5 $14.5 $14.9
The weighted average actuarial assumptions used to determine net pension expense for our defined benefit retirement planswere as follows:
U.S. and Puerto Rico Foreign
For the Years Ended December 31, 2013 2012 2011 2013 2012 2011
Discount rate 4.32% 4.97% 5.82% 2.13% 2.58% 2.82%
Rate of compensation increase 3.29% 3.81% 3.81% 2.29% 2.77% 2.64%
Expected long-term rate of return on plan assets 7.75% 7.75% 7.75% 2.74% 3.51% 4.01%
The expected long-term rate of return on plan assets is based on the historical and estimated future rates of return on thedifferent asset classes held in the plans. The expected long-term rate of return is the weighted average of the target asset allocationof each individual asset class. We believe that historical asset results approximate expected market returns applicable to thefunding of a long-term benefit obligation.
Discount rates were determined for each of our defined benefit retirement plans at their measurement date to reflect the yieldof a portfolio of high quality bonds matched against the timing and amounts of projected future benefit payments.
56

ZIMMER HOLDINGS, INC. 2013 FORM 10-K ANNUAL REPORT
Notes to Consolidated Financial Statements (Continued)
Changes in projected benefit obligations and plan assets were (in millions):
U.S. and Puerto Rico Foreign
For the Years Ended December 31, 2013 2012 2013 2012
Projected benefit obligation – beginning of year $314.3 $290.0 $259.4 $235.1Service cost 11.9 11.4 16.1 15.0Interest cost 13.2 13.3 5.6 6.1Plan amendments – (17.1) 118.9 (3.7)Employee contributions – – 15.9 17.5Benefits paid (10.4) (7.0) (29.4) (21.3)Settlement – (1.1) – –Actuarial (gain) loss (12.3) 24.8 (17.7) 6.9Expenses paid – – (0.2) (0.2)Translation loss – – 2.9 4.0
Projected benefit obligation – end of year $316.7 $314.3 $371.5 $259.4
Plan assets at fair market value – beginning of year $363.0 $275.1 $231.6 $205.1Actual return on plan assets 25.2 40.7 9.7 11.4Employer contributions 20.8 54.2 15.0 15.5Employee contributions – – 15.9 17.5Plan amendments – – 126.7 –Benefits paid (10.4) (7.0) (29.4) (21.3)Expenses paid – – (0.2) (0.2)Translation gain – – 3.0 3.6
Plan assets at fair market value – end of year $398.6 $363.0 $372.3 $231.6
Funded status $ 81.9 $ 48.7 $ 0.8 $(27.8)
Amounts recognized in consolidated balance sheet:Prepaid pension $ 92.7 $ 61.9 $ 12.1 $ 7.5Short-term accrued benefit liability (0.7) (0.4) – –Long-term accrued benefit liability (10.1) (12.8) (11.3) (35.3)
Net amount recognized $ 81.9 $ 48.7 $ 0.8 $(27.8)
Amounts recognized in accumulated other comprehensive income:Unrecognized prior service cost $(12.0) $(14.5) $ (8.3) $ (9.6)Unrecognized actuarial loss 113.3 136.9 15.5 35.9
Total amount recognized $101.3 $122.4 $ 7.2 $ 26.3
We estimate the following amounts recorded as part of accumulated other comprehensive income will be recognized as part ofour net pension expense during 2014 (in millions):
U.S. and
Puerto Rico Foreign
Unrecognized prior service cost $(2.6) $(1.2)
Unrecognized actuarial loss 10.9 0.4
$ 8.3 $(0.8)
57

ZIMMER HOLDINGS, INC. 2013 FORM 10-K ANNUAL REPORT
Notes to Consolidated Financial Statements (Continued)
The weighted average actuarial assumptions used to determine the projected benefit obligation for our defined benefitretirement plans were as follows:
U.S. and Puerto Rico Foreign
For the Years Ended December 31, 2013 2012 2011 2013 2012 2011
Discount rate 4.98% 4.32% 5.05% 2.45% 2.15% 2.49%
Rate of compensation increase 3.29% 3.29% 3.81% 1.52% 2.75% 2.76%
Plans with projected benefit obligations in excess of plan assets were as follows (in millions):
U.S. and Puerto Rico Foreign
As of December 31, 2013 2012 2013 2012
Projected benefit obligation $10.8 $29.3 $318.1 $233.1
Plan assets at fair market value – 16.0 307.4 197.7
Total accumulated benefit obligations and plans with accumulated benefit obligations in excess of plan assets were as follows(in millions):
U.S. and Puerto Rico Foreign
As of December 31, 2013 2012 2013 2012
Total accumulated benefit obligations $273.8 $268.7 $362.1 $244.9
Plans with accumulated benefit obligations in excess of plan assets:
Accumulated benefit obligation 8.8 26.9 308.9 191.9
Plan assets at fair market value – 16.0 303.7 168.8
The benefits expected to be paid out in each of the nextfive years and for the five years combined thereafter are asfollows (in millions):
For the Years Ending December 31,U.S. and
Puerto Rico Foreign
2014 $ 11.5 $ 18.3
2015 11.6 19.4
2016 13.3 19.2
2017 14.7 19.3
2018 16.3 19.9
2019-2023 104.8 106.0
The U.S. and Puerto Rico defined benefit retirementplans’ overall investment strategy is to maximize total returnsby emphasizing long-term growth of capital while mitigatingrisk. We have established target ranges of assets held by theplans of 40 to 45 percent for equity securities, 30 to 35 percentfor debt securities and 20 to 25 percent in non-traditionalinvestments. The plans strive to have sufficiently diversifiedassets so that adverse or unexpected results from one assetclass will not have an unduly detrimental impact on the entireportfolio. We regularly review the investments in the plans andwe may rebalance them from time-to-time based upon thetarget asset allocation of the plans.
For the U.S. and Puerto Rico plans, we maintain aninvestment policy statement that guides the investmentallocation in the plans. The investment policy statementdescribes the target asset allocation positions described above.Our benefits committee, along with our investment advisor,monitor compliance with and administer the investment policystatement and the plans’ assets and oversee the generalinvestment strategy and objectives of the plans. Our benefitscommittee generally meets quarterly to review performanceand to ensure that the current investment allocation is withinthe parameters of the investment policy statement.
The investment strategies of foreign based plans varyaccording to the plan provisions and local laws. The majorityof the assets in foreign based plans are located in Switzerland-based plans. These assets are held in trusts and arecommingled with the assets of other Swiss companies withrepresentatives of all the companies making the investmentdecisions. The overall strategy is to maximize total returnswhile avoiding risk. The trustees of the assets have establishedtarget ranges of assets held by the plans of 30 to 50 percent indebt securities, 20 to 37 percent in equity securities, 15 to 24percent in real estate, 3 to 15 percent in cash funds and 0 to12 percent in other funds.
58

ZIMMER HOLDINGS, INC. 2013 FORM 10-K ANNUAL REPORT
Notes to Consolidated Financial Statements (Continued)
The fair value of our U.S. and Puerto Rico pension planassets by asset category was as follows (in millions):
As of December 31, 2013
Fair Value Measurements at Reporting Date Using:
Asset Category Total
Quoted Pricesin Active
Markets forIdentical
Assets(Level 1)
SignificantOther
ObservableInputs
(Level 2)
SignificantUnobservable
Inputs(Level 3)
Cash and cash equivalents $ 0.8 $0.8 $ – $–
Equity securities:
U.S. large-cap 79.6 – 79.6 –
U.S. small-cap 22.3 – 22.3 –
International 87.7 – 87.7 –
Real estate 43.4 – 43.4 –
Commodity-linked mutualfunds 42.1 – 42.1 –
Intermediate fixed incomesecurities 122.7 – 122.7 –
Total $398.6 $0.8 $397.8 $–
As of December 31, 2012
Fair Value Measurements at Reporting Date Using:
Asset Category Total
Quoted Pricesin Active
Markets forIdentical
Assets(Level 1)
SignificantOther
ObservableInputs
(Level 2)
SignificantUnobservable
Inputs(Level 3)
Cash and cash equivalents $ 3.2 $3.2 $ – $–
Equity securities:
U.S. large-cap 60.3 – 60.3 –
U.S. small-cap 22.1 – 22.1 –
International 87.5 – 87.5 –
Real estate 29.5 – 29.5 –
Commodity-linked mutualfunds 38.3 – 38.3 –
Intermediate fixed incomesecurities 122.1 – 122.1 –
Total $363.0 $3.2 $359.8 $–
The fair value of our foreign pension plan assets was asfollows (in millions):
As of December 31, 2013
Fair Value Measurements at Reporting Date Using:
Asset Category Total
Quoted Pricesin Active
Markets forIdentical
Assets(Level 1)
SignificantOther
ObservableInputs
(Level 2)
SignificantUnobservable
Inputs(Level 3)
Cash and cash equivalents $ 13.9 $ 13.9 $ – $ –Equity securities:
Energy 4.7 4.7 – –Materials 5.7 5.7 – –Industrials 7.6 7.6 – –Consumer discretionary 5.2 5.2 – –Consumer staples 6.8 6.8 – –Healthcare 9.7 9.7 – –Financials 15.8 15.8 – –Information technology 5.8 5.8 – –Telecommunication services 2.6 2.6 – –Utilities 3.4 3.4 – –Other 35.7 33.2 2.5 –
Fixed income securities:Government bonds 64.4 – 64.4 –Corporate bonds 65.9 – 65.9 –Asset-backed securities 24.0 – 24.0 –Other debt 2.8 – 2.8 –
Other types of investments:Mortgage loans 9.0 – 9.0 –Insurance contracts 6.4 – 6.4 –Other investments 14.7 – 14.7 –
Real estate 68.2 – – 68.2
Total $372.3 $114.4 $189.7 $68.2
As of December 31, 2012
Fair Value Measurements at Reporting Date Using:
Asset Category Total
Quoted Pricesin Active
Markets forIdentical
Assets(Level 1)
SignificantOther
ObservableInputs
(Level 2)
SignificantUnobservable
Inputs(Level 3)
Cash and cash equivalents $ 12.7 $12.7 $ – $ –Equity securities:
Energy 1.7 1.7 – –Materials 2.6 2.6 – –Industrials 4.1 4.1 – –Consumer discretionary 2.2 2.2 – –Consumer staples 3.0 3.0 – –Healthcare 4.9 4.9 – –Financials 7.3 7.3 – –Information technology 2.5 2.5 – –Telecommunication services 1.0 1.0 – –Utilities 1.6 1.6 – –Other 35.1 32.5 2.6 –
Fixed income securities:Government bonds 44.9 – 44.9 –Corporate bonds 37.9 – 37.9 –Asset-backed securities 13.2 – 13.2 –Other debt 1.0 – 1.0 –
Other types of investments:Mortgage loans 5.4 – 5.4 –Insurance contracts 5.9 – 5.9 –Other investments 7.5 – 7.5 –
Real estate 37.1 – – 37.1
Total $231.6 $76.1 $118.4 $37.1
59

ZIMMER HOLDINGS, INC. 2013 FORM 10-K ANNUAL REPORT
Notes to Consolidated Financial Statements (Continued)
As of December 31, 2013 and 2012, our defined benefitpension plans’ assets did not hold any direct investment inZimmer Holdings common stock.
Equity securities are valued using a market approach,based on quoted prices for the specific security fromtransactions in active exchange markets (Level 1), or in somecases where we are invested in mutual or collective funds,based upon the net asset value per unit of the fund which isdetermined from quoted market prices of the underlyingsecurities in the fund’s portfolio (Level 2). Fixed incomesecurities are valued using a market approach, based uponquoted prices for the specific security or from institutional bidevaluations. Some fixed income securities are in funds with anet asset value per unit which is determined using similartechniques for the underlying securities in the fund’s portfolio.Real estate is valued by discounting to present value the cashflows expected to be generated by the specific properties.
The following table provides a reconciliation of thebeginning and ending balances of our foreign pension planassets measured at fair value that used significantunobservable inputs (Level 3) (in millions):
December 31,
2013
Beginning Balance $37.1Gains on assets sold 0.1Change in fair value of assets 1.2Net purchases and sales 28.1Translation gain 1.7
Ending Balance $68.2
We expect that we will have no legally required minimumfunding requirements in 2014 for the qualified U.S. and PuertoRico defined benefit retirement plans. We expect to voluntarilycontribute approximately $2.0 million to these plans during2014. Contributions to foreign defined benefit plans areestimated to be approximately $14.0 million in 2014. We do notexpect the assets in any of our plans to be returned to us in thenext year.
Defined Contribution Plans
We also sponsor defined contribution plans forsubstantially all of the U.S. and Puerto Rico employees andcertain employees in other countries. The benefits offeredunder these plans are reflective of local customs and practicesin the countries concerned. We expensed $29.6 million, $26.5million and $25.7 million related to these plans for the yearsended December 31, 2013, 2012 and 2011, respectively.
15. INCOME TAXES
The components of earnings before income taxes and theincome taxes paid consisted of the following (in millions):
For the Years Ended December 31, 2013 2012 2011
United States operations $400.7 $409.9 $485.7
Foreign operations 580.4 580.2 493.2
Total $981.1 $990.1 $978.9
The provision for income taxes consisted of (in millions):
Current:
Federal $ 199.0 $179.8 $148.4
State 20.6 13.8 14.3
Foreign 128.5 108.4 75.9
348.1 302.0 238.6
Deferred:
Federal (87.7) (58.8) (2.6)
State (8.5) 0.7 (0.9)
Foreign (30.0) (6.7) (16.2)
(126.2) (64.8) (19.7)
Provision for income taxes $ 221.9 $237.2 $218.9
Income taxes paid $ 272.3 $227.6 $236.4
A reconciliation of the U.S. statutory income tax rate toour effective tax rate is as follows:
For the Years Ended December 31, 2013 2012 2011
U.S. statutory income tax rate 35.0% 35.0% 35.0%
State taxes, net of federal deduction 0.8 1.0 0.7
Tax impact of foreign operations,including foreign tax credits (12.2) (10.4) (11.0)
Tax impact of certain significanttransactions 1.6 (3.5) –
Tax benefit relating to U.S.manufacturer’s deduction andexport sales (1.8) (1.9) (1.6)
R&D credit (0.6) – (0.5)
Goodwill impairment – 3.4 –
Other (0.2) 0.4 (0.2)
Effective income tax rate 22.6% 24.0% 22.4%
Our operations in Puerto Rico, Switzerland and the Stateof Indiana benefit from various tax incentive grants. Unlessthese grants are extended, they will expire between fiscalyears 2014 and 2026.
Deferred income taxes reflect the net tax effects oftemporary differences between the carrying amounts of assetsand liabilities for financial reporting purposes and the amountsused for income tax purposes. Valuation allowances arerecorded to reduce deferred income tax assets when it is morelikely than not that an income tax benefit will not be realized.
60

ZIMMER HOLDINGS, INC. 2013 FORM 10-K ANNUAL REPORT
Notes to Consolidated Financial Statements (Continued)
The components of deferred taxes consisted of thefollowing (in millions):
As of December, 31 2013 2012
Deferred tax assets:
Inventory $ 271.1 $ 225.1
Net operating loss carryover 26.4 26.8
Tax credit carryover 187.1 16.4
Capital loss carryover 7.8 4.0
Accrued liabilities 72.0 67.0
Share-based compensation 74.6 106.3
Unremitted earnings of foreign subsidiaries 25.6 172.3
Other 11.2 42.3
Total deferred tax assets 675.8 660.2
Less: Valuation allowances (42.7) (41.3)
Total deferred tax assets after valuation 633.1 618.9
Deferred tax liabilities:
Fixed assets $ (97.7) $ (93.9)
Intangible assets (106.4) (140.6)
Other (1.2) (1.0)
Total deferred tax liabilities (205.3) (235.5)
Total net deferred tax assets $ 427.8 $ 383.4
The net operating loss carryovers are available to reducefuture federal, state and foreign taxable earnings. AtDecember 31, 2013, these net operating loss carryoversgenerally expire within a period of 1 to 20 years. Valuationallowances for net operating loss carryovers have beenestablished in the amount of $17.3 million and $17.0 million atDecember 31, 2013 and 2012, respectively. The tax creditcarryovers are available to offset future federal, state andforeign tax liabilities. At December 31, 2013, these tax creditcarryovers generally expire within a period of 1 to 10 years. Wehave established valuation allowances for certain tax creditcarryovers in the amount of $14.9 million and $14.2 million atDecember 31, 2013 and 2012, respectively. The capital losscarryover is also available to reduce future federal capital gains.At December 31, 2013 these capital loss carryovers generallyexpire within a period of 4 to 5 years. We have establishedvaluation allowances for certain capital loss carryovers in theamount of $7.8 million and $4.0 million at December 31, 2013and 2012, respectively. The remaining valuation allowances of$2.7 million and $6.1 million at December 31, 2013 and 2012,respectively, relate primarily to potential capital losses.
At December 31, 2013, we had an aggregate ofapproximately $3,354 million of unremitted earnings of foreignsubsidiaries that have been, or are intended to be, indefinitelyreinvested for continued use in foreign operations. If the totalundistributed earnings of foreign subsidiaries were remitted, asignificant amount of the additional tax would be offset by theallowable foreign tax credits. It is not practical for us todetermine the additional tax related to remitting these earnings.
The following is a tabular reconciliation of the totalamounts of unrecognized tax benefits (in millions):
For the Years Ended December 31, 2013 2012 2011
Balance at January 1 $285.5 $158.4 $168.0
Increases related to prior periods 16.5 118.7 11.4
Decreases related to prior periods (17.3) (8.9) (49.0)
Increases related to current period 22.5 19.1 34.4
Decreases related to settlements withtaxing authorities (2.9) (0.6) (4.8)
Decreases related to lapse of statute oflimitations – (1.2) (1.6)
Balance at December 31 $304.3 $285.5 $158.4
Amounts impacting effective tax rate, ifrecognized balance at December 31 $186.3 $159.0 $132.7
We recognize accrued interest and penalties, related tounrecognized tax benefits, as income tax expense. During2013, we accrued interest and penalties of $8.2 million, and asof December 31, 2013, had recognized a liability for interestand penalties of $42.1 million.
During 2012, we accrued interest and penalties of $23.2million, and as of December 31, 2012, had recognized a liabilityfor interest and penalties of $33.9 million. We decreasedinterest and penalties by $12.1 million during 2011, and as ofDecember 31, 2011, had recognized a liability for interest andpenalties of $10.7 million.
We operate on a global basis and are subject to numerousand complex tax laws and regulations. Our income tax filingsare regularly under audit in multiple federal, state and foreignjurisdictions. Income tax audits may require an extendedperiod of time to reach resolution and may result in significantincome tax adjustments when interpretation of tax laws orallocation of company profits is disputed. The amount ofunrecognized tax benefits may change within the next twelvemonths between $0 and $60 million due to changes in auditstatus, expiration of statutes of limitations, settlements of taxassessments and other events which could impact ourdetermination of unrecognized tax benefits.
During the second quarter of 2011, the IRS concludedtheir examination of our U.S. federal returns for years 2005through 2007 and during the fourth quarter of 2013, the IRSconcluded their examination of our U.S. federal returns foryears 2008 through 2009. For years 2006 through 2009, the IRShas proposed adjustments reallocating profits between certainof our U.S. and foreign subsidiaries. We have disputed theseproposed adjustments and continue to pursue resolution withthe IRS. Although the ultimate timing for resolution of thedisputed tax issues is uncertain, we anticipate that within thenext twelve months we may settle certain tax matters with theIRS, and pay amounts for other unresolved tax matters inorder to limit the potential impact of IRS interest charges.Final resolution of these matters could have a material impacton our income tax expense, results of operations, and cashflows for future periods.
61

ZIMMER HOLDINGS, INC. 2013 FORM 10-K ANNUAL REPORT
Notes to Consolidated Financial Statements (Continued)
State income tax returns are generally subject toexamination for a period of 3 to 5 years after filing of therespective return. The state impact of any federal changesgenerally remains subject to examination by various states fora period of up to one year after formal notification to thestates. We have various state income tax returns in the processof examination, administrative appeals or litigation.
Our tax returns are currently under examination invarious foreign jurisdictions. Foreign jurisdictions havestatutes of limitations generally ranging from 3 to 5 years.Years still open to examination by foreign tax authorities inmajor jurisdictions include: Australia (2009 onward), Canada(2007 onward), France (2011 onward), Germany (2009onward), Ireland (2009 onward), Italy (2010 onward), Japan(2010 onward), Korea (2008 onward), Puerto Rico (2008onward), Switzerland (2012 onward), and the United Kingdom(2012 onward).
16. CAPITAL STOCK AND EARNINGS PER SHARE
We are authorized to issue 250 million shares of preferredstock, none of which were issued or outstanding as ofDecember 31, 2013.
The numerator for both basic and diluted earnings pershare is net earnings available to common stockholders. Thedenominator for basic earnings per share is the weightedaverage number of common shares outstanding during theperiod. The denominator for diluted earnings per share isweighted average shares outstanding adjusted for the effect ofdilutive stock options and other equity awards. The following isa reconciliation of weighted average shares for the basic anddiluted share computations (in millions):
For the Years Ended December 31, 2013 2012 2011
Weighted average shares outstanding for basicnet earnings per share 169.6 174.9 187.6
Effect of dilutive stock options and otherequity awards 2.2 1.1 1.1
Weighted average shares outstanding fordiluted net earnings per share 171.8 176.0 188.7
For the year ended December 31, 2013, an average of3.1 million options to purchase shares of common stock werenot included in the computation of diluted earnings per shareas the exercise prices of these options were greater than theaverage market price of the common stock. For the yearsended December 31, 2012 and 2011, an average of 11.9 millionand 13.2 million options, respectively, were not included.
During 2013, we repurchased 9.1 million shares of ourcommon stock at an average price of $78.88 per share for atotal cash outlay of $719.0 million, including commissions.Effective January 1, 2014, we have a new share repurchaseprogram that authorizes purchases of up to $1.0 billion with noexpiration date. No further purchases will be made under theprevious share repurchase program.
17. SEGMENT DATA
We design, develop, manufacture and market orthopaedicreconstructive implants, biologics, dental implants, spinalimplants, trauma products and related surgical products whichinclude surgical supplies and instruments designed to aid insurgical procedures and post-operation rehabilitation. We alsoprovide other healthcare-related services. We manageoperations through three major geographic segments – theAmericas, which is comprised principally of the U.S. andincludes other North, Central and South American markets;Europe, which is comprised principally of Europe and includesthe Middle East and African markets; and Asia Pacific, which iscomprised primarily of Japan and includes other Asian andPacific markets. This structure is the basis for our reportablesegment information discussed below. Management evaluatesreportable segment performance based upon segmentoperating profit exclusive of operating expenses pertaining toshare-based payment expense, inventory step-up and certainother inventory and manufacturing related charges, “Certainclaims,” goodwill impairment, “Special items,” and globaloperations and corporate functions. Global operations andcorporate functions include research, developmentengineering, medical education, brand management, corporatelegal, finance, and human resource functions, U.S., Puerto Ricoand Ireland-based manufacturing operations and logistics andintangible asset amortization resulting from businesscombination accounting. Intercompany transactions have beeneliminated from segment operating profit. Managementreviews accounts receivable, inventory, property, plant andequipment, goodwill and intangible assets by reportablesegment exclusive of U.S., Puerto Rico and Ireland-basedmanufacturing operations and logistics and corporate assets.
62

ZIMMER HOLDINGS, INC. 2013 FORM 10-K ANNUAL REPORT
Notes to Consolidated Financial Statements (Continued)
Net sales and other information by segment is as follows (in millions):
Americas Europe
Asia
Pacific
Global
Operations
and
Corporate
Functions Total
As of and for the Year Ended December 31, 2013Net sales $2,619.8 $1,212.6 $791.0 $ – $4,623.4Depreciation and amortization 70.9 72.6 30.7 184.3 358.5Segment operating profit 1,302.6 359.7 342.3 (648.8) 1,355.8
Share-based payment expense (48.5)Inventory step-up (8.0)Certain claims (47.0)Special items (216.7)
Operating profit 1,035.6Long-lived assets 810.8 306.3 107.6 – 1,224.7Total assets 2,814.9 2,343.8 541.9 3,880.0 9,580.6Additions to instruments 0.2 14.8 6.5 171.4 192.9Additions to other property, plant and equipment 9.0 10.3 7.6 73.1 100.0
As of and for the Year Ended December 31, 2012Net sales $2,476.3 $1,177.4 $818.0 $ – $4,471.7Depreciation and amortization 73.7 73.6 36.3 179.5 363.1Segment operating profit 1,256.3 369.1 311.1 (562.9) 1,373.6
Share-based payment expense (55.0)Inventory step-up (4.8)Certain claims (15.0)Goodwill impairment (96.0)Special items (155.4)
Operating profit 1,047.4Long-lived assets 776.0 326.1 108.6 – 1,210.7Total assets 2,690.6 2,308.0 578.3 3,435.5 9,012.4Additions to instruments – 14.0 7.1 127.8 148.9Additions to other property, plant and equipment 0.7 21.9 6.4 85.7 114.7
As of and for the Year Ended December 31, 2011Net sales $2,440.8 $1,214.5 $796.5 $ – $4,451.8Depreciation and amortization 81.0 74.9 36.3 167.7 359.9Segment operating profit 1,220.4 411.5 290.6 (593.5) 1,329.0
Share-based payment expense (60.5)Inventory step-up (11.4)Certain claims (157.8)Special items (75.2)
Operating profit 1,024.1Long-lived assets 769.0 330.6 107.7 – 1,207.3Total assets 2,571.6 2,345.5 602.4 2,995.8 8,515.3Additions to instruments – 15.2 7.7 132.5 155.4Additions to other property, plant and equipment 1.3 23.8 4.7 84.0 113.8
63

ZIMMER HOLDINGS, INC. 2013 FORM 10-K ANNUAL REPORT
Notes to Consolidated Financial Statements (Continued)
The Americas long-lived tangible assets are locatedprimarily in the U.S. $211.6 million of Europe long-livedtangible assets as of December 31, 2013 are located inSwitzerland.
For segment reporting purposes, deployed instrumentsare included in the measurement of reportable segment assetswhile undeployed instruments at U.S., Puerto Rico and Ireland-based manufacturing operations and logistics are included inglobal operations and corporate functions. The majority ofinstruments are purchased by U.S., Puerto Rico and Ireland-based manufacturing operations and logistics and are deployedto the reportable segments as needed for the business.Therefore, the reportable segment assets include deployedinstruments even though that reportable segment may notreport the instrument addition.
U.S. sales were $2,418.2 million, $2,280.7 million and$2,263.7 million for the years ended December 31, 2013, 2012and 2011, respectively. Sales within any other individualcountry were less than 10 percent of our consolidated sales.Sales are attributable to a country based upon the customer’scountry of domicile.
Beginning in 2013, our Knees product category net salesinclude certain early intervention products that are primarilyused in knee procedures. In 2012 and 2011, these productswere included in the Surgical and other product category. Netsales in the 2012 and 2011 periods related to these productshave been reclassified to conform to the 2013 presentation.Net sales by product category are as follows (in millions):
For the Years Ended December 31, 2013 2012 2011
Reconstructive
Knees $1,909.9 $1,833.8 $1,835.9
Hips 1,330.5 1,342.0 1,355.6
Extremities 193.8 173.8 163.4
3,434.2 3,349.6 3,354.9
Dental 239.3 237.7 248.1
Trauma 315.6 307.9 285.8
Spine 202.3 208.9 225.0
Surgical and other 432.0 367.6 338.0
Total $4,623.4 $4,471.7 $4,451.8
18. LEASES
Total rent expense for the years ended December 31,2013, 2012 and 2011 aggregated $49.2 million, $46.3 millionand $47.0 million, respectively.
Future minimum rental commitments under non-cancelable operating leases in effect as of December 31, 2013were (in millions):
For the Years Ending December 31,
2014 $47.6
2015 39.2
2016 27.7
2017 20.4
2018 16.0
Thereafter 41.2
19. COMMITMENTS AND CONTINGENCIES
Product Liability-Related Claims
We are subject to product liability claims arising in theordinary course of our business. We establish standardaccruals for product liability claims in conjunction with outsidecounsel based on current information and historical settlementinformation for open claims, related legal fees and claimsincurred but not reported. These standard product liabilityaccruals are recognized in selling, general and administrativeexpense. We may also establish provisions for certain productliability claims outside of the standard accruals that arerecorded separately on our statement of earnings, such as theprovision for claims related to the Durom Cup discussedbelow. We maintain insurance, subject to self-insured retentionrequirements, for losses from these and other claims.
On July 22, 2008, we temporarily suspended marketingand distribution of the Durom Cup in the U.S. Subsequently, anumber of product liability lawsuits and other claims havebeen asserted against us. We have settled some of these claimsand the others are still pending. Additional claims may beasserted in the future.
Initially, we estimated that any revision surgeries requiredwould manifest themselves within two years of the originalsurgery. In the second quarter of 2010, based upon morerecent claims information available, we revised our estimate toinclude all claims for revisions of original surgeries performedbefore July 22, 2008 (i.e., before our temporary suspension) ona worldwide basis, regardless of the amount of time betweenthe revision surgery and the original surgery. In the fourthquarter of 2011, as additional claims information becameavailable, we revised our estimates and methodology again toconsolidate all estimated liabilities associated with Durom
Cup-related claims regardless of whether the original surgeryoccurred before or after our temporary sales suspension. Werecognized estimated claims that met the parameters noted inthis paragraph during that time period as “Certain claims” on
64

ZIMMER HOLDINGS, INC. 2013 FORM 10-K ANNUAL REPORT
Notes to Consolidated Financial Statements (Continued)
our statement of earnings. We recognized estimated claimsoutside these parameters as part of selling, general andadministrative expense. The following table shows the line ofour statement of earnings and the period in which Durom
Cup-related claims were recognized:
For the Years Ended December 31, 2013 2012 2011 2010 2009 2008 Total
Certain claims $47.0 $15.0 $157.8 $75.0 $35.0 $69.0 $398.8
Selling, general andadministrative – – 4.2 15.4 24.6 7.2 51.4
Total $47.0 $15.0 $162.0 $90.4 $59.6 $76.2 $450.2
As noted above, we maintain insurance for productliability claims, subject to self-insurance retentionrequirements. In 2008, we notified our insurance carriers ofpotential claims related to the Durom Cup. Based upon ourmost recent estimates for liabilities associated with the Durom
Cup, as detailed above, we believe we may exhaust our self-insured retention under our insurance program. In this event,we would have a claim for insurance proceeds for ultimatelosses which exceed the self-insured retention amount, subjectto a 20 percent co-payment requirement and a cap. We believeour contracts with the insurance carriers are enforceable forthese claims and therefore we believe it is highly probable thatwe would recover some amount from our insurance carriers ifour ultimate losses exceed our self-insured retention.Accordingly, we have recognized a $218.0 million receivable in“other assets” on our consolidated balance sheet that reduced“Certain claims” expense for estimated insurance recoveries.As is customary in this process, our insurance carriers havereserved all rights under their respective policies and couldstill ultimately deny coverage for some or all of our insuranceclaims.
Our estimate, as of December 31, 2013, of the remainingliability for all Durom Cup-related claims is $379.0 million, ofwhich $50.0 million is classified as short-term in “Other currentliabilities” and $329.0 million is classified as long-term in“Other long-term liabilities” on our consolidated balance sheet.We expect to pay the majority of the Durom Cup-relatedclaims within the next five years.
Our understanding of clinical outcomes with the Durom
Cup and other large diameter hip cups continues to evolve. Werely on significant estimates in determining the provisions forDurom Cup-related claims, including the number of claimsthat we will receive and the average amount we will pay perclaim. The actual number of claims that we receive and theamount we pay per claim may differ from our estimates. Sinceour understanding of the clinical outcomes is still evolving, wecannot reasonably estimate the possible loss or range of lossthat may result from Durom Cup-related claims in excess ofthe losses we have accrued.
On August 20, 2008, Margo and Daniel Polett filed anaction against us and an unrelated third party, PublicCommunications, Inc. (PCI), in the Court of Common Pleas,Philadelphia, Pennsylvania seeking an unspecified amount of
damages for injuries and loss of consortium allegedly sufferedby Mrs. Polett and her spouse, respectively. The complaintalleged that defendants were negligent in connection withMrs. Polett’s participation in a promotional video featuring oneof our knee products. The case was tried in November 2010and the jury returned a verdict in favor of plaintiffs. The juryawarded $27.6 million in compensatory damages andapportioned fault 30 percent to plaintiffs, 34 percent to us and36 percent to PCI. Under applicable law, we may be liable forany portion of the damages apportioned to PCI that it does notpay. On December 2, 2010, we and PCI filed a Motion for Post-Trial Relief seeking a judgment notwithstanding the verdict, anew trial or a remittitur. On June 10, 2011, the trial courtentered an order denying our Motion for Post-Trial Relief andaffirming the jury verdict in full and entered judgment for$20.3 million against us and PCI. On June 29, 2011, we filed aNotice of Appeal to the Superior Court of Pennsylvania andposted a bond for the verdict amount plus interest. Oralargument before the appellate court in Philadelphia,Pennsylvania was held as scheduled on March 13, 2012. OnMarch 1, 2013, the Superior Court of Pennsylvania vacated the$27.6 million judgment and remanded the case for a new trial.On March 15, 2013, plaintiffs filed a motion for re-argument en
banc, and on March 28, 2013, we filed our response inopposition. On May 9, 2013, the Superior Court ofPennsylvania granted plaintiffs’ motion for re-argument en
banc. Oral argument (re-argument en banc) before theSuperior Court of Pennsylvania was held on October 16, 2013.On December 20, 2013, the Court issued its opinion againvacating the trial court judgment and remanding the case for anew trial. On January 21, 2014, plaintiffs filed a petition forallowance of appeal in the Supreme Court of Pennsylvania, andon February 4, 2014, we filed our response in opposition.Although we are defending this lawsuit vigorously, its ultimateresolution is uncertain.
Following a wide-spread advertising campaign conductedby certain law firms beginning in 2010, a number of productliability lawsuits have been filed against us in variousjurisdictions. The plaintiffs seek damages for personal injury,alleging that certain products within the NexGen Knee Systemsuffer from defects that cause them to loosen prematurely. Themajority of the cases are currently pending in a federalMultidistrict Litigation in the Northern District of Illinois.Other cases are pending in other state and federal courts, andadditional lawsuits may be filed. As of December 31, 2013,discovery in these lawsuits was underway and no trial dateshad been set. We have not accrued an estimated loss relatingto these lawsuits because we believe the plaintiffs’ allegationsare not consistent with the record of clinical success for theseproducts. As a result, we do not believe that it is probable thatwe have incurred a liability, and we cannot reasonably estimateany loss that might eventually be incurred. Although we arevigorously defending these lawsuits, their ultimate resolution isuncertain.
65

ZIMMER HOLDINGS, INC. 2013 FORM 10-K ANNUAL REPORT
Notes to Consolidated Financial Statements (Continued)
Intellectual Property-Related Claims
On December 10, 2010, Stryker Corporation and relatedentities (Stryker) filed suit against us in the U.S. District Courtfor the Western District of Michigan, alleging that certain ofour Pulsavac Plus Wound Debridement Products infringethree U.S. patents assigned to Stryker. The case was triedbeginning on January 15, 2013, and on February 5, 2013, thejury found that we infringed certain claims of the subjectpatents. The jury awarded $70.0 million in monetary damagesfor lost profits. The jury also found that we willfully infringedthe subject patents. We filed multiple post-trial motions,including a motion seeking a new trial. On August 7, 2013, thetrial court issued a ruling denying all of our motions andawarded treble damages and attorneys’ fees to Stryker. Wefiled a notice of appeal to the Court of Appeals for the FederalCircuit to seek reversal of both the jury’s verdict and the trialcourt’s rulings on our post-trial motions. That appeal ispending. We have not accrued an estimated loss related to thismatter in our consolidated statement of earnings for thequarter ended December 31, 2013 or any prior period becausewe do not believe that it is probable that we have incurred aliability. Although we believe we have strong grounds toreverse the trial court’s judgment, the ultimate resolution ofthis matter is uncertain. In the future we could be required torecord a charge of up to $210.0 million plus interest and
attorneys’ fees that could have a material adverse effect on ourresults of operations.
Regulatory Matters
In September 2012, we received a warning letter from theU.S. Food and Drug Administration (FDA) citing concernsrelating to certain manufacturing and validation processespertaining to Trilogy® Acetabular System productsmanufactured at our Ponce, Puerto Rico manufacturingfacility. We have provided detailed responses to the FDA as toour corrective actions and will continue to work expeditiouslyto address the issues identified by the FDA during inspectionsin Ponce. As of December 31, 2013, the warning letter remainspending. Until the violations are corrected, we may be subjectto additional regulatory action by the FDA, including seizure,injunction and/or civil monetary penalties. Additionally,requests for Certificates to Foreign Governments related toproducts manufactured at the Ponce facility may not begranted and premarket approval applications for Class IIIdevices to which the quality system regulation deviations arereasonably related will not be approved until the violationshave been corrected. In addition to responding to the warningletter described above, we are in the process of addressingvarious FDA Form 483 inspectional observations at certain ofour manufacturing facilities. The ultimate outcome of thesematters is presently uncertain.
20. QUARTERLY FINANCIAL INFORMATION (UNAUDITED)
(in millions, except per share data)
2013 Quarter Ended 2012 Quarter Ended
Mar Jun Sep Dec Mar Jun Sep Dec
Net sales $1,138.9 $1,169.5 $1,074.3 $1,240.7 $1,140.7 $1,125.0 $1,025.5 $1,180.5
Gross profit 846.0 845.9 745.5 899.9 852.0 843.1 769.8 881.6
Net earnings of Zimmer Holdings, Inc. 218.6 152.1 154.4 235.9 209.6 214.5 178.1 152.8
Earnings per common share
Basic 1.30 0.90 0.91 1.38 1.18 1.22 1.02 0.88
Diluted 1.28 0.89 0.90 1.36 1.17 1.22 1.02 0.88
The quarter ending December 31, 2012 included a $96.0 million goodwill impairment charge.
66

ZIMMER HOLDINGS, INC. 2013 FORM 10-K ANNUAL REPORT
ITEM 9. Changes in and Disagreements with Accountants on Accounting and Financial Disclosure
None.
ITEM 9A. Controls and Procedures
We maintain disclosure controls and procedures (asdefined in Rule 13a-15(e) under the Exchange Act) that aredesigned to provide reasonable assurance that informationrequired to be disclosed in the reports that we file or submitunder the Exchange Act is recorded, processed, summarizedand reported within the time periods specified in the SEC’srules and forms, and that such information is accumulated andcommunicated to our management, including our ChiefExecutive Officer and Chief Financial Officer, as appropriateto allow timely decisions regarding required disclosures.Because of inherent limitations, disclosure controls andprocedures, no matter how well designed and operated, canprovide only reasonable, and not absolute, assurance that theobjectives of disclosure controls and procedures are met.
Our management, with the participation of our ChiefExecutive Officer and Chief Financial Officer, evaluated theeffectiveness of the design and operation of our disclosurecontrols and procedures. Based on that evaluation, our ChiefExecutive Officer and Chief Financial Officer concluded that,as of the end of the period covered by this report, ourdisclosure controls and procedures are effective at areasonable assurance level.
During 2013, we transitioned work to a third-party serviceprovider to outsource certain finance functions that
historically had been performed in multiple countriesthroughout Europe and in the U.S. We also centralized otherfinance functions that historically had been performed in adecentralized manner. This outsourcing and centralization arepart of our ongoing operational excellence initiatives.
Also in 2013, we implemented and began to use newsoftware to consolidate our worldwide financial information.This software implementation is part of our operationalexcellence initiatives in order to improve the overall efficiencyand effectiveness of our financial reporting process.
In connection with the outsourcing, centralization offinance functions, and software implementation and theresulting business process changes, we continue to enhancethe design and documentation of our internal controlprocesses to ensure suitable controls over our financialreporting. There were no other changes in our internal controlover financial reporting (as defined in Rule 13a-15(f) of theExchange Act) that occurred during the quarter endedDecember 31, 2013 that have materially affected, or arereasonably likely to materially affect, our internal control overfinancial reporting. Management’s report on internal controlover financial reporting appears in this report at theconclusion of Part II, Item 7A.
ITEM 9B. Other Information
During the fourth quarter of 2013, the Audit Committee ofour Board of Directors approved the engagement ofPricewaterhouseCoopers LLP, our independent registeredpublic accounting firm, to perform certain non-audit servicesrelated to certain tax matters. This disclosure is madepursuant to Section 10A(i)(2) of the Exchange Act.
67

ZIMMER HOLDINGS, INC. 2013 FORM 10-K ANNUAL REPORT
PART III
ITEM 10. Directors, Executive Officers and Corporate Governance
Information required by this item is incorporated by reference from our definitive Proxy Statement for the annual meeting ofstockholders to be held on May 6, 2014 (the “2014 Proxy Statement”).
We have adopted the Zimmer Code of Ethics for Chief Executive Officer and Senior Financial Officers (the “finance code ofethics”), a code of ethics that applies to our Chief Executive Officer, Chief Financial Officer, Chief Accounting Officer andCorporate Controller, and other finance organization senior employees. The finance code of ethics is publicly available in theInvestor Relations section of our website, which may be accessed from our homepage at www.zimmer.com or directly athttp://investor.zimmer.com. If we make any substantive amendments to the finance code of ethics or grant any waiver, includingany implicit waiver, from a provision of the code to our Chief Executive Officer, Chief Financial Officer, or Chief Accounting Officerand Corporate Controller, we will disclose the nature of that amendment in the Investor Relations section of our website.
ITEM 11. Executive Compensation
Information required by this item is incorporated by reference from our 2014 Proxy Statement.
ITEM 12. Security Ownership of Certain Beneficial Owners and Management and Related Stockholder Matters
Information required by this item is incorporated by reference from our 2014 Proxy Statement.
ITEM 13. Certain Relationships and Related Transactions and Director Independence
Information required by this item is incorporated by reference from our 2014 Proxy Statement.
ITEM 14. Principal Accounting Fees and Services
Information required by this item is incorporated by reference from of our 2014 Proxy Statement.
68

ZIMMER HOLDINGS, INC. 2013 FORM 10-K ANNUAL REPORT
PART IV
ITEM 15. Exhibits, Financial Statement Schedules
(a) 1. Financial Statements
The following consolidated financial statements of Zimmer Holdings, Inc. and its subsidiaries are set forth in Part II,Item 8.
Report of Independent Registered Public Accounting Firm
Consolidated Statements of Earnings for the Years Ended December 31, 2013, 2012 and 2011
Consolidated Statements of Comprehensive Income for the Years Ended December 31, 2013, 2012 and 2011
Consolidated Balance Sheets as of December 31, 2013 and 2012
Consolidated Statements of Stockholders’ Equity for the Years Ended December 31, 2013, 2012 and 2011
Consolidated Statements of Cash Flows for the Years Ended December 31, 2013, 2012 and 2011
Notes to Consolidated Financial Statements
2. Financial Statement Schedules
Schedule II. Valuation and Qualifying Accounts
Other financial statement schedules are omitted because they are not applicable or the required information is shown inthe financial statements or the notes thereto.
3. Exhibits
A list of exhibits required to be filed as part of this report is set forth in the Index to Exhibits, which immediately precedessuch exhibits and is incorporated herein by reference.
69

ZIMMER HOLDINGS, INC. 2013 FORM 10-K ANNUAL REPORT
Signatures
Pursuant to the requirements of Section 13 or 15(d) of the Securities Exchange Act of 1934, the registrant has duly caused thisreport to be signed on its behalf by the undersigned, thereunto duly authorized.
ZIMMER HOLDINGS, INC.
By: /S/ DAVID C. DVORAK
David C. DvorakPresident and Chief Executive Officer
Dated: February 28, 2014
Pursuant to the requirements of the Securities Exchange Act of 1934, this report has been signed below by the following persons onbehalf of the registrant and in the capacities and on the dates indicated.
Signature Title Date
/s/ DAVID C. DVORAK
David C. Dvorak
President, Chief Executive Officer and Director (PrincipalExecutive Officer)
February 28, 2014
/s/ JAMES T. CRINES
James T. Crines
Executive Vice President, Finance and Chief Financial Officer(Principal Financial Officer)
February 28, 2014
/s/ DEREK M. DAVIS
Derek M. Davis
Vice President, Finance, and Corporate Controller and ChiefAccounting Officer (Principal Accounting Officer)
February 28, 2014
/s/ CHRISTOPHER B. BEGLEY
Christopher B. Begley
Director February 28, 2014
/s/ BETSY J. BERNARD
Betsy J. Bernard
Director February 28, 2014
/s/ PAUL M. BISARO
Paul M. Bisaro
Director February 28, 2014
/s/ GAIL K. BOUDREAUX
Gail K. Boudreaux
Director February 28, 2014
/s/ LARRY C. GLASSCOCK
Larry C. Glasscock
Director February 28, 2014
/s/ ROBERT A. HAGEMANN
Robert A. Hagemann
Director February 28, 2014
Arthur J. Higgins
Director February 28, 2014
/s/ JOHN L. MCGOLDRICK
John L. McGoldrick
Director February 28, 2014
/s/ CECIL B. PICKETT, PH.D.
Cecil B. Pickett, Ph.D.
Director February 28, 2014
70

ZIMMER HOLDINGS, INC. 2013 FORM 10-K ANNUAL REPORT
Index to Exhibits
Exhibit No Description
3.1 Restated Certificate of Incorporation of Zimmer Holdings, Inc. dated May 13, 2008 (incorporated by reference toExhibit 3.1 to the Registrant’s Quarterly Report on Form 10-Q filed August 5, 2008)
3.2 Restated By-Laws of Zimmer Holdings, Inc. effective December 13, 2013 (incorporated by reference to Exhibit 3.1 tothe Registrant’s Current Report on Form 8-K filed December 19, 2013)
4.1 Specimen Common Stock certificate (incorporated by reference to Exhibit 4.1 to the Registrant’s Quarterly Report onForm 10-Q filed November 6, 2012)
4.2 Indenture dated as of November 17, 2009 between Zimmer Holdings, Inc. and WellsFargo Bank, National Association, as Trustee (incorporated by reference to the form filed as Exhibit 4.8 to theRegistrant’s Registration Statement on Form S-3 filed November 12, 2009)
4.3 First Supplemental Indenture to the Indenture dated as of November 17, 2009 betweenZimmer Holdings, Inc. and Wells Fargo Bank, National Association, as Trustee (incorporated by reference toExhibit 4.2 to the Registrant’s Current Report on Form 8-K filed November 17, 2009)
4.4 Form of 4.625% Note due 2019 (incorporated by reference to Exhibit 4.3 above)
4.5 Form of 5.750% Note due 2039 (incorporated by reference to Exhibit 4.3 above)
4.6 Second Supplemental Indenture dated as of November 10, 2011, to the Indenture dated as of November 17, 2009between Zimmer Holdings, Inc. and Wells Fargo Bank, National Association, as Trustee (incorporated by reference toExhibit 4.1 to the Registrant’s Current Report on Form 8-K filed November 10, 2011)
4.7 Form of 1.400% Note due 2014 (incorporated by reference to Exhibit 4.6 above)
4.8 Form of 3.375% Note due 2021 (incorporated by reference to Exhibit 4.6 above)
10.1* Zimmer Holdings, Inc. 2001 Stock Incentive Plan (incorporated by reference to Appendix B to the Registrant’sdefinitive Proxy Statement on Schedule 14A filed March 24, 2003)
10.2* First Amendment to the Zimmer Holdings, Inc. 2001 Stock Incentive Plan (incorporated by reference to Exhibit 10.1to the Registrant’s Current Report on Form 8-K filed December 15, 2005)
10.3* Zimmer Holdings, Inc. 2006 Stock Incentive Plan, as amended (incorporated by reference to Exhibit 10.1 to theRegistrant’s Current Report on Form 8-K filed December 13, 2006)
10.4* Zimmer Holdings, Inc. Executive Performance Incentive Plan, as amended May 7, 2013 (incorporated by reference toExhibit 10.1 to the Registrant’s Current Report on Form 8-K filed May 13, 2013)
10.5* Restated Zimmer, Inc. Long-Term Disability Income Plan for Highly Compensated Employees (incorporated byreference to Exhibit 10.9 to the Registrant’s Annual Report on Form 10-K filed February 28, 2007)
10.6* Change in Control Severance Agreement with David C. Dvorak (incorporated by reference to Exhibit 10.10 to theRegistrant’s Annual Report on Form 10-K filed February 28, 2009)
10.7* Change in Control Severance Agreement with Katarzyna Mazur-Hofsaess (incorporated by reference to Exhibit 10.3 tothe Registrant’s Quarterly Report on Form 10-Q filed August 7, 2013)
10.8* Form of Change in Control Severance Agreement with James T. Crines (incorporated by reference to Exhibit 10.12 tothe Registrant’s Annual Report on Form 10-K filed February 28, 2009)
10.9* Form of Change in Control Severance Agreement with Chad F. Phipps (incorporated by reference to Exhibit 10.13 tothe Registrant’s Annual Report on Form 10-K filed February 28, 2009)
10.10* Form of Change in Control Severance Agreement with Joseph A. Cucolo (incorporated by reference to Exhibit 10.1 tothe Registrant’s Quarterly Report on Form 10-Q filed May 5, 2010)
10.11* Change in Control Severance Agreement with Stephen Hong Liang, Ooi (incorporated by reference to Exhibit 10.21 tothe Registrant’s Annual Report on Form 10-K filed March 12, 2003)
10.12* Change in Control Severance Agreement with Derek M. Davis (incorporated by reference to Exhibit 10.14 to theRegistrant’s Annual Report on Form 10-K filed February 28, 2009)
10.13* Restated Benefit Equalization Plan of Zimmer Holdings, Inc. and Its Subsidiary or Affiliated Corporations Participatingin the Zimmer Holdings, Inc. Savings and Investment Program (incorporated by reference to Exhibit 10.16 to theRegistrant’s Annual Report on Form 10-K filed February 28, 2009)
10.14* Restated Benefit Equalization Plan of Zimmer Holdings, Inc. and Its Subsidiary or Affiliated Corporations Participatingin the Zimmer Holdings, Inc. Retirement Income Plan or the Zimmer Puerto Rico Retirement Income Plan(incorporated by reference to Exhibit 10.17 to the Registrant’s Annual Report on Form 10-K filed February 28, 2009)
71

ZIMMER HOLDINGS, INC. 2013 FORM 10-K ANNUAL REPORT
Exhibit No Description
10.15* Form of Confidentiality, Non-Competition and Non-Solicitation Agreement with U.S.-Based Executive Officers(incorporated by reference to Exhibit 10.2 to the Registrant’s Quarterly Report on Form 10-Q filed November 6, 2012)
10.16* Non-Disclosure, Non-Competition and Non-Solicitation Employment Agreement with Stephen Hong Liang, Ooi(incorporated by reference to Exhibit 10.2 to the Registrant’s Current Report on Form 8-K filed March 27, 2006)
10.17* Confidentiality, Non-Competition and Non-Solicitation Agreement with Katarzyna Mazur-Hofsaess (incorporated byreference to Exhibit 10.4 to the Registrant’s Quarterly Report on Form 10-Q filed August 7, 2013)
10.18* Agreement by and between Bruno A. Melzi, Zimmer S.r.l. and Zimmer, Inc. dated December 12, 2012 (incorporated byreference to Exhibit 10.18 to the Registrant’s Annual Report on Form 10-K filed February 27, 2013)
10.19* Agreement by Private Deed between Zimmer S.r.l. and Bruno A. Melzi dated December 12, 2012 (incorporated byreference to Exhibit 10.19 to the Registrant’s Annual Report on Form 10-K filed February 27, 2013)
10.20* Form of Nonqualified Stock Option Award Letter under the Zimmer Holdings, Inc. 2001 Stock Incentive Plan(incorporated by reference to Exhibit 10.3 to the Registrant’s Current Report on Form 8-K filed January 11, 2006)
10.21* Form of Nonqualified Performance-Conditioned Stock Option Grant Award Letter under the Zimmer Holdings, Inc.2001 Stock Incentive Plan (incorporated by reference to Exhibit 10.1 to the Registrant’s Current Report on Form 8-Kfiled January 21, 2005)
10.22* Zimmer Holdings, Inc. Stock Plan for Non-Employee Directors, as amended (incorporated by reference to Appendix Cto the Registrant’s Definitive Proxy Statement filed March 20, 2009)
10.23* Form of Nonqualified Stock Option Award Letter under the Zimmer Holdings, Inc. Stock Plan for Non-EmployeeDirectors (incorporated by reference to Exhibit 10.2 to the Registrant’s Current Report on Form 8-K filed April 5,2005)
10.24* Form of Restricted Stock Unit Award Letter under the Zimmer Holdings, Inc. Stock Plan for Non-Employee Directors(incorporated by reference to Exhibit 10.1 to the Registrant’s Current Report on Form 8-K filed February 21, 2006)
10.25* Form of Nonqualified Stock Option Award Letter under the Zimmer Holdings, Inc. 2006 Stock Incentive Plan(incorporated by reference to Exhibit 10.2 to the Registrant’s Current Report on Form 8-K filed December 13, 2006)
10.26* Form of Nonqualified Stock Option Award Letter for Non-U.S. Employees under the Zimmer Holdings, Inc. 2006 StockIncentive Plan (incorporated by reference to Exhibit 10.3 to the Registrant’s Current Report on Form 8-K filedDecember 13, 2006)
10.27* Restated Zimmer Holdings, Inc. Deferred Compensation Plan for Non-Employee Directors (incorporated by referenceto Appendix D to the Registrant’s Definitive Proxy Statement filed March 20, 2009)
10.28* Zimmer Holdings, Inc. 2009 Stock Incentive Plan, as amended May 7, 2013 (incorporated by reference to Exhibit 10.2to the Registrant’s Current Report on Form 8-K filed May 13, 2013)
10.29* Form of Nonqualified Stock Option Award Letter under the Zimmer Holdings, Inc. 2009 Stock Incentive Plan(incorporated by reference to Exhibit 10.1 to the Registrant’s Quarterly Report on Form 10-Q filed May 5, 2011)
10.30* Form of Nonqualified Stock Option Award Letter for Non-U.S. Employees under the Zimmer Holdings, Inc. 2009 StockIncentive Plan (incorporated by reference to Exhibit 10.2 to the Registrant’s Quarterly Report on Form 10-Q filedMay 5, 2011)
10.31* Form of Performance-Based Restricted Stock Unit Award Letter (one-year performance period) under the ZimmerHoldings, Inc. 2009 Stock Incentive Plan (incorporated by reference to Exhibit 10.3 to the Registrant’s QuarterlyReport on Form 10-Q filed May 5, 2011)
10.32* Form of Performance-Based Restricted Stock Unit Award Letter for Non-U.S. Employees (one-year performanceperiod) under the Zimmer Holdings, Inc. 2009 Stock Incentive Plan (incorporated by reference to Exhibit 10.4 to theRegistrant’s Quarterly Report on Form 10-Q filed May 5, 2011)
10.33* Form of Restricted Stock Unit Award Letter (five-year vesting) under the Zimmer Holdings, Inc. 2009 Stock IncentivePlan (incorporated by reference to Exhibit 10.32 to the Registrant’s Annual Report on Form 10-K filed February 25,2010)
10.34* Form of Performance-Based Restricted Stock Unit Award Letter (three-year performance period) under the ZimmerHoldings, Inc. 2009 Stock Incentive Plan (incorporated by reference to Exhibit 10.34 to the Registrant’s AnnualReport on Form 10-K filed February 27, 2012)
10.35* Form of Indemnification Agreement with Non-Employee Directors and Officers (incorporated by reference toExhibit 10.1 to the Registrant’s Current Report on Form 8-K filed July 31, 2008)
72

ZIMMER HOLDINGS, INC. 2013 FORM 10-K ANNUAL REPORT
Exhibit No Description
10.36 $1,350,000,000 Credit Agreement dated as of May 9, 2012 (incorporated by reference to Exhibit 10.1 to theRegistrant’s Current Report on Form 8-K filed May 15, 2012)
10.37 Amendment No. 1 dated as of December 13, 2013 to the Credit Agreement dated as of May 9, 2012 (incorporated byreference to Exhibit 10.1 to the Registrant’s Current Report on Form 8-K filed on December 19, 2013)
10.38 Term Loan Agreement ¥11,700,000,000 dated as of May 24, 2012 (incorporated by reference to Exhibit 10.1 to theRegistrant’s Current Report on Form 8-K filed May 31, 2012)
10.39 Letter of Guarantee dated as of May 24, 2012 (incorporated by reference to Exhibit 10.2 to the Registrant’s CurrentReport on Form 8-K filed May 31, 2012)
21 List of Subsidiaries of Zimmer Holdings, Inc.
23 Consent of PricewaterhouseCoopers LLP
31.1 Certification pursuant to Rule 13a-14(a)/15d-14(a) of the Securities Exchange Act of 1934 of the Chief ExecutiveOfficer, as adopted pursuant to Section 302 of the Sarbanes-Oxley Act of 2002
31.2 Certification pursuant to Rule 13a-14(a)/15d-14(a) of the Securities Exchange Act of 1934 of the Chief FinancialOfficer, as adopted pursuant to Section 302 of the Sarbanes-Oxley Act of 2002
32 Certification pursuant to 18 U.S.C. Section 1350, as adopted pursuant to Section 906 of the Sarbanes-Oxley Act of2002
101.INS XBRL Instance Document
101.SCH XBRL Taxonomy Extension Schema Document
101.CAL XBRL Taxonomy Extension Calculation Linkbase Document
101.LAB XBRL Taxonomy Extension Label Linkbase Document
101.PRE XBRL Taxonomy Extension Presentation Linkbase Document
101.DEF XBRL Taxonomy Extension Definition Linkbase Document
* Management contract or compensatory plan or arrangement
73

Schedule II
Valuation and Qualifying Accounts
(in millions)
Description
Balance at
Beginning
of Period
Additions
Charged
(Credited)
to Expense
Deductions
to Reserve
Effects of
Foreign
Currency
Acquired
Allowances
Balance at
End of
Period
Allowance for Doubtful Accounts:
Year Ended December 31, 2011 $14.4 $ 4.5 $(1.7) $ – $ – $17.2
Year Ended December 31, 2012 17.2 7.1 (1.8) – 0.3 22.8
Year Ended December 31, 2013 22.8 1.9 (1.5) (0.5) – 22.7
Deferred Tax Asset Valuation Allowances:
Year End December 31, 2011 $39.9 $ 1.1 $(0.7) $ – $ – $40.3
Year End December 31, 2012 40.3 (0.9) (0.3) – 2.2 41.3
Year End December 31, 2013 41.3 1.5 (0.1) – – 42.7
74

ZIMMER HOLDINGS, INC. 2013 FORM 10-K ANNUAL REPORT
Reconciliations
Reconciliation of Operating Profit to Adjusted Operating Profit for the Years Ended December 31, 2013, 2012, 2011, 2010 and 2009 (in millions, unaudited)
For the Years Ended December 31,
2013 2012 2011 2010 2009
Operating Profit . . . . . . . . . . . . . . . . . . . . . . . . . . . . . . . . . . . . . . . . . . . . . . . . . . . . $1,035.6 $1,047.4 $1,024.1 $ 916.7 $1,018.8Inventory step-up and other inventory and manufacturing related charges . . . 70.5 4.8 11.4 1.4 12.5Certain claims . . . . . . . . . . . . . . . . . . . . . . . . . . . . . . . . . . . . . . . . . . . . . . . . . . . . . . 47.0 15.0 157.8 75.0 35.0Goodwill impairment . . . . . . . . . . . . . . . . . . . . . . . . . . . . . . . . . . . . . . . . . . . . . . . . — 96.0 — 204.0 73.0Special items . . . . . . . . . . . . . . . . . . . . . . . . . . . . . . . . . . . . . . . . . . . . . . . . . . . . . . 216.7 155.4 75.2 34.7 75.3Net curtailment and settlement . . . . . . . . . . . . . . . . . . . . . . . . . . . . . . . . . . . . . . . — — — — (32.1)
Adjusted Operating Profit . . . . . . . . . . . . . . . . . . . . . . . . . . . . . . . . . . . . . . . . . . . . $1,369.8 $1,318.6 $1,268.5 $1,231.8 $1,182.5
Reconciliation of Diluted EPS to Adjusted Diluted EPS for the Years Ended December 31, 2013, 2012, 2011, 2010 and 2009 (unaudited)
For the Years Ended December 31,
2013 2012 2011 2010 2009
Diluted EPS . . . . . . . . . . . . . . . . . . . . . . . . . . . . . . . . . . . . . . . . . . . . . . . . . . . . . . . . . . . . . . . . $ 4.43 $ 4.29 $ 4.03 $ 2.97 $ 3.32Inventory step-up and other inventory and manufacturing related charges . . . . . . . . . . . 0.41 0.03 0.06 0.01 0.06Certain claims . . . . . . . . . . . . . . . . . . . . . . . . . . . . . . . . . . . . . . . . . . . . . . . . . . . . . . . . . . . . . . 0.27 0.09 0.84 0.37 0.16Goodwill impairment . . . . . . . . . . . . . . . . . . . . . . . . . . . . . . . . . . . . . . . . . . . . . . . . . . . . . . . . — 0.54 — 1.01 0.34Special items . . . . . . . . . . . . . . . . . . . . . . . . . . . . . . . . . . . . . . . . . . . . . . . . . . . . . . . . . . . . . . . 1.26 0.88 0.40 0.17 0.35Net curtailment and settlement . . . . . . . . . . . . . . . . . . . . . . . . . . . . . . . . . . . . . . . . . . . . . . . — — — — (0.15)Taxes on above items and other certain tax adjustments* . . . . . . . . . . . . . . . . . . . . . . . . . . (0.62) (0.53) (0.53) (0.20) (0.14)
Adjusted Diluted EPS . . . . . . . . . . . . . . . . . . . . . . . . . . . . . . . . . . . . . . . . . . . . . . . . . . . . . . . . $ 5.75 $ 5.30 $ 4.80 $ 4.33 $ 3.94
* The tax effect is calculated based upon the statutory rates for the jurisdictions where the items were incurred.
Reconciliation of Sales Growth Rate to Constant Currency Sales Growth Rate for the Year Ended December 31, 2013 (unaudited)
For the Year Ended December 31, 2013
Reported
% Growth
Foreign
Exchange
Impact
Constant
Currency
% Growth
Geographic Segment
Americas . . . . . . . . . . . . . . . . . . . . . . . . . . . . . . . . . . . . . . . . . . . . . . . . . . . . . . . . . . . . . . . . . . . . . . . . . . . . . . . . . . . . 6% — 6%Europe . . . . . . . . . . . . . . . . . . . . . . . . . . . . . . . . . . . . . . . . . . . . . . . . . . . . . . . . . . . . . . . . . . . . . . . . . . . . . . . . . . . . . . 3 2 1Asia Pacific . . . . . . . . . . . . . . . . . . . . . . . . . . . . . . . . . . . . . . . . . . . . . . . . . . . . . . . . . . . . . . . . . . . . . . . . . . . . . . . . . . (3) (10) 7
Consolidated . . . . . . . . . . . . . . . . . . . . . . . . . . . . . . . . . . . . . . . . . . . . . . . . . . . . . . . . . . . . . . . . . . . . . . . . . . . . . . . 3 (2) 5Product Category
Reconstructive . . . . . . . . . . . . . . . . . . . . . . . . . . . . . . . . . . . . . . . . . . . . . . . . . . . . . . . . . . . . . . . . . . . . . . . . . . . . . . . 3 (1) 4Knees . . . . . . . . . . . . . . . . . . . . . . . . . . . . . . . . . . . . . . . . . . . . . . . . . . . . . . . . . . . . . . . . . . . . . . . . . . . . . . . . . . . . . 4 (1) 5Hips . . . . . . . . . . . . . . . . . . . . . . . . . . . . . . . . . . . . . . . . . . . . . . . . . . . . . . . . . . . . . . . . . . . . . . . . . . . . . . . . . . . . . . (1) (2) 1Extremities . . . . . . . . . . . . . . . . . . . . . . . . . . . . . . . . . . . . . . . . . . . . . . . . . . . . . . . . . . . . . . . . . . . . . . . . . . . . . . . . 11 (1) 12
Dental . . . . . . . . . . . . . . . . . . . . . . . . . . . . . . . . . . . . . . . . . . . . . . . . . . . . . . . . . . . . . . . . . . . . . . . . . . . . . . . . . . . . . . 1 1 —Trauma . . . . . . . . . . . . . . . . . . . . . . . . . . . . . . . . . . . . . . . . . . . . . . . . . . . . . . . . . . . . . . . . . . . . . . . . . . . . . . . . . . . . . 2 (3) 5Spine . . . . . . . . . . . . . . . . . . . . . . . . . . . . . . . . . . . . . . . . . . . . . . . . . . . . . . . . . . . . . . . . . . . . . . . . . . . . . . . . . . . . . . . (3) — (3)Surgical and Other . . . . . . . . . . . . . . . . . . . . . . . . . . . . . . . . . . . . . . . . . . . . . . . . . . . . . . . . . . . . . . . . . . . . . . . . . . . . 18 (3) 21
Consolidated . . . . . . . . . . . . . . . . . . . . . . . . . . . . . . . . . . . . . . . . . . . . . . . . . . . . . . . . . . . . . . . . . . . . . . . . . . . . . . . 3 (2) 5
75

[THIS PAGE INTENTIONALLY LEFT BLANK]

Corporate Information (As of March 17, 2014)
Board of Directors
Larry C. Glasscock Chairman of the Board, Zimmer Holdings, Inc. Retired Chairman, President and Chief Executive Officer, WellPoint, Inc.
Christopher B. Begley Retired Executive Chairman and Chief Executive Officer, Hospira, Inc.
Betsy J. Bernard Retired President, AT&T Corp.
Paul M. Bisaro Chairman, President and Chief Executive Officer, Actavis PLC
Gail K. Boudreaux Chief Executive Officer, UnitedHealthcare Executive Vice President, UnitedHealth Group
David C. Dvorak President and Chief Executive Officer, Zimmer Holdings, Inc.
Robert A. Hagemann Retired Senior Vice President and Chief Financial Officer, Quest Diagnostics Incorporated
Arthur J. Higgins Consultant, Blackstone Healthcare Partners
John L. Mc Goldrick Special Advisor, International AIDS Vaccine Initiative
Cecil B. Pickett, Ph.D. Retired President, Research and Development, Biogen Idec Inc.
Management Team
David C. Dvorak President and Chief Executive Officer
Audrey M. Beckman Senior Vice President, Strategic Quality Initiatives
James T. Crines Executive Vice President, Finance and Chief Financial Officer
Joseph A. Cucolo President, Americas
Derek M. Davis Vice President, Finance and Corporate Controller and Chief Accounting Officer
William P. Fisher Senior Vice President, Global Human Resources
Katarzyna Mazur-Hofsaess, M.D., Ph.D. President, Europe, Middle East and Africa
Matt E. Monaghan Senior Vice President, Global Hips and Reconstructive Research
Emmanuel Nyakako Senior Vice President, Global Quality, Regulatory and Clinical Affairs
Stephen H. L. Ooi President, Asia Pacific
Chad F. Phipps Senior Vice President, General Counsel and Secretary
Richard C. Stair Senior Vice President, Global Operations and Logistics
Stephen E. White Senior Vice President and General Manager, Knees
This annual report is printed on paper that contains 10% post-consumer waste.
Stock Performance Graph Comparison of Cumulative Total Return for years ended December 31
Assumes $100 was invested on December 31, 2008 in Zimmer common stock and each index and that dividends were reinvested. Returns over the indicated period should not be considered indicative of future returns.
Stockholder Information
Headquarters Zimmer Holdings, Inc. 345 East Main Street Warsaw, IN 46580, U.S.A. +1-574-267-6131 www.zimmer.com
Stock Listing Zimmer is listed on the New York Stock Exchange and the SIX Swiss Exchange under the symbol ZMH.
Transfer Agent Communications concerning stock transfer requirements, loss of certificates and change of address should be directed to Zimmer’s Transfer Agent:
American Stock Transfer & Trust Company, LLC 6201 15th Avenue Brooklyn, NY 11219 +1-888-552-8493 (domestic) +1-718-921-8124 (international) Email: [email protected] Website: http://www.amstock.com
Investor Relations Zimmer invites stockholders, security analysts, portfolio managers and other interested parties to contact:
Robert J. Marshall Jr. Vice President, Investor Relations and Treasurer +1-574-371-8042 [email protected]
James T. Crines Executive Vice President, Finance and Chief Financial Officer +1-574-372-4264 [email protected]
To obtain a free copy of Zimmer’s annual report on form 10-K, quarterly reports on form 10-Q, news releases, earnings releases, proxy statements, or to obtain Zimmer’s financial calendar, access SEC filings, listen to earnings calls, or to look up Zimmer stock quotes, please visit http://investor.zimmer.com or call +1-866-688-7656.
Independent Auditors PricewaterhouseCoopers LLP Chicago, IL, U.S.A.
Dividend Reinvestment and Stock Purchase Plan
American Stock Transfer & Trust Company, LLC administers the Investors Choice Dividend Reinvestment and Stock Purchase Plan, which allows registered stockholders to purchase additional shares of Zimmer common stock through the automatic investment of dividends. The plan also allows registered stockholders to purchase shares with optional cash investments of at least $25, either by check or by automatic deductions from checking or savings accounts. The maximum optional cash investment is $10,000 per transaction. Please direct inquiries concerning the plan to: Zimmer Holdings, Inc., c/o American Stock Transfer & Trust Company, LLC, P.O. Box 922, Wall Street Station, New York, NY 10269-0560, +1-888-552-8493 (domestic), +1-718-921-8124 (international)

Zimmer Holdings, Inc., 345 East Main Street, P.O. Box 708, Warsaw, IN 46580, U.S.A.