2013 Budget Presentation Public Council Meeting December 17, 2012

June 20, 2016

Table of Contents
1. Budget Process Timeline pg. 3
2. Budget Assumptions pg. 4
3. Enrolment pg. 5-7
2. Revenues pg. 9-14
4. Expenses pg. 15-21
5. Estimated Consolidated Statement
Of Operations – Compliance Basis pg. 22
6. Staffing pg. 23
7. Capital pg. 24
2

Budget Process Timeline
3
Pre-Budget preparation
• (February)
Consultation/Budget Priorities Survey
• (Feb/March)
Grants for Students Needs Release
• (March)
Preparation
• (March-June)
Presentation
• (June)
Ministry filing
• (June 30th)
- Budget planning process commences shortly after filing of Revised Estimates
in December
- Consultation process focusses on discretionary curriculum budgets in alignment
with Board’s multi-year strategic plan
- Finance staff spend months analyzing and calculating grants and expenses
- Budget Steering committee engaged throughout process

Budget Assumptions
In light of the stated assumptions as presented at the
June 7th Committee of the Whole, the final budget is:
Balanced
Aligned with the Board’s multi-year strategic plan in support of:
Believing: Nurturing Our Catholic Community
Achieving: Student Achievement and Well-being
Serving: Stewardship – Effective Management of Resources
Compliant with Ministry regulations and other legislation
Sustains & enhances local initiatives
4

5
As a result of the projected decline in enrolment, all grants flowing through the allocations experienced a decline of approximately $650,000.
AVERAGE DAILY ENROLMENT
Estimates
2016/17
Rev.Est.
2015/16
Increase/
(Decrease)
%
Change
Actual
2014/15
Actual
2013/14
Elementary
JK 1,639.5 1,691.5 (52.0) -3.07% 1,730.0 1,540.3
K 1,773.0 1,818.5 (45.5) -2.50% 1,844.5 1,640.3
Grades 1 to 3 5,673.5 5,649.0 24.5 0.43% 5,554.5 5,498.0
Grades 4 to 8 9,425.5 9,398.5 27.0 0.29% 9,570.0 9,539.0
Elementary Day School 18,511.5 18,557.5 (46.0) -0.25% 18,699.0 18,217.5
Secondary - Pupils less than 21 years
Grades 9 to 12 9,676.3 9,758.6 (82.3) -0.84% 9,763.2 9,842.4
Total Secondary Day School 9,676.3 9,758.6 (82.3) 9,763.2 9,842.4
TOTAL DAY SCHOOL ADE 28,187.8 28,316.1 (128.3) -0.45% 28,462.2 28,059.9
High Credit: Grades 9 to 12 (under 21 years) 72.4 78.3 (5.9) -7.50% 86.4 108.2

HISTORICAL PROJECTED
6
16,878 16,873 16,846
18,692 18,611
18,511 18,364
18,258 18,235
15,500
16,000
16,500
17,000
17,500
18,000
18,500
19,000
2011/12 2012/13 2013/14 2014/15 2015/16 2016/17 2017/18 2018/19 2019/20
Elementary enrolment is projected to decline in 2016/17 by 0.54% and is projected to continue to
decline over the next 3 years; however it is then expected to plateau. The decline is mainly in
relation to fertility rates, the average size of the family being smaller and lower immigration from
Catholic countries as well as residential development delays.

HISTORICAL PROJECTED
7
10245
10172
9842 9773 9764
9676 9638
9703
9580
9200
9400
9600
9800
10000
10200
10400
2011/12 2012/13 2013/14 2014/15 2015/16 2016/17 2017/18 2018/19 2019/20
Secondary enrolment is projected to decline in 2016/17 by 0.9%, it is expected to continue
to decline in 2017/18 with a slight increase in 2018/19 due to a unique grade 8 cohort
class transitioning into the secondary panel; enrolment is then projected to continue to
decline parallel to the elementary panel and in relation to the provincial trend.


Revenue Overview
Breakdown:
◦ Ministry of Education(GSN) $267.8 M
◦ Municipalities $ 56.2 M
◦ Other Revenue Sources $ 8.7 M
◦ TOTAL ALLOCATION $332.7 M
9

Revenues
Education funding formula determines each board’s overall funding
allocation
Property tax revenue provides a part of the allocation and the
Province provides additional funding up to the level set by the
education funding formula
Therefore, Municipal tax revenue neither adds to nor deducts from
a board’s overall allocation as determined by the formula
10

Revenues
Ministry of Education Revenue:
◦ Education funding in 2016–17 consists of:
Pupil Foundation Grant +
School Foundation Grant +
12 Special purpose grants +
Debt Service grant
GRANTS FOR STUDENT NEEDS (GSNs)
*enrolment drives all GSNs
11

Revenues
Other Revenue Sources:
◦ i) in addition to GSN the Ministry provides grants called EPOs –
‘Educational Programs-Other’
These are specific Ministry initiatives whereby an individual contract is
signed for each initiative
◦ ii) Adult Education grants from other Ministries
ESL, LINC, LBS
◦ iii) Other sources of revenues include:
VISA student fees,
cost recoveries from: facility/partnership agreements such as with the City
of Hamilton, Secondments, Professional Development, etc.
bank interest
12

13
The increase in revenues of $3,738,038 over 2015/16 revised estimates is largely due to:
benchmark increases for salaries, wages and benefits, grid movement restoration as
well as benchmark increases in non-salary portions of the transportation and school
operations grants.
2016/17
Estimates
2015/16 Revised
Estimates 2014/15 Actual
Total Revenue $332,714,990 $328,976,952 $329,447,339
$327,000,000
$328,000,000
$329,000,000
$330,000,000
$331,000,000
$332,000,000
$333,000,000
2016/17 Estimates 2015/16 Revised Estimates 2014/15 Actual
Total Revenue

Learning Services
77.69%
14
Revenues by Planning Area 2016/17
Estimates
2015/16
Revised Estimates
2014/15
Actual
Instruction $201,394,212 $199,274,681 $200,447,137
Local Taxation $56,207,673 $54,952,445 $54,923,354
Administration $8,297,802 $7,945,962 $8,750,661
Transportation $7,217,860 $7,094,595 $6,979,980
School Oper. & Maint. $29,178,747 $29,151,492 $29,078,958
Capital $15,086,817 $15,714,174 $14,824,566
Other $1,051,243 $1,051,243 $1,051,243
Amortization of DCC $14,280,636 $13,792,360 $13,391,440
$332,714,990 $328,976,952 $329,447,339
Instruction 61% Local Taxation
17%
Administration 2%
Transportation 2%
School Oper. & Maint. 9%
Capital 5%
Other 0%
Amortization of DCC 4%
Learning Services
77.97%
Special Education
18.95%
Con.Ed. 3.08%

Expense Overview
Budgetary guiding principles include: promoting the mission of Catholic Education
promoting equity in educational opportunity
promoting effective stewardship of Board resources
promoting accountability
The majority of expenses are tied to the Board Mission,
legislative and contractual requirements, & multi-year
strategic plan – furthermore, the Budget Priorities
Survey helped the Budget Steering Committee allocate
discretionary funds where available
16

17
The increase in expenses of $1,077,551 over 2015/16 revised estimates is largely due to:
salary, wages & benefit increase, increase in occasional teaching budgets, new
replacement VOIP system, increase in utility expense and increase in amortization due
to capital projects moving from construction in progress to assets in use
2016/17 Estimates
2015/16 Revised
Estimates 2014/15 Actual
Total Expenses $332,697,805 $331,620,254 $327,077,649
$324,000,000
$325,000,000
$326,000,000
$327,000,000
$328,000,000
$329,000,000
$330,000,000
$331,000,000
$332,000,000
$333,000,000
2016/17 Estimates 2015/16 Revised Estimates 2014/15 Actual
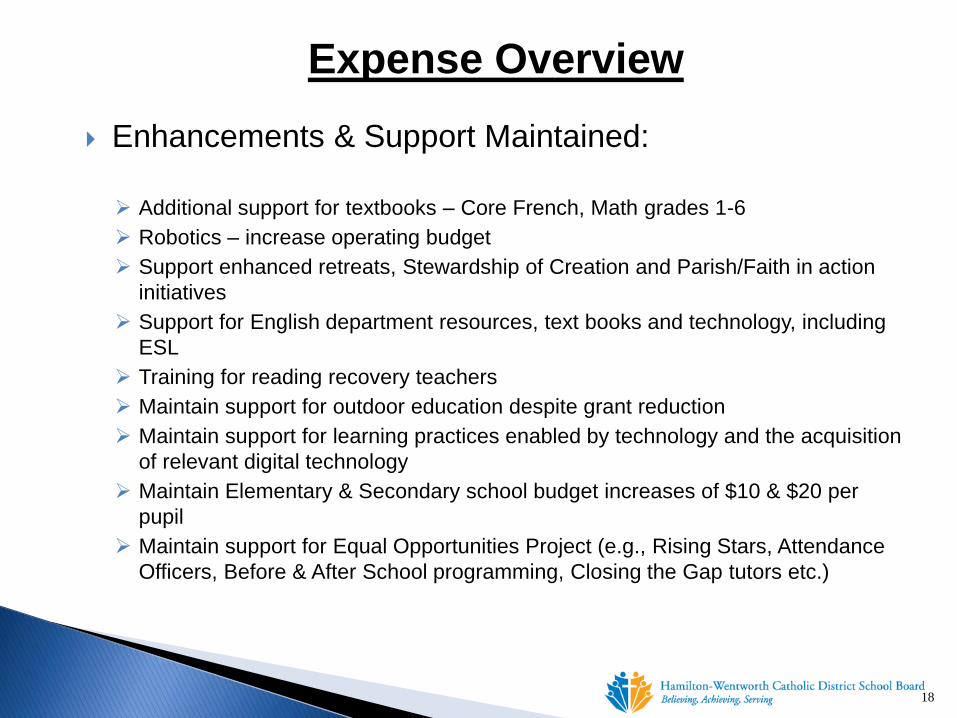
Expense Overview
Enhancements & Support Maintained:
Additional support for textbooks – Core French, Math grades 1-6
Robotics – increase operating budget
Support enhanced retreats, Stewardship of Creation and Parish/Faith in action
initiatives
Support for English department resources, text books and technology, including
ESL
Training for reading recovery teachers
Maintain support for outdoor education despite grant reduction
Maintain support for learning practices enabled by technology and the acquisition
of relevant digital technology
Maintain Elementary & Secondary school budget increases of $10 & $20 per
pupil
Maintain support for Equal Opportunities Project (e.g., Rising Stars, Attendance
Officers, Before & After School programming, Closing the Gap tutors etc.)
18

Expense Overview
19
Reductions made:
Plant Operations operating budgets
Board Administration casual and operating budgets
Classroom Teacher reductions as they relate to declining
enrolment/class size regulation
St. Charles budget as they relate to declining enrolment
Appropriated Surplus draws:
Retirement gratuity payments
Snow removal
Curriculum Budgets
Enhanced support for equal opportunities project
Portion of artificial surface playing field at Bishop Tonnos

20
Learning Services
81.4%
Special Education
16%
Continuing Ed. 2.6%
Expenses by Planning Area 2016/17 2015/16 2014/15
Estimates Revised Estimates Actual
Instruction $261,889,757 $261,885,698 $256,004,377
Administration $9,310,467 $8,841,541 $9,163,551
Transportation $7,761,348 $7,564,385 $7,284,103
Plant Op's & Maintenance $52,684,990 $52,277,387 $53,574,375
Other $1,051,243 $1,051,243 $1,051,243
$332,697,805 $331,620,254 $327,077,649
Instruction 78.7%
Administration 2.8 %
Transportation 2.3%
Plant Operations & Maint. 15.8 %
Other 0.3%

21
Expenses by Category
2016/17 2015/16 2014/15
Estimates Revised
Estimates Actual
Salaries & wages $237,137,117 $234,876,165 $231,362,648
Employee benefits $34,330,000 $34,490,835 $33,577,777
Staff development $1,125,705 $979,959 $1,086,122
Supplies & services $32,493,128 $33,160,057 $32,567,295
Interest Charges on Capital $6,198,694 $6,636,748 $6,623,838
Rental expense $232,800 $266,260 $346,153
Fees & Contractual Services $4,699,983 $5,146,269 $5,478,139
Other $1,403,643 $1,484,843 $1,857,480
Amortization $15,076,735 $14,579,118 $14,178,197
$332,697,805 $331,620,254 $327,077,649
Salaries & wages 71.3%
Employee benefits 10.3%
Staff development 0.3%
Supplies & services 9.8%
Interest Charges on Capital 1.9%
Rental expense 0.1%
Fees & Contractual Services
1.4%
Other 0.4%
Amortization 4.5%

Hamilton-Wentworth Catholic District School Board
ESTIMATED Consolidated Statement of Operations
For the year ended August 31, 2017
COMPLIANCE BASIS
22
2016/2017 2015/2016 2014/2015
Estimates Rev.Est. $ Change % Change Actual
REVENUES
Provincial grants - Grants for
Student Needs
$ 253,481,317 $ 251,972,893 $1,508,424 0.60% $ 251,027,239
Provincial grants - Other $ 5,362,574 $ 5,420,119 -$ 57,545 -1.07% $ 6,225,368
Local taxation $ 56,207,673 $ 54,952,445 $1,255,228 2.23% $ 54,923,354
Federal grants & fees $ 1,092,189 $ 925,000 $ 167,189 15.31% $ 1,059,866
Investment income $ 275,000 $ 275,000 $ - 0.00% $ 475,070
Other fees & revenues $ 2,015,601 $ 1,639,135 $ 376,466 18.68% $ 2,440,862
Amortization of Deferred Capital
Contributions
$ 14,280,636 $ 13,792,360 $ 488,276 3.42% $ 13,295,580
TOTAL REVENUE $ 332,714,990 $ 328,976,952 $3,738,038 1.12% 329,447,339$
EXPENSES
Instruction $ 261,889,757 $ 261,885,698 $ 4,059 0.00% $ 256,004,377
Administration $ 9,310,467 $ 8,841,541 $ 468,926 5.04% $ 9,163,551
Transportation $ 7,761,348 $ 7,564,385 $ 196,963 2.54% $ 7,284,103
Plant Operations & Maintenance $ 52,684,990 $ 52,277,387 $ 407,603 0.77% $ 53,574,375
Other $ 1,051,243 $ 1,051,243 $ - 0.00% $ 1,051,243
TOTAL EXPENSES $ 332,697,805 $ 331,620,254 $1,077,551 0.32% 327,077,649$
Annual Operating
Surplus/(Deficit), Compliance
Basis
17,185 (2,643,302) $2,660,487 $ 2,369,690

23
Instruction
2016/17
Estimates
2015/16
Rev Est Change
Teachers 1,734.0 1,742.3 -8.3
Educational Assistants 560.1 560.1 0.0
Early Childhood Educators 126.0 127.0 -1.0
Professional & Para-Professionals 76.7 78.5 -1.8
Principals & Vice Principals 82.5 83.0 -0.5
Clerical/Secretarial Support 128.7 129.1 -0.4
Coordinators & Consultants 21.0 19.0 2.0
Continuing Education 15.3 18.3 -3.0
Total Instruction 2,744.27 2,757.29 -13.0
Board Administration & Governance 77.87 74.37 +3.5
Transportation 2.6 2.6 0.0
Pupil Accommodation
Operations & Maintenance 253.64 253.88 -0.2
School Renewal 16 16 0.0
Capital Projects 0 0 0.0
Total Pupil Accommodation 269.64 269.9 -0.2
Total Staff 3,094.4 3,104.1 -9.76

Source: Capital
24
Capital construction in 2016/17 is largely attributed to the successful award of Capital Priorities
projects in the fall of 2015. Construction in Progress relates to: Our Lady of Assumption CES
new replacement school, St. Jean de Brebeuf CSS 5-classroom addition and renovation and
St. Gabriel CES 4-room child care addition. Assets in Service primarily relate to School
condition and school renewal expenditures of $3,905,130 and $1,962,150 respectively. In
addition, a new artificial surface playing field at Bishop Tonnos is planned for 2016/17.
Capital Additions 2016-17 Estimates 2015-16 Rev. Est. 2014-15 Actual
Assets in Service 7,359,179$ 7,009,553$ 14,438,032$
Construction in Progress 12,895,959$ -$ 11,153,609$
20,255,138$ 7,009,553$ 25,591,641$
Assets in Service
Land & Land Improvements 1,250,000$ 1,502,996$ 5,112,605$
Building 5,367,279$ 4,936,657$ 7,587,931$
Moveable Type Assets 741,900$ 569,900$ 1,737,496$
7,359,179$ 7,009,553$ 14,438,032$