2013-15 Quarterly Financial Report - Washington State ... State Airports V9 Transportation Demand...
82
2013-15 Quarterly Financial Report Through December 2013 Strategic Planning and Finance Budget and Financial Analysis February 25, 2014
-
Upload
phamkhuong -
Category
Documents
-
view
213 -
download
0
Transcript of 2013-15 Quarterly Financial Report - Washington State ... State Airports V9 Transportation Demand...

2013-15
Quarterly Financial Report
Through December 2013
Strategic Planning and Finance Budget and Financial Analysis February 25, 2014
covingj
Typewritten Text

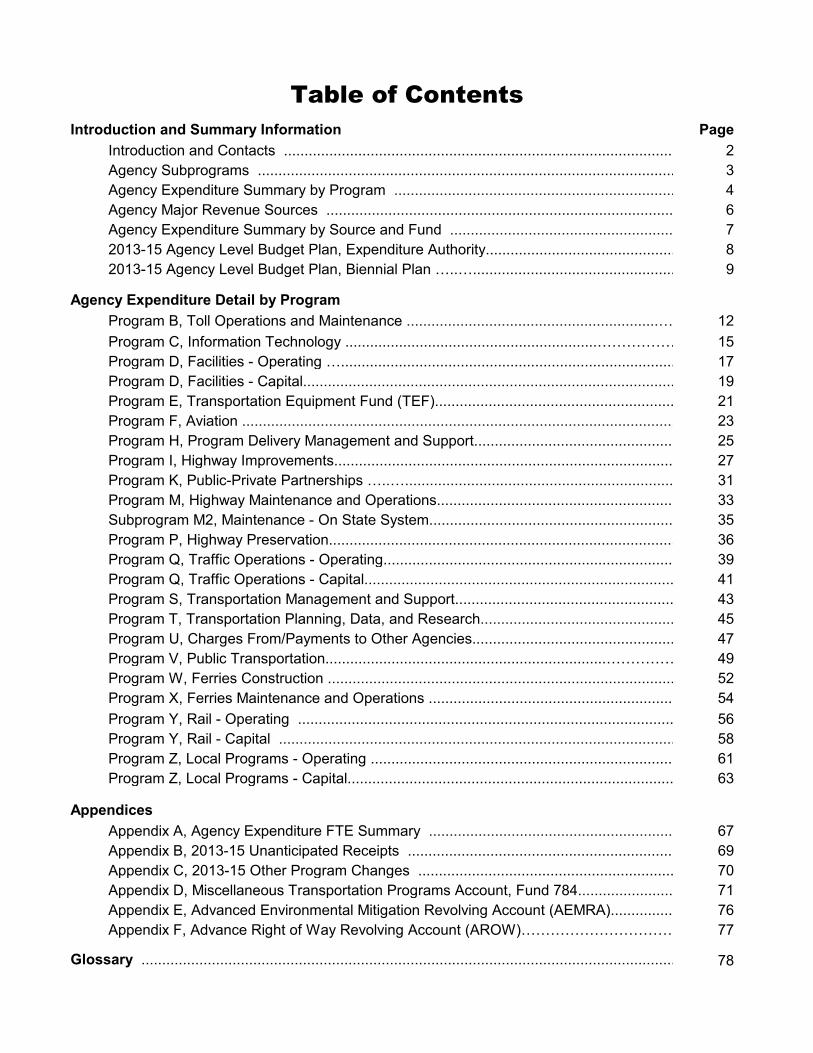
Table of Contents
Introduction and Summary Information PageIntroduction and Contacts ..................................................................................................................2Agency Subprograms ..........................................................................................................................3Agency Expenditure Summary by Program ............................................................................ 4Agency Major Revenue Sources ........................................................................................................6Agency Expenditure Summary by Source and Fund ............................................................ 72013-15 Agency Level Budget Plan, Expenditure Authority.................................................. 82013-15 Agency Level Budget Plan, Biennial Plan …..….................................................... 9
Agency Expenditure Detail by ProgramProgram B, Toll Operations and Maintenance .............................................................………………………………………………………………..12Program C, Information Technology .............................................................………………………………………………………………..15Program D, Facilities - Operating …....................................................................................… 17Program D, Facilities - Capital............................................................................................… 19Program E, Transportation Equipment Fund (TEF)........................................................................................…21Program F, Aviation ................................................................................................................. 23Program H, Program Delivery Management and Support....................................................................................................25Program I, Highway Improvements.......................................................................................................27Program K, Public-Private Partnerships …..…..................................................................... 31Program M, Highway Maintenance and Operations..............................................................................................................…33Subprogram M2, Maintenance - On State System.............................................................. 35Program P, Highway Preservation.....................................................................................................36Program Q, Traffic Operations - Operating................................................................................ 39Program Q, Traffic Operations - Capital..........................................................................................41Program S, Transportation Management and Support....................................................... 43Program T, Transportation Planning, Data, and Research................................................ 45Program U, Charges From/Payments to Other Agencies...........................................................................47Program V, Public Transportation....................................................................……………………………….49Program W, Ferries Construction ........................................................................................ 52Program X, Ferries Maintenance and Operations ............................................................ 54Program Y, Rail - Operating .........................................................................................................................…56Program Y, Rail - Capital .........................................................................................................................…58Program Z, Local Programs - Operating ...........................................................................................................61Program Z, Local Programs - Capital...........................................................................................................63
AppendicesAppendix A, Agency Expenditure FTE Summary ........................................................................................................67Appendix B, 2013-15 Unanticipated Receipts ................................................................ 69Appendix C, 2013-15 Other Program Changes ............................................................... 70Appendix D, Miscellaneous Transportation Programs Account, Fund 784........................................................................................................71Appendix E, Advanced Environmental Mitigation Revolving Account (AEMRA)........................................................................................................76Appendix F, Advance Right of Way Revolving Account (AROW)………………………………. 77
Glossary ...................................................................................................................................... 78


Introduction and Summary Information
1 Quarterly Financial Report Through December 2013

Introduction and Contacts The Washington State Department of Transportation (WSDOT) is responsible for preserving and operating a safe transportation system as efficiently as possible. The 2013-15 Biennium Transportation budget appropriates $8.7 billion for all state transportation operations and capital needs. Of this amount, WSDOT’s appropriation is $6.4 billion. In addition to the appropriation, the department has expenditure authority through unanticipated receipts and non-appropriated accounts. This Quarterly Financial Report summarizes the department’s second quarter 2013-15 biennial expenditures (through December 31, 2013) and compares those to spending plans. Revenue estimates are based on the November 2013 forecast adopted by the Transportation Revenue Forecast Council. Variances between planned and actual dollars and FTEs greater than ten percent for biennium to-date amounts are discussed in the Agency Expenditure Detail by Program section. Please direct any questions or comments to one of the following individuals: Quarterly Financial Report: Budget and Financial Analysis Director, Doug Vaughn (360.705.7500) Agency-wide: Assistant Budget Directors, Elise Greef (360.705.7541) or Megan Atkinson (360.708.7543) Revenue: Assistant Financial Analysis Director, Rich Struna (360.705.7120)
Contacts by Program:
Program Program Executive
Program Managers
Program Designees
Program Contacts
Budget Manager
B Craig Stone Ed Shumpert Ed Shumpert
Judith Kallo Joe Patterson C Katy Taylor Grant Rodeheaver Tom Parma Bob Loveless Joe Patterson D Linea Laird Chris Christopher Yvonne Medina Thanh Nguyen Dan Lawrence E Linea Laird Chris Christopher Greg Hansen Jeff Schroeder Dan Lawrence F Amy Scarton
Tristan Atkins Tristan Atkins Elise Greef My-Trang Le
H Linea Laird Laura Sanborn Laura Sanborn Lorri Riches Stacey Halverstadt I Linea Laird/
Amy Arnis Jay Alexander Jay Alexander Gary Lebow Doug Clouse K Amy Arnis Jeff Doyle Jeff Doyle Laura Sanborn My-Trang Le M1/M2/M3 Linea Laird Chris Christopher Greg Selstead Rob Kirkwood Dan Lawrence M5/M6 Amy Arnis Bob Covington Bob Covington Dave Davis Dan Lawrence P Linea Laird/
Amy Arnis Jay Alexander Jay Alexander Gary Lebow Doug Clouse Q Linea Laird John Nisbet John Nisbet Rob Kirkwood Dan Lawrence S Amy Arnis/
Katy Taylor Doug Vaughn Megan Atkinson Joe Patterson Joe Patterson T Amy Scarton
Brian Smith Laura Sanborn Terry Hayner Josh Covington
U Amy Arnis Doug Vaughn Elise Greef Dan Lawrence Dan Lawrence V Amy Scarton
Brian Lagerberg Cathy Silins Theo Yu Brian Connell
W David Moseley Jean Baker Vacant John Bernhard Stacey Halverstadt X David Moseley Jean Baker Vacant Matt Hanbey Stacey Halverstadt Y Amy Scarton
Ron Pate Brent Thompson Brent Thompson My-Trang Le
Z Amy Scarton
Kathleen Davis Eileen Leingang Doug Clouse Doug Clouse AEMRA Linea Laird Megan White Megan White Joe Witczak Josh Covington AROW Linea Laird Terry Meara Terry Meara Jennifer Holden Josh Covington
2 Quarterly Financial Report Through December 2013

Agency Subprograms
Subprogram Subprogram
B1 Toll Oversight and Planning Q1 Traffic Management and Support
B2 Tacoma Narrows Bridge Toll Op. and Maintenance Q2 Traffic Operations Activities
B3 High Occupancy Toll Lanes Maintenance and Op. Q3 Special Advanced Technology Projects
B5 State Route 520 Toll Operations S1 Executive Management and Support
C1 Business and Administration S2 Finance and Administration
C2 Field Services T2 Planning
C3 Infrastructure Services T3 Research and Library Services
C4 Enterprise Implementation T6 Pass Through Funds
C5 Information and Applications U0 Charges From/Payments to Other Agencies
C6 Software Maintenance Contracts V1 Public Transportation Administration
C7 Data Management V2 Public Transportation
D3 Facilities - Capital V4 Rural Mobility Grant Programs
D4 Facilities - Operating V5 Regional Mobility Grant Program
E1 Transportation Equipment Fund V6 Modal Coordination Program
F1 Aviation Management and Support V7 Statewide Commute Trip Reduction
F2 Airport Investment V8 Public Transportation Safety and Security
F3 State Airports V9 Transportation Demand Management Core Program
F4 Aviation Emergency Services W1 Terminal Construction
F5 Aviation Planning W2 Vessel Construction
H1 Headquarters Program Delivery Mgmt. and Support W3 Emergency Repairs
H2 Regional Program Delivery Mgmt. and Support X0 Payroll Suspense
H3 Environmental Program Delivery Mgmt. and Support X1 Operations - Vessels
I1 Mobility Improvements X2 Operations - Terminals
I2 Safety Improvements X3 Operations - Management and Support
I3 Economic Initiatives Improvements X4 Maintenance - Vessels
I4 Environmental Retrofit Improvement X6 Maintenance - Terminals
I5 Program Support Improvements X7 Maintenance - Management and Support
I6 Regional Transit Authority Improvements X8 Finance and Administration Support
I7 State Route 16 Tacoma Narrows Bridge X9 Executive Management Support
K2 Public-Private Partnerships Y2 Rail Freight Operations
M1 Maintenance Management and Support Y3 Rail Passenger Operations
M2 Maintenance - on State System Y4 Rail Passenger Capital
M3 Maintenance Sales and Services To Others Y5 Rail Freight Capital
M5 Inventory and Stores Administration Y6 King Street Station
M6 Undistributed - Inventory Suspense Z1 Local Programs Management and Support
P1 Roadway Preservation Z2 Local Programs Investments - Off State System
P2 Structures Preservation Z3 Bicycle and Pedestrian Coordination
P3 Other Facilities Preservation Z6 Operating Subsidy - Wahkiakum County
P4 Program Support Preservation Z9 Local Agency Investments on the State System
P5 Undistributed Costs Mats Lab/Geo./Printing 0M Advanced Environmental Mitigation Revolving Account
P7 Undistributed Costs - Project Engineer 0R Advance Right of Way Revolving Account
P8 Undistributed Costs - Direct Project Support
P9 Sales and Service to Others
3 Quarterly Financial Report Through December 2013

Dollars in Millions
Quarter Quarter Biennium toDate Percent Biennium Expenditure Programs Allotments Expenditures Allotments Expenditures Variance Variance Plan Authority
Agency Expenditure Summary by Program
* The 201315 Expenditure Authority includes dollars placed in unallotted and/or reserve status.** “Revolving Funds” are reflected separately from the capital and operating subtotal because program expenditures are reimbursed from other WSDOT programs. *** Program dollar amounts include nonappropriated funds.
Operating
BCDFHKMQSTUVXYZ
Toll Operations and MaintenanceInformation TechnologyFacilitiesOperatingAviationProgram Delivery Management and SupportPublicPrivate PartnershipsHighway Maintenance and OperationsTraffic OperationsOperatingTransportation Management and SupportTransportation Planning, Data and ResearchCharges From/Payments to Other AgenciesPublic Transportation Ferries Operations and MaintenanceRailOperatingLocal ProgramsOperating
6.010.03.01.26.00.151.37.13.38.94.813.759.75.11.4
5.29.73.41.15.60.150.26.93.57.523.113.360.15.51.3
16.018.85.71.911.60.195.913.86.916.126.415.9120.98.12.8
14.418.56.11.611.00.197.513.17.014.024.616.8119.47.82.7
1.50.3
(0.4)0.40.6
(0.0)(1.5)0.7
(0.1)2.11.8
(1.0)1.50.30.1
9.6%1.4%
(7.1)%18.4%4.8%
(3.2)%(1.6)%5.4%
(0.9)%13.2%6.6%
(6.1)%1.2%3.5%5.1%
55.371.826.27.847.80.6
404.455.528.566.077.1150.0483.533.111.3
62.772.126.39.548.40.6
410.056.328.766.382.1151.0485.233.111.4
***************
181.5 196.5 361.0 354.7 6.3 1.7% 1,518.9 1,543.5 *Subtotal Operating
Capital
DIPQWYZ
FacilitiesCapitalImprovementsPreservationTraffic OperationsCapitalFerries Division ConstructionRailCapitalLocal ProgramsCapital
2.6408.072.60.635.610.895.4
0.7383.668.40.742.516.193.2
3.5807.2199.40.869.832.6132.8
1.0592.6159.42.267.821.3120.1
2.6214.640.0(1.3)2.011.312.7
72.6%26.6%20.1%
(157.2)%2.8%34.7%9.6%
21.53,194.7605.37.2
291.7355.5530.7
21.53,545.2705.311.2291.7376.7530.7
***
*
625.6 605.2 1,246.1 964.3 281.9 22.6% 5,006.6 5,482.2 *Subtotal CapitalSubtotal 807.1 801.7 1,607.1 1,318.9 288.2 17.9% 6,525.5 7,025.7 *
Revolving Funds**
E Transportation Equipment Fund 19.2 15.5 34.0 29.8 4.2 12.3% 161.0 161.019.2 15.5 34.0 29.8 4.2 12.3% 161.0 161.0Subtotal Revolving Funds**
Subtotal 19.2 15.5 34.0 29.8 4.2 12.3% 161.0 161.0
Total 826.3 817.2 1,641.1 1,348.8 292.4 17.8% 6,686.5 7,186.7 *Agency Total
4 Quarterly Financial Report Through December 2013
covingj
Line
covingj
Line
covingj
Line
covingj
Line
covingj
Line
covingj
Line
covingj
Line
covingj
Line
covingj
Line
covingj
Line
Jun-
15
May
-15
Apr-1
5
Mar
-15
Feb-
15
Jan-
15
Dec
-14
Nov
-14
Oct
-14
Sep-
14
Aug-
14
Jul-1
4
Jun-
14
May
-14
Apr-1
4
Mar
-14
Feb-
14
Jan-
14
Dec
-13
Nov
-13
Oct
-13
Sep-
13
Aug-
13
Jul-1
3
7,500
5,000
2,500
0
Allotments Expenditures
Cumulative toDate Expenditure Comparison
Millions $
Jun-
15
May
-15
Apr-1
5
Mar
-15
Feb-
15
Jan-
15
Dec
-14
Nov
-14
Oct
-14
Sep-
14
Aug-
14
Jul-1
4
Jun-
14
May
-14
Apr-1
4
Mar
-14
Feb-
14
Jan-
14
Dec
-13
Nov
-13
Oct
-13
Sep-
13
Aug-
13
Jul-1
3
750
500
250
0
Allotments Expenditures
Monthly Expenditure Comparison
Millions $
Agency Level
Variance toDate:$292.4 million underexpended
17.8% underexpended
5 Quarterly Financial Report Through December 2013

Budget CurrentThrough 2nd Quarter, FY 2014 Forecast (b) Forecast (a)
Mar-13 Nov-13Motor Vehicle Fuel Tax Collection - Motor Vehicle Account 651.4 654.0 2519.7 2522.7DistributionRefunds and Transfers 35.6 34.2 138.6 141.4Distribution toTIB and CRAB (Local Governments) 68.3 68.5 259.0 259.3Distribution to Other State Accounts 33.0 33.0 125.1 125.2Distribution to Cities and Counties 125.6 126.0 474.6 476.2Distribution to Nickel Account 83.1 83.4 315.3 315.7Distribution to Transportation Partnership Account 141.3 141.7 536.1 536.7Total Distribution from Motor Vehicle Account 487.0 486.8 1848.7 1854.6Net Nov Fuel Tax Revenue to Motor Vehicle Acct. 164.5 167.1 671.0 668.2Licenses, Permits, and Fees (c)Motor Vehicle Account (108) 100.4 101.0 408.3 419.7State Patrol Highway (081) 73.2 72.1 301.6 303.1Puget Sound Ferry Operations (109) 3.7 3.7 15.2 15.3Recreational Vehicle (097) 0.3 0.3 1.3 1.3Multimodal Transportation (218) 31.1 30.8 134.7 136.7Transportation 2003 (Nickel) (550) 19.1 18.2 78.2 77.0Transportation Partnership (09H) 10.4 10.4 41.7 41.9Freight Mobility Multimodal (11E) 3.0 3.0 6.0 6.1Licensing Services (201) 1.4 1.4 6.0 6.1License Plate Technology Account (06T) 0.7 0.7 3.0 3.0Multiuse Roadway Safety Account Collections (571) 0.0 0.0 0.0 0.1Total Licenses, Permits, and Fees 243.3 241.5 996.0 1010.3Rental Car Sales Tax 15.5 15.3 49.7 51.8Sales Tax on Motor Vehicles 15.4 15.3 58.9 61.3 Use Tax on Motor Vehicles 2.9 3.0 11.9 12.1Business Related Revenue (Motor Vehicle Account) 3.7 3.5 11.9 14.5Ferry Fares 89.4 87.1 328.1 336.0Non-Farebox Revenue 2.0 2.0 7.9 7.6Toll Operations RevenueTacoma Narrows Bridge Tolls (511) 33.0 32.4 125.6 133.5TNB Transponder Sales, Violations and Fees (511) 0.6 0.7 1.5 2.1TNB Civil Penalties (1.1) (1.9) 1.4 5.9HOT Lane SR 167 Tolls (09F) 0.6 0.6 2.5 2.4HOT Lane Transponder Sales and Fees (09F) 0.0 0.0 0.1 0.1SR No. 520 Corridor (16J) 31.8 30.4 133.9 133.2SR No. 520 Corridor Transponder Sales and Fees (16J) 1.4 1.5 2.0 1.0SR No. 520 Civil Penalties and Fees (17P) 1.1 0.4 7.4 18.3Total Toll Operation Revenue 67.5 64.1 274.4 296.5Aircraft Fuel Tax (d) 1.5 1.5 6.1 6.7
Bonds (e)
Nickel BondsTPASR 520 GARVEESR 520 TIFIATotal Bond Revenue
3002,392
Net Proceeds Sold To-Date1545
240323
0623
2013-15 Appropriation50
2181,156
668
Referendum 49 Bonds
Agency Major Revenue Sources
Forecast (a) Actual
Dollars in Millions
Biennium To-date
(a) The biennium to date, and current biennial forecast columns reflect the November 2013 revenue forecast. (b) The biennial budget column reflects the March 2013 revenue forecast. The March 2013 forecast was included in the development of the 2013 Budget Bill. The Bond Proceeds are not forecasted but reflect current appropriations. (c) Licenses, Permits and Fees revenue figures from the Department of Licensing are not final and are subject to change. (d) Aircraft fuel tax does not include a transfer of 0.028% of gross fuel tax collections from the Motor Vehicle Account (108) to the Aeronautics Account (039). (e) SR 520 TIFIA and SR 520 are fully appropriated however, Section 306 (12) (d) requires $105.1 million of the SR520 TIFIA be unallotted and $227.4 million of the SR 520 be unallotted.
6 Quarterly Financial Report Through December 2013

Dollars in Millions
Fund Quarter Quarter Biennium toDate Biennial ExpenditureSource Account Allotments Expenditures Allotments Expenditures Plan Authority
Agency Expenditure Summary by Source and Fund
* Expenditure authority includes dollars in reserve and/or unallotted status.
Appropriated FundsState02M03904509409609909F09H10610810911B15316J17P215218511550
Essential Rail AssistanceAeronauticsState Vehicle ParkingTransportation InfrastructureHighway InfrastructurePuget Sound Capital ConstructionHigh Occ Toll Lanes OperationsTransportation PartnershipHighway SafetyMotor VehiclePuget Sound Ferry OperationsRegional Mobility Grant ProgramRural Mobility Grant ProgramState Route Number 520 CorridorState Route Number 520 Civil PenaltiesSpecial Category "C"Multimodal TransportationTacoma Narrows Toll BridgeTransportation 2003 (Nickel)
0.21.20.10.60.04.40.2
167.24.1
102.459.92.52.1
108.10.50.09.72.4
66.7
0.11.10.10.70.06.50.2
151.46.2
116.860.21.92.7
115.80.40.0
14.12.3
53.1
0.21.90.10.60.0
10.80.5
331.65.5
221.1121.02.92.1
193.51.00.0
20.36.4
127.2
0.21.50.10.70.09.80.4
258.76.3
205.8119.52.33.4
158.41.00.0
19.56.2
92.0
0.97.40.56.60.2
53.01.8
1,593.328.8828.4483.749.917.0536.14.20.1
123.622.3389.9
0.97.40.58.60.2
53.01.9
1,593.328.8855.0485.349.917.0769.54.20.1
123.923.6389.9
*
*
*
**
**
**
1 Subtotal State 532.1 533.6 1,046.6 885.8 4,147.6 4,412.9 *Local099108109218
Puget Sound Capital ConstructionMotor VehiclePuget Sound Ferry OperationsMultimodal Transportation
(0.1)63.80.00.0
0.05.30.00.0
0.0138.00.00.0
0.010.50.00.0
1.1171.90.10.0
1.1171.90.10.1 *
3 Subtotal Local 63.8 5.3 138.1 10.5 173.2 173.3 *Federal03909609910816J218
AeronauticsHighway InfrastructurePuget Sound Capital ConstructionMotor VehicleState Route Number 520 CorridorMultimodal Transportation
0.00.21.4
99.20.0
12.2
0.00.07.6
142.30.0
14.5
0.00.47.7
250.80.0
29.2
0.00.09.2
264.90.0
18.5
0.51.6
91.7984.1194.9320.1
2.21.6
91.71,092.3300.0340.0
*
***
2 Subtotal Federal 113.1 164.4 288.2 292.6 1,592.9 1,827.7 *Total Appropriated Funds 709.0 703.3 1,472.9 1,188.9 5,913.6 6,413.9 *
NonAppropriated FundsState410 Transportation Equip. Fund 19.2 15.5 34.1 29.9 161.2 161.2
1 Subtotal State 19.2 15.5 34.1 29.9 161.2 161.2Local432495759784
King Street StationToll CollectionMiscellaneous ProgramMisc. Trans. Program
0.00.00.03.2
0.00.00.05.8
0.00.00.05.9
0.00.00.08.8
0.20.00.2
70.3
0.20.00.2
70.33 Subtotal Local 3.2 5.8 5.9 8.8 70.7 70.7
Federal784784
Misc. Trans. ProgramARRAMisc. Trans. Program
1.193.9
4.188.5
2.1126.1
4.1117.1
8.4532.6
8.4532.6
2 Subtotal Federal 94.9 92.6 128.2 121.2 541.0 541.0Total NonAppropriated Funds 117.3 113.9 168.2 159.8 772.8 772.8
Agency Total 826.3 817.2 1,641.1 1,348.8 6,686.5 7,186.7 *
7 Quarterly Financial Report Through December 2013
connelb
Line
connelb
Line
connelb
Line
connelb
Line
connelb
Line
connelb
Line
connelb
Line
CovingJ
Rectangle
connelb
Line
connelb
Line
connelb
Line
connelb
Line
connelb
Line
connelb
Line
connelb
Line
connelb
Line
connelb
Line

2013-15 Agency Level Budget Plan, Expenditure Authority Dollars in Millions
2013 Legislative 2014 Legislative 2015 Legislative Unanticipated Other Program Compensation Expenditure Programs Appropriations (a) + Appropriations + Appropriations + Receipts (b) + Changes (c) + Adjustments = Authority
Operating
B 62.7 0.0 0.0 0.0 0.0 0.0 62.7
C 72.1 0.0 0.0 0.0 0.0 0.0 72.1
D 26.3 0.0 0.0 0.0 0.0 0.0 26.3
F 9.5 0.0 0.0 0.0 0.0 0.0 9.5
H 48.4 0.0 0.0 0.0 0.0 0.0 48.4
K 0.6 0.0 0.0 0.0 0.0 0.0 0.6
M 407.0 0.0 0.0 0.0 3.0 0.0 410.0
Q 52.8 0.0 0.0 0.3 3.2 0.0 56.3
S 28.3 0.0 0.0 0.2 0.2 0.0 28.7
T 48.6 0.0 0.0 0.1 17.5 0.0 66.3
U 82.1 0.0 0.0 0.0 0.0 0.0 82.1
V 109.7 0.0 0.0 0.0 41.2 0.0 151.0
X 485.2 0.0 0.0 0.0 0.0 0.0 485.2
Y 32.9 0.0 0.0 0.1 0.2 0.0 33.1
Z 11.3 0.0 0.0 0.0 0.1 0.0 11.4
Subtotal Operating 1,477.4 0.0 0.0 0.7 65.4 0.0 1,543.5
Capital
D 21.5 0.0 0.0 0.0 0.0 0.0 21.5
I 3,478.1 0.0 0.0 0.0 67.1 0.0 3,545.2
P 698.6 0.0 0.0 0.0 6.7 0.0 705.3
Q 11.2 0.0 0.0 0.0 0.0 0.0 11.2
W 291.3 0.0 0.0 0.0 0.3 0.0 291.7
Y 376.5 0.0 0.0 0.0 0.2 0.0 376.7
Z 58.5 0.0 0.0 0.0 472.1 0.0 530.7
Subtotal Capital 4,935.8 0.0 0.0 0.0 546.5 0.0 5,482.3
Revolving
E 0.0 0.0 0.0 0.0 161.0 0.0 161.0
Subtotal Revolving 0.0 0.0 0.0 0.0 161.0 0.0 161.0
Agency Total 6,413.2 0.0 0.0 0.7 772.9 0.0 7,186.7
(a) Legislative Appropriations include the 2013-15 Transportation Budget Bill – ESSB 5024 (Chapter 306, Laws of 2013, PV). (b) See Appendix B, Unanticipated Receipts, or specific program for details. (c) See Appendix C, Other Program Changes, or specific program for details.
8 Quarterly Financial Report Through December 2013

Dollars in MillionsAgency Level Budget Plan, Biennial Plan
Expenditure
Programs Authority Unallotted Reserve Biennial Plan
Operating
BCDFHKMQSTUVXYZ
Toll Operations and MaintenanceInformation TechnologyFacilitiesOperatingAviationProgram Delivery Management and SupportPublicPrivate PartnershipsHighway Maintenance and OperationsTraffic OperationsOperatingTransportation Management and SupportTransportation Planning, Data and ResearchCharges From/Payments to Other AgenciesPublic Transportation Ferries Operations and MaintenanceRailOperatingLocal ProgramsOperating
62.772.126.39.548.40.6
410.056.328.766.382.1151.0485.233.111.4
7.30.00.01.70.30.04.00.60.00.15.01.10.00.00.0
0.00.20.10.00.20.01.70.20.20.20.00.01.70.00.0
55.371.826.27.847.80.6
404.455.528.566.077.1149.9483.533.111.3
Subtotal Operating 1,543.5 20.1 4.6 1,518.8
Capital
DIPQWYZ
FacilitiesCapitalImprovementsPreservationTraffic OperationsCapitalFerries Division ConstructionRailCapitalLocal ProgramsCapital
21.53,545.2705.311.2291.7376.7530.7
0.0350.5100.03.90.021.20.0
0.00.00.00.00.00.00.0
21.53,194.7605.37.2
291.7355.5530.7
Subtotal Capital 5,482.2 475.7 0.0 5,006.6
Revolving
E Transportation Equipment Fund 161.0 0.0 0.0 161.0Subtotal Revolving 161.0 0.0 0.0 161.0
Agency Total 7,186.7 495.8 4.6 6,686.3
9 Quarterly Financial Report Through December 2013

10 Quarterly Financial Report Through December 2013

Agency Expenditure Detail by Program
11 Quarterly Financial Report Through December 2013

Program B, Toll Operations and Maintenance
Quarter Quarter Biennium to-Date Percent Biennium ExpenditureAllotments Expenditures Allotments Expenditures Variance Variance Plan Authority
Expenditure Status
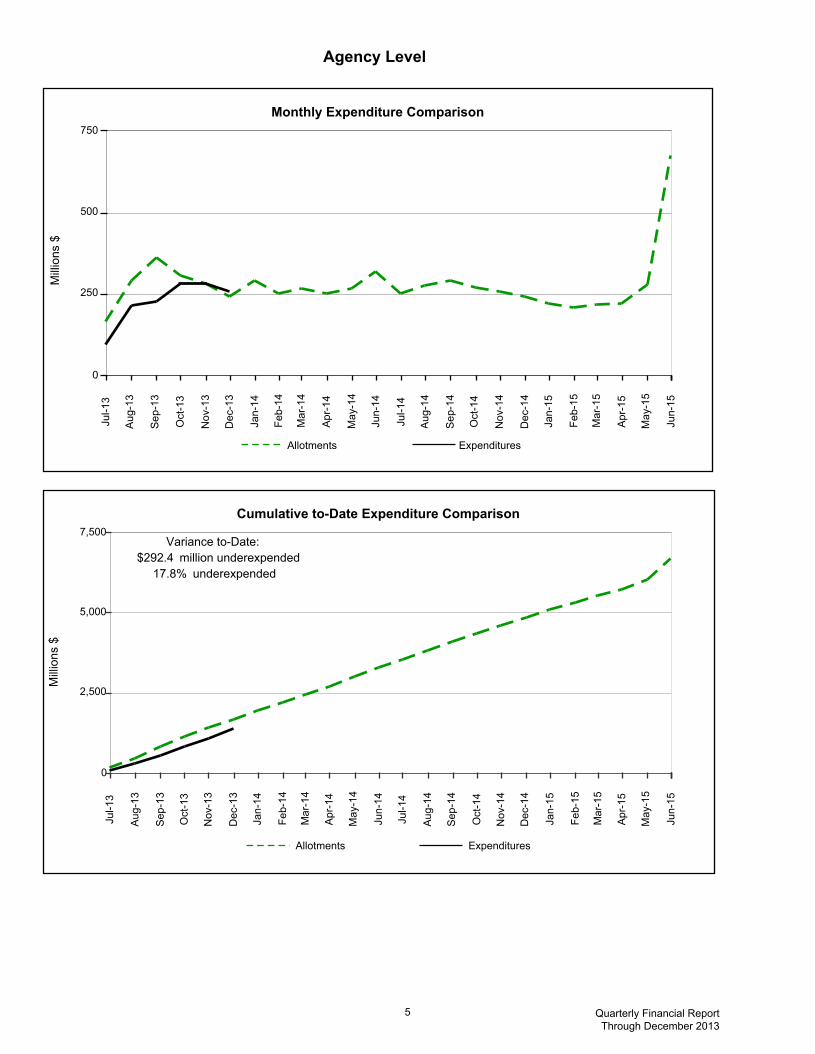
Common Toll Expenditure Suspense Account 0 (14) 0 0 0 0.0% 0 0Toll Oversight And Planning 213,600 129,744 276,900 187,314 89,586 32.4% 757,000 759,000Tacoma Narrows Bridge Toll Op. and Maint. 2,391,200 2,346,405 6,360,900 6,246,384 114,516 1.8% 22,298,000 23,610,000High Occupancy Toll Lanes Op. and Maint. 230,200 184,184 460,300 354,788 105,512 22.9% 1,848,000 1,851,000State Route 520 Toll Operations 3,179,300 2,517,058 8,866,100 7,635,693 1,230,407 13.9% 30,442,000 36,468,000Total Expenditures 6,014,300 5,177,377 15,964,200 14,424,180 1,540,020 9.6% 55,345,000 62,688,000
Sources of Funds (Accounts)
High Occ Toll Lanes Operations-State 230,200 184,184 460,300 354,788 105,512 22.9% 1,848,000 1,851,000Motor Vehicle-State 63,600 49,654 126,900 84,668 42,232 33.3% 507,000 509,000Puget Sound Ferry Operations-State 150,000 80,091 150,000 102,646 47,354 31.6% 250,000 250,000State Route Number 520 Corridor-State 2,658,700 2,097,175 7,824,800 6,679,105 1,145,695 14.6% 26,279,000 32,299,000State Route Number 520 Civ il Penalties-State 520,600 419,883 1,041,300 956,589 84,711 8.1% 4,163,000 4,169,000Toll Collection-Nonappropriated Funds 0 (14) 0 0 0 0.0% 0 0Tacoma Narrows Toll Bridge-State 2,391,200 2,346,405 6,360,900 6,246,384 114,516 1.8% 22,298,000 23,610,000Total Funds 6,014,300 5,177,377 15,964,200 14,424,180 1,540,020 9.6% 55,345,000 62,688,000
FTE Status 37.7 28.3 37.7 28.3 9.4 24.8% 37.7
Biennial Plan versus Expenditure Authority: The 2013-15 Biennial Plan is less than the Expenditure Authority because $7.3 million was placed into unallotted status to reflect an operation and maintenance reserve for unforeseen costs at Tacoma Narrows Bridge and SR 520 Bridge facilities. In addition, the transportation budget funded health benefit rates at $809 in FY 2014 and $820 in FY 2015, which is higher than the final, enacted rates in the state operating budget of $782 in FY 2014 and $763 in 2015. The difference between the higher, funded amount and the enacted rates has been placed in reserve for operating programs and is expected to be removed in the 2014 Supplemental Budget. For Program B, the amount in reserve for health benefits is $43,000. VARIANCE EXPLANATIONS Expenditure Status Toll Oversight and Planning: The variance is due to expenditures related to the statewide customer service center integration plan occurring later than planned and staff vacancies. High Occupancy Toll Lanes Maintenance & Operations: The variance is due to less-than-planned staffing costs due to vacancies.
State Route 520 Toll Operations: Credit card fees and transponder related expenses were lower than expected.
Source of Funds (Account) High Occupancy Toll Lanes Operations-State: See explanation in High Occupancy Toll Lanes Maintenance and Operations.
Motor Vehicle Account-State: The variance is primarily due to less-than-planned staffing costs due to vacancies.
Puget Sound Ferry Operations-State: See explanation for Toll Oversight and Planning.
12 Quarterly Financial Report Through December 2013

Program B, Toll Operations and Maintenance (Continued)
State Route 520 Corridor-State: See explanation for SR 520 Toll Operations.
FTE Status: The FTE variance is primarily due to vacancies.
13 Quarterly Financial Report Through December 2013
Program B, Toll Operations and Maintenance
Jun-
15
May
-15
Apr-1
5
Mar
-15
Feb-
15
Jan-
15
Dec
-14
Nov
-14
Oct
-14
Sep-
14
Aug-
14
Jul-1
4
Jun-
14
May
-14
Apr-1
4
Mar
-14
Feb-
14
Jan-
14
Dec
-13
Nov
-13
Oct
-13
Sep-
13
Aug-
13
Jul-1
3
7.5
5.0
2.5
0.0
Allotments Expenditures
Monthly Expenditure Comparison
Millions $
Jun-
15
May
-15
Apr-1
5
Mar
-15
Feb-
15
Jan-
15
Dec
-14
Nov
-14
Oct
-14
Sep-
14
Aug-
14
Jul-1
4
Jun-
14
May
-14
Apr-1
4
Mar
-14
Feb-
14
Jan-
14
Dec
-13
Nov
-13
Oct
-13
Sep-
13
Aug-
13
Jul-1
3
50
25
0
Allotments Expenditures
Cumulative toDate Expenditure Comparison
Millions $
Variance toDate:$1.5 million underexpended
9.6% underexpended
14 Quarterly Financial Report Through December 2013

Program C, Information Technology
Quarter Quarter Biennium to-Date Percent Biennium ExpenditureAllotments Expenditures Allotments Expenditures Variance Variance Plan Authority
Expenditure Status
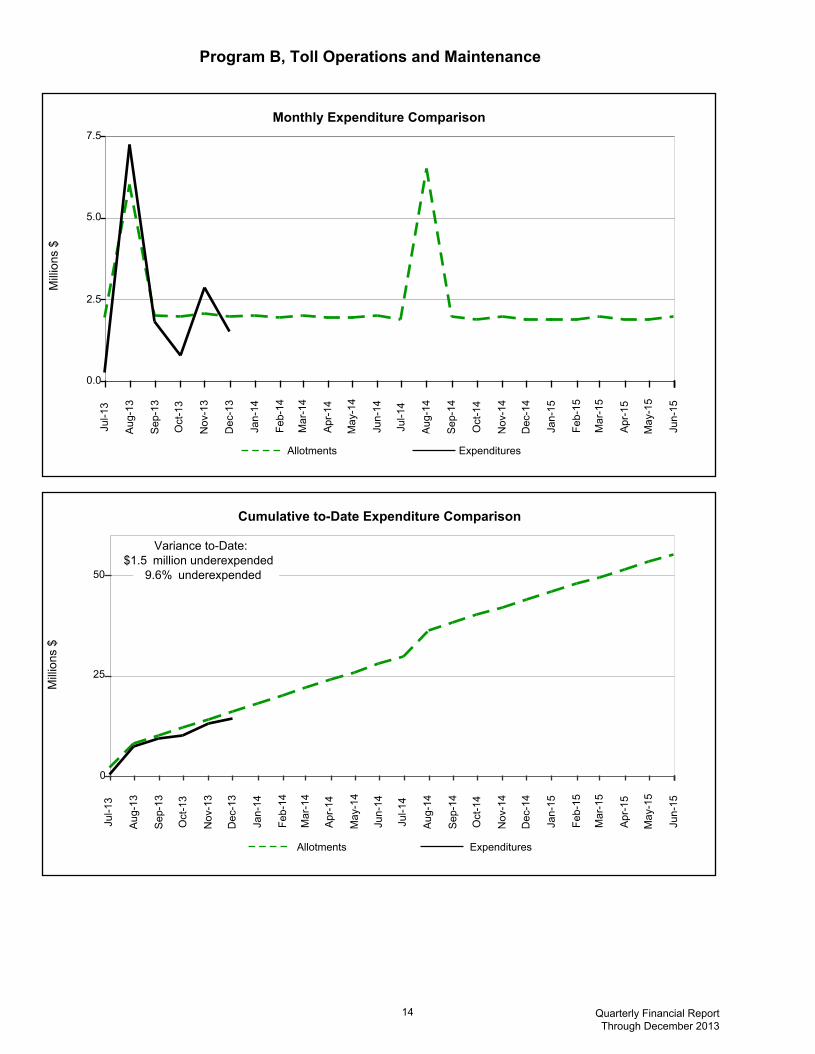
Business And Administration 286,000 281,152 627,000 566,624 60,376 9.6% 2,704,000 2,931,000Field Serv ices 3,849,000 3,524,090 7,427,000 7,151,656 275,344 3.7% 29,784,000 29,784,000Infrastructure Serv ices 1,543,000 1,627,059 3,064,800 3,097,892 (33,092) (1.1)% 13,159,200 13,159,200Enterprise Implementation 246,000 238,177 549,000 498,423 50,577 9.2% 1,982,000 1,982,000Information And Applications 1,222,000 1,173,225 2,484,000 2,387,825 96,175 3.9% 10,115,000 10,115,000Software Maintenance Contracts 2,238,000 2,210,207 3,425,000 3,563,576 (138,576) (4.0)% 9,455,000 9,455,000Data Management 592,000 613,093 1,200,000 1,247,025 (47,025) (3.9)% 4,633,000 4,633,000Total Expenditures 9,976,000 9,667,002 18,776,800 18,513,021 263,779 1.4% 71,832,200 72,059,200
Sources of Funds (Accounts)
Transportation Partnership-State 178,000 243,732 317,000 394,497 (77,497) (24.4)% 1,460,000 1,460,000Motor Vehicle-State 9,448,000 9,036,327 17,952,000 17,585,832 366,168 2.0% 68,546,000 68,773,000Multimodal Transportation-State 181,000 181,000 181,000 181,000 0 0.0% 363,000 363,000Transportation 2003 (Nickel)-State 169,000 204,586 326,000 347,966 (21,966) (6.7)% 1,460,000 1,460,000Misc. Trans. Program-Nonappropriated Funds 0 1,358 800 3,726 (2,926) (365.7)% 3,200 3,200Total Funds 9,976,000 9,667,002 18,776,800 18,513,021 263,779 1.4% 71,832,200 72,059,200
FTE Status 225.1 222.6 225.1 221.3 3.8 1.7% 225.1
Biennial Plan versus Expenditure Authority: The transportation budget funded health benefit rates at $809 in FY 2014 and $820 in FY 2015, which is higher than the final enacted rates in the state operating budget of $782 in FY 2014 and $763 in 2015. The difference between the higher, funded amount and the enacted rates has been placed in reserve for operating programs and is expected to be removed in the 2014 Supplemental Budget. For Program C, the amount in reserve for health benefits is $227,000.
VARIANCE EXPLANATIONS Source of Funds (Account) Transportation Partnership-State: The variance is due to earlier-than-planned expenditures for software license renewals.
Miscellaneous Transportation Programs-Nonappropriated Funds: The monthly local cost recovery activity allotment assumptions have changed since the initial allotment plan. Allotments will be adjusted to match the new plan.
15 Quarterly Financial Report Through December 2013
Program C, Information Technology
Jun-
15
May
-15
Apr-1
5
Mar
-15
Feb-
15
Jan-
15
Dec
-14
Nov
-14
Oct
-14
Sep-
14
Aug-
14
Jul-1
4
Jun-
14
May
-14
Apr-1
4
Mar
-14
Feb-
14
Jan-
14
Dec
-13
Nov
-13
Oct
-13
Sep-
13
Aug-
13
Jul-1
3
5.0
2.5
0.0
Allotments Expenditures
Monthly Expenditure Comparison
Millions $
Jun-
15
May
-15
Apr-1
5
Mar
-15
Feb-
15
Jan-
15
Dec
-14
Nov
-14
Oct
-14
Sep-
14
Aug-
14
Jul-1
4
Jun-
14
May
-14
Apr-1
4
Mar
-14
Feb-
14
Jan-
14
Dec
-13
Nov
-13
Oct
-13
Sep-
13
Aug-
13
Jul-1
3
75
50
25
0
Allotments Expenditures
Cumulative toDate Expenditure Comparison
Millions $
Variance toDate:$0.3 million underexpended
1.4% underexpended
16 Quarterly Financial Report Through December 2013

Program D, Facilities – Operating
Quarter Quarter Biennium to-Date Percent Biennium Expenditure
Allotments Expenditures Allotments Expenditures Variance Variance Plan Authority
Expenditure Status
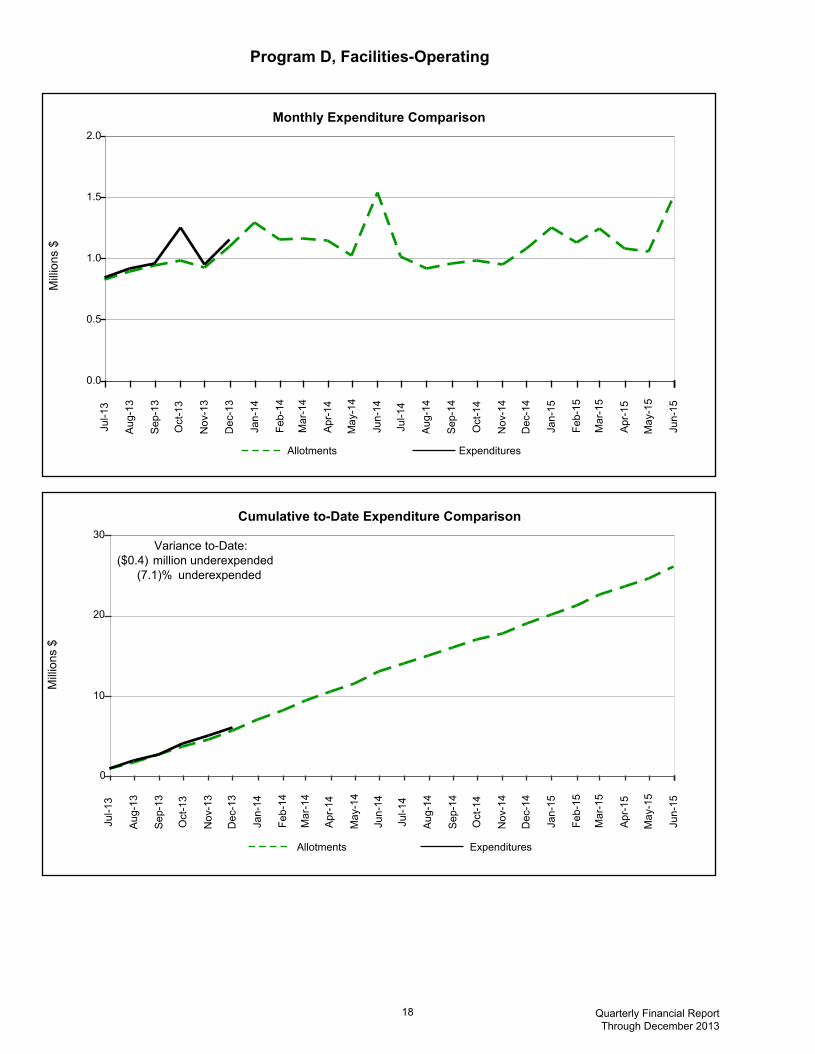
Capital Facilities-Maintenance and Operation 2,999,900 3,358,026 5,661,300 6,062,341 (401,041) (7.1)% 26,164,000 26,251,000Total Expenditures 2,999,900 3,358,026 5,661,300 6,062,341 (401,041) (7.1)% 26,164,000 26,251,000
Sources of Funds (Accounts)
Motor Vehicle-State 2,999,900 3,358,021 5,661,300 6,062,341 (401,041) (7.1)% 26,164,000 26,251,000Misc. Trans. Program-Nonappropriated Funds 0 5 0 0 0 0.0% 0 0Total Funds 2,999,900 3,358,026 5,661,300 6,062,341 (401,041) (7.1)% 26,164,000 26,251,000
FTE Status 66.4 70.6 69.3 70.4 (1.0) (1.5)% 73.3 Biennial Plan versus Expenditure Authority: The transportation budget funded health benefit rates at $809 in FY 2014 and $820 in FY 2015, which is higher than the final, enacted rate in the state operating budget of $782 in FY 2014 and $763 in 2015. The difference between the higher, funded amount and the enacted rates has been placed in reserve for operating programs and is expected to be removed in the 2014 Supplemental Budget. For Program D, the amount in reserve for health benefits is $87,000.
17 Quarterly Financial Report Through December 2013
Program D, FacilitiesOperating
Jun-
15
May
-15
Apr-1
5
Mar
-15
Feb-
15
Jan-
15
Dec
-14
Nov
-14
Oct
-14
Sep-
14
Aug-
14
Jul-1
4
Jun-
14
May
-14
Apr-1
4
Mar
-14
Feb-
14
Jan-
14
Dec
-13
Nov
-13
Oct
-13
Sep-
13
Aug-
13
Jul-1
3
2.0
1.5
1.0
0.5
0.0
Allotments Expenditures
Monthly Expenditure Comparison
Millions $
Jun-
15
May
-15
Apr-1
5
Mar
-15
Feb-
15
Jan-
15
Dec
-14
Nov
-14
Oct
-14
Sep-
14
Aug-
14
Jul-1
4
Jun-
14
May
-14
Apr-1
4
Mar
-14
Feb-
14
Jan-
14
Dec
-13
Nov
-13
Oct
-13
Sep-
13
Aug-
13
Jul-1
3
30
20
10
0
Allotments Expenditures
Cumulative toDate Expenditure Comparison
Millions $
Variance toDate:($0.4) million underexpended
(7.1)% underexpended
18 Quarterly Financial Report Through December 2013

Program D, Facilities – Capital
Quarter Quarter Biennium to-Date Percent Biennium Expenditure
Allotments Expenditures Allotments Expenditures Variance Variance Plan Authority
Expenditure Status
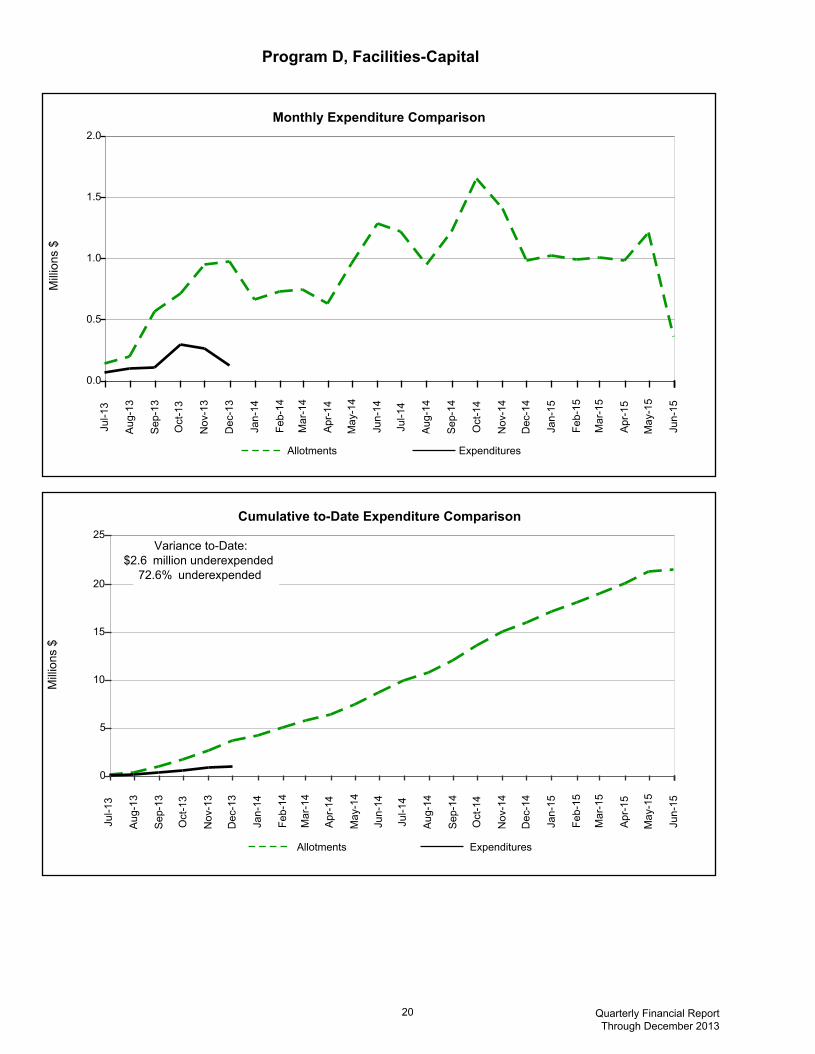
Capital Facilities-Construction 2,636,300 688,276 3,549,500 971,252 2,578,248 72.6% 21,531,000 21,531,000
Total Expenditures 2,636,300 688,276 3,549,500 971,252 2,578,248 72.6% 21,531,000 21,531,000
Sources of Funds (Accounts)
Transportation Partnership-State 983,300 98,941 1,321,500 145,685 1,175,815 89.0% 13,425,000 13,425,000
Motor Vehicle-State 1,653,000 589,335 2,228,000 825,568 1,402,432 62.9% 8,106,000 8,106,000
Total Funds 2,636,300 688,276 3,549,500 971,252 2,578,248 72.6% 21,531,000 21,531,000
FTE Status 19.2 8.2 15.4 7.6 7.8 50.4% 12.3 VARIANCE EXPLANATIONS Expenditure Status: The expenditure variance is due to a delay in the award of the Traffic Management Center Project and the deferral of some projects to later in the biennium. Source of Funds (Account): Transportation Partnership-State: The variance is due to a delay in award of the Traffic Management Center project. Motor Vehicle Account-State: The variance is due to the deferral of the Dayton Avenue Controls and Electrical project to a later date and several regional minor projects (Davenport roof replacement and Wenatchee boiler replacement) will be delivered later than planned.
19 Quarterly Financial Report Through December 2013
Program D, FacilitiesCapital
Jun-
15
May
-15
Apr-1
5
Mar
-15
Feb-
15
Jan-
15
Dec
-14
Nov
-14
Oct
-14
Sep-
14
Aug-
14
Jul-1
4
Jun-
14
May
-14
Apr-1
4
Mar
-14
Feb-
14
Jan-
14
Dec
-13
Nov
-13
Oct
-13
Sep-
13
Aug-
13
Jul-1
3
2.0
1.5
1.0
0.5
0.0
Allotments Expenditures
Monthly Expenditure Comparison
Millions $
Jun-
15
May
-15
Apr-1
5
Mar
-15
Feb-
15
Jan-
15
Dec
-14
Nov
-14
Oct
-14
Sep-
14
Aug-
14
Jul-1
4
Jun-
14
May
-14
Apr-1
4
Mar
-14
Feb-
14
Jan-
14
Dec
-13
Nov
-13
Oct
-13
Sep-
13
Aug-
13
Jul-1
3
25
20
15
10
5
0
Allotments Expenditures
Cumulative toDate Expenditure Comparison
Millions $
Variance toDate:$2.6 million underexpended
72.6% underexpended
20 Quarterly Financial Report Through December 2013

Program E, Transportation Equipment Fund
Quarter Quarter Biennium to-Date Percent Biennium Expenditure
Allotments Expenditures Allotments Expenditures Variance Variance Plan Authority
Expenditure Status
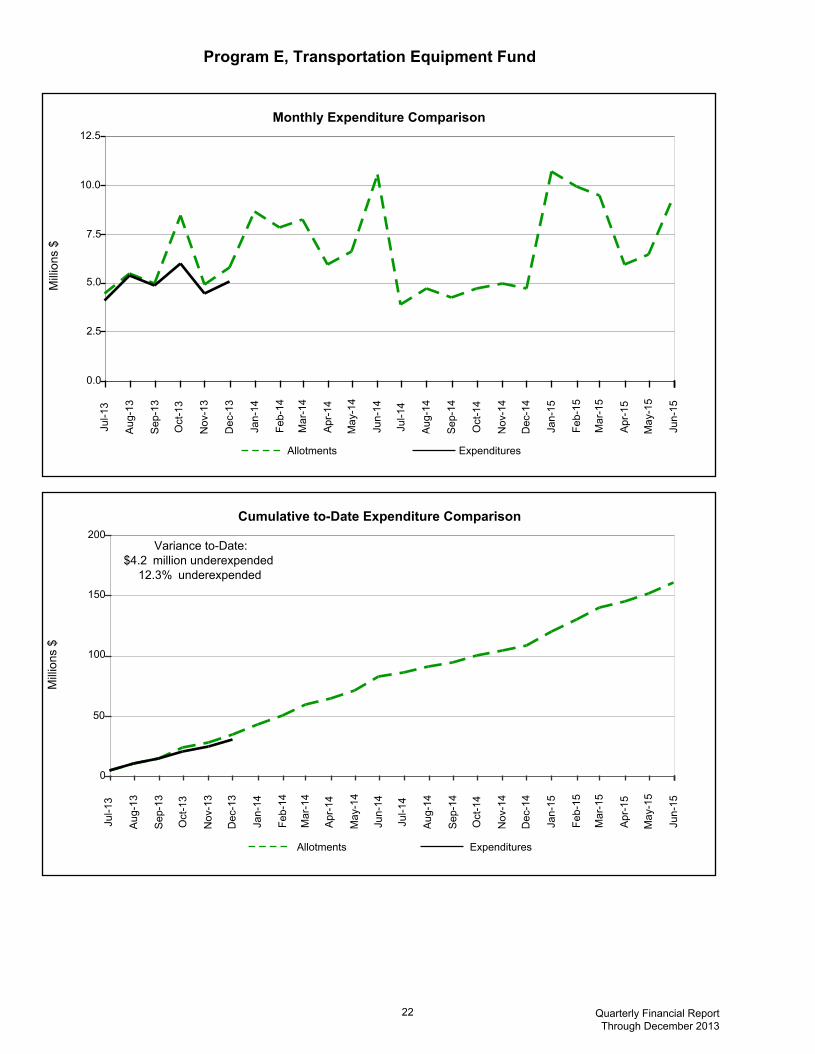
Transportation Equipment Fund 19,164,000 15,502,622 34,007,000 29,809,595 4,197,405 12.3% 160,988,000 160,988,000
Total Expenditures 19,164,000 15,502,622 34,007,000 29,809,595 4,197,405 12.3% 160,988,000 160,988,000
Sources of Funds (Accounts)
Transportation Equip. Fund-Nonappropriated Funds 19,164,000 15,502,622 34,007,000 29,809,595 4,197,405 12.3% 160,988,000 160,988,000
Total Funds 19,164,000 15,502,622 34,007,000 29,809,595 4,197,405 12.3% 160,988,000 160,988,000
FTE Status 209.3 204.6 208.1 205.3 2.8 1.4% 209.3
Note: As of December 31, 2013, the available cash balance in the state treasury for the Transportation Equipment Fund was $15,471,566 while equipment that has been ordered but not yet received totaled $10,038,361. The cash balance has been accumulating due to delays in the ordering of equipment. VARIANCE EXPLANATIONS Expenditure Status Transportation Equipment Fund: Expenditures to-date for equipment are less than planned because of delays in purchasing. The responsibility for all purchasing was transferred from the Department of Enterprise Services to the department at start of 2013-15, additional procurement staff were requested in the 2014 supplemental budget to catch up with equipment purchasing. In addition, fuel expenditures have been lower than allotments due to lower than expected consumption and prices. Source of Funds Transportation Equipment Fund-Non-appropriated Funds: See the explanation above for Transportation Equipment Fund. Allotment Adjustment Allotments were updated to add $9,772,000 to the spending plan to account for equipment ordered in the 2011-13 biennium, but not received and paid for until 2013-15.
21 Quarterly Financial Report Through December 2013
Program E, Transportation Equipment Fund
Jun-
15
May
-15
Apr-1
5
Mar
-15
Feb-
15
Jan-
15
Dec
-14
Nov
-14
Oct
-14
Sep-
14
Aug-
14
Jul-1
4
Jun-
14
May
-14
Apr-1
4
Mar
-14
Feb-
14
Jan-
14
Dec
-13
Nov
-13
Oct
-13
Sep-
13
Aug-
13
Jul-1
3
12.5
10.0
7.5
5.0
2.5
0.0
Allotments Expenditures
Monthly Expenditure Comparison
Millions $
Jun-
15
May
-15
Apr-1
5
Mar
-15
Feb-
15
Jan-
15
Dec
-14
Nov
-14
Oct
-14
Sep-
14
Aug-
14
Jul-1
4
Jun-
14
May
-14
Apr-1
4
Mar
-14
Feb-
14
Jan-
14
Dec
-13
Nov
-13
Oct
-13
Sep-
13
Aug-
13
Jul-1
3
200
150
100
50
0
Allotments Expenditures
Cumulative toDate Expenditure Comparison
Millions $
Variance toDate:$4.2 million underexpended
12.3% underexpended
22 Quarterly Financial Report Through December 2013
Program F, Aviation
Quarter Quarter Biennium to-Date Percent Biennium Expenditure
Allotments Expenditures Allotments Expenditures Variance Variance Plan Authority
Expenditure Status
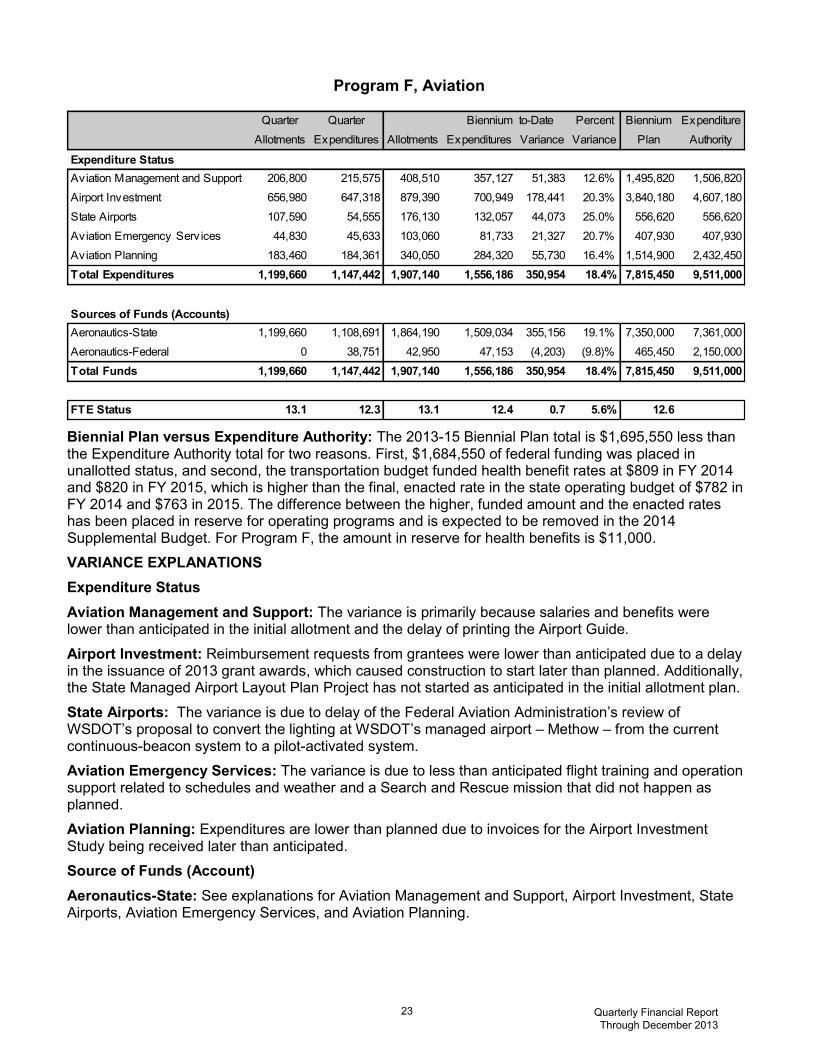
Aviation Management and Support 206,800 215,575 408,510 357,127 51,383 12.6% 1,495,820 1,506,820
Airport Investment 656,980 647,318 879,390 700,949 178,441 20.3% 3,840,180 4,607,180
State Airports 107,590 54,555 176,130 132,057 44,073 25.0% 556,620 556,620
Aviation Emergency Serv ices 44,830 45,633 103,060 81,733 21,327 20.7% 407,930 407,930
Aviation Planning 183,460 184,361 340,050 284,320 55,730 16.4% 1,514,900 2,432,450
Total Expenditures 1,199,660 1,147,442 1,907,140 1,556,186 350,954 18.4% 7,815,450 9,511,000
Sources of Funds (Accounts)
Aeronautics-State 1,199,660 1,108,691 1,864,190 1,509,034 355,156 19.1% 7,350,000 7,361,000
Aeronautics-Federal 0 38,751 42,950 47,153 (4,203) (9.8)% 465,450 2,150,000
Total Funds 1,199,660 1,147,442 1,907,140 1,556,186 350,954 18.4% 7,815,450 9,511,000
FTE Status 13.1 12.3 13.1 12.4 0.7 5.6% 12.6
Biennial Plan versus Expenditure Authority: The 2013-15 Biennial Plan total is $1,695,550 less than the Expenditure Authority total for two reasons. First, $1,684,550 of federal funding was placed in unallotted status, and second, the transportation budget funded health benefit rates at $809 in FY 2014 and $820 in FY 2015, which is higher than the final, enacted rate in the state operating budget of $782 in FY 2014 and $763 in 2015. The difference between the higher, funded amount and the enacted rates has been placed in reserve for operating programs and is expected to be removed in the 2014 Supplemental Budget. For Program F, the amount in reserve for health benefits is $11,000. VARIANCE EXPLANATIONS Expenditure Status Aviation Management and Support: The variance is primarily because salaries and benefits were lower than anticipated in the initial allotment and the delay of printing the Airport Guide. Airport Investment: Reimbursement requests from grantees were lower than anticipated due to a delay in the issuance of 2013 grant awards, which caused construction to start later than planned. Additionally, the State Managed Airport Layout Plan Project has not started as anticipated in the initial allotment plan. State Airports: The variance is due to delay of the Federal Aviation Administration’s review of WSDOT’s proposal to convert the lighting at WSDOT’s managed airport – Methow – from the current continuous-beacon system to a pilot-activated system. Aviation Emergency Services: The variance is due to less than anticipated flight training and operation support related to schedules and weather and a Search and Rescue mission that did not happen as planned. Aviation Planning: Expenditures are lower than planned due to invoices for the Airport Investment Study being received later than anticipated. Source of Funds (Account) Aeronautics-State: See explanations for Aviation Management and Support, Airport Investment, State Airports, Aviation Emergency Services, and Aviation Planning.
23 Quarterly Financial Report Through December 2013

Program F, Aviation
Jun-
15
May
-15
Apr-1
5
Mar
-15
Feb-
15
Jan-
15
Dec
-14
Nov
-14
Oct
-14
Sep-
14
Aug-
14
Jul-1
4
Jun-
14
May
-14
Apr-1
4
Mar
-14
Feb-
14
Jan-
14
Dec
-13
Nov
-13
Oct
-13
Sep-
13
Aug-
13
Jul-1
3
0.50
0.25
0.00
Allotments Expenditures
Monthly Expenditure Comparison
Millions $
Jun-
15
May
-15
Apr-1
5
Mar
-15
Feb-
15
Jan-
15
Dec
-14
Nov
-14
Oct
-14
Sep-
14
Aug-
14
Jul-1
4
Jun-
14
May
-14
Apr-1
4
Mar
-14
Feb-
14
Jan-
14
Dec
-13
Nov
-13
Oct
-13
Sep-
13
Aug-
13
Jul-1
3
10.0
7.5
5.0
2.5
0.0
Allotments Expenditures
Cumulative toDate Expenditure Comparison
Millions $
Variance toDate:$0.4 million underexpended
18.4% underexpended
24 Quarterly Financial Report Through December 2013

Program H, Program Delivery Management and Support
Quarter Quarter Biennium to-Date Percent Biennium ExpenditureAllotments Expenditures Allotments Expenditures Variance Variance Plan Authority
Expenditure Status
Headquarters Program Delivery Mgmt. and Support 1,953,300 1,915,529 3,907,900 3,813,811 94,089 2.4% 15,765,700 15,855,200Regional Program Delivery Mgmt. and Support 1,483,200 1,438,472 3,024,100 2,928,104 95,996 3.2% 12,031,000 12,101,800Headquarters Environmental Services Office 2,544,900 2,291,347 4,674,000 4,306,082 367,918 7.9% 19,969,900 20,400,000Total Expenditures 5,981,400 5,645,347 11,606,000 11,047,997 558,004 4.8% 47,766,600 48,357,000
Sources of Funds (Accounts)
Motor Vehicle-State 5,900,340 5,538,074 11,443,980 10,896,684 547,296 4.8% 47,364,000 47,607,000Motor Vehicle-Federal 49,560 74,839 99,020 95,115 3,905 3.9% 152,600 500,000Multimodal Transportation-State 31,500 32,434 63,000 56,198 6,802 10.8% 250,000 250,000Total Funds 5,981,400 5,645,347 11,606,000 11,047,997 558,004 4.8% 47,766,600 48,357,000
FTE Status 214.0 202.3 214.0 203.5 10.4 4.9% 213.4 Biennium Plan versus Expenditure Authority: The 2013-15 Biennium Plan total is less than the Expenditure Authority total because $347,400 of federal authority was placed in unallotted status. Should federal funds become available, the federal authority will be allotted and a spending plan will be submitted through a quarterly allotment adjustment. In addition, the transportation budget funded health benefit rates at $809 in FY 2014 and $820 in FY 2015, which is higher than the final, enacted rate in the state operating budget of $782 in FY 2014 and $763 in 2015. The difference between the higher, funded amount and the enacted rates has been placed in reserve for operating programs and is expected to be removed in the 2014 Supplemental Budget. For Program H, the amount in reserve for health benefits is $243,000. VARIANCE EXPLANATIONS Source of Funds Multimodal Transportation–State: Underruns in salaries and benefits are the cause of this variance.
25 Quarterly Financial Report Through December 2013

Program H, Program Delivery Management and Support
Jun-
15
May
-15
Apr-1
5
Mar
-15
Feb-
15
Jan-
15
Dec
-14
Nov
-14
Oct
-14
Sep-
14
Aug-
14
Jul-1
4
Jun-
14
May
-14
Apr-1
4
Mar
-14
Feb-
14
Jan-
14
Dec
-13
Nov
-13
Oct
-13
Sep-
13
Aug-
13
Jul-1
3
2.5
2.0
1.5
1.0
0.5
0.0
Allotments Expenditures
Monthly Expenditure Comparison
Millions $
Jun-
15
May
-15
Apr-1
5
Mar
-15
Feb-
15
Jan-
15
Dec
-14
Nov
-14
Oct
-14
Sep-
14
Aug-
14
Jul-1
4
Jun-
14
May
-14
Apr-1
4
Mar
-14
Feb-
14
Jan-
14
Dec
-13
Nov
-13
Oct
-13
Sep-
13
Aug-
13
Jul-1
3
50
40
30
20
10
0
Allotments Expenditures
Cumulative toDate Expenditure Comparison
Millions $
Variance toDate:$0.6 million underexpended
4.8% underexpended
26 Quarterly Financial Report Through December 2013

Program I, Highway Improvements
Quarter Quarter Biennium to-Date Percent Biennium ExpenditureAllotments Expenditures Allotments Expenditures Variance Variance Plan Authority
Expenditure Status
Mobility Improvements 366,366,000 339,790,983 707,443,000 509,208,302 198,234,698 28.0% 2,836,145,000 3,168,645,000Safety Improvements 12,423,000 14,206,721 32,849,000 28,168,041 4,680,959 14.2% 88,418,500 88,418,500Economic Initiatives Improvements 16,258,000 16,232,720 38,850,000 31,868,993 6,981,007 18.0% 123,184,000 123,184,000Environmental Retrofit Improvements 7,783,000 6,067,302 18,272,000 11,704,158 6,567,842 35.9% 59,485,000 59,485,000Program Support Budgeted Improvements 3,874,000 3,413,993 7,749,000 6,634,311 1,114,689 14.4% 20,413,000 38,413,000Regional Transit Authority Improvements 1,299,000 3,891,593 2,053,000 4,997,311 (2,944,311) (143.4)% 67,099,000 67,099,000Total Expenditures 408,003,000 383,603,311 807,216,000 592,581,116 214,634,884 26.6% 3,194,744,500 3,545,244,500
Sources of Funds (Accounts)
Transportation Partnership-State 160,016,000 147,291,608 316,518,000 250,033,705 66,484,295 21.0% 1,534,698,000 1,534,698,000Motor Vehicle-State 7,208,000 8,295,138 18,494,000 15,254,438 3,239,562 17.5% 43,508,000 61,508,000Motor Vehicle-Federal 34,434,000 81,935,901 74,022,000 120,485,694 (46,463,694) (62.8)% 431,356,000 431,356,000Motor Vehicle-Local 61,927,000 4,147,962 133,269,000 7,441,164 125,827,836 94.4% 160,018,500 160,018,500Motor Vehicle-Federal-ARRA 1,082,000 0 1,443,000 0 1,443,000 100.0% 9,983,000 9,983,000State Route Number 520 Corridor-Federal 0 0 0 0 0 0.0% 194,915,000 300,000,000State Route Number 520 Corridor-State 105,461,000 113,653,660 185,651,000 151,753,096 33,897,904 18.3% 509,790,000 737,205,000Special Category "C"-State 0 0 0 0 0 0.0% 124,000 124,000Multimodal Transportation-State 0 0 0 0 0 0.0% 1,000,000 1,000,000Transportation 2003 (Nickel)-State 36,576,000 24,387,448 75,766,000 42,615,707 33,150,293 43.8% 242,253,000 242,253,000Misc. Trans. Program-Nonappropriated Funds 1,299,000 3,891,593 2,053,000 4,997,311 (2,944,311) (143.4)% 67,099,000 67,099,000Total Funds 408,003,000 383,603,311 807,216,000 592,581,116 214,634,884 26.6% 3,194,744,500 3,545,244,500
FTE Status 1,529.1 1,263.8 1,523.4 1,286.1 237.3 15.6% 1,405.5
Biennial Plan versus Expenditure Authority: The 2013-15 Biennial Plan total is $350,500,000 less than the Expenditure Authority total. The Legislature provided full authority for the State Route 520 Bridge Replacement project. The current biennium’s spending plan for this project is $332,500,000 less than the total amount appropriated. This difference has been placed in un-allotted status. In addition, $18,000,000 of Motor Vehicle-State has been placed in un-allotted status as directed by the Legislature until the Office of Financial Management has certified that the department’s 2014 Supplemental Budget request conforms to certain requirements. VARIANCE EXPLANATIONS Expenditure Status: A combination of favorable bids and various project expenditure delays and savings resulted in a variance from estimated expenditures. Specific examples include: Mobility Improvements: "I-5/Portland Ave to Port of Tacoma Rd - NB HOV" - Project bid opening was canceled in May 2013 after right of way negotiations with the Puyallup Tribe were deferred. "I-5/Mellen Street I/C to Grand Mound I/C - Add Lanes" – Project cost reduction due to updated estimate and favorable bids.
27 Quarterly Financial Report Through December 2013

Program I, Highway Improvements (Continued)
"I-5/Columbia River Crossing/Vancouver - EIS" – Project has been cancelled. "SR 99/S King St Vic to Roy St - Viaduct Replacement" - The variance is a result of deferred work on the Bored Tunnel contractor's schedule. "SR 502/I-5 to Battle Ground - Add Lanes" – Completion date and expenditure delay due to delay in acquiring all necessary right of way.
Safety Improvements: "US 2/Bickford Avenue - Intersection Safety Improvements" – There was an expenditure reduction due to reimbursement from the Traffic Safety Commission. "SR 243/Mattawa - Intersection Improvements" – The advertisement date has been delayed while various design solutions are explored with public input. Economic Initiatives Improvements: “I-90/Snowshed to Keechelus Dam Phase 1C - Replace Snowshed and Add Lanes” - The project was updated to reflect construction of a bridge in lieu of the snowshed, which caused a delay from the original schedule. Environmental Retrofit Improvements: “SR 20/Skagit River CED - Permanent Restoration” – Under spending is due to an overall project savings from favorable bids. “SR 106/Twanoh Falls - Chronic Environmental Deficiency” - Under spending is due to an overall project savings from favorable bids. Program Support Improvements: Expenditures to-date are less than anticipated for program support activities. Regional Transit Authority Improvements: “I-90/Two Way Transit - Transit and HOV Improvements” - The expenditures to-date for this project are greater than anticipated in the original spending plan. Source of Funds (Account): Transportation Partnership-State: The variance is due to less than anticipated expenditures to date on projects including, “I-5/Portland Ave to Port of Tacoma Rd - NB HOV” Motor Vehicle Account-State: The variance is due to less than anticipated expenditures to-date on projects including, “SR 20/Skagit River CED - Permanent Restoration” and “SR 243/Mattawa – Intersection Improvements”.
Motor Vehicle Account-Federal: The variance is due to greater than anticipated federal expenditures to-date on projects including, “SR 99/S King St Vic to Roy St - Viaduct Replacement.” Motor Vehicle Account-Local: The variance is due to less than anticipated expenditures to-date on projects including, “US 2/Bickford Avenue - Intersection Safety Improvements.” Motor Vehicle Account-Federal ARRA: All ARRA funds have expended in prior biennia. Allotment in this fund source will be adjusted to zero. State Route 520 Corridor-State: The variance is due to less than anticipated expenditures to-date for this fund source on projects including, “SR 520/I-5 to Medina - Evergreen Point Floating Bridge and Landings” project.
Transportation 2003 (Nickel)-State: The variance is due to less than anticipated expenditures to-date on projects including, “SR 99/S King St Vic to Roy St - Viaduct Replacement” and “SR 522/Snohomish River Bridge to US 2 - Add Lanes.”
28 Quarterly Financial Report Through December 2013

Program I, Highway Improvements (Continued)
Miscellaneous Transportation Programs-Local: See explanation under Regional Transit Authority Improvements.
FTE Status: The attrition rate to-date in the Improvements Program is higher than was anticipated in the allotment plan.
29 Quarterly Financial Report Through December 2013

Program I, Improvements
Jun-
15
May
-15
Apr-1
5
Mar
-15
Feb-
15
Jan-
15
Dec
-14
Nov
-14
Oct
-14
Sep-
14
Aug-
14
Jul-1
4
Jun-
14
May
-14
Apr-1
4
Mar
-14
Feb-
14
Jan-
14
Dec
-13
Nov
-13
Oct
-13
Sep-
13
Aug-
13
Jul-1
3
500
400
300
200
100
0
Allotments Expenditures
Monthly Expenditure Comparison
Millions $
Jun-
15
May
-15
Apr-1
5
Mar
-15
Feb-
15
Jan-
15
Dec
-14
Nov
-14
Oct
-14
Sep-
14
Aug-
14
Jul-1
4
Jun-
14
May
-14
Apr-1
4
Mar
-14
Feb-
14
Jan-
14
Dec
-13
Nov
-13
Oct
-13
Sep-
13
Aug-
13
Jul-1
3
4,000
3,000
2,000
1,000
0
Allotments Expenditures
Cumulative toDate Expenditure Comparison
Millions $
Variance toDate:$214.6 million underexpended
26.6% underexpended
30 Quarterly Financial Report Through December 2013
Program K, Public/ Private Partnerships
Quarter Quarter Biennium to-Date Percent Biennium ExpenditureAllotments Expenditures Allotments Expenditures Variance Variance Plan Authority
Expenditure Status
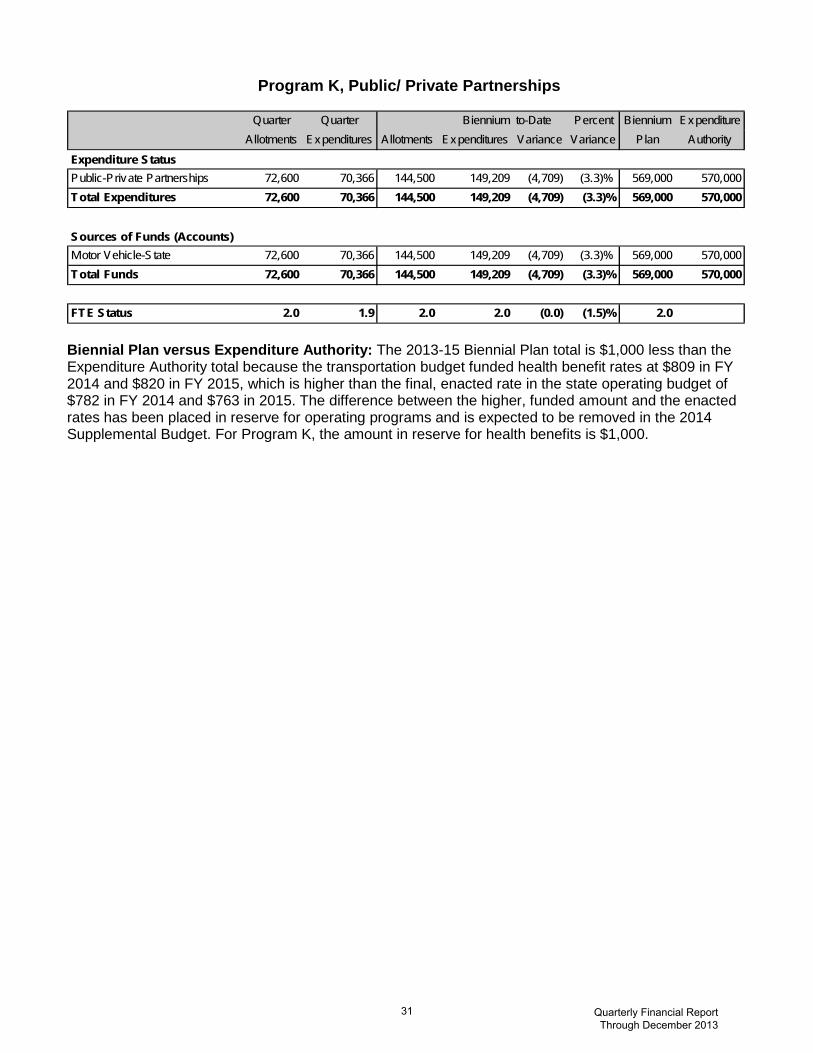
Public-Private Partnerships 72,600 70,366 144,500 149,209 (4,709) (3.3)% 569,000 570,000Total Expenditures 72,600 70,366 144,500 149,209 (4,709) (3.3)% 569,000 570,000
Sources of Funds (Accounts)
Motor Vehicle-State 72,600 70,366 144,500 149,209 (4,709) (3.3)% 569,000 570,000Total Funds 72,600 70,366 144,500 149,209 (4,709) (3.3)% 569,000 570,000
FTE Status 2.0 1.9 2.0 2.0 (0.0) (1.5)% 2.0 Biennial Plan versus Expenditure Authority: The 2013-15 Biennial Plan total is $1,000 less than the Expenditure Authority total because the transportation budget funded health benefit rates at $809 in FY 2014 and $820 in FY 2015, which is higher than the final, enacted rate in the state operating budget of $782 in FY 2014 and $763 in 2015. The difference between the higher, funded amount and the enacted rates has been placed in reserve for operating programs and is expected to be removed in the 2014 Supplemental Budget. For Program K, the amount in reserve for health benefits is $1,000.
31 Quarterly Financial Report Through December 2013

Program K, PublicPrivate Partnerships
Jun-
15
May
-15
Apr-1
5
Mar
-15
Feb-
15
Jan-
15
Dec
-14
Nov
-14
Oct
-14
Sep-
14
Aug-
14
Jul-1
4
Jun-
14
May
-14
Apr-1
4
Mar
-14
Feb-
14
Jan-
14
Dec
-13
Nov
-13
Oct
-13
Sep-
13
Aug-
13
Jul-1
3
0.05
0.04
0.03
0.02
0.01
0.00
Allotments Expenditures
Monthly Expenditure Comparison
Millions $
Jun-
15
May
-15
Apr-1
5
Mar
-15
Feb-
15
Jan-
15
Dec
-14
Nov
-14
Oct
-14
Sep-
14
Aug-
14
Jul-1
4
Jun-
14
May
-14
Apr-1
4
Mar
-14
Feb-
14
Jan-
14
Dec
-13
Nov
-13
Oct
-13
Sep-
13
Aug-
13
Jul-1
3
0.8
0.6
0.4
0.2
0.0
Allotments Expenditures
Cumulative toDate Expenditure Comparison
Millions $
Variance toDate:($0.0) million overexpended
(3.3)% overexpended
32 Quarterly Financial Report Through December 2013
Program M, Highway Maintenance and Operations
Quarter Quarter Biennium to-Date Percent Biennium ExpenditureAllotments Expenditures Allotments Expenditures Variance Variance Plan Authority
Expenditure Status
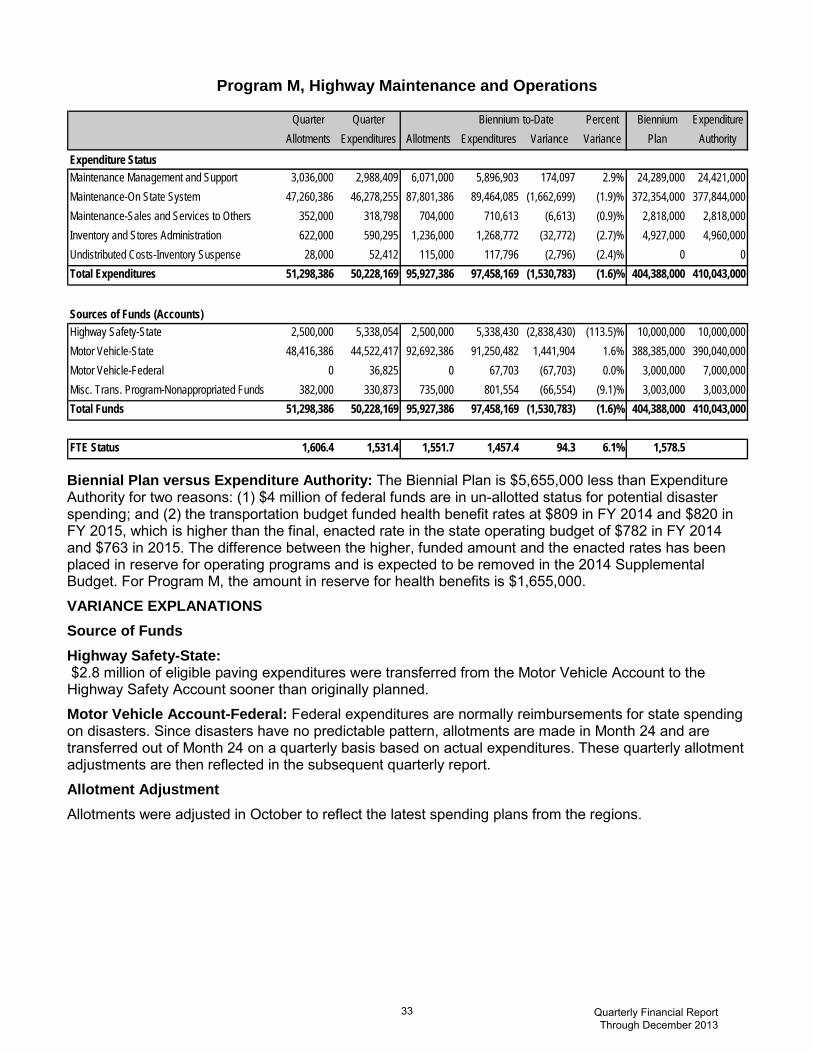
Maintenance Management and Support 3,036,000 2,988,409 6,071,000 5,896,903 174,097 2.9% 24,289,000 24,421,000Maintenance-On State System 47,260,386 46,278,255 87,801,386 89,464,085 (1,662,699) (1.9)% 372,354,000 377,844,000Maintenance-Sales and Services to Others 352,000 318,798 704,000 710,613 (6,613) (0.9)% 2,818,000 2,818,000Inventory and Stores Administration 622,000 590,295 1,236,000 1,268,772 (32,772) (2.7)% 4,927,000 4,960,000Undistributed Costs-Inventory Suspense 28,000 52,412 115,000 117,796 (2,796) (2.4)% 0 0Total Expenditures 51,298,386 50,228,169 95,927,386 97,458,169 (1,530,783) (1.6)% 404,388,000 410,043,000
Sources of Funds (Accounts)
Highway Safety-State 2,500,000 5,338,054 2,500,000 5,338,430 (2,838,430) (113.5)% 10,000,000 10,000,000Motor Vehicle-State 48,416,386 44,522,417 92,692,386 91,250,482 1,441,904 1.6% 388,385,000 390,040,000Motor Vehicle-Federal 0 36,825 0 67,703 (67,703) 0.0% 3,000,000 7,000,000Misc. Trans. Program-Nonappropriated Funds 382,000 330,873 735,000 801,554 (66,554) (9.1)% 3,003,000 3,003,000Total Funds 51,298,386 50,228,169 95,927,386 97,458,169 (1,530,783) (1.6)% 404,388,000 410,043,000
FTE Status 1,606.4 1,531.4 1,551.7 1,457.4 94.3 6.1% 1,578.5
Biennial Plan versus Expenditure Authority: The Biennial Plan is $5,655,000 less than Expenditure Authority for two reasons: (1) $4 million of federal funds are in un-allotted status for potential disaster spending; and (2) the transportation budget funded health benefit rates at $809 in FY 2014 and $820 in FY 2015, which is higher than the final, enacted rate in the state operating budget of $782 in FY 2014 and $763 in 2015. The difference between the higher, funded amount and the enacted rates has been placed in reserve for operating programs and is expected to be removed in the 2014 Supplemental Budget. For Program M, the amount in reserve for health benefits is $1,655,000. VARIANCE EXPLANATIONS Source of Funds Highway Safety-State: $2.8 million of eligible paving expenditures were transferred from the Motor Vehicle Account to the Highway Safety Account sooner than originally planned. Motor Vehicle Account-Federal: Federal expenditures are normally reimbursements for state spending on disasters. Since disasters have no predictable pattern, allotments are made in Month 24 and are transferred out of Month 24 on a quarterly basis based on actual expenditures. These quarterly allotment adjustments are then reflected in the subsequent quarterly report. Allotment Adjustment Allotments were adjusted in October to reflect the latest spending plans from the regions.
33 Quarterly Financial Report Through December 2013
Program M, Highway Maintenance and Operations
Jun-
15
May
-15
Apr-1
5
Mar
-15
Feb-
15
Jan-
15
Dec
-14
Nov
-14
Oct
-14
Sep-
14
Aug-
14
Jul-1
4
Jun-
14
May
-14
Apr-1
4
Mar
-14
Feb-
14
Jan-
14
Dec
-13
Nov
-13
Oct
-13
Sep-
13
Aug-
13
Jul-1
3
25
20
15
10
5
0
Allotments Expenditures
Monthly Expenditure Comparison
Millions $
Jun-
15
May
-15
Apr-1
5
Mar
-15
Feb-
15
Jan-
15
Dec
-14
Nov
-14
Oct
-14
Sep-
14
Aug-
14
Jul-1
4
Jun-
14
May
-14
Apr-1
4
Mar
-14
Feb-
14
Jan-
14
Dec
-13
Nov
-13
Oct
-13
Sep-
13
Aug-
13
Jul-1
3
500
400
300
200
100
0
Allotments Expenditures
Cumulative toDate Expenditure Comparison
Millions $
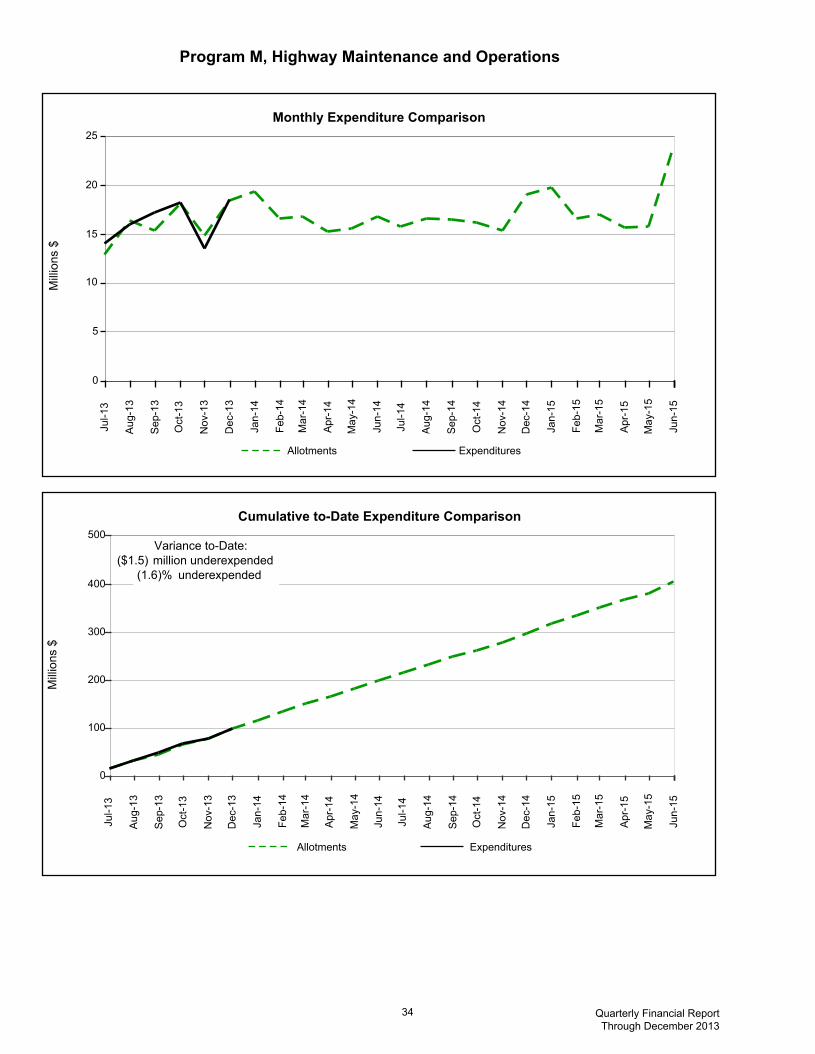
Variance toDate:($1.5) million underexpended
(1.6)% underexpended
34 Quarterly Financial Report Through December 2013

Subprogram M2, Maintenance - On State Systems
Quarter Quarter BiennialActivities Detail Plan Expenditures Detail Plan Expenditures Variance PlanExpenditure Status
Roadway Maintenance and Operations 4,620,115 5,002,418 13,979,833 13,630,605 349,228 2.5% 51,909,221 Drainage Maintenance and Slope Repair 4,351,551 3,667,938 8,239,616 7,353,896 885,720 10.7% 41,311,797 Roadside and Landscape Maintenance 3,693,630 4,313,940 8,486,567 9,309,167 (822,600) (9.7)% 36,888,472 Bridge and Tunnel Maintenance 3,303,546 3,621,414 7,125,728 7,211,817 (86,089) (1.2)% 30,639,231 Snow and Ice Control 13,286,227 13,042,752 16,197,551 16,230,263 (32,712) (0.2)% 79,798,168 Traffic Services 9,197,412 8,867,921 20,318,842 21,289,802 (970,960) (4.8)% 74,260,002 Rest Area Maintenance 1,545,861 1,570,577 3,142,150 3,134,364 7,786 0.2% 12,827,314 Training and Testing 2,433,784 2,733,631 4,570,679 4,804,751 (234,072) (5.1)% 19,879,168 3rd Party Damage Repair 2,682,593 3,031,424 5,036,640 5,556,657 (520,017) (10.3)% 20,596,961 Disaster Operations 281,393 426,240 383,548 942,762 (559,214) (145.8)% 4,243,666 Total Expenditures 45,396,112 46,278,255 87,481,154 89,464,085 (1,982,931) (2.3)% 372,354,000
Percent Variance
Biennium to-Date
VARIANCE EXPLANATIONS Drainage Maintenance and Slope Repair: The under-spending is the result of staff vacancies and delays in drainage maintenance due to other emergent needs. Regions will increase efforts during the remainder of this fiscal year. 3rd Party Damage Repair: Damage to the highway infrastructure by the traveling public has been more than anticipated. Repairs are a high priority and are accomplished as soon as possible. Disaster Operations: The negative variance is primarily the result of our response efforts to several mudslides and slope damage that occurred due to heavy rainfalls. North Central Region expended approximately $400,000 for mudslides on SR 20 that may not qualify for federal reimbursement due to the $700,000 threshold set by FHWA. South Central Region has expended $277,000 for slides on SR 20 that is pending FHWA approval and federal reimbursement. Once reimbursement occurs, an allotment adjustment will be processed.
35 Quarterly Financial Report Through December 2013
Program P, Highway Preservation
Quarter Quarter Biennium to-Date Percent Biennium ExpenditureAllotments Expenditures Allotments Expenditures Variance Variance Plan Authority
Expenditure Status
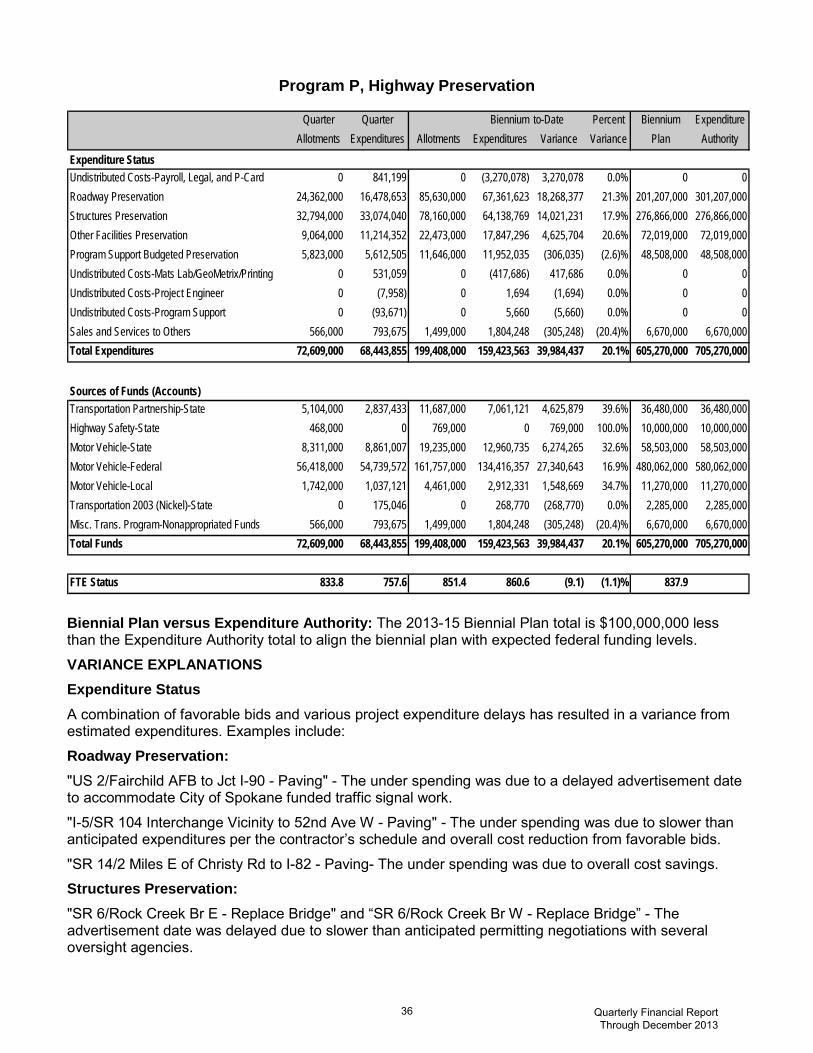
Undistributed Costs-Payroll, Legal, and P-Card 0 841,199 0 (3,270,078) 3,270,078 0.0% 0 0Roadway Preservation 24,362,000 16,478,653 85,630,000 67,361,623 18,268,377 21.3% 201,207,000 301,207,000Structures Preservation 32,794,000 33,074,040 78,160,000 64,138,769 14,021,231 17.9% 276,866,000 276,866,000Other Facilities Preservation 9,064,000 11,214,352 22,473,000 17,847,296 4,625,704 20.6% 72,019,000 72,019,000Program Support Budgeted Preservation 5,823,000 5,612,505 11,646,000 11,952,035 (306,035) (2.6)% 48,508,000 48,508,000Undistributed Costs-Mats Lab/GeoMetrix/Printing 0 531,059 0 (417,686) 417,686 0.0% 0 0Undistributed Costs-Project Engineer 0 (7,958) 0 1,694 (1,694) 0.0% 0 0Undistributed Costs-Program Support 0 (93,671) 0 5,660 (5,660) 0.0% 0 0Sales and Services to Others 566,000 793,675 1,499,000 1,804,248 (305,248) (20.4)% 6,670,000 6,670,000Total Expenditures 72,609,000 68,443,855 199,408,000 159,423,563 39,984,437 20.1% 605,270,000 705,270,000
Sources of Funds (Accounts)
Transportation Partnership-State 5,104,000 2,837,433 11,687,000 7,061,121 4,625,879 39.6% 36,480,000 36,480,000Highway Safety-State 468,000 0 769,000 0 769,000 100.0% 10,000,000 10,000,000Motor Vehicle-State 8,311,000 8,861,007 19,235,000 12,960,735 6,274,265 32.6% 58,503,000 58,503,000Motor Vehicle-Federal 56,418,000 54,739,572 161,757,000 134,416,357 27,340,643 16.9% 480,062,000 580,062,000Motor Vehicle-Local 1,742,000 1,037,121 4,461,000 2,912,331 1,548,669 34.7% 11,270,000 11,270,000Transportation 2003 (Nickel)-State 0 175,046 0 268,770 (268,770) 0.0% 2,285,000 2,285,000Misc. Trans. Program-Nonappropriated Funds 566,000 793,675 1,499,000 1,804,248 (305,248) (20.4)% 6,670,000 6,670,000Total Funds 72,609,000 68,443,855 199,408,000 159,423,563 39,984,437 20.1% 605,270,000 705,270,000
FTE Status 833.8 757.6 851.4 860.6 (9.1) (1.1)% 837.9
Biennial Plan versus Expenditure Authority: The 2013-15 Biennial Plan total is $100,000,000 less than the Expenditure Authority total to align the biennial plan with expected federal funding levels. VARIANCE EXPLANATIONS Expenditure Status A combination of favorable bids and various project expenditure delays has resulted in a variance from estimated expenditures. Examples include: Roadway Preservation: "US 2/Fairchild AFB to Jct I-90 - Paving" - The under spending was due to a delayed advertisement date to accommodate City of Spokane funded traffic signal work. "I-5/SR 104 Interchange Vicinity to 52nd Ave W - Paving" - The under spending was due to slower than anticipated expenditures per the contractor’s schedule and overall cost reduction from favorable bids. "SR 14/2 Miles E of Christy Rd to I-82 - Paving- The under spending was due to overall cost savings. Structures Preservation: "SR 6/Rock Creek Br E - Replace Bridge" and “SR 6/Rock Creek Br W - Replace Bridge” - The advertisement date was delayed due to slower than anticipated permitting negotiations with several oversight agencies.
36 Quarterly Financial Report Through December 2013

Program P, Highway Preservation (Continued)
"SR 433/Lewis and Clark Bridge - Superstructure Painting" - The under spending is due to a revised contractor’s schedule. Other Facilities Preservation: "SR 7/Alder Canyon Slide - Emergency Slope Stabilization" - The construction cost for this project decreased based on the recommendation of the geotechnical investigation and analysis. "US 2/Stevens Pass West - Slope Stabilization" – Under spending this biennium resulted from higher than anticipated spending last biennium per the contractor’s schedule. "I-90/Indian John Hill EB and WB Rest Areas - Replace Lighting System" – Schedule and expenditure delay due to delay in luminaire pole procurement. Undistributed Costs Mats Lab/Geo/Printing, Undistributed Costs Project Engineer, and Undistributed Costs Direct Project Support: These subprograms contain cost recovery and suspense accounts that are not allotted and will be zeroed out at the end of the fiscal year. Sales and Services to Others: Regions are using mores Sales and Service to Others than originally planned based on historical expenditures. Source of Funds (Account) Transportation Partnership - State: Expenditures were less than planned due to less expenditure activity to date on projects, including “SR 6/Rock Creek Br E - Replace Bridge.” Highway Safety Account - State: Expenditures were less than planned due to less expenditure activity to date on projects, including “I-5/S 216th St Vic to I-405 I/C Vic - Concrete Pavement Replacement”. Motor Vehicle Account-State: Expenditures were less than planned due to less expenditure activity to date on projects, including “SR 23/Jct US 195 to Jct I-90 - Chip Seal.” Motor Vehicle Account-Federal: Expenditures were less than planned due to less expenditure activity to date on projects, including “US 2/Fairchild AFB to Jct I-90 - Paving.” Motor Vehicle Account-Local: Expenditures were less than planned due to less expenditure activity to date on projects, including "SR 433/Lewis and Clark Bridge - Superstructure Painting". Miscellaneous Transportation Programs - Local: See explanation under Sales and Services to Others above.
37 Quarterly Financial Report Through December 2013

Program P, Preservation
Jun-
15
May
-15
Apr-1
5
Mar
-15
Feb-
15
Jan-
15
Dec
-14
Nov
-14
Oct
-14
Sep-
14
Aug-
14
Jul-1
4
Jun-
14
May
-14
Apr-1
4
Mar
-14
Feb-
14
Jan-
14
Dec
-13
Nov
-13
Oct
-13
Sep-
13
Aug-
13
Jul-1
3
50
25
0
Allotments Expenditures
Monthly Expenditure Comparison
Millions $
Jun-
15
May
-15
Apr-1
5
Mar
-15
Feb-
15
Jan-
15
Dec
-14
Nov
-14
Oct
-14
Sep-
14
Aug-
14
Jul-1
4
Jun-
14
May
-14
Apr-1
4
Mar
-14
Feb-
14
Jan-
14
Dec
-13
Nov
-13
Oct
-13
Sep-
13
Aug-
13
Jul-1
3
750
500
250
0
Allotments Expenditures
Cumulative toDate Expenditure Comparison
Millions $
Variance toDate:$40.0 million underexpended
20.1% underexpended
38 Quarterly Financial Report Through December 2013
Program Q, Traffic Operations - Operating
Quarter Quarter Biennium to-Date Percent Biennium ExpenditureAllotments Expenditures Allotments Expenditures Variance Variance Plan Authority
Expenditure Status
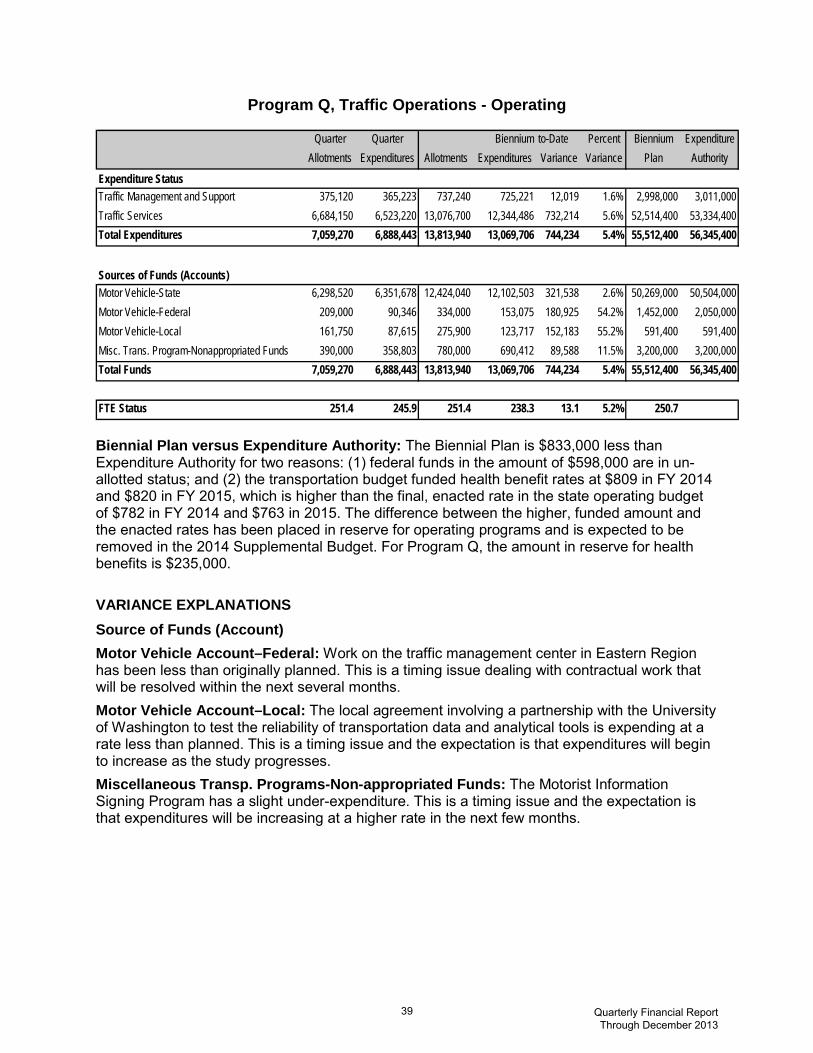
Traffic Management and Support 375,120 365,223 737,240 725,221 12,019 1.6% 2,998,000 3,011,000Traffic Services 6,684,150 6,523,220 13,076,700 12,344,486 732,214 5.6% 52,514,400 53,334,400Total Expenditures 7,059,270 6,888,443 13,813,940 13,069,706 744,234 5.4% 55,512,400 56,345,400
Sources of Funds (Accounts)
Motor Vehicle-State 6,298,520 6,351,678 12,424,040 12,102,503 321,538 2.6% 50,269,000 50,504,000Motor Vehicle-Federal 209,000 90,346 334,000 153,075 180,925 54.2% 1,452,000 2,050,000Motor Vehicle-Local 161,750 87,615 275,900 123,717 152,183 55.2% 591,400 591,400Misc. Trans. Program-Nonappropriated Funds 390,000 358,803 780,000 690,412 89,588 11.5% 3,200,000 3,200,000Total Funds 7,059,270 6,888,443 13,813,940 13,069,706 744,234 5.4% 55,512,400 56,345,400
FTE Status 251.4 245.9 251.4 238.3 13.1 5.2% 250.7
Biennial Plan versus Expenditure Authority: The Biennial Plan is $833,000 less than Expenditure Authority for two reasons: (1) federal funds in the amount of $598,000 are in un-allotted status; and (2) the transportation budget funded health benefit rates at $809 in FY 2014 and $820 in FY 2015, which is higher than the final, enacted rate in the state operating budget of $782 in FY 2014 and $763 in 2015. The difference between the higher, funded amount and the enacted rates has been placed in reserve for operating programs and is expected to be removed in the 2014 Supplemental Budget. For Program Q, the amount in reserve for health benefits is $235,000. VARIANCE EXPLANATIONS Source of Funds (Account) Motor Vehicle Account–Federal: Work on the traffic management center in Eastern Region has been less than originally planned. This is a timing issue dealing with contractual work that will be resolved within the next several months. Motor Vehicle Account–Local: The local agreement involving a partnership with the University of Washington to test the reliability of transportation data and analytical tools is expending at a rate less than planned. This is a timing issue and the expectation is that expenditures will begin to increase as the study progresses. Miscellaneous Transp. Programs-Non-appropriated Funds: The Motorist Information Signing Program has a slight under-expenditure. This is a timing issue and the expectation is that expenditures will be increasing at a higher rate in the next few months.
39 Quarterly Financial Report Through December 2013

Program Q, Traffic OperationsOperating
Jun-
15
May
-15
Apr-1
5
Mar
-15
Feb-
15
Jan-
15
Dec
-14
Nov
-14
Oct
-14
Sep-
14
Aug-
14
Jul-1
4
Jun-
14
May
-14
Apr-1
4
Mar
-14
Feb-
14
Jan-
14
Dec
-13
Nov
-13
Oct
-13
Sep-
13
Aug-
13
Jul-1
3
3
2
1
0
Allotments Expenditures
Monthly Expenditure Comparison
Millions $
Jun-
15
May
-15
Apr-1
5
Mar
-15
Feb-
15
Jan-
15
Dec
-14
Nov
-14
Oct
-14
Sep-
14
Aug-
14
Jul-1
4
Jun-
14
May
-14
Apr-1
4
Mar
-14
Feb-
14
Jan-
14
Dec
-13
Nov
-13
Oct
-13
Sep-
13
Aug-
13
Jul-1
3
50
25
0
Allotments Expenditures
Cumulative toDate Expenditure Comparison
Millions $
Variance toDate:$0.7 million underexpended
5.4% underexpended
40 Quarterly Financial Report Through December 2013

Program Q, Traffic Operations - Capital
Quarter Quarter Biennium to-Date Percent Biennium ExpenditureAllotments Expenditures Allotments Expenditures Variance Variance Plan Authority
Expenditure Status
Special Advanced Technology Projects 564,000 703,464 839,000 2,157,684 (1,318,684) (157.2)% 7,204,000 11,153,000Total Expenditures 564,000 703,464 839,000 2,157,684 (1,318,684) (157.2)% 7,204,000 11,153,000
Sources of Funds (Accounts)
Motor Vehicle-State 229,000 286,070 345,000 737,068 (392,068) (113.6)% 2,500,000 3,194,000Motor Vehicle-Federal 335,000 417,395 494,000 1,420,616 (926,616) (187.6)% 4,704,000 7,959,000Total Funds 564,000 703,464 839,000 2,157,684 (1,318,684) (157.2)% 7,204,000 11,153,000
FTE Status 10.3 6.3 10.3 7.2 3.1 30.3% 10.3 Biennial Plan versus Expenditure Authority: The Biennial Plan is less than Expenditure Authority because $3,255,000 of federal spending authority and $694,000 of state matching funds were placed in un-allotted status until the department is awarded federally-selected competitive grants or Congressional earmark projects. VARIANCE EXPLANATIONS Expenditure Status Special Advanced Technology Projects: The negative variance reflects numerous projects that were expected to be completed in the 2011-13 biennium but are continuing into the 2013-15 biennium. The 2014 Supplemental Budget Request includes re-appropriation requests for these projects. Source of Funds (Account) Motor Vehicle Account-State: See explanation for Special Advanced Technology Projects. Motor Vehicle Account-Federal: See explanation for Special Advanced Technology Projects. FTE Status: FTE usage was less than anticipated.
41 Quarterly Financial Report Through December 2013

Program Q, Traffic OperationsCapital
Jun-
15
May
-15
Apr-1
5
Mar
-15
Feb-
15
Jan-
15
Dec
-14
Nov
-14
Oct
-14
Sep-
14
Aug-
14
Jul-1
4
Jun-
14
May
-14
Apr-1
4
Mar
-14
Feb-
14
Jan-
14
Dec
-13
Nov
-13
Oct
-13
Sep-
13
Aug-
13
Jul-1
3
1.0
0.8
0.5
0.3
0.0
Allotments Expenditures
Monthly Expenditure Comparison
Millions $
Jun-
15
May
-15
Apr-1
5
Mar
-15
Feb-
15
Jan-
15
Dec
-14
Nov
-14
Oct
-14
Sep-
14
Aug-
14
Jul-1
4
Jun-
14
May
-14
Apr-1
4
Mar
-14
Feb-
14
Jan-
14
Dec
-13
Nov
-13
Oct
-13
Sep-
13
Aug-
13
Jul-1
3
8
5
3
0
Allotments Expenditures
Cumulative toDate Expenditure Comparison
Millions $
Variance toDate:($1.3) million overexpended
(157.2)% overexpended
42 Quarterly Financial Report Through December 2013
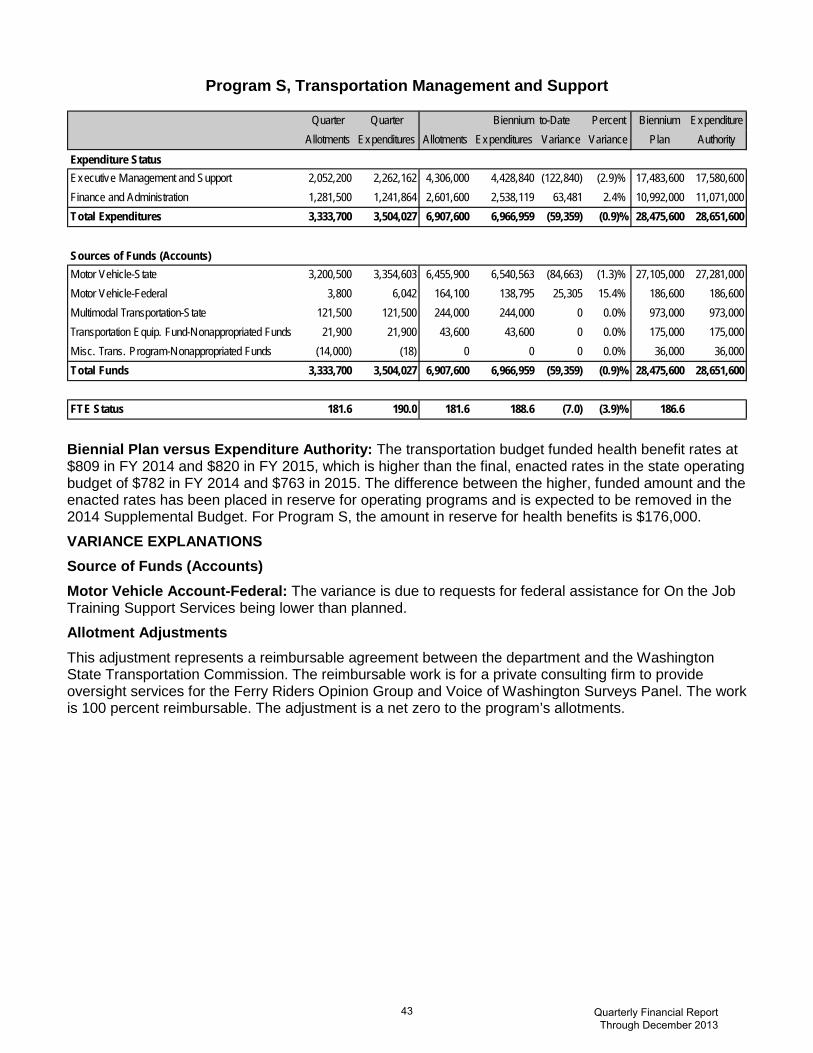
Program S, Transportation Management and Support
Quarter Quarter Biennium to-Date Percent Biennium ExpenditureAllotments Expenditures Allotments Expenditures Variance Variance Plan Authority
Expenditure Status
Executive Management and Support 2,052,200 2,262,162 4,306,000 4,428,840 (122,840) (2.9)% 17,483,600 17,580,600Finance and Administration 1,281,500 1,241,864 2,601,600 2,538,119 63,481 2.4% 10,992,000 11,071,000Total Expenditures 3,333,700 3,504,027 6,907,600 6,966,959 (59,359) (0.9)% 28,475,600 28,651,600
Sources of Funds (Accounts)
Motor Vehicle-State 3,200,500 3,354,603 6,455,900 6,540,563 (84,663) (1.3)% 27,105,000 27,281,000Motor Vehicle-Federal 3,800 6,042 164,100 138,795 25,305 15.4% 186,600 186,600Multimodal Transportation-State 121,500 121,500 244,000 244,000 0 0.0% 973,000 973,000Transportation Equip. Fund-Nonappropriated Funds 21,900 21,900 43,600 43,600 0 0.0% 175,000 175,000Misc. Trans. Program-Nonappropriated Funds (14,000) (18) 0 0 0 0.0% 36,000 36,000Total Funds 3,333,700 3,504,027 6,907,600 6,966,959 (59,359) (0.9)% 28,475,600 28,651,600
FTE Status 181.6 190.0 181.6 188.6 (7.0) (3.9)% 186.6
Biennial Plan versus Expenditure Authority: The transportation budget funded health benefit rates at $809 in FY 2014 and $820 in FY 2015, which is higher than the final, enacted rates in the state operating budget of $782 in FY 2014 and $763 in 2015. The difference between the higher, funded amount and the enacted rates has been placed in reserve for operating programs and is expected to be removed in the 2014 Supplemental Budget. For Program S, the amount in reserve for health benefits is $176,000. VARIANCE EXPLANATIONS Source of Funds (Accounts) Motor Vehicle Account-Federal: The variance is due to requests for federal assistance for On the Job Training Support Services being lower than planned.
Allotment Adjustments This adjustment represents a reimbursable agreement between the department and the Washington State Transportation Commission. The reimbursable work is for a private consulting firm to provide oversight services for the Ferry Riders Opinion Group and Voice of Washington Surveys Panel. The work is 100 percent reimbursable. The adjustment is a net zero to the program’s allotments.
43 Quarterly Financial Report Through December 2013

Program S, Transportation Management and Support
Jun-
15
May
-15
Apr-1
5
Mar
-15
Feb-
15
Jan-
15
Dec
-14
Nov
-14
Oct
-14
Sep-
14
Aug-
14
Jul-1
4
Jun-
14
May
-14
Apr-1
4
Mar
-14
Feb-
14
Jan-
14
Dec
-13
Nov
-13
Oct
-13
Sep-
13
Aug-
13
Jul-1
3
1.5
1.0
0.5
0.0
Allotments Expenditures
Monthly Expenditure Comparison
Millions $
Jun-
15
May
-15
Apr-1
5
Mar
-15
Feb-
15
Jan-
15
Dec
-14
Nov
-14
Oct
-14
Sep-
14
Aug-
14
Jul-1
4
Jun-
14
May
-14
Apr-1
4
Mar
-14
Feb-
14
Jan-
14
Dec
-13
Nov
-13
Oct
-13
Sep-
13
Aug-
13
Jul-1
3
30
20
10
0
Allotments Expenditures
Cumulative toDate Expenditure Comparison
Millions $
Variance toDate:($0.1) million underexpended
(0.9)% underexpended
44 Quarterly Financial Report Through December 2013

Program T, Transportation Planning, Data, and Research
Quarter Quarter Biennium to-Date Percent Biennium ExpenditureAllotments Expenditures Allotments Expenditures Variance Variance Plan Authority
Expenditure Status
Planning 4,601,865 4,230,890 8,824,365 8,685,210 139,155 1.6% 34,451,465 34,731,265Research and Library Services 1,167,800 865,705 1,691,800 1,399,833 291,967 17.3% 9,652,800 9,666,000Pass Through Funds 3,129,588 2,394,968 5,624,588 3,920,960 1,703,628 30.3% 21,853,000 21,853,000Total Expenditures 8,899,253 7,491,562 16,140,753 14,006,004 2,134,749 13.2% 65,957,265 66,250,265
Sources of Funds (Accounts)
Motor Vehicle-State 2,498,520 2,372,944 4,925,600 4,736,062 189,538 3.8% 19,916,000 20,109,000Motor Vehicle-Federal 3,233,240 2,659,237 5,582,640 5,194,298 388,342 7.0% 25,026,000 25,026,000Multimodal Transportation-State 104,830 104,229 162,850 172,495 (9,645) (5.9)% 662,000 662,000Multimodal Transportation-Federal 419,310 441,285 674,810 717,943 (43,133) (6.4)% 2,809,000 2,809,000Multimodal Transportation-Local 0 0 0 0 0 0.0% 0 100,000Misc. Trans. Program-Nonappropriated Funds 2,643,353 1,913,868 4,794,853 3,185,206 1,609,647 33.6% 17,544,265 17,544,265Total Funds 8,899,253 7,491,562 16,140,753 14,006,004 2,134,749 13.2% 65,957,265 66,250,265
FTE Status 188.5 171.2 186.4 177.6 8.8 4.7% 187.3
Biennial Plan versus Expenditure Authority: The transportation budget funded health benefit rates at $809 in FY 2014 and $820 in FY 2015, which is higher than the final, enacted rate in the state operating budget of $782 in FY 2014 and $763 in 2015. The difference between the higher, funded amount and the enacted rates has been placed in reserve for operating programs and is expected to be removed in the 2014 Supplemental Budget. For Program T, the amount in reserve for health benefits is $193,000. VARIANCE EXPLANATIONS Expenditure Status Research and Library Services: The plan is based on historical spending patterns. The current variance is due to some projects beginning later than anticipated. Expenditures in upcoming months will catch up with the plan. Pass Through Funds: The variance is caused by the fluctuation in the local organizations’ reimbursement requests and the unique timeline in which each organization works. Source of Funds (Account) Miscellaneous Transp. Programs-Federal: The plan is based on historical spending and the program expects future expenditures to catch up with the plan. ALLOTMENT ADJUSTMENTS Recognition of Subprogram T3 portion ($13,200) of the PEBB reduction previously submitted under Subprogram T2. Subprogram T3 was reduced by $160,000 of federal authority. This authority was transferred to Subprogram T2 to fund three projects: regional corridor studies, least cost planning, and decision support. The adjustment for $141,000 includes: International Mobility and Trade Corridor Program ($90,000) and Preparing Interstate and State Routes in the Skagit River Base ($51,000). In addition, the T2 appropriation reducing unallocated funds by $47,000 from the September ALAD was removed.
45 Quarterly Financial Report Through December 2013
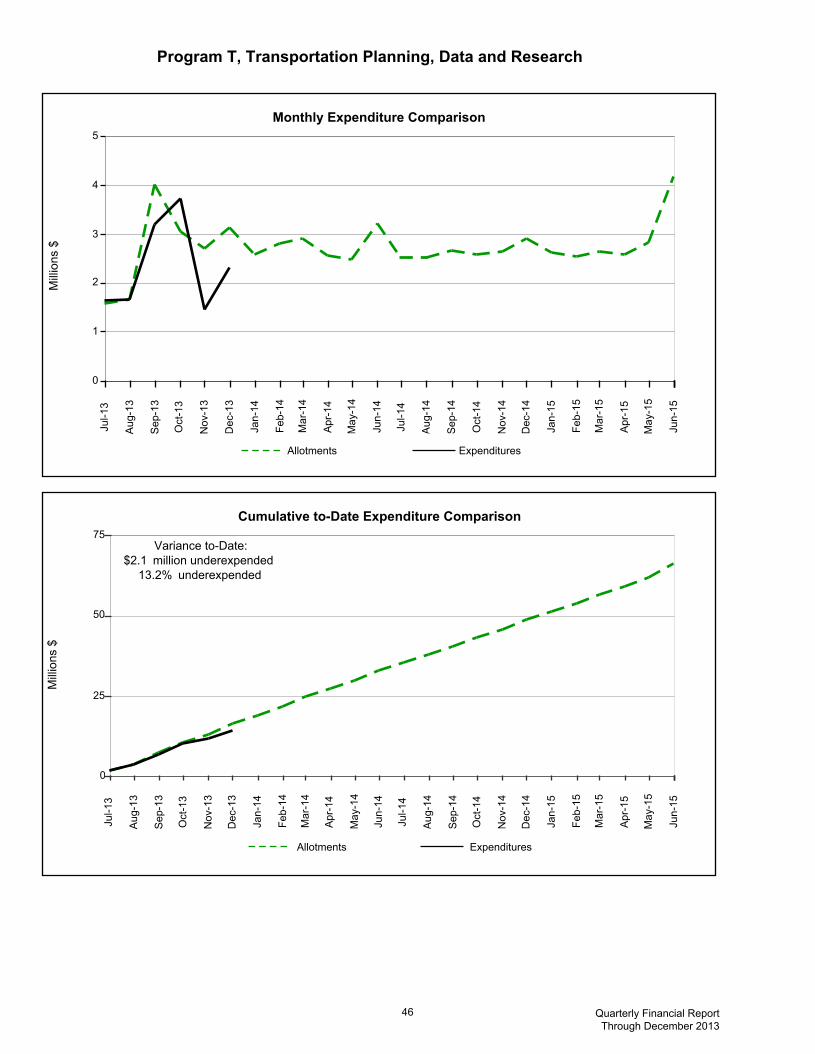
Program T, Transportation Planning, Data and Research
Jun-
15
May
-15
Apr-1
5
Mar
-15
Feb-
15
Jan-
15
Dec
-14
Nov
-14
Oct
-14
Sep-
14
Aug-
14
Jul-1
4
Jun-
14
May
-14
Apr-1
4
Mar
-14
Feb-
14
Jan-
14
Dec
-13
Nov
-13
Oct
-13
Sep-
13
Aug-
13
Jul-1
3
5
4
3
2
1
0
Allotments Expenditures
Monthly Expenditure Comparison
Millions $
Jun-
15
May
-15
Apr-1
5
Mar
-15
Feb-
15
Jan-
15
Dec
-14
Nov
-14
Oct
-14
Sep-
14
Aug-
14
Jul-1
4
Jun-
14
May
-14
Apr-1
4
Mar
-14
Feb-
14
Jan-
14
Dec
-13
Nov
-13
Oct
-13
Sep-
13
Aug-
13
Jul-1
3
75
50
25
0
Allotments Expenditures
Cumulative toDate Expenditure Comparison
Millions $
Variance toDate:$2.1 million underexpended
13.2% underexpended
46 Quarterly Financial Report Through December 2013

Program U, Charges from Other Agencies
Quarter Biennial Expenditure
Allotments Expenditures Allotments Expenditures Variance Plan Authority
Expenditure Status
Department of Enterprise Services 3,027,000 20,632,133 23,530,000 21,730,770 1,799,230 7.6% 59,521,000 59,521,000
Consolidated Technical Services 47,400 46,478 79,000 92,955 (13,955) (17.7)% 363,000 363,000
Office of Financial Management 652,056 632,341 684,856 899,708 (214,852) (31.4)% 2,820,419 2,820,419
Secretary of State 66,000 66,263 132,000 132,526 (526) (0.4)% 530,000 530,000
State Auditor 63,000 40,794 126,000 48,145 77,855 61.8% 505,000 505,000
Attorney General & Legal Services 945,900 1,615,631 1,576,500 1,653,558 (77,058) (4.9)% 7,257,000 7,257,000
Office of Minority & Women's Busnss. Entrp. 138,000 36,935 276,000 91,995 184,005 66.7% 1,503,000 1,503,000
Prior Period Accounting Adjustment 0 0 0 248 (248) 0.0% 0 0
Un-allotted 0 0 0 0 0 0.0% 0 5,000,000
Other Charges 0 0 0 0 0 0.0% 4,568,581 4,568,581
Total Expenditures 4,939,356 23,070,575 26,404,356 24,649,905 1,754,451 6.6% 77,068,000 82,068,000
Source of Funds (Accounts)
Motor Vehicle Account-State 4,797,756 23,035,108 26,394,356 24,559,379 1,834,977 7.0% 76,628,000 81,628,000
Motor Vehicle Account-Federal 0 35,466 0 90,526 (90,526) 0.0% 400,000 400,000
Multimodal Transportation-State 5,000 0 10,000 0 10,000 100.0% 40,000 40,000
Total Funds 4,802,756 23,070,574 26,404,356 24,649,905 1,754,451 6.6% 77,068,000 82,068,000
Percent
Variance
Biennium To-Date
Biennial Plan versus Expenditure Authority: The Biennial Plan is $5 million less than Expenditure Authority since that amount was put in un-allotted status. The department requested a funding reduction of $5 million in the 2014 Supplemental Budget as fewer funds are needed for self-insurance. VARIANCE EXPLANATIONS Expenditure Status Consolidated Technical Services: Billings from the agency occurred earlier than expected. Office of Financial Management: Billings from OFM for labor relations services are more than anticipated. Allotments will be adjusted in January. State Auditor: Billings from the agency are slower than expected. Office of Minority & Women’s Business Enterprises: The department only recently completed, in November 2013, a new agreement with the Office of Minority and Women’s Business Enterprises for 2013-15 certifications of disadvantaged business enterprises, so expenditures will occur later than planned. Source of Funds (Accounts) Multimodal Transportation-State: This account is used for a portion of the charges from the Department of Enterprise Services for the Jefferson Street Building Data Center. Those charges and payments are on schedule as planned, although the billings have so far been paid entirely from the Motor Vehicle Account-State, rather than a portion being paid from the Multimodal Account as originally planned. Allotment Adjustment Allotments were adjusted in October to conform to new information about billings from OFM.
47 Quarterly Financial Report Through December 2013
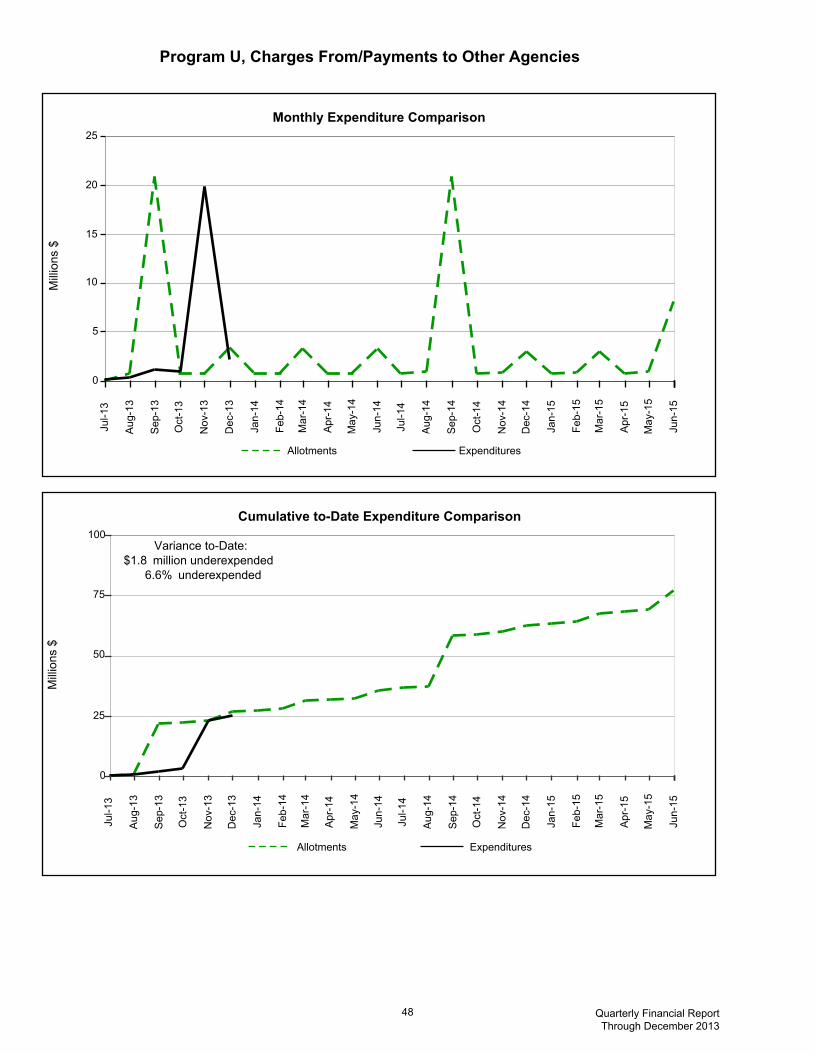
Program U, Charges From/Payments to Other Agencies
Jun-
15
May
-15
Apr-1
5
Mar
-15
Feb-
15
Jan-
15
Dec
-14
Nov
-14
Oct
-14
Sep-
14
Aug-
14
Jul-1
4
Jun-
14
May
-14
Apr-1
4
Mar
-14
Feb-
14
Jan-
14
Dec
-13
Nov
-13
Oct
-13
Sep-
13
Aug-
13
Jul-1
3
25
20
15
10
5
0
Allotments Expenditures
Monthly Expenditure Comparison
Millions $
Jun-
15
May
-15
Apr-1
5
Mar
-15
Feb-
15
Jan-
15
Dec
-14
Nov
-14
Oct
-14
Sep-
14
Aug-
14
Jul-1
4
Jun-
14
May
-14
Apr-1
4
Mar
-14
Feb-
14
Jan-
14
Dec
-13
Nov
-13
Oct
-13
Sep-
13
Aug-
13
Jul-1
3
100
75
50
25
0
Allotments Expenditures
Cumulative toDate Expenditure Comparison
Millions $
Variance toDate:$1.8 million underexpended
6.6% underexpended
48 Quarterly Financial Report Through December 2013

Program V, Public Transportation
Quarter Quarter Biennium to-Date Percent Biennium ExpenditureAllotments Expenditures Allotments Expenditures Variance Variance Plan Authority
Expenditure Status
Administration 113,000 103,423 210,000 193,746 16,254 7.7% 837,000 847,000Public Transportation 8,268,000 7,971,765 9,668,000 10,052,007 (384,007) (4.0)% 68,963,000 70,041,000Rural Mobility Grant Program 2,111,000 2,686,718 2,124,000 3,411,472 (1,287,472) (60.6)% 17,133,000 17,133,000Regional Mobility Grant Program 2,500,000 1,922,218 2,948,000 2,332,950 615,050 20.9% 49,948,000 49,948,000Modal Coordination Program 93,000 49,184 132,000 67,355 64,645 49.0% 888,000 888,000Statewide Commute Trip Reduction Program 423,000 556,339 645,000 783,508 (138,508) (21.5)% 6,122,000 6,122,000Transportation Demand Mgmt. Core Program 150,000 0 150,000 0 150,000 100.0% 6,000,000 6,000,000Total Expenditures 13,658,000 13,289,648 15,877,000 16,841,037 (964,037) (6.1)% 149,891,000 150,979,000
Sources of Funds (Accounts)
State Vehicle Parking-State 55,000 102,515 63,000 112,638 (49,638) (78.8)% 452,000 452,000Regional Mobility Grant Program-State 2,500,000 1,922,218 2,948,000 2,332,950 615,050 20.9% 49,948,000 49,948,000Rural Mobility Grant Program-State 2,100,000 2,692,666 2,100,000 3,396,156 (1,296,156) (61.7)% 17,000,000 17,000,000Multimodal Transportation-State 4,196,000 5,136,823 4,640,000 6,209,351 (1,569,351) (33.8)% 38,659,000 39,057,000Multimodal Transportation-Federal 176,000 289,919 256,000 551,523 (295,523) (115.4)% 2,590,000 3,280,000Multimodal Transportation-Local 0 0 0 0 0 0.0% 10,000 10,000Misc. Trans. Program-Nonappropriated Funds 4,631,000 3,147,004 5,870,000 4,238,419 1,631,581 27.8% 41,232,000 41,232,000Misc. Trans. Program-Federal-Nonappropriated ARRA 0 (1,497) 0 0 0 0.0% 0 0Total Funds 13,658,000 13,289,648 15,877,000 16,841,037 (964,037) (6.1)% 149,891,000 150,979,000
FTE Status 37.7 33.5 37.7 35.2 2.5 6.5% 37.5
Biennial Plan versus Expenditure Authority: The 2013-15 Biennial Plan total is $1,088,000 less than the Expenditure Authority total. $690,000 in federal funding and $175,000 in state funding were placed in unallotted status for the Light Rail Safety Program contingency. Although federal funds for the program have been appropriated, the Federal Transit Administration (FTA) has not established the program yet. $200,000 in state funds was placed in unallotted status for the Public Transportation Summary because of a budget proviso. The transportation budget funded health benefit rates at $809 in FY 2014 and $820 in FY 2015, which is higher than the final, enacted rate in the state operating budget of $782 in FY 2014 and $763 in 2015. The difference between the higher, funded amount and the enacted rates has been placed in reserve for operating programs and is expected to be removed in the 2014 Supplemental Budget. For Program V, the amount in reserve for health benefits is $23,000.
VARIANCE EXPLANATIONS Expenditure Status Rural Mobility Grant Program: Expenditures were greater than allotments because rural mobility grants for transit and nonprofit organizations were spent sooner than planned. Regional Mobility Grant Program: Expenditures were less than allotments because billings from the grant recipients were lower than planned.
49 Quarterly Financial Report Through December 2013
Modal Coordination Program: Expenditures were less than allotments due to a vacancy and staff who completed federal planning work that was charged to Public Transportation. Statewide Commute Trip Reduction Program: Expenditures were higher than planned because contractors completed work earlier than anticipated, because of higher contracted costs for the State Agency Rider (STAR) Pass program, and due to increased demand for the Safe Ride Home program. Transportation Demand Management Core Program: Expenditures were lower than planned because the grantees ordered vans later than planned, which will results in later than planned deliveries and billings to WSDOT. Source of Funds (Account): State Vehicle Parking-State: Expenditures were higher than planned because of higher contracted costs for the State Agency Rider (STAR) Pass program and increased demand for the Safe Ride Home program. Regional Mobility Grant Program-State: See explanation for the Regional Mobility Grant Program. Rural Mobility Grant Program-State: See explanation for the Rural Mobility Grant Program. Multimodal Transportation-State: The variance was due to Public Transportation special needs grants that were spent earlier than planned. Multimodal Transportation-Federal: The variance is due to more staff time than planned being charged to federal planning work. Miscellaneous Transportation Programs-Nonappropriated Funds: Expenditures for grants and staff time were less than planned because federal funds were awarded late. Additionally, staff that previously charged time to nonappropriated funds charged their time to federal planning funds because the Job Access Reverse Commute grant has been closed. FTE Status: The variance is within ten percent of the allotment plan.
50 Quarterly Financial Report Through December 2013

Program V, Public Transportation
Jun-
15
May
-15
Apr-1
5
Mar
-15
Feb-
15
Jan-
15
Dec
-14
Nov
-14
Oct
-14
Sep-
14
Aug-
14
Jul-1
4
Jun-
14
May
-14
Apr-1
4
Mar
-14
Feb-
14
Jan-
14
Dec
-13
Nov
-13
Oct
-13
Sep-
13
Aug-
13
Jul-1
3
40
30
20
10
0
Allotments Expenditures
Monthly Expenditure Comparison
Millions $
Jun-
15
May
-15
Apr-1
5
Mar
-15
Feb-
15
Jan-
15
Dec
-14
Nov
-14
Oct
-14
Sep-
14
Aug-
14
Jul-1
4
Jun-
14
May
-14
Apr-1
4
Mar
-14
Feb-
14
Jan-
14
Dec
-13
Nov
-13
Oct
-13
Sep-
13
Aug-
13
Jul-1
3
150
100
50
0
Allotments Expenditures
Cumulative toDate Expenditure Comparison
Millions $
Variance toDate:($1.0) million underexpended
(6.1)% underexpended
51 Quarterly Financial Report Through December 2013
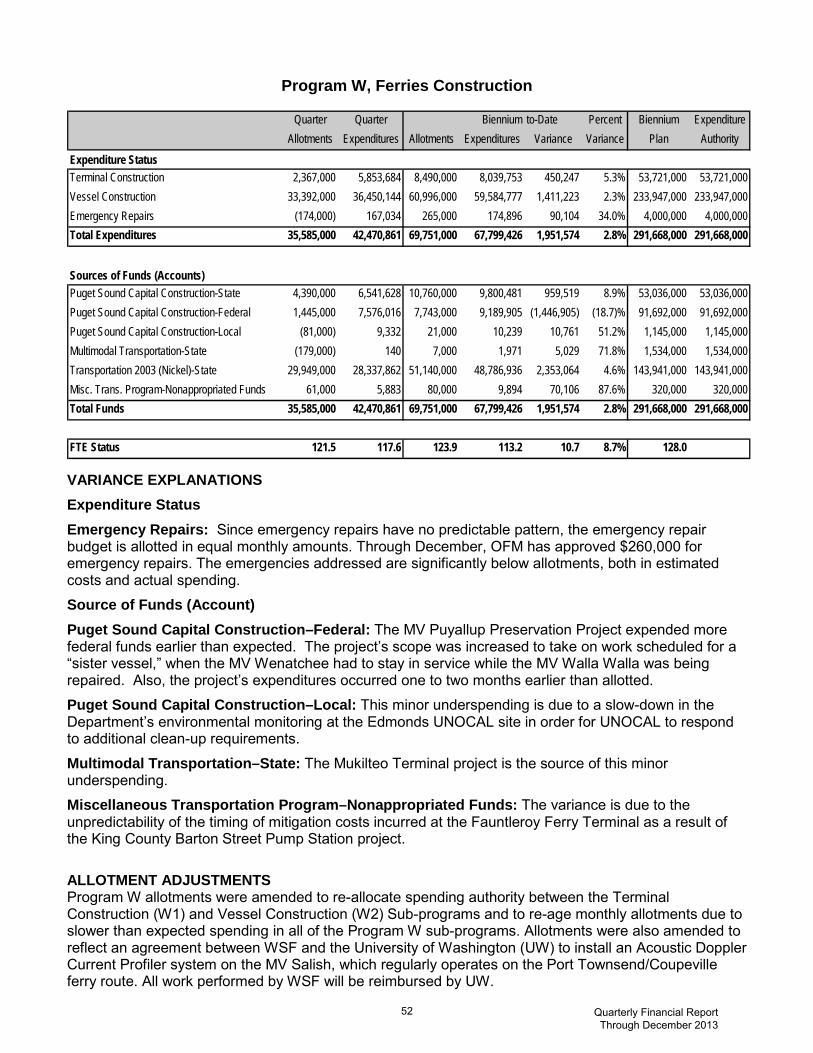
Program W, Ferries Construction
Quarter Quarter Biennium to-Date Percent Biennium ExpenditureAllotments Expenditures Allotments Expenditures Variance Variance Plan Authority
Expenditure Status
Terminal Construction 2,367,000 5,853,684 8,490,000 8,039,753 450,247 5.3% 53,721,000 53,721,000Vessel Construction 33,392,000 36,450,144 60,996,000 59,584,777 1,411,223 2.3% 233,947,000 233,947,000Emergency Repairs (174,000) 167,034 265,000 174,896 90,104 34.0% 4,000,000 4,000,000Total Expenditures 35,585,000 42,470,861 69,751,000 67,799,426 1,951,574 2.8% 291,668,000 291,668,000
Sources of Funds (Accounts)
Puget Sound Capital Construction-State 4,390,000 6,541,628 10,760,000 9,800,481 959,519 8.9% 53,036,000 53,036,000Puget Sound Capital Construction-Federal 1,445,000 7,576,016 7,743,000 9,189,905 (1,446,905) (18.7)% 91,692,000 91,692,000Puget Sound Capital Construction-Local (81,000) 9,332 21,000 10,239 10,761 51.2% 1,145,000 1,145,000Multimodal Transportation-State (179,000) 140 7,000 1,971 5,029 71.8% 1,534,000 1,534,000Transportation 2003 (Nickel)-State 29,949,000 28,337,862 51,140,000 48,786,936 2,353,064 4.6% 143,941,000 143,941,000Misc. Trans. Program-Nonappropriated Funds 61,000 5,883 80,000 9,894 70,106 87.6% 320,000 320,000Total Funds 35,585,000 42,470,861 69,751,000 67,799,426 1,951,574 2.8% 291,668,000 291,668,000
FTE Status 121.5 117.6 123.9 113.2 10.7 8.7% 128.0
VARIANCE EXPLANATIONS Expenditure Status Emergency Repairs: Since emergency repairs have no predictable pattern, the emergency repair budget is allotted in equal monthly amounts. Through December, OFM has approved $260,000 for emergency repairs. The emergencies addressed are significantly below allotments, both in estimated costs and actual spending. Source of Funds (Account) Puget Sound Capital Construction–Federal: The MV Puyallup Preservation Project expended more federal funds earlier than expected. The project’s scope was increased to take on work scheduled for a “sister vessel,” when the MV Wenatchee had to stay in service while the MV Walla Walla was being repaired. Also, the project’s expenditures occurred one to two months earlier than allotted. Puget Sound Capital Construction–Local: This minor underspending is due to a slow-down in the Department’s environmental monitoring at the Edmonds UNOCAL site in order for UNOCAL to respond to additional clean-up requirements. Multimodal Transportation–State: The Mukilteo Terminal project is the source of this minor underspending. Miscellaneous Transportation Program–Nonappropriated Funds: The variance is due to the unpredictability of the timing of mitigation costs incurred at the Fauntleroy Ferry Terminal as a result of the King County Barton Street Pump Station project. ALLOTMENT ADJUSTMENTS Program W allotments were amended to re-allocate spending authority between the Terminal Construction (W1) and Vessel Construction (W2) Sub-programs and to re-age monthly allotments due to slower than expected spending in all of the Program W sub-programs. Allotments were also amended to reflect an agreement between WSF and the University of Washington (UW) to install an Acoustic Doppler Current Profiler system on the MV Salish, which regularly operates on the Port Townsend/Coupeville ferry route. All work performed by WSF will be reimbursed by UW.
52 Quarterly Financial Report Through December 2013

Program W, Ferries Division Construction
Jun-
15
May
-15
Apr-1
5
Mar
-15
Feb-
15
Jan-
15
Dec
-14
Nov
-14
Oct
-14
Sep-
14
Aug-
14
Jul-1
4
Jun-
14
May
-14
Apr-1
4
Mar
-14
Feb-
14
Jan-
14
Dec
-13
Nov
-13
Oct
-13
Sep-
13
Aug-
13
Jul-1
3
30
20
10
0
Allotments Expenditures
Monthly Expenditure Comparison
Millions $
Jun-
15
May
-15
Apr-1
5
Mar
-15
Feb-
15
Jan-
15
Dec
-14
Nov
-14
Oct
-14
Sep-
14
Aug-
14
Jul-1
4
Jun-
14
May
-14
Apr-1
4
Mar
-14
Feb-
14
Jan-
14
Dec
-13
Nov
-13
Oct
-13
Sep-
13
Aug-
13
Jul-1
3
300
200
100
0
Allotments Expenditures
Cumulative toDate Expenditure Comparison
Millions $
Variance toDate:$2.0 million underexpended
2.8% underexpended
53 Quarterly Financial Report Through December 2013
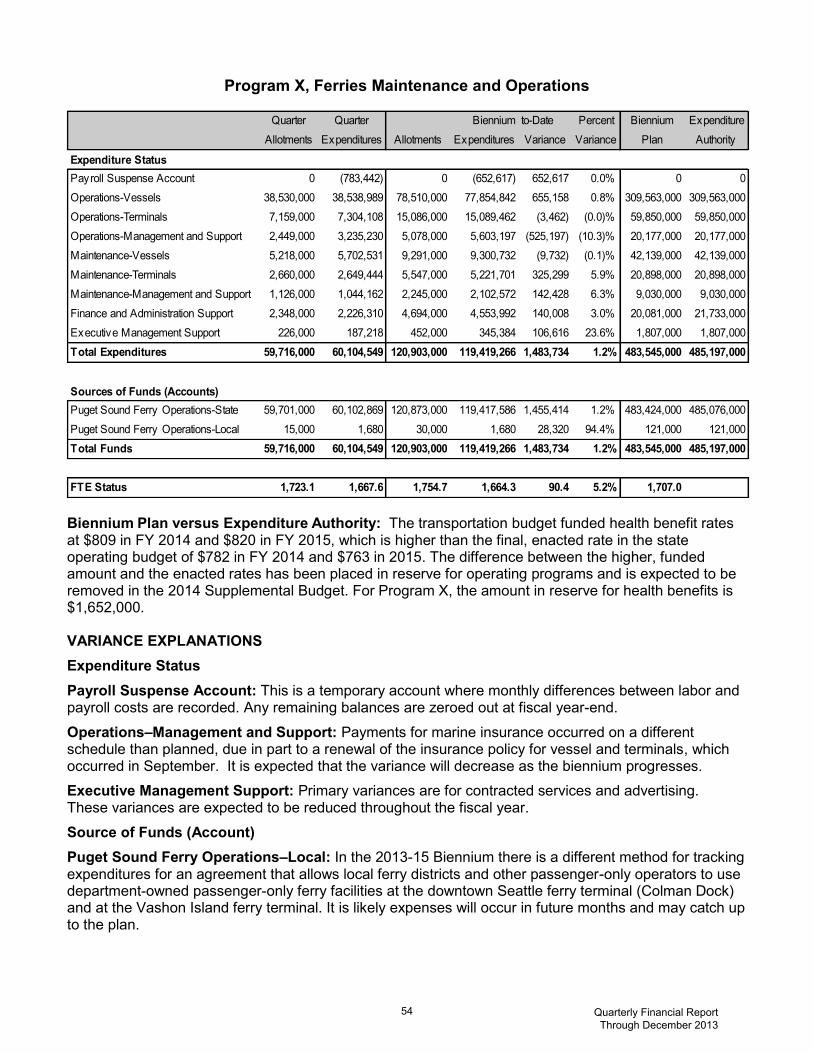
Program X, Ferries Maintenance and Operations
Quarter Quarter Biennium to-Date Percent Biennium Expenditure
Allotments Expenditures Allotments Expenditures Variance Variance Plan Authority
Expenditure Status
Payroll Suspense Account 0 (783,442) 0 (652,617) 652,617 0.0% 0 0
Operations-Vessels 38,530,000 38,538,989 78,510,000 77,854,842 655,158 0.8% 309,563,000 309,563,000
Operations-Terminals 7,159,000 7,304,108 15,086,000 15,089,462 (3,462) (0.0)% 59,850,000 59,850,000
Operations-Management and Support 2,449,000 3,235,230 5,078,000 5,603,197 (525,197) (10.3)% 20,177,000 20,177,000
Maintenance-Vessels 5,218,000 5,702,531 9,291,000 9,300,732 (9,732) (0.1)% 42,139,000 42,139,000
Maintenance-Terminals 2,660,000 2,649,444 5,547,000 5,221,701 325,299 5.9% 20,898,000 20,898,000
Maintenance-Management and Support 1,126,000 1,044,162 2,245,000 2,102,572 142,428 6.3% 9,030,000 9,030,000
Finance and Administration Support 2,348,000 2,226,310 4,694,000 4,553,992 140,008 3.0% 20,081,000 21,733,000
Executive Management Support 226,000 187,218 452,000 345,384 106,616 23.6% 1,807,000 1,807,000
Total Expenditures 59,716,000 60,104,549 120,903,000 119,419,266 1,483,734 1.2% 483,545,000 485,197,000
Sources of Funds (Accounts)
Puget Sound Ferry Operations-State 59,701,000 60,102,869 120,873,000 119,417,586 1,455,414 1.2% 483,424,000 485,076,000
Puget Sound Ferry Operations-Local 15,000 1,680 30,000 1,680 28,320 94.4% 121,000 121,000
Total Funds 59,716,000 60,104,549 120,903,000 119,419,266 1,483,734 1.2% 483,545,000 485,197,000
FTE Status 1,723.1 1,667.6 1,754.7 1,664.3 90.4 5.2% 1,707.0
Biennium Plan versus Expenditure Authority: The transportation budget funded health benefit rates at $809 in FY 2014 and $820 in FY 2015, which is higher than the final, enacted rate in the state operating budget of $782 in FY 2014 and $763 in 2015. The difference between the higher, funded amount and the enacted rates has been placed in reserve for operating programs and is expected to be removed in the 2014 Supplemental Budget. For Program X, the amount in reserve for health benefits is $1,652,000. VARIANCE EXPLANATIONS Expenditure Status Payroll Suspense Account: This is a temporary account where monthly differences between labor and payroll costs are recorded. Any remaining balances are zeroed out at fiscal year-end. Operations–Management and Support: Payments for marine insurance occurred on a different schedule than planned, due in part to a renewal of the insurance policy for vessel and terminals, which occurred in September. It is expected that the variance will decrease as the biennium progresses. Executive Management Support: Primary variances are for contracted services and advertising. These variances are expected to be reduced throughout the fiscal year. Source of Funds (Account) Puget Sound Ferry Operations–Local: In the 2013-15 Biennium there is a different method for tracking expenditures for an agreement that allows local ferry districts and other passenger-only operators to use department-owned passenger-only ferry facilities at the downtown Seattle ferry terminal (Colman Dock) and at the Vashon Island ferry terminal. It is likely expenses will occur in future months and may catch up to the plan.
54 Quarterly Financial Report Through December 2013
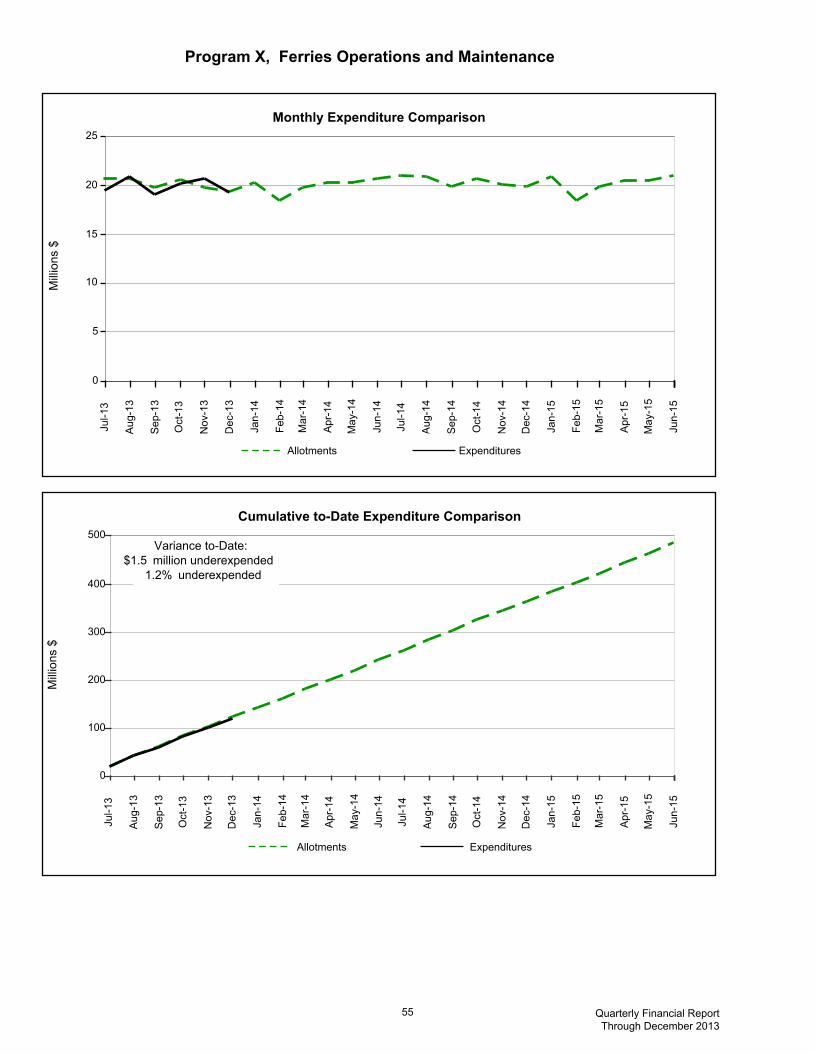
Program X, Ferries Operations and Maintenance
Jun-
15
May
-15
Apr-1
5
Mar
-15
Feb-
15
Jan-
15
Dec
-14
Nov
-14
Oct
-14
Sep-
14
Aug-
14
Jul-1
4
Jun-
14
May
-14
Apr-1
4
Mar
-14
Feb-
14
Jan-
14
Dec
-13
Nov
-13
Oct
-13
Sep-
13
Aug-
13
Jul-1
3
25
20
15
10
5
0
Allotments Expenditures
Monthly Expenditure Comparison
Millions $
Jun-
15
May
-15
Apr-1
5
Mar
-15
Feb-
15
Jan-
15
Dec
-14
Nov
-14
Oct
-14
Sep-
14
Aug-
14
Jul-1
4
Jun-
14
May
-14
Apr-1
4
Mar
-14
Feb-
14
Jan-
14
Dec
-13
Nov
-13
Oct
-13
Sep-
13
Aug-
13
Jul-1
3
500
400
300
200
100
0
Allotments Expenditures
Cumulative toDate Expenditure Comparison
Millions $
Variance toDate:$1.5 million underexpended
1.2% underexpended
55 Quarterly Financial Report Through December 2013

Program Y, Rail - Operating
Quarter Quarter Biennium to-Date Percent Biennium Expenditure
Allotments Expenditures Allotments Expenditures Variance Variance Plan Authority
Expenditure Status
Rail Freight Operations 52,000 37,616 80,000 70,419 9,581 12.0% 404,000 404,000
Rail Passenger Operations 5,067,000 5,510,757 8,031,000 7,756,271 274,729 3.4% 32,731,000 32,742,000
Total Expenditures 5,119,000 5,548,373 8,111,000 7,826,689 284,311 3.5% 33,135,000 33,146,000
Sources of Funds (Accounts)
Multimodal Transportation-State 5,068,000 5,480,100 8,024,000 7,750,076 273,924 3.4% 32,913,000 32,924,000
Multimodal Transportation-Federal 36,000 61,293 62,000 61,293 707 1.1% 62,000 62,000
Multimodal Transportation-Local 0 0 10,000 8,340 1,660 16.6% 10,000 10,000
Miscellaneous Program-Nonappropriated Funds 15,000 6,980 15,000 6,980 8,020 53.5% 150,000 150,000
Total Funds 5,119,000 5,548,373 8,111,000 7,826,689 284,311 3.5% 33,135,000 33,146,000
FTE Status 10.8 10.3 10.9 10.7 0.2 1.7% 10.2
Biennial Plan versus Expenditure Authority: The 2013-15 Biennial Plan total is $11,000 less than the Expenditure Authority total because the transportation budget funded health benefit rates at $809 in FY 2014 and $820 in FY 2015, which is higher than the final, enacted rate in the state operating budget of $782 in FY 2014 and $763 in 2015. The difference between the higher, funded amount and the enacted rates has been placed in reserve for operating programs and is expected to be removed in the 2014 Supplemental Budget. For Program Y, the amount in reserve for health benefits is $11,000. VARIANCE EXPLANATIONS Expenditure Status Rail Freight Operations: The variance is due to Grain Train expenditures were less than anticipated in the initial allotment plan. Source of Funds (Account) Multimodal Transportation-Local: Labor hours to-date are less than anticipated for Oregon Department of Transportation’s (ODOT) share for the Rail Corridor Director’s salary. Miscellaneous Program-Nonappropriated Funds: See explanation for the Rail Freight Operations. ALLOTMENT ADJUSTMENTS The allotments were adjusted between good and services, salaries, and benefits for understated projected salary and benefits for several of the positions in Passenger Rail and Freight Rail operations. Adjustment is also made to reflect the updated schedule of Amtrak payments for Federal Fiscal Year 2014. The new Amtrak contract was signed in September 2013.
56 Quarterly Financial Report Through December 2013
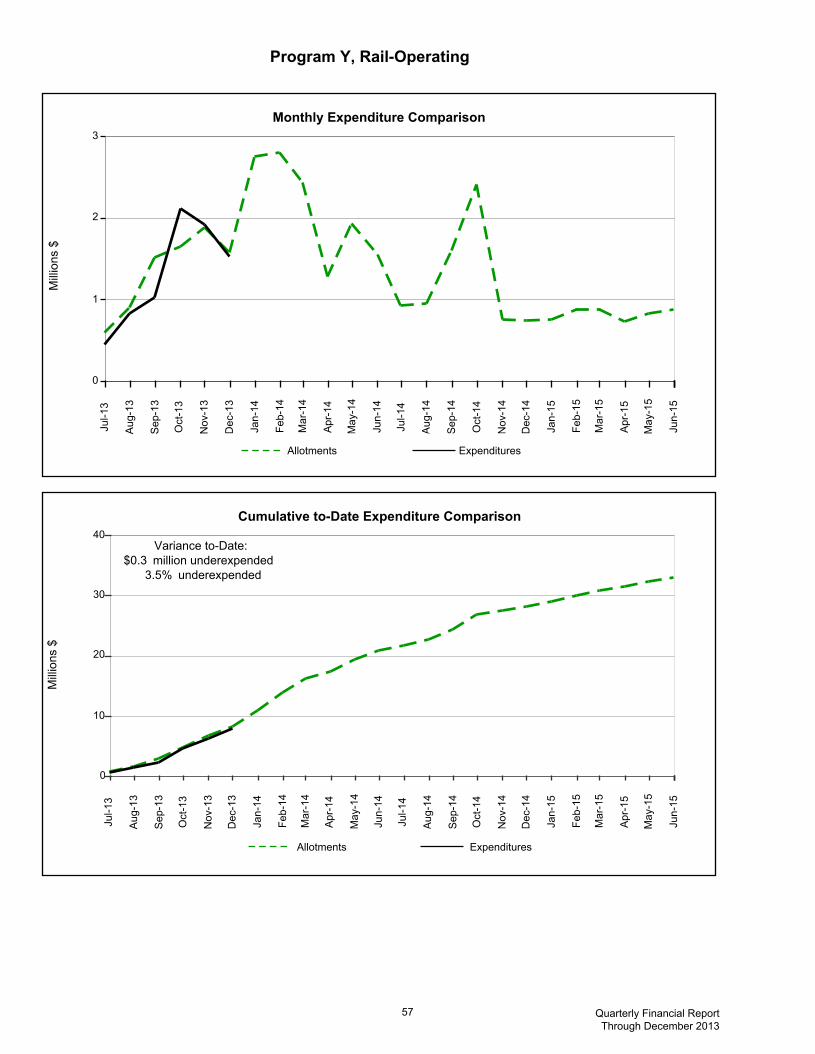
Program Y, RailOperating
Jun-
15
May
-15
Apr-1
5
Mar
-15
Feb-
15
Jan-
15
Dec
-14
Nov
-14
Oct
-14
Sep-
14
Aug-
14
Jul-1
4
Jun-
14
May
-14
Apr-1
4
Mar
-14
Feb-
14
Jan-
14
Dec
-13
Nov
-13
Oct
-13
Sep-
13
Aug-
13
Jul-1
3
3
2
1
0
Allotments Expenditures
Monthly Expenditure Comparison
Millions $
Jun-
15
May
-15
Apr-1
5
Mar
-15
Feb-
15
Jan-
15
Dec
-14
Nov
-14
Oct
-14
Sep-
14
Aug-
14
Jul-1
4
Jun-
14
May
-14
Apr-1
4
Mar
-14
Feb-
14
Jan-
14
Dec
-13
Nov
-13
Oct
-13
Sep-
13
Aug-
13
Jul-1
3
40
30
20
10
0
Allotments Expenditures
Cumulative toDate Expenditure Comparison
Millions $
Variance toDate:$0.3 million underexpended
3.5% underexpended
57 Quarterly Financial Report Through December 2013
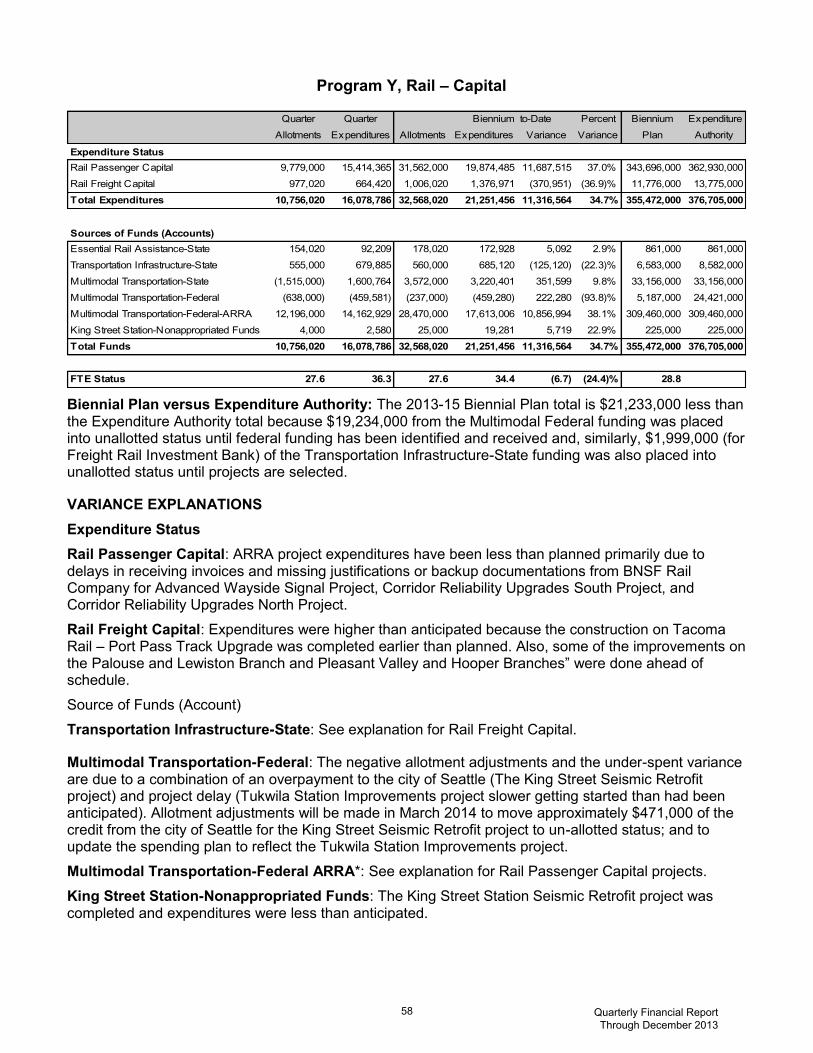
Program Y, Rail – Capital
Quarter Quarter Biennium to-Date Percent Biennium Expenditure
Allotments Expenditures Allotments Expenditures Variance Variance Plan Authority
Expenditure Status
Rail Passenger Capital 9,779,000 15,414,365 31,562,000 19,874,485 11,687,515 37.0% 343,696,000 362,930,000
Rail Freight Capital 977,020 664,420 1,006,020 1,376,971 (370,951) (36.9)% 11,776,000 13,775,000
Total Expenditures 10,756,020 16,078,786 32,568,020 21,251,456 11,316,564 34.7% 355,472,000 376,705,000
Sources of Funds (Accounts)
Essential Rail Assistance-State 154,020 92,209 178,020 172,928 5,092 2.9% 861,000 861,000
Transportation Infrastructure-State 555,000 679,885 560,000 685,120 (125,120) (22.3)% 6,583,000 8,582,000
Multimodal Transportation-State (1,515,000) 1,600,764 3,572,000 3,220,401 351,599 9.8% 33,156,000 33,156,000
Multimodal Transportation-Federal (638,000) (459,581) (237,000) (459,280) 222,280 (93.8)% 5,187,000 24,421,000
Multimodal Transportation-Federal-ARRA 12,196,000 14,162,929 28,470,000 17,613,006 10,856,994 38.1% 309,460,000 309,460,000
King Street Station-Nonappropriated Funds 4,000 2,580 25,000 19,281 5,719 22.9% 225,000 225,000
Total Funds 10,756,020 16,078,786 32,568,020 21,251,456 11,316,564 34.7% 355,472,000 376,705,000
FTE Status 27.6 36.3 27.6 34.4 (6.7) (24.4)% 28.8
Biennial Plan versus Expenditure Authority: The 2013-15 Biennial Plan total is $21,233,000 less than the Expenditure Authority total because $19,234,000 from the Multimodal Federal funding was placed into unallotted status until federal funding has been identified and received and, similarly, $1,999,000 (for Freight Rail Investment Bank) of the Transportation Infrastructure-State funding was also placed into unallotted status until projects are selected.
VARIANCE EXPLANATIONS Expenditure Status Rail Passenger Capital: ARRA project expenditures have been less than planned primarily due to delays in receiving invoices and missing justifications or backup documentations from BNSF Rail Company for Advanced Wayside Signal Project, Corridor Reliability Upgrades South Project, and Corridor Reliability Upgrades North Project. Rail Freight Capital: Expenditures were higher than anticipated because the construction on Tacoma Rail – Port Pass Track Upgrade was completed earlier than planned. Also, some of the improvements on the Palouse and Lewiston Branch and Pleasant Valley and Hooper Branches” were done ahead of schedule. Source of Funds (Account) Transportation Infrastructure-State: See explanation for Rail Freight Capital.
Multimodal Transportation-Federal: The negative allotment adjustments and the under-spent variance are due to a combination of an overpayment to the city of Seattle (The King Street Seismic Retrofit project) and project delay (Tukwila Station Improvements project slower getting started than had been anticipated). Allotment adjustments will be made in March 2014 to move approximately $471,000 of the credit from the city of Seattle for the King Street Seismic Retrofit project to un-allotted status; and to update the spending plan to reflect the Tukwila Station Improvements project. Multimodal Transportation-Federal ARRA*: See explanation for Rail Passenger Capital projects. King Street Station-Nonappropriated Funds: The King Street Station Seismic Retrofit project was completed and expenditures were less than anticipated.
58 Quarterly Financial Report Through December 2013
Program Y, Rail – Capital (Continued) FTE Status: The variance is for Freight Rail due to staff work performed on the Department of Commerce grant project. When the Department of Commerce grant is billed, the expenditures are zeroed out but the related FTEs will remain in the Rail program. ALLOTMENT ADJUSTMENTS The allotments were adjusted for the two Palouse River and Coulee City projects (Central Washington Branch lines and SR 271 McCoy projects). The crossing repairs for these projects occurred earlier than anticipated in the initial spending plan.
59 Quarterly Financial Report Through December 2013
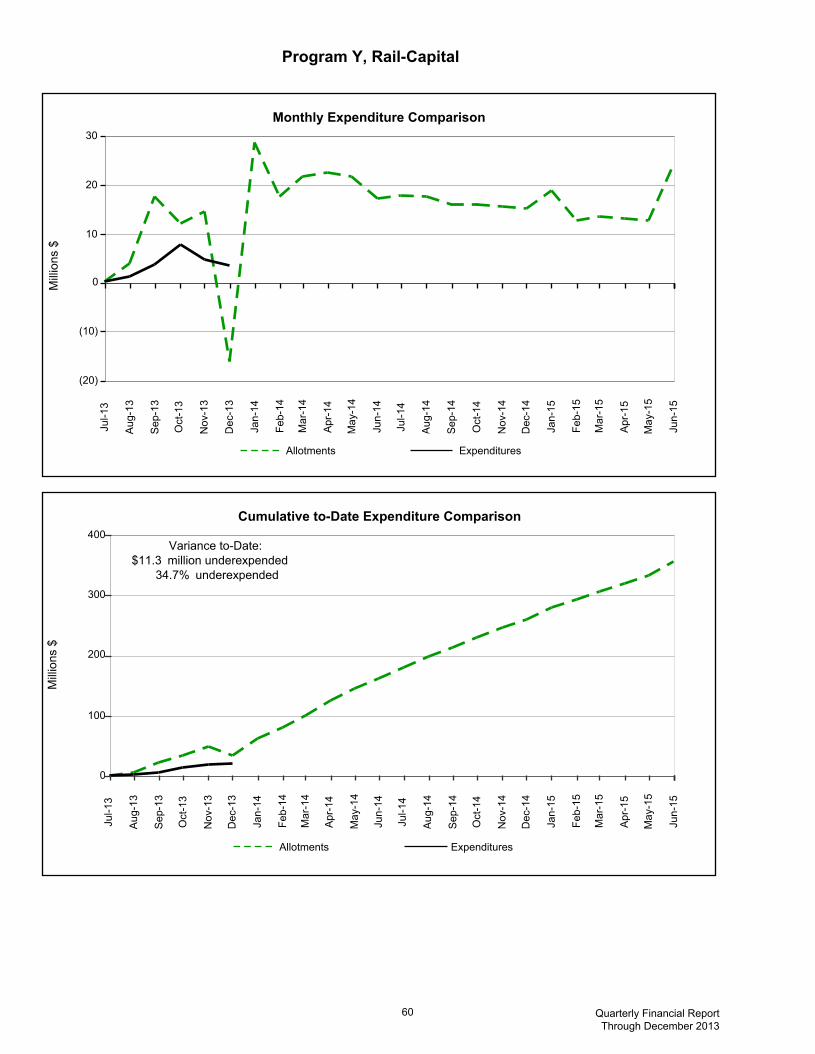
Program Y, RailCapital
Jun-
15
May
-15
Apr-1
5
Mar
-15
Feb-
15
Jan-
15
Dec
-14
Nov
-14
Oct
-14
Sep-
14
Aug-
14
Jul-1
4
Jun-
14
May
-14
Apr-1
4
Mar
-14
Feb-
14
Jan-
14
Dec
-13
Nov
-13
Oct
-13
Sep-
13
Aug-
13
Jul-1
3
30
20
10
0
(20)
(10)
Allotments Expenditures
Monthly Expenditure Comparison
Millions $
Jun-
15
May
-15
Apr-1
5
Mar
-15
Feb-
15
Jan-
15
Dec
-14
Nov
-14
Oct
-14
Sep-
14
Aug-
14
Jul-1
4
Jun-
14
May
-14
Apr-1
4
Mar
-14
Feb-
14
Jan-
14
Dec
-13
Nov
-13
Oct
-13
Sep-
13
Aug-
13
Jul-1
3
400
300
200
100
0
Allotments Expenditures
Cumulative toDate Expenditure Comparison
Millions $
Variance toDate:$11.3 million underexpended
34.7% underexpended
60 Quarterly Financial Report Through December 2013
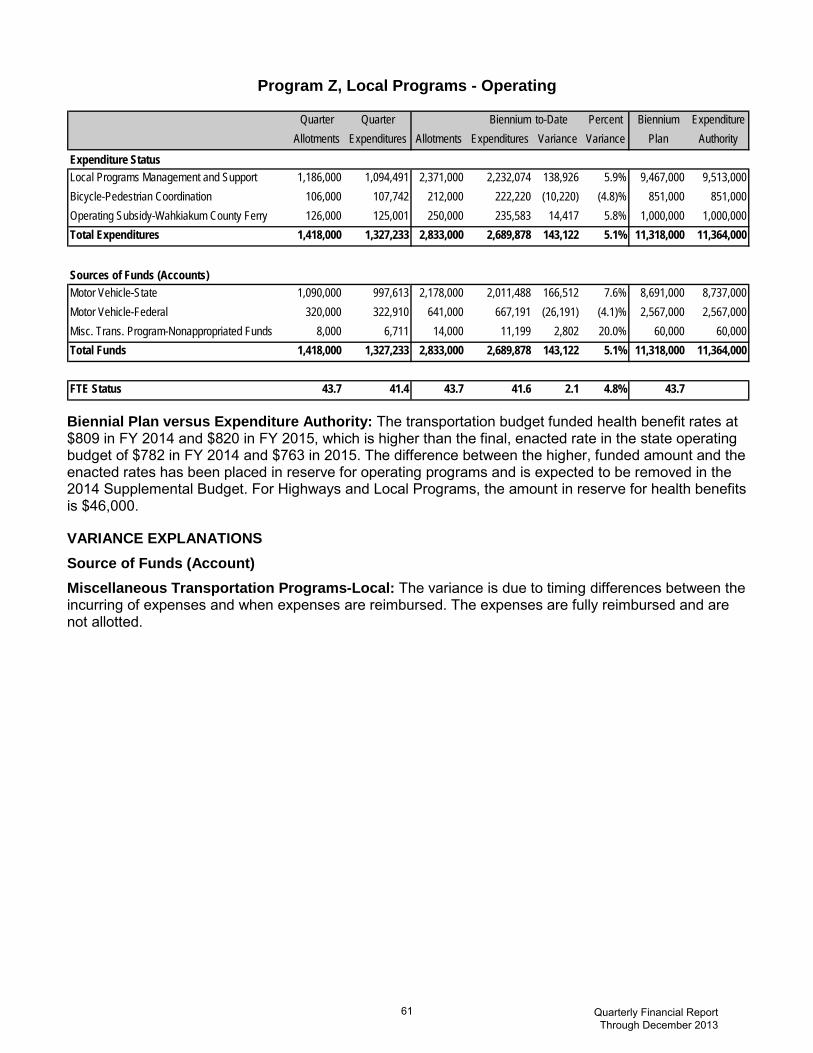
Program Z, Local Programs - Operating
Quarter Quarter Biennium to-Date Percent Biennium ExpenditureAllotments Expenditures Allotments Expenditures Variance Variance Plan Authority
Expenditure Status
Local Programs Management and Support 1,186,000 1,094,491 2,371,000 2,232,074 138,926 5.9% 9,467,000 9,513,000Bicycle-Pedestrian Coordination 106,000 107,742 212,000 222,220 (10,220) (4.8)% 851,000 851,000Operating Subsidy-Wahkiakum County Ferry 126,000 125,001 250,000 235,583 14,417 5.8% 1,000,000 1,000,000Total Expenditures 1,418,000 1,327,233 2,833,000 2,689,878 143,122 5.1% 11,318,000 11,364,000
Sources of Funds (Accounts)
Motor Vehicle-State 1,090,000 997,613 2,178,000 2,011,488 166,512 7.6% 8,691,000 8,737,000Motor Vehicle-Federal 320,000 322,910 641,000 667,191 (26,191) (4.1)% 2,567,000 2,567,000Misc. Trans. Program-Nonappropriated Funds 8,000 6,711 14,000 11,199 2,802 20.0% 60,000 60,000Total Funds 1,418,000 1,327,233 2,833,000 2,689,878 143,122 5.1% 11,318,000 11,364,000
FTE Status 43.7 41.4 43.7 41.6 2.1 4.8% 43.7
Biennial Plan versus Expenditure Authority: The transportation budget funded health benefit rates at $809 in FY 2014 and $820 in FY 2015, which is higher than the final, enacted rate in the state operating budget of $782 in FY 2014 and $763 in 2015. The difference between the higher, funded amount and the enacted rates has been placed in reserve for operating programs and is expected to be removed in the 2014 Supplemental Budget. For Highways and Local Programs, the amount in reserve for health benefits is $46,000.
VARIANCE EXPLANATIONS Source of Funds (Account) Miscellaneous Transportation Programs-Local: The variance is due to timing differences between the incurring of expenses and when expenses are reimbursed. The expenses are fully reimbursed and are not allotted.
61 Quarterly Financial Report Through December 2013

Program Z, Local ProgramsOperating
Jun-
15
May
-15
Apr-1
5
Mar
-15
Feb-
15
Jan-
15
Dec
-14
Nov
-14
Oct
-14
Sep-
14
Aug-
14
Jul-1
4
Jun-
14
May
-14
Apr-1
4
Mar
-14
Feb-
14
Jan-
14
Dec
-13
Nov
-13
Oct
-13
Sep-
13
Aug-
13
Jul-1
3
1.0
0.8
0.6
0.4
0.2
0.0
Allotments Expenditures
Monthly Expenditure Comparison
Millions $
Jun-
15
May
-15
Apr-1
5
Mar
-15
Feb-
15
Jan-
15
Dec
-14
Nov
-14
Oct
-14
Sep-
14
Aug-
14
Jul-1
4
Jun-
14
May
-14
Apr-1
4
Mar
-14
Feb-
14
Jan-
14
Dec
-13
Nov
-13
Oct
-13
Sep-
13
Aug-
13
Jul-1
3
12
10
8
6
4
2
0
Allotments Expenditures
Cumulative toDate Expenditure Comparison
Millions $
Variance toDate:$0.1 million underexpended
5.1% underexpended
62 Quarterly Financial Report Through December 2013

Program Z, Local Programs – Capital
Quarter Quarter Biennium to-Date Percent Biennium ExpenditureAllotments Expenditures Allotments Expenditures Variance Variance Plan Authority
Expenditure Status
Construction-Off State System 94,782,500 92,812,328 131,637,000 119,617,482 12,019,518 9.1% 525,846,000 525,846,000Local Agency Investments on the State System 655,000 395,560 1,177,000 461,716 715,284 60.8% 4,832,000 4,832,000Total Expenditures 95,437,500 93,207,888 132,814,000 120,079,198 12,734,802 9.6% 530,678,000 530,678,000
Sources of Funds (Accounts)
Highway Infrastructure-State 25,000 0 49,000 0 49,000 100.0% 207,000 207,000Highway Infrastructure-Federal 198,000 0 396,000 0 396,000 100.0% 1,602,000 1,602,000Transportation Partnership-State 888,000 939,630 1,776,000 1,025,224 750,776 42.3% 7,214,000 7,214,000Highway Safety-State 1,095,000 882,266 2,190,000 986,809 1,203,191 54.9% 8,805,000 8,805,000Motor Vehicle-State 204,000 34,193 408,000 34,193 373,807 91.6% 1,634,000 1,634,000Motor Vehicle-Federal 3,141,500 1,990,684 6,278,000 2,129,163 4,148,837 66.1% 25,163,000 25,163,000Multimodal Transportation-State 1,719,000 1,465,067 3,438,000 1,686,575 1,751,425 50.9% 13,913,000 13,913,000Misc. Trans. Program-Nonappropriated Funds 87,117,000 83,841,853 116,179,000 110,163,039 6,015,961 5.2% 463,740,000 463,740,000Misc. Trans. Program-Federal-Nonappropriated ARRA 1,050,000 4,054,195 2,100,000 4,054,195 (1,954,195) (93.1)% 8,400,000 8,400,000Total Funds 95,437,500 93,207,888 132,814,000 120,079,198 12,734,802 9.6% 530,678,000 530,678,000
FTE Status 36.0 25.2 36.0 24.1 11.9 32.9% 36.0
VARIANCE EXPLANATIONS Expenditure Status Local Agency Investments on the State System: Expenditure activity was less than planned for federal non-appropriated projects that are on the state highway system. Source of Funds (Account) Highway Infrastructure-State: The underspending is due to a delay in the contract payment request. Highway Infrastructure-Federal: The underspending is due to a delay in the contract payment request. Transportation Partnership-State: The underspending is due to expenditures lagging behind expectations on the “Lake Forest Park & Ride” and numerous projects in the 2013 Bicycle-Pedestrian and Safe Routes to School Program. Highway Safety Account-State: The underspending is due primarily to lower than anticipated expenditures to date for the 2013 Bicycle-Pedestrian and Safe Routes to School Program. Motor Vehicle Account–State: Progress is slower than originally anticipated for activity on several projects, including “SR 908 Pavement Rehab,” “US 101 Safety Rest Area,” and “Deer Harbor Guard Rail.” Motor Vehicle Account–Federal: The underspending is due to expenditures lagging behind initial expectations for this activity in several projects, including “Scott Ave. Reconstruction,” 156th/160th Rehab,” SR 908 Pavement Rehab,” 61st Ave NE & NE 181st,” as well as numerous 2013 Bicycle-Pedestrian and Safe Routes to School Program projects.. Multimodal Transportation-State: The underspending is primarily due to expenditures lagging behind initial expectations on the “Parker Road-SR 20 Realign and Transit Park” project and numerous projects in the 2013 Bicycle-Pedestrian and Safe Routes to Schools Program.
63 Quarterly Financial Report Through December 2013
Program Z, Local Programs – Capital (Continued)
Miscellaneous Transp. Programs ARRA: The negative variance is due to the final payment on the “South Lake Union Corridor” project being greater than anticipated. FTE Status: The anticipated FTE expenditures for work on local projects are less than anticipated due to staff turnover. The vacant positions are in the recruitment process.
64 Quarterly Financial Report Through December 2013

Program Z, Local ProgramsCapital
Jun-
15
May
-15
Apr-1
5
Mar
-15
Feb-
15
Jan-
15
Dec
-14
Nov
-14
Oct
-14
Sep-
14
Aug-
14
Jul-1
4
Jun-
14
May
-14
Apr-1
4
Mar
-14
Feb-
14
Jan-
14
Dec
-13
Nov
-13
Oct
-13
Sep-
13
Aug-
13
Jul-1
3
50
40
30
20
10
0
Allotments Expenditures
Monthly Expenditure Comparison
Millions $
Jun-
15
May
-15
Apr-1
5
Mar
-15
Feb-
15
Jan-
15
Dec
-14
Nov
-14
Oct
-14
Sep-
14
Aug-
14
Jul-1
4
Jun-
14
May
-14
Apr-1
4
Mar
-14
Feb-
14
Jan-
14
Dec
-13
Nov
-13
Oct
-13
Sep-
13
Aug-
13
Jul-1
3
500
250
0
Allotments Expenditures
Cumulative toDate Expenditure Comparison
Millions $
Variance toDate:$12.7 million underexpended
9.6% underexpended
65 Quarterly Financial Report Through December 2013
Appendices
Appendix A, Agency Expenditure FTE Summary
Appendix B, 2013-15 Unanticipated Receipts
Appendix C, 2013-15 Other Program Changes
Appendix D, Miscellaneous Transportation Programs Account, Fund 784
Appendix E, Advanced Environmental Mitigation Revolving Account (AEMRA), Project Funding
Appendix F, Advance Right of Way Revolving Account (AROW), Project Funding
66 Quarterly Financial Report Through December 2013

Appendix A, Agency FTE Expenditure Summary
Quarter Quarter Biennium toDate Percent Biennial Programs Allotments Expenditures Allotments Expenditures Variance Variance Plan
Operating
BCDFHKMQSTUVXYZ
Toll Operations and MaintenanceInformation TechnologyFacilitiesOperatingAviationProgram Delivery Management and SupportPublicPrivate PartnershipsHighway Maintenance and OperationsTraffic OperationsOperatingTransportation Management and SupportTransportation Planning, Data and ResearchCharges From/Payments to Other AgenciesPublic Transportation Ferries Operations and MaintenanceRailOperatingLocal ProgramsOperating
37.7225.166.413.1214.02.0
1,606.4251.4181.6188.50.037.7
1,723.110.843.7
28.3222.670.612.3202.31.9
1,531.4245.9190.0171.20.033.5
1,667.610.341.4
37.7225.169.313.1214.02.0
1,551.7251.4181.6186.40.037.7
1,754.710.943.7
28.3221.370.412.4203.52.0
1,457.4238.3188.6177.60.035.2
1,664.310.741.6
9.43.8
(1.0)0.710.4(0.0)94.313.1(7.0)8.80.02.590.40.22.1
24.8%1.7%
(1.5)%5.6%4.9%
(1.5)%6.1%5.2%
(3.9)%4.7%0.0%6.5%5.2%1.7%4.8%
37.7225.173.312.6213.42.0
1,578.5250.7186.6187.30.037.5
1,707.010.243.7
Subtotal Operating 4,601.5 4,429.1 4,579.3 4,351.7 227.6 5.0% 4,565.6
Capital
DIPQWYZ
FacilitiesCapitalImprovementsPreservationTraffic OperationsCapitalFerries Division ConstructionRailCapitalLocal ProgramsCapital
19.21,529.1833.810.3121.527.636.0
8.21,263.8757.66.3
117.636.325.2
15.41,523.4851.410.3123.927.636.0
7.61,286.1860.67.2
113.234.424.1
7.8237.3(9.1)3.110.7(6.7)11.9
50.4%15.6%(1.1)%30.3%8.7%
(24.4)%32.9%
12.31,405.5837.910.3128.028.836.0
Subtotal Capital 2,577.6 2,215.1 2,588.1 2,333.2 254.9 9.8% 2,458.9Subtotal 7,179.0 6,644.2 7,167.4 6,684.9 482.5 6.7% 7,024.5
Revolving
E Transportation Equipment Fund 209.3 204.6 208.1 205.3 2.8 1.4% 209.3Subtotal Revolving 209.3 204.6 208.1 205.3 2.8 1.4% 209.3
Agency Total 7,388.3 6,848.8 7,375.5 6,890.2 485.3 6.6% 7,233.8
67 Quarterly Financial Report Through December 2013
covingj
Line
covingj
Line
covingj
Line
covingj
Line
covingj
Line
covingj
Line
covingj
Line
covingj
Line
covingj
Line
covingj
Line
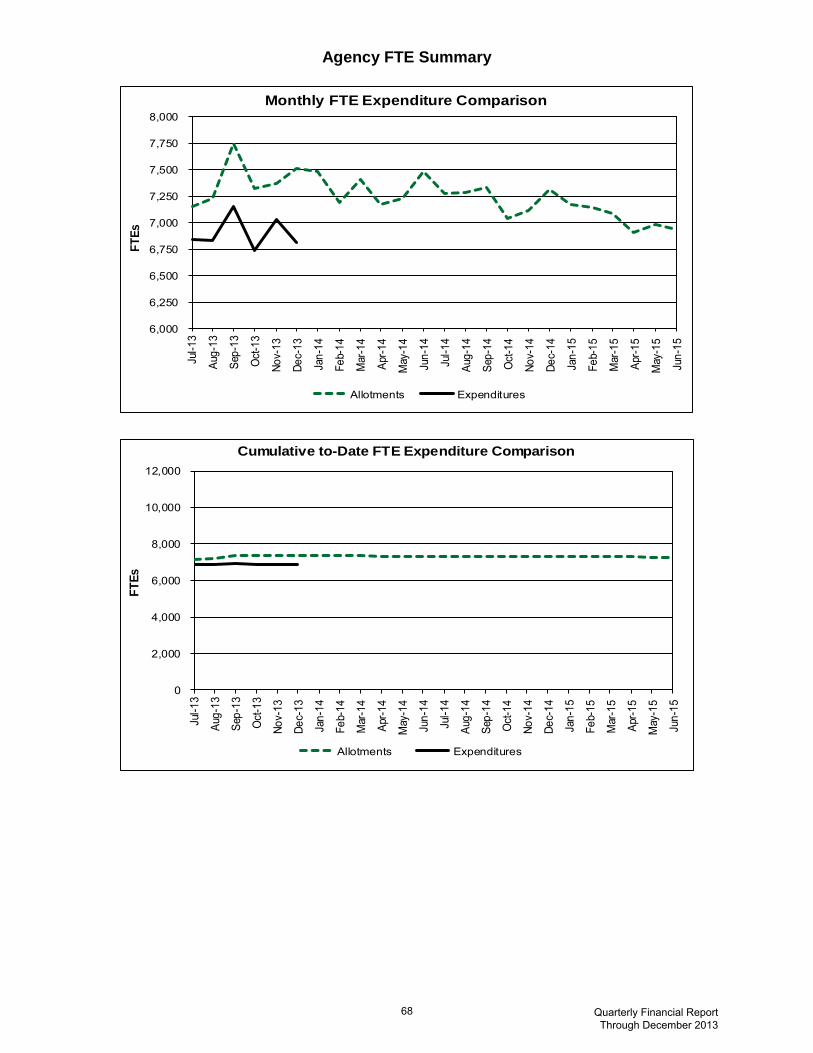
Agency FTE Summary
6,000
6,250
6,500
6,750
7,000
7,250
7,500
7,750
8,000
Jul-
13
Aug
-13
Sep
-13
Oct-
13
Nov
-13
Dec
-13
Jan
-14
Feb
-14
Mar
-14
Apr
-14
May
-14
Jun
-14
Jul-
14
Aug
-14
Sep
-14
Oct-
14
Nov
-14
Dec
-14
Jan
-15
Feb
-15
Mar
-15
Apr
-15
May
-15
Jun
-15
Allotments Expenditures
Monthly FTE Expenditure Comparison
FTEs
0
2,000
4,000
6,000
8,000
10,000
12,000
Jul-
13
Aug
-13
Sep
-13
Oct-
13
Nov
-13
Dec
-13
Jan
-14
Feb
-14
Mar
-14
Apr
-14
May
-14
Jun
-14
Jul-
14
Aug
-14
Sep
-14
Oct-
14
Nov
-14
Dec
-14
Jan
-15
Feb
-15
Mar
-15
Apr
-15
May
-15
Jun
-15
Allotments Expenditures
FTEs
Cumulative to-Date FTE Expenditure Comparison
68 Quarterly Financial Report Through December 2013
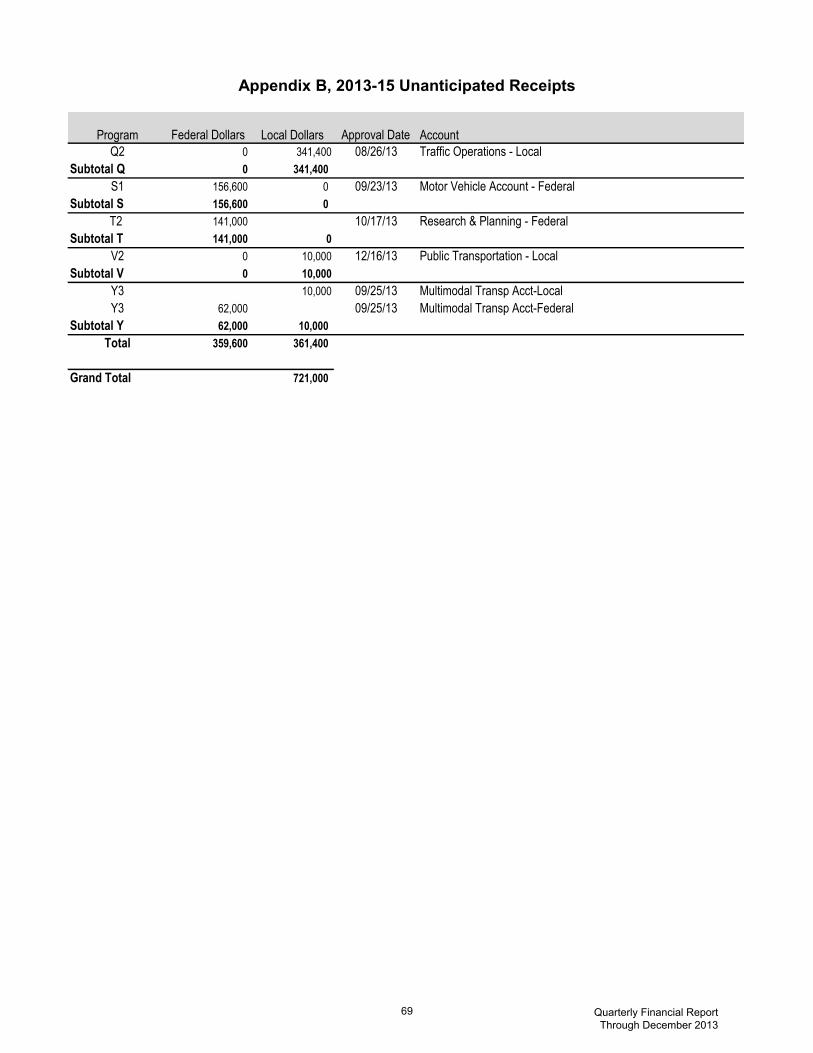
Appendix B, 2013-15 Unanticipated Receipts
Program Federal Dollars Local Dollars Approval Date Account
Q2 0 341,400 08/26/13 Traffic Operations - Local
Subtotal Q 0 341,400
S1 156,600 0 09/23/13 Motor Vehicle Account - Federal
Subtotal S 156,600 0
T2 141,000 10/17/13 Research & Planning - Federal
Subtotal T 141,000 0
V2 0 10,000 12/16/13 Public Transportation - Local
Subtotal V 0 10,000
Y3 10,000 09/25/13 Multimodal Transp Acct-Local
Y3 62,000 09/25/13 Multimodal Transp Acct-Federal
Subtotal Y 62,000 10,000
Total 359,600 361,400
Grand Total 721,000
69 Quarterly Financial Report Through December 2013

Appendix C, 2013-15 Other Program Changes
Program Dollars Approval Date AccountC3 3,200 10/08/13 Miscellaneous Transportation Programs Account - Local
Subtotal C 3,200E1 160,988,000 10/08/13 Transportation Equipment Account - State
Subtotal E 160,988,000I6 14,000,000 10/11/13 Miscellaneous Transportation Programs Account - FederalI6 53,099,000 10/11/13 Miscellaneous Transportation Programs Account - Local
Subtotal I 67,099,000M2 110,000 10/08/13 Miscellaneous Transportation Programs Account - FederalM2 75,000 10/08/13 Miscellaneous Transportation Programs Account - LocalM3 2,818,000 10/08/13 Sales & Services to Others - Local
Subtotal M 3,003,000P9 6,670,000 10/11/13 Miscellaneous Transportation Programs Account - Local
Subtotal P 6,670,000Q2 3,200,000 10/08/13 Miscellaneous Transportation Programs Account - Local
Subtotal Q 3,200,000 S1 36,000 10/08/13 Miscellaneous Transportation Programs Account - LocalS2 175,000 10/08/13 Miscellaneous Transportation Programs Account - Local
Subtotal S 211,000T2 44,265 10/08/13 Miscellaneous Transportation Programs Account - LocalT3 47,000 10/28/13 Sales & Services to Others - Federal T6 17,453,000 10/08/13 Miscellaneous Transportation Programs Account - Federal
Subtotal T 17,544,265V2 41,162,000 10/08/13 Miscellaneous Transportation Programs Account - FederalV2 70,000 10/08/13 Miscellaneous Transportation Programs Account - Local
Subtotal V 41,232,000W1 320,000 10/11/13 Miscellaneous Transportation Programs Account - Local
Subtotal W 320,000Y2 150,000 10/08/13 Miscellaneous Program Account - LocalY4 225,000 10/11/13 King Street Railroad Station Facility Account - Local
Subtotal Y 375,000Z1 60,000 10/08/13 Miscellaneous Program Account - LocalZ2 458,798,000 10/11/13 Miscellaneous Transportation Programs Account - FederalZ2 3,660,000 10/11/13 Miscellaneous Transportation Programs Account - LocalZ2 8,400,000 10/11/13 Miscellaneous Transportation Programs Account - FederalZ9 1,076,000 10/11/13 Miscellaneous Transportation Programs Account - FederalZ9 206,000 10/11/13 Miscellaneous Transportation Programs Account - Local
Subtotal Z 472,200,000Total 772,845,465
In addition to appropriated funds and approved unanticipated receipts, the department also has spending authority in non-appropriated, non-budgeted accounts. These accounts are:
Miscellaneous Transportation Programs Account (784)
Toll Collection Account (495)
Transportation Equipment Account (410)
Miscellaneous Programs Account (759)
King Street Railroad Station Facility Account (432)
Advanced Environmental Mitigation Account (789)
70 Quarterly Financial Report Through December 2013

Appendix D, Miscellaneous Transportation Programs Account, Fund 784Dollars
Quarter Quarter Biennium toDate Percent Biennial Allotments Expenditures Allotments Expenditures Variance Variance Plan
C3D4I6M2M3P9Q2S1S2T2T3T6V2W1Z1Z2Z3Z9
Infrastructure ServicesCapital Facilities Maintenance and OperationRegional Transit Authority ImprovementsMaintenance – On State SystemMaintenance – Sales and Services to OthersSales and Services to OthersTraffic ServicesExecutive Management and SupportFinance and AdministrationPlanningResearch and Library ServicesPass Through FundsPublic TransportationTerminal ConstructionLocal Programs Management and SupportConstruction – Off State SystemBicycle – Pedestrian CoordinationLocal Agency Investments on the State System
00
1,299,00030,000352,000566,000390,000(14,000)
02,765
15,0002,625,5884,631,000
61,0008,000
87,955,0000
212,000
1,3585
3,891,59311,569319,304793,675358,803
0(18)
29,9720
1,883,8963,145,507
5,8838,519
87,703,131(1,809)192,917
8000
2,053,00031,000704,000
1,499,000780,000
00
35,26515,000
4,744,5885,870,000
80,00014,000
117,986,0000
293,000
3,7260
4,997,31190,941710,613
1,804,248690,412
00
29,9720
3,155,2334,238,419
9,89411,199
113,994,4960
222,738
(2,926)0
(2,944,311)(59,941)(6,613)
(305,248)89,588
00
5,29315,000
1,589,3551,631,581
70,1062,802
3,991,5040
70,262
(365.7)%0.0%
(143.4)%(193.4)%(0.9)%(20.4)%11.5%0.0%0.0%15.0%100.0%33.5%27.8%87.6%20.0%3.4%0.0%24.0%
3,2000
67,099,000185,000
2,818,0006,670,0003,200,000
36,0000
44,26547,000
17,453,00041,232,000
320,00060,000
470,858,0000
1,282,00098,133,353 98,344,305 134,105,653 129,959,203 4,146,450 3.1% 611,307,465
Nonappropriated FundsFederalNonappropriated Arra
97,083,3531,050,000
94,291,6074,052,698
132,005,6532,100,000
125,905,0074,054,195
6,100,646(1,954,195)
4.6%(93.1)%
602,907,4658,400,000
98,133,353 98,344,305 134,105,653 129,959,203 4,146,450 3.1% 611,307,465
Expenditure Status
Total Expenditures
Sources of Funds (Accounts)
Total Funds
71 Quarterly Financial Report Through December 2013
connelb
Line
connelb
Line
connelb
Line
connelb
Line
connelb
Line
connelb
Line

Agency Fund 784 Summary
0
5
10
15
20
25
30
35
40
45
50
Jul-1
3
Aug
-13
Sep
-13
Oct
-13
Nov
-13
Dec
-13
Jan-
14
Feb-
14
Mar
-14
Apr
-14
May
-14
Jun-
14
Jul-1
4
Aug
-14
Sep
-14
Oct
-14
Nov
-14
Dec
-14
Jan-
15
Feb-
15
Mar
-15
Apr
-15
May
-15
Jun-
15
Allotments Expenditures
Milli
ons
$Monthly Expenditure Comparison
0
100
200
300
400
500
600
700
Jul-1
3
Aug
-13
Sep
-13
Oct
-13
Nov
-13
Dec
-13
Jan-
14
Feb-
14
Mar
-14
Apr
-14
May
-14
Jun-
14
Jul-1
4
Aug
-14
Sep
-14
Oct
-14
Nov
-14
Dec
-14
Jan-
15
Feb-
15
Mar
-15
Apr
-15
May
-15
Jun-
15
Allotments Expenditures
Milli
ons
$
Cumulative to-Date Expenditure Comparison
Variance to-Date: $4.1 million underexpended
3.1% underexpended
72 Quarterly Financial Report Through December 2013

Appendix D, Miscellaneous Transportation Programs Account, Fund 784 (continued)FullTime Equivalent (FTEs)
Quarter Quarter Biennium toDate Percent Biennial Allotments Expenditures Allotments Expenditures Variance Variance Plan
C3D4I6M2M3P9Q2S1S2T2T3T6V2W1Z1Z2Z3Z9
Infrastructure ServicesCapital Facilities Maintenance and OperationRegional Transit Authority ImprovementsMaintenance – On State SystemMaintenance – Sales and Services to OthersSales and Services to OthersTraffic ServicesExecutive Management and SupportFinance and AdministrationPlanningResearch and Library ServicesPass Through FundsPublic TransportationTerminal ConstructionLocal Programs Management and SupportConstruction – Off State SystemBicycle – Pedestrian CoordinationLocal Agency Investments on the State System
0.00.028.52.224.020.714.00.00.00.20.00.015.03.00.034.00.02.0
0.00.031.9(0.0)5.920.011.60.00.00.40.00.011.80.20.220.60.03.5
0.00.026.71.224.021.914.00.00.01.30.00.015.02.00.034.00.02.0
0.00.028.31.29.024.411.70.00.00.20.00.013.10.20.121.20.02.1
0.00.0
(1.6)0.015.0(2.5)2.30.00.01.10.00.01.91.8
(0.1)12.80.0
(0.1)
0.00.0
(6.1)1.362.6
(11.6)16.40.00.083.40.00.012.891.70.037.70.0
(7.4)
0.00.039.22.824.024.014.00.00.00.50.00.015.02.00.034.00.02.0
143.6 106.1 142.1 111.5 30.5 21.5 157.5
FTE Status
Total FTEs
73 Quarterly Financial Report Through December 2013
covingj
Line
covingj
Line
covingj
Line
covingj
Line
covingj
Typewritten Text
covingj
Typewritten Text
covingj
Typewritten Text
covingj
Typewritten Text
covingj
Typewritten Text
covingj
Typewritten Text
covingj
Typewritten Text
covingj
Text Box
The Miscellaneous Transportation Programs Account (Fund 784) was created in 1997. It was established to track federal funds passed through to local governments, and for services the department provides to other public and private entities for which the department receives reimbursement. Fund 784 is “non-appropriated.” This account is also “non-budgeted,” which means that the department does not submit an allotment plan (a spending plan for each month in the biennium) for approval to the Office of Financial Management (OFM).
covingj
Text Box
Although reimbursable services processed through Fund 784 are not subject to legislative appropriations or OFM allotment control, department programs must create a spending plan by month because this fund is subject to internal department expenditure controls.
covingj
Text Box
Expenditures on behalf of other state agencies, as well as reimbursements, are recorded. For internal allotment procedures, reimbursable expenditures from other state agencies are shown in the spending plan as positive amounts but offset in total by negative amounts in Object S - Interagency Reimbursements. As such, net expenditures reported for other state agencies are equal to zero. There is no off-set in the spending plan for other public or private entities because those reimbursements are recorded in the accounting system as revenue, rather than as a negative expenditure.
covingj
Text Box
Note: The department is directed by statute - RCW 47.04.220(7) - to provide an annual report to the Office of Financial Management and to the Legislative Transportation Committees on the activities in the Miscellaneous Transportation Programs account (Fund 784) and any recommended changes in the process. As the department has no recommendations for changes at this time, the report provided here fulfills this requirement.

Appendix D, Miscellaneous Transportation Programs Account, Fund 784 (Continued)
Miscellaneous Transportation Programs Account Activities Programs that use the Miscellaneous Transportation Programs Account (Fund 784) include:
Program C—Office of Information Technology Program C’s reimbursable services relate to interagency agreements with state agencies and municipalities. Subprogram C3–Infrastructure Services includes reimbursable work performed on behalf of other state agencies and municipalities for network and fiber optic installation and co-location. Subprogram C5–Enterprise Applications performs reimbursable work on the Collision Location Accident System (CLAS) for Washington State Patrol (WSP).
Program D—Facilities Program D uses Fund 784 to record expenditures and reimbursements from WSP for utilities and facility maintenance in Southwest Region where it uses a portion of the department’s facilities in Vancouver and at the section maintenance facility at Naselle; and to record expenditures for non-state agencies and private entities for which the program provides services, such as utilities used by the Wenatchee National Forest at a wireless communication site.
Program I—Improvements The department provides project design services and construction project administration to the Central Puget Sound Regional Transit Authority (Sound Transit) for its regional express bus program. Projects involving the department include direct access ramps to state highways for Sound Transit buses and carpools and related high occupancy vehicle (HOV) and supporting facilities such as park and ride lots.
Program M—Highway Maintenance Program M’s reimbursable services consist of maintenance work performed for cities and counties, as well as work performed for the federal government on roads that are not part of the state system.
Program P—Preservation – Subprogram P9 – Sales and Services to Others The Preservation Program accounts for several types of reimbursable services that are provided to other governmental agencies and private parties. These services include the department’s Materials Laboratory and Geographic Information Services cost recovery centers, highway access permit reviews, and real estate reviews and appraisals.
Program Q—Traffic Operations Traffic Operations manages the Motorist Information Sign Program in which businesses may advertise on highway information signs. Businesses are charged a fee to cover costs.
Program S—Transportation Management and Support Subprogram S1 Executive Management and Support utilizes Fund 784 for the collection of conference registration fees and local sponsorship funding for the biennial tribal conference organized by the Governmental Relations Office. The expenditures for conferences are allotted once they are scheduled.
74 Quarterly Financial Report Through December 2013

Appendix D, Miscellaneous Transportation Programs Account, Fund 784 (Continued)
Program T—Transportation Planning, Data, and Research
Subprogram T6 Pass Through Funds: Program T administers the distribution of federal funds to the state’s eleven Metropolitan Planning Organizations to support transportation planning activities.
Subprogram T2: Transportation Planning uses Fund 784 to account for sales of transportation data reports to other government agencies and the public.
Program V—Public Transportation Program V administers grants from the Federal Transit Administration (FTA) for use by public and private transit agencies. FTA grant programs include: (1) Section 5310 program that provides grants to nonprofit agencies serving the elderly and persons with disabilities; (2) Section 5311 program that funds projects to improve public transportation in non-urban areas; (3) Section 5309 grants for bus purchases and other transit equipment, (4) Section 5316 Job Access and Reverse Commute Program that funds transportation services needed by low-income people to access jobs and related support services; and (5) Section 5317 program that provides transportation to persons with disabilities beyond requirements of the Americans with Disabilities Act. The division is also responsible for the selection, administration, and reporting of FTA funds provided by ARRA.
Program W—Ferries Construction Program W uses Fund 784 to account for the purchase and installation of security equipment at terminals and on vessels that are reimbursed by the Emergency Management Division of the Washington State Military Department.
Program Z—Local Programs–Capital Off state system projects – Subprogram Z2: Local Programs administers the federal funds earmarked for city and county highway projects. Off state system projects also include projects in which cities and counties fully reimburse the department for services.
Local agency investments on the state system – Subprogram Z9: Fund 784 is used for projects on the state system that are paid for from local or federal funding sources.
75 Quarterly Financial Report Through December 2013

Appendix E, Advanced Environmental Mitigation Revolving Account (AEMRA) Project Funding
Quarter Quarter Biennial Expenditure Allotments Expenditures Allotments Expenditures Variance Plan Authority
Expenditure StatusAdv. Environmental Mitigation Revolving 0 0 0 0 0 0 0 0 Total Expenditures 0 0 0 0 0 0 0 0
Source of Funds (Account)Advanced Env. Mitigation Revolving 0 0 0 0 0 0 0 0 Total Funds 0 0 0 0 0 0 0 0
FTE Status 0 0 0 0 0 0 0 0
Percent Variance
Biennium to-Date
VARIANCE EXPLANATION
Advance Right of Way Revolving Account: No activity is planned at this time.
Project Funding History
Ref. # ProjectApproved Funding
Date Funding Approved
Expected Payback
DatePayment Received
1 North Fork Newaukum River Mitigation Bank (Teitzel) 1,700,000 12/24/1998 6/30/2018 partial2 Dillenbaugh Creek Mitigation Bank (Greenhill) 167,000 1/29/2004 6/30/2018 -3 Moses Lake Wetland Bank 260,000 12/24/1998 6/30/2018 partial4 South Sequim Bay Vicinity Projects 546,000 6/20/2002 6/30/2018 partial5 SR 101 Bogachiel River (SR101/SR110) 109,507 11/19/2002 6/30/2018 -6 Tarlett Slough Phase I (Acquisition) 293,000 6/24/2003 6/30/2016 partial7 Tarlett Slough Phase II (Development) 460,000 4/28/2009 6/30/2015 20138 SR 3 Belfair Area Widening and Safety 805,000 4/10/2009 9/30/2012 20129 Bainbridge Island Ferry Terminal Project 250,000 12/24/1998 6/30/2007 2006
10 I-405 Corridor Program 250,000 8/19/2002 6/30/2007 200611 I-405 Congestion Relief /Bus Rapid Transit 800,000 4/21/2003 6/30/2007 200612 SR 14 Southwest Region Mitigation Site 280,000 10/20/1999 6/30/2007 200013 Mt. Baker SR5/542 Safety Improvement Projects 375,000 11/30/2007 Cancelled -14 Deer Creek Loop Road to Agate Road 72,835 5/24/2002 6/30/2009 2009
Total 6,368,342 Shaded area - closed loans.
76 Quarterly Financial Report Through December 2013

Appendix F, Advance Right of Way Revolving Account (AROW) Project Funding
Quarter Quarter Biennial Expenditure Allotments Expenditures Allotments Expenditures Variance Plan Authority
Expenditure StatusAdvance Right of Way Revolving Account 0 0 0 0 0 0 0 0Total Expenditures 0 0 0 0 0 0 0 0
Source of Funds (Account)Advanced Right of Way Revolving 0 0 0 0 0 0 0 0Total Funds 0 0 0 0 0 0 0 0
FTE Status 0 0 0 0 0 0 0 0
Percent Variance
Biennium to-Date
VARIANCE EXPLANATION: Advance Right of Way Revolving Account: No activity is planned at this time.
Project History
Property Acquisitions Approved – Reimbursements to be made in Future
Project
Year Funding
Approved
Year Acquisition Completed
Anticipated Replayment Date
Prior Expected Repayment Change
Expected Repayment
SR 6, Interchange to National Ave 1997 1998 Unfunded 2,775,000 2,775,000 North Spokane Corridor 2003 2003 Unfunded** 9,646,000 (6,861,000) 2,785,000 SR 500, NE 15th Ave to NE 66th Ave 2004 2004 Unfunded 2,677,000 2,677,000 SR 509, Freight & Congestion 2004 2008 Unfunded 6,285,000 6,285,000 SR 101, Shore Rd to Kitchen Rd 2006 Repaid July 2010 - - SR 9, SR 522 to Clearwater 1996 Repaid July 2007 - - SR 195, MP93.15 to SR 90 2003 Repaid January 2009 - - SR 510, Yelm Bypass 2005 Repaid July 2007 - - SR 5, SR 161 & SR 18 Interchanges 2005 Repaid December 2009 - -
Total 21,383,000 (6,861,000) 14,522,000 Shaded area – closed loans
77 Quarterly Financial Report Through December 2013

Glossary
Allotment
The department's plan of estimated expenditures, revenues, cash disbursements, and cash receipts for each month of the biennium.
Appropriation A legislative authorization for each program to make expenditures for specific purposes from designated funding sources, and during a specified time period.
Biennial Plan The portion of expenditure authority the department plans to spend in the current biennium.
Biennium A 24-month fiscal period. The biennium period extends from July 1 of odd numbered years to June 30 of odd numbered years, such as the 2013-15 biennium, which runs from July 1, 2013 to June 30, 2015.
Expenditure Authority
Total amount of expenditures the department is authorized to make in the biennium. For each program, expenditure authority is the sum of legislative appropriations; additional appropriation authority for federal and local funds obtained through the unanticipated receipts process administered by the Office of Financial Management (OFM); and funds the department is authorized to spend that are not subject to legislative appropriations (such as, federal pass through funds that are processed through the Miscellaneous Transportation Programs).
FTE Staff Full time equivalent (FTE) is a way to measure the size of the state's workforce. One FTE equates to approximately 1,771 hours of work for a fiscal year and is determined by available hours less holidays and a three year historical average of vacation and sick leave taken. The factors for conversion are calculated on a monthly basis for regular full-time employees, temporary employees, and for overtime worked.
Internal Service Fund
A fund that produces goods or services on a cost reimbursement basis. Example: Operations Transportation Equipment Fund (TEF), and a portion of the TEF purchases and maintains vehicles for the department's use, and recovers costs from the program that use the equipment.
Nonappropriated Funds
Funding can be expended without legislative appropriation. Only funds in accounts specifically established in state law as being exempt from appropriation fall into this category. Nonappropriated accounts can either be budgeted (subject to OFM allotment approval), such as the Transportation Equipment Fund, or nonbudgeted, such as the Miscellaneous Transportation Programs Account.
Program A program is a major activity within the department expressed as a primary function or organizational unit. The department may not alter its program structure without explicit approval of the Legislature and the OFM.
Reserve Appropriation authority that the department does not expect to use because of circumstances such as technical corrections, proviso compliance, and the Governor's cash deficit allotment reductions.
Sub-Program A general term describing specific activities within the department's programs.
Unallotted Appropriation authority not specifically scheduled for expenditure.
Unanticipated Receipts
Federal or Local money received which has not been appropriated by the Legislature. The Governor has the authority to approve allotment of such money within the guidelines of the intent in which they were received.
78 Quarterly Financial Report Through December 2013