2013-15 Quarterly Financial Report · 2013-15 . Quarterly Financial Report. Through September 2014...
83
2013-15 Quarterly Financial Report Through September 2014 Financial Administration Budget and Financial Analysis December 1, 2014
Transcript of 2013-15 Quarterly Financial Report · 2013-15 . Quarterly Financial Report. Through September 2014...

2013-15 Quarterly Financial Report Through September 2014 Financial Administration Budget and Financial Analysis December 1, 2014

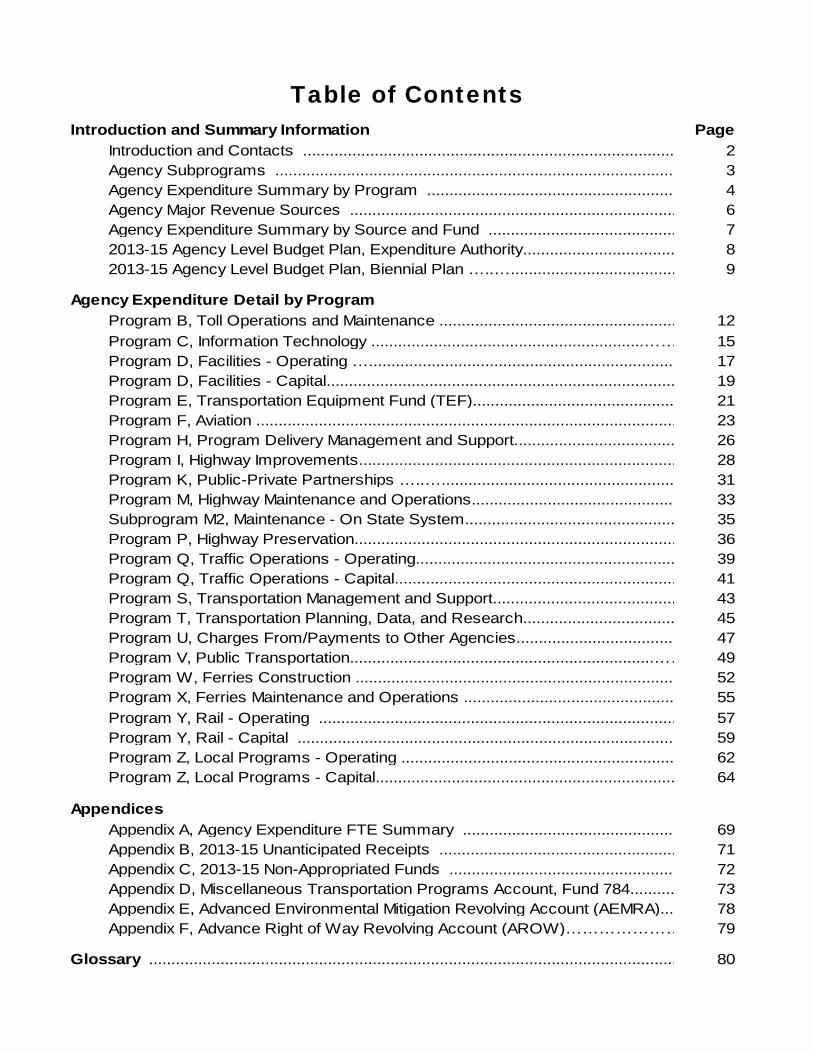
Table of Contents Introduction and Summary Information Page
Introduction and Contacts .................................................................................... 2Agency Subprograms .......................................................................................... 3Agency Expenditure Summary by Program ........................................................ 4Agency Major Revenue Sources ......................................................................... 6Agency Expenditure Summary by Source and Fund .......................................... 72013-15 Agency Level Budget Plan, Expenditure Authority.................................. 82013-15 Agency Level Budget Plan, Biennial Plan …..…..................................... 9
Agency Expenditure Detail by Program
Program B, Toll Operations and Maintenance ..................................................... 12Program C, Information Technology .............................................................…… 15Program D, Facilities - Operating …..................................................................... 17Program D, Facilities - Capital.............................................................................. 19Program E, Transportation Equipment Fund (TEF).............................................. 21Program F, Aviation .............................................................................................. 23Program H, Program Delivery Management and Support.................................... 26Program I, Highway Improvements....................................................................... 28Program K, Public-Private Partnerships …..…..................................................... 31Program M, Highway Maintenance and Operations.............................................. 33Subprogram M2, Maintenance - On State System............................................... 35Program P, Highway Preservation........................................................................ 36Program Q, Traffic Operations - Operating.......................................................... 39Program Q, Traffic Operations - Capital............................................................... 41Program S, Transportation Management and Support......................................... 43Program T, Transportation Planning, Data, and Research.................................. 45Program U, Charges From/Payments to Other Agencies.................................... 47Program V, Public Transportation....................................................................…… 49Program W, Ferries Construction ........................................................................ 52Program X, Ferries Maintenance and Operations ................................................ 55Program Y, Rail - Operating ................................................................................ 57Program Y, Rail - Capital ..................................................................................... 59Program Z, Local Programs - Operating .............................................................. 62Program Z, Local Programs - Capital................................................................... 64
Appendices
Appendix A, Agency Expenditure FTE Summary ................................................ 69Appendix B, 2013-15 Unanticipated Receipts ..................................................... 71Appendix C, 2013-15 Non-Appropriated Funds ................................................... 72Appendix D, Miscellaneous Transportation Programs Account, Fund 784.......... 73Appendix E, Advanced Environmental Mitigation Revolving Account (AEMRA).... 78Appendix F, Advance Right of Way Revolving Account (AROW)………………… 79
Glossary ...................................................................................................................... 80


Introduction and Summary Information
1 Quarterly Financial Report Through September 2014
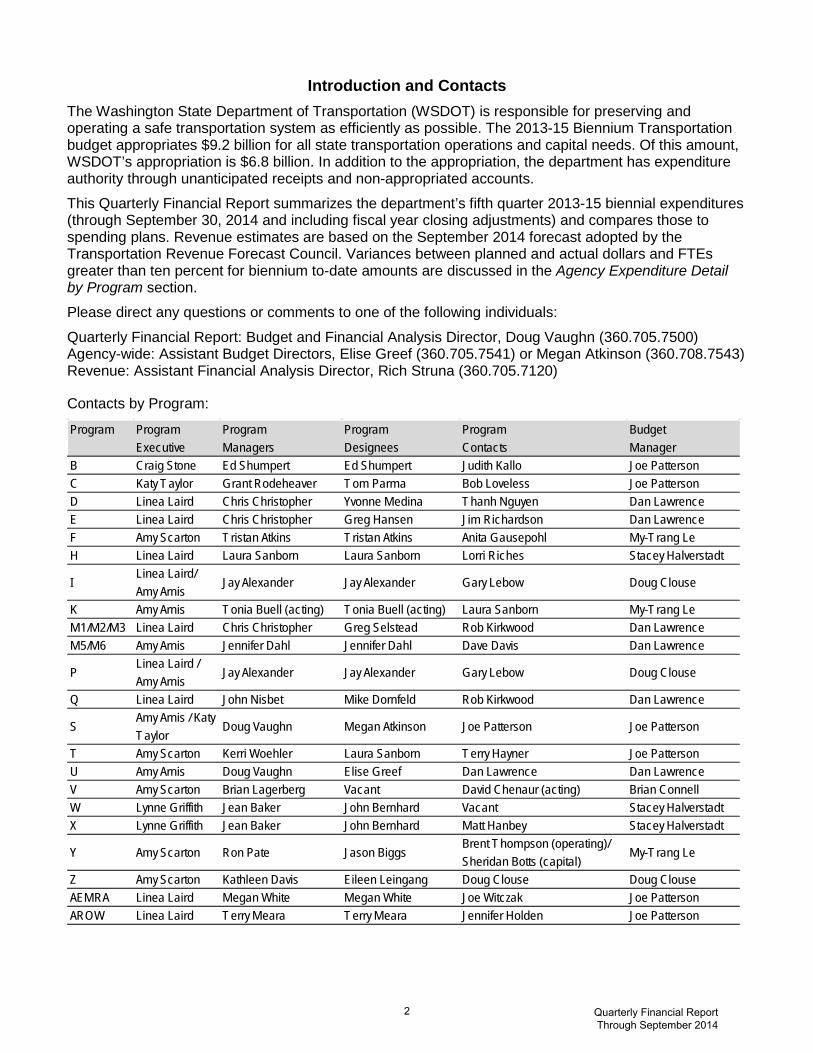
Introduction and Contacts
The Washington State Department of Transportation (WSDOT) is responsible for preserving and operating a safe transportation system as efficiently as possible. The 2013-15 Biennium Transportation budget appropriates $9.2 billion for all state transportation operations and capital needs. Of this amount, WSDOT’s appropriation is $6.8 billion. In addition to the appropriation, the department has expenditure authority through unanticipated receipts and non-appropriated accounts.
This Quarterly Financial Report summarizes the department’s fifth quarter 2013-15 biennial expenditures (through September 30, 2014 and including fiscal year closing adjustments) and compares those to spending plans. Revenue estimates are based on the September 2014 forecast adopted by the Transportation Revenue Forecast Council. Variances between planned and actual dollars and FTEs greater than ten percent for biennium to-date amounts are discussed in the Agency Expenditure Detail by Program section.
Please direct any questions or comments to one of the following individuals:
Quarterly Financial Report: Budget and Financial Analysis Director, Doug Vaughn (360.705.7500) Agency-wide: Assistant Budget Directors, Elise Greef (360.705.7541) or Megan Atkinson (360.708.7543) Revenue: Assistant Financial Analysis Director, Rich Struna (360.705.7120)
Contacts by Program:
Program ProgramExecutive
ProgramManagers
ProgramDesignees
ProgramContacts
BudgetManager
B Craig Stone Ed Shumpert Ed Shumpert Judith Kallo Joe PattersonC Katy Taylor Grant Rodeheaver Tom Parma Bob Loveless Joe PattersonD Linea Laird Chris Christopher Yvonne Medina Thanh Nguyen Dan LawrenceE Linea Laird Chris Christopher Greg Hansen Jim Richardson Dan LawrenceF Amy Scarton Tristan Atkins Tristan Atkins Anita Gausepohl My-Trang LeH Linea Laird Laura Sanborn Laura Sanborn Lorri Riches Stacey Halverstadt
ILinea Laird/ Amy Arnis
Jay Alexander Jay Alexander Gary Lebow Doug Clouse
K Amy Arnis Tonia Buell (acting) Tonia Buell (acting) Laura Sanborn My-Trang LeM1/M2/M3 Linea Laird Chris Christopher Greg Selstead Rob Kirkwood Dan LawrenceM5/M6 Amy Arnis Jennifer Dahl Jennifer Dahl Dave Davis Dan Lawrence
PLinea Laird / Amy Arnis
Jay Alexander Jay Alexander Gary Lebow Doug Clouse
Q Linea Laird John Nisbet Mike Dornfeld Rob Kirkwood Dan Lawrence
SAmy Arnis / Katy Taylor
Doug Vaughn Megan Atkinson Joe Patterson Joe Patterson
T Amy Scarton Kerri Woehler Laura Sanborn Terry Hayner Joe PattersonU Amy Arnis Doug Vaughn Elise Greef Dan Lawrence Dan LawrenceV Amy Scarton Brian Lagerberg Vacant David Chenaur (acting) Brian ConnellW Lynne Griffith Jean Baker John Bernhard Vacant Stacey HalverstadtX Lynne Griffith Jean Baker John Bernhard Matt Hanbey Stacey Halverstadt
Y Amy Scarton Ron Pate Jason BiggsBrent Thompson (operating)/ Sheridan Botts (capital)
My-Trang Le
Z Amy Scarton Kathleen Davis Eileen Leingang Doug Clouse Doug ClouseAEMRA Linea Laird Megan White Megan White Joe Witczak Joe PattersonAROW Linea Laird Terry Meara Terry Meara Jennifer Holden Joe Patterson
2 Quarterly Financial Report Through September 2014
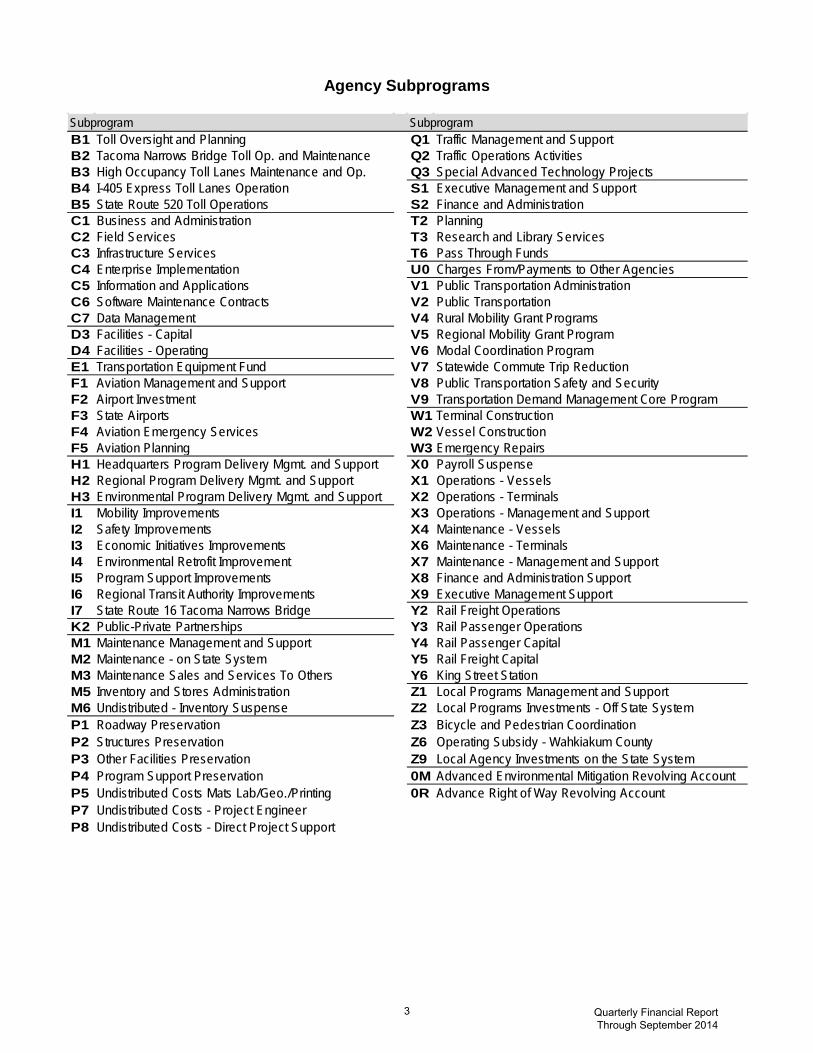
Agency Subprograms
Subprogram SubprogramB1 Toll Oversight and Planning Q1 Traffic Management and SupportB2 Tacoma Narrows Bridge Toll Op. and Maintenance Q2 Traffic Operations ActivitiesB3 High Occupancy Toll Lanes Maintenance and Op. Q3 Special Advanced Technology ProjectsB4 I-405 Express Toll Lanes Operation S1 Executive Management and SupportB5 State Route 520 Toll Operations S2 Finance and AdministrationC1 Business and Administration T2 PlanningC2 Field Services T3 Research and Library ServicesC3 Infrastructure Services T6 Pass Through FundsC4 Enterprise Implementation U0 Charges From/Payments to Other AgenciesC5 Information and Applications V1 Public Transportation AdministrationC6 Software Maintenance Contracts V2 Public TransportationC7 Data Management V4 Rural Mobility Grant ProgramsD3 Facilities - Capital V5 Regional Mobility Grant ProgramD4 Facilities - Operating V6 Modal Coordination ProgramE1 Transportation Equipment Fund V7 Statewide Commute Trip ReductionF1 Aviation Management and Support V8 Public Transportation Safety and SecurityF2 Airport Investment V9 Transportation Demand Management Core ProgramF3 State Airports W1 Terminal ConstructionF4 Aviation Emergency Services W2 Vessel ConstructionF5 Aviation Planning W3 Emergency RepairsH1 Headquarters Program Delivery Mgmt. and Support X0 Payroll SuspenseH2 Regional Program Delivery Mgmt. and Support X1 Operations - VesselsH3 Environmental Program Delivery Mgmt. and Support X2 Operations - TerminalsI1 Mobility Improvements X3 Operations - Management and SupportI2 Safety Improvements X4 Maintenance - VesselsI3 Economic Initiatives Improvements X6 Maintenance - TerminalsI4 Environmental Retrofit Improvement X7 Maintenance - Management and SupportI5 Program Support Improvements X8 Finance and Administration SupportI6 Regional Transit Authority Improvements X9 Executive Management SupportI7 State Route 16 Tacoma Narrows Bridge Y2 Rail Freight OperationsK2 Public-Private Partnerships Y3 Rail Passenger OperationsM1 Maintenance Management and Support Y4 Rail Passenger CapitalM2 Maintenance - on State System Y5 Rail Freight CapitalM3 Maintenance Sales and Services To Others Y6 King Street StationM5 Inventory and Stores Administration Z1 Local Programs Management and SupportM6 Undistributed - Inventory Suspense Z2 Local Programs Investments - Off State SystemP1 Roadway Preservation Z3 Bicycle and Pedestrian CoordinationP2 Structures Preservation Z6 Operating Subsidy - Wahkiakum CountyP3 Other Facilities Preservation Z9 Local Agency Investments on the State SystemP4 Program Support Preservation 0M Advanced Environmental Mitigation Revolving AccountP5 Undistributed Costs Mats Lab/Geo./Printing 0R Advance Right of Way Revolving AccountP7 Undistributed Costs - Project EngineerP8 Undistributed Costs - Direct Project Support
3 Quarterly Financial Report Through September 2014

Dollars in Millions
Quarter Quarter Biennium toDate Percent Biennium Expenditure Programs Allotments Expenditures Allotments Expenditures Variance Variance Plan Authority
Agency Expenditure Summary by Program
* The 201315 Expenditure Authority includes dollars placed in unallotted and/or reserve status.** "NonAppropriated Budgeted" portions of operating programs are reflected separately because program expenditures are reimbursed from other WSDOT programs.
Operating
BCDFHKMQSTUVXYZ
Toll Operations and MaintenanceInformation TechnologyFacilitiesOperatingAviationProgram Delivery Management and SupportPublicPrivate PartnershipsHighway Maintenance and OperationsTraffic OperationsOperatingTransportation Management and SupportTransportation Planning, Data and ResearchCharges From/Payments to Other AgenciesPublic Transportation Ferries Operations and MaintenanceRailOperatingLocal ProgramsOperating
9.98.82.91.46.10.151.87.53.58.219.413.162.33.61.4
9.59.12.70.85.70.145.36.33.45.819.75.158.43.31.3
38.544.615.95.029.60.4
249.434.717.639.756.167.0302.524.47.1
35.442.915.94.028.30.3
245.732.216.839.055.362.0295.025.46.6
3.11.70.00.91.40.03.72.50.80.70.85.07.5
(1.0)0.4
8.1%3.8%0.0%18.4%4.6%7.1%1.5%7.1%4.5%1.8%1.4%7.4%2.5%
(3.9)%5.8%
58.971.926.18.249.10.6
406.855.828.666.177.2151.9482.746.211.3
68.272.026.110.149.40.6
411.655.928.767.277.7152.9483.546.211.3
***************
199.9 176.5 932.3 904.8 27.5 2.9% 1,541.3 1,561.3 *Subtotal Operating
Capital
DIPQWYZ
FacilitiesCapitalImprovementsPreservationTraffic OperationsCapitalFerries Division ConstructionRailCapitalLocal ProgramsCapital
4.4473.8141.42.933.068.941.0
3.0211.7103.40.417.9(8.3)40.1
9.51,752.2429.17.3
171.8174.7307.2
7.31,484.6413.04.5
152.8121.1320.4
2.3267.616.22.819.053.6
(13.2)
23.8%15.3%3.8%38.0%11.1%30.7%(4.3)%
23.93,231.9671.913.4379.3449.1547.6
23.93,670.3726.414.3379.3485.1547.6
***
*
765.4 368.1 2,851.9 2,503.7 348.2 12.2% 5,317.0 5,846.9 *Subtotal CapitalSubtotal 965.3 544.6 3,784.2 3,408.5 375.7 9.9% 6,858.4 7,408.2 *
NonAppropriated Budgeted**
ES
Transportation Equipment FundTransportation Management and Support
12.30.0
16.60.0
91.50.1
82.00.1
9.50.0
10.4%0.0%
156.30.2
156.30.2
12.4 16.7 91.6 82.1 9.5 10.4% 156.5 156.5Subtotal NonAppropriated Budgeted**
Total 977.6 561.3 3,875.8 3,490.5 385.2 9.9% 7,014.9 7,564.7 *Agency Total
4 Quarterly Financial Report Through September 2014
ConnelB
Line
ConnelB
Line
ConnelB
Line
ConnelB
Line
ConnelB
Line
ConnelB
Line
ConnelB
Line
ConnelB
Line
ConnelB
Line
ConnelB
Line

Jun15
May15
Apr15
Mar15
Feb15
Jan15
Dec14
Nov14
Oct14
Sep14
Aug14
Jul14
Jun14
May14
Apr14
Mar14
Feb14
Jan14
Dec13
Nov13
Oct13
Sep13
Aug13
Jul13
7,500
5,000
2,500
0
Allotments Expenditures
Cumulative toDate Expenditure Comparison
Millions $
Jun15
May15
Apr15
Mar15
Feb15
Jan15
Dec14
Nov14
Oct14
Sep14
Aug14
Jul14
Jun14
May14
Apr14
Mar14
Feb14
Jan14
Dec13
Nov13
Oct13
Sep13
Aug13
Jul13
1,000.0
750.0
500.0
250.0
0.0
(250.0)
Allotments Expenditures
Monthly Expenditure Comparison
Millions $
Agency Level
Variance toDate:$385.2 million underexpended
9.9% underexpended
5 Quarterly Financial Report Through September 2014

September-2014 Budget Current
First Quarter FY 2015 Forecast (b)
Forecast (a)
Feb-14 Sep-14
Motor Vehicle Fuel Tax
Collection - Motor Vehicle Account 1,599.6 1,601.5 2,531.2 2,535.8
DistributionRefunds and Transfers 84.2 84.2 138.5 135.8Distribution toTIB and CRAB (Local Governments) 164.4 164.4 260.5 261.3Distribution to Other State Accounts 79.3 79.3 125.7 126.0Distribution to Cities and Counties 302.3 302.2 478.6 480.3Distribution to Nickel Account 200.2 200.2 317.2 318.1Distribution to Transportation Partnership Account 340.3 340.3 539.3 540.8Total Distribution from Motor Vehicle Account 1,170.5 1,170.5 1,859.8 1,862.3
Net Fuel Tax Revenue to Motor Vehicle Acct. 429.0 430.9 671.4 673.6
Licenses, Permits, and FeesMotor Vehicle (108) 261.2 260.7 422.4 423.7State Patrol (081) 188.5 189.8 300.9 304.5State Ferries (109) 9.6 9.7 15.2 15.5Capital Vessel Replacement (18J) 0.0 0.0 10.3 10.3RV Disposal Fee (097) 0.9 0.7 1.3 1.3Multimodal Fund (218) 84.2 85.2 135.7 137.3Transportation 2003 (Nickel) Account (555) 46.8 47.4 77.0 76.1Transportation Partnership Account (09H) 25.5 26.3 41.8 42.2Freight Mobility Investment Account (11E) 6.0 6.0 6.0 6.0DOL Services Account (201) 3.8 3.8 6.1 6.1License Plate Technology Account (06T) 1.9 1.9 3.0 3.0Multiuse Roadway Safety Account Collections (571) 0.0 0.0 1.2 0.5Total Licenses, Permits, and Fees 628.4 631.5 1,020.8 1,026.4
Rental Car Sales Tax 37.0 36.8 51.8 54.7
Sales Tax on Motor Vehicles 39.2 39.3 62.0 63.1
Use Tax on Motor Vehicles 7.6 7.6 12.1 12.1
Business Related Revenue (Motor Vehicle Account) 12.5 12.0 14.5 18.3
Farebox Revenue 223.5 225.7 335.3 344.9
Non-Farebox Revenue 4.5 4.7 7.5 8.0
Toll Operations RevenueTacoma Narrows Bridge Tolls (511) 82.5 81.1 133.5 133.5TNB Transponder Sales, Violations and Fees (511) 0.9 1.3 2.3 2.3TNB Civil Penalties (511) 0.8 0.3 2.6 2.6HOT Lane SR 167 Tolls (09F) 1.6 1.6 2.6 2.6HOT Lane Transponder Sales and Fees (09F) 0.1 0.1 0.1 0.1SR 520 Corridor (16J) 77.2 76.1 133.3 133.3SR 520 Corridor Transponder Sales and Fees (16J) 3.3 2.8 1.0 1.0SR 520 Civil Penalties and Fees (17P) 11.4 7.9 18.3 18.3Total Toll Operation Revenue 177.9 171.0 293.7 293.7
Aircraft Fuel Tax (c) 3.6 3.7 6.7 6.5
Bonds (d)
50 15Nickel 297 170TPA 812 415
Total 1,159 600SR 520 GARVEE 323 323 TIFIA 300 10Remaining Bond Authorization 344 - 2011-13 Net Proceeds (f) 148 148
Total 1,115 481
2,274 1,081 TOTAL BONDS
R-49
2013-15 Appropriation
ProceedsSold To
Date
Agency Major Revenue Sources
Biennium To Date
Forecast (a)
Actual
Dollars in Millions
(a) The biennium to date and current biennial forecast columns reflect the Sept 2014 forecast. (b) The biennial budget column reflects the February 2014 revenue forecast. The February 2014 forecast was assumed in the development of the 2014 Transportation Budget (ESSB 6001, CH. 222 laws of 2014 PV). The Bond Proceeds are not forecasted but reflect current appropriations. The February 2014 forecast for TNB and SR 520 includes actual experience through December 2013 (c) Aircraft fuel tax does not include a transfer of 0.028% of gross fuel tax collections from the Motor Vehicle Account (108) to the Aeronautics Account (039). (d) SR 520 TIFIA and SR 520 are fully appropriated however, Section 306 (12) (d) requires $84 million of the SR520 federal appropriation be unallotted and $354.4 million of the SR 520 state appropriation be unallotted. (e) Remaining bond authorization include $111 million in Triple Pledge bond proceeds. (f) Net proceeds from bonds sold in 2011-13, but authorized in 2013-15 so proceeds can be assigned.
6 Quarterly Financial Report Through September 2014

Dollars in Millions
Fund Quarter Quarter Biennium toDate Biennial ExpenditureSource Account Allotments Expenditures Allotments Expenditures Plan Authority
Agency Expenditure Summary by Source and Fund
Appropriated FundsState02M03904509409609909F09H10610810911B15316J17P215218511550595
Essential Rail AssistanceAeronauticsState Vehicle ParkingTransportation InfrastructureHighway InfrastructurePuget Sound Capital ConstructionHigh Occ Toll Lanes OperationsTransportation PartnershipHighway SafetyMotor VehiclePuget Sound Ferry OperationsRegional Mobility Grant ProgramRural Mobility Grant ProgramState Route Number 520 CorridorState Route Number 520 Civil PenaltiesSpecial Category "C"Multimodal TransportationTacoma Narrows Toll BridgeTransportation 2003 (Nickel)I405 Express Toll Lanes Ops
0.01.30.10.80.07.90.2
144.36.0
115.962.48.00.6
84.30.50.1
22.84.1
37.80.0
0.00.80.00.50.05.10.2
99.00.8
103.558.61.20.8
70.00.60.13.73.8
25.70.0
0.34.90.44.20.1
28.81.2
710.518.3531.0302.918.39.9
379.12.60.1
83.115.6225.10.0
0.23.90.33.80.0
25.41.0
597.218.9497.7295.314.38.8
405.62.60.1
65.514.9233.20.0
1.07.90.87.20.2
63.81.9
1,376.432.4856.8483.151.117.0553.14.20.1
157.823.3519.91.5
1.07.90.89.20.2
63.81.9
1,376.432.4858.9483.951.117.0914.44.20.1
159.825.1519.92.0
*
*
*
**
**
**
*1 Subtotal State 497.1 374.4 2,336.3 2,189.0 4,159.6 4,530.1 *
Local039099108109218
AeronauticsPuget Sound Capital ConstructionMotor VehiclePuget Sound Ferry OperationsMultimodal Transportation
0.00.25.50.00.0
0.00.01.70.00.0
0.00.3
20.80.10.0
0.00.1
13.10.00.0
0.01.3
178.80.10.4
0.01.3
179.00.10.5
*
*3 Subtotal Local 5.7 1.7 21.2 13.2 180.6 181.0 *
Federal03909609910816J218
AeronauticsHighway InfrastructurePuget Sound Capital ConstructionMotor VehicleState Route Number 520 CorridorMultimodal Transportation
0.00.2
12.0219.4118.060.3
0.00.05.7
124.60.0
(5.6)
0.11.0
44.8776.6118.0152.5
0.10.0
35.0700.510.0106.4
0.31.6
118.41,134.7216.0403.3
2.21.6
118.41,194.9300.0436.3
*
***
2 Subtotal Federal 410.0 124.8 1,092.9 851.9 1,874.4 2,053.4 *Total Appropriated Funds 912.7 500.8 3,450.5 3,054.2 6,214.6 6,764.4 *
NonAppropriated FundsState410 Transportation Equip. Fund 12.4 16.7 91.6 82.1 156.5 156.5
1 Subtotal State 12.4 16.7 91.6 82.1 156.5 156.5Local432495759784
King Street StationToll CollectionMiscellaneous ProgramMisc. Trans. Program
0.00.00.0
18.3
0.00.00.04.3
0.00.00.0
42.2
0.00.00.0
25.0
0.20.00.2
102.0
0.20.00.2
102.03 Subtotal Local 18.3 4.3 42.2 25.0 102.4 102.4
Federal784784
Misc. Trans. ProgramARRAMisc. Trans. Program
1.133.2
0.039.5
5.3286.2
4.1325.2
8.4533.0
8.4533.0
2 Subtotal Federal 34.2 39.5 291.5 329.3 541.4 541.4Total NonAppropriated Funds 64.9 60.4 425.3 436.4 800.3 800.3
Agency Total 977.6 561.3 3,875.8 3,490.6 7,014.9 7,564.7 *
7 Quarterly Financial Report Through September 2014
ConnelB
Line
ConnelB
Line
ConnelB
Line
ConnelB
Line
ConnelB
Line
ConnelB
Line
ConnelB
Line
ConnelB
Line
ConnelB
Line
ConnelB
Line
ConnelB
Line
ConnelB
Line
ConnelB
Line
ConnelB
Line
ConnelB
Line
ConnelB
Line

2013-15 Agency Level Budget Plan, Expenditure Authority Dollars in Millions
2013 Legislative 2014 Legislative 2015 Legislative Unanticipated Non-Appropriated Compensation Expenditure Appropriations (a) + Appropriations + Appropriations + Receipts (b) + Funds (c) + Adjustments = Authority
OperatingB Toll Operations and Maintenance 62.7 5.5 0.0 0.0 0.0 0.0 68.2C Information Technology 72.1 -0.1 0.0 0.0 0.0 0.0 72.0D Facilities-Operating 26.3 -0.1 0.0 0.0 0.0 0.0 26.1F Aviation 9.5 0.5 0.0 0.0 0.0 0.0 10.1H Program Delivery Management & Support 48.4 1.1 0.0 0.0 0.0 0.0 49.4K Public-Private Partnerships 0.6 0.0 0.0 0.0 0.0 0.0 0.6M Highway Maintenance & Operations 407.0 1.3 0.0 0.0 3.2 0.0 411.6Q Traffic Operations-Operating 52.8 -0.4 0.0 0.3 3.2 0.0 55.9S Transportation Management & Support 28.3 0.2 0.0 0.2 0.0 0.0 28.7T Transportation Planning, Data & Research 48.6 0.9 0.0 0.1 17.5 0.0 67.2U Charges From/Payments to Other Agencies 82.1 -4.4 0.0 0.0 0.0 0.0 77.7V Public Transportation 109.7 1.9 0.0 0.0 41.2 0.0 152.9X Ferries Operations & Maintenance 485.2 -1.7 0.0 0.0 0.0 0.0 483.5Y Rail-Operating 32.9 13.1 0.0 0.1 0.2 0.0 46.2Z Local Programs-Operating 11.3 -0.1 0.0 0.0 0.1 0.0 11.3
Subtotal Operating 1,477.4 17.8 0.0 0.7 65.5 0.0 1,561.3
CapitalD Facilities-Capital 21.5 2.3 0.0 0.0 0.0 0.0 23.9I Improvements 3,478.1 94.4 0.0 0.0 97.7 0.0 3,670.3P Preservation 698.6 19.9 0.0 0.0 7.9 0.0 726.4Q Traffic Operations-Capital 11.2 3.1 0.0 0.0 0.0 0.0 14.3W Ferries Division Construction 291.3 87.7 0.0 0.0 0.3 0.0 379.3Y Rail-Capital 376.5 108.4 0.0 0.0 0.2 0.0 485.1Z Local Programs-Capital 58.5 16.9 0.0 0.0 472.1 0.0 547.6
Subtotal Capital 4,935.8 332.8 0.0 0.0 578.3 0.0 5,846.9Subtotal 6,413.2 350.5 0.0 0.7 643.8 0.0 7,408.2
E Transportation Equipment Fund 0.0 0.0 0.0 0.0 156.3 0.0 156.3S Transportation Management & Support 0.0 0.0 0.0 0.0 0.2 0.0 0.2
Subtotal Non-Appropriated Budgeted 0.0 0.0 0.0 0.0 156.5 0.0 156.5
Agency Total 6,413.2 350.5 0.0 0.7 800.3 0.0 7,564.7
Programs
Non-Appropriated Budgeted (d)
(a) Legislative Appropriations include the 2013-15 Transportation Budget Bill – ESSB 5024 (Chapter 306, Laws of 2013, PV) and the 2014 Supplemental
Transportation Budget Bill – ESSB 6001 (Chapter 222, Laws of 2014, PV). (b) See Appendix B, Unanticipated Receipts, or specific program for details. (c) See Appendix C, Non-Appropriated Funds, or specific program for details. (d) “Non-Appropriated Budgeted” portions of operating programs are reflected separately because program expenditures are reimbursed from other
WSDOT programs.
8 Quarterly Financial Report Through September 2014
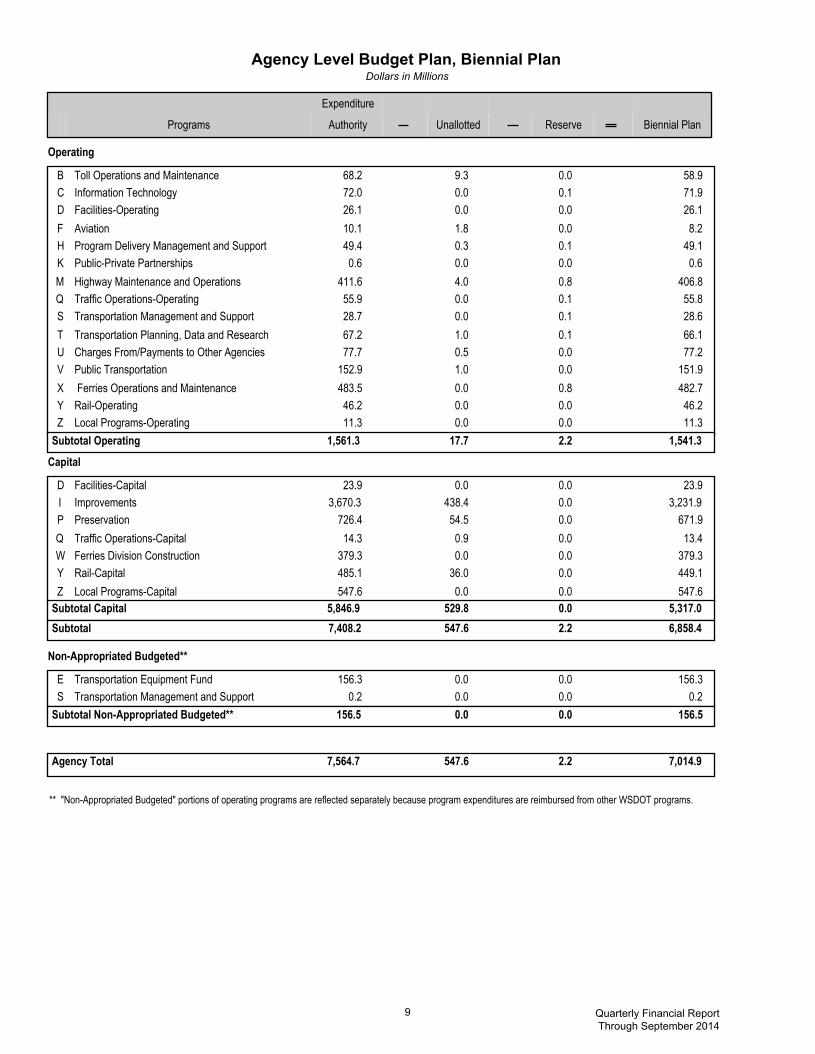
Dollars in MillionsAgency Level Budget Plan, Biennial Plan
Expenditure
Programs Authority Unallotted Reserve Biennial Plan
Operating
BCDFHKMQSTUVXYZ
Toll Operations and MaintenanceInformation TechnologyFacilitiesOperatingAviationProgram Delivery Management and SupportPublicPrivate PartnershipsHighway Maintenance and OperationsTraffic OperationsOperatingTransportation Management and SupportTransportation Planning, Data and ResearchCharges From/Payments to Other AgenciesPublic Transportation Ferries Operations and MaintenanceRailOperatingLocal ProgramsOperating
68.272.026.110.149.40.6
411.655.928.767.277.7152.9483.546.211.3
9.30.00.01.80.30.04.00.00.01.00.51.00.00.00.0
0.00.10.00.00.10.00.80.10.10.10.00.00.80.00.0
58.971.926.18.249.10.6
406.855.828.666.177.2151.9482.746.211.3
Subtotal Operating 1,561.3 17.7 2.2 1,541.3
Capital
DIPQWYZ
FacilitiesCapitalImprovementsPreservationTraffic OperationsCapitalFerries Division ConstructionRailCapitalLocal ProgramsCapital
23.93,670.3726.414.3379.3485.1547.6
0.0438.454.50.90.036.00.0
0.00.00.00.00.00.00.0
23.93,231.9671.913.4379.3449.1547.6
Subtotal Capital 5,846.9 529.8 0.0 5,317.0Subtotal 7,408.2 547.6 2.2 6,858.4
NonAppropriated Budgeted**
ES
Transportation Equipment FundTransportation Management and Support
156.30.2
0.00.0
0.00.0
156.30.2
Subtotal NonAppropriated Budgeted** 156.5 0.0 0.0 156.5
Agency Total 7,564.7 547.6 2.2 7,014.9
** "NonAppropriated Budgeted" portions of operating programs are reflected separately because program expenditures are reimbursed from other WSDOT programs.
9 Quarterly Financial Report Through September 2014

10 Quarterly Financial Report Through September 2014

Agency Expenditure Detail by Program
11 Quarterly Financial Report Through September 2014

Program B, Toll Operations and Maintenance
Quarter Quarter Biennium to-Date Percent Biennium ExpenditureAllotments Expenditures Allotments Expenditures Variance Variance Plan Authority
Expenditure StatusCommon Toll Expenditure Suspense Account 0 0 0 0 0 0.0% 0 0Toll Oversight And Planning 63,300 112,571 572,000 474,335 97,665 17.1% 763,000 764,000Tacoma Narrows Bridge Toll Op. and Maint. 4,090,700 3,815,173 15,543,600 14,902,665 640,935 4.1% 23,221,000 25,007,000High Occupancy Toll Lanes Op. and Maint. 215,500 219,645 1,155,900 990,425 165,475 14.3% 1,897,000 1,942,000I-405 Express Toll Lanes 0 0 0 0 0 0.0% 1,500,000 2,019,000State Route 520 Toll Operations 5,547,200 5,397,597 21,224,800 19,017,235 2,207,565 10.4% 31,502,000 38,423,000Total Expenditures 9,916,700 9,544,985 38,496,300 35,384,660 3,111,640 8.1% 58,883,000 68,155,000
Sources of Funds (Accounts)High Occ Toll Lanes Operations-State 215,500 219,645 1,155,900 990,425 165,475 14.3% 1,897,000 1,942,000Motor Vehicle-State 63,300 102,546 322,000 328,388 (6,388) (2.0)% 513,000 514,000Puget Sound Ferry Operations-State 0 10,024 250,000 145,947 104,053 41.6% 250,000 250,000State Route Number 520 Corridor-State 5,030,100 4,835,106 18,624,900 16,413,274 2,211,626 11.9% 27,351,000 34,267,000State Route Number 520 Civ il Penalties-State 517,100 562,492 2,599,900 2,603,961 (4,061) (0.2)% 4,151,000 4,156,000Toll Collection-Nonappropriated Funds 0 0 0 0 0 0.0% 0 0Tacoma Narrows Toll Bridge-State 4,090,700 3,815,173 15,543,600 14,902,665 640,935 4.1% 23,221,000 25,007,000I-405 Express Toll Lanes Ops-State 0 0 0 0 0 0.0% 1,500,000 2,019,000Total Funds 9,916,700 9,544,985 38,496,300 35,384,660 3,111,640 8.1% 58,883,000 68,155,000
FTE Status 39.3 29.2 38.6 29.1 9.6 24.8% 38.3 Biennial Plan versus Expenditure Authority: Funding for state employee health insurance is adjusted from $763 per month per employee to $703 per month per employee in fiscal year 2015. The difference between the higher, funded amount and the enacted rates has been placed in reserve for operating programs and is expected to be removed in the 2015 Supplemental Budget. For Program B, the amount in reserve for health benefits is $22,000. In addition, the 2013-15 Biennial Plan is less than the Expenditure Authority because $7.3 million was placed into unallotted status to reflect an operation and maintenance reserve for unforeseen costs at Tacoma Narrows Bridge and State Route 520 Bridge facilities. The program also placed $519,000 of the I-405 Express Toll Lanes (ETL) into unallotted status until a plan to begin tolling is approved by the Office of Financial Management, in consultation with the transportation committees of the Legislature. In addition, $1.4 million of the Customer Service Center (CSC) vendor re-procurement proviso is placed into unallotted status until a procurement plan is approved by the Office of Financial Management, in consultation with the transportation committees of the Legislature. VARIANCE EXPLANATIONS Expenditure Status Toll Oversight and Planning: The variance is due to expenditures related to the statewide customer service center integration plan occurring later than planned. High Occupancy Toll Lanes Maintenance & Operations: The variance is due to lower than planned vendor costs, staffing costs due to vacancies, and delay in the CSC re-procurement project. State Route 520 Toll Operations: The variance is due to credit card fees and transponder related costs being lower than expected as well as staffing costs being lower than planned due to vacancies. Additionally, a portion of the variance is due to the delay in the CSC re-procurement project.
12 Quarterly Financial Report Through September 2014

Program B, Toll Operations and Maintenance (Continued) Source of Funds (Accounts) High Occupancy Toll Lanes Operations-State: See explanation in High Occupancy Toll Lanes Maintenance and Operations. Puget Sound Ferry Operations-State: See explanation for Toll Oversight and Planning. State Route 520 Corridor-State: See explanation for SR 520 Toll Operations. FTE Status: The FTE variance is primarily due to vacancies. ALLOTMENT ADJUSTMENTS Allotments were adjusted to reflect the delay in developing a request for proposal for a new vendor contract for the tolling Customer Service Center.
13 Quarterly Financial Report Through September 2014

Program B, Toll Operations and Maintenance (continued)
Jun15
May15
Apr15
Mar15
Feb15
Jan15
Dec14
Nov14
Oct14
Sep14
Aug14
Jul14
Jun14
May14
Apr14
Mar14
Feb14
Jan14
Dec13
Nov13
Oct13
Sep13
Aug13
Jul13
7.5
5.0
2.5
0.0
Allotments Expenditures
Monthly Expenditure Comparison
Millions $
Jun15
May15
Apr15
Mar15
Feb15
Jan15
Dec14
Nov14
Oct14
Sep14
Aug14
Jul14
Jun14
May14
Apr14
Mar14
Feb14
Jan14
Dec13
Nov13
Oct13
Sep13
Aug13
Jul13
50
25
0
Allotments Expenditures
Cumulative toDate Expenditure Comparison
Millions $
Variance toDate:$3.1million underexpended 8.1% underexpended
14 Quarterly Financial Report Through September 2014

Program C, Information Technology
Quarter Quarter Biennium to-Date Percent Biennium ExpenditureAllotments Expenditures Allotments Expenditures Variance Variance Plan Authority
Expenditure StatusBusiness And Administration 286,000 297,009 1,586,000 1,522,660 63,340 4.0% 2,693,000 2,699,000Field Serv ices 3,635,000 3,836,754 18,596,000 17,745,574 850,426 4.6% 29,694,000 29,743,000Infrastructure Serv ices 1,535,800 1,215,763 7,800,400 7,118,845 681,555 8.7% 13,131,200 13,151,200Enterprise Implementation 189,000 286,307 1,244,000 1,244,789 (789) (0.1)% 1,975,000 1,979,000Information And Applications 1,254,000 1,390,849 6,310,000 6,137,537 172,463 2.7% 10,075,000 10,098,000Software Maintenance Contracts 1,337,000 1,527,161 6,125,000 6,253,071 (128,071) (2.1)% 9,718,000 9,718,000Data Management 578,000 563,846 2,895,000 2,854,090 40,910 1.4% 4,617,000 4,626,000Total Expenditures 8,814,800 9,117,688 44,556,400 42,876,568 1,679,832 3.8% 71,903,200 72,014,200
Sources of Funds (Accounts)Transportation Partnership-State 139,000 150,709 869,000 1,023,972 (154,972) (17.8)% 1,460,000 1,460,000Motor Vehicle-State 8,104,000 8,352,207 40,763,000 39,108,344 1,654,656 4.1% 65,825,000 65,936,000Puget Sound Ferry Operations-State 85,000 188,181 217,000 188,181 28,819 13.3% 263,000 263,000Multimodal Transportation-State 329,000 269,915 1,810,000 1,591,204 218,796 12.1% 2,883,000 2,883,000Transportation 2003 (Nickel)-State 157,000 155,901 886,000 953,515 (67,515) (7.6)% 1,460,000 1,460,000Misc. Trans. Program-Nonappropriated Funds 800 774 11,400 11,353 47 0.4% 12,200 12,200Total Funds 8,814,800 9,117,688 44,556,400 42,876,568 1,679,832 3.8% 71,903,200 72,014,200Total Funds
FTE Status 225.1 232.3 225.1 227.2 (2.1) (1.0)% 225.1 Biennial Plan versus Expenditure Authority: Funding for state employee health insurance is adjusted from $763 per month per employee to $703 per month per employee in fiscal year 2015. The difference between the higher, funded amount and the enacted rates has been placed in reserve for operating programs and is expected to be removed in the 2015 Supplemental Budget. For Program C, the amount in reserve for health benefits is $111,000. VARIANCE EXPLANATIONS Source of Funds (Accounts) Transportation Partnership-State: The variance is due to earlier-than-planned expenditures for software license renewals. Puget Sound Ferry Operations-State: The variance is due to expenditures paid from the Motor Vehicle Account having not yet been transferred. Multimodal Transportation-State: The variance is due to later-than-planned expenditures for technology research subscriptions.
15 Quarterly Financial Report Through September 2014

Program C, Information Technology (continued)
Jun15
May15
Apr15
Mar15
Feb15
Jan15
Dec14
Nov14
Oct14
Sep14
Aug14
Jul14
Jun14
May14
Apr14
Mar14
Feb14
Jan14
Dec13
Nov13
Oct13
Sep13
Aug13
Jul13
5.0
2.5
0.0
Allotments Expenditures
Monthly Expenditure Comparison
Millions $
Jun15
May15
Apr15
Mar15
Feb15
Jan15
Dec14
Nov14
Oct14
Sep14
Aug14
Jul14
Jun14
May14
Apr14
Mar14
Feb14
Jan14
Dec13
Nov13
Oct13
Sep13
Aug13
Jul13
75
50
25
0
Allotments Expenditures
Cumulative toDate Expenditure Comparison
Millions $
Variance toDate:$1.7 million underexpended 3.8% underexpended
16 Quarterly Financial Report Through September 2014
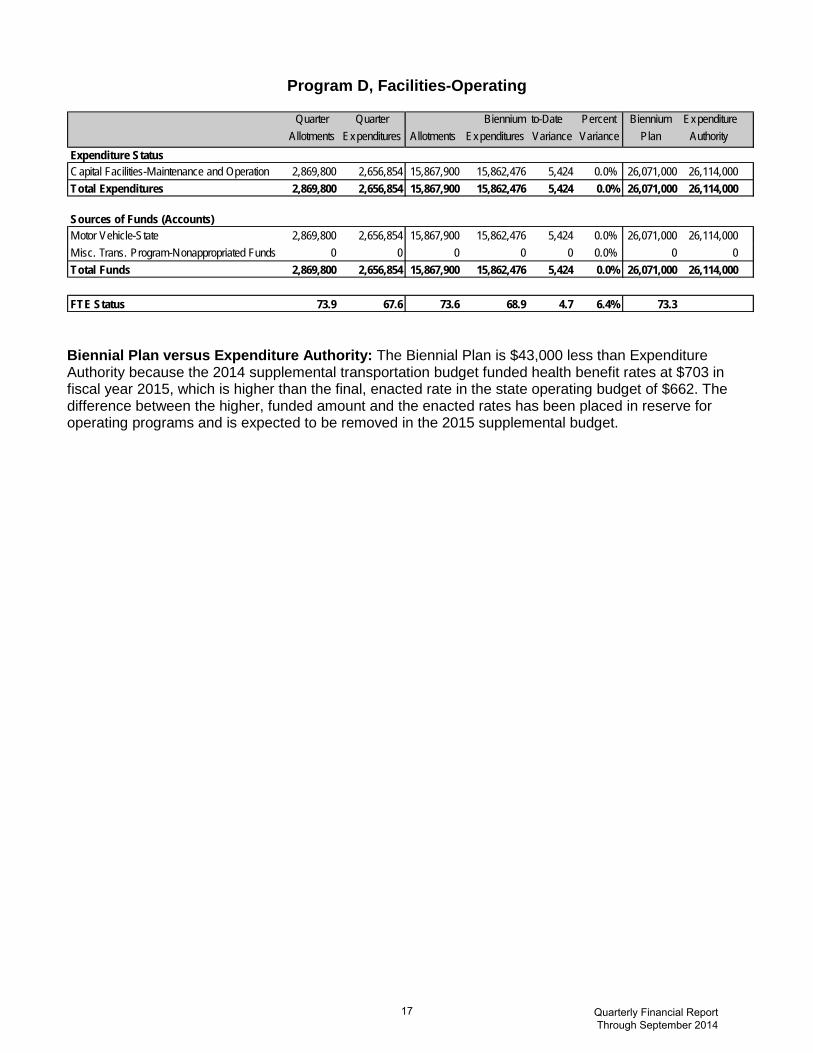
Program D, Facilities-Operating
Quarter Quarter Biennium to-Date Percent Biennium ExpenditureAllotments Expenditures Allotments Expenditures Variance Variance Plan Authority
Expenditure StatusCapital Facilities-Maintenance and Operation 2,869,800 2,656,854 15,867,900 15,862,476 5,424 0.0% 26,071,000 26,114,000Total Expenditures 2,869,800 2,656,854 15,867,900 15,862,476 5,424 0.0% 26,071,000 26,114,000
Sources of Funds (Accounts)Motor Vehicle-State 2,869,800 2,656,854 15,867,900 15,862,476 5,424 0.0% 26,071,000 26,114,000Misc. Trans. Program-Nonappropriated Funds 0 0 0 0 0 0.0% 0 0Total Funds 2,869,800 2,656,854 15,867,900 15,862,476 5,424 0.0% 26,071,000 26,114,000
FTE Status 73.9 67.6 73.6 68.9 4.7 6.4% 73.3 Biennial Plan versus Expenditure Authority: The Biennial Plan is $43,000 less than Expenditure Authority because the 2014 supplemental transportation budget funded health benefit rates at $703 in fiscal year 2015, which is higher than the final, enacted rate in the state operating budget of $662. The difference between the higher, funded amount and the enacted rates has been placed in reserve for operating programs and is expected to be removed in the 2015 supplemental budget.
17 Quarterly Financial Report Through September 2014

Program D, FacilitiesOperating (continued)
Jun15
May15
Apr15
Mar15
Feb15
Jan15
Dec14
Nov14
Oct14
Sep14
Aug14
Jul14
Jun14
May14
Apr14
Mar14
Feb14
Jan14
Dec13
Nov13
Oct13
Sep13
Aug13
Jul13
2.0
1.5
1.0
0.5
0.0
Allotments Expenditures
Monthly Expenditure Comparison
Millions $
Jun15
May15
Apr15
Mar15
Feb15
Jan15
Dec14
Nov14
Oct14
Sep14
Aug14
Jul14
Jun14
May14
Apr14
Mar14
Feb14
Jan14
Dec13
Nov13
Oct13
Sep13
Aug13
Jul13
30
20
10
0
Allotments Expenditures
Cumulative toDate Expenditure Comparison
Millions $
Variance toDate:$0.0million underexpended 0.0% underexpended
18 Quarterly Financial Report Through September 2014

Program D, Facilities-Capital
Quarter Quarter Biennium to-Date Percent Biennium ExpenditureAllotments Expenditures Allotments Expenditures Variance Variance Plan Authority
Expenditure StatusCapital Facilities-Construction 4,364,000 2,981,181 9,532,300 7,263,474 2,268,826 23.8% 23,859,000 23,859,000Total Expenditures 4,364,000 2,981,181 9,532,300 7,263,474 2,268,826 23.8% 23,859,000 23,859,000
Sources of Funds (Accounts)Transportation Partnership-State 1,889,900 2,689,042 4,322,700 5,094,641 (771,941) (17.9)% 14,390,000 14,390,000Motor Vehicle-State 2,474,100 292,139 5,209,600 2,168,832 3,040,768 58.4% 9,469,000 9,469,000Total Funds 4,364,000 2,981,181 9,532,300 7,263,474 2,268,826 23.8% 23,859,000 23,859,000
FTE Status 17.2 8.3 13.9 8.5 5.4 38.7% 12.3 VARIANCE EXPLANATIONS Expenditure Status Capital Facilities-Construction: There are two primary reasons for the variance between the biennium to-date spending plan and actual expenditures. First, minor preservation projects are delayed due to region workforce availability. And, second, major projects related to building code and stormwater permit compliance at Everett, Aberdeen, and Tumwater are delayed due to city permitting processes. Project expenditures are anticipated to catch up to allotments within the next quarter. Source of Funds (Accounts) Transportation Partnership-State: The procurement and installation of the stormwater detention systems and steel fabrication work for the Northwest Region Traffic Management Center project occurred earlier than planned. The project remains within budget and is anticipated to be operationally complete in April 2015. Motor Vehicle Account-State: See the explanation for Capital Facilities-Construction. FTE Status: See the explanation for Motor Vehicle Account-State.
19 Quarterly Financial Report Through September 2014

Program D, FacilitiesCapital (continued)
Jun15
May15
Apr15
Mar15
Feb15
Jan15
Dec14
Nov14
Oct14
Sep14
Aug14
Jul14
Jun14
May14
Apr14
Mar14
Feb14
Jan14
Dec13
Nov13
Oct13
Sep13
Aug13
Jul13
5.0
2.5
0.0
(5.0)
(2.5)
Allotments Expenditures
Monthly Expenditure Comparison
Millions $
Jun15
May15
Apr15
Mar15
Feb15
Jan15
Dec14
Nov14
Oct14
Sep14
Aug14
Jul14
Jun14
May14
Apr14
Mar14
Feb14
Jan14
Dec13
Nov13
Oct13
Sep13
Aug13
Jul13
25
20
15
10
5
0
Allotments Expenditures
Cumulative toDate Expenditure Comparison
Millions $
Variance toDate:$2.3million underexpended
23.8% underexpended
20 Quarterly Financial Report Through September 2014

Program E, Transportation Equipment Fund
Quarter Quarter Biennium to-Date Percent Biennium ExpenditureAllotments Expenditures Allotments Expenditures Variance Variance Plan Authority
Expenditure StatusTransportation Equipment Fund 12,340,000 16,633,063 91,488,000 81,962,683 9,525,317 10.4% 156,287,000 156,287,000Total Expenditures 12,340,000 16,633,063 91,488,000 81,962,683 9,525,317 10.4% 156,287,000 156,287,000
Sources of Funds (Accounts)Transportation Equip. Fund-Nonappropriated Funds 12,340,000 16,633,063 91,488,000 81,962,683 9,525,317 10.4% 156,287,000 156,287,000Total Funds 12,340,000 16,633,063 91,488,000 81,962,683 9,525,317 10.4% 156,287,000 156,287,000
FTE Status 207.0 206.3 208.8 206.0 2.8 1.3% 209.3 Note: As of September 30, 2014, the cash balance for the Transportation Equipment Fund is $16,856,188 while equipment that has been ordered but not yet received totaled $13,500,731. VARIANCE EXPLANATIONS Expenditure Status Transportation Equipment Fund: Expenditures to-date for equipment are less than planned because of delays in purchasing. The responsibility for all purchasing was transferred from the Department of Enterprise Services to the department at the start of 2013-15 biennium; an additional staff person was hired in January 2014 to catch up with equipment purchasing, in addition to other duties. The backlog is being addressed and equipment purchasing is catching up to the plan. TEF fuel expenditures through September exceed the plan as a result of higher than planned consumption, offset by lower than planned per-gallon prices, for a net variance of approximately $260,000. Source of Funds Transportation Equipment Fund-Nonappropriated Funds: See the explanation above for Transportation Equipment Fund.
21 Quarterly Financial Report Through September 2014

Program E, Transportation Equipment Fund (continued)
Jun15
May15
Apr15
Mar15
Feb15
Jan15
Dec14
Nov14
Oct14
Sep14
Aug14
Jul14
Jun14
May14
Apr14
Mar14
Feb14
Jan14
Dec13
Nov13
Oct13
Sep13
Aug13
Jul13
12.5
10.0
7.5
5.0
2.5
0.0
Allotments Expenditures
Monthly Expenditure Comparison
Millions $
Jun15
May15
Apr15
Mar15
Feb15
Jan15
Dec14
Nov14
Oct14
Sep14
Aug14
Jul14
Jun14
May14
Apr14
Mar14
Feb14
Jan14
Dec13
Nov13
Oct13
Sep13
Aug13
Jul13
200
150
100
50
0
Allotments Expenditures
Cumulative toDate Expenditure Comparison
Millions $
Variance toDate:$9.5million underexpended
10.4% underexpended
22 Quarterly Financial Report Through September 2014
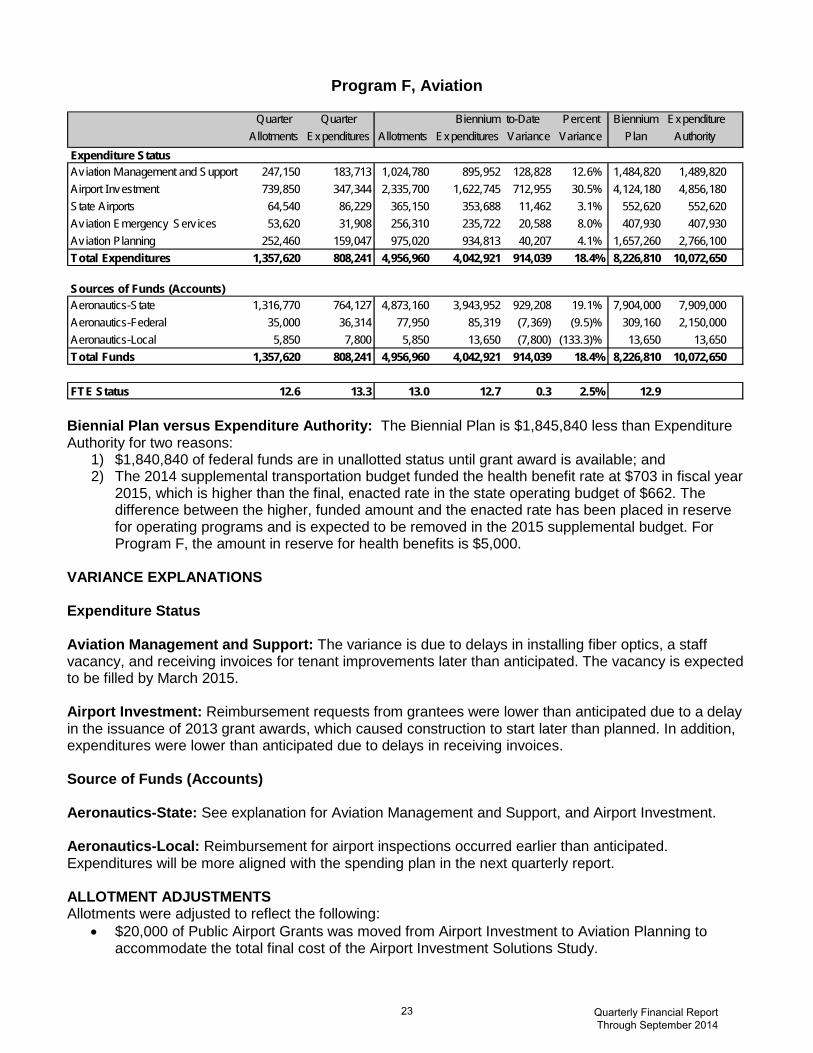
Program F, Aviation
Quarter Quarter Biennium to-Date Percent Biennium ExpenditureAllotments Expenditures Allotments Expenditures Variance Variance Plan Authority
Expenditure StatusAviation Management and Support 247,150 183,713 1,024,780 895,952 128,828 12.6% 1,484,820 1,489,820Airport Investment 739,850 347,344 2,335,700 1,622,745 712,955 30.5% 4,124,180 4,856,180State Airports 64,540 86,229 365,150 353,688 11,462 3.1% 552,620 552,620Aviation Emergency Serv ices 53,620 31,908 256,310 235,722 20,588 8.0% 407,930 407,930Aviation Planning 252,460 159,047 975,020 934,813 40,207 4.1% 1,657,260 2,766,100Total Expenditures 1,357,620 808,241 4,956,960 4,042,921 914,039 18.4% 8,226,810 10,072,650
Sources of Funds (Accounts)Aeronautics-State 1,316,770 764,127 4,873,160 3,943,952 929,208 19.1% 7,904,000 7,909,000Aeronautics-Federal 35,000 36,314 77,950 85,319 (7,369) (9.5)% 309,160 2,150,000Aeronautics-Local 5,850 7,800 5,850 13,650 (7,800) (133.3)% 13,650 13,650Total Funds 1,357,620 808,241 4,956,960 4,042,921 914,039 18.4% 8,226,810 10,072,650
FTE Status 12.6 13.3 13.0 12.7 0.3 2.5% 12.9 Biennial Plan versus Expenditure Authority: The Biennial Plan is $1,845,840 less than Expenditure Authority for two reasons:
1) $1,840,840 of federal funds are in unallotted status until grant award is available; and 2) The 2014 supplemental transportation budget funded the health benefit rate at $703 in fiscal year
2015, which is higher than the final, enacted rate in the state operating budget of $662. The difference between the higher, funded amount and the enacted rate has been placed in reserve for operating programs and is expected to be removed in the 2015 supplemental budget. For Program F, the amount in reserve for health benefits is $5,000.
VARIANCE EXPLANATIONS Expenditure Status Aviation Management and Support: The variance is due to delays in installing fiber optics, a staff vacancy, and receiving invoices for tenant improvements later than anticipated. The vacancy is expected to be filled by March 2015. Airport Investment: Reimbursement requests from grantees were lower than anticipated due to a delay in the issuance of 2013 grant awards, which caused construction to start later than planned. In addition, expenditures were lower than anticipated due to delays in receiving invoices. Source of Funds (Accounts) Aeronautics-State: See explanation for Aviation Management and Support, and Airport Investment. Aeronautics-Local: Reimbursement for airport inspections occurred earlier than anticipated. Expenditures will be more aligned with the spending plan in the next quarterly report. ALLOTMENT ADJUSTMENTS Allotments were adjusted to reflect the following:
• $20,000 of Public Airport Grants was moved from Airport Investment to Aviation Planning to accommodate the total final cost of the Airport Investment Solutions Study.
23 Quarterly Financial Report Through September 2014
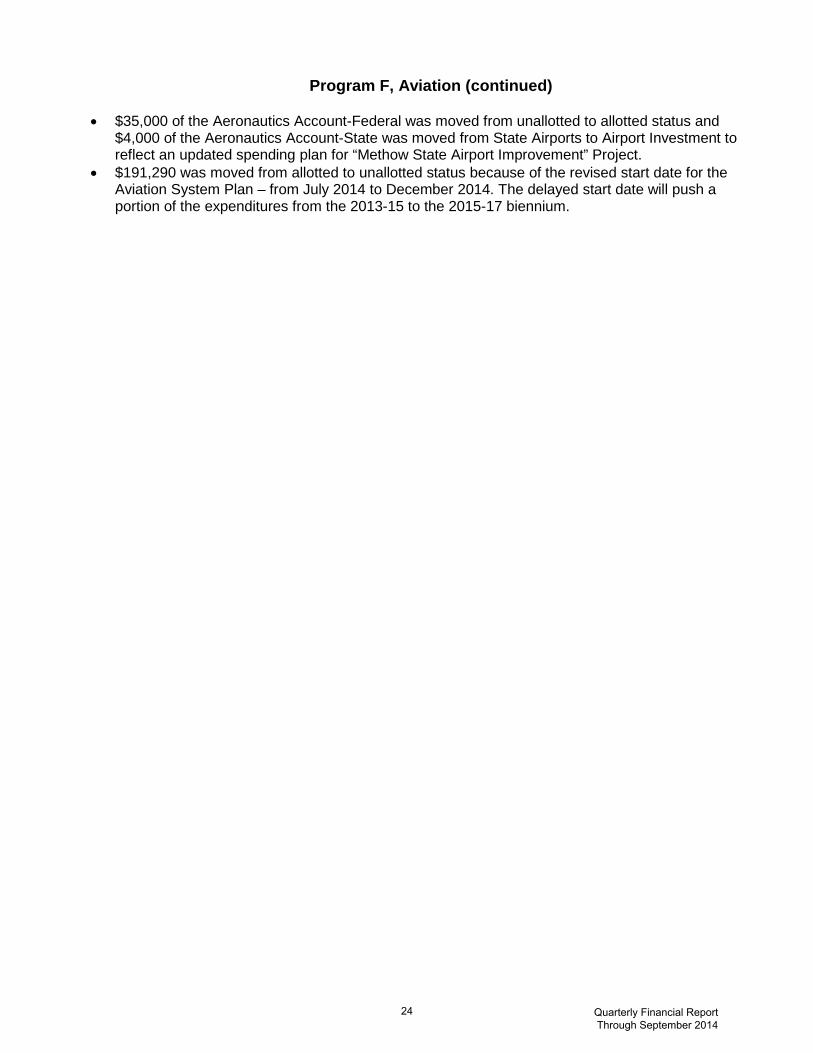
Program F, Aviation (continued)
• $35,000 of the Aeronautics Account-Federal was moved from unallotted to allotted status and $4,000 of the Aeronautics Account-State was moved from State Airports to Airport Investment to reflect an updated spending plan for “Methow State Airport Improvement” Project.
• $191,290 was moved from allotted to unallotted status because of the revised start date for the Aviation System Plan – from July 2014 to December 2014. The delayed start date will push a portion of the expenditures from the 2013-15 to the 2015-17 biennium.
24 Quarterly Financial Report Through September 2014

Program F, Aviation (continued)
Jun-
15
May
-15
Apr
-15
Mar
-15
Feb-
15
Jan-
15
Dec
-14
Nov
-14
Oct
-14
Sep
-14
Aug
-14
Jul-1
4
Jun-
14
May
-14
Apr
-14
Mar
-14
Feb-
14
Jan-
14
Dec
-13
Nov
-13
Oct
-13
Sep
-13
Aug
-13
Jul-1
3
0.4
0.2
0.0
Allotments Expenditures
Monthly Expenditure Comparison
Millions $
Jun-
15
May
-15
Apr
-15
Mar
-15
Feb-
15
Jan-
15
Dec
-14
Nov
-14
Oct
-14
Sep
-14
Aug
-14
Jul-1
4
Jun-
14
May
-14
Apr
-14
Mar
-14
Feb-
14
Jan-
14
Dec
-13
Nov
-13
Oct
-13
Sep
-13
Aug
-13
Jul-1
3
10.0
8.0
6.0
4.0
2.0
0.0
Allotments Expenditures
Cumulative toDate Expenditure Comparison
Millions $
Variance toDate:$0.9million underexpended
18.4% underexpended
25 Quarterly Financial Report Through September 2014

Program H, Program Delivery Management and Support
Quarter Quarter Biennium to-Date Percent Biennium ExpenditureAllotments Expenditures Allotments Expenditures Variance Variance Plan Authority
Expenditure StatusHeadquarters Program Delivery Mgmt. and Support 2,105,100 2,106,729 10,360,700 9,682,374 678,326 6.5% 16,654,500 16,695,500Regional Program Delivery Mgmt. and Support 1,588,900 1,522,497 7,715,500 7,615,292 100,208 1.3% 12,479,700 12,515,500Headquarters Environmental Serv ices Office 2,358,600 2,112,149 11,565,200 10,989,109 576,091 5.0% 19,919,200 20,226,000Total Expenditures 6,052,600 5,741,374 29,641,400 28,286,774 1,354,626 4.6% 49,053,400 49,437,000
Sources of Funds (Accounts)Motor Vehicle-State 5,998,340 5,680,818 29,316,800 27,971,735 1,345,065 4.6% 48,568,000 48,687,000Motor Vehicle-Federal 23,760 29,890 168,600 168,485 115 0.1% 235,400 500,000Multimodal Transportation-State 30,500 30,666 156,000 146,555 9,445 6.1% 250,000 250,000Total Funds 6,052,600 5,741,374 29,641,400 28,286,774 1,354,626 4.6% 49,053,400 49,437,000
FTE Status 221.3 215.4 218.3 207.0 11.3 5.2% 219.2 Biennium Plan versus Expenditure Authority: The 2013-15 Biennium Plan is less than the Expenditure Authority because $264,600 of federal authority was placed in unallotted status. Should federal funds become available, the federal authority will be allotted and a spending plan will be submitted through a quarterly allotment adjustment. In addition, the 2014 supplemental transportation budget funded the health benefit rate at $703 in fiscal year 2015, which is higher than the final, enacted rate in the state operating budget of $662. The difference between the higher, funded amount and the enacted rate has been placed in reserve for operating programs and is expected to be removed in the 2015 supplemental budget. For Program H, the amount in reserve for health benefits is $119,000. ALLOTMENT ADJUSTMENTS In July 2014, allotments were adjusted to reflect an updated spending plan. Adjustments included:
1) Shifting planned spending among objects of expenditure in Headquarters Program Delivery Management & Support and Headquarters Environmental Services Office.
2) Shifting planned spending from the Environmental Services Office to Regional Program Delivery Management & Support to more accurately align with actual expenditure history for salaries.
3) Moving federal allotments for the Environmental Services Office from unallotted to allotted to account for increased state work force work on a new federal project, the “River S Bridge Replacement,” for an architectural and engineering contract, and for unanticipated equipment charges for the federally-funded “Skagit River Basin Pilot” project.
26 Quarterly Financial Report Through September 2014

Program H, Program Delivery Management and Support (continued)
Jun15
May15
Apr15
Mar15
Feb15
Jan15
Dec14
Nov14
Oct14
Sep14
Aug14
Jul14
Jun14
May14
Apr14
Mar14
Feb14
Jan14
Dec13
Nov13
Oct13
Sep13
Aug13
Jul13
2.5
2.0
1.5
1.0
0.5
0.0
Allotments Expenditures
Monthly Expenditure Comparison
Millions $
Jun15
May15
Apr15
Mar15
Feb15
Jan15
Dec14
Nov14
Oct14
Sep14
Aug14
Jul14
Jun14
May14
Apr14
Mar14
Feb14
Jan14
Dec13
Nov13
Oct13
Sep13
Aug13
Jul13
50
40
30
20
10
0
Allotments Expenditures
Cumulative toDate Expenditure Comparison
Millions $
Variance toDate:$1.4 million underexpended 4.6% underexpended
27 Quarterly Financial Report Through September 2014

Program I, Highway Improvements
Quarter Quarter Biennium to-Date Percent Biennium ExpenditureAllotments Expenditures Allotments Expenditures Variance Variance Plan Authority
Expenditure StatusMobility Improvements 411,003,000 182,691,525 1,534,467,000 1,315,768,424 218,698,576 14.3% 2,804,718,000 3,243,130,000Safety Improvements 13,204,000 4,059,113 55,310,000 38,609,178 16,700,822 30.2% 90,941,000 90,941,000Economic Initiatives Improvements 19,641,000 13,459,248 75,534,000 67,600,605 7,933,395 10.5% 142,509,000 142,509,000Environmental Retrofit Improvements 9,449,000 5,510,365 37,292,000 30,381,325 6,910,675 18.5% 65,937,000 65,937,000Program Support Budgeted Improvements 4,005,000 3,719,025 17,862,000 17,125,803 736,197 4.1% 30,055,000 30,055,000Regional Transit Authority Improvements 16,510,000 2,273,477 31,744,000 15,106,296 16,637,704 52.4% 97,716,000 97,716,000SR 16 Tacoma Narrows Bridge Project 0 0 0 0 0 0.0% 12,000 12,000Total Expenditures 473,812,000 211,712,753 1,752,209,000 1,484,591,632 267,617,369 15.3% 3,231,888,000 3,670,300,000
Sources of Funds (Accounts)Transportation Partnership-State 137,214,000 94,564,256 680,142,000 572,423,427 107,718,573 15.8% 1,313,555,000 1,313,555,000Motor Vehicle-State 9,170,000 6,177,117 40,555,000 34,878,362 5,676,638 14.0% 69,478,000 69,478,000Motor Vehicle-Federal 83,195,000 23,530,390 378,659,000 313,385,241 65,273,759 17.2% 516,181,000 516,181,000Motor Vehicle-Federal-ARRA 0 0 0 0 0 0.0% 0 0Motor Vehicle-Local 4,462,000 1,540,871 15,806,000 8,673,654 7,132,347 45.1% 166,357,000 166,357,000State Route Number 520 Corridor-Federal 117,970,000 0 117,970,000 10,000,000 107,970,000 91.5% 215,999,000 300,000,000State Route Number 520 Corridor-State 79,235,000 65,117,145 360,435,000 389,229,356 (28,794,356) (8.0)% 525,700,000 880,111,000Special Category "C"-State 65,000 109,584 91,000 124,000 (33,000) (36.3)% 124,000 124,000Multimodal Transportation-State 0 0 0 0 0 0.0% 1,000,000 1,000,000Transportation 2003 (Nickel)-State 25,991,000 18,399,912 126,807,000 140,771,297 (13,964,297) (11.0)% 325,778,000 325,778,000Misc. Trans. Program-Nonappropriated Funds 16,510,000 2,273,477 31,744,000 15,106,296 16,637,704 52.4% 97,716,000 97,716,000Total Funds 473,812,000 211,712,753 1,752,209,000 1,484,591,632 267,617,369 15.3% 3,231,888,000 3,670,300,000
FTE Status 1,465.3 1,224.0 1,477.6 1,266.2 211.4 14.3% 1,425.3
Biennial Plan versus Expenditure Authority: The 2013-15 Biennial Plan total is $438,412,000 less than the Expenditure Authority total. The Legislature provided full authority for the State Route 520 Bridge Replacement project and the current biennium spending plan for this project is less than the full appropriation by this amount.
VARIANCE EXPLANATIONS Note: The fiscal year closeout included a significant amount of accruals for contractor payments on services provided prior to the end of the fiscal year. Since this accrual, activity only occurs at the end of each fiscal year, and not each month, it skews the expenditure history for June, July, and August. To help compensate for this, the explanations below are representative of the allotment status as of the end of June, ignoring the fiscal year end accruals. Expenditure Status A combination of favorable bids and various project expenditure delays and savings resulted in a variance from estimated expenditures. Specific examples include: Safety Improvements: "US 2/Bickford Avenue - Intersection Safety Improvements" – There was an expenditure reduction due to reimbursement from the Traffic Safety Commission. "SR 546/Depot Rd and Bender Rd - Intersections Improvements" – Under spending is due to an overall project savings from favorable bids.
28 Quarterly Financial Report Through September 2014

Program I, Highway Improvements (Continued) Economic Initiatives Improvements: “I-90/Snowshed to Keechelus Dam Phase 1C - Replace Snowshed and Add Lanes” - The project was updated to reflect construction of a bridge in lieu of the snowshed, which caused a delay from the original schedule. Environmental Retrofit Improvements: “SR 20/Skagit River CED - Permanent Restoration” – Under spending is due to an overall project savings from favorable bids. “SR 106/Twanoh Falls - Chronic Environmental Deficiency” - Under spending is due to an overall project savings from favorable bids. Regional Transit Authority Improvements: “I-90/Two Way Transit - Transit and HOV Improvements” - The expenditures to-date for this project are less than anticipated in the original spending plan. Source of Funds (Account) Transportation Partnership-State: The variance is due to less than anticipated expenditures to date on projects including, “SR 99/S King St Vic to Roy St - Viaduct Replacement” Motor Vehicle Account-State: The variance is due to less than anticipated expenditures to-date on projects including, “SR 20/Skagit River CED – Permanent Restoration,” and “SR 243/Mattawa – Intersection Improvements.” Motor Vehicle Account-Local: The variance is due to reimbursement of expenditures to-date on “US 2/Bickford Avenue – Intersection Safety Improvements.” Special Category “C”-State: The variance is due to less than anticipated expenditures to-date for this fund source on the “SR 18/Maple Valley to Issaquah/Hobart Rd - Add Lanes” project. Miscellaneous Transportation Programs-Local: See explanation under Regional Transit Authority Improvements. FTE Status: The attrition rate to-date in the Improvements Program is higher than was anticipated in the allotment plan. ALLOTMENT ADJUSTMENTS Allotments for all capital programs were adjusted to match the capital project list approved by the Legislature in the 2014 Legislative session, detailed in the Transportation Executive Information System (TEIS) (Version 14LEGFIN).
29 Quarterly Financial Report Through September 2014

Program I, Highway Improvements (continued)
Jun15
May15
Apr15
Mar15
Feb15
Jan15
Dec14
Nov14
Oct14
Sep14
Aug14
Jul14
Jun14
May14
Apr14
Mar14
Feb14
Jan14
Dec13
Nov13
Oct13
Sep13
Aug13
Jul13
750.0
500.0
250.0
0.0
(250.0)
Allotments Expenditures
Monthly Expenditure Comparison
Millions $
Jun15
May15
Apr15
Mar15
Feb15
Jan15
Dec14
Nov14
Oct14
Sep14
Aug14
Jul14
Jun14
May14
Apr14
Mar14
Feb14
Jan14
Dec13
Nov13
Oct13
Sep13
Aug13
Jul13
4,000
3,000
2,000
1,000
0
Allotments Expenditures
Cumulative toDate Expenditure Comparison
Millions $
Variance toDate:$267.6million underexpended 15.3% underexpended
30 Quarterly Financial Report Through September 2014

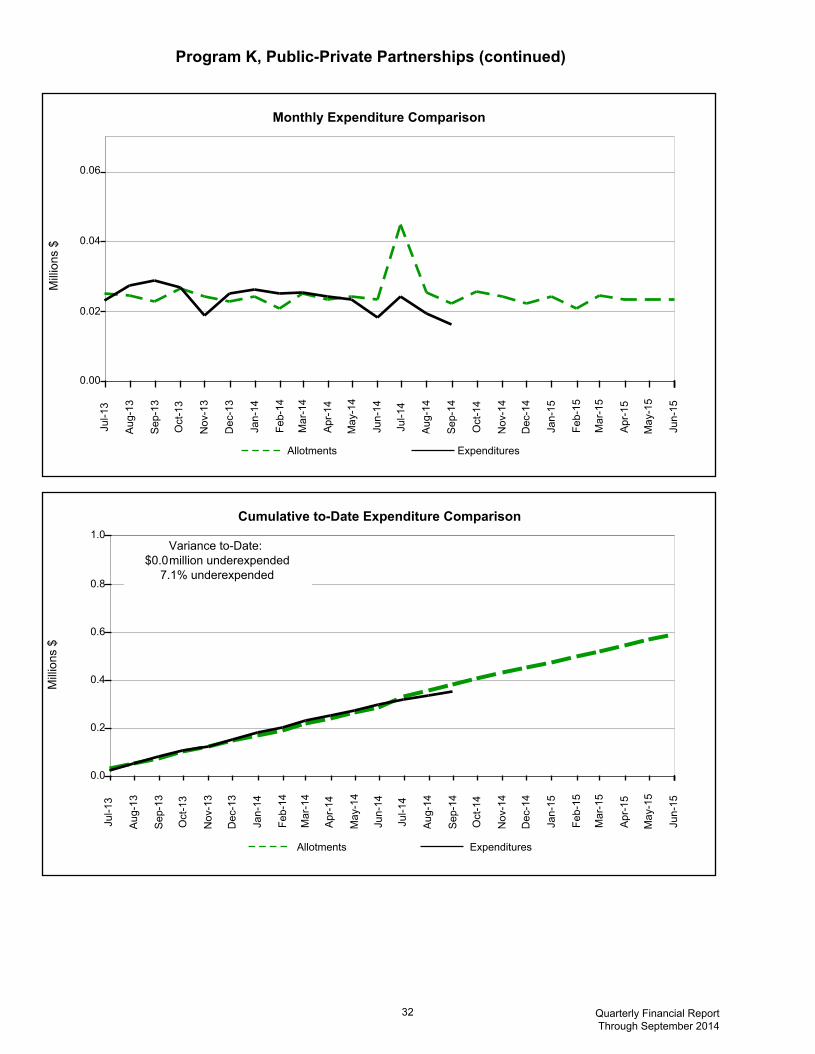
Program K, Public-Private Partnerships
Quarter Quarter Biennium to-Date Percent Biennium ExpenditureAllotments Expenditures Allotments Expenditures Variance Variance Plan Authority
Expenditure StatusPublic-Private Partnerships 92,000 59,324 376,700 350,124 26,576 7.1% 588,000 589,000Total Expenditures 92,000 59,324 376,700 350,124 26,576 7.1% 588,000 589,000
Sources of Funds Motor Vehicle-State 92,000 59,324 376,700 350,124 26,576 7.1% 588,000 589,000Total Funds 92,000 59,324 376,700 350,124 26,576 7.1% 588,000 589,000
FTE Status 2.0 1.7 2.0 2.0 0.0 0.6% 2.0 Biennial Plan versus Expenditure Authority: The 2014 supplemental transportation budget funded the health benefit rate at $703 in fiscal year 2015, which is higher than the final, enacted rate in the state operating budget of $662. The difference between the higher, funded amount and the enacted rate has been placed in reserve for operating programs and is expected to be removed in the 2015 supplemental budget. For Program K, the amount in reserve for health benefits is $1,000.
31 Quarterly Financial Report Through September 2014
Program K, PublicPrivate Partnerships (continued)
Jun-
15
May
-15
Apr
-15
Mar
-15
Feb-
15
Jan-
15
Dec
-14
Nov
-14
Oct
-14
Sep
-14
Aug
-14
Jul-1
4
Jun-
14
May
-14
Apr
-14
Mar
-14
Feb-
14
Jan-
14
Dec
-13
Nov
-13
Oct
-13
Sep
-13
Aug
-13
Jul-1
3
0.06
0.04
0.02
0.00
Allotments Expenditures
Monthly Expenditure Comparison
Millions $
Jun-
15
May
-15
Apr
-15
Mar
-15
Feb-
15
Jan-
15
Dec
-14
Nov
-14
Oct
-14
Sep
-14
Aug
-14
Jul-1
4
Jun-
14
May
-14
Apr
-14
Mar
-14
Feb-
14
Jan-
14
Dec
-13
Nov
-13
Oct
-13
Sep
-13
Aug
-13
Jul-1
3
1.0
0.8
0.6
0.4
0.2
0.0
Allotments Expenditures
Cumulative toDate Expenditure Comparison
Millions $
Variance toDate:$0.0million underexpended 7.1% underexpended
32 Quarterly Financial Report Through September 2014

Program M, Highway Maintenance and Operations
Quarter Quarter Biennium to-Date Percent Biennium ExpenditureAllotments Expenditures Allotments Expenditures Variance Variance Plan Authority
Expenditure StatusMaintenance Management and Support 3,035,000 2,983,426 15,180,000 15,006,478 173,522 1.1% 24,289,000 24,289,000Maintenance-On State System 47,785,283 41,073,164 229,298,730 225,738,205 3,560,525 1.6% 374,799,350 379,591,190Maintenance-Sales and Serv ices to Others 352,000 329,003 1,761,000 1,771,630 (10,630) (0.6)% 2,818,000 2,818,000Inventory and Stores Administration 607,680 712,613 3,088,060 2,944,447 143,613 4.7% 4,886,650 4,902,810Undistributed Costs-Inventory Suspense (9,000) 230,974 70,000 230,974 (160,974) (230.0)% 0 0Total Expenditures 51,770,963 45,329,179 249,397,790 245,691,733 3,706,057 1.5% 406,793,000 411,601,000
Sources of Funds (Accounts)Highway Safety-State 2,500,000 235,400 7,500,000 7,981,500 (481,500) (6.4)% 10,000,000 10,000,000Motor Vehicle-State 47,628,963 44,298,914 238,755,790 234,168,517 4,587,274 1.9% 390,550,000 391,358,000Motor Vehicle-Federal 1,150,000 331,060 1,150,000 1,482,307 (332,307) (28.9)% 3,000,000 7,000,000Misc. Trans. Program-Nonappropriated Funds 492,000 463,804 1,992,000 2,059,410 (67,410) (3.4)% 3,243,000 3,243,000Total Funds 51,770,963 45,329,179 249,397,790 245,691,733 3,706,057 1.5% 406,793,000 411,601,000
FTE Status 1,455.5 1,400.0 1,567.2 1,486.1 81.1 5.2% 1,578.5
Biennial Plan versus Expenditure Authority: The Biennial Plan is $4,808,000 less than the Expenditure Authority for two reasons. First, $4 million of federal funds are in un-allotted status for potential disaster spending; and, second, the transportation budget funded health benefit rates at $703 in fiscal year 2015, which is higher than the final, enacted rate in the state operating budget of $662. The difference between the higher, funded amount and the enacted rates has been placed in reserve for operating programs and is expected to be removed in the 2015 Supplemental Budget. For Program M, the amount in reserve for health benefits is $808,000. VARIANCE EXPLANATIONS Expenditure Status Undistributed Costs-Inventory Suspense: This subprogram is used as a clearing account for the collection and redistribution of pit site and sign shop costs. Costs to produce signs and crush aggregate are examples of charges. Upon completion, costs are moved into inventory or charged to a specific job, which removes the expenditures from this subprogram. The expenditures are moved to other subprograms, while the FTEs remain with this subprogram. At the end of the biennium, cumulative allotments and expenditures will each net to zero. Source of Funds Motor Vehicle-Federal: The higher-than-planned federal expenditures are a result of federally reimbursed costs for fire and flood disasters in the North Central Region. An allotment adjustment will be processed in January to eliminate this variance. ALLOTMENT ADJUSTMENTS Allotments were updated for prior expenditures and detail plans from the regions.
33 Quarterly Financial Report Through September 2014

Program M, Highway Maintenance and Operations (continued)
Jun15
May15
Apr15
Mar15
Feb15
Jan15
Dec14
Nov14
Oct14
Sep14
Aug14
Jul14
Jun14
May14
Apr14
Mar14
Feb14
Jan14
Dec13
Nov13
Oct13
Sep13
Aug13
Jul13
25.0
20.0
15.0
10.0
5.0
0.0
Allotments Expenditures
Monthly Expenditure Comparison
Millions $
Jun15
May15
Apr15
Mar15
Feb15
Jan15
Dec14
Nov14
Oct14
Sep14
Aug14
Jul14
Jun14
May14
Apr14
Mar14
Feb14
Jan14
Dec13
Nov13
Oct13
Sep13
Aug13
Jul13
500
400
300
200
100
0
Allotments Expenditures
Cumulative toDate Expenditure Comparison
Millions $
Variance toDate:$3.7million underexpended 1.5% underexpended
34 Quarterly Financial Report Through September 2014

Subprogram M2, Maintenance-On State Systems
Quarter Quarter Biennium to-Date Percent BienniumDetail Plan Expenditures Detail Plan Expenditures Variance Variance Plan
Expenditure StatusRoadway Maintenance and Operations 10,429,308 9,126,733 35,417,274 33,500,889 1,916,385 5.4% 51,458,882Drainage Maintenance and Slope Repair 4,718,673 4,193,325 24,869,829 21,342,675 3,527,154 14.2% 42,405,100Roadside and Landscape Maintenance 4,914,778 4,653,470 22,567,777 23,263,259 (695,482) (3.1)% 36,966,246Bridge and Tunnel Maintenance 3,905,172 3,800,077 18,999,314 19,161,829 (162,515) (.9)% 30,793,747Snow and Ice Control 2,878,433 3,110,174 41,895,745 44,768,672 (2,872,927) (6.9)% 79,423,678Traffic Serv ices 11,146,361 9,527,715 49,960,988 47,142,260 2,818,728 5.6% 75,165,222Rest Area Maintenance 1,500,745 1,534,357 7,823,857 7,956,784 (132,927) (1.7)% 12,484,410Training and Testing 1,919,852 1,973,061 11,789,681 11,378,325 411,356 3.5% 19,881,9213rd Party Damage Repair 2,478,710 2,623,873 13,560,872 14,249,828 (688,956) (5.1)% 21,684,556Disaster Operations 1,239,830 530,379 2,285,391 2,973,683 (688,292) (30.1)% 4,535,588Total Expenditures 45,131,862 41,073,164 229,170,728 225,738,205 3,432,523 1.5% 374,799,350 Note: The detail plan for Subprogram M2 is temporarily different from allotments for M2 by $128,002. VARIANCE EXPLANATIONS Drainage Maintenance and Slope Repair: The under-spending is the result of staff vacancies and delays in drainage maintenance due to other emergent needs. Disaster Operations: The negative variance is primarily the result of several mudslides and slope damage that occurred due to heavy rainfalls.
35 Quarterly Financial Report Through September 2014

Program P, Highway Preservation
Quarter Quarter Biennium to-Date Percent Biennium ExpenditureAllotments Expenditures Allotments Expenditures Variance Variance Plan Authority
Expenditure StatusUndistributed Costs-Payroll, Legal, and P-Card 0 1,510,455 0 1,510,455 (1,510,455) 0.0% 0 0Roadway Preservation 89,414,000 60,304,196 196,031,000 188,248,196 7,782,804 4.0% 260,353,000 314,853,000Structures Preservation 39,096,000 22,408,684 163,414,000 139,674,791 23,739,209 14.5% 280,448,000 280,448,000Other Facilities Preservation 5,090,000 13,582,049 33,727,000 50,131,918 (16,404,918) (48.6)% 74,651,000 74,651,000Program Support Budgeted Preservation 6,554,000 5,376,599 30,924,000 29,296,868 1,627,132 5.3% 48,511,000 48,511,000Undistributed Costs-Mats Lab/GeoMetrix /Printing 0 (968,241) 0 (968,241) 968,241 0.0% 0 0Undistributed Costs-Project Engineer 0 251 0 251 (251) 0.0% 0 0Undistributed Costs-Program Support 0 522 0 522 (522) 0.0% 0 0Sales and Serv ices to Others 1,221,000 1,222,097 5,033,000 5,062,810 (29,810) (0.6)% 7,912,000 7,912,000Total Expenditures 141,375,000 103,436,612 429,129,000 412,957,569 16,171,431 3.8% 671,875,000 726,375,000
Sources of Funds (Accounts)Transportation Partnership-State 3,760,000 1,550,885 20,225,000 16,289,813 3,935,187 19.5% 34,966,000 34,966,000Highway Safety-State 2,381,000 249,991 5,246,000 8,340,924 (3,094,924) (59.0)% 13,500,000 13,500,000Motor Vehicle-State 8,138,000 4,223,207 37,109,000 23,008,253 14,100,747 38.0% 59,796,000 59,796,000Motor Vehicle-Federal 124,635,000 95,994,028 355,485,000 355,526,517 (41,517) (0.0)% 541,104,000 595,604,000Motor Vehicle-Local 791,000 164,536 4,541,000 4,039,783 501,217 11.0% 11,827,000 11,827,000Tacoma Narrows Toll Bridge-State 22,000 0 45,000 0 45,000 100.0% 120,000 120,000Transportation 2003 (Nickel)-State 427,000 31,868 1,445,000 689,469 755,531 52.3% 2,650,000 2,650,000Misc. Trans. Program-Nonappropriated Funds 1,221,000 1,222,097 5,033,000 5,062,810 (29,810) (0.6)% 7,912,000 7,912,000Total Funds 141,375,000 103,436,612 429,129,000 412,957,569 16,171,431 3.8% 671,875,000 726,375,000
FTE Status 926.1 928.4 872.5 854.0 18.5 2.1% 837.9 Biennial Plan versus Expenditure Authority: The 2013-15 Biennial Plan total is $54,500,000 less than the Expenditure Authority total to align the biennial plan with expected federal funding levels. Expenditure Status A combination of favorable bids and various project expenditure delays has resulted in a variance from estimated expenditures. Examples include: Structures Preservation: "SR 16/Tacoma Narrows Bridge - Replace Maintenance Traveler" – The under spending was due to the delay of the project’s advertisement. “US 101/Astoria-Megler Bridge Main Span - Superstructure Painter" – Update to the Oregon Department of Transportation’s schedule resulted in slower than anticipated billings. Other Facilities Preservation: "SR 530 Slide" - The construction cost for this emergency project was not included in the original biennial plan.
36 Quarterly Financial Report Through September 2014

Program P, Highway Preservation (continued) Undistributed Costs Mats Lab/Geo/Printing, Undistributed Costs Project Engineer, and Undistributed Costs Direct Project Support: These subprograms contain cost recovery and suspense accounts that are not allotted and will be zeroed out at the end of the fiscal year. Source of Funds (Account) Transportation Partnership-State: There was less than planned expenditure activity to date on projects, including “SR 9/Pilchuck Creek - Replace Bridge.” Highway Safety Account-State: Expenditures were greater than originally planned due to a more aggressive plan to spend these funds on projects, including “I-5/Chamber Way Bridge - Special Repair.” Motor Vehicle Account-State: Under spending is result of actual and planned expenditures of Motor Vehicle Account-State funds being switched to Highway Safety Account-State funds as part of budget development. Motor Vehicle Account-Local: Expenditures were less than planned due to increased expenditure activity to date on projects, including “SR 21/Keller Ferry Boat - Replace Boat.” Tacoma Narrows Toll Bridge-State: Expenditures were less than planned due to less expenditure activity to date on the Tacoma Narrows Bridge. Transportation 2003 (Nickel)-State: Expenditures were less than planned due to less expenditure activity to date on projects, including “I-5/NE 117th St to SR 104 - Pavement Repair.”
37 Quarterly Financial Report Through September 2014

Program P, Highway Preservation (continued)
Jun15
May15
Apr15
Mar15
Feb15
Jan15
Dec14
Nov14
Oct14
Sep14
Aug14
Jul14
Jun14
May14
Apr14
Mar14
Feb14
Jan14
Dec13
Nov13
Oct13
Sep13
Aug13
Jul13
100.0
75.0
50.0
25.0
0.0
(25.0)
Allotments Expenditures
Monthly Expenditure Comparison
Millions $
Jun15
May15
Apr15
Mar15
Feb15
Jan15
Dec14
Nov14
Oct14
Sep14
Aug14
Jul14
Jun14
May14
Apr14
Mar14
Feb14
Jan14
Dec13
Nov13
Oct13
Sep13
Aug13
Jul13
750
500
250
0
Allotments Expenditures
Cumulative toDate Expenditure Comparison
Millions $
Variance toDate:$16.2million underexpended 3.8% underexpended
38 Quarterly Financial Report Through September 2014

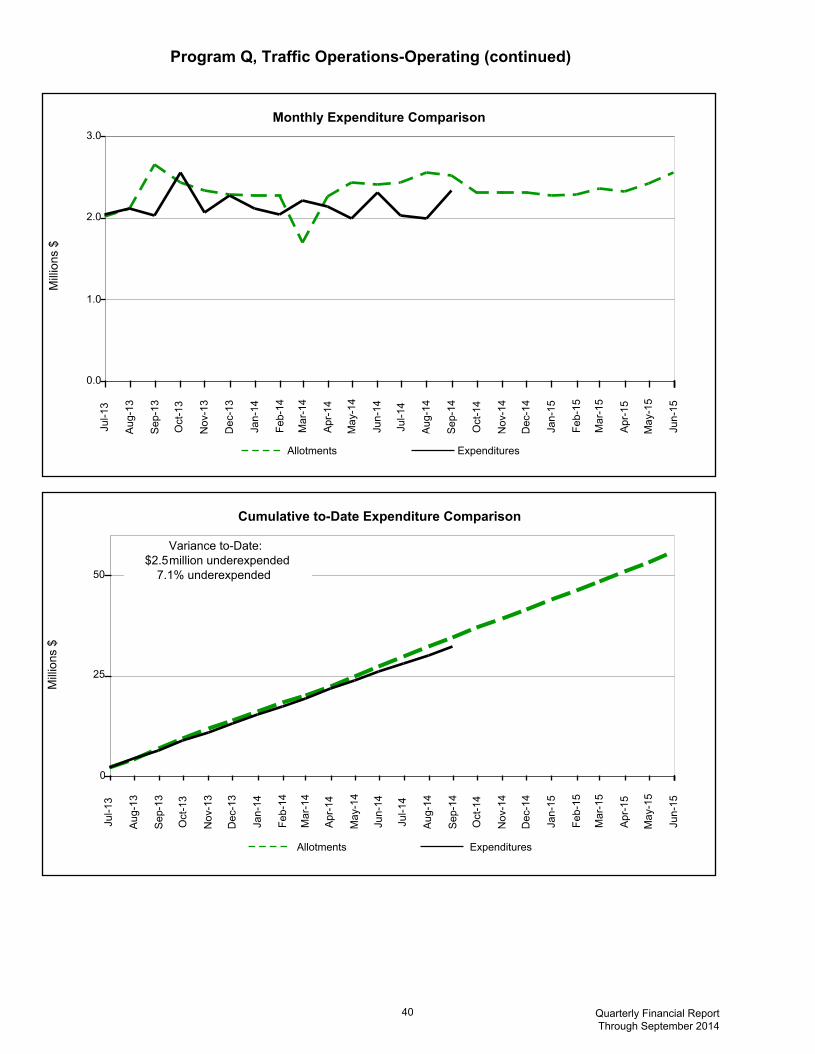
Program Q, Traffic Operations-Operating
Quarter Quarter Biennium to-Date Percent Biennium ExpenditureAllotments Expenditures Allotments Expenditures Variance Variance Plan Authority
Expenditure StatusTraffic Management and Support 375,120 309,800 1,862,600 1,686,888 175,712 9.4% 2,998,000 2,998,000Traffic Serv ices 7,119,050 6,029,461 32,790,050 30,514,628 2,275,422 6.9% 52,783,400 52,898,400Total Expenditures 7,494,170 6,339,261 34,652,650 32,201,516 2,451,134 7.1% 55,781,400 55,896,400
Sources of Funds (Accounts)Motor Vehicle-State 6,493,170 5,891,118 31,378,250 29,531,835 1,846,415 5.9% 49,940,000 50,055,000Motor Vehicle-Federal 410,000 118,262 825,000 469,122 355,878 43.1% 2,050,000 2,050,000Motor Vehicle-Local 201,000 5,912 459,400 428,928 30,472 6.6% 591,400 591,400Misc. Trans. Program-Nonappropriated Funds 390,000 323,969 1,990,000 1,771,631 218,369 11.0% 3,200,000 3,200,000Total Funds 7,494,170 6,339,261 34,652,650 32,201,516 2,451,134 7.1% 55,781,400 55,896,400
FTE Status 250.4 241.4 250.9 242.2 8.7 3.5% 250.7 Biennial Plan versus Expenditure Authority: The Biennial Plan is $115,000 less than the Expenditure Authority because the 2014 Supplemental Transportation funded health benefit rates at $703 in fiscal year 2015, which is higher than the final, enacted rate in the state operating budget of $662. The difference between the higher, funded amount and the enacted rates has been placed in reserve for operating programs and is expected to be removed in the 2015 Supplemental Budget. VARIANCE EXPLANATIONS Source of Funds (Accounts) Motor Vehicle Account-Federal: Spending on federal grants is lower than expected. Work on the Spokane Regional Traffic Management Center was delayed. The contractor was recently selected and spending will commence in January 2015 and should conclude by June 2015. Grants for Commercial Vehicle Information Systems and Networks are being completed at a lower cost than originally estimated; funds are being de-obligated and the spending plan will be adjusted. Misc. Trans. Program-Non-appropriated Funds: Expenditures are less than allotments because of the backlog of replacing wood motorist information signs with steel signs. The regions will be spending approximately $250,000 through the end of the biennium to complete these projects.
39 Quarterly Financial Report Through September 2014
Program Q, Traffic OperationsOperating (continued)
Jun15
May15
Apr15
Mar15
Feb15
Jan15
Dec14
Nov14
Oct14
Sep14
Aug14
Jul14
Jun14
May14
Apr14
Mar14
Feb14
Jan14
Dec13
Nov13
Oct13
Sep13
Aug13
Jul13
3.0
2.0
1.0
0.0
Allotments Expenditures
Monthly Expenditure Comparison
Millions $
Jun15
May15
Apr15
Mar15
Feb15
Jan15
Dec14
Nov14
Oct14
Sep14
Aug14
Jul14
Jun14
May14
Apr14
Mar14
Feb14
Jan14
Dec13
Nov13
Oct13
Sep13
Aug13
Jul13
50
25
0
Allotments Expenditures
Cumulative toDate Expenditure Comparison
Millions $
Variance toDate:$2.5million underexpended 7.1% underexpended
40 Quarterly Financial Report Through September 2014
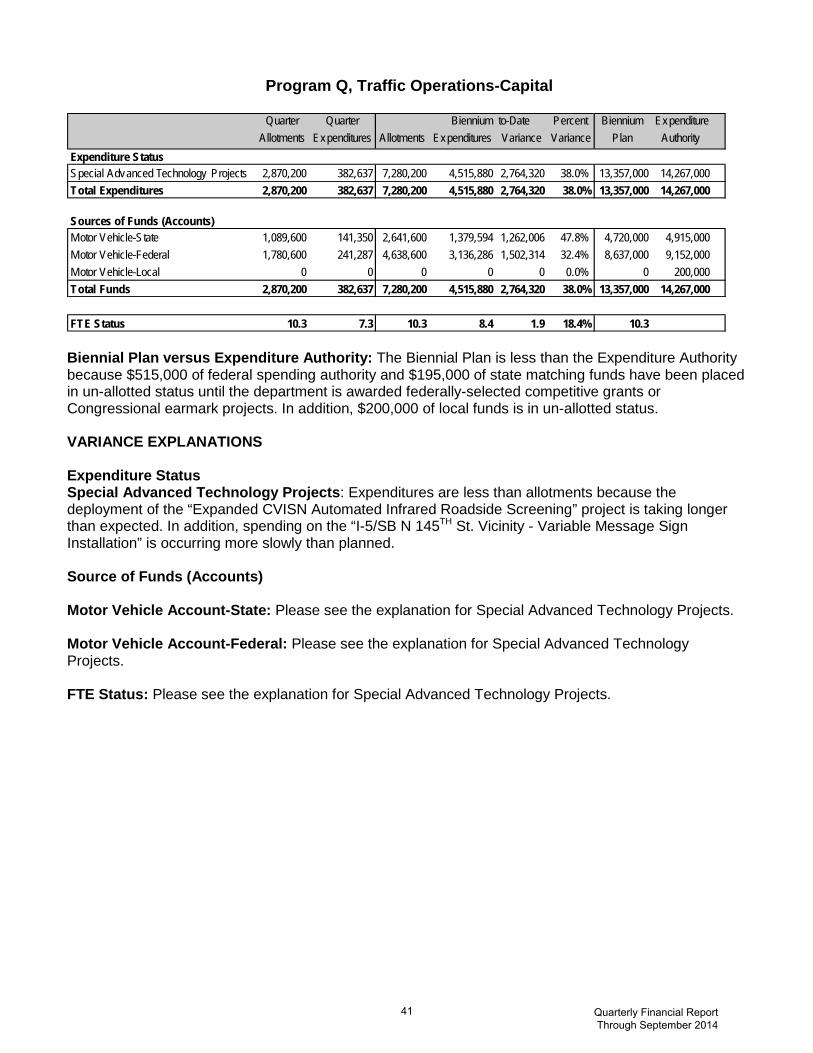
Program Q, Traffic Operations-Capital
Quarter Quarter Biennium to-Date Percent Biennium ExpenditureAllotments Expenditures Allotments Expenditures Variance Variance Plan Authority
Expenditure StatusSpecial Advanced Technology Projects 2,870,200 382,637 7,280,200 4,515,880 2,764,320 38.0% 13,357,000 14,267,000Total Expenditures 2,870,200 382,637 7,280,200 4,515,880 2,764,320 38.0% 13,357,000 14,267,000
Sources of Funds (Accounts)Motor Vehicle-State 1,089,600 141,350 2,641,600 1,379,594 1,262,006 47.8% 4,720,000 4,915,000Motor Vehicle-Federal 1,780,600 241,287 4,638,600 3,136,286 1,502,314 32.4% 8,637,000 9,152,000Motor Vehicle-Local 0 0 0 0 0 0.0% 0 200,000Total Funds 2,870,200 382,637 7,280,200 4,515,880 2,764,320 38.0% 13,357,000 14,267,000
FTE Status 10.3 7.3 10.3 8.4 1.9 18.4% 10.3 Biennial Plan versus Expenditure Authority: The Biennial Plan is less than the Expenditure Authority because $515,000 of federal spending authority and $195,000 of state matching funds have been placed in un-allotted status until the department is awarded federally-selected competitive grants or Congressional earmark projects. In addition, $200,000 of local funds is in un-allotted status. VARIANCE EXPLANATIONS Expenditure Status Special Advanced Technology Projects: Expenditures are less than allotments because the deployment of the “Expanded CVISN Automated Infrared Roadside Screening” project is taking longer than expected. In addition, spending on the “I-5/SB N 145TH St. Vicinity - Variable Message Sign Installation” is occurring more slowly than planned. Source of Funds (Accounts) Motor Vehicle Account-State: Please see the explanation for Special Advanced Technology Projects. Motor Vehicle Account-Federal: Please see the explanation for Special Advanced Technology Projects. FTE Status: Please see the explanation for Special Advanced Technology Projects.
41 Quarterly Financial Report Through September 2014

Program Q, Traffic OperationsCapital (continued)
Jun15
May15
Apr15
Mar15
Feb15
Jan15
Dec14
Nov14
Oct14
Sep14
Aug14
Jul14
Jun14
May14
Apr14
Mar14
Feb14
Jan14
Dec13
Nov13
Oct13
Sep13
Aug13
Jul13
2.0
1.5
1.0
0.5
0.0
Allotments Expenditures
Monthly Expenditure Comparison
Millions $
Jun15
May15
Apr15
Mar15
Feb15
Jan15
Dec14
Nov14
Oct14
Sep14
Aug14
Jul14
Jun14
May14
Apr14
Mar14
Feb14
Jan14
Dec13
Nov13
Oct13
Sep13
Aug13
Jul13
15
10
5
0
Allotments Expenditures
Cumulative toDate Expenditure Comparison
Millions $
Variance toDate:$2.8million underexpended
38.0% underexpended
42 Quarterly Financial Report Through September 2014

Program S, Transportation Management and Support
Quarter Quarter Biennium to-Date Percent Biennium ExpenditureAllotments Expenditures Allotments Expenditures Variance Variance Plan Authority
Expenditure StatusExecutive Management and Support 2,243,500 2,182,150 11,226,400 10,856,297 370,103 3.3% 18,419,800 18,466,800Finance and Administration 1,252,700 1,194,506 6,482,900 6,059,199 423,701 6.5% 10,351,800 10,390,800Total Expenditures 3,496,200 3,376,656 17,709,300 16,915,497 793,803 4.5% 28,771,600 28,857,600
Sources of Funds (Accounts)Motor Vehicle-State 3,327,100 3,136,886 16,719,200 15,822,423 896,777 5.4% 26,993,000 27,079,000Motor Vehicle-Federal 3,700 74,362 175,300 279,264 (103,964) (59.3)% 436,600 436,600Multimodal Transportation-State 143,500 143,500 704,500 704,500 0 0.0% 1,131,000 1,131,000Transportation Equip. Fund-Nonappropriated Funds 21,900 21,900 109,300 109,300 0 0.0% 175,000 175,000Misc. Trans. Program-Nonappropriated Funds 0 9 1,000 9 991 99.1% 36,000 36,000Total Funds 3,496,200 3,376,656 17,709,300 16,915,497 793,803 4.5% 28,771,600 28,857,600
FTE Status 192.6 185.6 183.8 186.4 (2.6) (1.4)% 187.1
Biennial Plan versus Expenditure Authority: The 2014 supplemental transportation budget funded the state employee health benefit rate at $703 per month in fiscal year 2015, which is higher than the final, enacted rate in the state operating budget of $662. The difference between the higher, funded amount and the enacted rates has been placed in reserve for operating programs and is expected to be removed in the 2015 supplemental budget. For Program S, the amount in reserve for health benefits is $86,000. VARIANCE EXPLANATIONS Source of Funds (Accounts) Motor Vehicle Account-Federal: The variance is due to requests for federal assistance for On the Job Training Support Services occurring earlier than planned. Miscellaneous Transportation Programs-Nonappropriated Funds: Expenditures for the State Tribal Transportation Conference are occurring later than planned. ALLOTMENT ADJUSTMENT Allotments were adjusted to reflect an updated spending plan that moves funding between subprograms, corrects object of expenditure, and shifts funding to later in the biennium.
43 Quarterly Financial Report Through September 2014
ConnelB
Line
ConnelB
Line

Program S, Transportation Management and Support (continued)
Jun15
May15
Apr15
Mar15
Feb15
Jan15
Dec14
Nov14
Oct14
Sep14
Aug14
Jul14
Jun14
May14
Apr14
Mar14
Feb14
Jan14
Dec13
Nov13
Oct13
Sep13
Aug13
Jul13
1.5
1.0
0.5
0.0
Allotments Expenditures
Monthly Expenditure Comparison
Millions $
Jun15
May15
Apr15
Mar15
Feb15
Jan15
Dec14
Nov14
Oct14
Sep14
Aug14
Jul14
Jun14
May14
Apr14
Mar14
Feb14
Jan14
Dec13
Nov13
Oct13
Sep13
Aug13
Jul13
30
20
10
0
Allotments Expenditures
Cumulative toDate Expenditure Comparison
Millions $
Variance toDate:$0.8million underexpended 4.5% underexpended
44 Quarterly Financial Report Through September 2014

Program T, Transportation Planning, Data, and Research
Quarter Quarter Biennium to-Date Percent Biennium ExpenditureAllotments Expenditures Allotments Expenditures Variance Variance Plan Authority
Expenditure StatusPlanning 4,535,489 3,932,903 22,176,754 20,807,765 1,368,989 6.2% 35,458,917 35,794,717Research and Library Serv ices 562,963 632,545 4,844,700 4,123,082 721,618 14.9% 8,804,348 9,511,548Pass Through Funds 3,076,507 1,265,139 12,640,492 14,031,780 (1,391,288) (11.0)% 21,853,000 21,853,000Total Expenditures 8,174,959 5,830,586 39,661,946 38,962,627 699,319 1.8% 66,116,265 67,159,265
Sources of Funds (Accounts)Motor Vehicle-State 2,369,837 1,975,821 12,275,239 11,547,273 727,966 5.9% 19,725,000 19,818,000Motor Vehicle-Federal 2,807,015 2,501,840 14,981,150 13,369,214 1,611,936 10.8% 25,376,000 26,226,000Multimodal Transportation-State 84,000 62,329 438,200 402,970 35,230 8.0% 662,000 662,000Multimodal Transportation-Federal 377,600 254,757 1,886,600 1,756,174 130,426 6.9% 2,809,000 2,809,000Multimodal Transportation-Local 0 0 0 0 0 0.0% 0 100,000Misc. Trans. Program-Nonappropriated Funds 2,536,507 1,035,839 10,080,757 11,886,996 (1,806,239) (17.9)% 17,544,265 17,544,265Total Funds 8,174,959 5,830,586 39,661,946 38,962,627 699,319 1.8% 66,116,265 67,159,265
FTE Status 188.7 167.9 188.2 172.0 16.1 8.6% 187.3 Biennial Plan versus Expenditure Authority: The 2014 supplemental transportation budget funded the state employee health benefit rate at $703 per month in fiscal year 2015, which is higher than the final, enacted rate in the state operating budget of $662. The difference between the higher, funded amount and the enacted rates has been placed in reserve for operating programs and is expected to be removed in the 2015 supplemental budget. For Program T, the amount in reserve for health benefits is $93,000. Additionally, $100,000 of local authority is placed into unallotted status until a project requiring local funding is approved. VARIANCE EXPLANATIONS Expenditure Status Research and Library Services: The plan for the Transportation Pooled Fund Projects is based on historical spending patterns. Due to the nature of performing research activities and the coordination of pooled fund research with other states, the level of research expenditures can fluctuate between months, from what was anticipated. The allocations have been adjusted for the remaining months of the biennium. Pass Through Funds: The local organizations that receive this pass-through funding have multiple funding sources. Spending was ahead of the plan. The quarterly allotments are based on historical averages. Source of Funds (Accounts) Motor Vehicle-Federal: See explanation above for Research and Library Services. Miscellaneous Transportation Program-Nonappropriated Funds: See Pass Through Funds. ALLOTMENT ADJUSTMENTS Allotments were adjusted to reflect an update to the spending plan that moved funding between objects as well as moved federal authority out of unallotted status for a Strategic Highway Research Program 2 Proof of Concept Implementation project.
45 Quarterly Financial Report Through September 2014
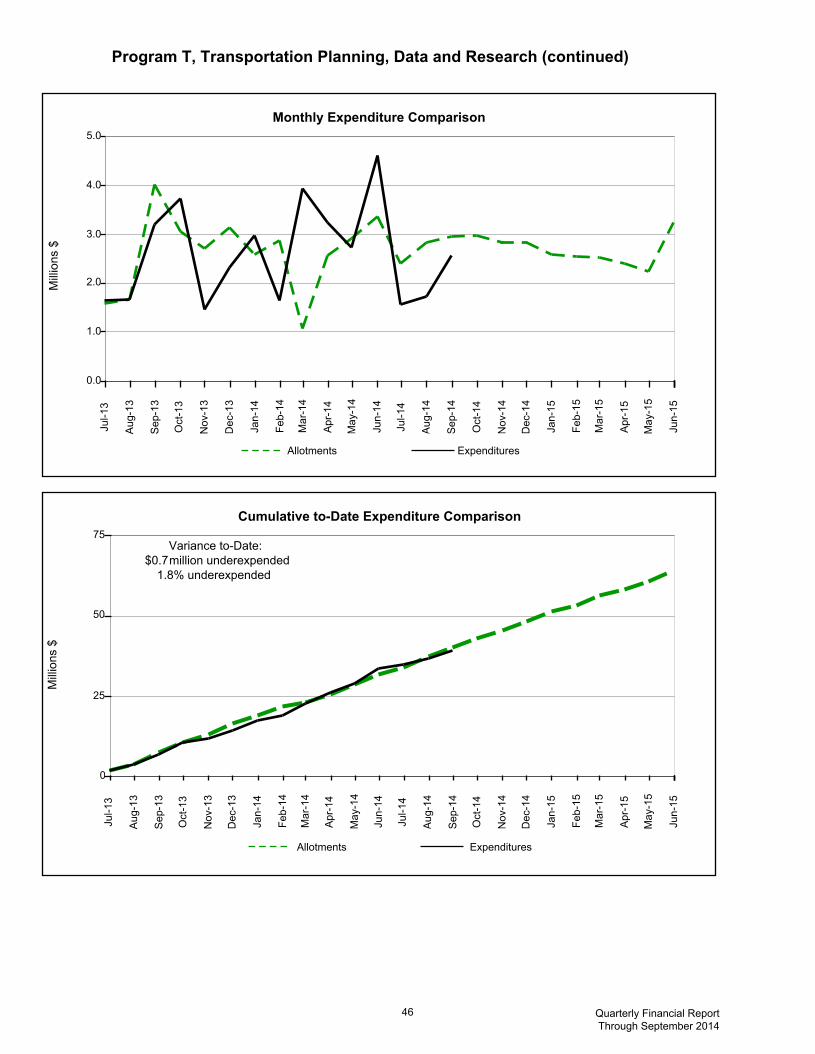
Program T, Transportation Planning, Data and Research (continued)
Jun-
15
May
-15
Apr
-15
Mar
-15
Feb-
15
Jan-
15
Dec
-14
Nov
-14
Oct
-14
Sep
-14
Aug
-14
Jul-1
4
Jun-
14
May
-14
Apr
-14
Mar
-14
Feb-
14
Jan-
14
Dec
-13
Nov
-13
Oct
-13
Sep
-13
Aug
-13
Jul-1
3
5.0
4.0
3.0
2.0
1.0
0.0
Allotments Expenditures
Monthly Expenditure Comparison
Millions $
Jun-
15
May
-15
Apr
-15
Mar
-15
Feb-
15
Jan-
15
Dec
-14
Nov
-14
Oct
-14
Sep
-14
Aug
-14
Jul-1
4
Jun-
14
May
-14
Apr
-14
Mar
-14
Feb-
14
Jan-
14
Dec
-13
Nov
-13
Oct
-13
Sep
-13
Aug
-13
Jul-1
3
75
50
25
0
Allotments Expenditures
Cumulative toDate Expenditure Comparison
Millions $
Variance toDate:$0.7million underexpended 1.8% underexpended
46 Quarterly Financial Report Through September 2014
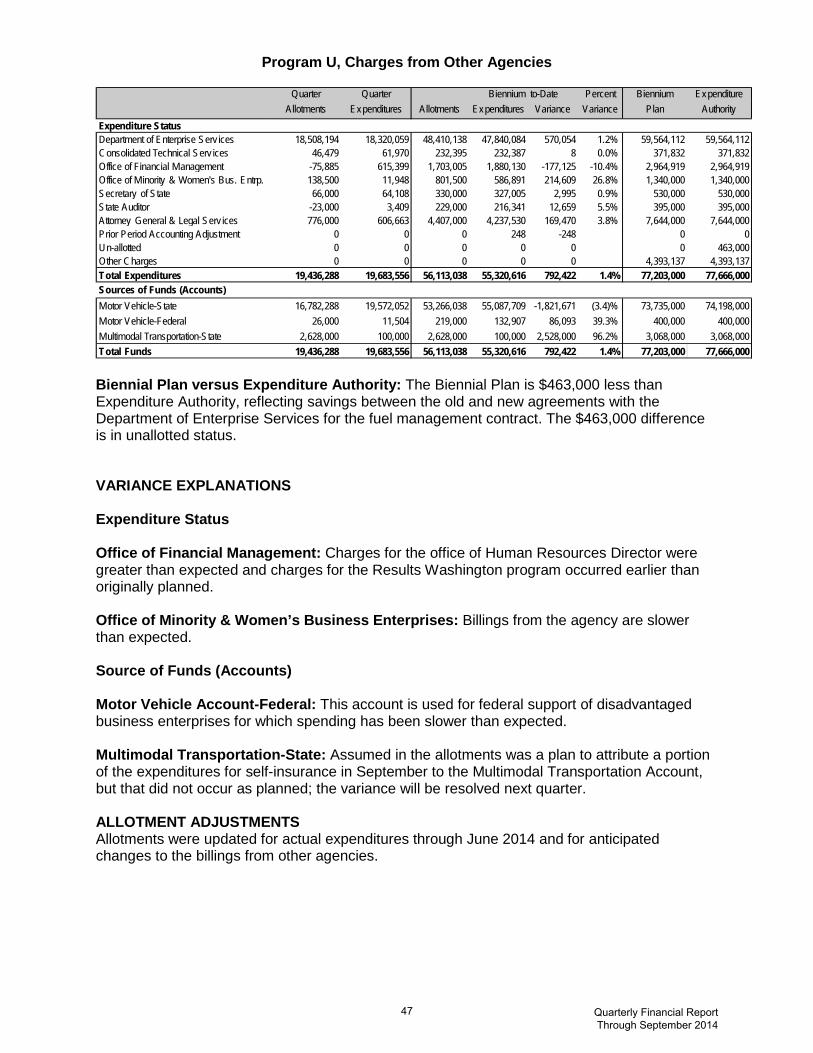
Program U, Charges from Other Agencies
Quarter Quarter Biennium to-Date Percent Biennium ExpenditureAllotments Expenditures Allotments Expenditures Variance Variance Plan Authority
Expenditure StatusDepartment of Enterprise Serv ices 18,508,194 18,320,059 48,410,138 47,840,084 570,054 1.2% 59,564,112 59,564,112Consolidated Technical Serv ices 46,479 61,970 232,395 232,387 8 0.0% 371,832 371,832Office of Financial Management -75,885 615,399 1,703,005 1,880,130 -177,125 -10.4% 2,964,919 2,964,919Office of Minority & Women's Bus. Entrp. 138,500 11,948 801,500 586,891 214,609 26.8% 1,340,000 1,340,000Secretary of State 66,000 64,108 330,000 327,005 2,995 0.9% 530,000 530,000State Auditor -23,000 3,409 229,000 216,341 12,659 5.5% 395,000 395,000Attorney General & Legal Serv ices 776,000 606,663 4,407,000 4,237,530 169,470 3.8% 7,644,000 7,644,000Prior Period Accounting Adjustment 0 0 0 248 -248 0 0Un-allotted 0 0 0 0 0 0 463,000Other Charges 0 0 0 0 0 4,393,137 4,393,137Total Expenditures 19,436,288 19,683,556 56,113,038 55,320,616 792,422 1.4% 77,203,000 77,666,000Sources of Funds (Accounts)Motor Vehicle-State 16,782,288 19,572,052 53,266,038 55,087,709 -1,821,671 (3.4)% 73,735,000 74,198,000Motor Vehicle-Federal 26,000 11,504 219,000 132,907 86,093 39.3% 400,000 400,000Multimodal Transportation-State 2,628,000 100,000 2,628,000 100,000 2,528,000 96.2% 3,068,000 3,068,000Total Funds 19,436,288 19,683,556 56,113,038 55,320,616 792,422 1.4% 77,203,000 77,666,000 Biennial Plan versus Expenditure Authority: The Biennial Plan is $463,000 less than Expenditure Authority, reflecting savings between the old and new agreements with the Department of Enterprise Services for the fuel management contract. The $463,000 difference is in unallotted status. VARIANCE EXPLANATIONS Expenditure Status Office of Financial Management: Charges for the office of Human Resources Director were greater than expected and charges for the Results Washington program occurred earlier than originally planned. Office of Minority & Women’s Business Enterprises: Billings from the agency are slower than expected. Source of Funds (Accounts) Motor Vehicle Account-Federal: This account is used for federal support of disadvantaged business enterprises for which spending has been slower than expected. Multimodal Transportation-State: Assumed in the allotments was a plan to attribute a portion of the expenditures for self-insurance in September to the Multimodal Transportation Account, but that did not occur as planned; the variance will be resolved next quarter. ALLOTMENT ADJUSTMENTS Allotments were updated for actual expenditures through June 2014 and for anticipated changes to the billings from other agencies.
47 Quarterly Financial Report Through September 2014

Program U, Charges From Other Agencies (continued)
Jun15
May15
Apr15
Mar15
Feb15
Jan15
Dec14
Nov14
Oct14
Sep14
Aug14
Jul14
Jun14
May14
Apr14
Mar14
Feb14
Jan14
Dec13
Nov13
Oct13
Sep13
Aug13
Jul13
20.0
10.0
0.0
Allotments Expenditures
Monthly Expenditure Comparison
Millions $
Jun15
May15
Apr15
Mar15
Feb15
Jan15
Dec14
Nov14
Oct14
Sep14
Aug14
Jul14
Jun14
May14
Apr14
Mar14
Feb14
Jan14
Dec13
Nov13
Oct13
Sep13
Aug13
Jul13
100
75
50
25
0
Allotments Expenditures
Cumulative toDate Expenditure Comparison
Millions $
Variance toDate:$0.8million underexpended 1.4% underexpended
48 Quarterly Financial Report Through September 2014
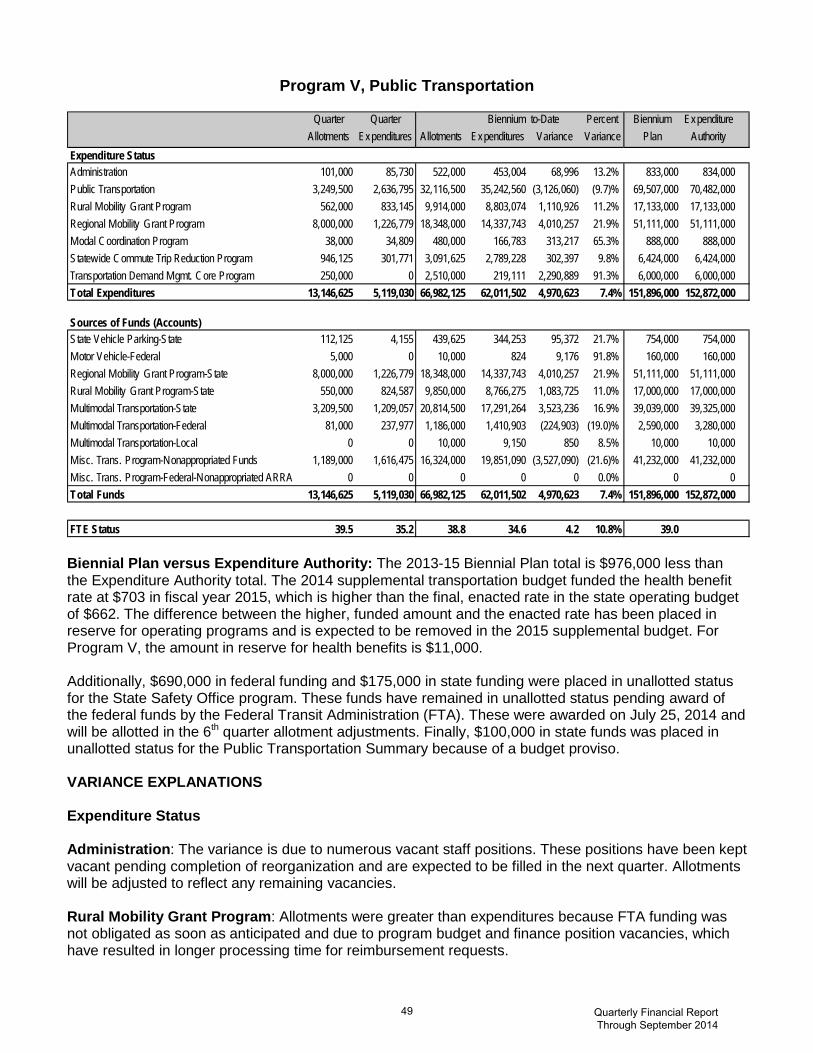
Program V, Public Transportation
Quarter Quarter Biennium to-Date Percent Biennium ExpenditureAllotments Expenditures Allotments Expenditures Variance Variance Plan Authority
Expenditure StatusAdministration 101,000 85,730 522,000 453,004 68,996 13.2% 833,000 834,000Public Transportation 3,249,500 2,636,795 32,116,500 35,242,560 (3,126,060) (9.7)% 69,507,000 70,482,000Rural Mobility Grant Program 562,000 833,145 9,914,000 8,803,074 1,110,926 11.2% 17,133,000 17,133,000Regional Mobility Grant Program 8,000,000 1,226,779 18,348,000 14,337,743 4,010,257 21.9% 51,111,000 51,111,000Modal Coordination Program 38,000 34,809 480,000 166,783 313,217 65.3% 888,000 888,000Statewide Commute Trip Reduction Program 946,125 301,771 3,091,625 2,789,228 302,397 9.8% 6,424,000 6,424,000Transportation Demand Mgmt. Core Program 250,000 0 2,510,000 219,111 2,290,889 91.3% 6,000,000 6,000,000Total Expenditures 13,146,625 5,119,030 66,982,125 62,011,502 4,970,623 7.4% 151,896,000 152,872,000
Sources of Funds (Accounts)State Vehicle Parking-State 112,125 4,155 439,625 344,253 95,372 21.7% 754,000 754,000Motor Vehicle-Federal 5,000 0 10,000 824 9,176 91.8% 160,000 160,000Regional Mobility Grant Program-State 8,000,000 1,226,779 18,348,000 14,337,743 4,010,257 21.9% 51,111,000 51,111,000Rural Mobility Grant Program-State 550,000 824,587 9,850,000 8,766,275 1,083,725 11.0% 17,000,000 17,000,000Multimodal Transportation-State 3,209,500 1,209,057 20,814,500 17,291,264 3,523,236 16.9% 39,039,000 39,325,000Multimodal Transportation-Federal 81,000 237,977 1,186,000 1,410,903 (224,903) (19.0)% 2,590,000 3,280,000Multimodal Transportation-Local 0 0 10,000 9,150 850 8.5% 10,000 10,000Misc. Trans. Program-Nonappropriated Funds 1,189,000 1,616,475 16,324,000 19,851,090 (3,527,090) (21.6)% 41,232,000 41,232,000Misc. Trans. Program-Federal-Nonappropriated ARRA 0 0 0 0 0 0.0% 0 0Total Funds 13,146,625 5,119,030 66,982,125 62,011,502 4,970,623 7.4% 151,896,000 152,872,000
FTE Status 39.5 35.2 38.8 34.6 4.2 10.8% 39.0 Biennial Plan versus Expenditure Authority: The 2013-15 Biennial Plan total is $976,000 less than the Expenditure Authority total. The 2014 supplemental transportation budget funded the health benefit rate at $703 in fiscal year 2015, which is higher than the final, enacted rate in the state operating budget of $662. The difference between the higher, funded amount and the enacted rate has been placed in reserve for operating programs and is expected to be removed in the 2015 supplemental budget. For Program V, the amount in reserve for health benefits is $11,000. Additionally, $690,000 in federal funding and $175,000 in state funding were placed in unallotted status for the State Safety Office program. These funds have remained in unallotted status pending award of the federal funds by the Federal Transit Administration (FTA). These were awarded on July 25, 2014 and will be allotted in the 6th quarter allotment adjustments. Finally, $100,000 in state funds was placed in unallotted status for the Public Transportation Summary because of a budget proviso. VARIANCE EXPLANATIONS Expenditure Status Administration: The variance is due to numerous vacant staff positions. These positions have been kept vacant pending completion of reorganization and are expected to be filled in the next quarter. Allotments will be adjusted to reflect any remaining vacancies. Rural Mobility Grant Program: Allotments were greater than expenditures because FTA funding was not obligated as soon as anticipated and due to program budget and finance position vacancies, which have resulted in longer processing time for reimbursement requests.
49 Quarterly Financial Report Through September 2014

Regional Mobility Grant Program: The variance is due to numerous reimbursement requests being submitted late during the fifth quarter. Late reimbursement requests, in excess of $3.3 million, have now been received and are being processed or are expected to be submitted for payment soon. Modal Coordination Program: This variance is due to an allotment plan, which included more funding than necessary for grant agreements. Allotments will be adjusted to reflect this. Transportation Demand Management Core Program: Expenditures were lower than allotments because grantees ordered vans later than planned, which will result in later than planned deliveries and billings to the department. Source of Funds (Accounts) State Vehicle Parking-State: The variance is primarily due to reimbursement requests for Commute Trip Reduction (CTR) grants to cities and municipalities being submitted later than planned and due to program budget and finance position vacancies, which have resulted in longer processing time for reimbursement requests. These vacancies are expected to be filled in the next quarter and this variance is expected to correct itself in coming quarters. The remaining variance is due to CTR staff vacancies. Motor Vehicle-Federal: The I-90/SR 18 park and ride study has been completed but has not yet been billed for by an out-of-state vendor. Regional Mobility Grant Program-State: See explanation for the Regional Mobility Grant Program. Rural Mobility Grant Program-State: See explanation for the Rural Mobility Grant Program. Multimodal Transportation-State: See explanation for the Transportation Demand Management Core Program. Additional variance was caused by special needs grant program grantees submitting reimbursement requests later than planned. Multimodal Transportation-Federal: The variance is due to more staff charging time for federal planning work than allotted. Allotments will be adjusted to reflect actual charges. Miscellaneous Transportation Programs-Nonappropriated Funds: This variance is primarily due to one-time capital grant recipients submitting reimbursement requests for pass-through grants ahead of schedule. FTE Status: The variance is due to numerous staff vacancies, which have been held vacant pending the completion of a reorganization review. These vacancies are expected to be filled in the next quarter.
50 Quarterly Financial Report Through September 2014

Program V, Public Transportation (continued)
Jun15
May15
Apr15
Mar15
Feb15
Jan15
Dec14
Nov14
Oct14
Sep14
Aug14
Jul14
Jun14
May14
Apr14
Mar14
Feb14
Jan14
Dec13
Nov13
Oct13
Sep13
Aug13
Jul13
40.0
30.0
20.0
10.0
0.0
Allotments Expenditures
Monthly Expenditure Comparison
Millions $
Jun15
May15
Apr15
Mar15
Feb15
Jan15
Dec14
Nov14
Oct14
Sep14
Aug14
Jul14
Jun14
May14
Apr14
Mar14
Feb14
Jan14
Dec13
Nov13
Oct13
Sep13
Aug13
Jul13
200
150
100
50
0
Allotments Expenditures
Cumulative toDate Expenditure Comparison
Millions $
Variance toDate:$5.0million underexpended 7.4% underexpended
51 Quarterly Financial Report Through September 2014

Program W, Ferries Construction
Quarter Quarter Biennium to-Date Percent Biennium ExpenditureAllotments Expenditures Allotments Expenditures Variance Variance Plan Authority
Expenditure StatusTerminal Construction 8,638,000 3,359,798 27,630,000 23,898,771 3,731,229 13.5% 84,473,000 84,473,000Vessel Construction 22,737,000 14,097,366 142,146,000 127,445,442 14,700,558 10.3% 289,925,000 289,925,000Emergency Repairs 1,615,000 433,307 2,038,000 1,475,063 562,937 27.6% 4,935,000 4,935,000Total Expenditures 32,990,000 17,890,471 171,814,000 152,819,277 18,994,723 11.1% 379,333,000 379,333,000
Sources of Funds (Accounts)Puget Sound Capital Construction-State 7,850,000 5,103,625 28,758,000 25,448,552 3,309,449 11.5% 63,825,000 63,825,000Puget Sound Capital Construction-Federal 12,046,000 5,680,402 44,801,000 34,956,730 9,844,270 22.0% 118,444,000 118,444,000Puget Sound Capital Construction-Local 241,000 3,428 283,000 53,759 229,241 81.0% 1,312,000 1,312,000Transportation Partnership-State 87,000 25,000 174,000 28,815 145,185 83.4% 2,813,000 2,813,000Multimodal Transportation-State 1,527,000 1,079 1,543,000 1,518,657 24,343 1.6% 2,588,000 2,588,000Transportation 2003 (Nickel)-State 11,179,000 7,076,936 95,996,000 90,802,870 5,193,130 5.4% 190,031,000 190,031,000Misc. Trans. Program-Nonappropriated Funds 60,000 0 259,000 9,894 249,106 96.2% 320,000 320,000Total Funds 32,990,000 17,890,471 171,814,000 152,819,277 18,994,723 11.1% 379,333,000 379,333,000
FTE Status 128.7 111.7 129.2 117.5 11.8 9.1% 128.0 VARIANCE EXPLANATIONS Expenditure Status Terminal Construction: The “Mukilteo Terminal Preservation/Relocation” project is underspending due the extended time needed to complete Section 106 (archeological and historical) documentation and tribal usual and accustomed hunting and fishing ground negotiations necessary to obtain a record of decision for the National Environmental Policy Act process. This caused a delay in the ramp-up of spending on the project. The “Bremerton Terminal Slip 2-Timber Wingwall Replacement” project is underspending because work on the project was temporarily delayed to accommodate procurement of “Buy America” materials, and fabrication of the wingwall offsite. Spending will increase when the contractor installs the wingwall at the terminal. Vessel Construction: The “MV Cathlamet Preservation,” “#2 – 144-Auto Ferry,” “MV Kitsap Preservation,” and “MV Klahowya Preservation” projects account for much of the biennium-to-date variance. The MV Cathlamet was not able to go into the shipyard in September for scheduled dockside preservation work due to emergencies on other vessels. This dockside work has been canceled for the biennium. In addition, the “#2 – 144-Auto Ferry” and the “MV Kitsap Preservation” projects are spending at a slower rate than anticipated in the allotment plan due the timing of billings. Finally, the MV Klahowya shipyard visit during the fourth quarter was reduced in scope of work and cost. The savings on this project will be used to support dry-docking for a United States Coast Guard-required inspection and preservation work on the MV Tacoma at Vigor Shipyard; this work is scheduled to begin in the middle of March 2015 and is expected to extend through the rest of the biennium. Emergency Repairs: Through September, the Office of Financial Management has approved $4,904,079 out of a total biennial appropriation of $4,935,000 for emergency repairs. Because these are unprogrammed projects, it is difficult predict the scheduling of work and expenditures.
52 Quarterly Financial Report Through September 2014
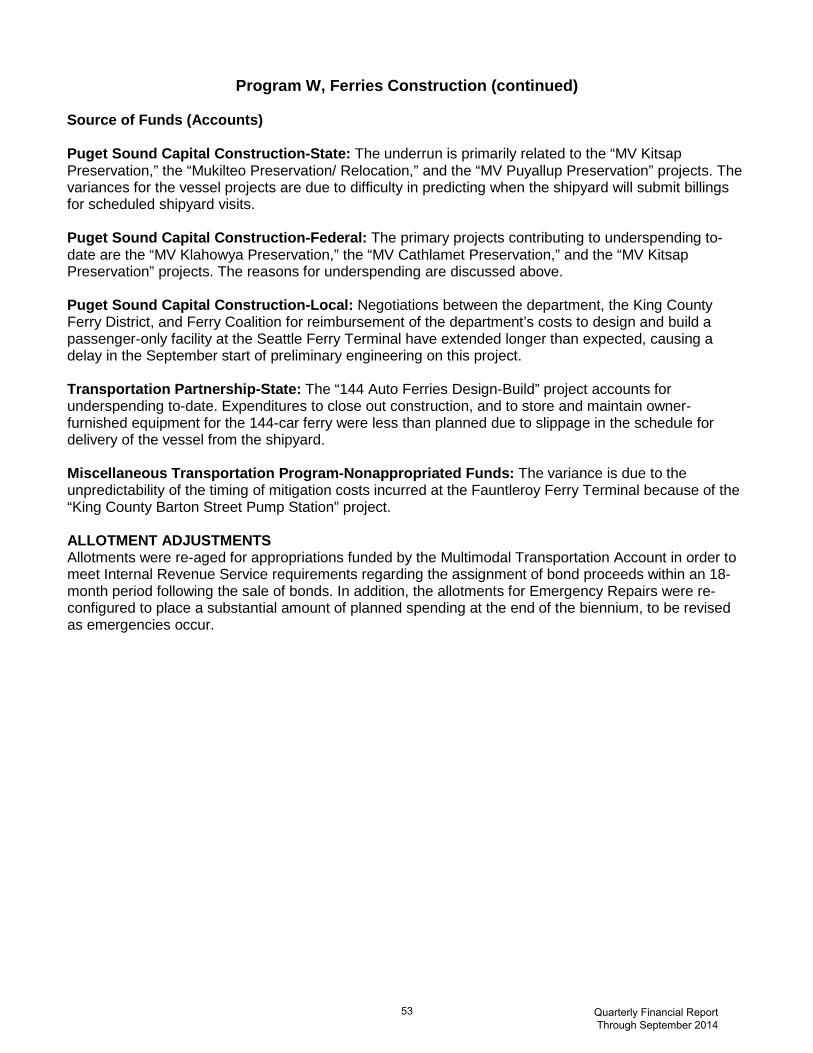
Program W, Ferries Construction (continued) Source of Funds (Accounts) Puget Sound Capital Construction-State: The underrun is primarily related to the “MV Kitsap Preservation,” the “Mukilteo Preservation/ Relocation,” and the “MV Puyallup Preservation” projects. The variances for the vessel projects are due to difficulty in predicting when the shipyard will submit billings for scheduled shipyard visits. Puget Sound Capital Construction-Federal: The primary projects contributing to underspending to-date are the “MV Klahowya Preservation,” the “MV Cathlamet Preservation,” and the “MV Kitsap Preservation” projects. The reasons for underspending are discussed above. Puget Sound Capital Construction-Local: Negotiations between the department, the King County Ferry District, and Ferry Coalition for reimbursement of the department’s costs to design and build a passenger-only facility at the Seattle Ferry Terminal have extended longer than expected, causing a delay in the September start of preliminary engineering on this project. Transportation Partnership-State: The “144 Auto Ferries Design-Build” project accounts for underspending to-date. Expenditures to close out construction, and to store and maintain owner-furnished equipment for the 144-car ferry were less than planned due to slippage in the schedule for delivery of the vessel from the shipyard. Miscellaneous Transportation Program-Nonappropriated Funds: The variance is due to the unpredictability of the timing of mitigation costs incurred at the Fauntleroy Ferry Terminal because of the “King County Barton Street Pump Station” project. ALLOTMENT ADJUSTMENTS Allotments were re-aged for appropriations funded by the Multimodal Transportation Account in order to meet Internal Revenue Service requirements regarding the assignment of bond proceeds within an 18-month period following the sale of bonds. In addition, the allotments for Emergency Repairs were re-configured to place a substantial amount of planned spending at the end of the biennium, to be revised as emergencies occur.
53 Quarterly Financial Report Through September 2014

Program W, Ferries Construction (continued)
Jun15
May15
Apr15
Mar15
Feb15
Jan15
Dec14
Nov14
Oct14
Sep14
Aug14
Jul14
Jun14
May14
Apr14
Mar14
Feb14
Jan14
Dec13
Nov13
Oct13
Sep13
Aug13
Jul13
75.0
50.0
25.0
0.0
Allotments Expenditures
Monthly Expenditure Comparison
Millions $
Jun15
May15
Apr15
Mar15
Feb15
Jan15
Dec14
Nov14
Oct14
Sep14
Aug14
Jul14
Jun14
May14
Apr14
Mar14
Feb14
Jan14
Dec13
Nov13
Oct13
Sep13
Aug13
Jul13
400
300
200
100
0
Allotments Expenditures
Cumulative toDate Expenditure Comparison
Millions $
Variance toDate:$19.0million underexpended 11.1% underexpended
54 Quarterly Financial Report Through September 2014
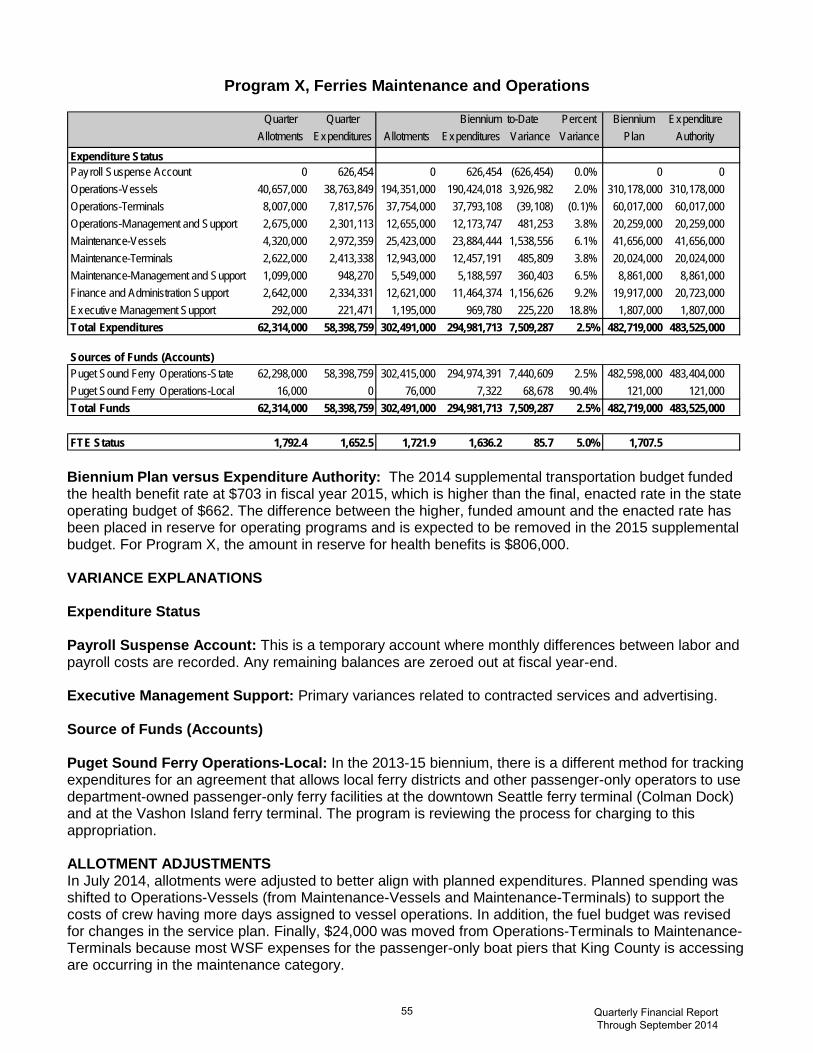
Program X, Ferries Maintenance and Operations
Quarter Quarter Biennium to-Date Percent Biennium ExpenditureAllotments Expenditures Allotments Expenditures Variance Variance Plan Authority
Expenditure StatusPayroll Suspense Account 0 626,454 0 626,454 (626,454) 0.0% 0 0Operations-Vessels 40,657,000 38,763,849 194,351,000 190,424,018 3,926,982 2.0% 310,178,000 310,178,000Operations-Terminals 8,007,000 7,817,576 37,754,000 37,793,108 (39,108) (0.1)% 60,017,000 60,017,000Operations-Management and Support 2,675,000 2,301,113 12,655,000 12,173,747 481,253 3.8% 20,259,000 20,259,000Maintenance-Vessels 4,320,000 2,972,359 25,423,000 23,884,444 1,538,556 6.1% 41,656,000 41,656,000Maintenance-Terminals 2,622,000 2,413,338 12,943,000 12,457,191 485,809 3.8% 20,024,000 20,024,000Maintenance-Management and Support 1,099,000 948,270 5,549,000 5,188,597 360,403 6.5% 8,861,000 8,861,000Finance and Administration Support 2,642,000 2,334,331 12,621,000 11,464,374 1,156,626 9.2% 19,917,000 20,723,000Executive Management Support 292,000 221,471 1,195,000 969,780 225,220 18.8% 1,807,000 1,807,000Total Expenditures 62,314,000 58,398,759 302,491,000 294,981,713 7,509,287 2.5% 482,719,000 483,525,000
Sources of Funds (Accounts)Puget Sound Ferry Operations-State 62,298,000 58,398,759 302,415,000 294,974,391 7,440,609 2.5% 482,598,000 483,404,000Puget Sound Ferry Operations-Local 16,000 0 76,000 7,322 68,678 90.4% 121,000 121,000Total Funds 62,314,000 58,398,759 302,491,000 294,981,713 7,509,287 2.5% 482,719,000 483,525,000
FTE Status 1,792.4 1,652.5 1,721.9 1,636.2 85.7 5.0% 1,707.5 Biennium Plan versus Expenditure Authority: The 2014 supplemental transportation budget funded the health benefit rate at $703 in fiscal year 2015, which is higher than the final, enacted rate in the state operating budget of $662. The difference between the higher, funded amount and the enacted rate has been placed in reserve for operating programs and is expected to be removed in the 2015 supplemental budget. For Program X, the amount in reserve for health benefits is $806,000. VARIANCE EXPLANATIONS Expenditure Status Payroll Suspense Account: This is a temporary account where monthly differences between labor and payroll costs are recorded. Any remaining balances are zeroed out at fiscal year-end. Executive Management Support: Primary variances related to contracted services and advertising. Source of Funds (Accounts) Puget Sound Ferry Operations-Local: In the 2013-15 biennium, there is a different method for tracking expenditures for an agreement that allows local ferry districts and other passenger-only operators to use department-owned passenger-only ferry facilities at the downtown Seattle ferry terminal (Colman Dock) and at the Vashon Island ferry terminal. The program is reviewing the process for charging to this appropriation. ALLOTMENT ADJUSTMENTS In July 2014, allotments were adjusted to better align with planned expenditures. Planned spending was shifted to Operations-Vessels (from Maintenance-Vessels and Maintenance-Terminals) to support the costs of crew having more days assigned to vessel operations. In addition, the fuel budget was revised for changes in the service plan. Finally, $24,000 was moved from Operations-Terminals to Maintenance-Terminals because most WSF expenses for the passenger-only boat piers that King County is accessing are occurring in the maintenance category.
55 Quarterly Financial Report Through September 2014
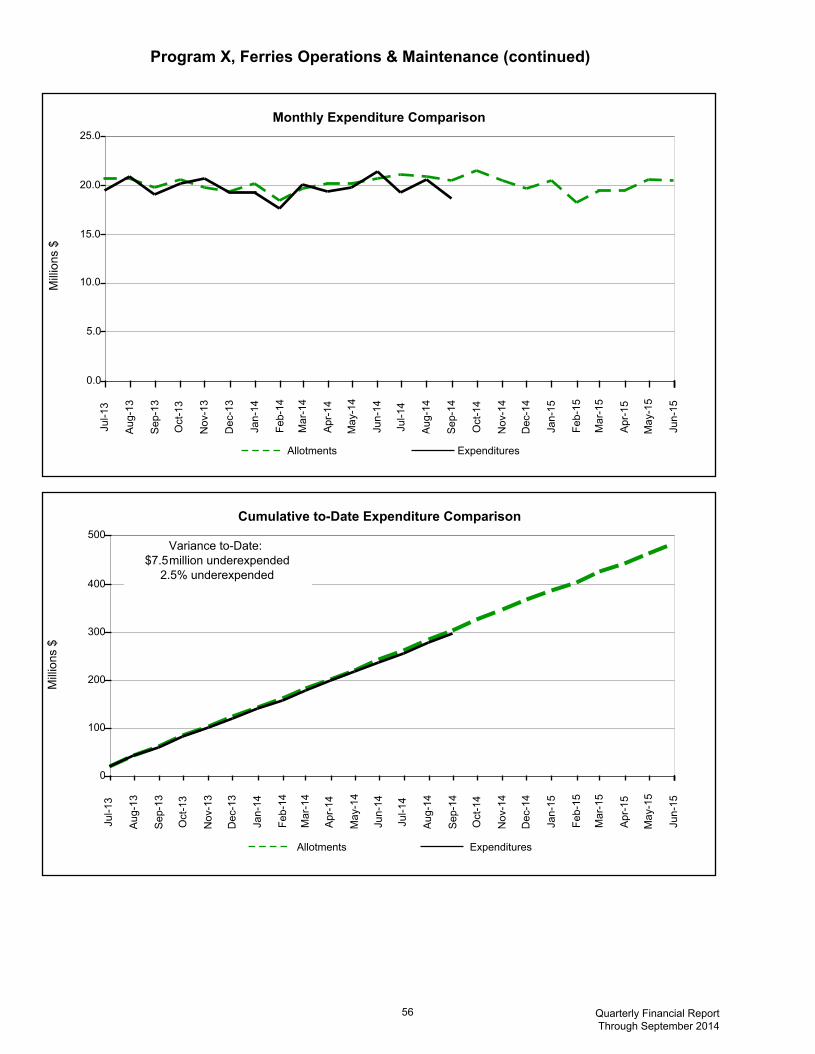
Program X, Ferries Operations & Maintenance (continued)
Jun15
May15
Apr15
Mar15
Feb15
Jan15
Dec14
Nov14
Oct14
Sep14
Aug14
Jul14
Jun14
May14
Apr14
Mar14
Feb14
Jan14
Dec13
Nov13
Oct13
Sep13
Aug13
Jul13
25.0
20.0
15.0
10.0
5.0
0.0
Allotments Expenditures
Monthly Expenditure Comparison
Millions $
Jun15
May15
Apr15
Mar15
Feb15
Jan15
Dec14
Nov14
Oct14
Sep14
Aug14
Jul14
Jun14
May14
Apr14
Mar14
Feb14
Jan14
Dec13
Nov13
Oct13
Sep13
Aug13
Jul13
500
400
300
200
100
0
Allotments Expenditures
Cumulative toDate Expenditure Comparison
Millions $
Variance toDate:$7.5million underexpended 2.5% underexpended
56 Quarterly Financial Report Through September 2014

Program Y, Rail-Operating
Quarter Quarter Biennium to-Date Percent Biennium ExpenditureAllotments Expenditures Allotments Expenditures Variance Variance Plan Authority
Expenditure StatusRail Freight Operations 90,000 32,233 232,000 186,305 45,695 19.7% 554,000 554,000Rail Passenger Operations 3,501,000 3,220,937 24,210,400 25,213,515 (1,003,115) (4.1)% 45,687,400 45,694,000Total Expenditures 3,591,000 3,253,170 24,442,400 25,399,821 (957,421) (3.9)% 46,241,400 46,248,000
Sources of Funds (Accounts)Multimodal Transportation-State 3,575,000 3,253,170 24,341,000 25,306,645 (965,645) (4.0)% 46,021,000 46,026,000Multimodal Transportation-Federal 0 0 62,000 55,293 6,707 10.8% 62,000 62,000Multimodal Transportation-Local 0 0 8,400 8,340 60 0.7% 8,400 10,000Miscellaneous Program-Nonappropriated Funds 16,000 0 31,000 29,542 1,458 4.7% 150,000 150,000Total Funds 3,591,000 3,253,170 24,442,400 25,399,821 (957,421) (3.9)% 46,241,400 46,248,000
FTE Status 10.0 10.5 10.4 10.5 (0.1) (1.3)% 10.2 Biennial Plan versus Expenditure Authority: The Biennial Plan is $6,600 less than Expenditure Authority for two reasons. First, $1,600 of local unanticipated receipts for the share of the Rail Corridor Director with Oregon Department of Transportation is in unallotted status because expenditures were less than anticipated. Second, the 2014 supplemental transportation budget funded the health benefit rate at $703 in fiscal year 2015, which is higher than the final, enacted rate in the state operating budget of $662. The difference between the higher, funded amount and the enacted rate has been placed in reserve for operating programs and is expected to be removed in the 2015 supplemental budget. For Program Y, the amount in reserve for health benefits is $5,000. VARIANCE EXPLANATIONS Expenditure Status Rail Freight Operations: The variance is because of delays in receiving invoices from the Washington State University on the Study of Inventory of Short Line Rail Infrastructure. Invoices are anticipated to be received by the next quarterly report. Source of Funds (Accounts) Multimodal Transportation-Federal: The variance is because some of the transactions related to the Skagit River Emergency Service from the close of the 2011-13 biennium did not occur as anticipated. Expenditures were reversed in the current biennium, which result in a reduction in expenditures.
57 Quarterly Financial Report Through September 2014

Program Y, RailOperating (continued)
Jun15
May15
Apr15
Mar15
Feb15
Jan15
Dec14
Nov14
Oct14
Sep14
Aug14
Jul14
Jun14
May14
Apr14
Mar14
Feb14
Jan14
Dec13
Nov13
Oct13
Sep13
Aug13
Jul13
4.0
3.0
2.0
1.0
0.0
Allotments Expenditures
Monthly Expenditure Comparison
Millions $
Jun15
May15
Apr15
Mar15
Feb15
Jan15
Dec14
Nov14
Oct14
Sep14
Aug14
Jul14
Jun14
May14
Apr14
Mar14
Feb14
Jan14
Dec13
Nov13
Oct13
Sep13
Aug13
Jul13
50
40
30
20
10
0
Allotments Expenditures
Cumulative toDate Expenditure Comparison
Millions $
Variance toDate:($1.0)million overexpended (3.9)% overexpended
58 Quarterly Financial Report Through September 2014
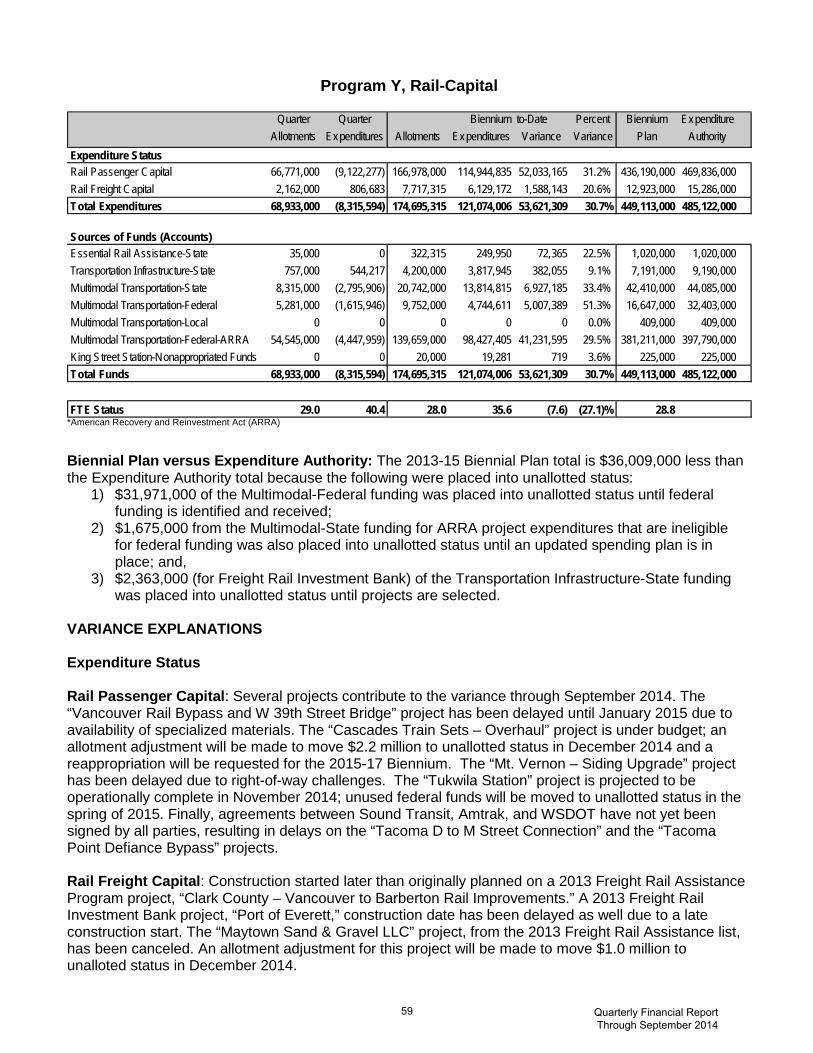
Program Y, Rail-Capital
Quarter Quarter Biennium to-Date Percent Biennium ExpenditureAllotments Expenditures Allotments Expenditures Variance Variance Plan Authority
Expenditure StatusRail Passenger Capital 66,771,000 (9,122,277) 166,978,000 114,944,835 52,033,165 31.2% 436,190,000 469,836,000Rail Freight Capital 2,162,000 806,683 7,717,315 6,129,172 1,588,143 20.6% 12,923,000 15,286,000Total Expenditures 68,933,000 (8,315,594) 174,695,315 121,074,006 53,621,309 30.7% 449,113,000 485,122,000
Sources of Funds (Accounts)Essential Rail Assistance-State 35,000 0 322,315 249,950 72,365 22.5% 1,020,000 1,020,000Transportation Infrastructure-State 757,000 544,217 4,200,000 3,817,945 382,055 9.1% 7,191,000 9,190,000Multimodal Transportation-State 8,315,000 (2,795,906) 20,742,000 13,814,815 6,927,185 33.4% 42,410,000 44,085,000Multimodal Transportation-Federal 5,281,000 (1,615,946) 9,752,000 4,744,611 5,007,389 51.3% 16,647,000 32,403,000Multimodal Transportation-Local 0 0 0 0 0 0.0% 409,000 409,000Multimodal Transportation-Federal-ARRA 54,545,000 (4,447,959) 139,659,000 98,427,405 41,231,595 29.5% 381,211,000 397,790,000King Street Station-Nonappropriated Funds 0 0 20,000 19,281 719 3.6% 225,000 225,000Total Funds 68,933,000 (8,315,594) 174,695,315 121,074,006 53,621,309 30.7% 449,113,000 485,122,000
FTE Status 29.0 40.4 28.0 35.6 (7.6) (27.1)% 28.8*American Recovery and Reinvestment Act (ARRA)
Biennial Plan versus Expenditure Authority: The 2013-15 Biennial Plan total is $36,009,000 less than the Expenditure Authority total because the following were placed into unallotted status:
1) $31,971,000 of the Multimodal-Federal funding was placed into unallotted status until federal funding is identified and received;
2) $1,675,000 from the Multimodal-State funding for ARRA project expenditures that are ineligible for federal funding was also placed into unallotted status until an updated spending plan is in place; and,
3) $2,363,000 (for Freight Rail Investment Bank) of the Transportation Infrastructure-State funding was placed into unallotted status until projects are selected.
VARIANCE EXPLANATIONS Expenditure Status Rail Passenger Capital: Several projects contribute to the variance through September 2014. The “Vancouver Rail Bypass and W 39th Street Bridge” project has been delayed until January 2015 due to availability of specialized materials. The “Cascades Train Sets – Overhaul” project is under budget; an allotment adjustment will be made to move $2.2 million to unallotted status in December 2014 and a reappropriation will be requested for the 2015-17 Biennium. The “Mt. Vernon – Siding Upgrade” project has been delayed due to right-of-way challenges. The “Tukwila Station” project is projected to be operationally complete in November 2014; unused federal funds will be moved to unallotted status in the spring of 2015. Finally, agreements between Sound Transit, Amtrak, and WSDOT have not yet been signed by all parties, resulting in delays on the “Tacoma D to M Street Connection” and the “Tacoma Point Defiance Bypass” projects. Rail Freight Capital: Construction started later than originally planned on a 2013 Freight Rail Assistance Program project, “Clark County – Vancouver to Barberton Rail Improvements.” A 2013 Freight Rail Investment Bank project, “Port of Everett,” construction date has been delayed as well due to a late construction start. The “Maytown Sand & Gravel LLC” project, from the 2013 Freight Rail Assistance list, has been canceled. An allotment adjustment for this project will be made to move $1.0 million to unalloted status in December 2014.
59 Quarterly Financial Report Through September 2014
ConnelB
Line
ConnelB
Line

Program Y, Rail-Capital (continued)
Source of Funds (Accounts) Essential Rail Assistance-State: See explanation for Rail Freight Capital.
Multimodal Transportation-State: See explanation for Rail Passenger Capital on the “Vancouver Rail Bypass and W 39th Street Bridge” project and the “Cascades Train Sets–Overhaul” project. Multimodal Transportation-Federal: See explanation for Rail Passenger Capital on the “Mt. Vernon– Siding Upgrade” project and the “Tukwila Station” project. Multimodal Transportation-Federal ARRA: See explanation for Rail Passenger Capital on the “Tacoma D to M Street Connection” and the “Tacoma Point Defiance Bypass” projects. FTE Status: Several factors contribute to the Freight Rail FTE variance. The first is related to staff work performed on the Department of Commerce grant project. When the Department of Commerce grant is billed, the expenditures are zeroed out but the related FTEs remain in the Rail program. Second, more staff members have worked on the oversight of the PCC projects than originally anticipated. The Passenger Rail FTE variance is due to additional work required on the “Tacoma Point Defiance Bypass" project.
60 Quarterly Financial Report Through September 2014

Program Y, RailCapital (continued)
Jun-
15
May
-15
Apr
-15
Mar
-15
Feb-
15
Jan-
15
Dec
-14
Nov
-14
Oct
-14
Sep
-14
Aug
-14
Jul-1
4
Jun-
14
May
-14
Apr
-14
Mar
-14
Feb-
14
Jan-
14
Dec
-13
Nov
-13
Oct
-13
Sep
-13
Aug
-13
Jul-1
3
75.0
50.0
25.0
0.0
(25.0)
Allotments Expenditures
Monthly Expenditure Comparison
Millions $
Jun-
15
May
-15
Apr
-15
Mar
-15
Feb-
15
Jan-
15
Dec
-14
Nov
-14
Oct
-14
Sep
-14
Aug
-14
Jul-1
4
Jun-
14
May
-14
Apr
-14
Mar
-14
Feb-
14
Jan-
14
Dec
-13
Nov
-13
Oct
-13
Sep
-13
Aug
-13
Jul-1
3
500
400
300
200
100
0
Allotments Cume Expenditures
Cumulative toDate Expenditure Comparison
Millions $
Variance toDate $53.6 million underexpended 30.7% underexpended
61 Quarterly Financial Report Through September 2014
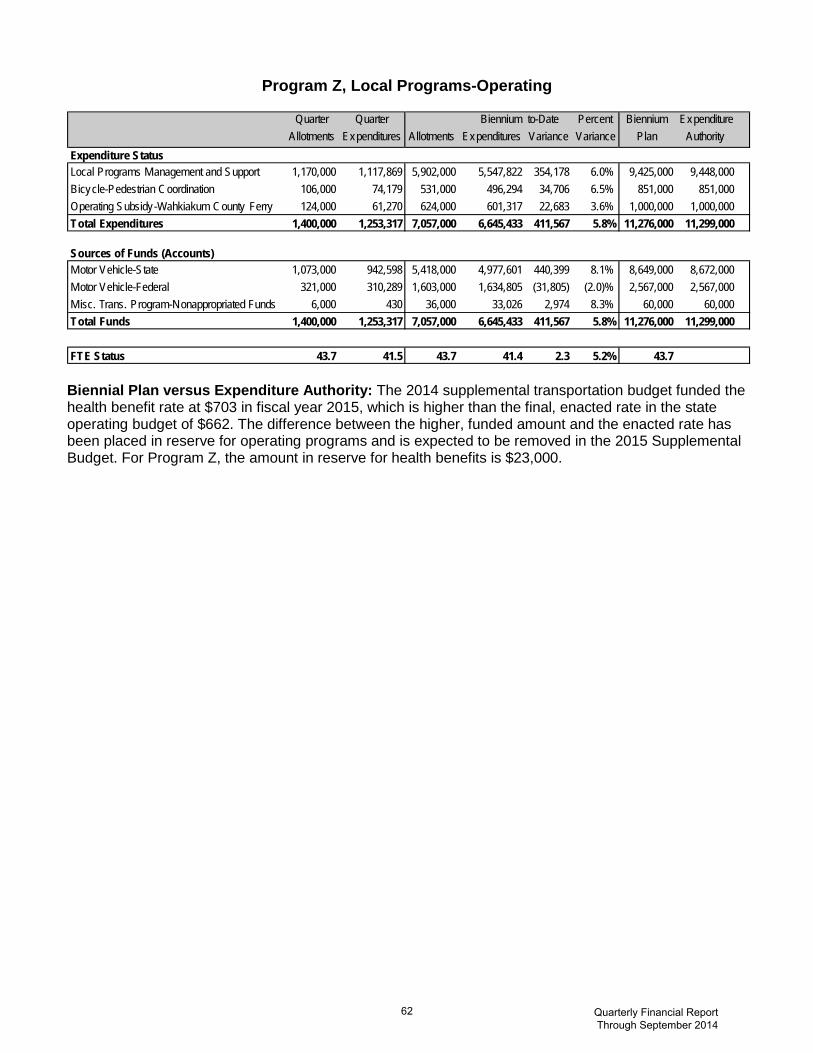
Program Z, Local Programs-Operating
Quarter Quarter Biennium to-Date Percent Biennium ExpenditureAllotments Expenditures Allotments Expenditures Variance Variance Plan Authority
Expenditure StatusLocal Programs Management and Support 1,170,000 1,117,869 5,902,000 5,547,822 354,178 6.0% 9,425,000 9,448,000Bicycle-Pedestrian Coordination 106,000 74,179 531,000 496,294 34,706 6.5% 851,000 851,000Operating Subsidy-Wahkiakum County Ferry 124,000 61,270 624,000 601,317 22,683 3.6% 1,000,000 1,000,000Total Expenditures 1,400,000 1,253,317 7,057,000 6,645,433 411,567 5.8% 11,276,000 11,299,000
Sources of Funds (Accounts)Motor Vehicle-State 1,073,000 942,598 5,418,000 4,977,601 440,399 8.1% 8,649,000 8,672,000Motor Vehicle-Federal 321,000 310,289 1,603,000 1,634,805 (31,805) (2.0)% 2,567,000 2,567,000Misc. Trans. Program-Nonappropriated Funds 6,000 430 36,000 33,026 2,974 8.3% 60,000 60,000Total Funds 1,400,000 1,253,317 7,057,000 6,645,433 411,567 5.8% 11,276,000 11,299,000
FTE Status 43.7 41.5 43.7 41.4 2.3 5.2% 43.7 Biennial Plan versus Expenditure Authority: The 2014 supplemental transportation budget funded the health benefit rate at $703 in fiscal year 2015, which is higher than the final, enacted rate in the state operating budget of $662. The difference between the higher, funded amount and the enacted rate has been placed in reserve for operating programs and is expected to be removed in the 2015 Supplemental Budget. For Program Z, the amount in reserve for health benefits is $23,000.
62 Quarterly Financial Report Through September 2014
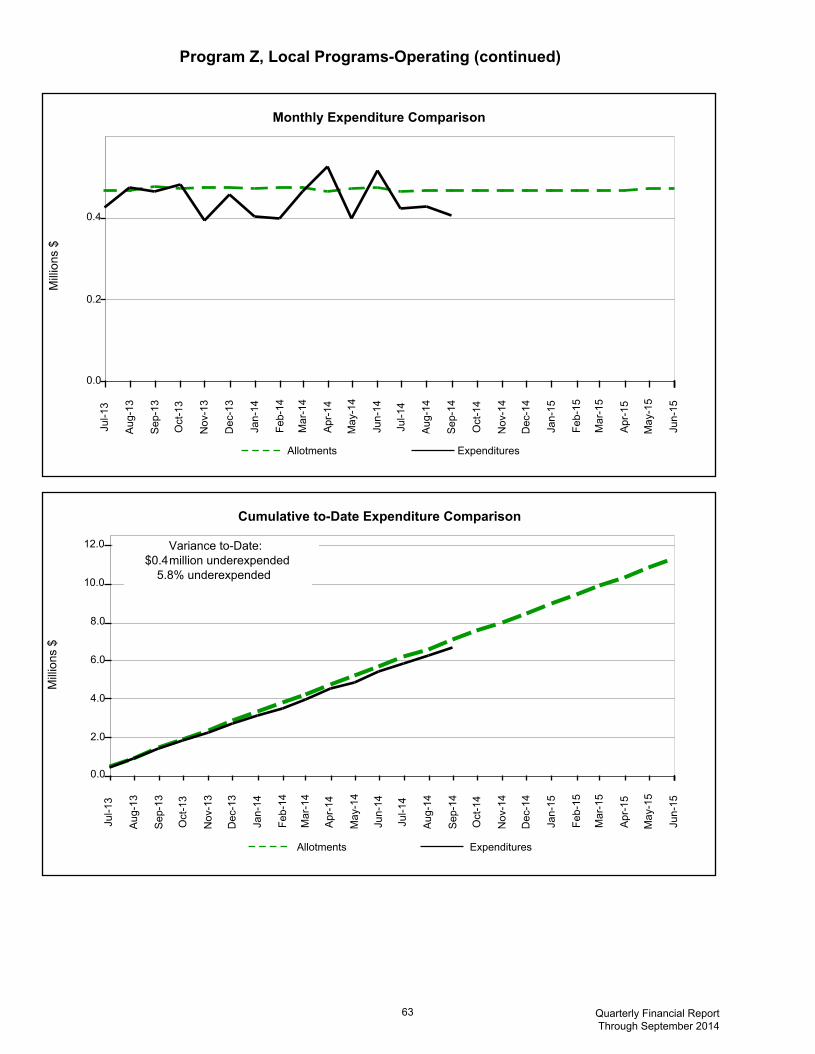
Program Z, Local ProgramsOperating (continued)
Jun-
15
May
-15
Apr
-15
Mar
-15
Feb-
15
Jan-
15
Dec
-14
Nov
-14
Oct
-14
Sep
-14
Aug
-14
Jul-1
4
Jun-
14
May
-14
Apr
-14
Mar
-14
Feb-
14
Jan-
14
Dec
-13
Nov
-13
Oct
-13
Sep
-13
Aug
-13
Jul-1
3
0.4
0.2
0.0
Allotments Expenditures
Monthly Expenditure Comparison
Millions $
Jun-
15
May
-15
Apr
-15
Mar
-15
Feb-
15
Jan-
15
Dec
-14
Nov
-14
Oct
-14
Sep
-14
Aug
-14
Jul-1
4
Jun-
14
May
-14
Apr
-14
Mar
-14
Feb-
14
Jan-
14
Dec
-13
Nov
-13
Oct
-13
Sep
-13
Aug
-13
Jul-1
3
12.0
10.0
8.0
6.0
4.0
2.0
0.0
Allotments Expenditures
Cumulative toDate Expenditure Comparison
Millions $
Variance toDate:$0.4million underexpended 5.8% underexpended
63 Quarterly Financial Report Through September 2014

Program Z, Local Programs-Capital
Quarter Quarter Biennium to-Date Percent Biennium ExpenditureAllotments Expenditures Allotments Expenditures Variance Variance Plan Authority
Expenditure StatusConstruction-Off State System 40,494,500 39,954,392 304,278,500 318,520,146 (14,241,646) (4.7)% 542,790,000 542,790,000Local Agency Investments on the State System 525,000 104,077 2,938,000 1,918,473 1,019,527 34.7% 4,832,000 4,832,000Total Expenditures 41,019,500 40,058,469 307,216,500 320,438,620 (13,222,120) (4.3)% 547,622,000 547,622,000
Sources of Funds (Accounts)Highway Infrastructure-State 27,000 0 130,000 0 130,000 100.0% 207,000 207,000Highway Infrastructure-Federal 201,000 0 999,000 0 999,000 100.0% 1,602,000 1,602,000Transportation Partnership-State 1,238,000 44,106 4,790,000 2,351,362 2,438,638 50.9% 9,236,000 9,236,000Highway Safety-State 1,129,000 286,120 5,544,000 2,537,556 3,006,444 54.2% 8,915,000 8,915,000Motor Vehicle-State 331,000 0 1,147,000 1,510,614 (363,614) (31.7)% 2,201,000 2,201,000Motor Vehicle-Federal 5,073,500 1,471,322 18,640,500 10,915,267 7,725,233 41.4% 34,581,000 34,581,000Multimodal Transportation-State 2,908,000 1,405,950 9,784,000 4,664,997 5,119,003 52.3% 18,740,000 18,740,000Misc. Trans. Program-Nonappropriated Funds 29,062,000 36,849,652 260,932,000 294,403,311 (33,471,311) (12.8)% 463,740,000 463,740,000Misc. Trans. Program-Federal-Nonappropriated ARRA 1,050,000 1,317 5,250,000 4,055,513 1,194,487 22.8% 8,400,000 8,400,000Total Funds 41,019,500 40,058,469 307,216,500 320,438,620 (13,222,120) (4.3)% 547,622,000 547,622,000
FTE Status 36.0 26.5 36.0 25.8 10.2 28.2% 36.0 VARIANCE EXPLANATIONS Expenditure Status Local Agency Investments on the State System: The positive variance is due to expenditures lagging behind initial expectations for this activity in federal nonappropriated funding for projects that are on the state highway system. Source of Funds (Account) Highway Infrastructure-State: The Highway Infrastructure funding is committed and under agreement. The expenditure activity is lagging due to a delay in the contract payment request. Highway Infrastructure-Federal: The Highway Infrastructure funding is committed and under agreement. The expenditure activity is lagging due to a delay in the contact payment request. Transportation Partnership-State: The underspending is due to lease negotiations on the “Lake Forest Park & Ride” project as well as a number of projects slow to bill in the 2013 Bicycle-Pedestrian Program. Highway Safety Account-State: Expenditure activity is slower than originally anticipated on many of the 2013 Safe Routes to School selected projects. Motor Vehicle Account-State: Expenditures for Right of Way activity was greater than anticipated on the “Riverside Avenue Extension” project. This project accounted for $1.1 million of expenditure activity in this fund source.
64 Quarterly Financial Report Through September 2014
ConnelB
Line
ConnelB
Line

Program Z, Local Programs – Capital (continued)
Motor Vehicle Account-Federal: Expenditures are lagging behind expectations for projects in this account in the Bicycle Pedestrian and the Safe Routes to School Program and on several projects including the “S. 228th St. UPRR Grad Separation,” “Slater Road Bridge,” “SR 908 Pavement Rehab,” “South Wapato and McDonald Road Intersection” and, “SR 522 Improvements/61st Ave NE and NE 181st Street.” Multimodal Transportation-State: The expenditure activity on the “Island Transit – Parker Rd-SR 20 Realign and Transit Park” project has been slower than expected as well as expenditures lagging behind on a number of projects in the 2013 Bicycle Pedestrian Program. Miscellaneous Transportation Program-Nonappropriated: Expenditure activity has been greater than anticipated over the last two quarters for projects in this program. FTE Status: The anticipated FTE expenditures for work on local projects are less than anticipated due to staff turnover. The vacant position is in the recruitment process.
65 Quarterly Financial Report Through September 2014

Program Z, Local ProgramsCapital (continued)
Jun15
May15
Apr15
Mar15
Feb15
Jan15
Dec14
Nov14
Oct14
Sep14
Aug14
Jul14
Jun14
May14
Apr14
Mar14
Feb14
Jan14
Dec13
Nov13
Oct13
Sep13
Aug13
Jul13
75.0
50.0
25.0
0.0
(25.0)
Allotments Expenditures
Monthly Expenditure Comparison
Millions $
Jun15
May15
Apr15
Mar15
Feb15
Jan15
Dec14
Nov14
Oct14
Sep14
Aug14
Jul14
Jun14
May14
Apr14
Mar14
Feb14
Jan14
Dec13
Nov13
Oct13
Sep13
Aug13
Jul13
500
250
0
Allotments Expenditures
Cumulative toDate Expenditure Comparison
Millions $
Variance toDate:($13.2)million overexpended (4.3)% overexpended
66 Quarterly Financial Report Through September 2014

Appendices
Appendix A, Agency Expenditure FTE Summary
Appendix B, 2013-15 Unanticipated Receipts
Appendix C, 2013-15 Other Program Changes
Appendix D, Miscellaneous Transportation Programs Account, Fund 784
Appendix E, Advanced Environmental Mitigation Revolving Account (AEMRA), Project Funding
Appendix F, Advance Right of Way Revolving Account (AROW), Project Funding
67 Quarterly Financial Report Through September 2014

Appendix A, Agency FTE Expenditure Summary
Quarter Quarter Biennium toDate Percent Biennial Programs Allotments Expenditures Allotments Expenditures Variance Variance Plan
Operating
BCDFHKMQSTUVXYZ
Toll Operations and MaintenanceInformation TechnologyFacilitiesOperatingAviationProgram Delivery Management and SupportPublicPrivate PartnershipsHighway Maintenance and OperationsTraffic OperationsOperatingTransportation Management and SupportTransportation Planning, Data and ResearchCharges From/Payments to Other AgenciesPublic Transportation Ferries Operations and MaintenanceRailOperatingLocal ProgramsOperating
39.3225.173.912.6221.42.0
1,455.5250.4192.6188.70.039.5
1,792.410.043.7
29.2232.367.613.3215.41.7
1,400.0241.4185.6167.90.035.2
1,652.510.541.5
38.6225.173.613.0218.32.0
1,567.2250.9183.8188.20.038.8
1,721.910.443.7
29.1227.268.912.7207.02.0
1,486.1242.2186.4172.00.034.6
1,636.210.541.4
9.6(2.1)4.70.311.30.081.18.7
(2.6)16.10.04.285.7(0.1)2.3
24.8%(1.0)%6.4%2.5%5.2%0.6%5.2%3.5%
(1.4)%8.6%0.0%10.8%5.0%
(1.3)%5.2%
38.3225.173.312.9219.22.0
1,578.5250.7187.1187.30.039.0
1,707.510.243.7
Subtotal Operating 4,547.0 4,294.2 4,575.6 4,356.3 219.3 4.8% 4,574.8
Capital
DIPQWYZ
FacilitiesCapitalImprovementsPreservationTraffic OperationsCapitalFerries Division ConstructionRailCapitalLocal ProgramsCapital
17.21,465.3926.110.3128.729.036.0
8.31,224.0928.47.3
111.740.426.5
13.91,477.6872.510.3129.228.036.0
8.51,266.2854.08.4
117.535.625.8
5.4211.418.51.911.8(7.6)10.2
38.7%14.3%2.1%18.4%9.1%
(27.1)%28.2%
12.31,425.3837.910.3128.028.836.0
Subtotal Capital 2,612.7 2,346.6 2,567.6 2,316.1 251.5 9.8% 2,478.6Subtotal 7,159.7 6,640.8 7,143.1 6,672.4 470.8 6.6% 7,053.4
NonAppropriated Budgeted
ES
Transportation Equipment FundTransportation Management and Support
207.00.0
206.30.0
208.80.0
206.00.0
2.80.0
1.3%0.0%
209.30.0
Subtotal NonAppropriated Budgeted 207.0 206.3 208.8 206.0 2.8 1.3% 209.3
Agency Total 7,366.7 6,847.2 7,352.0 6,878.4 473.6 6.4% 7,262.7
** FTEs associated with "NonAppropriated Budgeted" portions of operating programs are reflected separately because program expenditures are reimbursed from other WSDOT programs.
68 Quarterly Financial Report Through September 2014
ConnelB
Line
ConnelB
Line
ConnelB
Line
ConnelB
Line
ConnelB
Line
ConnelB
Line
ConnelB
Line
ConnelB
Line
ConnelB
Line
ConnelB
Line
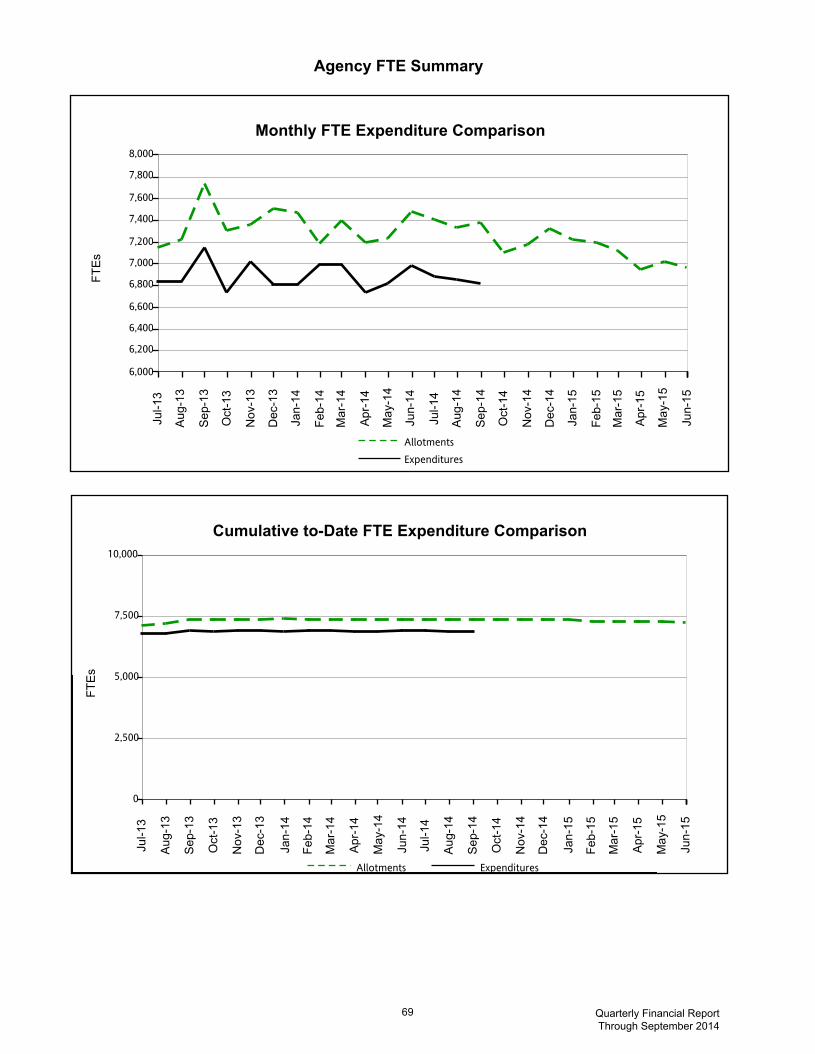
Agency FTE Summary
Jun-
15
May
-15
Apr
-15
Mar
-15
Feb-
15
Jan-
15
Dec
-14
Nov
-14
Oct
-14
Sep
-14
Aug
-14
Jul-1
4
Jun-
14
May
-14
Apr
-14
Mar
-14
Feb-
14
Jan-
14
Dec
-13
Nov
-13
Oct
-13
Sep
-13
Aug
-13
Jul-1
38,000
7,800
7,600
7,400
7,200
7,000
6,800
6,600
6,400
6,200
6,000
AllotmentsExpenditures
Monthly FTE Expenditure Comparison
FTE
s
Jun-
15
May
-15
Apr
-15
Mar
-15
Feb-
15
Jan-
15
Dec
-14
Nov
-14
Oct
-14
Sep
-14
Aug
-14
Jul-1
4
Jun-
14
May
-14
Apr
-14
Mar
-14
Feb-
14
Jan-
14
Dec
-13
Nov
-13
Oct
-13
Sep
-13
Aug
-13
Jul-1
3
10,000
7,500
5,000
2,500
0
Allotments Expenditures
Cumulative toDate FTE Expenditure Comparison
FTE
s
69 Quarterly Financial Report Through September 2014
ConnelB
Typewritten Text
Variance to-Date: 473.6 underexpended 6.4% underexpended
ConnelB
Typewritten Text
ConnelB
Typewritten Text
ConnelB
Typewritten Text
ConnelB
Rectangle
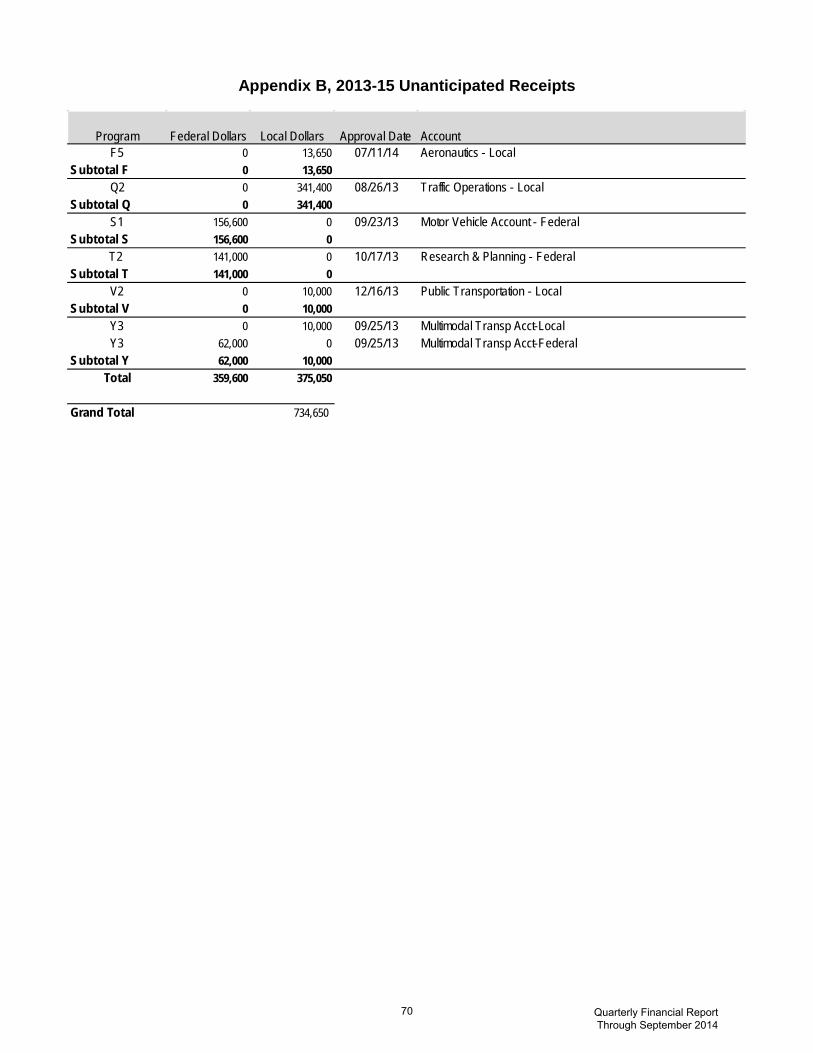
Appendix B, 2013-15 Unanticipated Receipts
Program Federal Dollars Local Dollars Approval Date AccountF5 0 13,650 07/11/14 Aeronautics - Local
Subtotal F 0 13,650Q2 0 341,400 08/26/13 Traffic Operations - Local
Subtotal Q 0 341,400S1 156,600 0 09/23/13 Motor Vehicle Account - Federal
Subtotal S 156,600 0T2 141,000 0 10/17/13 Research & Planning - Federal
Subtotal T 141,000 0V2 0 10,000 12/16/13 Public Transportation - Local
Subtotal V 0 10,000Y3 0 10,000 09/25/13 Multimodal Transp Acct-LocalY3 62,000 0 09/25/13 Multimodal Transp Acct-Federal
Subtotal Y 62,000 10,000Total 359,600 375,050
Grand Total 734,650
70 Quarterly Financial Report Through September 2014

Appendix C, 2013-15 Non-Appropriated Funds
In addition to appropriated funds and approved unanticipated receipts, the department also has spending authority in non-appropriated accounts.
Program Dollars Approval Date AccountC3 12,200 05/08/14 Miscellaneous Transportation Programs Account-Local
Subtotal C 12,200E1 156,287,000 05/06/14 Transportation Equipment Fund-State
Subtotal E 156,287,000I6 14,000,000 10/11/13 Miscellaneous Transportation Programs Account-FederalI6 83,716,000 06/03/14 Miscellaneous Transportation Programs Account-Local
Subtotal I 97,716,000M2 350,000 08/21/14 Miscellaneous Transportation Programs Account-FederalM2 75,000 10/08/13 Miscellaneous Transportation Programs Account-LocalM3 2,818,000 10/08/13 Miscellaneous Transportation Programs Account-Local
Subtotal M 3,243,000P9 153,000 06/03/14 Miscellaneous Transportation Programs Account-FederalP9 7,759,000 06/03/14 Miscellaneous Transportation Programs Account-Local
Subtotal P 7,912,000Q2 3,200,000 10/08/13 Miscellaneous Transportation Programs Account-Local
Subtotal Q 3,200,000 S1 36,000 10/08/13 Miscellaneous Transportation Programs Account-LocalS2 175,000 10/08/13 Transportation Equipment Fund-State
Subtotal S 211,000T2 44,265 10/08/13 Miscellaneous Transportation Programs Account-LocalT3 47,000 10/28/13 Miscellaneous Transportation Programs Account-LocalT6 17,453,000 10/08/13 Miscellaneous Transportation Programs Account-Federal
Subtotal T 17,544,265V2 41,162,000 10/08/13 Miscellaneous Transportation Programs Account-FederalV2 70,000 10/08/13 Miscellaneous Transportation Programs Account-Local
Subtotal V 41,232,000W1 320,000 10/11/13 Miscellaneous Transportation Programs Account-Local
Subtotal W 320,000Y2 150,000 10/08/13 Miscellaneous Program Account-LocalY4 225,000 10/11/13 King Street Railroad Station Facility Account-Local
Subtotal Y 375,000Z1 60,000 10/08/13 Miscellaneous Transportation Programs Account-LocalZ2 458,798,000 10/11/13 Miscellaneous Transportation Programs Account-FederalZ2 3,660,000 10/11/13 Miscellaneous Transportation Programs Account-LocalZ2 8,400,000 10/11/13 Miscellaneous Transportation Programs Account-Federal ARRAZ9 1,076,000 10/11/13 Miscellaneous Transportation Programs Account-FederalZ9 206,000 10/11/13 Miscellaneous Transportation Programs Account-Local
Subtotal Z 472,200,000Total 800,252,465
71 Quarterly Financial Report Through September 2014
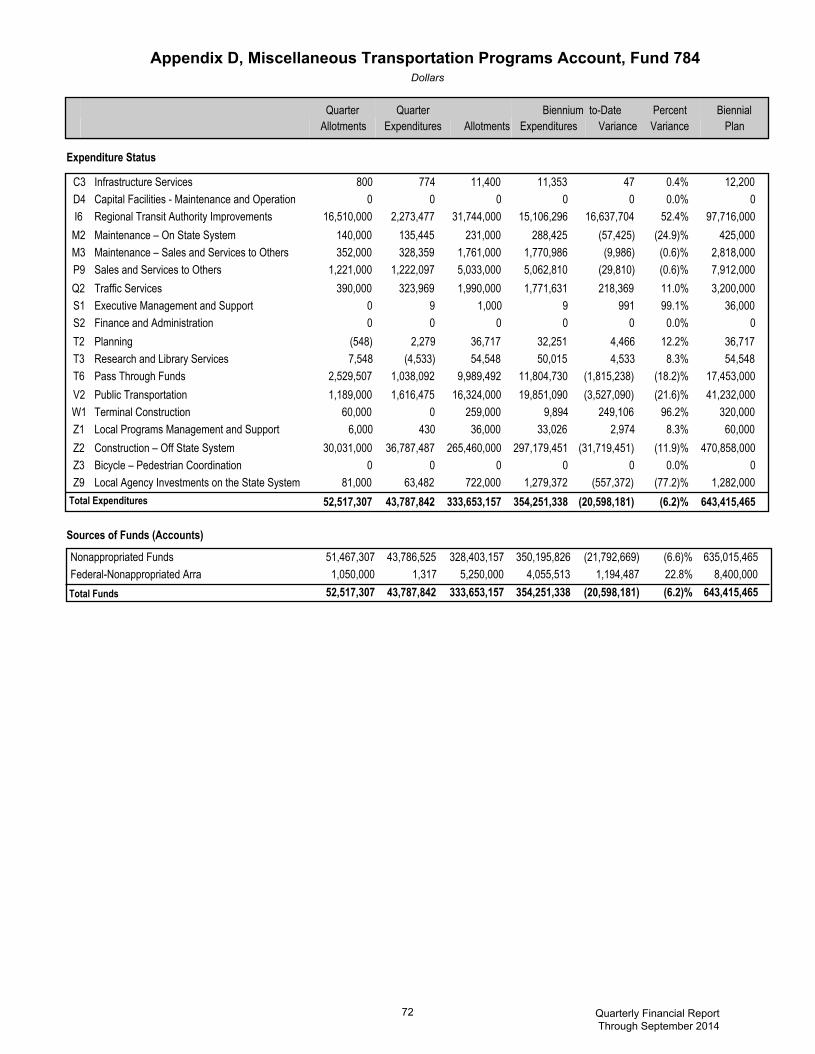
Appendix D, Miscellaneous Transportation Programs Account, Fund 784Dollars
Quarter Quarter Biennium toDate Percent Biennial Allotments Expenditures Allotments Expenditures Variance Variance Plan
C3D4I6M2M3P9Q2S1S2T2T3T6V2W1Z1Z2Z3Z9
Infrastructure ServicesCapital Facilities Maintenance and OperationRegional Transit Authority ImprovementsMaintenance – On State SystemMaintenance – Sales and Services to OthersSales and Services to OthersTraffic ServicesExecutive Management and SupportFinance and AdministrationPlanningResearch and Library ServicesPass Through FundsPublic TransportationTerminal ConstructionLocal Programs Management and SupportConstruction – Off State SystemBicycle – Pedestrian CoordinationLocal Agency Investments on the State System
8000
16,510,000140,000352,000
1,221,000390,000
00
(548)7,548
2,529,5071,189,000
60,0006,000
30,031,0000
81,000
7740
2,273,477135,445328,359
1,222,097323,969
90
2,279(4,533)
1,038,0921,616,475
0430
36,787,4870
63,482
11,4000
31,744,000231,000
1,761,0005,033,0001,990,000
1,0000
36,71754,548
9,989,49216,324,000
259,00036,000
265,460,0000
722,000
11,3530
15,106,296288,425
1,770,9865,062,8101,771,631
90
32,25150,015
11,804,73019,851,090
9,89433,026
297,179,4510
1,279,372
470
16,637,704(57,425)(9,986)(29,810)218,369
9910
4,4664,533
(1,815,238)(3,527,090)
249,1062,974
(31,719,451)0
(557,372)
0.4%0.0%52.4%
(24.9)%(0.6)%(0.6)%11.0%99.1%0.0%12.2%8.3%
(18.2)%(21.6)%96.2%8.3%
(11.9)%0.0%
(77.2)%
12,2000
97,716,000425,000
2,818,0007,912,0003,200,000
36,0000
36,71754,548
17,453,00041,232,000
320,00060,000
470,858,0000
1,282,00052,517,307 43,787,842 333,653,157 354,251,338 (20,598,181) (6.2)% 643,415,465
Nonappropriated FundsFederalNonappropriated Arra
51,467,3071,050,000
43,786,5251,317
328,403,1575,250,000
350,195,8264,055,513
(21,792,669)1,194,487
(6.6)%22.8%
635,015,4658,400,000
52,517,307 43,787,842 333,653,157 354,251,338 (20,598,181) (6.2)% 643,415,465
Expenditure Status
Total Expenditures
Sources of Funds (Accounts)
Total Funds
72 Quarterly Financial Report Through September 2014
ConnelB
Line
ConnelB
Line
ConnelB
Line
ConnelB
Line
ConnelB
Line
ConnelB
Line

Agency Fund 784 Summary
Jun-
15
May
-15
Apr
-15
Mar
-15
Feb-
15
Jan-
15
Dec
-14
Nov
-14
Oct
-14
Sep
-14
Aug
-14
Jul-1
4
Jun-
14
May
-14
Apr
-14
Mar
-14
Feb-
14
Jan-
14
Dec
-13
Nov
-13
Oct
-13
Sep
-13
Aug
-13
Jul-1
3
75
50
25
0
-25
Allotments Expenditures
Monthly Expenditure Comparison
Millions $
Jun-
15
May
-15
Apr
-15
Mar
-15
Feb-
15
Jan-
15
Dec
-14
Nov
-14
Oct
-14
Sep
-14
Aug
-14
Jul-1
4
Jun-
14
May
-14
Apr
-14
Mar
-14
Feb-
14
Jan-
14
Dec
-13
Nov
-13
Oct
-13
Sep
-13
Aug
-13
Jul-1
3
750
500
250
0
Allotments Expenditures
Cumulative toDate Expenditure Comparison
Millions $
73 Quarterly Financial Report Through September 2014
ConnelB
Typewritten Text
Variance to-Date: ($20.6) million overexpended (6.2)% overexpended
ConnelB
Line
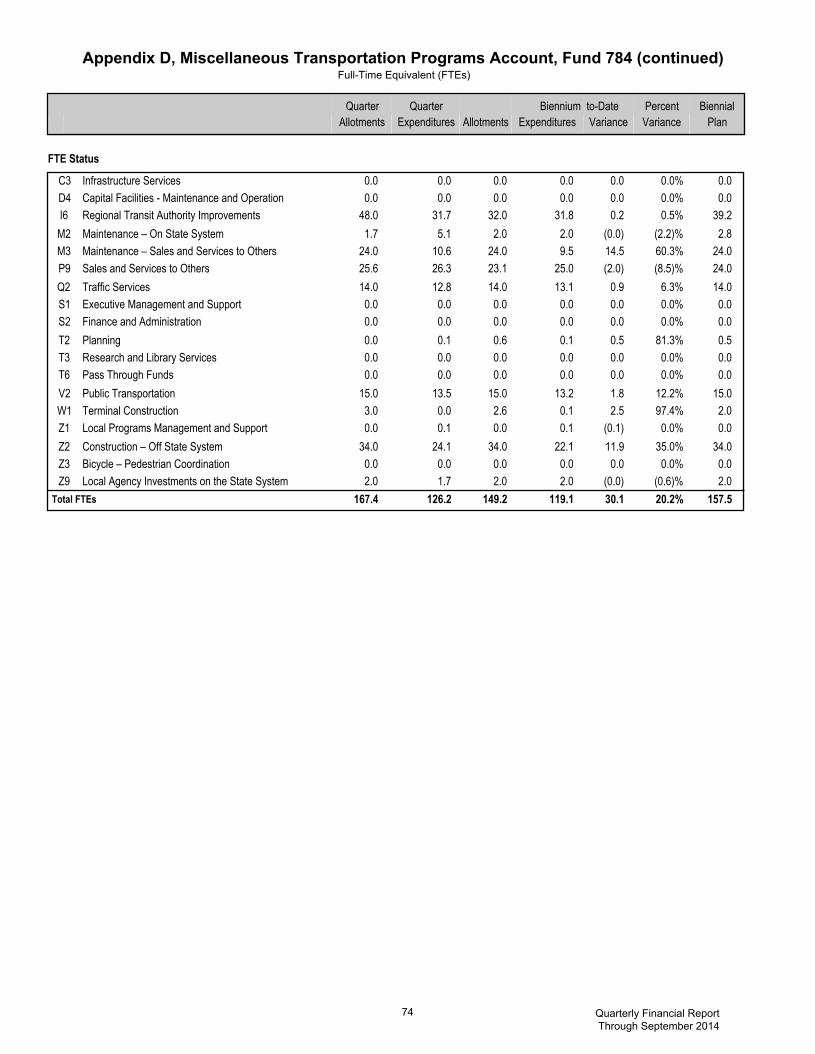
Appendix D, Miscellaneous Transportation Programs Account, Fund 784 (continued)FullTime Equivalent (FTEs)
Quarter Quarter Biennium toDate Percent Biennial Allotments Expenditures Allotments Expenditures Variance Variance Plan
C3D4I6M2M3P9Q2S1S2T2T3T6V2W1Z1Z2Z3Z9
Infrastructure ServicesCapital Facilities Maintenance and OperationRegional Transit Authority ImprovementsMaintenance – On State SystemMaintenance – Sales and Services to OthersSales and Services to OthersTraffic ServicesExecutive Management and SupportFinance and AdministrationPlanningResearch and Library ServicesPass Through FundsPublic TransportationTerminal ConstructionLocal Programs Management and SupportConstruction – Off State SystemBicycle – Pedestrian CoordinationLocal Agency Investments on the State System
0.00.048.01.724.025.614.00.00.00.00.00.015.03.00.034.00.02.0
0.00.031.75.110.626.312.80.00.00.10.00.013.50.00.124.10.01.7
0.00.032.02.024.023.114.00.00.00.60.00.015.02.60.034.00.02.0
0.00.031.82.09.525.013.10.00.00.10.00.013.20.10.122.10.02.0
0.00.00.2
(0.0)14.5(2.0)0.90.00.00.50.00.01.82.5
(0.1)11.90.0
(0.0)
0.0%0.0%0.5%
(2.2)%60.3%(8.5)%6.3%0.0%0.0%81.3%0.0%0.0%12.2%97.4%0.0%35.0%0.0%
(0.6)%
0.00.039.22.824.024.014.00.00.00.50.00.015.02.00.034.00.02.0
167.4 126.2 149.2 119.1 30.1 20.2% 157.5
FTE Status
Total FTEs
74 Quarterly Financial Report Through September 2014

Appendix D, Miscellaneous Transportation Programs Account, Fund 784 (Continued)
The Miscellaneous Transportation Programs Account (Fund 784) was created in 1997. It was established to track federal funds passed through to local governments, and for services the department provides to other public and private entities for which the department receives reimbursement. Fund 784 is “non-appropriated.” This account is also “non-budgeted,” which means that the department does not submit an allotment plan (a spending plan for each month in the biennium) for approval to the Office of Financial Management (OFM).
Although reimbursable services processed through Fund 784 are not subject to legislative appropriations or OFM allotment control, department programs must create a spending plan by month because this fund is subject to internal department expenditure controls.
Expenditures on behalf of other state agencies, as well as reimbursements, are recorded. For internal allotment procedures, reimbursable expenditures from other state agencies are shown in the spending plan as positive amounts but offset in total by negative amounts in Object S – Interagency Reimbursements. As such, net expenditures reported for other state agencies are equal to zero. There is no off-set in the spending plan for other public or private entities because those reimbursements are recorded in the accounting system as revenue, rather than as a negative expenditure.
Note: The department is directed by statute – RCW 47.04.220(7) – to provide an annual report to the Office of Financial Management and to the Legislative Transportation Committees on the activities in the Miscellaneous Transportation Programs account (Fund 784) and any recommended changes in the process. As the department has no recommendations for changes at this time, the report provided here fulfills this requirement.
Miscellaneous Transportation Programs Account Activities
Programs that use the Miscellaneous Transportation Programs Account (Fund 784) include:
Program C—Office of Information Technology
Program C’s reimbursable services relate to interagency agreements with state agencies and municipalities. Subprogram C3–Infrastructure Services includes reimbursable work performed on behalf of other state agencies and municipalities for network and fiber optic installation and co-location. Subprogram C5–Enterprise Applications performs reimbursable work on the Collision Location Accident System (CLAS) for Washington State Patrol (WSP).
Program D—Facilities
Program D uses Fund 784 to record expenditures and reimbursements from WSP for utilities and facility maintenance in Southwest Region where it uses a portion of the department’s facilities in Vancouver and at the section maintenance facility at Naselle; and to record expenditures for non-state agencies and private entities for which the program provides services, such as utilities used by the Wenatchee National Forest at a wireless communication site.
Program I—Improvements
The department provides project design services and construction project administration to the Central Puget Sound Regional Transit Authority (Sound Transit) for its regional express bus program. Projects involving the department include direct access ramps to state highways for Sound Transit buses and carpools and related high occupancy vehicle (HOV) and supporting facilities such as park and ride lots.
Program M—Highway Maintenance
Program M’s reimbursable services consist of maintenance work performed for cities and counties, as well as work performed for the federal government on roads that are not part of the state system.
75 Quarterly Financial Report Through September 2014
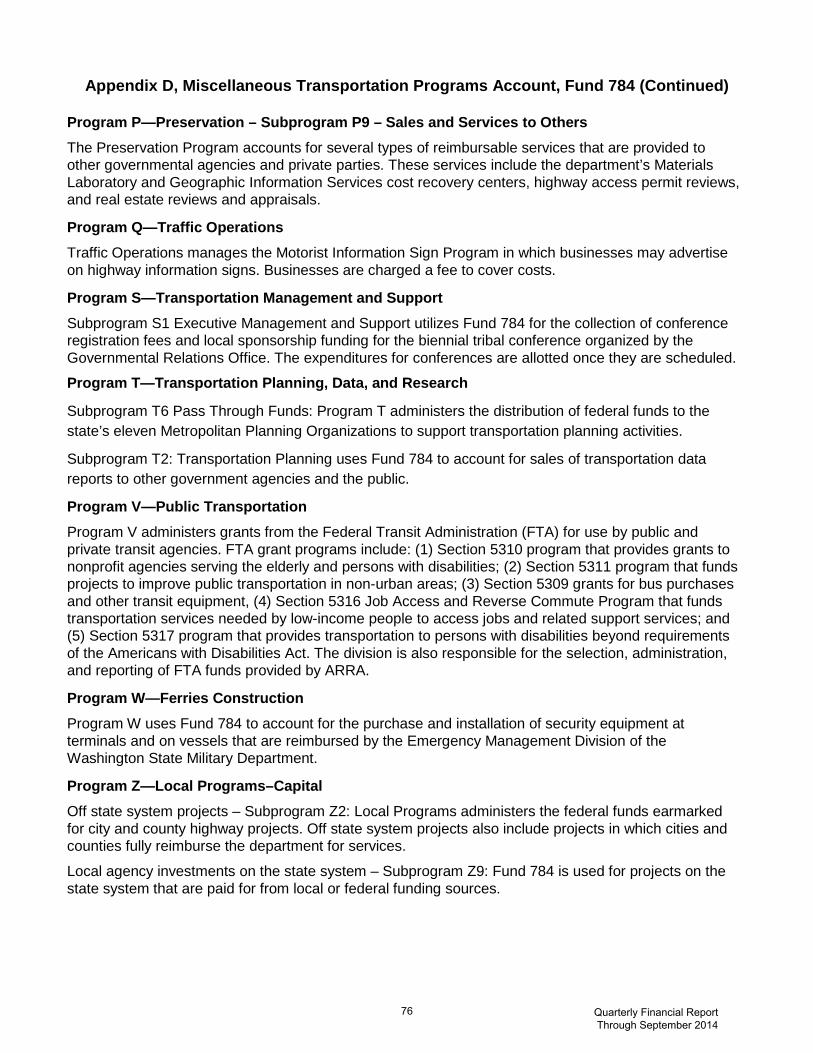
Appendix D, Miscellaneous Transportation Programs Account, Fund 784 (Continued)
Program P—Preservation – Subprogram P9 – Sales and Services to Others
The Preservation Program accounts for several types of reimbursable services that are provided to other governmental agencies and private parties. These services include the department’s Materials Laboratory and Geographic Information Services cost recovery centers, highway access permit reviews, and real estate reviews and appraisals.
Program Q—Traffic Operations
Traffic Operations manages the Motorist Information Sign Program in which businesses may advertise on highway information signs. Businesses are charged a fee to cover costs.
Program S—Transportation Management and Support
Subprogram S1 Executive Management and Support utilizes Fund 784 for the collection of conference registration fees and local sponsorship funding for the biennial tribal conference organized by the Governmental Relations Office. The expenditures for conferences are allotted once they are scheduled.
Program T—Transportation Planning, Data, and Research
Subprogram T6 Pass Through Funds: Program T administers the distribution of federal funds to the state’s eleven Metropolitan Planning Organizations to support transportation planning activities.
Subprogram T2: Transportation Planning uses Fund 784 to account for sales of transportation data reports to other government agencies and the public.
Program V—Public Transportation
Program V administers grants from the Federal Transit Administration (FTA) for use by public and private transit agencies. FTA grant programs include: (1) Section 5310 program that provides grants to nonprofit agencies serving the elderly and persons with disabilities; (2) Section 5311 program that funds projects to improve public transportation in non-urban areas; (3) Section 5309 grants for bus purchases and other transit equipment, (4) Section 5316 Job Access and Reverse Commute Program that funds transportation services needed by low-income people to access jobs and related support services; and (5) Section 5317 program that provides transportation to persons with disabilities beyond requirements of the Americans with Disabilities Act. The division is also responsible for the selection, administration, and reporting of FTA funds provided by ARRA.
Program W—Ferries Construction
Program W uses Fund 784 to account for the purchase and installation of security equipment at terminals and on vessels that are reimbursed by the Emergency Management Division of the Washington State Military Department.
Program Z—Local Programs–Capital
Off state system projects – Subprogram Z2: Local Programs administers the federal funds earmarked for city and county highway projects. Off state system projects also include projects in which cities and counties fully reimburse the department for services.
Local agency investments on the state system – Subprogram Z9: Fund 784 is used for projects on the state system that are paid for from local or federal funding sources.
76 Quarterly Financial Report Through September 2014

Appendix E, Advanced Environmental Mitigation Revolving Account (AEMRA) Project Funding
Quarter Quarter Biennial Expenditure Allotments Expenditures Allotments Expenditures Variance Plan Authority
Expenditure StatusAdv. Environmental Mitigation Revolving 0 0 0 0 0 0 0 0 Total Expenditures 0 0 0 0 0 0 0 0
Source of Funds (Account)Advanced Env. Mitigation Revolving 0 0 0 0 0 0 0 0 Total Funds 0 0 0 0 0 0 0 0
FTE Status 0 0 0 0 0 0 0 0
Percent Variance
Biennium to-Date
VARIANCE EXPLANATION
Advance Right of Way Revolving Account: No activity is planned at this time.
Project Funding History
Ref. # ProjectApproved Funding
Date Funding Approved
Expected Payback
DatePayment Received
1 North Fork Newaukum River Mitigation Bank (Teitzel) 1,700,000 12/24/1998 6/30/2018 partial2 Dillenbaugh Creek Mitigation Bank (Greenhill) 167,000 1/29/2004 6/30/2018 -3 Moses Lake Wetland Bank 260,000 12/24/1998 6/30/2018 partial4 South Sequim Bay Vicinity Projects 546,000 6/20/2002 6/30/2018 partial5 SR 101 Bogachiel River (SR101/SR110) 109,507 11/19/2002 6/30/2018 -6 Tarlett Slough Phase I (Acquisition) 293,000 6/24/2003 6/30/2016 partial7 Tarlett Slough Phase II (Development) 460,000 4/28/2009 6/30/2015 20138 SR 3 Belfair Area Widening and Safety 805,000 4/10/2009 9/30/2012 20129 Bainbridge Island Ferry Terminal Project 250,000 12/24/1998 6/30/2007 2006
10 I-405 Corridor Program 250,000 8/19/2002 6/30/2007 200611 I-405 Congestion Relief /Bus Rapid Transit 800,000 4/21/2003 6/30/2007 200612 SR 14 Southwest Region Mitigation Site 280,000 10/20/1999 6/30/2007 200013 Mt. Baker SR5/542 Safety Improvement Projects 375,000 11/30/2007 Cancelled -14 Deer Creek Loop Road to Agate Road 72,835 5/24/2002 6/30/2009 2009
Total 6,368,342 Shaded area - closed loans.
77 Quarterly Financial Report Through September 2014
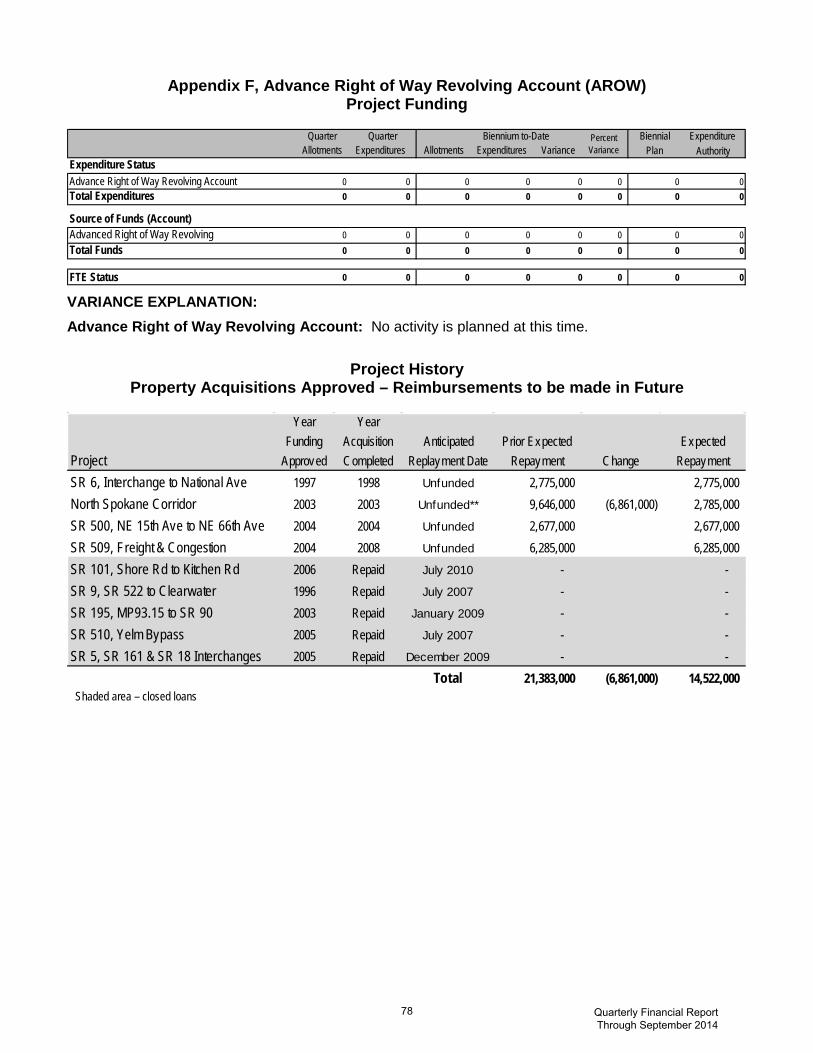
Appendix F, Advance Right of Way Revolving Account (AROW) Project Funding
Quarter Quarter Biennial Expenditure Allotments Expenditures Allotments Expenditures Variance Plan Authority
Expenditure StatusAdvance Right of Way Revolving Account 0 0 0 0 0 0 0 0Total Expenditures 0 0 0 0 0 0 0 0
Source of Funds (Account)Advanced Right of Way Revolving 0 0 0 0 0 0 0 0Total Funds 0 0 0 0 0 0 0 0
FTE Status 0 0 0 0 0 0 0 0
Percent Variance
Biennium to-Date
VARIANCE EXPLANATION:
Advance Right of Way Revolving Account: No activity is planned at this time.
Project History
Property Acquisitions Approved – Reimbursements to be made in Future
Project
Year Funding
Approved
Year Acquisition Completed
Anticipated Replayment Date
Prior Expected Repayment Change
Expected Repayment
SR 6, Interchange to National Ave 1997 1998 Unfunded 2,775,000 2,775,000 North Spokane Corridor 2003 2003 Unfunded** 9,646,000 (6,861,000) 2,785,000 SR 500, NE 15th Ave to NE 66th Ave 2004 2004 Unfunded 2,677,000 2,677,000 SR 509, Freight & Congestion 2004 2008 Unfunded 6,285,000 6,285,000 SR 101, Shore Rd to Kitchen Rd 2006 Repaid July 2010 - - SR 9, SR 522 to Clearwater 1996 Repaid July 2007 - - SR 195, MP93.15 to SR 90 2003 Repaid January 2009 - - SR 510, Yelm Bypass 2005 Repaid July 2007 - - SR 5, SR 161 & SR 18 Interchanges 2005 Repaid December 2009 - -
Total 21,383,000 (6,861,000) 14,522,000 Shaded area – closed loans
78 Quarterly Financial Report Through September 2014
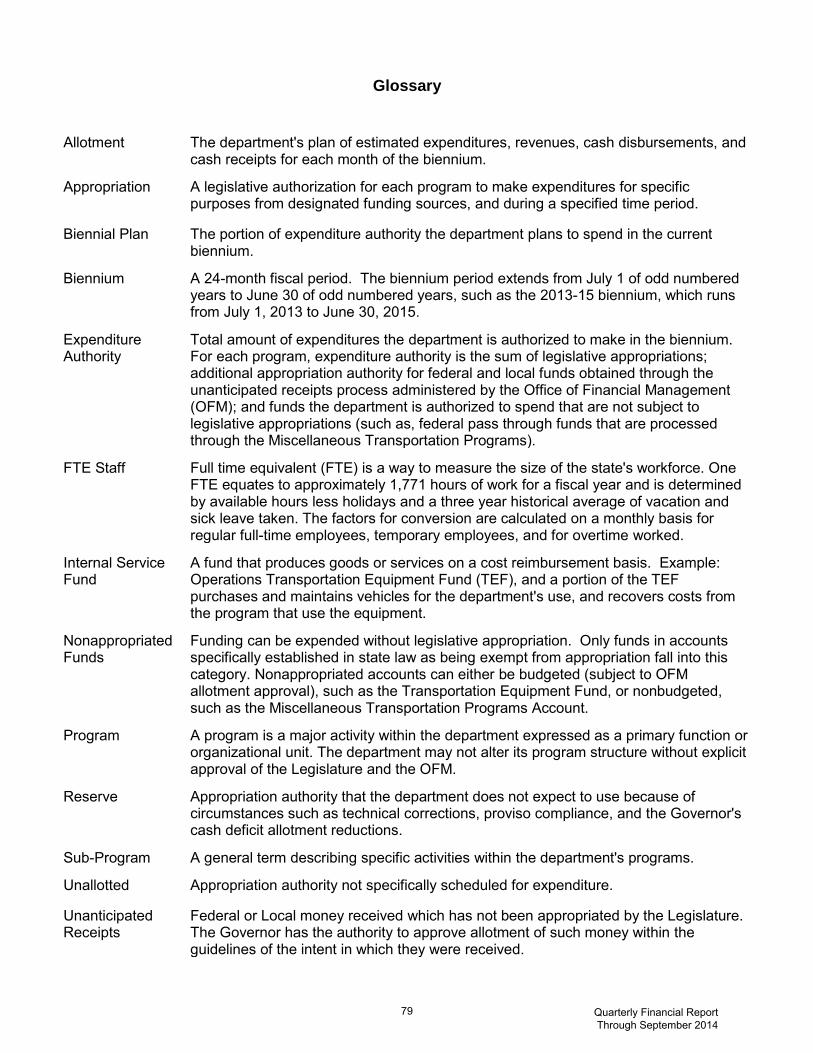
Glossary
Allotment
The department's plan of estimated expenditures, revenues, cash disbursements, and cash receipts for each month of the biennium.
Appropriation A legislative authorization for each program to make expenditures for specific purposes from designated funding sources, and during a specified time period.
Biennial Plan The portion of expenditure authority the department plans to spend in the current biennium.
Biennium A 24-month fiscal period. The biennium period extends from July 1 of odd numbered years to June 30 of odd numbered years, such as the 2013-15 biennium, which runs from July 1, 2013 to June 30, 2015.
Expenditure Authority
Total amount of expenditures the department is authorized to make in the biennium. For each program, expenditure authority is the sum of legislative appropriations; additional appropriation authority for federal and local funds obtained through the unanticipated receipts process administered by the Office of Financial Management (OFM); and funds the department is authorized to spend that are not subject to legislative appropriations (such as, federal pass through funds that are processed through the Miscellaneous Transportation Programs).
FTE Staff Full time equivalent (FTE) is a way to measure the size of the state's workforce. One FTE equates to approximately 1,771 hours of work for a fiscal year and is determined by available hours less holidays and a three year historical average of vacation and sick leave taken. The factors for conversion are calculated on a monthly basis for regular full-time employees, temporary employees, and for overtime worked.
Internal Service Fund
A fund that produces goods or services on a cost reimbursement basis. Example: Operations Transportation Equipment Fund (TEF), and a portion of the TEF purchases and maintains vehicles for the department's use, and recovers costs from the program that use the equipment.
Nonappropriated Funds
Funding can be expended without legislative appropriation. Only funds in accounts specifically established in state law as being exempt from appropriation fall into this category. Nonappropriated accounts can either be budgeted (subject to OFM allotment approval), such as the Transportation Equipment Fund, or nonbudgeted, such as the Miscellaneous Transportation Programs Account.
Program A program is a major activity within the department expressed as a primary function or organizational unit. The department may not alter its program structure without explicit approval of the Legislature and the OFM.
Reserve Appropriation authority that the department does not expect to use because of circumstances such as technical corrections, proviso compliance, and the Governor's cash deficit allotment reductions.
Sub-Program A general term describing specific activities within the department's programs.
Unallotted Appropriation authority not specifically scheduled for expenditure.
Unanticipated Receipts
Federal or Local money received which has not been appropriated by the Legislature. The Governor has the authority to approve allotment of such money within the guidelines of the intent in which they were received.
79 Quarterly Financial Report Through September 2014