20120501 - Introduction to Dataflow
84
Gruppo di Misure Meccaniche e Termiche UNIBS - DIMI A. Virtual Instruments (VIs) The appearance and operation of VIs imitate physical instruments, such as oscilloscopes and digital multimeters. Virtual Instrument (VI) – A LabVIEW program
-
Upload
luis-armando-reyes-cardoso -
Category
Documents
-
view
230 -
download
0
Transcript of 20120501 - Introduction to Dataflow

7/28/2019 20120501 - Introduction to Dataflow
http://slidepdf.com/reader/full/20120501-introduction-to-dataflow 1/84
Gruppo di Misure Meccaniche e TermicheUNIBS - DIMI
A. Virtual Instruments (VIs)
The appearance and operation of VIs imitate physical instruments,
such as oscilloscopes and digital multimeters.
Virtual Instrument (VI) – A LabVIEWprogram

7/28/2019 20120501 - Introduction to Dataflow
http://slidepdf.com/reader/full/20120501-introduction-to-dataflow 2/84
Gruppo di Misure Meccaniche e TermicheUNIBS - DIMI
B. Parts of a VI
LabVIEW VIs contain three main components:
1. Front Panel 2. Block Diagram 3. Icon/Connector Pane
7/28/2019 20120501 - Introduction to Dataflow
http://slidepdf.com/reader/full/20120501-introduction-to-dataflow 3/84
Gruppo di Misure Meccaniche e TermicheUNIBS - DIMI
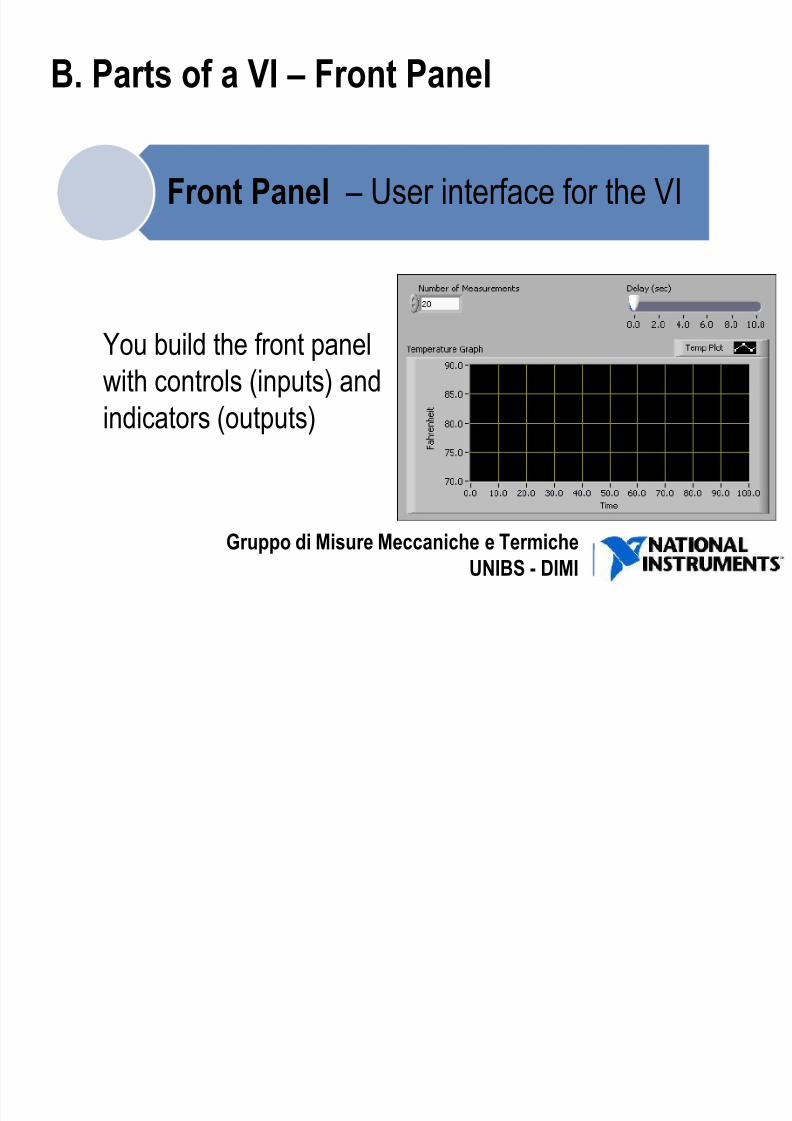
B. Parts of a VI – Front Panel
You build the front panel
with controls (inputs) and
indicators (outputs)
Front Panel – User interface for the VI
7/28/2019 20120501 - Introduction to Dataflow
http://slidepdf.com/reader/full/20120501-introduction-to-dataflow 4/84
Gruppo di Misure Meccaniche e TermicheUNIBS - DIMI
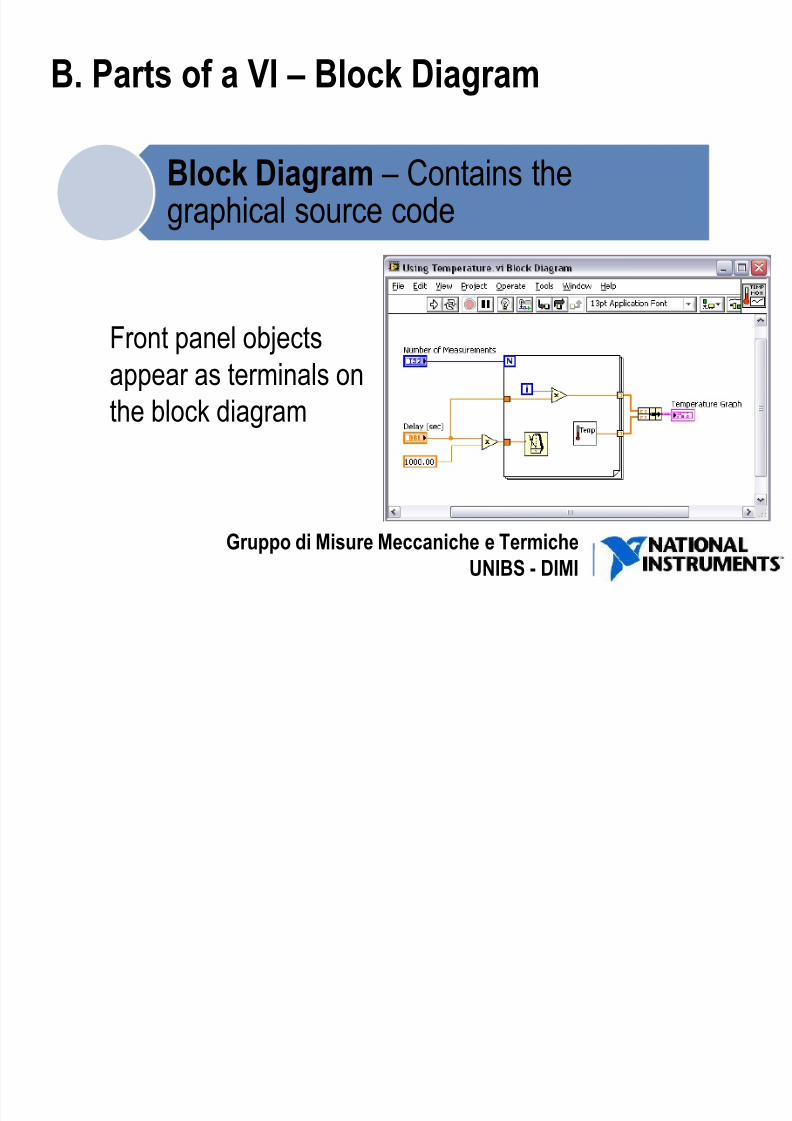
B. Parts of a VI – Block Diagram
Front panel objects
appear as terminals on
the block diagram
Block Diagram – Contains thegraphical source code

7/28/2019 20120501 - Introduction to Dataflow
http://slidepdf.com/reader/full/20120501-introduction-to-dataflow 5/84
Gruppo di Misure Meccaniche e TermicheUNIBS - DIMI
B. Parts of a VI – Icon/Connector Pane
• Icon: graphical representation of a VI
• Connector Pane: map of the inputs and outputs of a VI
• Icons and connector panes are necessary to use a VI as
a subVI− A subVI is a VI that is inside of another VI
− Similar to a function in a text-based programming
language
Icon Connector Pane
7/28/2019 20120501 - Introduction to Dataflow
http://slidepdf.com/reader/full/20120501-introduction-to-dataflow 6/84
Gruppo di Misure Meccaniche e TermicheUNIBS - DIMI
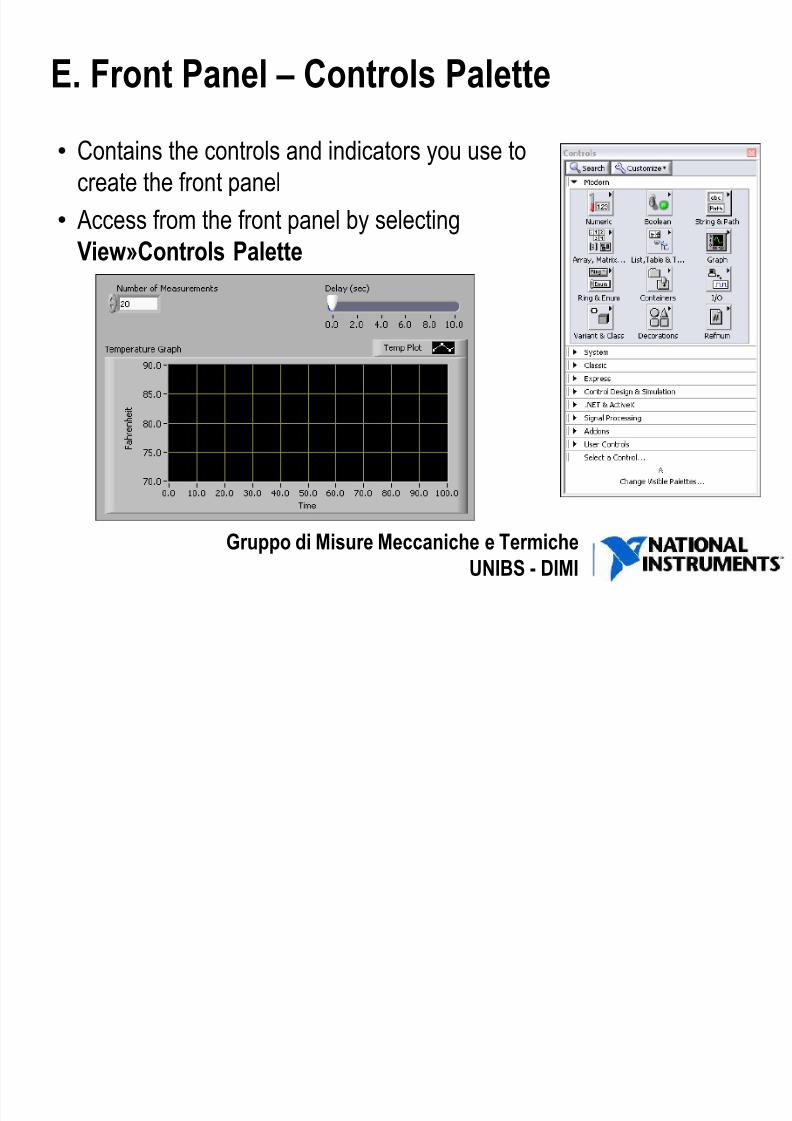
E. Front Panel – Controls Palette
• Contains the controls and indicators you use to
create the front panel
• Access from the front panel by selecting
View»Controls Palette
7/28/2019 20120501 - Introduction to Dataflow
http://slidepdf.com/reader/full/20120501-introduction-to-dataflow 7/84
Gruppo di Misure Meccaniche e TermicheUNIBS - DIMI
E. Front Panel – Controls & Indicators
• Controls
− Knobs, push buttons, dials, and other input devices
− Simulate instrument input devices and supply data to the block
diagram of the VI• Indicators
− Graphs, LEDs, and other displays
− Simulate instrument output devices and display data the block
diagram acquires or generates

7/28/2019 20120501 - Introduction to Dataflow
http://slidepdf.com/reader/full/20120501-introduction-to-dataflow 8/84
Gruppo di Misure Meccaniche e TermicheUNIBS - DIMI
E. Front Panel – Numeric Controls/Indicators
The numeric data type can represent numbers of various
types, such as integer or real
Numeric Indicator
Numeric Control
Increment/Decrement Buttons
7/28/2019 20120501 - Introduction to Dataflow
http://slidepdf.com/reader/full/20120501-introduction-to-dataflow 9/84
Gruppo di Misure Meccaniche e TermicheUNIBS - DIMI
E. Front Panel – Boolean Controls/Indicators
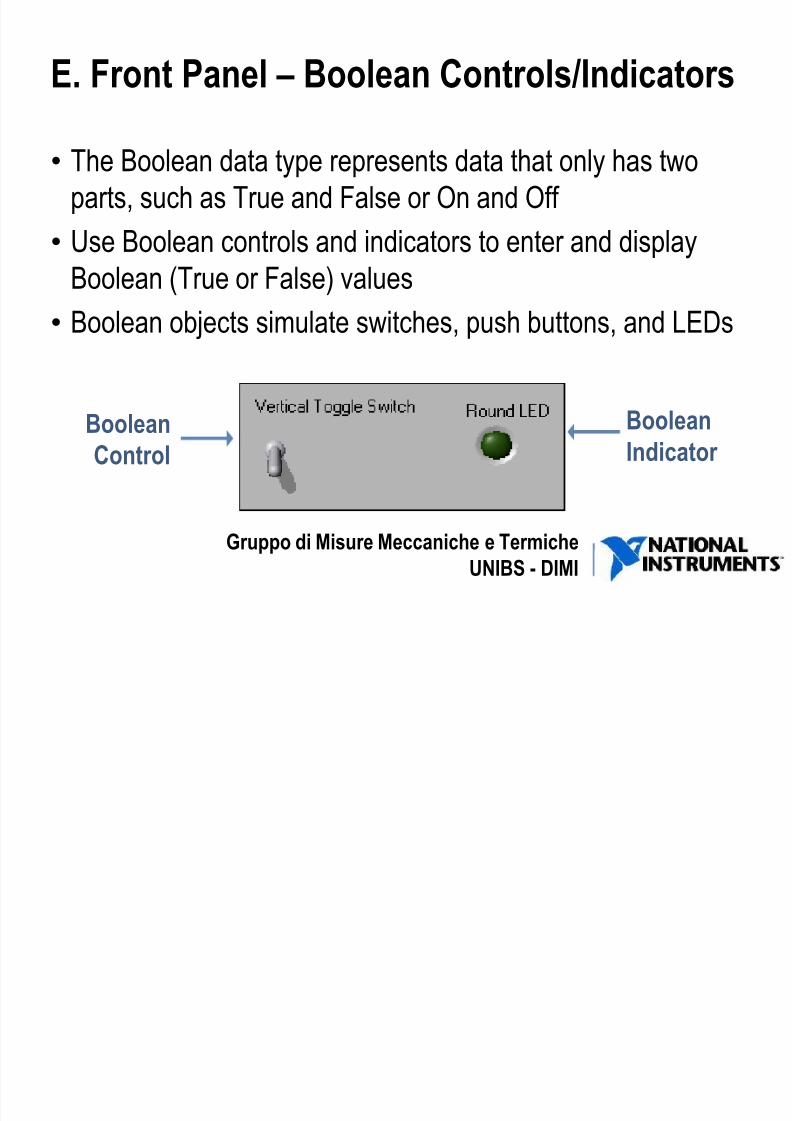
• The Boolean data type represents data that only has two
parts, such as True and False or On and Off
• Use Boolean controls and indicators to enter and display
Boolean (True or False) values• Boolean objects simulate switches, push buttons, and LEDs
BooleanControl
BooleanIndicator
7/28/2019 20120501 - Introduction to Dataflow
http://slidepdf.com/reader/full/20120501-introduction-to-dataflow 10/84
Gruppo di Misure Meccaniche e TermicheUNIBS - DIMI
E. Front Panel – Strings
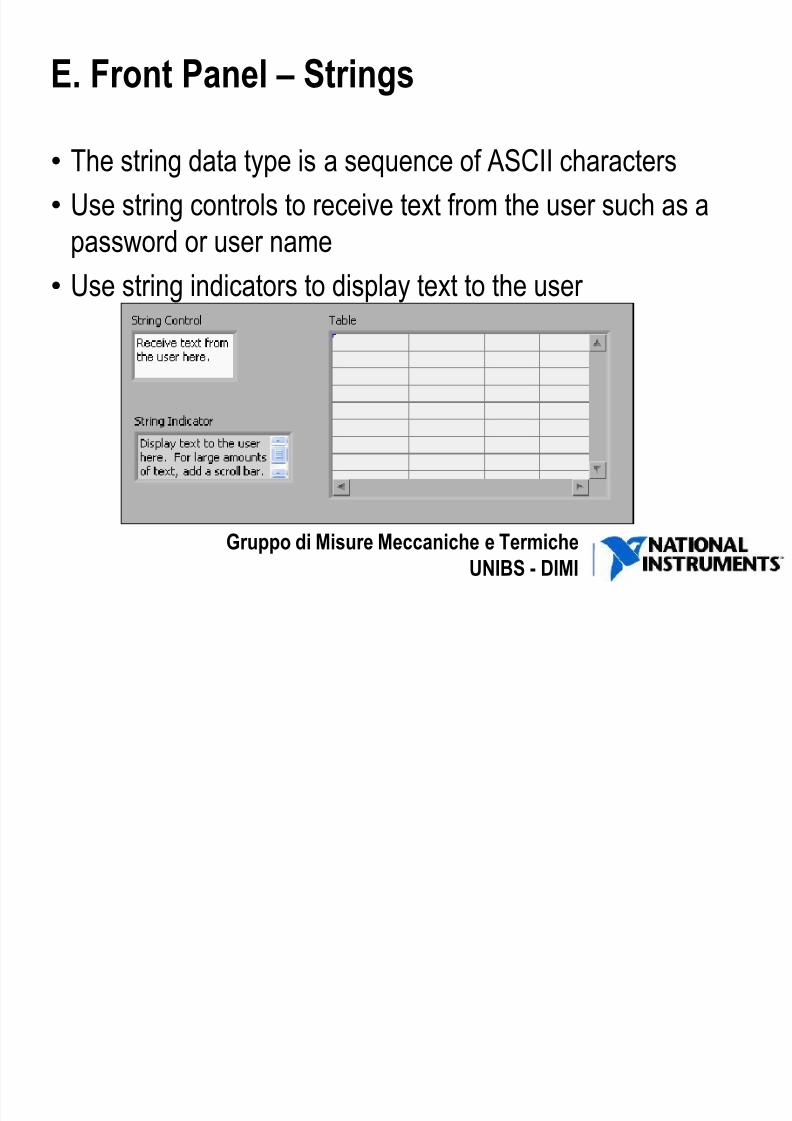
• The string data type is a sequence of ASCII characters
• Use string controls to receive text from the user such as a
password or user name
• Use string indicators to display text to the user
7/28/2019 20120501 - Introduction to Dataflow
http://slidepdf.com/reader/full/20120501-introduction-to-dataflow 11/84
Gruppo di Misure Meccaniche e TermicheUNIBS - DIMI
E. Front Panel – Shortcut Menus
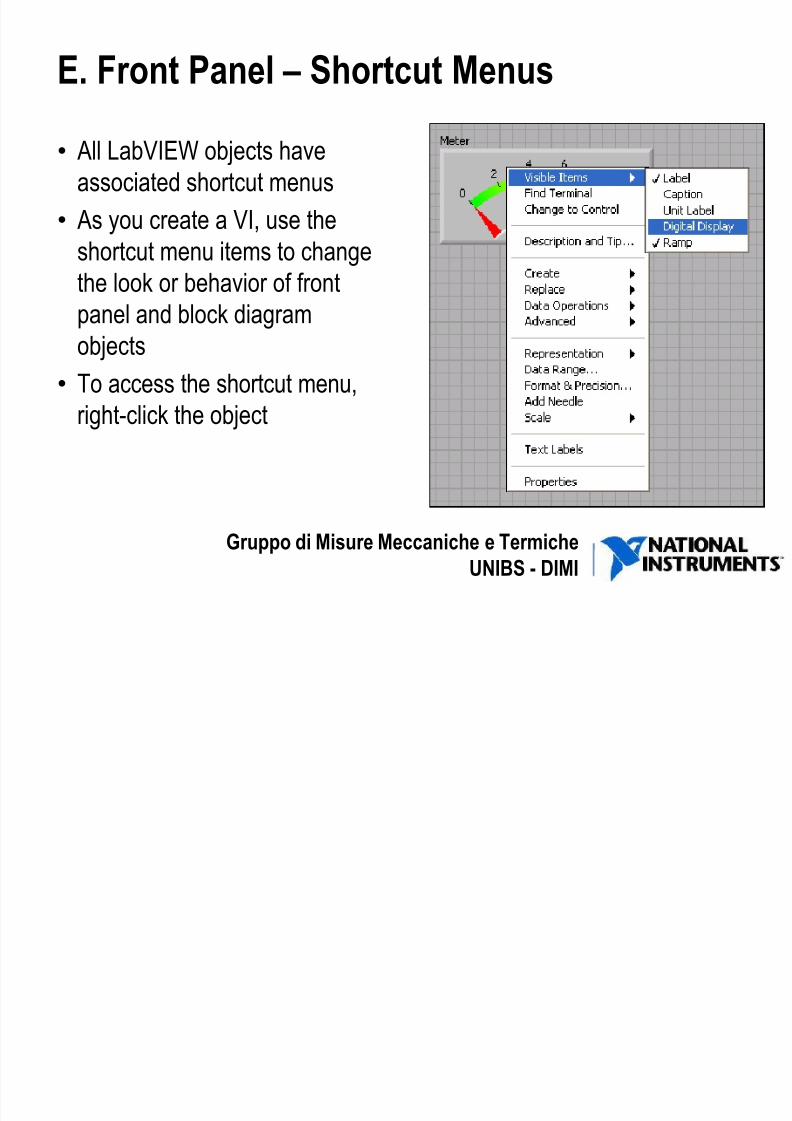
• All LabVIEW objects have
associated shortcut menus
• As you create a VI, use the
shortcut menu items to change
the look or behavior of frontpanel and block diagram
objects
• To access the shortcut menu,
right-click the object

7/28/2019 20120501 - Introduction to Dataflow
http://slidepdf.com/reader/full/20120501-introduction-to-dataflow 12/84
Gruppo di Misure Meccaniche e TermicheUNIBS - DIMI
E. Front Panel – Property Dialog Box
• Right-click a front panel
object and select
Properties to display
• The options available on
the property dialog boxare similar to the options
available on the shortcut
menu for that object
7/28/2019 20120501 - Introduction to Dataflow
http://slidepdf.com/reader/full/20120501-introduction-to-dataflow 13/84
Gruppo di Misure Meccaniche e Termiche
UNIBS - DIMI
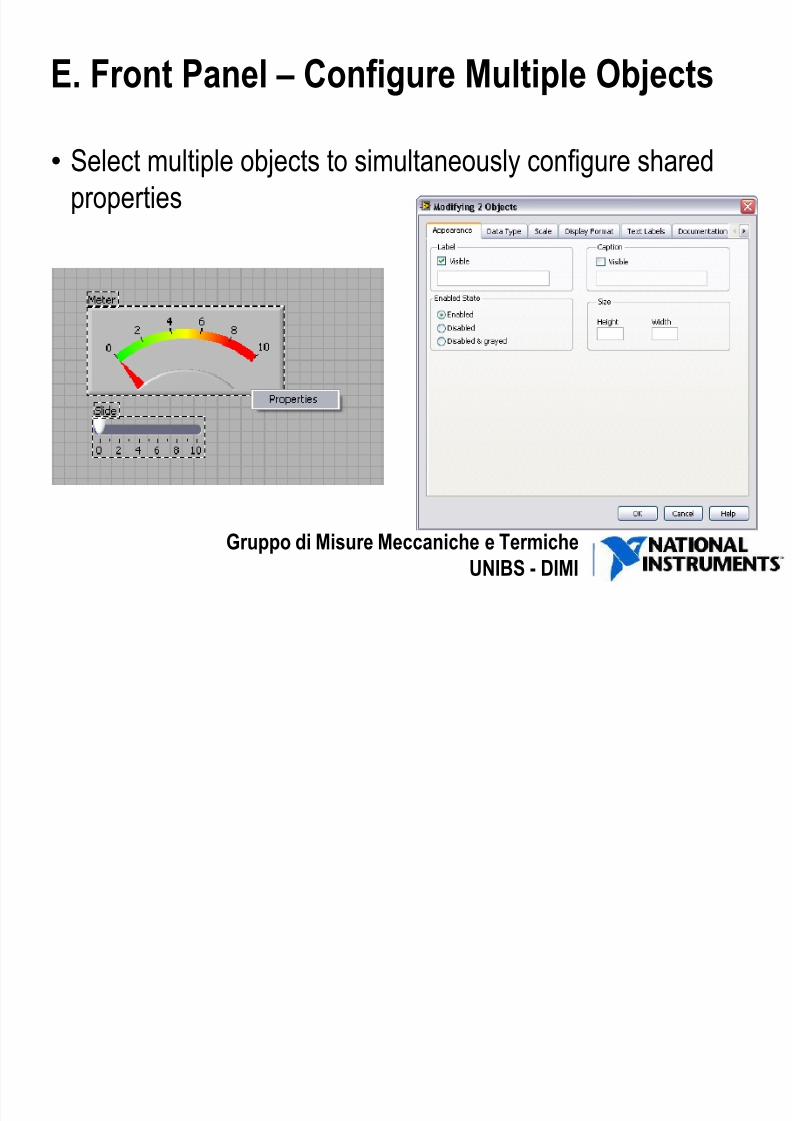
E. Front Panel – Configure Multiple Objects
• Select multiple objects to simultaneously configure shared
properties
7/28/2019 20120501 - Introduction to Dataflow
http://slidepdf.com/reader/full/20120501-introduction-to-dataflow 14/84
Gruppo di Misure Meccaniche e Termiche
UNIBS - DIMI
Configuring Your LabVIEW Environment
• Functions Palette
− Tack the Functions palette and select Customize»Change
Visible Categories then click Select All
• Controls Palette− Tack the Controls palette and select Customize»Change
Visible Categories then click Select All

7/28/2019 20120501 - Introduction to Dataflow
http://slidepdf.com/reader/full/20120501-introduction-to-dataflow 15/84
Gruppo di Misure Meccaniche e Termiche
UNIBS - DIMI
Pratice
Replicate the following front panel

7/28/2019 20120501 - Introduction to Dataflow
http://slidepdf.com/reader/full/20120501-introduction-to-dataflow 16/84
Gruppo di Misure Meccaniche e Termiche
UNIBS - DIMI
F. Block Diagram
Block diagram objects include the
following:
• Terminals
• SubVIs• Functions
• Constants
•Structures
• Wires

7/28/2019 20120501 - Introduction to Dataflow
http://slidepdf.com/reader/full/20120501-introduction-to-dataflow 17/84
Gruppo di Misure Meccaniche e Termiche
UNIBS - DIMI
F. Block Diagram – Terminals
• Terminals are:
− Block diagram appearance of front panel objects
− Entry and exit ports that exchange information between the
front panel and block diagram− Analogous to parameters and constants in text-based
programming languages
• Change the view type of a terminal by toggling the View as
Icon selection from the context menu

7/28/2019 20120501 - Introduction to Dataflow
http://slidepdf.com/reader/full/20120501-introduction-to-dataflow 18/84
Gruppo di Misure Meccaniche e Termiche
UNIBS - DIMI
F. Block Diagram Terminals
7/28/2019 20120501 - Introduction to Dataflow
http://slidepdf.com/reader/full/20120501-introduction-to-dataflow 19/84
Gruppo di Misure Meccaniche e Termiche
UNIBS - DIMI
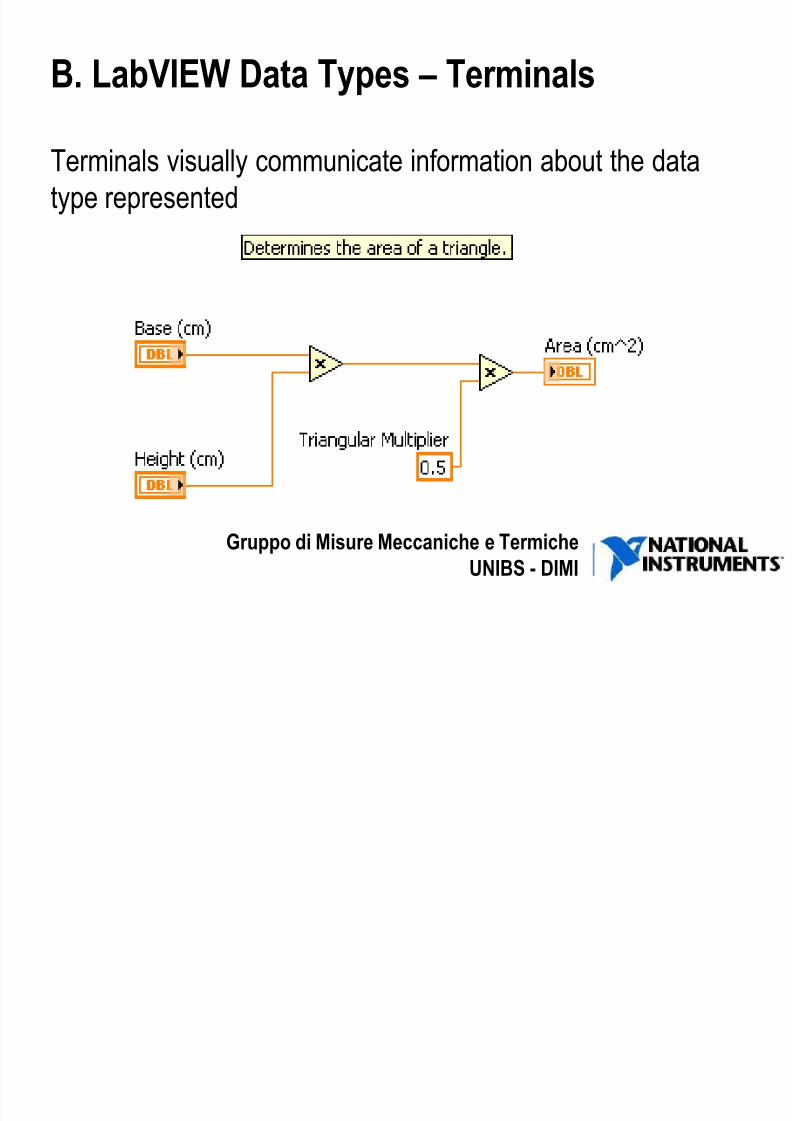
B. LabVIEW Data Types – Terminals
Terminals visually communicate information about the data
type represented
7/28/2019 20120501 - Introduction to Dataflow
http://slidepdf.com/reader/full/20120501-introduction-to-dataflow 20/84
Gruppo di Misure Meccaniche e Termiche
UNIBS - DIMI
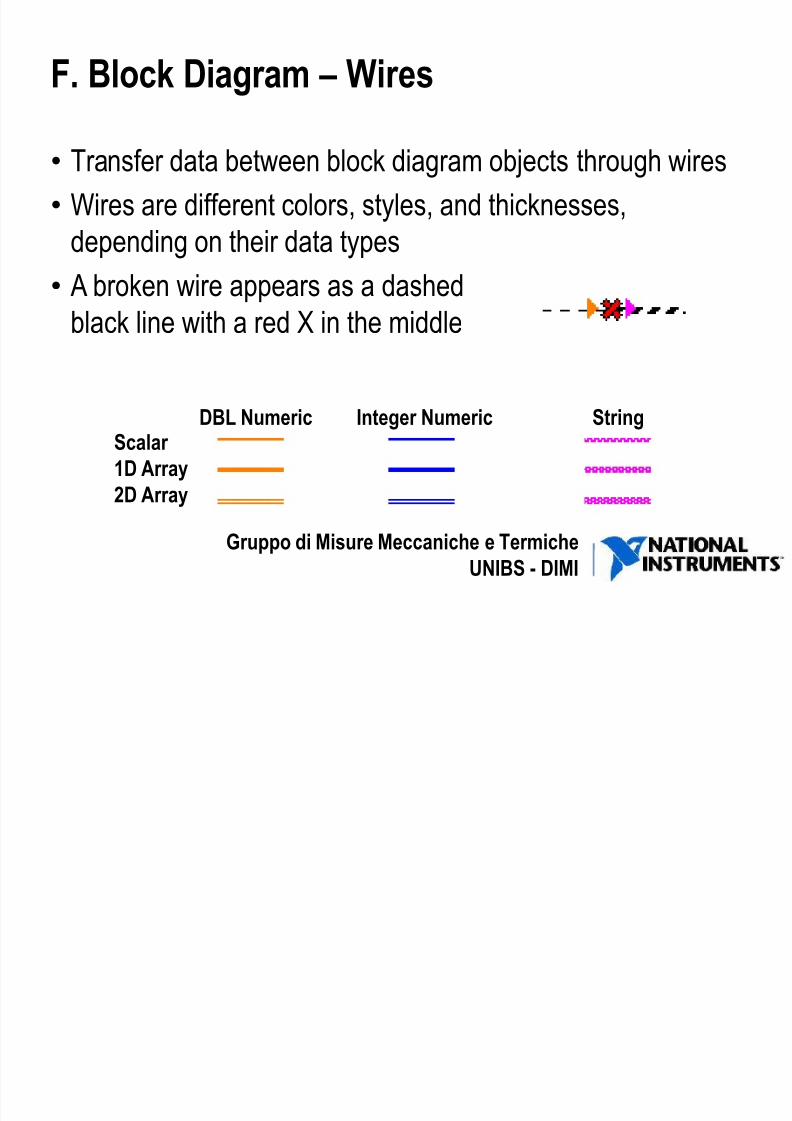
F. Block Diagram – Wires
• Transfer data between block diagram objects through wires
• Wires are different colors, styles, and thicknesses,
depending on their data types
• A broken wire appears as a dashedblack line with a red X in the middle
Scalar
1D Array
2D Array
DBL Numeric Integer Numeric String
7/28/2019 20120501 - Introduction to Dataflow
http://slidepdf.com/reader/full/20120501-introduction-to-dataflow 21/84
Gruppo di Misure Meccaniche e Termiche
UNIBS - DIMI
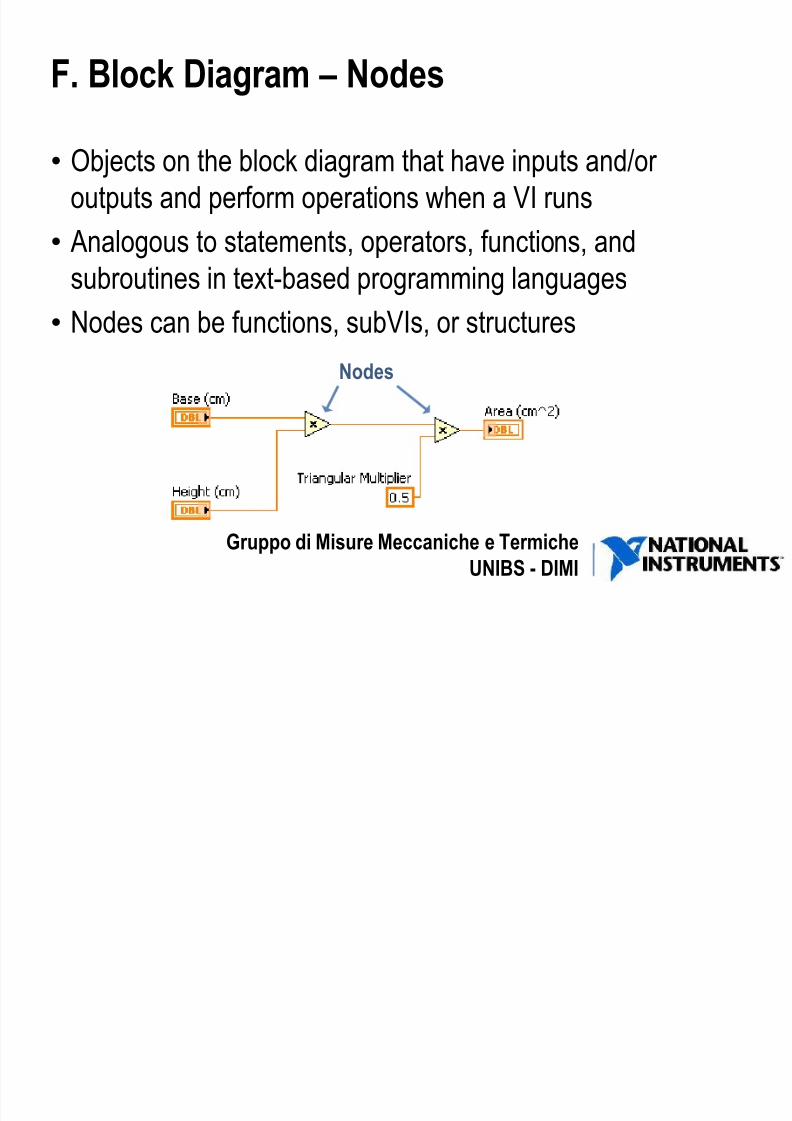
F. Block Diagram – Nodes
• Objects on the block diagram that have inputs and/or
outputs and perform operations when a VI runs
• Analogous to statements, operators, functions, and
subroutines in text-based programming languages• Nodes can be functions, subVIs, or structures
Nodes

7/28/2019 20120501 - Introduction to Dataflow
http://slidepdf.com/reader/full/20120501-introduction-to-dataflow 22/84
Gruppo di Misure Meccaniche e Termiche
UNIBS - DIMI
H. Selecting A Tool
• Create, modify, and debug VIs
using the tools provided by LabVIEW
• A tool is a special operating mode of the
mouse cursor • The operating mode of the cursor corresponds to the icon of
the tool selected
•
When using the Automatic Tool Selection, LabVIEWchooses which tool to select based on the current location of
the mouse

7/28/2019 20120501 - Introduction to Dataflow
http://slidepdf.com/reader/full/20120501-introduction-to-dataflow 23/84
Gruppo di Misure Meccaniche e Termiche
UNIBS - DIMI
Practice
Look and the block diagram of the previous practice and addthe following nodes:
• Add
•Multiply
•Random number •Greater than
•Less than
•Get date/time in seconds
Then use wires to connect all the elements of the blockdiagram leaving no terminal unconnected.
Target:
Simulate a given temperature value,
add a random noise of given amplitude,
then light up an alert when such atemperature is greater than setpoint and
another if is less than setpoint .

7/28/2019 20120501 - Introduction to Dataflow
http://slidepdf.com/reader/full/20120501-introduction-to-dataflow 24/84
Gruppo di Misure Meccaniche e Termiche
UNIBS - DIMI
Practice solution

7/28/2019 20120501 - Introduction to Dataflow
http://slidepdf.com/reader/full/20120501-introduction-to-dataflow 25/84
Gruppo di Misure Meccaniche e Termiche
UNIBS - DIMI
F. Block Diagram – Function Nodes
• Fundamental operating elements of LabVIEW
• Do not have front panels or block diagrams, but do have
connector panes
• Double-clicking a function only selects the function – doesnot open it like a VI
• Has a pale yellow background on its icon

7/28/2019 20120501 - Introduction to Dataflow
http://slidepdf.com/reader/full/20120501-introduction-to-dataflow 26/84
Gruppo di Misure Meccaniche e Termiche
UNIBS - DIMI
F. Block Diagram – SubVI Nodes
• SubVI: VIs that you build to use inside of another VI
• Any VI has the potential to be used as a subVI
• When you double-click a subVI on the block diagram, you
can view the front panel and block diagram of the subVI− The upper right corner of the front panel and block diagram
displays the icon for the current VI
− This is the icon that appears when you place the VI on a blockdiagram as a subVI

7/28/2019 20120501 - Introduction to Dataflow
http://slidepdf.com/reader/full/20120501-introduction-to-dataflow 27/84
Gruppo di Misure Meccaniche e Termiche
UNIBS - DIMI
F. Block Diagram – Wires
• Transfer data between block diagram objects through wires
• Wires are different colors, styles, and thicknesses,
depending on their data types
• A broken wire appears as a dashedblack line with a red X in the middle
Scalar
1D Array
2D Array
DBL Numeric Integer Numeric String

7/28/2019 20120501 - Introduction to Dataflow
http://slidepdf.com/reader/full/20120501-introduction-to-dataflow 28/84
Gruppo di Misure Meccaniche e Termiche
UNIBS - DIMI
B. LabVIEW Data Types – Terminals
Terminals visually communicate information about the data
type represented

7/28/2019 20120501 - Introduction to Dataflow
http://slidepdf.com/reader/full/20120501-introduction-to-dataflow 29/84
Gruppo di Misure Meccaniche e Termiche
UNIBS - DIMI
B. LabVIEW Data Types – Numerics
• The numeric data type represents
numbers of various types
• To change the representation
of a numeric, right-click thecontrol, indicator, or constant,
and select Representation
from the shortcut menu

7/28/2019 20120501 - Introduction to Dataflow
http://slidepdf.com/reader/full/20120501-introduction-to-dataflow 30/84
Gruppo di Misure Meccaniche e Termiche
UNIBS - DIMI
B. LabVIEW Data Types – Boolean
• Behavior of Boolean controls is specified by the mechanical
action
• In LabVIEW, the Boolean
data type is representedwith the color green

7/28/2019 20120501 - Introduction to Dataflow
http://slidepdf.com/reader/full/20120501-introduction-to-dataflow 31/84
Gruppo di Misure Meccaniche e Termiche
UNIBS - DIMI
Mechanical Action of Booleans
Use the Mechanical Action of Booleans VI located in the NI
Example Finder to learn about the different switch and latch
actions.

7/28/2019 20120501 - Introduction to Dataflow
http://slidepdf.com/reader/full/20120501-introduction-to-dataflow 32/84
Gruppo di Misure Meccaniche e Termiche
UNIBS - DIMI
B. Data Types – String
• A sequence of displayable or non-displayable ASCII characters
• On the front panel, strings appear as tables,text entry boxes, and labels
• Change the display type from the short-cutmenu: Normal, ‘\’ Codes, Password and Hex
• Edit and manipulate strings with the String functions on the
block diagram• In LabVIEW, the string data type is represented with the
color pink

7/28/2019 20120501 - Introduction to Dataflow
http://slidepdf.com/reader/full/20120501-introduction-to-dataflow 33/84
Gruppo di Misure Meccaniche e Termiche
UNIBS - DIMI
B. Data Types – Enum
An enum
represents a
pair of values,
a string and anumeric, where the
enum can be one
of a defined list of
values

7/28/2019 20120501 - Introduction to Dataflow
http://slidepdf.com/reader/full/20120501-introduction-to-dataflow 34/84
Gruppo di Misure Meccaniche e Termiche
UNIBS - DIMI
B. Data Types – Enum
• Enum: enumerated
control, constant, or
indicator
• Enums are useful because it is easier to manipulate numbers than strings
on the block diagram

7/28/2019 20120501 - Introduction to Dataflow
http://slidepdf.com/reader/full/20120501-introduction-to-dataflow 35/84
Gruppo di Misure Meccaniche e Termiche
UNIBS - DIMI
B. Data Types – Dynamic
• Stores the information generated or acquired by an Express
VI
• Non-Express VIs do not accept the dynamic data type
− To use a built-in VI or function to analyze or process thedynamic data type, you must convert the data type
− Numeric, waveform, or Boolean data indicators or inputs
automatically convert the dynamic data type when wired
• In LabVIEW, the dynamic data type is represented with the
color dark blue

7/28/2019 20120501 - Introduction to Dataflow
http://slidepdf.com/reader/full/20120501-introduction-to-dataflow 36/84
Gruppo di Misure Meccaniche e Termiche
UNIBS - DIMI
F. Block Diagram – Wiring Tips
• Press <Ctrl>-B to delete all broken wires
• Right-click and select Clean Up Wire to reroute the wire

7/28/2019 20120501 - Introduction to Dataflow
http://slidepdf.com/reader/full/20120501-introduction-to-dataflow 37/84
Gruppo di Misure Meccaniche e Termiche
UNIBS - DIMI
F. Block Diagram – Wiring Tips
Use the Clean Up Diagram tool to reroute multiple wires and
objects to improve readability
1. Select a section of your block diagram
2. Click the Clean Up Diagram button on the block diagramtoolbar

7/28/2019 20120501 - Introduction to Dataflow
http://slidepdf.com/reader/full/20120501-introduction-to-dataflow 38/84
Gruppo di Misure Meccaniche e Termiche
UNIBS - DIMI
I. Dataflow
LabVIEW follows a dataflow model for running VIs
• A node executes only when data are available at all of its
input terminals
• A node supplies data to the output terminals only when thenode finishes execution
7/28/2019 20120501 - Introduction to Dataflow
http://slidepdf.com/reader/full/20120501-introduction-to-dataflow 39/84
Gruppo di Misure Meccaniche e Termiche
UNIBS - DIMI
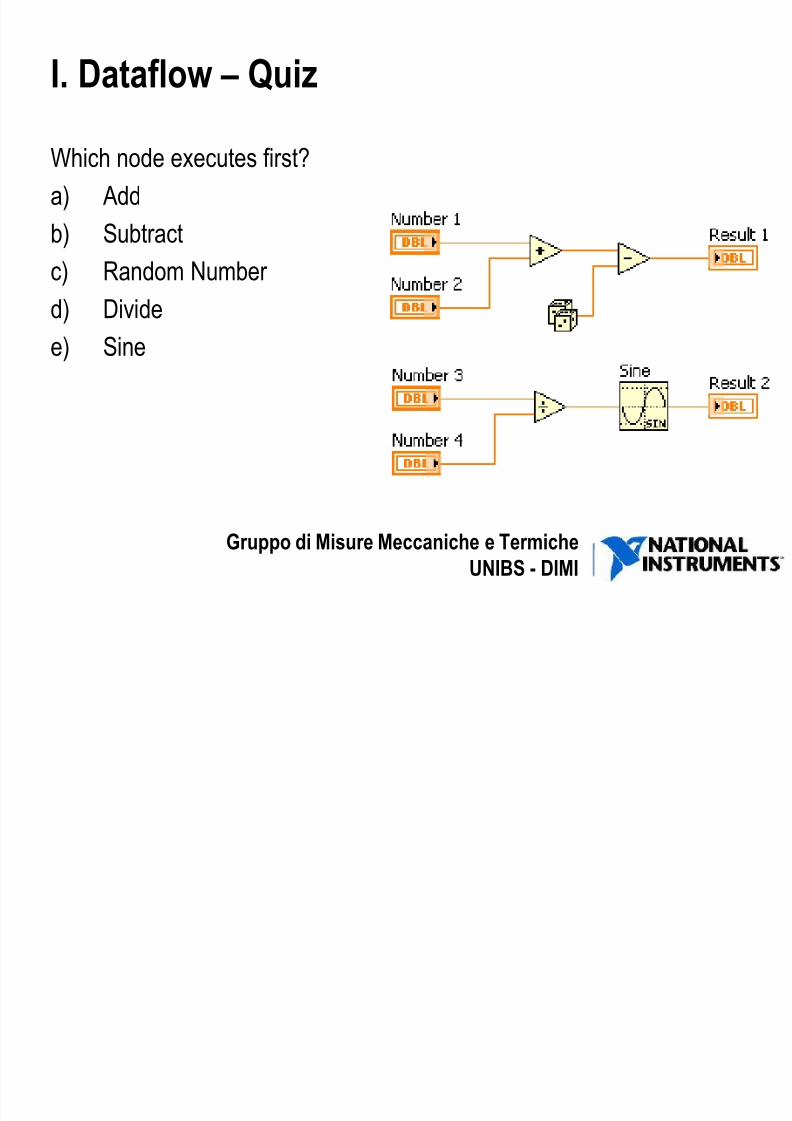
I. Dataflow – Quiz
Which node executes first?
a) Add
b) Subtract
c) Random Number d) Divide
e) Sine

7/28/2019 20120501 - Introduction to Dataflow
http://slidepdf.com/reader/full/20120501-introduction-to-dataflow 40/84
Gruppo di Misure Meccaniche e Termiche
UNIBS - DIMI
I. Dataflow – Quiz Answers
NO CORRECT ANSWER
Which node executes first?
a) Add –
possibly b) Subtract – definitely not
c) Random Number – possibly
d) Divide – possibly
e) Sine –
definitely not

7/28/2019 20120501 - Introduction to Dataflow
http://slidepdf.com/reader/full/20120501-introduction-to-dataflow 41/84
Gruppo di Misure Meccaniche e Termiche
UNIBS - DIMI
Summary—Quiz
1. Which function executes first: Add or Subtract?
a) Add
b) Subtract
c) Unknown

7/28/2019 20120501 - Introduction to Dataflow
http://slidepdf.com/reader/full/20120501-introduction-to-dataflow 42/84
Gruppo di Misure Meccaniche e Termiche
UNIBS - DIMI
Summary—Quiz Answer
1. Which function executes first: Add or Subtract?
a) Add
b) Subtract
c) Unknown

7/28/2019 20120501 - Introduction to Dataflow
http://slidepdf.com/reader/full/20120501-introduction-to-dataflow 43/84
Gruppo di Misure Meccaniche e Termiche
UNIBS - DIMI
I. Case Structures
•
Have two or more subdiagrams or cases• Execute and displays only one case at a time
• An input value determines which subdiagram to execute
•
Similar tocase
statements or if...then...else
statements in text-based programming languages

7/28/2019 20120501 - Introduction to Dataflow
http://slidepdf.com/reader/full/20120501-introduction-to-dataflow 44/84
Gruppo di Misure Meccaniche e Termiche
UNIBS - DIMI
I. Case Structures
• Case Selector Label: contains the name of the current caseand decrement and increment buttons on each side
• Selector Terminal: Wire an input value, or selector, todetermine which case executes

7/28/2019 20120501 - Introduction to Dataflow
http://slidepdf.com/reader/full/20120501-introduction-to-dataflow 45/84
Gruppo di Misure Meccaniche e Termiche
UNIBS - DIMI
Practice
Add to the previous practice a button in order to update the
string label ONLY if the button is pressed. Then run.
Change its mechanical action and run again.
Create a enum control with items “Heating”, “Cooling”,“Conditioning” and use its values to turn on label “too hot”
only, label “too cold” only, or both, according to the case
selected.
Make the string indicator display “Hi there!” if the user inputs
“Hello”, or the same input string if otherwise.

7/28/2019 20120501 - Introduction to Dataflow
http://slidepdf.com/reader/full/20120501-introduction-to-dataflow 46/84
Gruppo di Misure Meccaniche e Termiche
UNIBS - DIMI
I. Case Structures – Default Case
• You can specify a default casefor the Case structure
− If you specified cases for 1, 2,and 3, but you get an input of
4, the Case structure executesthe default case
• Right-click the Case structureborder to add, duplicate,
remove, or rearrange casesand to select a default case
7/28/2019 20120501 - Introduction to Dataflow
http://slidepdf.com/reader/full/20120501-introduction-to-dataflow 47/84
Gruppo di Misure Meccaniche e Termiche
UNIBS - DIMI
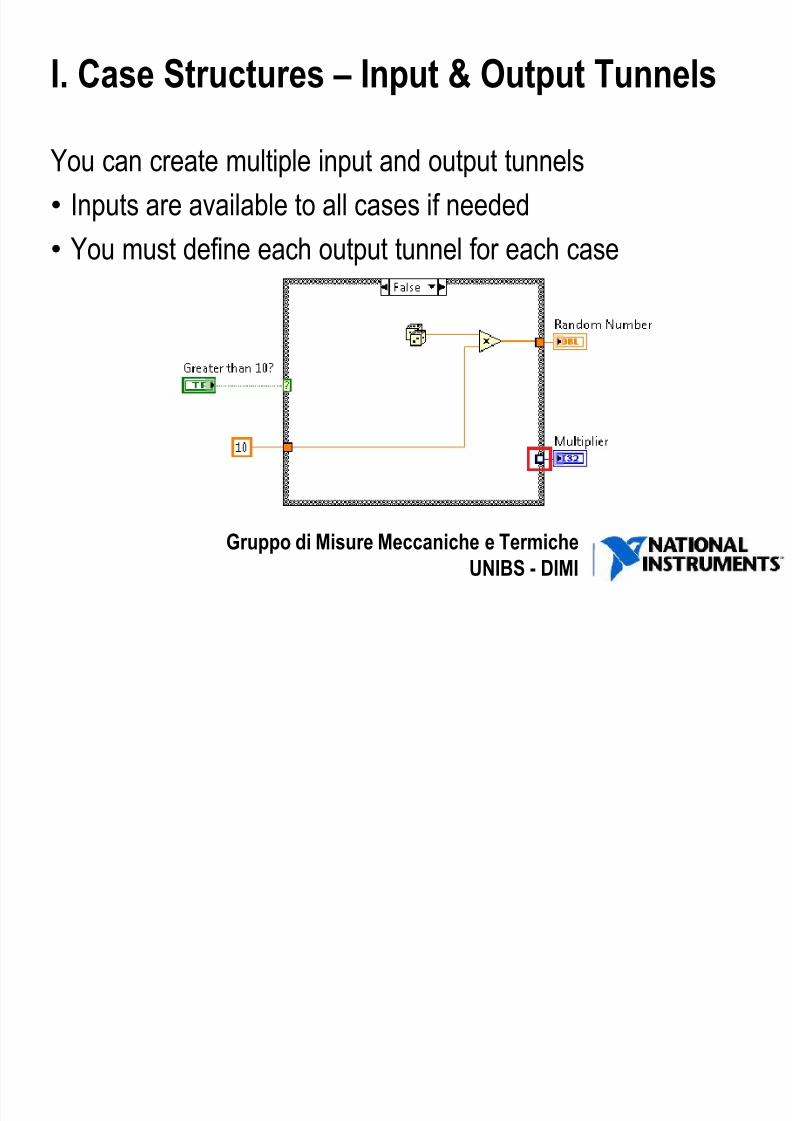
I. Case Structures – Input & Output Tunnels
You can create multiple input and output tunnels
• Inputs are available to all cases if needed
• You must define each output tunnel for each case
7/28/2019 20120501 - Introduction to Dataflow
http://slidepdf.com/reader/full/20120501-introduction-to-dataflow 48/84
Gruppo di Misure Meccaniche e Termiche
UNIBS - DIMI
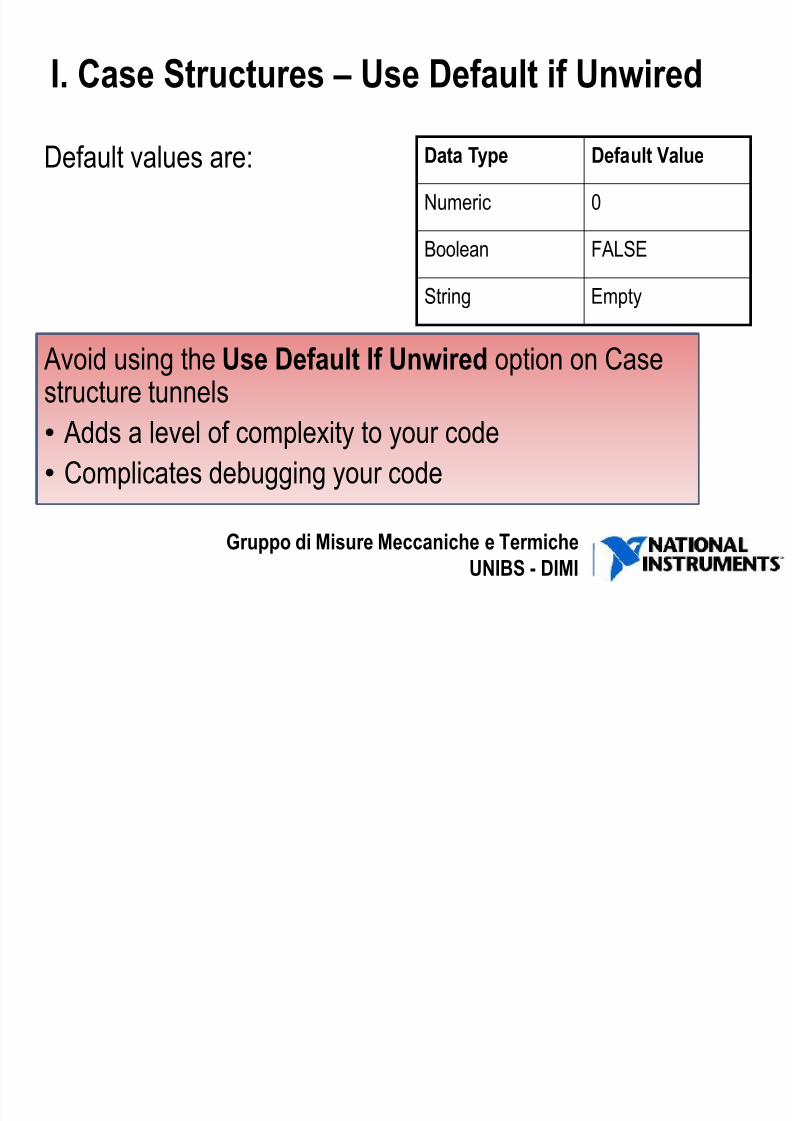
I. Case Structures – Use Default if Unwired
Default values are:
Avoid using the Use Default If Unwired option on Casestructure tunnels
• Adds a level of complexity to your code
• Complicates debugging your code
Data Type Default Value
Numeric 0
Boolean FALSE
String Empty

7/28/2019 20120501 - Introduction to Dataflow
http://slidepdf.com/reader/full/20120501-introduction-to-dataflow 49/84
Gruppo di Misure Meccaniche e Termiche
UNIBS - DIMI
I. Case Structures – Boolean
Boolean input creates two cases: True and False

7/28/2019 20120501 - Introduction to Dataflow
http://slidepdf.com/reader/full/20120501-introduction-to-dataflow 50/84
Gruppo di Misure Meccaniche e Termiche
UNIBS - DIMI
I. Case Structures – Integer
• Add a case for each integer as necessary
• Integers without a defined case use the default case

7/28/2019 20120501 - Introduction to Dataflow
http://slidepdf.com/reader/full/20120501-introduction-to-dataflow 51/84
Gruppo di Misure Meccaniche e Termiche
UNIBS - DIMI
I. Case Structures – String
• Add a case for each string as necessary
• Strings without a defined case use the default case

7/28/2019 20120501 - Introduction to Dataflow
http://slidepdf.com/reader/full/20120501-introduction-to-dataflow 52/84
Gruppo di Misure Meccaniche e Termiche
UNIBS - DIMI
I. Case Structures – Enum
• Gives users a list of items from which to select
• The case selector displays a case for each item in the
enumerated type control

7/28/2019 20120501 - Introduction to Dataflow
http://slidepdf.com/reader/full/20120501-introduction-to-dataflow 53/84
Gruppo di Misure Meccaniche e Termiche
UNIBS - DIMI
I. Case Structures - Error Checking and Error
Handling
Use Case Structures inside VIs to execute the code if thereis no error and skip the code if there is an error

7/28/2019 20120501 - Introduction to Dataflow
http://slidepdf.com/reader/full/20120501-introduction-to-dataflow 54/84
Gruppo di Misure Meccaniche e Termiche
UNIBS - DIMI
D. While Loops
LabVIEW While Loop Flowchart Pseudo Code
Repeat (code);
Until Condition met;End;

7/28/2019 20120501 - Introduction to Dataflow
http://slidepdf.com/reader/full/20120501-introduction-to-dataflow 55/84
Gruppo di Misure Meccaniche e Termiche
UNIBS - DIMI
D. While Loops
• Iteration terminal: returns number of times loop has
executed; zero indexed
• Conditional terminal: defines when the loop stops
Iteration Terminal Conditional Terminal

7/28/2019 20120501 - Introduction to Dataflow
http://slidepdf.com/reader/full/20120501-introduction-to-dataflow 56/84
Gruppo di Misure Meccaniche e Termiche
UNIBS - DIMI
Practice
Add a STOP button to the previous practice, then includeeverything in a while loop in order to stop the program when theuser hit STOP.
Add a CHART and display the current iteration number on it.
Please note: from now on the RUN CONTINOUSLY buttonwon’t be used, use the RUN button instead.
AVOID HITTING THE ABORT BUTTON AT ALL COSTS!!

7/28/2019 20120501 - Introduction to Dataflow
http://slidepdf.com/reader/full/20120501-introduction-to-dataflow 57/84
Gruppo di Misure Meccaniche e Termiche
UNIBS - DIMI
D. While Loops – Tunnels
• Tunnels transfer data into and out of structures
• The tunnel adopts the color of the data type wired to thetunnel
•
Data pass out of a loop after the loop terminates• When a tunnel
passes data intoa loop, the loop
executes onlyafter data arriveat the tunnel

7/28/2019 20120501 - Introduction to Dataflow
http://slidepdf.com/reader/full/20120501-introduction-to-dataflow 58/84
Gruppo di Misure Meccaniche e Termiche
UNIBS - DIMI
Practice
Please open again the previous vi.
Using an input tunnel display the time the vi has been active
(in seconds) and stop it when such time is MORE THAN 20s
or if the user hits the STOP button.
Think about this: what are the differences between a simplewire and a tunnel? Can a wire HOLD data? Can a tunnel?

7/28/2019 20120501 - Introduction to Dataflow
http://slidepdf.com/reader/full/20120501-introduction-to-dataflow 59/84
Gruppo di Misure Meccaniche e Termiche
UNIBS - DIMI
F. Timing a VI
Why do you need timing in a VI?
• Control the frequency at which a loop executes
• Provide the processor with time to complete other tasks,
such as processing the user interface

7/28/2019 20120501 - Introduction to Dataflow
http://slidepdf.com/reader/full/20120501-introduction-to-dataflow 60/84
Gruppo di Misure Meccaniche e Termiche
UNIBS - DIMI
F. Timing a VI – Wait Functions
• A wait function inside a loop allows the VI to sleep for a set
amount of time
• Allows the processor to address other tasks during the wait
time• Uses the operating system millisecond clock
7/28/2019 20120501 - Introduction to Dataflow
http://slidepdf.com/reader/full/20120501-introduction-to-dataflow 61/84
Gruppo di Misure Meccaniche e Termiche
UNIBS - DIMI
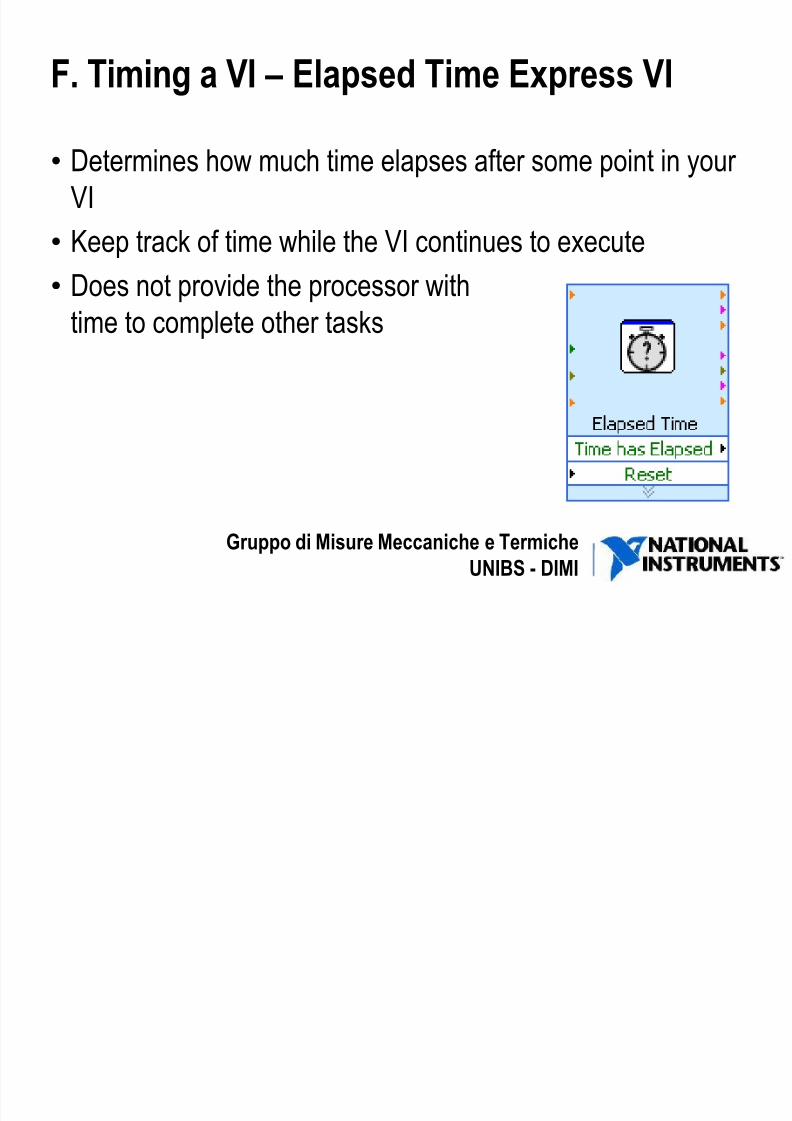
F. Timing a VI – Elapsed Time Express VI
• Determines how much time elapses after some point in your
VI
• Keep track of time while the VI continues to execute
• Does not provide the processor withtime to complete other tasks
7/28/2019 20120501 - Introduction to Dataflow
http://slidepdf.com/reader/full/20120501-introduction-to-dataflow 62/84
Gruppo di Misure Meccaniche e Termiche
UNIBS - DIMI
Practice
Open task manager and run the previous vi.
Add to the previous practice the proper wait function in order
to force the loop time to 200ms
Open task manager and run the vi again.
Add to the previous practice the proper function in order todisplay a string version of time elapsed
7/28/2019 20120501 - Introduction to Dataflow
http://slidepdf.com/reader/full/20120501-introduction-to-dataflow 63/84
Gruppo di Misure Meccaniche e Termiche
UNIBS - DIMI
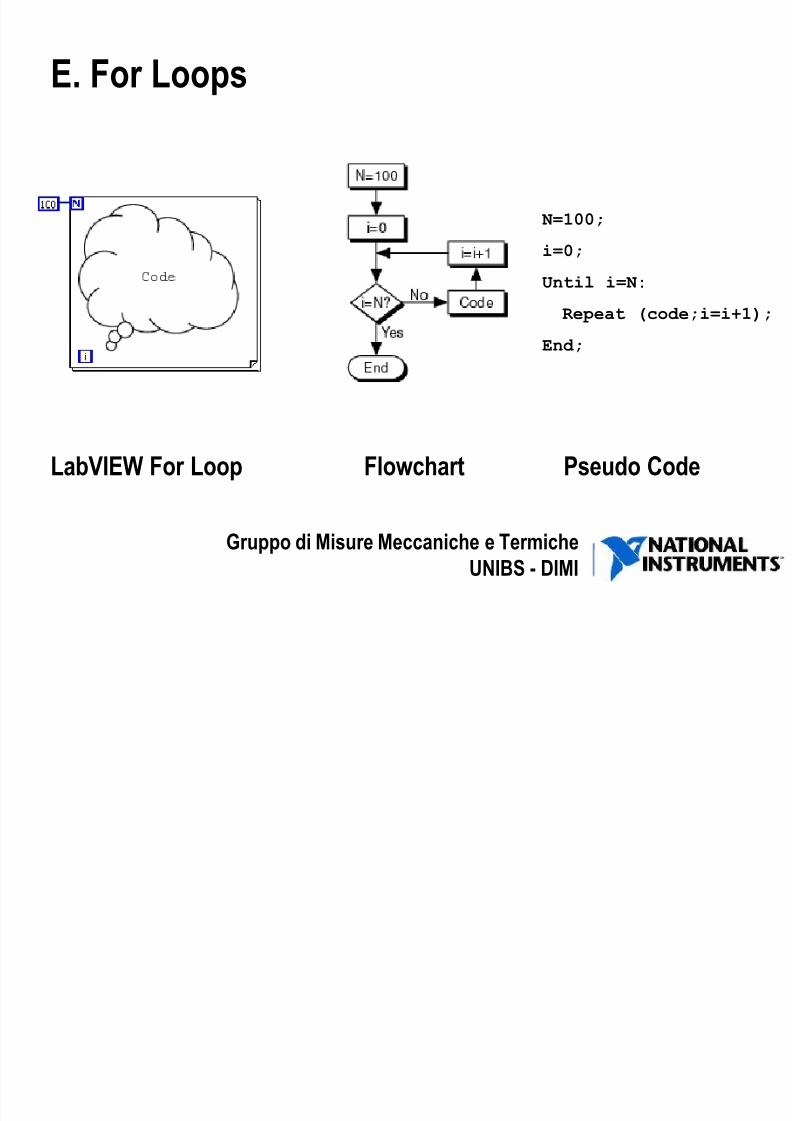
E. For Loops
LabVIEW For Loop Flowchart Pseudo Code
N=100;
i=0;
Until i=N:
Repeat (code;i=i+1);
End;

7/28/2019 20120501 - Introduction to Dataflow
http://slidepdf.com/reader/full/20120501-introduction-to-dataflow 64/84
Gruppo di Misure Meccaniche e Termiche
UNIBS - DIMI
E. For Loops
• Create a For Loop the same way you create a While Loop
• If you need to replace an existing While Loop with a For
Loop, right-click the border of the While Loop, and select
Replace with For Loop from the shortcut menu• The value in the count terminal (an input terminal)
indicates how many times to repeat the subdiagram

7/28/2019 20120501 - Introduction to Dataflow
http://slidepdf.com/reader/full/20120501-introduction-to-dataflow 65/84
Gruppo di Misure Meccaniche e Termiche
UNIBS - DIMI
E. For Loops – Conditional Terminal
You can add a conditional terminal to configure a For Loop to
stop when a Boolean condition or an error occurs
7/28/2019 20120501 - Introduction to Dataflow
http://slidepdf.com/reader/full/20120501-introduction-to-dataflow 66/84
Gruppo di Misure Meccaniche e Termiche
UNIBS - DIMI
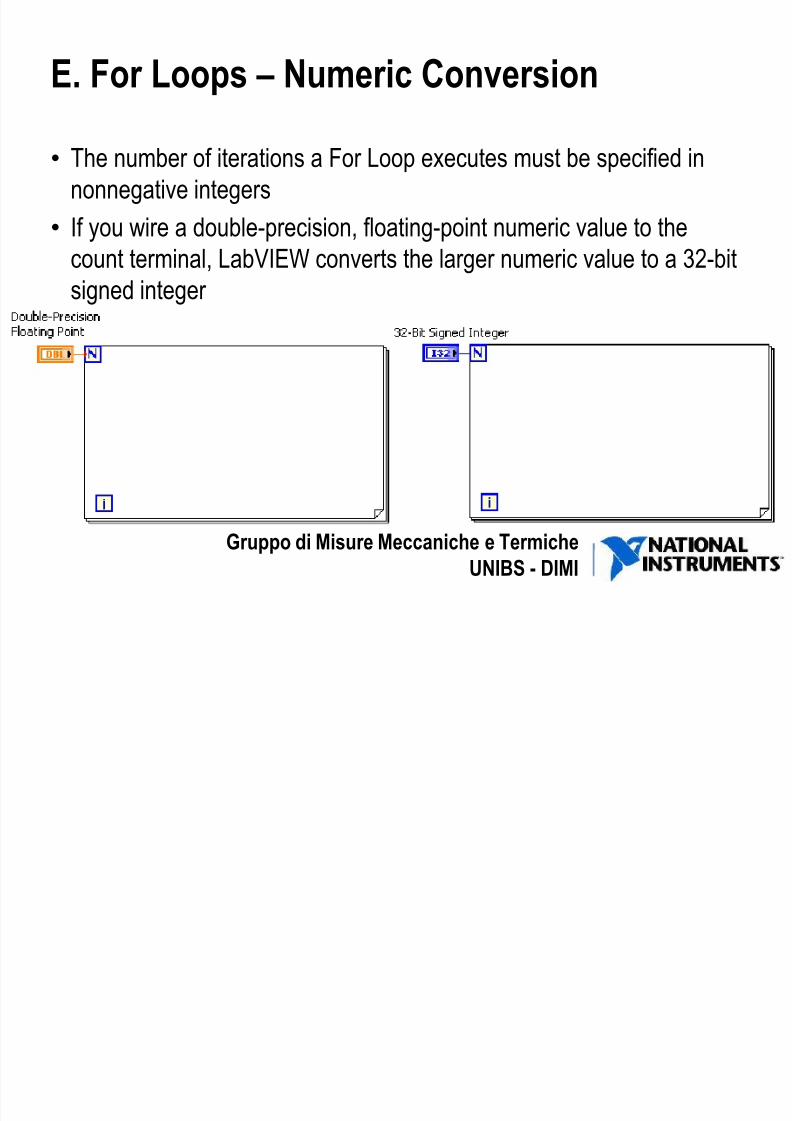
E. For Loops – Numeric Conversion
• The number of iterations a For Loop executes must be specified innonnegative integers
• If you wire a double-precision, floating-point numeric value to the
count terminal, LabVIEW converts the larger numeric value to a 32-bit
signed integer

7/28/2019 20120501 - Introduction to Dataflow
http://slidepdf.com/reader/full/20120501-introduction-to-dataflow 67/84
Gruppo di Misure Meccaniche e Termiche
UNIBS - DIMI
• Normally, when you wire different representation types to theinputs of a function, the function returns an output in the larger
or wider format
• LabVIEW chooses the
representation that
uses more bits
• However, the For Loop
count terminal alwayscoerces to a 32-bit signed
integer
E. For Loops – Numeric Conversion
Coercion Dot
7/28/2019 20120501 - Introduction to Dataflow
http://slidepdf.com/reader/full/20120501-introduction-to-dataflow 68/84
Gruppo di Misure Meccaniche e Termiche
UNIBS - DIMI
E. For Loops – Numeric Conversion
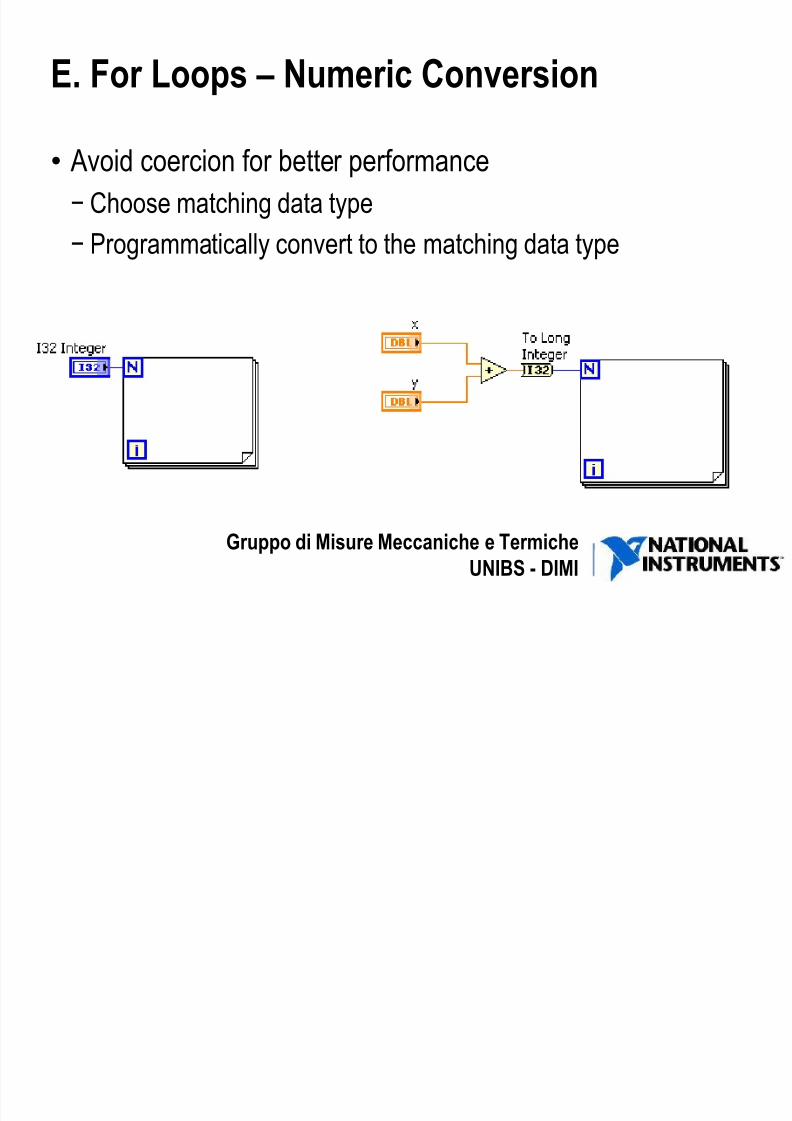
• Avoid coercion for better performance
− Choose matching data type
− Programmatically convert to the matching data type

7/28/2019 20120501 - Introduction to Dataflow
http://slidepdf.com/reader/full/20120501-introduction-to-dataflow 69/84
Gruppo di Misure Meccaniche e Termiche
UNIBS - DIMI
Practice
Reproduce the following block diagram
What will be the result displayed in A? in B? in C? When?What will be the content of D?

7/28/2019 20120501 - Introduction to Dataflow
http://slidepdf.com/reader/full/20120501-introduction-to-dataflow 70/84
Gruppo di Misure Meccaniche e Termiche
UNIBS - DIMI
E. For Loops – Conditional Terminal
For Loops configured for a conditional exit have:
• Red glyph next to the count terminal
• Conditional terminal in the lower right corner

7/28/2019 20120501 - Introduction to Dataflow
http://slidepdf.com/reader/full/20120501-introduction-to-dataflow 71/84
Gruppo di Misure Meccaniche e Termiche
UNIBS - DIMI
E. For Loop/While Loop Comparison
For Loop
• Executes a set number of times unless
a conditional terminal is added
• Can execute zero times
• Tunnels automatically output an arrayof data
While Loop
• Stops executing only if the value at the
conditional terminal meets the
condition
• Must execute at least once• Tunnels automatically output the last
value
7/28/2019 20120501 - Introduction to Dataflow
http://slidepdf.com/reader/full/20120501-introduction-to-dataflow 72/84
Gruppo di Misure Meccaniche e Termiche
UNIBS - DIMI
A. Arrays
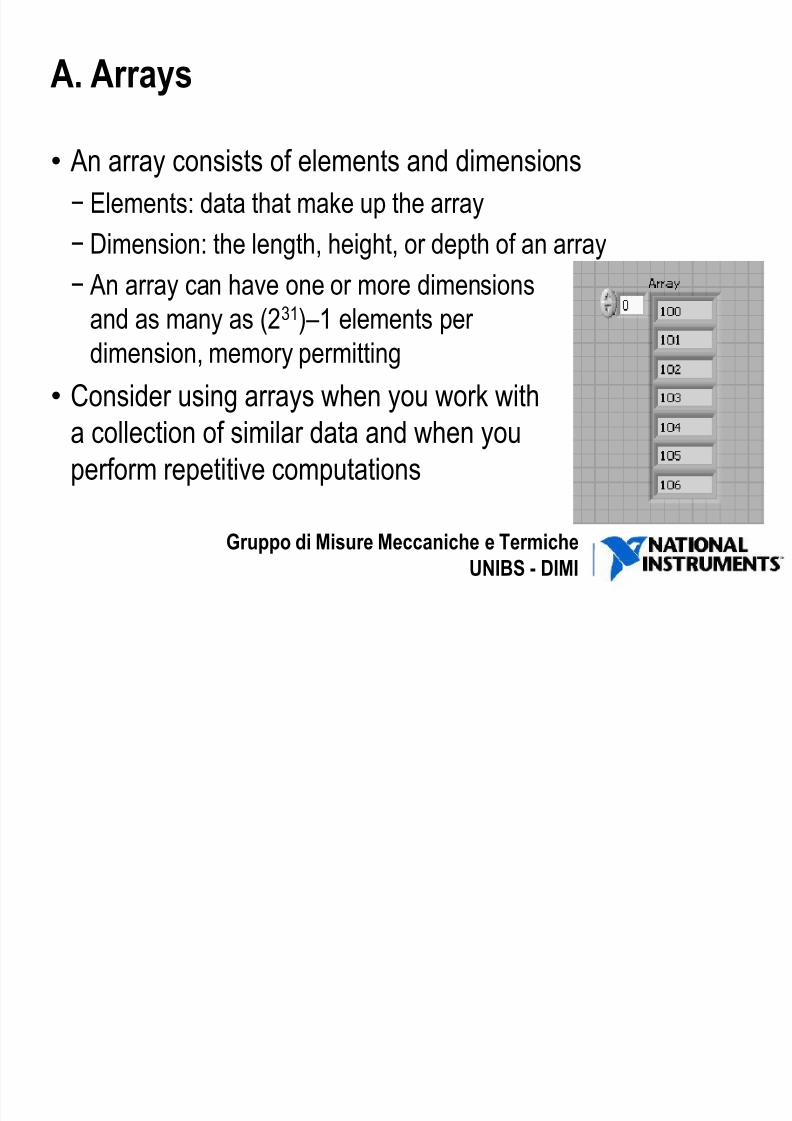
• An array consists of elements and dimensions
− Elements: data that make up the array
− Dimension: the length, height, or depth of an array
− An array can have one or more dimensionsand as many as (231) –1 elements per
dimension, memory permitting
• Consider using arrays when you work with
a collection of similar data and when youperform repetitive computations
7/28/2019 20120501 - Introduction to Dataflow
http://slidepdf.com/reader/full/20120501-introduction-to-dataflow 73/84
Gruppo di Misure Meccaniche e Termiche
UNIBS - DIMI
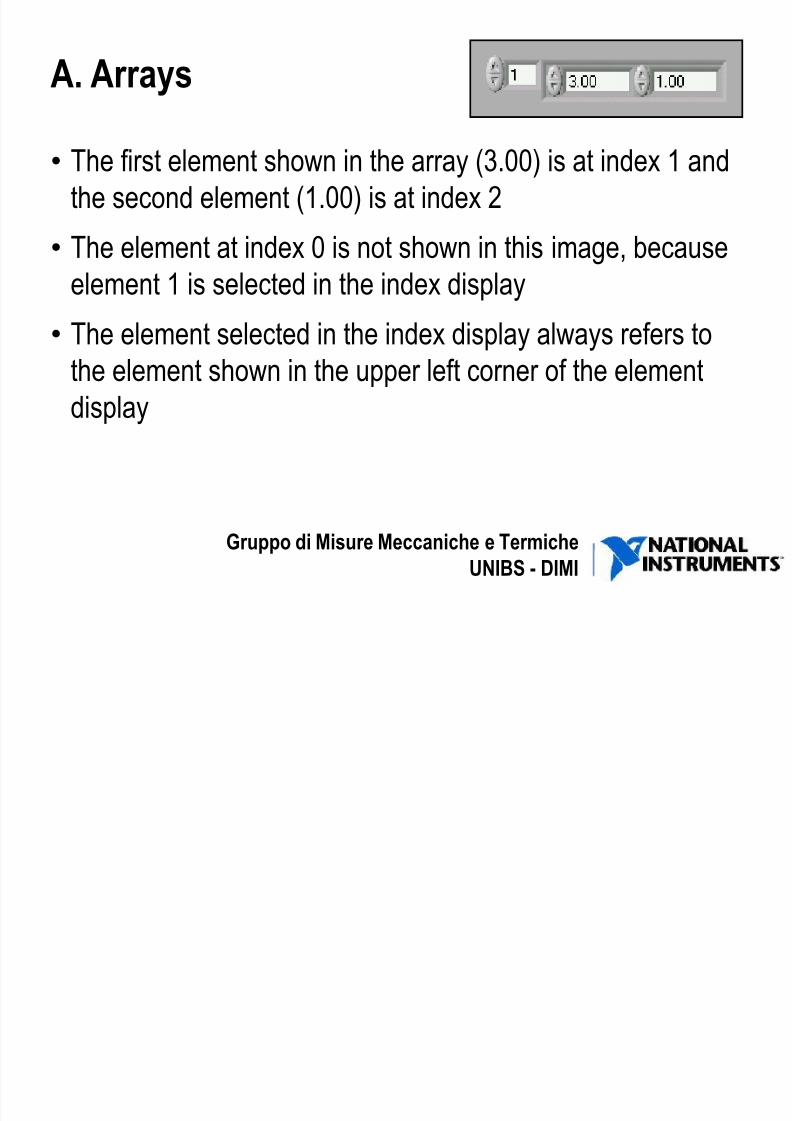
A. Arrays
• The first element shown in the array (3.00) is at index 1 andthe second element (1.00) is at index 2
• The element at index 0 is not shown in this image, because
element 1 is selected in the index display• The element selected in the index display always refers to
the element shown in the upper left corner of the element
display

7/28/2019 20120501 - Introduction to Dataflow
http://slidepdf.com/reader/full/20120501-introduction-to-dataflow 74/84
Gruppo di Misure Meccaniche e Termiche
UNIBS - DIMI
A. Arrays – Creating
1. Place an array shell on the front panel
2. Drag a data object or element into the array shell

7/28/2019 20120501 - Introduction to Dataflow
http://slidepdf.com/reader/full/20120501-introduction-to-dataflow 75/84
Gruppo di Misure Meccaniche e Termiche
UNIBS - DIMI
A. Arrays – 2D Array
• Stores elements in a grid
• Requires a column index and a row index to locate an
element, both of which are zero-based
• To create a multidimensional array on the front panel, right-click the index display and select Add Dimension from the
shortcut menu
• You also can resize the index display until you have as
many dimensions as you want

7/28/2019 20120501 - Introduction to Dataflow
http://slidepdf.com/reader/full/20120501-introduction-to-dataflow 76/84
Gruppo di Misure Meccaniche e Termiche
UNIBS - DIMI
A. Arrays – Initializing
• You can initialize an array, or leave it uninitialized
• For initialized arrays, you define the number of elements in
each dimension, and the contents of each element
• Uninitialized arrays have dimension but no elements

7/28/2019 20120501 - Introduction to Dataflow
http://slidepdf.com/reader/full/20120501-introduction-to-dataflow 77/84
Gruppo di Misure Meccaniche e Termiche
UNIBS - DIMI
A. Arrays – Creating Constants
• To create an array constant:
− Select an array constant on the
Functions palette
− Place the array shell on the block diagram− Place a constant in the array shell
• You can use an array constant to store
constant data or as a basis for comparison
with another array
• Array constants also are useful for passing data into a subVI

7/28/2019 20120501 - Introduction to Dataflow
http://slidepdf.com/reader/full/20120501-introduction-to-dataflow 78/84
Gruppo di Misure Meccaniche e Termiche
UNIBS - DIMI
A. Arrays – Auto-indexing
• If you wire an array to or from a For Loop or While Loop, youcan link each iteration of the loop to an element in that array
by enabling auto-indexing on tunnel
•
The tunnel changes from a solid square to the image shownabove to indicate auto-indexing

7/28/2019 20120501 - Introduction to Dataflow
http://slidepdf.com/reader/full/20120501-introduction-to-dataflow 79/84
Gruppo di Misure Meccaniche e Termiche
UNIBS - DIMI
A. Arrays – Auto-indexing Input
For Loop executesa number of times
equal to the number
of elements in the
array

7/28/2019 20120501 - Introduction to Dataflow
http://slidepdf.com/reader/full/20120501-introduction-to-dataflow 80/84
Gruppo di Misure Meccaniche e Termiche
UNIBS - DIMI
A. Arrays – Auto-indexing Input
If the iteration count terminal is wired and arrays of differentsizes are wired to auto-indexed tunnels, the actual number of
iterations becomes the smallest of the choices.

7/28/2019 20120501 - Introduction to Dataflow
http://slidepdf.com/reader/full/20120501-introduction-to-dataflow 81/84
Gruppo di Misure Meccaniche e Termiche
UNIBS - DIMI
Practice
Create a new VI having the following block diagram
Which values will be displayed by A,B and C?
O

7/28/2019 20120501 - Introduction to Dataflow
http://slidepdf.com/reader/full/20120501-introduction-to-dataflow 82/84
Gruppo di Misure Meccaniche e Termiche
UNIBS - DIMI
A. Arrays – Auto-indexing Output
• When you auto-index an array output tunnel, the outputarray receives a new element from every iteration of the
loop
•
Auto-indexed output arrays are always equal in size to thenumber of iterations
A A C i 2D A

7/28/2019 20120501 - Introduction to Dataflow
http://slidepdf.com/reader/full/20120501-introduction-to-dataflow 83/84
Gruppo di Misure Meccaniche e Termiche
UNIBS - DIMI
A. Arrays – Creating 2D Arrays
You can use two For Loops, one inside the other, to create a2D array
P ti

7/28/2019 20120501 - Introduction to Dataflow
http://slidepdf.com/reader/full/20120501-introduction-to-dataflow 84/84
Practice
Open the thermostat practice VI,
Instead of generating a single temperature value per cycle,
create a set of 100 samples, put them in an array.
Display all the 100 samples on both the CHART and theGRAPH, while controlling the boolean indicators only on the
AVERAGE of the array
Please try to keep you block diagram as tidy as possible