2012 Wage and Benefits Survey - Pharmacy … · The 2012 Wage and Benefits Survey asked a number of...
47
2012 Wage and Benefits Survey Conducted March/April 2012
Transcript of 2012 Wage and Benefits Survey - Pharmacy … · The 2012 Wage and Benefits Survey asked a number of...

2012 Wage and Benefits Survey
Conducted March/April 2012

2 | Page PANS 2012 Wage and Benefits Survey
Table of Contents
Introduction Page 3 Background Page 3 Methodology Page 3 New Questions for 2012 Page 3 Response Rate and Reliability Page 3 Provincial Results Page 4 Respondent Profile Page 5 Job Title Page 5 Employment Environment Page 5 Dispensary Hours Page 6 Employment History Page 6 Location of Employment/Practice Page 7 Employment Schedule Page 8 Job Security Page 12 Expanded Services Page 13 Pharmacist Compensation Page 14 Method of Compensation Page 14 Hourly Wage Trend (2005-2012, by job title) Page 14 Base Annual Amount (excluding bonuses) Page 15 Average Hourly Wage by Region (2010 vs 2012) Page 16 Average Hourly Wage by Job Title (2010 vs 2010) Page 17 Average Hourly Wage by Experience Page 18 Average Hourly Wage by Dispensary Hours Page 20 Paid Vacation Page 21 Additional Benefits Page 22 Results: Job Title Page 25 Full Time Pharmacist Retail Page 26 Part Time Pharmacist Retail Page 28 Manager/Owner Retail Page 30 Manager/Non Owner Retail Page 32 Hospital Staff Pharmacist Full Time Page 34 Hospital Staff Pharmacist Part Time Page 36 Results: Region Page 38 Shelburne, Yarmouth and Digby Counties Page 39 Lunenbrug and Queens Counties Page 40 Hants, Kings and Annapolis Counties (except East Hants) Page 41 Metro (Halifax, Dartmouth, Bedford, Sackville) Page 42 Halifax County (other than Metro), East Hants Page 43 Antigonish, Cumberland, Colchester, Pictou and Guysborough Counties Page 44 Sydney Area (Sydney, New Waterford, Glace Bay, North Sydney, Sydney Mines) Page 45 Cape Breton (other than Sydney Area) Page 46 Conclusion Page 47

3 | Page PANS 2012 Wage and Benefits Survey
Introduction
Background Since 1989, the Pharmacy Association of Nova Scotia has conducted a Wage and Benefits Survey of its members. The PANS 2012 Wage and Benefits Survey was conducted in March and April. The original deadline for submissions was March 31. The deadline was extended by two weeks to give PANS members more time to complete the survey and to improve the response rate. Methodology As in 2010, PANS used the web-based survey application "Survey Monkey" to conduct the survey. This the second time the survey has been web-based. Previously, surveys were conducted by mail. New Questions for 2012 The 2012 Wage and Benefits Survey asked a number of new questions. These included questions about overtime, job security, expanded services, employment environment, breaks and scheduling. Response Rate and Reliability 456 respondents completed the survey this year. This is down from 2010, when 516 people completed the survey. The survey had a response rate of 37.8%. The response rate for the 2010 Wage and Benefits Survey was 46.2% . The 2012 Wage and Benefits Survey is accurate +/- 3.62 , 19 times out of 20.

4 | Page PANS 2012 Wage and Benefits Survey
Provincial Results

5 | Page PANS 2012 Wage and Benefits Survey
Respondent Profile
Position Held By Respondents
Employment Environment

6 | Page PANS 2012 Wage and Benefits Survey
Respondent Profile (continued)
Dispensary Hours at Place of Employment
Employment History

7 | Page PANS 2012 Wage and Benefits Survey
Respondent Profile (continued) Location of Employment/Practice
The percentage of respondents from each region is virtually the same as the 2010 Wage and Benefits Survey. The only variance is in the representation from the Hants, Kings and Annapolis Counties which represented 11.6 percent of the respondents in 2010 and in 2012 they represented 9.4 percent of the respondents. Metro (Halifax, Dartmouth, Bedford and Sackville) increased their representation in the survey from 39.9 percent in 2010 to 42.5 percent in 2012.

8 | Page PANS 2012 Wage and Benefits Survey
Employment Schedule
Hours Contracted to Work Per Week
Weekends Expected to Work

9 | Page PANS 2012 Wage and Benefits Survey
Employment Schedule continued
Hours Worked (per week) for the Past Year
The survey indicates that only 40 percent of respondents have notice a change in their work schedule over the past year. The results were split with 50 percent of those who had noticed a change saying that their hours worked had increased while the remaining 50 percent noticed their hours had decreased.

10 | Page PANS 2012 Wage and Benefits Survey
Employment Schedule continued
Hours a Week Worked Beyond the Hours Contracted to Work (i.e. overtime hours)

11 | Page PANS 2012 Wage and Benefits Survey
Employment Schedule continued
Scheduled Breaks Taken Regularly
(Almost every respondent that said they did not get regular breaks said it was because the pharmacy was too busy and/or they were the only pharmacist on duty) Breaks (other than meals) Taken

12 | Page PANS 2012 Wage and Benefits Survey
Job Security Pharmacists Perception Of Having A Secure Job For The Next Two Years
Job Security - By Job Title
Yes No Not Sure
PhC FT Retail 73.3% 7.6% 19.1% PhC PT Retail 43.3% 13.3% 43.3% Manager/Owner 79.5% 13.6% 6.8% Manager/Non Owner 68.7% 13.4% 17.9% Hospital Staff Pharmacist FT 50.0% 33.3% 16.7% Hospital Staff Pharmacist PT 100.0% 0.0% 0.0%
Respondents were asked "Do you feel your job is secure for the next two years?" Manager/Owners were the most confident, closely followed by Full Time Retail Pharmacists. There was a great deal of uncertainty among Part Time Retail Pharmacists with 43.3 percent saying they were not sure if their job was secure for the next two years.

13 | Page PANS 2012 Wage and Benefits Survey
Expanded Services Performance of Expanded Services
The most common reasons provided for not performing the upon services were:
• No private counselling room • Lack of Training • Services are not covered by third parties or government • Pharmacist is not comfortable providing the service(s) • Not enough time • Not enough staff • Lack of Support from manager/owner

14 | Page PANS 2012 Wage and Benefits Survey
Pharmacist Compensation (Wages/Salary) Method of Compensation
Hourly Wage
Hourly Rate 2012 2010 2008 2007 2006 2005 Retail Manager Non Owner $ 45.67 $ 45.21 $ 41.68 $ 40.92 $ 38.76 $ 37.78 PhC Full Time $ 43.53 $ 43.17 $ 39.34 $ 38.61 $ 37.05 $ 36.03 PhC Part time $ 42.40 $ 41.44 $ 38.91 $ 36.66 $ 35.85 $ 34.46 Hospital PhC Full Time $ 42.83 $ 42.57 $ 40.14 $ 37.60 $ 35.24 $ 33.03 PhC Part Time $ 44.14 $ 41.75 $ 39.34 $ 38.70 $ 35.20 $ 33.16 Assistant Director - - $ 41.47 $ 35.00 $ 33.00 $ 34.00 Director - - $ 49.37 $ 43.73 $ 35.96 $ 39.66
$30.00
$32.00
$34.00
$36.00
$38.00
$40.00
$42.00
$44.00
$46.00
$48.00
$50.00
2012 2010 2008 2007 2006 2005
Manager Non Owner
PhC Full Time
PhC Part time
PhC Full Time
PhC Part Time

15 | Page PANS 2012 Wage and Benefits Survey
Pharmacist Compensation (Wages/Salary)
Base Annual Salary (not including bonuses)

16 | Page PANS 2012 Wage and Benefits Survey
Average Hourly Wage - By Region
2010 2012Sheburne, Yarmouth and Digby Counties 45.48$ 47.27$ Lunenburg and Queens Counties 42.67$ 43.65$ Hants, Kings and Annapolis Counties (except East Hants) 48.33$ 44.53$ Metro (Halifax, Dartmouth, Bedford, Sackville) 41.12$ 42.26$ Halifax County (other than Metro), East Hants 41.77$ 42.44$ Antigonish, Cumberland, Colchester, Pictou and Guysborough Counties 44.72$ 44.62$ Sydney Area (Sydney, New Waterford, Glace Bay, North Sydney, Sydney Mines) 42.90$ 44.66$ Cape Breton (other than the Sydney Area) 50.25$ 51.90$ Average 43.38$ 44.07$
Hourly WageLocation

17 | Page PANS 2012 Wage and Benefits Survey
Average Hourly Wage - By Job Title
Note: There were few Hospital Directors or Assistant Directors of Pharmacy who completed the survey and therefore the results were no statistically relevant.
2010 2012Retail: Manager/Owner 43.95$ 46.78$ Retail: Manager/Non Owner 45.21$ 45.67$ Retail: Full Time Pharmacist 43.17$ 43.53$ Retail: Part Time Pharmacist 41.44$ 42.40$ Retail: Full Time Relief Pharmacist n/a 46.05$ Retail: Part Time Relief Pharmacist n/a 45.18$ Hospital: Director of Pharmacy/Manager n/a n/aHospital: Assistant Director of Pharmacy/Assistant Manager 44.00$ n/aHospital: Full Time Staff Pharmacist 42.57$ 42.83$ Hospital: Part Time Staff Pharmacist 41.75$ 44.14$ Average 43.38$ 44.07$
Job TitleHourly Wage

18 | Page PANS 2012 Wage and Benefits Survey
Average Hourly Wage - By Experience (Total Years in Profession)
2010 20126 or less 42.72$ 42.94$ 7-12 43.73$ 44.99$ 13-19 44.79$ 44.67$ 20-26 44.30$ 43.97$ 27-33 42.84$ 44.81$ More than 33 41.72$ 44.00$ Average 43.38$ 44.07$
Years in ProfessionHourly Wage

19 | Page PANS 2012 Wage and Benefits Survey
Average Hourly Wage - By Experience (Years with Current Employer)
2010 20126 or less 43.24$ 43.50$ 7-12 43.33$ 44.97$ 13-19 45.05$ 45.53$ 20-26 41.76$ 43.63$ 27-33 44.00$ 42.25$ More than 33 41.00$ 44.00$ Average 43.38$ 44.07$
Years with Current EmployerHourly Wage

20 | Page PANS 2012 Wage and Benefits Survey
Average Hourly Wage - By Dispensary Hours
Hours WageLess than 30 42.29$ 31-40 44.33$ 41-50 46.83$ 51-60 43.82$ 61-70 45.26$ 71-80 43.35$ 81-90 43.44$ 91-100 44.06$ 101-105 43.00$ 106-110 44.50$ 111-115 41.92$ 24/7 47.50$

21 | Page PANS 2012 Wage and Benefits Survey
Paid Vacation (Weeks)
Note: Respondents stated that their vacation pay was based on the following (expressed in a percentage of respondents):
• Fixed Number of Weeks 36.3 % • Fixed Number of Days: 10.3 % • Percent of Hours Worked: 33.5 % • Percent of Salary: 11.9 % • Don't Get Vacation: 3.6 % • Don't Know: 4.0 %
2010 20120 5.4% 7.6%1 0.8% 0.7%2 4.6% 4.9%3 39.3% 38.9%4 34.7% 32.1%5 12.5% 13.3%6 2.0% 2.0%7 0.0% 0.0%8 0.4% 0.0%
More than 8 0.4% 0.0%
WeeksPercentage of Respondents

22 | Page PANS 2012 Wage and Benefits Survey
Additional Benefits
Percentage of Respondents Registration with NSCP 2010 2012
Yes 94.1% 93.2% No 5.3% 6.2%
Partly 0.6% 0.6%
Percentage of Respondents PANS Membership 2010 2012
Yes 92.7% 91.7% No 6.2% 7.7%
Partly 1.2% 0.6%
Percentage of Respondents Medical Insurance 2010 2012
Yes 88.3% 92.8% No 11.7% 7.0%
Don't Know n/a 0.2%
Percentage of Respondents
Dental Insurance 2010 2012 Yes 88.1% 92.4% No 11.9% 7.0%
Don't Know n/a 0.7%
Percentage of Respondents
Short Term Disability Insurance 2010 2012 Yes 78.3% 75.1% No 21.7% 18.4%
Don't Know n/a 6.5% Average % of Salary Covered 50.0%
Percentage of Respondents Long Term Disability Insurance 2010 2012
Yes 49.2% 20.7% No 50.8% 0.0%
Don't Know n/a 79.3%
Percentage of Respondents
Life Insurance 2010 2012 Yes 89.0% 83.7% No 11.0% 6.1%
Don't Know n/a 10.2%
23 | Page PANS 2012 Wage and Benefits Survey
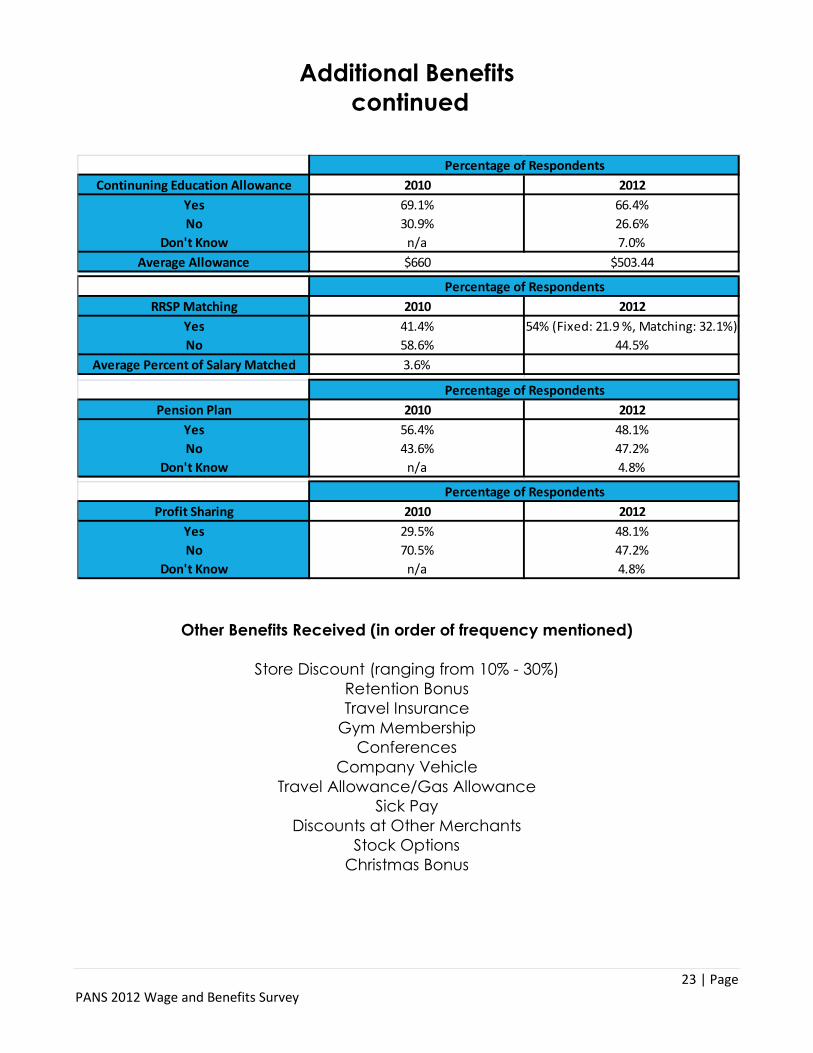
Additional Benefits continued
Other Benefits Received (in order of frequency mentioned)
Store Discount (ranging from 10% - 30%) Retention Bonus Travel Insurance
Gym Membership Conferences
Company Vehicle Travel Allowance/Gas Allowance
Sick Pay Discounts at Other Merchants
Stock Options Christmas Bonus
Continuning Education Allowance 2010 2012Yes 69.1% 66.4%No 30.9% 26.6%
Don't Know n/a 7.0%Average Allowance $660 $503.44
RRSP Matching 2010 2012Yes 41.4% 54% (Fixed: 21.9 %, Matching: 32.1%)No 58.6% 44.5%
Average Percent of Salary Matched 3.6%
Pension Plan 2010 2012Yes 56.4% 48.1%No 43.6% 47.2%
Don't Know n/a 4.8%
Profit Sharing 2010 2012Yes 29.5% 48.1%No 70.5% 47.2%
Don't Know n/a 4.8%
Percentage of Respondents
Percentage of Respondents
Percentage of Respondents
Percentage of Respondents

24 | Page PANS 2012 Wage and Benefits Survey
Desired Benefits (in order of frequency mentioned)
Pension RRSP Matching Profit Sharing
Performance Bonus Health and Dental Insurance
Maternity Leave/Maternity Leave Top-up NSCP/PANS Fees
Continuing Education Allowance More Vacation
Short Term Disability Breaks
Fitness Membership Better Wages Paid Sick Days Personal Days
Flex Days
25 | Page PANS 2012 Wage and Benefits Survey
Results: Job Title

26 | Page PANS 2012 Wage and Benefits Survey
Results: Job Title - Full Time Pharmacist Retail
Method of Compensation
Average Hourly Wage
Salary
2010 2012Hourly 96.9% 98.4%
Annual Salary 3.1% 1.6%
Percentage of RespondentsMethod
Years in Profession 2010 20126 or less $40.86 $42.49
4-12 $45.33 $44.3213-19 $42.33 $44.9520-26 $43.17 $43.9327-33 $41.33 $43.75
More than 33 $41.00 $42.50Average $42.57 $43.54
ars with Current Emplo 2010 20126 or less $42.62 $43.13
4-12 $43.00 $43.9813-19 $41.00 $45.1020-26 $41.67 $42.8627-33 $0.00 n/a
More than 33 $0.00 $44.50Average $42.57 $43.53
Annual Salary (w/o bonuses) 2010 2012less than $10,000 0.0% 0.0%$10,000 - $19,000 0.0% 0.0%$20,000 - $29,999 3.2% 0.0%$30,000 - $39,999 0.0% 0.0%$40,000 - $49,999 0.0% 0.0%$50,000 - $59,999 0.0% 4.0%$60,000 - $69,999 3.2% 6.3%$70,000 - $79,999 9.7% 23.4%$80,000 - $89,999 77.4% 34.3%$90,000 - $99,999 3.2% 22.9%
$100,000 - $150,000 3.2% 8.6%more than $150,000 0.0% 0.6%
27 | Page PANS 2012 Wage and Benefits Survey
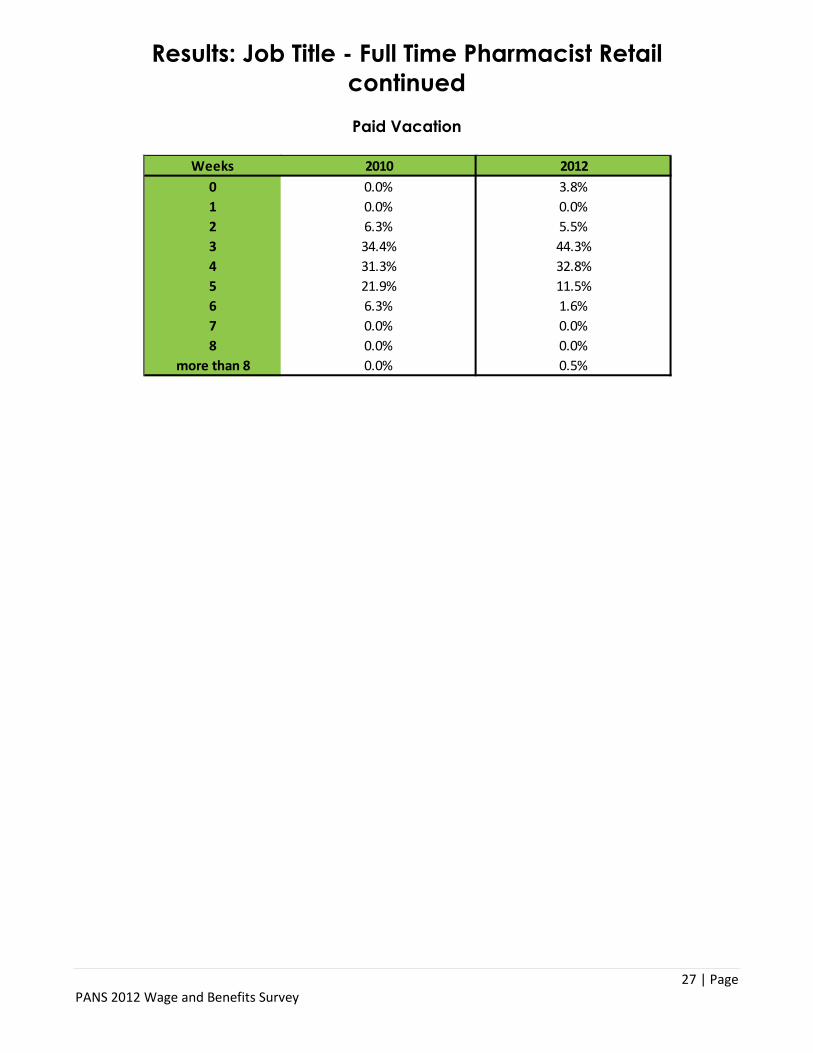
Results: Job Title - Full Time Pharmacist Retail continued
Paid Vacation
Weeks 2010 20120 0.0% 3.8%1 0.0% 0.0%2 6.3% 5.5%3 34.4% 44.3%4 31.3% 32.8%5 21.9% 11.5%6 6.3% 1.6%7 0.0% 0.0%8 0.0% 0.0%
more than 8 0.0% 0.5%

28 | Page PANS 2012 Wage and Benefits Survey
Results: Job Title - Part Time Pharmacist Retail
Method of Compensation
Average Hourly Wage
Salary
Annual Salary (w/o bonuses) 2010 2012
less than $10,000 0.0% 5.0% $10,000 - $19,000 0.0% 2.5% $20,000 - $29,999 12.5% 10.0% $30,000 - $39,999 0.0% 10.0% $40,000 - $49,999 0.0% 17.5% $50,000 - $59,999 37.5% 20.0% $60,000 - $69,999 37.5% 17.5% $70,000 - $79,999 12.5% 5.0% $80,000 - $89,999 0.0% 12.5% $90,000 - $99,999 0.0% 0.0%
$100,000 - $150,000 0.0% 0.0% more than $150,000 0.0% 0.0%
2010 2012Hourly 96.4% 97.6%
Annual Salary 3.6% 2.4%
MethodPercentage of Respondents
Years in Profession 2010 20126 or less $42.00 $41.71
4-12 $42.00 $40.6713-19 $42.00 $42.0020-26 $42.00 $42.3327-33 $42.00 $43.71
More than 33 $40.00 $43.71Average $41.75 $42.40
Years with Current Employer 2010 20126 or less $41.33 $42.05
4-12 $42.00 $41.8613-19 $42.00 $41.5020-26 n/a $44.4327-33 n/a $43.00
More than 33 n/a n/aAverage $41.75 $42.40

29 | Page PANS 2012 Wage and Benefits Survey
Results: Job Title - Part Time Pharmacist Retail
continued
Paid Vacation
Weeks 2010 20120 12.5% 24.4%1 0.0% 2.4%2 0.0% 7.3%3 37.5% 31.7%4 37.5% 26.8%5 12.5% 4.9%6 0.0% 0.0%7 0.0% 0.0%8 0.0% 0.0%
more than 8 0.0% 2.4%
30 | Page PANS 2012 Wage and Benefits Survey
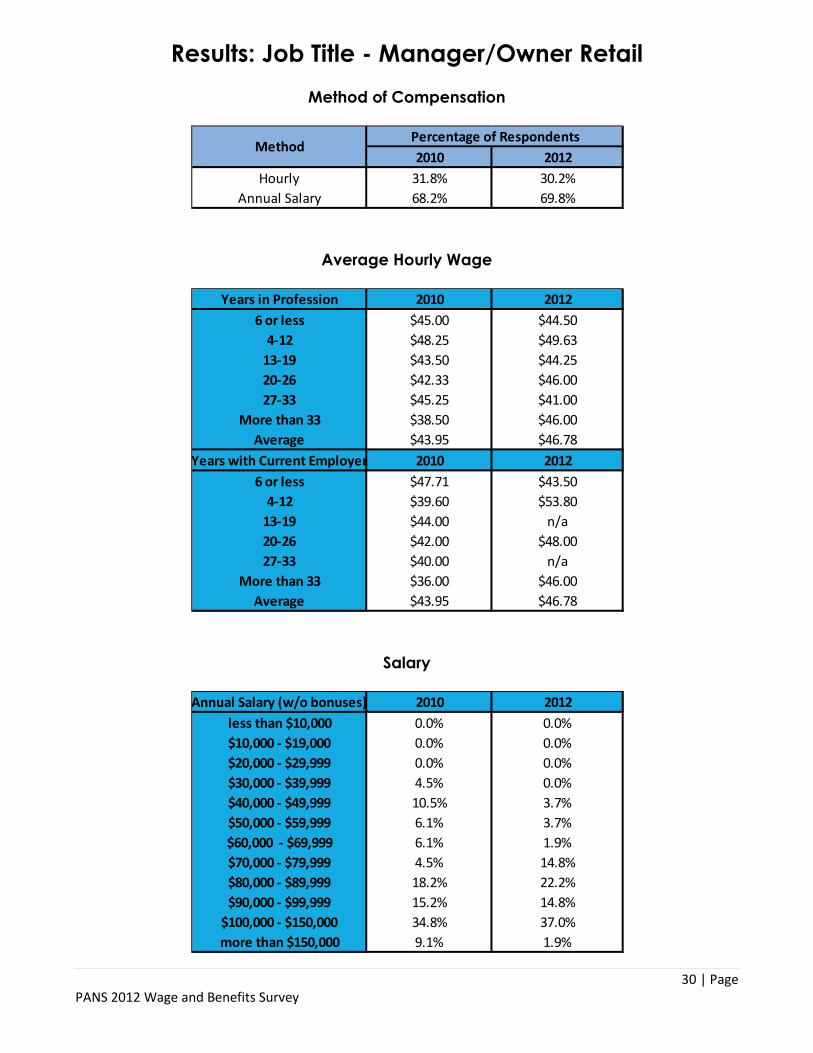
Results: Job Title - Manager/Owner Retail
Method of Compensation
Average Hourly Wage
Salary
2010 2012Hourly 31.8% 30.2%
Annual Salary 68.2% 69.8%
MethodPercentage of Respondents
Years in Profession 2010 20126 or less $45.00 $44.50
4-12 $48.25 $49.6313-19 $43.50 $44.2520-26 $42.33 $46.0027-33 $45.25 $41.00
More than 33 $38.50 $46.00Average $43.95 $46.78
Years with Current Employer 2010 20126 or less $47.71 $43.50
4-12 $39.60 $53.8013-19 $44.00 n/a20-26 $42.00 $48.0027-33 $40.00 n/a
More than 33 $36.00 $46.00Average $43.95 $46.78
Annual Salary (w/o bonuses) 2010 2012less than $10,000 0.0% 0.0%$10,000 - $19,000 0.0% 0.0%$20,000 - $29,999 0.0% 0.0%$30,000 - $39,999 4.5% 0.0%$40,000 - $49,999 10.5% 3.7%$50,000 - $59,999 6.1% 3.7%$60,000 - $69,999 6.1% 1.9%$70,000 - $79,999 4.5% 14.8%$80,000 - $89,999 18.2% 22.2%$90,000 - $99,999 15.2% 14.8%
$100,000 - $150,000 34.8% 37.0%more than $150,000 9.1% 1.9%

31 | Page PANS 2012 Wage and Benefits Survey
Results: Job Title - Manager/Owner Retail
continued
Paid Vacation
Weeks 2010 20120 13.6% 9.3%1 3.0% 3.7%2 4.5% 9.3%3 25.8% 33.3%4 37.9% 35.2%5 10.6% 5.6%6 1.5% 3.7%7 0.0% 0.0%8 0.0% 0.0%
more than 8 3.0% 0.0%

32 | Page PANS 2012 Wage and Benefits Survey
Results: Job Title - Manager/Non Owner Retail
Method of Compensation
Average Hourly Wage
Salary
2010 2012Hourly 92.8% 85.4%
Annual Salary 7.2% 14.6%
MethodPercentage of Respondents
Years in Profession 2010 20126 or less $44.07 $44.24
4-12 $45.38 $44.8313-19 $47.57 $48.3820-26 $45.56 $45.4227-33 $43.89 $47.33
More than 33 $44.50 $46.00Average $45.21 $45.67
Years with Current Employer 2010 20126 or less $44.89 $44.57
4-12 $44.97 $46.7713-19 $45.89 $46.6320-26 $42.80 $42.6727-33 $46.67 n/a
More than 33 $40.00 n/aAverage $45.21 $45.67
Annual Salary (w/o bonuses) 2010 2012less than $10,000 0.0% 0.0%$10,000 - $19,000 0.0% 0.0%$20,000 - $29,999 0.0% 0.0%$30,000 - $39,999 0.0% 0.0%$40,000 - $49,999 0.0% 0.0%$50,000 - $59,999 0.0% 1.3%$60,000 - $69,999 6.2% 2.5%$70,000 - $79,999 6.5% 10.0%$80,000 - $89,999 25.8% 27.5%$90,000 - $99,999 26.9% 38.8%
$100,000 - $150,000 37.6% 20.0%more than $150,000 0.0% 0.0%

33 | Page PANS 2012 Wage and Benefits Survey
Results: Job Title - Manager/Non Owner Retail continued
Paid Vacation
Weeks 2010 20120 1.1% 0.0%1 0.0% 0.0%2 2.1% 2.5%3 37.9% 35.8%4 41.1% 40.7%5 16.8% 19.8%6 1.1% 1.2%7 0.0% 0.0%8 0.0% 0.0%
more than 8 0.0% 0.0%

34 | Page PANS 2012 Wage and Benefits Survey
Results: Job Title - Hospital Staff Pharmacist Full Time
Method of Compensation
Average Hourly Wage
Salary
2010 2012Hourly 96.9% 90.6%
Annual Salary 3.1% 9.4%
MethodPercentage of Respondents
Years in Profession 2010 20126 or less $40.86 $42.43
4-12 $45.33 $43.2513-19 $42.33 $43.0020-26 $43.17 $43.0027-33 $41.33 $42.50
More than 33 $41.00 n/aAverage $42.57 $42.83
Years with Current Employer 2010 20126 or less $42.62 $42.69
4-12 $43.00 $43.2913-19 $41.00 $43.0020-26 $41.67 $42.5027-33 n/a $42.00
More than 33 n/a n/aAverage $42.57 $42.83
Annual Salary (w/o bonuses) 2010 2012less than $10,000 0.0% 0.0%$10,000 - $19,000 0.0% 0.0%$20,000 - $29,999 3.2% 0.0%$30,000 - $39,999 0.0% 0.0%$40,000 - $49,999 0.0% 0.0%$50,000 - $59,999 0.0% 0.0%$60,000 - $69,999 3.2% 0.0%$70,000 - $79,999 9.7% 0.0%$80,000 - $89,999 77.4% 96.8%$90,000 - $99,999 3.2% 3.2%
$100,000 - $150,000 3.2% 0.0%more than $150,000 0.0% 0.0%

35 | Page PANS 2012 Wage and Benefits Survey
Results: Job Title - Hospital Staff Pharmacist Full Time continued
Paid Vacation
Weeks 2010 20120 0.0% 3.1%1 0.0% 0.0%2 6.3% 3.1%3 34.4% 37.5%4 31.3% 31.3%5 21.9% 21.9%6 6.3% 3.1%7 0.0% 0.0%8 0.0% 0.0%
more than 8 0.0% 0.0%

36 | Page PANS 2012 Wage and Benefits Survey
Results: Job Title - Hospital Staff Pharmacist Part Time
Method of Compensation
Average Hourly Wage
Salary
2010 2012Hourly 100.0% 100.0%
Annual Salary 0.0% 0.0%
MethodPercentage of Respondents
Years in Profession 2010 20126 or less $42.00 $43.00
4-12 $42.00 $43.0013-19 $42.00 $44.6720-26 $42.00 $45.0027-33 $42.00 n/a
More than 33 $40.00 $44.00Average $41.75 $44.14
Years with Current Employer 2010 20126 or less $41.33 $44.74
4-12 $42.00 $43.0013-19 $42.00 n/a20-26 n/a n/a27-33 n/a $44.00
More than 33 n/a n/aAverage $41.75 $44.14
Annual Salary (w/o bonuses) 2010 2012less than $10,000 0.0% 0.0%$10,000 - $19,000 0.0% 0.0%$20,000 - $29,999 12.5% 0.0%$30,000 - $39,999 0.0% 0.0%$40,000 - $49,999 0.0% 14.3%$50,000 - $59,999 37.5% 28.6%$60,000 - $69,999 37.5% 28.6%$70,000 - $79,999 12.5% 14.3%$80,000 - $89,999 0.0% 14.3%$90,000 - $99,999 0.0% 0.0%
$100,000 - $150,000 0.0% 0.0%more than $150,000 0.0% 0.0%

37 | Page PANS 2012 Wage and Benefits Survey
Results: Job Title - Hospital Staff Pharmacist Part Time continued
Paid Vacation
Weeks 2010 20120 12.5% 42.9%1 0.0% 0.0%2 0.0% 0.0%3 37.5% 28.6%4 37.5% 14.3%5 12.5% 0.0%6 0.0% 14.3%7 0.0% 0.0%8 0.0% 0.0%
more than 8 0.0% 0.0%

38 | Page PANS 2012 Wage and Benefits Survey
Results: Region

39 | Page PANS 2012 Wage and Benefits Survey
Results: Region - Shelburne, Yarmouth and Digby Counties
Average Hourly Wage
Salary
Years in Profession 2010 20126 or less $46.83 $47.67
4-12 $48.80 $46.2513-19 $44.14 $45.8820-26 $44.14 $47.5027-33 $45.25 $51.67
More than 33 $45.67 $46.00Years with Current Employer 2010 2012
6 or less $45.80 $46.534-12 $48.00 $52.25
13-19 $45.75 $49.0020-26 $41.00 $42.0027-33 $49.00 n/a
More than 33 $36.00 $46.00Job Title 2010 2012
Owner/ Manager (Retail) $45.00 $46.25Manager/Non Owner (Retail) $48.75 $52.86Full time Pharmacist (Retail) $44.80 $46.00Part Time Pharmacist (Retail) $42.75 $36.00
Full Time Relief (Retail) n/a n/aPart Time Relief (Retail) n/a n/a
Director of Pharmacy (Manager) n/a n/aAssistant Director of Pharmacy (Assistant n/a n/a
Staff Pharmacist Full Time (Hospital) $42.00 $43.00Staff Pharmacist Part Time (Hospital) n/a n/a
Average $45.58 $47.27
Annual Salary (w/o bonuses) 2010 2012less than $10,000 0.0% 0.0%$10,000 - $19,000 0.0% 0.0%$20,000 - $29,999 3.7% 0.0%$30,000 - $39,999 0.0% 0.0%$40,000 - $49,999 0.0% 6.7%$50,000 - $59,999 7.4% 3.3%$60,000 - $69,999 0.0% 3.3%$70,000 - $79,999 3.7% 3.3%$80,000 - $89,999 29.6% 36.7%$90,000 - $99,999 18.5% 13.3%
$100,000 - $150,000 37.0% 33.3%more than $150,000 0.0% 0.0%

40 | Page PANS 2012 Wage and Benefits Survey
Results: Region - Lunenburg and Queens Counties
Average Hourly Wage
Salary
Years in Profession 2010 20126 or less $41.20 $42.40
4-12 n/a $45.0013-19 $42.67 $43.6720-26 $43.25 $45.0027-33 $44.50 $45.00
More than 33 $40.67 $39.00Years with Current Employer 2010 2012
6 or less $42.79 $42.834-12 $40.75 $44.5013-19 $44.67 $46.0020-26 n/a $41.0027-33 n/a n/a
More than 33 n/a n/aJob Title 2010 2012
Owner/ Manager (Retail) $45.00 n/aManager/Non Owner (Retail) $48.00 $46.00Full time Pharmacist (Retail) $41.75 $43.36Part Time Pharmacist (Retail) $43.75 $40.50
Full Time Relief (Retail) n/a n/aPart Time Relief (Retail) n/a n/a
Director of Pharmacy (Manager) n/a n/aAssistant Director of Pharmacy (Assistant Manager) n/n n/a
Staff Pharmacist Full Time (Hospital) n/a n/aStaff Pharmacist Part Time (Hospital) $40.00 n/a
Average $42.67 $43.65
Annual Salary (w/o bonuses) 2010 2012less than $10,000 0.0% 0.0%$10,000 - $19,000 0.0% 0.0%$20,000 - $29,999 0.0% 0.0%$30,000 - $39,999 0.0% 0.0%$40,000 - $49,999 3.7% 0.0%$50,000 - $59,999 14.8% 8.7%$60,000 - $69,999 0.0% 4.3%$70,000 - $79,999 22.2% 13.0%$80,000 - $89,999 33.3% 26.1%$90,000 - $99,999 14.8% 26.1%
$100,000 - $150,000 7.4% 21.7%more than $150,000 3.7% 0.0%

41 | Page PANS 2012 Wage and Benefits Survey
Results: Region - Hants, Kings and Annapolis Counties (except East Hants)
Average Hourly Wage
Salary
Years in Profession 2010 20126 or less $47.00 $44.00
4-12 $46.63 $46.3313-19 $53.08 $45.8620-26 $51.44 $43.5027-33 $42.00 $42.20
More than 33 $42.00 $44.20Years with Current Employer 2010 2012
6 or less $46.50 $43.744-12 $51.08 $45.13
13-19 $50.00 $49.0020-26 $43.00 $43.6727-33 $41.00 $40.00
More than 33 $0.00 $44.00Job Title 2010 2012
Owner/ Manager (Retail) $44.20 $40.00Manager/Non Owner (Retail) $53.89 $45.83Full time Pharmacist (Retail) $49.07 $44.26Part Time Pharmacist (Retail) $43.33 $45.00
Full Time Relief (Retail) n/a $48.00Part Time Relief (Retail) n/a n/a
Director of Pharmacy (Manager) N/A n/aAssistant Director of Pharmacy (Assistant N/A n/a
Staff Pharmacist Full Time (Hospital) $42.00 $43.33Staff Pharmacist Part Time (Hospital) N/A 43
Average $48.33 $44.53
Annual Salary (w/o bonuses) 2010 2012less than $10,000 0.0% 0.0%$10,000 - $19,000 0.0% 0.0%$20,000 - $29,999 1.7% 0.0%$30,000 - $39,999 0.0% 0.0%$40,000 - $49,999 3.3% 0.0%$50,000 - $59,999 0.0% 7.7%$60,000 - $69,999 5.0% 0.0%$70,000 - $79,999 10.0% 12.8%$80,000 - $89,999 28.3% 46.2%$90,000 - $99,999 11.7% 20.5%
$100,000 - $150,000 40.0% 12.8%more than $150,000 0.0% 0.0%

42 | Page PANS 2012 Wage and Benefits Survey
Results: Region - Metro (Halifax, Dartmouth, Bedford, Sackville)
Average Hourly Wage
Salary
Years in Profession 2010 20126 or less $40.94 $41.74
4-12 $41.29 $42.9013-19 $40.81 $42.9320-26 $41.32 $41.8327-33 $41.55 $42.65
More than 33 $40.79 $42.08Years with Current Employer 2010 2012
6 or less $41.01 $42.204-12 $41.33 $42.3213-19 $41.82 $41.7720-26 $40.64 $43.3327-33 $43.00 $42.00
More than 33 $40.50 $42.67Job Title 2010 2012
Owner/ Manager (Retail) $41.44 $43.00Manager/Non Owner (Retail) $41.71 $42.81Full time Pharmacist (Retail) 4047% $41.37Part Time Pharmacist (Retail) $40.04 $41.39
Full Time Relief (Retail) n/a $45.00Part Time Relief (Retail) n/a $43.17
Director of Pharmacy (Manager) n/a n/aAssistant Director of Pharmacy (Assistant Manager) $44.00 n/a
Staff Pharmacist Full Time (Hospital) $42.29 $42.70Staff Pharmacist Part Time (Hospital) $42.00 $45.50
Average $41.12 $42.26
Annual Salary (w/o bonuses) 2010 2012less than $10,000 0.5% 1.6%$10,000 - $19,000 1.0% 1.1%$20,000 - $29,999 2.6% 1.6%$30,000 - $39,999 3.1% 1.1%$40,000 - $49,999 3.1% 3.8%$50,000 - $59,999 3.6% 7.1%$60,000 - $69,999 11.8% 7.7%$70,000 - $79,999 13.8% 20.8%$80,000 - $89,999 40.5% 37.2%$90,000 - $99,999 9.7% 10.9%
$100,000 - $150,000 9.2% 6.6%more than $150,000 1.0% 0.5%

43 | Page PANS 2012 Wage and Benefits Survey
Results: Region - Halifax County (other than Metro), East Hants
Average Hourly Wage
Salary
Years in Profession 2010 20126 or less $42.00 $39.71
4-12 $44.80 $44.4413-19 $40.67 $43.5020-26 $42.00 $42.0027-33 $40.63 $44.00
More than 33 $43.00 $42.00Years with Current Employer 2010 2012
6 or less $44.09 $42.204-12 $38.82 $44.25
13-19 $44.50 n/a20-26 $43.00 $40.0027-33 $0.00 n/a
More than 33 $0.00 n/aJob Title 2010 2012
Owner/ Manager (Retail) $31.00 $45.50Manager/Non Owner (Retail) $41.63 $45.00Full time Pharmacist (Retail) $43.89 $41.00Part Time Pharmacist (Retail) $39.60 $43.00
Full Time Relief (Retail) n/a $55.00Part Time Relief (Retail) n/a $40.00
Director of Pharmacy (Manager) n/a n/aAssistant Director of Pharmacy (Assistant n/a n/a
Staff Pharmacist Full Time (Hospital) $47.67 n/aStaff Pharmacist Part Time (Hospital) $42.00 n/a
Average $41.77 $42.44
Annual Salary (w/o bonuses) 2010 2012less than $10,000 0.0% 3.4%$10,000 - $19,000 8.8% 0.0%$20,000 - $29,999 0.0% 0.0%$30,000 - $39,999 2.9% 0.0%$40,000 - $49,999 2.9% 0.0%$50,000 - $59,999 2.9% 0.0%$60,000 - $69,999 8.8% 3.4%$70,000 - $79,999 11.8% 37.9%$80,000 - $89,999 20.6% 27.6%$90,000 - $99,999 11.8% 17.2%
$100,000 - $150,000 29.4% 10.3%more than $150,000 0.0% 0.0%

44 | Page PANS 2012 Wage and Benefits Survey
Results: Region - Antigonish, Cumberland, Colchester,
Pictou and Guysborough Counties
Average Hourly Wage
Salary
Years in Profession 2010 20126 or less $43.75 $45.50
4-12 $44.21 $46.2413-19 $44.75 $48.5020-26 $45.84 $46.9127-33 $45.10 $47.17
More than 33 $44.38 $47.57Years with Current Employer 2010 2012
6 or less $44.91 $45.914-12 $44.22 $48.00
13-19 $45.44 $49.1720-26 $43.40 $45.5727-33 $46.00 n/a
More than 33 $47.00 $45.00Job Title 2010 2012
Owner/ Manager (Retail) $53.50 $47.00Manager/Non Owner (Retail) $47.18 $47.80Full time Pharmacist (Retail) $44.18 $46.41Part Time Pharmacist (Retail) $43.00 $46.43
Full Time Relief (Retail) n/a $45.00Part Time Relief (Retail) n/a $55.00
Director of Pharmacy (Manager) n/a n/aAssistant Director of Pharmacy (Assistant n/a n/a
Staff Pharmacist Full Time (Hospital) $41.67 $43.00Staff Pharmacist Part Time (Hospital) $42.00 $43.67
Average $44.72 $46.62
Annual Salary (w/o bonuses) 2010 2012less than $10,000 0.0% 0.0%$10,000 - $19,000 0.0% 0.0%$20,000 - $29,999 2.4% 1.4%$30,000 - $39,999 0.0% 1.4%$40,000 - $49,999 2.4% 1.4%$50,000 - $59,999 3.7% 7.0%$60,000 - $69,999 6.1% 7.0%$70,000 - $79,999 12.2% 7.0%$80,000 - $89,999 26.8% 22.5%$90,000 - $99,999 18.3% 35.2%
$100,000 - $150,000 26.8% 15.5%more than $150,000 1.2% 1.4%

45 | Page PANS 2012 Wage and Benefits Survey
Results: Region - Sydney Area (Sydney, New Waterford, Glace Bay, North Sydney, Sydney Mines)
Average Hourly Wage
Salary
Years in Profession 2010 20126 or less $42.71 $43.86
4-12 $41.50 $44.7513-19 $46.00 $45.5020-26 $43.63 $44.8027-33 $41.75 $44.86
More than 33 $41.67 $44.60Years with Current Employer 2010 2012
6 or less $43.23 $43.934-12 $42.58 $44.75
13-19 $42.67 $46.2920-26 $42.50 n/a27-33 $0.00 $43.00
More than 33 $41.50 $45.00Job Title 2010 2012
Owner/ Manager (Retail) n/a n/aManager/Non Owner (Retail) $44.78 $46.50Full time Pharmacist (Retail) $42.26 $44.64Part Time Pharmacist (Retail) $43.20 $42.25
Full Time Relief (Retail) n/a $45.50Part Time Relief (Retail) n/a $44.00
Director of Pharmacy (Manager) n/a n/aAssistant Director of Pharmacy (Assistant n/a n/a
Staff Pharmacist Full Time (Hospital) n/a $43.00Staff Pharmacist Part Time (Hospital) n/a n/a
Average $42.90 $44.66
Annual Salary (w/o bonuses) 2010 2012less than $10,000 0.0% n/a$10,000 - $19,000 0.0% 2.4%$20,000 - $29,999 0.0% 2.4%$30,000 - $39,999 0.0% 4.9%$40,000 - $49,999 2.1% 4.9%$50,000 - $59,999 8.5% 7.3%$60,000 - $69,999 4.3% 2.4%$70,000 - $79,999 4.3% n/a$80,000 - $89,999 27.7% 26.8%$90,000 - $99,999 29.8% 31.7%
$100,000 - $150,000 21.3% 17.1%more than $150,000 2.1% n/a

46 | Page PANS 2012 Wage and Benefits Survey
Results: Region - Cape Breton (other than Sydney Area)
Average Hourly Wage
Salary
Years in Profession 2010 20126 or less $46.50 $48.50
4-12 $54.60 $57.0013-19 $45.00 $53.0020-26 $0.00 $51.0027-33 $49.50 $60.00
More than 33 $0.00 $43.50Years with Current Employer 2010 2012
6 or less $51.29 $49.334-12 $59.50 $56.80
13-19 $45.00 n/a20-26 $0.00 $43.0027-33 $0.00 $44.00
More than 33 $0.00 n/aJob Title 2010 2012
Owner/ Manager (Retail) $65.00 $63.50Manager/Non Owner (Retail) $55.00 $60.00Full time Pharmacist (Retail) $48.30 $49.00Part Time Pharmacist (Retail) $0.00 n/a
Full Time Relief (Retail) n/a n/aPart Time Relief (Retail) n/a n/a
Director of Pharmacy (Manager) n/a n/aAssistant Director of Pharmacy (Assistant n/a n/a
Staff Pharmacist Full Time (Hospital) n/a n/aStaff Pharmacist Part Time (Hospital) n/a 44
Average $50.25 $51.90
Annual Salary (w/o bonuses) 2010 2012less than $10,000 0.0% 0.0%$10,000 - $19,000 0.0% 0.0%$20,000 - $29,999 0.0% 0.0%$30,000 - $39,999 0.0% 0.0%$40,000 - $49,999 0.0% 0.0%$50,000 - $59,999 0.0% 0.0%$60,000 - $69,999 5.9% 11.8%$70,000 - $79,999 0.0% 11.8%$80,000 - $89,999 17.6% 17.6%$90,000 - $99,999 35.3% 11.8%
$100,000 - $150,000 35.3% 47.1%more than $150,000 5.9% 0.0%

47 | Page PANS 2012 Wage and Benefits Survey
Conclusions
The majority of pharmacists are paid hourly in Nova Scotia. Based on the comments of respondents, there is an appetite for the opportunity to receive bonuses based on their performance. The highest hourly wages continue to be paid in Cape Breton. Pensions and RRSP Matching Programs are still the number one most desired benefits. Although the feeling of job security is relatively strong amongst pharmacists, many comments made in the additional comments section indicated that there is growing stress in the workplace amongst the PANS membership Salaries have continued to increase at normal trending levels.