2012 VHA Facility Quality and Safety Report · Introduction 6. Part 1. VHA Facility ... Psychiatry...
81
2012 VHA Facility Quality and Safety Report Department of Veterans Affairs Veterans Health Administration September 2012
-
Upload
hoangtuyen -
Category
Documents
-
view
215 -
download
0
Transcript of 2012 VHA Facility Quality and Safety Report · Introduction 6. Part 1. VHA Facility ... Psychiatry...

2012 VHA Facility Quality and Safety Report
Department of Veterans Affairs Veterans Health Administration September 2012

Page 2
Page 2
Tables of Contents
Table of Contents 2.
Executive Summary 4. Introduction 6. Part 1. VHA Facility Quality and Safety Data 8.
Section 1: Services, Staffing, Treatment Volumes and Accreditation 8. Available In-House Services: Utilization Community Living Centers (CLCs) Hospital Accreditation Status Medical Center Staffing
Section 2: Effective Domain Measures 13. ORYX 30 Day Risk Adjusted Disease Mortality 30 Day Risk Adjusted Readmission Rates Surgical Quality Outpatient PACT
Section 3: Equitable Care 21. Outpatient Care Composites:
Gender Age Satisfaction with Care by Race/Ethnicity Urban vs. Rural (see Tables 1.3 and 1.4) Section 4: Safe Care 26. Health Care-Associated Infections Patient Safety Measures
Section 5: Timely Care 28. Access to Care How VA Verifies Accuracy
Section 6: Patient Centered Care 29.
Section 7. Efficient Care 32. Ambulatory Care sensitive conditions Hospitalizations Results

Page 3
Page 3
Part 2: Adverse Event and Close Call Reporting in the Veterans Health Administration FY 2006 to FY 2009 35.
Introduction 35.
Section 1: Overview and Event Types and Locations Associated with Root Cause Analyses Submitted FY 2006 to FY 2009 Primary Analysis and Categorization (PAC) Data by Setting and VISN 37.
Section 2: Timeliness and Number of Root Cause Analyses Submitted FY 2006 to FY 2009 44.
Section 3: RCAs Possessing “Strong Strings” 46.
Section 4: Information on Reports That Were Not the Subject of Single Case RCAs 48.
Part 3: VHA Facility Quality & Safety Data Tables 51.
Part 4: Data Definitions 52.
Frequently Used Acronyms 52.
Definitions 53.

Page 4
2012 VHA Facility Quality and Safety Report Department of Veterans Affairs Veterans Health Administration
Page 4
Executive Summary The Veterans Health Administration (VHA) is committed to providing the highest quality and safest health care for Veterans. VHA has established a wide array of innovative and comprehensive programs to measure, analyze, improve and report on all aspects of health care quality and patient safety. This is the fourth annual VHA Facility Quality and Safety Report.
VA issued its first facility-level report on quality and safety in 2008. The 2008-2010 reports are available at: (http://www1.va.gov/health/HospitalReportCard.asp), and data files that comprise the report can be accessed through http://www.data.gov/. The 2012 report of VHA’s quality and safety data presents information related to the care provided in outpatient and hospital settings, the staffing of each Department of Veterans Affairs (VA) medical facility, the quality of inpatient and outpatient health care provided to all Veterans and to certain patient populations, the medical center accreditation status, patient satisfaction and selected patient outcomes for Fiscal Year (FY) 2011. This information has been compiled from multiple sources throughout VHA. This report is greatly expanded from previous reports and includes new metrics such as medical and surgical outcomes data and a detailed analysis of VA’s safety reports from its rich patient safety reporting system. The Facility Quality and Safety Report is organized to provide information organized according to the six domains that the Institute of Medicine established for defining quality in health care: Effective, Equitable, Safe, Timely, Patient-centered, and Efficient.
The highlights of the 2012 report include information on the new measures being reported in the following sections:
Section 1: Services, Utilization, Staffing and Accreditation include new information following areas:
Available Hospital Services includes new measures on Urgent Care
Clinics and Domiciliary Care;
Outpatient Visits (Primary and Specialty Care);
Outpatient Procedures (Cardiac Catheterizations);
Community Living Centers (CLCs) Average Daily Census and Unique
Residents;
CLC Services for both Short Stay and Long Stay; and
Patient Aligned Care Team (PACT) including completed appointments
within 7 days.
Section 4: Safe and Health Care Associated Infections includes new metrics on the Number of Ventilator Days and Number of Central Line Days.

Page 5
2012 VHA Facility Quality and Safety Report Department of Veterans Affairs Veterans Health Administration
Page 5
Section 6: Patient Centered Satisfaction includes information on the Number of Patients Surveyed in relation to the Satisfaction with Inpatient Care.

Page 6
2012 VHA Facility Quality and Safety Report Department of Veterans Affairs Veterans Health Administration
Introduction
VHA is the largest integrated health care system in the United States (US) In FY 2011, within its budget of $51.4 billion, VHA delivered clinical services to 6.1 million out of 8.5 million enrolled Veterans. VHA operated a wide range of facilities and programs including 152 hospitals, 802 hospital and community-report summarizes performance data for clinical quality and patient safety for all VA medical facilities. Where two or more hospital divisions operate as an integrated health care system under a single leadership team, those facilities are combined, so a total of 139 separate facilities are listed in this report.1
1 The following hospitals are reported with their parent facility [designated in brackets]: Brockton/West Roxbury [VA Boston Health Care System (HCS), Castle Point [VA Hudson Valley HCS], Lincoln [Nebraska/Western Iowa HCS], Lyons [VA New Jersey HCS], Miles City [VA Montana HCS], Murfreesboro [VA Tennessee Valley HCS], Sepulveda [VA Greater Los Angeles HCS], Tuskegee [Central Alabama Veterans HCS], Leavenworth [VA Eastern Kansas HCS], Los Angeles OPC [VA Greater Los Angeles HCS], Grand Island [Nebraska/W. Iowa HCS], Lake City [N. Florida/ S. Georgia HCS], and Knoxville [VA Central Iowa HCS]. The Manila VAMC reports no quality data.
Page 6
Facilities are categorized according to complexity level which is determined on the basis of the characteristics of the patient population, clinical services offered, educational and research missions and administrative complexity. Facilities are classified into three levels with Level 1
representing the most complex facilities, Level 2 moderately complex facilities, and Level 3 the least complex facilities. Level 1 is further subdivided into categories 1a - 1c.
The first section of the report describes the infrastructure of VHA facilities and locally available services across the continuum of Veteran care needs.
The next six sections are organized around the Institute of Medicine’s (IOM) six dimensions defining health care quality. According to the IOM,2
2 Institute of Medicine. Crossing the Quality Chasm. National Academy Press: Washington, DC,
2001.
health care should be:
Effective—providing services based on scientific knowledge to all who could benefit and refraining from providing services to those not likely to benefit (avoiding underuse and overuse).

Page 7
2012 VHA Facility Quality and Safety Report Department of Veterans Affairs Veterans Health Administration
Page 7
Equitable—providing care that does not vary in quality because of personal characteristics such as gender, ethnicity, geographic location, and socioeconomic status.
Safe—avoiding injuries to patients from the care that is intended to help them.
Timely—reducing waits and sometimes harmful delays for both those who receive and those who give care.
Patient-Centered—providing care that is respectful of and responsive to individual patient preferences, needs, and values; and ensuring that patient values guide all clinical decisions.
Efficient—avoiding waste of equipment, supplies, ideas, and energy.

Page 8
2012 VHA Facility Quality and Safety Report Department of Veterans Affairs Veterans Health Administration
Part 1. VHA Facility Quality and Safety Data
Part 1 references the data tables displayed in Part 3 of this report. The data are organized by data elements defined in columns and facilities defined in rows. The columns referenced in this narrative correspond to the data elements found in the data tables.
Section 1: Services, Staffing, Treatment Volumes and Accreditation
Available In-House Services:
Eighty-nine percent of VHA facilities provide in-house acute medical and surgical services, and 79 percent provide acute inpatient psychiatric services. Eighty-four percent (117 of 139) have intensive care units (ICU), 83 percent have emergency departments, and 85 percent have CLCs, formerly designated as Nursing Home Care Units (NHCU).3
3 VA provides institutional long-term care services through three mechanisms: 132 VA owned and operated Community Living Centers (CLC), services purchased under contract with over 2,500 Community Nursing Homes, and 122 State Veterans Homes located in 48 states and Puerto Rico.
Page 8
In 2004, Public Law (P.L.) 108-422 and P. L. 108-447 directed VA to establish specialized interdisciplinary rehabilitation programs to handle the complex medical, psychological, rehabilitation, and prosthetic needs of Veterans with complex trauma associated with combat injury. The changing nature of combat (e.g., increased prevalence of blast-related as opposed to gunshot-related injury) as well as improved battlefield casualty care has resulted in a growing proportion of Veterans who have polytrauma, a combination of injuries that include brain injury, limb loss, impaired vision, hearing loss, and psychological sequelae, including post-traumatic stress injury. VA implemented the requirements of these public laws by developing a Polytrauma System of Care (PSC) for severely injured Veterans. The components of the PSC include:
Five regional Polytrauma/Traumatic Brain Injury (TBI) Rehabilitation Centers (PRC) provide acute comprehensive medical and rehabilitation care for complex and severe polytraumatic injuries. They maintain a full staff of dedicated rehabilitation professionals and consultants from other

Page 9
2012 VHA Facility Quality and Safety Report Department of Veterans Affairs Veterans Health Administration
specialties related to polytrauma. The PRCs serve as resources for other facilities in the PSC, develop research and educational programs and provide system-wide consultation to assist implementation of best practice models of care.
The 22 Polytrauma Rehabilitation Network Sites (PNS) have dedicated interdisciplinary teams to manage the post-acute sequelae of polytrauma and to coordinate life-long rehabilitation services for patients within each Veterans Integrated Service Network (VISN). These sites provide a high level of expert care, a full range of clinical and ancillary services, and serve as resources for other facilities within their network which manage Veterans with severe and lasting injuries that return to their VISN area.
The 82 Polytrauma Support Clinic Teams (PSCT) are local teams of providers with rehabilitation expertise that deliver follow up services in consultation with regional and network specialists. They assist in management of stable polytrauma sequelae through direct care, consultation, and the use of tele-rehabilitation technologies, as needed. The PSCT also provides second-level comprehensive evaluation of patients who screen positive for possible TBI.
The remaining 48 VA facilities that do not have the necessary services to provide specialized care have a designated Polytrauma Point of Contact (PPOC) who is knowledgeable about the PSC, and ensures that patients are referred to a facility capable of providing the level of services required. They commonly refer to the PNS and PSCT within their VISN, and may also utilize fee-basis contracting to local civilian rehabilitation resources.
Page 9
Utilization
Acute Inpatient: Medical/Surgical. VA had a total of 499,305 Acute Inpatient Medical/Surgical hospital discharges in FY 2011 with an average system-wide length of stay of 5.2 days. The rate of discharges per 1,000 facility unique patients
was 88.4 and the rate of bed days of care per 1,000 unique patients was 450.
Unique Patients: This is the total number of unique patients at the national or facility level who received care from VA in a VA or Non-VA setting (VA Care, Non-VA Care, Home Dialysis, Observation Beds, and Pharmacy Only file sources) during FY 2011. In FY 2011, VA provided health care services to 5,795,398 unique patients.
Acute Inpatient: Mental Health. VA had a total of 86,173 Acute Inpatient Psychiatry hospital discharges in FY 2011 with an average system-wide length of

Page 10
2012 VHA Facility Quality and Safety Report Department of Veterans Affairs Veterans Health Administration
Page 10
stay of 9.0 days. The rate of discharges per 1,000 unique patients was 14.9 and the rate of bed days of care per 1,000 unique patients was 133. Outpatient Visits: VA had a total of 12,999,414 primary care outpatient visits and 37,368,512 specialty care outpatient visits in FY 2011.
Medical Procedures: In FY 2011, VA performed 429,165 outpatient endoscopy procedures in-house. Of the 5 endoscopy procedure types reported, 51 percent (220,353) were colonoscopies, 26 percent (109,934) upper GI procedures, 17 percent (74,110) ENT endoscopies, three percent (13,376) sigmoidoscopies and three percent (11,392) bronchoscopies. Facilities using the VA Cardiovascular Assessment, Reporting and Tracking System for Cardiac Catheterization Laboratories (CART-CL)4
4 www.hsrd.research.va.gov/for_managers/stories/cart-cl.cfm In FY 2011, all VA cardiac
catheterization laboratories had implemented CART-CL.
reported a total of 40,280 coronary angiographies and 11,860 percutaneous coronary interventions. In-house Radiology: In FY 2011, VA performed 1,387,010 CT, 559,625 MRI, and 149,949 Mammography procedures in-house. It should be noted that VA outsources the great majority of our Mammography; therefore, these numbers will likely be much lower as compared to Medicare or private sector data.
Community Living Centers (CLCs)
VA operates 132 CLCs. All CLCs must be fully accredited by The Joint Commission (TJC). VA’s CLC program includes an array of non-acute and post-acute services, including short-stay and long-stay, for Veterans who are medically and psychiatrically stable and require the unique services provided in this institutional post hospital setting. Admission criteria for CLCs require that the Veteran be medically and psychiatrically stable. Additionally, the primary type of service, anticipated length of stay, and anticipated discharge disposition needed must be documented. Priority for CLC use must be established and documented; special populations for which community placement is difficult receive special consideration.
It is VA policy that CLC admissions must be categorized into short-stay services or long-stay services, placed in the appropriate treating specialty.
These service categories and treating specialty codes are: (1) Short Stay
(a) Rehabilitation (64) (b) Skilled nursing care (95) (c) Restorative care (66)

Page 11
2012 VHA Facility Quality and Safety Report Department of Veterans Affairs Veterans Health Administration
(d) Maintenance care for those awaiting alternative placement (67) (e) Psychiatric care (68) (f) Dementia care (69) (g) Geriatric Evaluation and Management (GEM) (81) (h) Hospice (may exceed 90 days) (96) (i) Respite care (47)
(2) Long Stay (a) Dementia care (42) (b) Skilled nursing care (43) (c) Maintenance care (44) (d) Psychiatric care or chronically mentally ill care (45) (e) Spinal Cord Injury and Disorders (46)
DISCHARGE CRITERIA: a. The resident has met the treatment goals. b. The facility can no longer accommodate the resident due to change in
care needs. c. The resident evidences flagrant disregard for policies of the medical center
(i.e. illegal activities) after being appropriately advised of such. d. Long-stay residents who meet the criteria under Public Law 106-117 for
long stay: (1) May not be discharged to another facility or setting if they continue to require nursing home care, unless they agree to such a transfer. (2) May be discharged, if they no longer require nursing home care, such as when they have met their goals for admission and/or their condition has improved to the extent that they no longer require nursing home care.
Hospital Accreditation Status
Page 11
The Joint Commission (TJC): VA requires that all VA hospital and ambulatory care facilities utilized for the diagnosis, treatment and prevention of disease in patients meet or exceed the standards of TJC. The formal review and accreditation process by TJC demonstrates that VA medical facilities are committed to quality and performance improvement. All VA facilities undergo a triennial onsite survey that includes hospital, ambulatory, long-term care, home care and behavioral health programs. The onsite inspection examines all processes and outcomes of the medical care delivery system to include, but not limited to:
Environment of Care
Emergency Management
Human Resources
Infection Prevention and Control

Page 12
2012 VHA Facility Quality and Safety Report Department of Veterans Affairs Veterans Health Administration
Page 12
Information Management
Leadership
Life Safety
Medication Management
Medical Staff
National Patient Safety Goals
Nursing
Provision of Care, Treatment and Services
Performance Improvement
Record of Care, Treatment, and Services
Rights and Responsibility of the Individual
Transplant Safety
Waived Testing
In 2011, all VA hospital and ambulatory care facilities were fully accredited by TJC.
Commission on Accreditation of Rehabilitation Facilities (CARF): VA is committed to providing specialized treatment and quality rehabilitation care to Veterans with disabilities. These populations include Veterans with spinal cord injury and disorders (SCI/D), blindness or severely visually impaired, traumatic brain injury, amputation, serious mental illnesses, and those who are homeless. This commitment is supported through a system-wide, long-term joint collaboration with CARF to achieve and maintain national accreditation for all appropriate VA rehabilitation programs. In 2011, the VA facilities listed in this report had at least one of their rehabilitation programs accredited by CARF.
Accreditation Program for VA Clinical Laboratories: VA requires that all laboratory testing performed at VHA medical laboratories, both within medical centers or community based laboratories, utilized for the diagnosis, treatment and prevention of disease in patients, meet or exceed the requirements of the Clinical Laboratory Improvement Amendments (CLIA) of 1988. All laboratory testing, regardless of location, is subject to onsite inspection and accreditation by a nationally recognized accreditation body, such as the College of American Pathologists (CAP), the Commission on Office Laboratory Accreditation (COLA), or TJC. These accrediting bodies perform a comprehensive review which involves a biennial onsite examination of processes and outcomes of medical laboratory operations including:
• Patient Test Management • Leadership • Personnel Standards • Quality Assurance • Quality Control • Proficiency Testing • Safety

Page 13
2012 VHA Facility Quality and Safety Report Department of Veterans Affairs Veterans Health Administration
Page 13
Medical Center Staffing
VHA employed 13,710 full-time and 3,060 part-time physicians Full-Time Employee Equivalents (FTEE) in FY 2011. Nationally, there were 2.9 staff physician FTEE per 1,000 unique patients.5
5 This number excludes medical residents and other trainees, physicians who provide occasional
services without compensation, and contracted physicians.
Hours Per Patient Day (HPPD) data (also known as NHPPD - Nursing Hours per Patient Day) are an industry standard that measures the average hours of direct nursing care that patients receive per inpatient day. Data in this report are estimates that are derived from employment files and VHA’s Decision Support System (DSS), and is dependent upon accurate mapping of labor to specific patient wards. Although comparative data is available from external sources (Labor Management Institute and National Database Nursing Quality Indicators), it is important to note that VHA data includes all worked hours mapped to a ward
– e.g. both direct and indirect care.
The facility total loss rate reflects any loss, retirement, death, termination, voluntary separation or transfer that removes an employee from the selected facility. This report gives the facility total loss rate for:
Registered Nurse (occupation code 0610)
Practical Nurse (LPN) (occupation code 0620)
Nursing Assistant (occupation code 0621)
Section 2: Effective Domain Measures
ORYX Composites
Of the 139 facilities listed in this report, 127 hospitals offer inpatient acute care services and thus report hospital processes of care using TJC ORYX® measures of inpatient quality.6
6 The following facilities do not offer acute care inpatient services: Honolulu, Anchorage, Bedford,
Butler, Canandaigua, Manchester, New Orleans, Northampton, St. Cloud, Orlando, Tuscaloosa, Walla Walla, White City, El Paso, and Columbus.
Within VHA, there are four applicable core measurement sets: Acute Myocardial Infarction, Congestive Heart Failure, Community Acquired Pneumonia and the Surgical Care Improvement Project (SCIP).7
7 For further information consult:
http://www.jointcommission.org/accreditationprograms/hospitals/oryx/ .
Summary scores in the form of composite metrics are created by combining the individual measures within each core set using the “opportunities model” approach as described for Outpatient Care Composites.

Page 14
2012 VHA Facility Quality and Safety Report Department of Veterans Affairs Veterans Health Administration
Page 14
Acute Myocardial Infarction (AMI). The percent of AMI patients: o Without aspirin contraindications who received aspirin within 24 hours
of arriving at the hospital. o Without aspirin contraindications who are prescribed aspirin at hospital
discharge. o With left ventricular systolic dysfunction and without both Angiotensin
Converting Enzyme Inhibitor (ACEI) and Angiotensin Receptor Blocker (ARB) contraindications who are prescribed an ACEI or ARB at hospital discharge.
o Without beta blocker contraindications who are prescribed a beta blocker at hospital discharge.
o Receiving thrombolytic therapy during the hospital stay and having a time from hospital arrival to thrombolysis of 30 minutes or less.
o Receiving primary Percutaneous Coronary Intervention (PCI) during the hospital stay with a time from hospital arrival to PCI of 90 minutes or less.
o With elevated low-density lipoprotein cholesterol (LDL-C ≥ 130 mg/dL or narrative equivalent) who are prescribed a lipid-lowering medication at hospital discharge.
Heart Failure (HF). The percent of HF patients: o Discharged home with written discharge instructions or educational
material given to patient or caregiver at discharge or during the hospital stay addressing all of the following: activity level, diet, discharge medications, follow-up appointment, weight monitoring, and what to do if symptoms worsen.
o With documentation in the hospital record that Left Ventricular Function (LVF) was assessed before arrival, during hospitalization, or is planned for after discharge.
o With Left Ventricular Systolic Dysfunction (LVSD) and without both ACEI and ARB contraindications who are prescribed an ACEI or ARB at hospital discharge.
Pneumonia. The percent of Pneumonia patients: o Who had an assessment of arterial oxygenation by arterial blood gas
measurement or pulse oximetry within 24 hours of arriving at the hospital.
o Transferred or admitted to the ICU within 24 hours of hospital arrival, who had blood cultures performed within 24 hours prior to or 24 hours after hospital arrival.
o Whose initial emergency room blood culture specimen was collected prior to first hospital dose of antibiotics.
o Who were Immunocompetent and received their initial antibiotic during the first 24 hours that is consistent with current guidelines.

Page 15
2012 VHA Facility Quality and Safety Report Department of Veterans Affairs Veterans Health Administration
o Who were Immunocompetent ICU patients who receive an initial antibiotic regimen during the first 24 hours that is consistent with current guidelines.
o Who were Immunocompetent non-ICU patients who receive an initial antibiotic regimen during the first 24 hours that is consistent with current guidelines.
Surgical Care Improvement Project (SCIP):
Page 15
o Surgical patients who received prophylactic antibiotics within one hour prior to surgical incision.
o Prophylactic antibiotic selection for surgical patients. o Surgical patients whose prophylactic antibiotics were discontinued
within 24 hours after surgery end time. (48 hours for CABG and other cardiac surgery)
o Cardiac surgery patients with controlled blood glucose at 6 a.m. on the morning following surgery.
o Surgery patients with appropriate hair removal. o Surgery patients with peri-operative temperature management. o Patients on beta-blocker therapy prior to admission who received a
beta-blocker during the peri-operative period. o Surgery patients with recommended venous thromboembolism
prophylaxis ordered. o Surgery patients who received appropriate venous thromboembolism
prophylaxis within 24 hours prior to surgery to 24 hours after surgery.
VHA performance on core hospital measures is also reported on the Center for Medicare and Medicaid Service’s (CMS) Hospital Compare Web site, http://www.hospitalcompare.hhs.gov/. VHA performance can be compared with that of private hospitals at this site, although results may differ from this report because of differences in reporting period.
30 day Risk Adjusted Disease Mortality
Hospital-specific, risk-standardized rates of mortality within 30 days of discharge are reported for patients hospitalized with a principal diagnosis of heart attack, heart failure, and Pneumonia. For each condition, the risk-standardized (also known as "adjusted" or "risk-adjusted") hospital mortality rates are calculated using mathematical models that use administrative data to adjust for differences in patient characteristics that affect expected mortality rates.8
8 Ross J, et al. Use of administrative claims models to assess 30 day mortality among Veterans
Health Administration hospitals. Medical Care 2010; 48: 652-658.
With risk adjustment, mortality rates can be used to compare performance among
Page 16
2012 VHA Facility Quality and Safety Report Department of Veterans Affairs Veterans Health Administration
Page 16
hospitals. The mortality measures for heart attack, heart failure, and Pneumonia have been endorsed by the National Quality Forum (NQF).9
9 http://www.qualityforum.org/Home.aspx
30 day Risk Adjusted Readmission Rates
Hospital-specific, risk-standardized rates of readmission within 30 days of discharge are reported for patients hospitalized with a principal diagnosis of heart attack, heart failure, and Pneumonia. For each condition, the risk-standardized hospital readmission rates are calculated using mathematical models that use administrative data to adjust for differences in patient characteristics that affect expected readmission rates. With risk adjustment, readmission rates can be used to compare performance among hospitals.
Surgical Quality
VA’s Surgical Quality Improvement Program (VASQIP) monitors major surgical procedures performed at VHA facilities and tracks risk adjusted surgical complications (morbidity) and mortality rates. The following patient data is collected at each facility by a specially trained nurse and entered into the VA’s electronic health record: detailed preoperative patient characteristics including chart-abstracted medical conditions, functional status, recent laboratory tests, information about the surgical procedure performed, and 30-day outcomes data. A surgical procedure is classified as major if the health of the patient and the risk of the surgical procedure create any significant morbidity or mortality within 30 days after the surgical procedure. The VASQIP program analyzes this patient data using mathematical models to predict an individual patient’s expected outcome based on the patient’s preoperative characteristics and the type and nature of the surgical procedure. Overall patient outcomes for major surgical procedures are expressed by comparing observed rates of mortality and morbidity to the expected rates for those patients undergoing the procedure as observed-to-expected (O/E) ratios. For example, if, based on patient characteristics, a facility expected five deaths following major surgery, but only four patients died, the O/E ratio would be reported as 0.8. Listed in columns CM and CN are VA medical centers performing more than 400 major surgical procedures in FY 2011 and the associated O/E ratios for morbidity and mortality. As reference for this period, VASQIP analyzed 128,914 major surgical procedures performed at 126 VA medical centers. The overall 30-day unadjusted mortality and morbidity rates were 1.27 percent and 7.94 percent, respectively.

Page 17
2012 VHA Facility Quality and Safety Report Department of Veterans Affairs Veterans Health Administration
Page 17
Outpatient
Care Composites: The National Committee on Quality Assurance (NCQA)
publishes the Healthcare Effectiveness Data and Information Set (HEDIS), a recognized tool used by the majority of U.S. health plans to measure performance on important evidence-based dimensions of care and service. VHA uses a subset of measures applicable to the VA population from the HEDIS measures, and collects data on performance using a random sample of patient records that are analyzed and abstracted by trained personnel as part of VHA’s External Peer Review Program (EPRP). In this section, quality performance is reported by dimensions of care (diabetes; prevention and screening for cancer; cardiovascular care; immunization; and smoking cessation) with composite scores for each dimension calculated using an “opportunities model” approach.10
10 The opportunities model assumes that each Veteran needs and has the opportunity to receive one or more processes of care, but not all Veterans need the same care. Composite measures that use this model summarize the proportion of appropriate care that is delivered. The denominator for an opportunities model composite is the sum of opportunities (across all Veterans) to receive appropriate care across a set of individual process measures. The numerator is the sum of the components of appropriate care that are actually delivered. See Agency for Healthcare Quality and Research, National Health care Quality Report 2008, http://www.ahrq.gov/qual/nhqr08/Chap1.htm (accessed June 30, 2010).
Comparisons between facilities using these metrics should be interpreted cautiously as many factors can account for variations in scores such as differences across facilities in Veterans’ clinical and socio-economic conditions.
Diabetes Mellitus: The percentage of patients 18 to 75 years of age with diabetes (type 1 and type 2) who had each of the following:
o HbA1c testing. o Poorly controlled HbA1c >9. o LDL-C screening. o LDL-C controlled to less than 100 mg/dL. o Patients receiving any retinal screening during the report period, or
a documented refusal of a diabetic eye exam. o Patients who have received nephropathy screening. o Diabetic blood pressure <140/90: the percentage of hypertensive
adults ages 18 to 85 whose blood pressure was controlled to or below 140/90 mmHg during the past year. Both systolic and diastolic pressure readings must be at or under this threshold for blood pressure to be considered controlled.
Prevention And Screening For Cancer: o Breast Cancer Screening: The percentage of women between 50
and 69 years old who had at least one mammogram in the past two years.

Page 18
2012 VHA Facility Quality and Safety Report Department of Veterans Affairs Veterans Health Administration
o Cervical Cancer Screening: The percentage of women aged 21 to 64 enrolled in a health plan that had at least one pap test in the past three years.
o Colorectal Cancer Screening: The percentage of adults 51 to 75 years of age who have had appropriate screening for colorectal cancer.
Cardiovascular Care: o Cholesterol Management: The percentage of patients 18 to75
years of age with a diagnosis of Ischemic Vascular Disease (IVD) who received LDL-C screening and whose LDL-C concentration was controlled to <100mg/dL.
o Blood Pressure: The percentage of hypertensive adults ages 18 to 85 whose blood pressure was controlled to less than 140/90 mmHg during the past year. Both systolic and diastolic pressure readings must be at or under this threshold for blood pressure to be considered controlled.
Immunizations: o Influenza: The percentage of adults 50 years of age or older who
received an influenza vaccination during the most recent flu season.
Smoking Cessation Measures: o The percentage of current smokers 18 or older who received advice
to quit smoking from their practitioner within the past year. o The percentage of current smokers 18 or older whose practitioner
discussed or recommended smoking cessation medications with them over the past year.
o The percentage of current smokers 18 or older whose practitioner discussed or recommended smoking cessation methods or strategies with them over the past year.
Page 18
Table 1.2, External Comparisons, displays comparative system level information about outpatient performance on individual HEDIS metrics. In making comparisons, caution is warranted due to significant differences in the way VHA abstracts clinical data and defines eligible patient. Due to population
differences and methodology variations, not all HEDIS measures are comparable to VA measures; therefore, this is not a comprehensive list of indicators, but this comparison does contain those indicators that are closely aligned in content and

Page 19
2012 VHA Facility Quality and Safety Report Department of Veterans Affairs Veterans Health Administration
Page 19
methodology. 1) VA comparison data is obtained by abstracting medical record data using similar methodologies to matched HEDIS methodologies. 2) HEDIS Data was obtained from the "State of Health Care Quality Report" available on the NCQA website: www.ncqa.org. 3) HEDIS is obtained by survey, VA is
obtained by medical record abstraction. 4) BRFSS reports are available on the CDC website: www.cdc.gov. 5) Behavioral Risk Factor Surveillance System (BRFSS) survey scores are median scores. VA Scores are averages obtained by medical record abstraction. 6) Data obtained from Quality Compass, a tool available through NCQA (www.ncqa.org). 7) HEDIS HMO comparative data is used. 8) Scores calculated by using EBB standards. Scores calculated out to four decimal places, rounded at two, displayed as an integer.

Page 20
2012 VHA Facility Quality and Safety Report Department of Veterans Affairs Veterans Health Administration
Page 20
Table 1.2: External Comparisons: VHA vs. HEDIS 2009-2011
Clinical Indictor
VA Average Percent 2011 (1)
VA Average Percent 2010
(1)
VA Average Percent 2009 (1)
HEDIS Commer-
cial 2010 (1)
HEDIS Medicare 2010 (1)
HEDIS Medicaid 2010 (1)
Breast Cancer Screening 85 87 84 71 69 51
Cervical Cancer Screening 93 94 92 77 n/a 67
Cholesterol Management for Patients with Cardiovascular Conditions: LDL-C
Control (<100 mg/dL)
71 69 67 59 56 41
Cholesterol Management for Patients with Cardiovascular Conditions: LDL-C
Screening 96 96 96 89 89 82
Colorectal Cancer Screening 82 82 80 63 58 n/a
Comprehensive Diabetes Care - Blood Pressure Control (<140/90)
81 82 80 66 62 60
Comprehensive Diabetes Care - Eye Exams
90 91 88 58 65 53
Comprehensive Diabetes Care - HbA1c Testing
98 99 98 90 90 82
Comprehensive Diabetes Care - LDL-C Controlled (LDL-C<100 mg/dL)
69 70 69 48 52 35
Comprehensive Diabetes Care - LDL-C Screening
97 97 96 86 88 75
Comprehensive Diabetes Care - Medical Attention for Nephropathy
95 96 95 84 89 78
Comprehensive Diabetes Care - Poor HbA1c Control (Lower is better)
17 15 16 27 26 44
Controlling High Blood Pressure - Total 78 79 77 63 62 56
Medical Assistance with Smoking Cessation - Advising Smokers To Quit
2
92 91 n/a 77 n/a 74
Medical Assistance with Smoking Cessation - Discussing Medications
2
76 75 n/a 52 n/a 43
Medical Assistance with Smoking Cessation - Discussing Strategies
2
70 69 n/a 45 n/a 39
Flu Shots for Adults (50-64)2 71 75 n/a 53 n/a n/a
Flu Shots for Adults (65 and older)2,3
84 85 n/a n/a 67 n/a
Immunizations: Pneumococcal2,3
86 86 n/a n/a 69 n/a
SOURCE: Office of Analytics and Business Intelligence 12-19-2011
Note: Due to population differences, and methodology variations not all HEDIS measures are comparable to VA measures - therefore this is not a comprehensive list of indicators but this comparison does contain those indicators that are closely aligned in content and methodology. VA clinical data were obtained by abstracting medical record data using similar methodologies to matched HEDIS methodologies. HEDIS Data
were obtained from the 2011 "State of Health Care Quality Report" based on HMO scores (NCQA website: www.ncqa.org).
1) VA data are provided based on fiscal year. HEDIS and BRFSS data are calendar year.
2) HEDIS data were obtained by survey; VA data were obtained by Survey of Healthcare Experiences of Patient (SHEP).

Page 21
2012 VHA Facility Quality and Safety Report Department of Veterans Affairs Veterans Health Administration
Page 21
3) External scores based on BRFSS reports (CDC website: www.cdc.gov). BRFSS reports median scores.
Patient Aligned Care Teams (PACT) Metrics:
Metrics for PACTs are designed to cover three major aspects of team-based, patient-centered care: access, continuity, and coordination of care. In the interest of fostering a patient-centered approach to care, it is useful to state the measures from the patient’s perspective:
PACT patients should expect that:
• When they make an appointment it will be within seven days of when they want or need it 90 percent of the time
• When they want to see their own provider today, they can do so two out of three times
• They will see their own provider at least three out of four times they see a PCP
• Not all their needs require a face-to-face visit; 20 percent of the time it can be handled over the phone
• If they are discharged from a VA hospital, someone from their PACT will check on them within two days at least 50 percent of the time
The corresponding metrics are:
• Completed Primary Care appointments within seven days of Desired Date (Target: 90%)
• Same-day appointments with the assigned Primary Care Provider: Desired Date = Create Date=Appointment date (Target: 66%)
• Primary Care Provider (PCP) continuity: Percentage of appointments with the assigned PCP vs. appointments with other Primary Care providers or Emergency Department visits (Target: 75%)
• Percentage of telephone encounters vs. all Primary Care encounters (Target: 20%)
• Contact by Primary Care within two business days of discharge from a VHA hospital (Target: 50%)

Page 22
2012 VHA Facility Quality and Safety Report Department of Veterans Affairs Veterans Health Administration
Page 22
Section 3: Equitable Care
Outpatient Composites: Gender
This section compares the outpatient care received by men and women Veterans using HEDIS outpatient composites across VHA facilities. Currently, six percent of the users of the VHA health care system are women, but this number is projected to grow to seven percent by 2016 and eight percent by 2020.11
11 VHA Office of Enrollment and Forecasting (2011 EHCPM (By2010) Sep 30, 2010 Enrollment
File)
Although the External Peer Review Program (EPRP) uses a special augmented sample of 30,000 women ages 40 to 69 to increase the precision of the estimates of each quality measure, small sample sizes may limit the ability to compare scores for men and women for some VHA sites. Facility results are only reported if there are 100 or more women in the composite denominator. The quality of care provided to women Veterans has been considerably higher in VA than for care in the private sector, based on both gender-specific measures (e.g., screening for cervical and breast cancer) and for gender-neutral measures (e.g., management of hypertension and diabetes, treatment of elevated cholesterol, and screening for colorectal cancer). These cross-sectional results indicate that men and women generally are receiving similar technical quality of care. Notwithstanding these positive results, there are also some persistent gaps in care that are opportunities for targeted quality improvement. For example, LDL cholesterol control continues to compare less favorably for female Veterans than for male Veterans. However, taking into account the use of moderate dose statins, which lower cardiovascular risk regardless of measured LDL-C level, significantly reduces the apparent gender difference in cholesterol control. In FY12 VA will replace the LDL-C < 100 measure with one that promotes the use of moderate dose statins, no longer requiring adherence to the LDL-C cutpoint of 100.
VHA continues to pursue opportunities to identify and reduce variation in care delivery and address areas of care and service delivery that impacts the quality of care provided to female Veterans.
Outpatient Composites: Age
This section compares patients age 65 and older to patients age 65 and under on the outpatient HEDIS composites. Comparisons of the quality of outpatient care for different age groups indicates that Veterans aged 65 or older receive slightly higher levels of recommended services than Veterans younger than 65, particularly for preventive health services.

Page 23
2012 VHA Facility Quality and Safety Report Department of Veterans Affairs Veterans Health Administration
Page 23
Satisfaction with Care by Race/Ethnicity
This section provides a comparison of patient experiences according to self-reported race/ethnicity.
Urban vs. Rural (See Tables 1.3 and 1.4)
The special needs of Veterans who live in rural areas and those Veterans that have to travel further to receive health care are top priorities for VHA. In this section, determination of Urban versus Rural residence was based on the Veteran’s reported home address. Urban areas were defined by U.S. Census as urbanized areas; rural areas are all other areas excluded in U.S. Census defined as urbanized areas. Clinical data were obtained from EPRP outpatient samples in FY 2011. National and VISN weighted scores were calculated for the outpatient quality of care clinical composites (See Table 1.3). Facility level scores were not calculated because facilities may not be wholly urban or wholly rural based on geographic location. Differences of +/- five points are viewed as clinically significant. No adjustments were made for patient characteristics.

Page 24
Table 1.3: Outpatient Care Composites in Percentages, Urban vs. Rural
Outpatient Care Composites
Urban Rural Populations
Column Designator
Pct Pct Pct Pct Pct Pct Pct Pct Pct Pct
National 88 87 80 96 96 88 87 81 96 97
VA New England Health Care System - VISN 1 89 88 83 95 96 88 89 80 96 96
VA Health care Network Upstate New York - VISN 2 86 87 77 98 96 87 87 81 98 97
VA NY/NJ Veterans Health Care Network - VISN 3 87 87 80 97 97 87 85 81 97 96
VA Health care - VISN 4 88 86 83 96 97 89 87 83 95 97
VA Capitol Health Care Network - VISN 5 88 88 79 95 96 87 87 83 96 97
VA Mid-Atlantic Healthcare Network - VISN 6 87 89 79 93 96 89 89 80 96 97
VA Southeast Network - VISN 7 87 88 82 97 96 88 89 82 97 97 D
iab
etes
Mel
litu
s VA Sunshine Healthcare Network - VISN 8 88 88 81 97 96 88 88 82 98 96
VA Mid South Healthcare Network - VISN 9 86 87 78 95 96 87 87 78 95 96
VA Health Care System of Ohio - VISN 10 89 87 80 96 96 89 87 83 97 97
Veterans In Partnership - VISN 11 88 87 80 95 96 90 87 83 96 97 P
reve
nti
on
The Great Lakes Health Care System - VISN 12 88 86 83 96 97 90 89 84 97 97
VA Heartland Network - VISN 15 87 88 80 96 96 87 87 79 97 96
South Central VA Health Care Network - VISN 16 87 87 79 97 97 87 87 80 97 97 Is
chem
ic H
eart
Dz
VA Heart of Texas Health Care Network - VISN 17 87 90 79 97 96 88 90 82 96 97
VA Southwest Health Care Network - VISN 18 86 89 78 96 94 87 86 80 96 95
Rocky Mountain Network - VISN 19 88 89 80 96 96 88 88 79 96 96
Northwest Network - VISN 20 87 88 78 94 96 87 87 77 94 96 To
bac
co
Sierra Pacific Network - VISN 21 88 87 81 97 96 89 86 81 94 97
Desert Pacific Healthcare Network - VISN 22 87 85 80 97 96 88 82 81 99 95
VA Midwest Health Care Network - VISN 23 88 89 79 96 97 88 87 81 97 98 B
ehav
iora
l Hea
lth
Scre
en
ing
Dia
bet
es M
ellit
us
Pre
ven
tio
n
Isch
emic
Hea
rt D
z
Tob
acco
Beh
avio
ral H
ealt
h Sc
ree
nin
g
2012 VHA Facility Quality and Safety Report Department of Veterans Affairs Veterans Health Administration

Page 25
Table 1.4. FY 2010 Outpatient SHEP Scores, Urban vs. Rural
Outpatient SHEP Composites
Urban Rural
H
ow
elW
lo
ctD
or
s
&
Nu
rs
eso
mC
ni
mu
tca
e
Oa
ver
llin
gR
at
o
f
oP
ers
n
alo
ctD
No
r/u
r
se G
etti
ng N
eed
ed C
are
Ov
aler
la
Rin
gt
of
ea
Htl
hC
r
ae
G
etti
ng C
are
Q
uic
kly
vO
aer
lla
Rit
n
g
o
fpS
aec
isli
t
Pro
vid
er W
ait
Tim
e
(20
Min
ute
s o
r le
ss)
Ho
w W
ell D
oct
ors
&
Nu
rses
Co
mm
unic
ate
Ove
rall
Rat
ing
of
P
erso
nal
Do
cto
r/N
urs
e
Get
ting
Nee
ded
Car
e
Ove
rall
Rat
ing
of
H
ealt
h C
are
Get
ting
Car
e Q
uic
kly
Ove
rall
Rat
ing
o
f Sp
ecia
list
Pro
vid
er W
ait
Tim
e
(20
Min
ute
s o
r le
ss)
National 71 74 53 60 51 69 78 71 74 53 60 51 70 81
VA New England Health Care System - VISN 1 73 75 56 63 55 72 84 73 74 55 62 55 72 85
VA Healthcare Network Upstate New York - VISN 2 77 79 60 65 60 73 85 74 77 57 62 54 73 86
VA NY/NJ Veterans Healthcare Network - VISN 3 73 76 56 63 56 67 79 75 77 61 64 55 74 87
VA Healthcare - VISN 4 75 78 56 63 55 71 81 74 78 59 65 56 72 84
VA Capitol Health Care Network - VISN 5 74 76 55 61 52 68 80 71 74 56 62 55 71 85
VA Mid-Atlantic Health Care Network - VISN 6 69 70 49 56 47 67 82 70 73 50 60 49 70 80
VA Southeast Network - VISN 7 72 73 52 61 51 70 79 71 74 52 60 51 68 81
VA Sunshine Healthcare Network - VISN 8 73 77 53 62 52 70 76 71 74 52 61 51 71 79
VA Mid South Healthcare Network - VISN 9 71 73 53 61 52 70 75 71 73 53 61 52 69 77
VA Health Care System of Ohio - VISN 10 71 75 56 61 51 69 84 70 75 54 61 52 71 87
Veterans In Partnership - VISN 11 70 75 54 60 54 69 73 72 74 57 61 54 72 78
The Great Lakes Health Care System - VISN 12 74 75 57 62 54 69 75 72 73 52 60 54 68 81
VA Heartland Network - VISN 15 67 68 54 55 52 66 77 69 71 52 58 51 67 81
South Central VA Health Care Network - VISN 16 70 73 50 58 47 70 67 70 73 52 60 49 70 75
VA Heart of Texas Health Care Network - VISN 17 69 70 51 60 52 68 77 68 69 52 59 50 69 78
VA Southwest Health Care Network - VISN 18 69 73 48 58 47 67 70 70 75 47 58 47 67 75
Rocky Mountain Network - VISN 19 71 75 48 57 46 68 75 73 74 50 57 48 67 81
Northwest Network - VISN 20 68 70 49 53 47 65 80 67 69 47 53 47 66 82
Sierra Pacific Network - VISN 21 71 75 54 63 51 72 82 70 72 53 60 49 70 84
Desert Pacific Healthcare Network - VISN 22 69 72 49 58 47 69 75 72 73 52 60 47 71 81
VA Midwest Health Care Network - VISN 23 74 76 56 62 54 71 81 74 78 55 63 54 70 82
2012 VHA Facility Quality and Safety Report Department of Veterans Affairs Veterans Health Administration

Page 26
Page 26
Survey of Healthcare Experiences of Patients (SHEP) outpatient results found in
Table 1.4 are based on a VA model that adjusted for factors known to influence patient’s experience with care including age, education, self-reported health status, and facility characteristics. SHEP scores for VISNs and facilities will be comparable. Scores cannot be compared directly to any external reference as there is no standardized methodology for valid adjustment. The outpatient data presented here use “Top-Box” scoring. The “Top-Box” is the most positive response to CAHPS survey questions. The “Top-Box” response is "Always” for five CAHPS composites (How Well Doctors/Nurses Communicate, Getting Needed Care, Getting Care Quickly) and "‘9’ or ‘10’ (high)" for the three global ratings (Overall Hospital Rating of Health Care, Overall Rating of Personal Doctor/Nurse, Overall Rating of VA Specialist).
Both rural and urban-dwelling Veterans report satisfaction with outpatient care that is equivalent, and the quality of outpatient care remains high regardless of where Veterans reside. There were no meaningful differences (five points or more) at the national level in the scores for any of the outpatient CAHPS composites and reporting satisfaction measures for patients residing in rural or urban areas, although there is a slight trend towards higher satisfaction among rural Veterans. Within the 21 VISNs, Overall Rating of health care scores showed no meaningful differences. Only one network (VISN 6) had better Provider Wait Time (of 20 minutes or less) scores for urban patients, and all other networks reported better scores for rural patients. Indeed, eight networks had a difference of five points or more. This could be that many of the larger clinics are located in urban settings
Section 4: Safe Care
Health Care-Associated Infections
2012 VHA Facility Quality and Safety Report Department of Veterans Affairs Veterans Health Administration
The rates of health care-associated occurrences for Ventilator Associated Pneumonia (VAP), Central Line Associated Bacteremia (CLAB) and Methicillin-Resistant Staphylococcus Aureus (MRSA) in VA hospitals are tracked and reported regularly, as
these are costly and potentially preventable complications of hospitalization. The rates of VAP in VA ranged from 0 to 14.8 per 1,000 days of mechanical ventilation with pooled mean of 2.3 for medical/surgical intensive care units (ICU). Thirty-five facilities had no VAP
rate during FY 2009. The national rate for VAP in VA medical/surgical intensive care units (ICU) is 1.5 episodes per 1000 ventilator-days. Forty-two facilities had no VAP during FY 2011. By way of comparison, the Centers for Disease Control (CDC)

Page 27
Page 27
reported for 2009 a pooled mean rate of VAP of 2.0 episodes per 1000 ventilator-days among medical/surgical major teaching ICUs.12
12 Edwards, J.R., Peterson, K.D., Mu, Y., et al. (2009). National Healthcare Safety Network (NHSN)
report: Data summary for 2006 through 2008, issued December 2009. Am J Infect Control 37: 783-805.
The rates of CLAB in VA hospitals ranged from zero to 5.3 per 1,000 days of line placement with an overall mean rate of 1.1. Forty facilities had no central line associated bloodstream infections in 2011. By way of comparison, the National Healthcare Safety Network (NHSN) indicates that infection rates in 2009 range from zero (10th percentile) to 3.8 (90th percentile) per 1000 line days with a pooled mean of 1.7.
VA undertook large-scale implementation of a MRSA Prevention Initiative which includes active surveillance screening on hospital admission and transfer as well as other interventions to reduce the risk of spread of resistant bacteria13
13 Jain R, et al. Veterans Affairs Initiative to Prevent Methicillin Resistant Staphylococcus Aureus
Infections. N Engl J Med 2011; 364:1419-30.
. VA reports MRSA infection rates in both ICU and non-ICU acute care settings, and assesses rates of compliance with recommended screening practices. From the time of full
implementation of the MRSA Initiative in October 2009 through September 2011, monthly rates of MRSA health care-associated infections have decreased 38 percent in the ICU setting and have decreased 44 percent in the non-ICU acute care setting. The mean baseline rate for 2011 for ICU MRSA health care-
associated infections was 0.44 infections/1,000 bed days of care, and for the non-ICU acute care setting, this rate was 0.2 infections/1,000 bed days of care. Thirty one facilities had no cases of MRSA infections (including Acute Care and ICU).
2012 VHA Facility Quality and Safety Report Department of Veterans Affairs Veterans Health Administration
Patient Safety Measures
ICU Risk Adjusted Length of Stay. To assist in tracking the appropriate length of treatment in the ICU, VHA calculates an Observed Minus Expected Length of Stay (OMELOS), which is a risk adjusted measure of appropriate ICU utilization that accounts for characteristics of the individual patient such as age, diagnoses, and laboratory values that determine need for more intensive treatment. An OMELOS less than zero indicates that on average, Veterans in that ICU stay for a period that is shorter than what is expected based on their risk, while an OMELOS greater than zero indicates the opposite. Values for OMELOS across the VHA system ranged from -1.71 to 1.47, with a VA overall of 0.04. Insulin Induced Hypoglycemia. The parameters for optimal glucose control have been studied in literature for several years. Recent studies in the critical care population identified severe hypoglycemia (low blood glucose) as a significant risk of intensive glucose control. VA reports the proportion of patient days which include a measured

Page 28
Page 28
2012 VHA Facility Quality and Safety Report Department of Veterans Affairs Veterans Health Administration
blood glucose concentration <45mg/dl for Veterans receiving hypoglycemic agents. Only a small number of sites exceed the mean of 0.9 for <45mg/dl. Hospital Acquired Pressure Ulcer Rate. Pressure ulcer prevention is an important patient safety goal. VA reports the incidence of hospital acquired pressure ulcers (HAPU) that are Stage II or greater. Stage II pressure ulcers are when the skin breaks open, wears away, or forms an ulcer which may or may not be tender and painful. Even with appropriate medical and nursing care, sometimes pressure ulcers are unavoidable due to patient-specific factors. As a result, some VA facilities with a high proportion of very old or debilitated patients may have higher HAPU rates The Institute for Healthcare Improvement (IHI) Mentor Hospital Registry lists hospital acquired pressure ulcer incidence rates ranging from 1.14 percent to 5.07 percent. When reviewing comparative data, it is important to ensure that the incidence rate is reviewed (many health care facilities use prevalence as a measure for hospital acquired pressure ulcers).14
14
http://www.ihi.org/IHI/Programs/Campaign/mentor_registry_pu.htm
Section 5: Timely Care
Access to Care
Delivery of primary care is critical to preventative health care and timely disease identification and management.
A visit to a primary health care provider is generally also a patient’s point of entry for specialty care. As such, timely access to primary health care services is critical to providing high-quality care to Veterans.
Effective October 2012, VHA will begin reporting separately the percent of new primary care appointments completed within 14 days of the desired date for an appointment and the percent of established primary care appointments completed within 14 days of desired date. Completed appointments in specialty care will also be measured and reported against the 14 days from desired date standard for new and established patients. The desired appointment date is the date on which the patient or provider wants the patient to be seen. How VA Obtains and Uses Access Data
There is no recognized “gold standard” in the health care industry for calculating appointment timeliness, and no best way to capture the needs of patients and clinicians in a single access number. Several years ago, VA determined it would measure timeliness by comparing the date an appointment is completed with the date expressly desired by the patient or provider. That metric is tracked, reported bimonthly to facilities, and used to monitor and improve performance. VA calculates the waiting

Page 29
Page 29
2012 VHA Facility Quality and Safety Report Department of Veterans Affairs Veterans Health Administration
time using time stamps entered into VA’s Veterans Information System and Technology Architecture (VistA) scheduling software. Locally, schedulers are trained to understand the concept of desired date and enter it correctly into VistA. Training and audits are used to assure accuracy of the data. However, as for any process that relies on human input of data and judgment of patient needs, access times are only approximations of how well VA meets the needs of the Veterans it serves. At a local level, VA facility managers use waiting times along with other clinic operational indicators not reported here to understand and to improve clinic function. These other measures include third next available appointment (a measure of capacity), clinic demand, clinic supply, completed appointment rates, patient no-show rates, cancellation rates, rescheduling rates, and various measures of continuity with a specific provider. At the national level, VA drives improvement by identifying high performers and sharing their best practices with other facilities that may be performing less well.
Section 6: Patient Centered Domain Metrics
Beginning in FY 2009, the SHEP began the two-year transition from a proprietary survey with few available external benchmarks to a new public-domain survey instrument, the Consumer Assessment of Healthcare Providers and Systems (CAHPS). The CAHPS program (https://www.cahps.ahrq.gov/default.asp ) is a public-private initiative to develop standardized surveys of patient experiences with inpatient and outpatient care. Due to the administration of new surveys using CAHPS protocol, the results for FY 2009 cannot be compared with SHEP results from prior years.
We report FY 2011 hospital results for the CAHPS standardized composites and reporting measures (see list below). Composites are an aggregation of two or more individual questions, and reporting measures are based on a single question.15
15 Further detail on the calculation of CAHPS composites is available in Description of Data Elements,
Part 4 of this report.
Inpatient Composite and Reporting Measures
Outpatient Composite and Reporting Measures
Communication with Nurses
Communication with Doctors
Responsiveness of Hospital Staff
Pain Management
Communication about Medication
Cleanliness of the Hospital Environment
Quietness of the Hospital Environment
Discharge Information
Overall Rating of Hospital
Willingness to recommend Hospital
How Well Doctors/Nurses Communicate
Overall Rating of Personal Doctor/Nurse
Getting Needed Care
Overall Rating of Health Care
Getting Care Quickly
Overall Rating of VA Specialist
Provider Wait Time 20 minutes or less

Page 30
Page 30
Composites and reporting scores are calculated as the weighted percentages of survey responses. Inpatient results use population weights to reflect the numbers of patients at each facility, bedsections and other categories such as age and gender. Inpatient scores as reported here exclude responses from patients who were hospitalized in Psychiatry bedsections, because the CAHPS instrument was not designed for such settings. Outpatient results use scores from all patients seeking outpatient services, and are adjusted using population weights that reflect the numbers of patients at each facility or clinic and other categories such as age, gender and patient type (primary care new and established, non-primary care). Outpatient results are case-mix adjusted based on a VA model that accounts for factors known to influence patients’ experience with care including age, education, self-reported health status, and facility characteristics. Outpatient scores for VISNs and facilities will be directly comparable to the private sector as there is no universally recognized adjustment methodology. However, we have provided Medicare and Commercial scores from The CAHPS Comparative Database as a rough benchmark. The outpatient data presented here use “Top-Box” scoring. The “Top-Box” is the most positive response to CAHPS survey questions. The “Top-Box” response is "Always” for five CAHPS composites (How Well Doctors/Nurses Communicate, Getting Needed Care, Getting Care Quickly) and "‘9’ or ‘10’ (high)" for the three global ratings (Overall Hospital Rating of Health care, Overall Rating of Personal Doctor/Nurse, Overall Rating of VA Specialist). The inpatient survey follows the guidelines described in the “HCAHPS Quality Assurance Guidelines" published by CMS for the mail only mode of survey administration. The data presented here use “Top-Box” scoring. The “Top-Box” is the most positive response to HCAHPS survey questions. The “Top-Box” response is "Always” for five HCAHPS composites (Communication with Nurses, Communication with Doctors, Responsiveness of Hospital Staff, Pain Management, and Communication about Medicines) and two individual items (Cleanliness of Hospital Environment and Quietness of Hospital Environment), "Yes" for the sixth composite, Discharge Information, "‘9’ or ‘10’ (high)" for the Overall Hospital Rating item, and "Would definitely recommend” for the Recommend the Hospital item.
2012 VHA Facility Quality and Safety Report Department of Veterans Affairs Veterans Health Administration
To ensure that differences in HCAHPS results reflect differences in perceived hospital quality only, HCAHPS survey results were adjusted for factors beyond the control of the facility such as: service line (medical, surgical, or maternity care), categorical age, self-reported education, self-reported health status, language other than English spoken at home, age by service-line interactions, and percentile response order, also known as “relative lag time,” which is based on the time between discharge and survey completion. In addition, facility characteristics such as

Page 31
Page 31
2012 VHA Facility Quality and Safety Report Department of Veterans Affairs Veterans Health Administration
size and nurse turnover rate were also included in the model. It should be noted that the inpatient scores used the same patient-mix adjustment model which would allow VA hospitals to be directly compared to those private hospitals contributing HCAHPS data to CMS16.
16 See www.hospitalcompare.hhs.gov
Overall, VA inpatient experiences were similar to those reported by CMS on their Hospital Compare website. The only clinically meaningful was in the area of pain management, which may reflect the high prevalence of pain conditions among Veterans. While outpatient comparisons are more difficult given the lack of a common case-mix adjustment methodology, VA scores are generally similar to the commercial health plan or Medicare benchmark. Table 1.6: Adjusted* CAHPS Comparisons (Outpatient)
Outpatient CAHPS Composites and Reporting Measures
VA FY11 Commercial** 2011
Medicare*** 2011
Getting Needed Care 53 54 65
Getting Care Quickly 52 56 66
Doctor/Nurse Communication 72 73 76
Rating of Personal Dr/Nurse 75 65 76
Rating of Specialist 69 64 73
Rating of Overall Health care 61 50 62 *
Results are adjusted within VA only. The variation in survey sampling and administration protocols, as well as differences in patient characteristics renders direct comparison invalid. CAHPS Commercial and Medicare data are provided as a crude benchmark.
**Commercial results based on surveys collected from September 2010 thru June 2011; 376 health plans
***Medicare survey data were collected from February 2011 thru June 2011; 445 health plans
Table 1.7: Adjusted HCAHPS Comparisons (Inpatient) Inpatient HCAHPS Composites and Reporting Measures
VA FY11 Hospital Compare*
Cleanliness of Hospital Environment 73 71
Communication about Medications 63 60
Communication with Doctors 76 80
Communication with Nurses 73 77
Discharge Information 86 83
Pain Management 64 69
Quietness of Hospital Environment 54 58
Rating of Hospital 67 68
Responsiveness of Hospital Staff 61 64
Willingness to Recommend 72 70 *Results taken from CMS Hospital Compare website and based on surveys collected from April 2010 to March 2011

Page 32
Page 32
Section 7: Efficient Care
Ambulatory Care Sensitive Conditions Hospitalizations (Columns GB-GD)
Hospitalizations due to Ambulatory Care Sensitive Conditions (ACSCs) such as hypertension, CHF and Pneumonia are believed to be largely avoidable or preventable if ambulatory care is provided in a timely and effective manner. It has been well established that effective primary care is associated with lower hospitalizations due to ACSCs.
The issue of ACSC hospitalizations is widely recognized:
Agency for Health care Research and Quality (AHRQ) maintains an algorithm that models ACSC hospitalizations as Preventive Quality Indicators (PQI) http://www.qualityindicators.ahrq.gov/modules/pqi_resources.aspx
CMS has conducted studies evaluating ACSC hospitalizations among Medicare Fee-for-Service Beneficiaries
Institute of Medicine recommends that avoidable hospitalizations be used to monitor access to health care services
Literature on ACSC hospitalizations is extensive, such as in the Journal of the American Medical Association and Health Affairs
2012 VHA Facility Quality and Safety Report Department of Veterans Affairs Veterans Health Administration
The 12 ACSC Conditions include: Diabetes, short-term complications Perforated appendix Diabetes, long-term complications Chronic Obstructive Pulmonary Disease (COPD) Hypertension Congestive Heart Failure Dehydration Bacterial Pneumonia Urinary Tract Infection Angina without an in-hospital procedure Uncontrolled Diabetes Adult Asthma
(ICD-9 diagnosis code details associated with the above 12 ACSC conditions are available at http://www.qualityindicators.ahrq.gov/modules/PQI_TechSpec.aspx )
All ACSC Conditions: Hospitalizations per 1000 ACSC Patients: For each VA Medical Center, hospitalizations due to the ACSCs previously listed are counted as the numerator for this measure. For each VA Medical Center all patients with ACSCs are identified as the denominator for this measure. Risk standardized hospitalization rates

Page 33
Page 33
2012 VHA Facility Quality and Safety Report Department of Veterans Affairs Veterans Health Administration
derived by multivariate regression are reported for FY 2011. This metric permits the facility to understand their risk adjusted performance relative to that of the National System Average. This calculation is the facility O/E (observed over expected admissions) times the national ACSC hospitalization rate per 1000 which was 30.9 in FY 2011.
Congestive Heart Failure (CHF): Hospitalizations per 1000 CHF ACSC Patients: For each VA Medical Center, hospitalizations due to CHF, one of the ACSCs, are counted as the numerator for this measure. For each VA Medical Center all patients with CHF are identified as the denominator for this measure. Risk standardized CHF hospitalization rates derived by multivariate regression are reported for FY 2011. This metric permits the facility to understand their risk adjusted performance relative to that of the National System Average. This calculation is the facility O/E (observed over expected CHF admissions) times the national CHF hospitalization rate per 1000 which was 118.1 in FY 2011.
Pneumonia: Hospitalizations per 1000 Pneumonia ACSC Patients: For each VAMC, hospitalizations due to Pneumonia, one of the ACSCs, are counted as the numerator for this measure. For each VAMC all patients with Pneumonia are identified as the denominator for this measure. Risk standardized hospitalization rates derived by multivariate regression are reported for FY 2011. This metric permits the facility to understand their risk adjusted performance relative to that of the National System Average. This calculation is the facility O/E (observed over expected Pneumonia admissions) times the national Pneumonia hospitalization rate per 1000 which was 225.0 in FY 2011.
Note: ACSC hospitalizations with “admission source” equal to “research” and all ACSC hospitalizations resulting in death are excluded from the count of hospitalizations in the reported ACSC rates.
When benchmarking to other organizations, it is important to understand the definition of population used in the denominator. For many organizations, calculating the population (i.e. Heart Failure, Pneumonia, etc.) is difficult, if not impossible and, therefore, they will frequently utilize the total population in the denominator. The use of the total population in the denominator will produce lower hospitalization rates than those included in the VHA analysis. Additionally, the lack of Medicare, Medicaid, and/or Private Insurance diagnosis and hospitalization data (numerator and denominator) may not provide an accurate accounting of ACSC rates in patients who may rely on both VHA and Medicare for their health care.
Results
All 12 Ambulatory Care Sensitive Conditions (ACSC): VHA provided health care to 5,795,398 unique patients in FY 2011. Of these patients, 56 percent (3,245,284 of 5,795,398) were identified as having one or more of the ACSC conditions. Hospitalizations in the ACSC population represented 14 percent (100,301 of 721,985) of

Page 34
Page 34
2012 VHA Facility Quality and Safety Report Department of Veterans Affairs Veterans Health Administration
the total hospital admissions to a VA or Non-VA facility (FY 2011). The average number of ACSC admissions was 722 with a range of 57 (Coatesville, PA) to 2,373 (Gainesville, FL). The system-wide rate of ACSC Admissions per 1,000 ACSC Patients was 30.9. The observed hospitalization rates per 1,000 ACSC Patients for the 139 individual VHA facilities varied substantially from 6.3 (Coatesville, PA) to 58.4 (Beckley, WV). Risk standardized hospitalization rates ranged from 15.3 (Walla Walla, WA) to 77.3 (Anchorage, AK, Bedford, MA, and Coatesville, PA). When VHA data were adjusted for patient risk and other variables, 45 percent (63 of 139) of VHA facilities were found to have higher than expected ACSC admission rates and 55 percent (76 of 139) lower than expected rates.
Congestive Heart Failure (CHF): VHA provided health care to 5,795,398 unique patients in FY 2011. Of these patients, four percent (212,373 of 5,795,398) were identified as having a Congestive Heart Failure (CHF) condition. Hospitalizations in the CHF population represented three percent (25,084 of 721,985) of the total hospital admissions to a VA or Non-VA facility (FY 2011). The average number of CHF admissions was 180 with a range of 14 (Coatesville, PA) to 771 (Dallas, TX). The system-wide rate of CHF Admissions per 1,000 CHF patients was 118.1. The observed hospitalization rates per 1,000 CHF Patients for the 139 individual VHA facilities varied greatly from 21.5 (Coatesville, PA) to 229.1 (Anchorage, AK). Risk standardized hospitalization rates ranged from 59.2 (Iron Mountain, MI) to 295.3 (Coatesville, PA and Grand Junction, CO). When VHA data were adjusted for patient risk and other variables, 47 percent (66 of 139) of VHA facilities were found to have higher than expected CHF admission rates and 53 percent (73 of 139) lower than expected rates.
Pneumonia: VHA provided health care to 5,795,398 unique patients in FY 2011. Of these patients, 1.4 percent (80,618 of 5,795,398) were identified as having a Pneumonia condition. Hospitalizations in the Pneumonia population represented 2.5 percent (18,137 of 721,985) of the total hospital admissions to a VA or Non-VA facility (FY 2011). The average number of Pneumonia admissions was 130 with a range of seven (Coatesville, PA) to 373 (Gainesville, FL). The system-wide rate of Pneumonia Admissions per 1000 Pneumonia patients was 225.0. The observed hospitalization rates per 1000 Pneumonia patients for the 139 individual VHA facilities varied greatly from 70.8 (Coatesville, PA) to 430.8 (Beckley, WV). Risk standardized hospitalization rates ranged from 85.4 (Iron Mountain, MI) to 562.5 (Coatesville, PA and El Paso OPC, TX). When VHA data were adjusted for patient risk and other variables, 45 percent (62 of 139) of VHA facilities were found to have higher than expected Pneumonia admission rates and 55 percent (77 of 139) lower than expected rates.
Page 35
Page 35
Part 2: Adverse Event - Close Call Reporting and Patient Safety Culture in the Veterans Health Administration FY 2006 to 2011
Introduction
In 1999, the VA National Center for Patient Safety (NCPS) was established to lead the effort to improve the safety of patients cared for in the VA health care system. To allow facility, network and VHA-wide learning about adverse events, NCPS developed a standardized method for Root Cause Analysis (RCA), involving the identification of basic or contributing causal factors to adverse events or close calls and the use of that information to develop actions to address the identified causes and prevent harm to patients in the future. RCAs have the following characteristics:
· The review engages those closest to the process of care and brings in the perspective of multiple professional disciplines.
· The analysis focuses primarily on systems and processes rather than individual performance.
· The analysis digs deeper by asking “what” and “why” until all aspects of the process are reviewed and all contributing factors are identified (progressing from looking at special causes to common causes).
· The analysis identifies changes that could be made in systems and processes through either redesign or development of new processes or systems that would improve performance and reduce the risk of event or close call recurrence.
2012 VHA Facility Quality and Safety Report Department of Veterans Affairs Veterans Health Administration
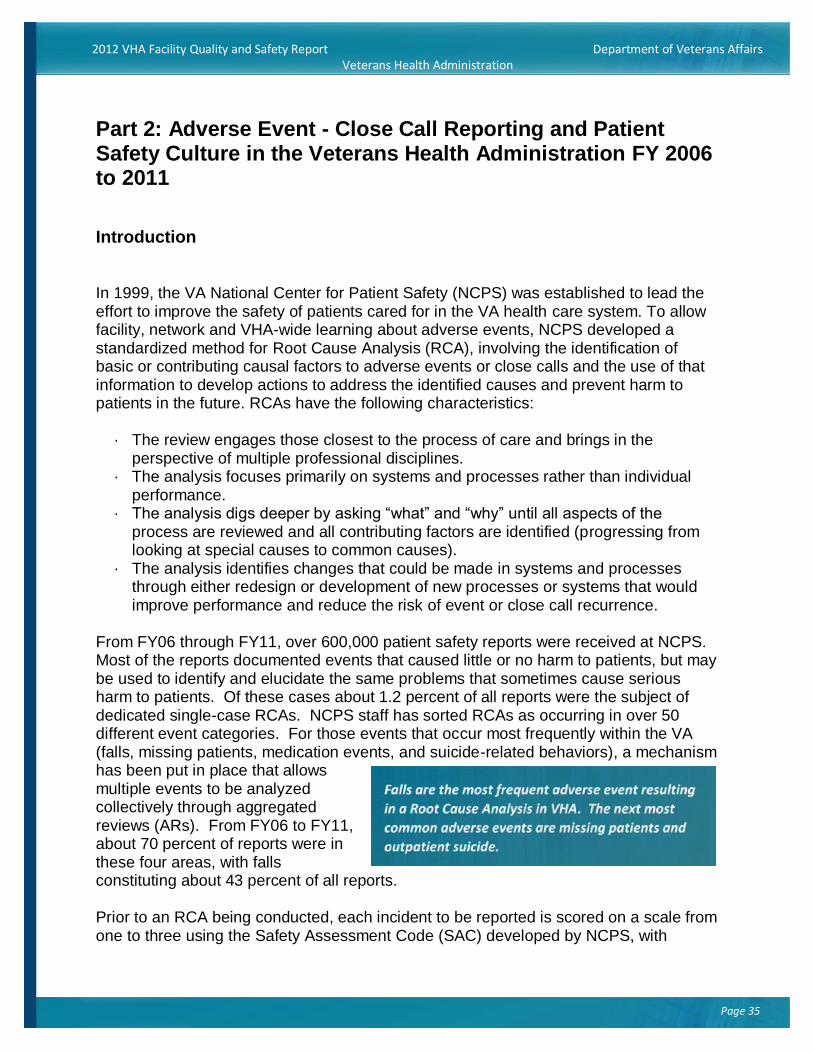
From FY06 through FY11, over 600,000 patient safety reports were received at NCPS. Most of the reports documented events that caused little or no harm to patients, but may be used to identify and elucidate the same problems that sometimes cause serious harm to patients. Of these cases about 1.2 percent of all reports were the subject of dedicated single-case RCAs. NCPS staff has sorted RCAs as occurring in over 50 different event categories. For those events that occur most frequently within the VA (falls, missing patients, medication events, and suicide-related behaviors), a mechanism has been put in place that allows multiple events to be analyzed collectively through aggregated reviews (ARs). From FY06 to FY11, about 70 percent of reports were in these four areas, with falls constituting about 43 percent of all reports.
Prior to an RCA being conducted, each incident to be reported is scored on a scale from one to three using the Safety Assessment Code (SAC) developed by NCPS, with

Page 36
Page 36
events scored three, being the most harmful or potentially harmful. Overall, 34 percent of RCAs were scored as actual SAC 3 and 66 percent scored actual SAC 1 or 2, but the ratios within different categories vary.
2012 VHA Facility Quality and Safety Report Department of Veterans Affairs Veterans Health Administration
Each RCA may identify one or more actions that, once implemented, may prevent the recurrence of similar events. The number of such actions averaged 4.4 per RCA from FY06 through FY11. Patient safety staff at the VAMC is required to report back to NCPS regarding the effectiveness of RCA actions. Overall, of actions/outcomes that were implemented and measured, 85.3 percent were rated as having made the situation better, 14.3 percent rated as about the same, and 0.4 percent rated as worse. These data, while clearly having the weakness of being self-reported, suggests that the core imperative to reduce patient harm is likely being met as VAMC staff work to improve patient safety.
TJC and VHA require that RCAs be completed within 45 days. The rate of on-time RCAs improved from 45 percent in FY06 to 98 percent in FY11. The rate of RCAs submitted after more than 90 days has decreased dramatically from 23 percent in FY06 to 0.3 percent in FY11.
T able 2.0: Root Cause Ana lysis T ime liness and Volume T rends, FY06-FY11
RCA Parameter FY2006 FY2007 FY2008 FY2009 FY2010 FY2011
Mean RCA Dura tion (Date
Aware - Da te Signed)75 66 46 42 40 40
Percent RCAs Comple ted
Within 45 Days44.5 51.2 85.4 95.7 97.7 97.7
Percent RCAs Comple ted
Within 46 to 90 Days32.7 30.6 9.8 3.2 1.5 1.9
% RCAs Comple ted Within
>90 Days22.8 18.1 4.8 1.1 0.8 0.3
T ota l Number of RCAs
Submitted1024 1224 1472 1314 1321 1186
In addition to tracking the timeliness of RCAs, NCPS staff assesses the quality of RCAs in terms of the actions contained in the RCAs, and their connections to quantifiable action measures and management concurrence. Data from FY06 to FY11 has shown steady improvement in this aspect of RCA quality. These results are presented in detail below in Figures 2.4 and 2.5.
The correlation between the number of RCA reports submitted by a health care facility and its safety has not been established, nor should it be assumed that facilities with higher rates of reported events are less (or more) safe than their peers. VHA encourages reporting in order to identify problems that need to be addressed at the local level, and in some cases nationally through responses such as patient safety

Page 37
Page 37
2012 VHA Facility Quality and Safety Report Department of Veterans Affairs Veterans Health Administration
alerts, new purchasing decisions, and new practices or policies. The data presented in this report for FY06 to FY11 suggest that facility-level VHA staff believe that the actions they have designed and implemented as part of the RCAs performed in response to adverse events and close calls have been effective. The data compiled by NCPS also shows reporting continuing to increase, timeliness of RCAs improving, and the assessed quality of RCAs submitted by VAMCs increasing.
To assess the impact that VHA NCPS has made toward affecting the culture of patient safety across the VHA, NCPS conducts a VHA-wide patient safety culture survey every three to five years. In the summer of 2011 this survey was repeated and more than 48,000 facility employees responded to the survey. Survey data were analyzed at the VHA, VISN and facility levels and detailed results were reported back to patient safety managers, patient safety officers and facility directors. A summary of results is presented below in Table 4.1.
Section 1: Events Associated with RCAs Submitted FY06 to FY11
NCPS defines adverse events as “untoward incidents, therapeutic misadventures, iatrogenic injuries or other adverse occurrences directly associated with care or services provided within the jurisdiction of a medical center, outpatient clinic or other facility.” Adverse events may result from acts of commission or omission (e.g., administration of the wrong medication, failure to make a timely diagnosis or institute the appropriate therapeutic intervention, adverse reactions or negative outcomes of treatment, etc.). Adverse events and close calls reported to NCPS are termed “safety reports,” and are scored by the facility patient safety manager along two scales: Harm (from catastrophic to minor) and Probability (from frequent to remote). Each event is coded both for the actual harm caused, and the potential harm that could have been caused. Harm and probability are combined to get a score from one to three called the SAC. Safety reports receiving the highest priority score of three on the SAC (“SAC 3s”) must be reviewed using the RCA process. Events scoring 1 or 2 may also be the subject of an RCA, at the discretion of facility management. RCAs may be performed on actual adverse events (those that cause harm) or on “close calls” (also known as “near misses”) where harm was avoided. More information is available in the VHA “National Patient Safety Improvement Handbook” (see:
includes an initial summary of the event, a final understanding of the event, including contributing factors and causes identified by the RCA team, and a specific action plan for addressing the causes. Each action plan is specified, with a timeline for implementation together with a description of how, when and by what parties the accomplishment of the corrective actions will be evaluated; all RCAs are signed by the director of the facility from which the RCA was submitted. RCAs are conducted by interdisciplinary facility teams organized by the VAMC’s patient safety manager. A recent NCPS analysis of the membership of RCA teams from FY06 through FY11 indicated that nurses were involved on at least 87 percent of RCA teams, physicians - at least 42 percent, pharmacists – at least 18 percent, and social workers and mental health professionals – 13 and 20 percent, respectively.
http://www1.va.gov/VHAPUBLICATIONS/ViewPublication.asp?pub_ID=1695). An RCA

Page 38
Page 38
2012 VHA Facility Quality and Safety Report Department of Veterans Affairs Veterans Health Administration
Single case RCA reports are submitted to the NCPS throughout the year as they occur, while ARs of four types of events (adverse drug events, falls, missing patients, and suicidal behaviors) have been submitted each year, one per quarter, for events in these four areas that score one or two on the SAC matrix. ARs may cover a few or a few dozen adverse events or close calls, and allow for the review team to look for recurring problems at the VAMC level. Table 2.1 provides a summary of the total number of adverse events and close calls reported for FY06 to FY11. Overall, of 611,358 reports, 68.4 percent were on one of the four AR topics, and 1.2 percent was the subject of dedicated RCAs. Table 2.2 shows a breakdown of the four aggregate review topics with fall events comprising 63 percent of these 418,232 reports. Of the 7,548 adverse events and close calls that were the subject of RCAs, only about a third (2,514 or 33.3 percent) were for events with an actual SAC score of three. The majority of RCAs (5,034 or 66.7 percent) were performed on events with actual SAC scores of one or two.
T able 2.1: All Reports of Adverse Events and Close Ca lls, FY06 to FY11
FY06 FY07 FY08 FY09 FY10 FY11 T OT AL
RCAs1,026 1,225 1,472 1,316 1,321 1,188 7,548
1.3% 1.4% 1.4% 1.2% 1.2% 1.1% 1.2%
Safe ty Reports20,040 25,218 30,715 35,280 37,547 36,778 185,578
25.0% 28.1% 28.3% 31.8% 33.7% 33.3% 30.4%
Safe ty Reports on Any of Four
Aggregated Review T opics
59,238 63,283 76,266 74,440 72,452 72,553 418,232
73.8% 70.5% 70.3% 67.0% 65.1% 65.6% 68.4%
T OT AL 80,304 89,726 108,453 111,036 111,320 110,519 611,358
T able 2.2: Reports of Adverse Events and Close Ca lls in Aggregated Review Categories,
FY06 to FY11
FY06 FY07 FY08 FY09 FY10 FY11 T OT AL
Fa ll36,736 40,781 46,144 44,914 46,505 48,242 263,322
62.0% 64.4% 60.5% 60.3% 64.2% 66.5% 63.0%
Missing Patient1,530 1,542 1,632 1,503 1,535 1,223 8,965
2.6% 2.4% 2.1% 2.0% 2.1% 1.7% 2.1%
Medica tion18,053 17,822 22,001 22,374 24,406 23,088 127,744
30.5% 28.2% 28.8% 30.1% 33.7% 31.8% 30.5%
Suicida l Behavior and
Outpatient Suicide
2,919 3,138 6,489 5,649 6 18,201
4.9% 5.0% 8.5% 7.6% 0.0% 0.0% 4.4%
T OT AL 59,238 63,283 76,266 74,440 72,452 72,553 418,232
The SAC scores for all the adverse events and close calls reported from FY06 to FY11 are shown in Table 2.3 and for just RCA reports in Table 2.4. In Tables 2.3 and 2.5, the approximately 600 events that received a SAC score of three, but were not the subject of individual RCAs were included in ARs.

Page 39
Page 39
2012 VHA Facility Quality and Safety Report Department of Veterans Affairs Veterans Health Administration
T able 2.3: Actua l Sa fe ty Assessment Code (SAC) Scores for All Reports of
Adverse Events and Close Ca lls, FY06 to FY11
SAC Score FY06 FY07 FY08 FY09 FY10 FY11 T OT AL
172,191 79,457 96,285 99,069 100,607 96,768 544,377
89.9% 88.6% 88.8% 89.2% 90.4% 87.6% 89.0%
27,638 9,764 11,409 11,356 10,312 13,377 63,856
9.5% 10.9% 10.5% 10.2% 9.3% 12.1% 10.4%
3475 505 759 611 401 374 3,125
0.6% 0.6% 0.7% 0.6% 0.4% 0.3% 0.5%
T OT AL 80,304 89,726 108,453 111,036 111,320 110,519 611,358
T able 2.4: Actua l Sa fe ty Assessment Code (SAC) Scores for RCAs ONLY,
FY06 to FY11
SAC Score FY06 FY07 FY08 FY09 FY10 FY11 T OT AL
1385 479 523 514 587 478 2,966
0.5% 0.5% 0.5% 0.5% 0.5% 0.4% 0.5%
2288 336 419 355 334 336 2,068
0.4% 0.4% 0.4% 0.3% 0.3% 0.3% 0.3%
3353 410 530 447 400 374 2,514
0.4% 0.5% 0.5% 0.4% 0.4% 0.3% 0.4%
T OT AL 1,026 1,225 1,472 1,316 1,321 1,188 7,548
When an RCA is submitted to NCPS, it is coded into one of over 50 categories by an analyst according to several criteria, including the event type and the activity or process associated with the event. Major event types have been defined since 2000 according to the NCPS Primary Analysis and Categorization (PAC) glossary and have been used to code all RCAs. A single event may be coded under more than one PAC event type, so the event types should not be understood as constituting a true taxonomy of mutually exclusive events types. Approximately 20 percent of RCAs are coded with two or more categories. For example, a single RCA might be coded both for “Delay in Treatment/Diagnosis/ Surgery” as well as for “Communication of Abnormal Result.” The PAC codes were designed to be useful for follow-up at the national, network, and local level. When a facility patient safety manager or network patient safety officer, or a member of the NCPS staff is working to understand the causes of a type of adverse event, or the actions that have been implemented at VAMCs in the past to try to prevent adverse events in that category, the PAC categories facilitate the rapid identification of RCAs previously submitted in a particular category. Summary VHA-wide data on the PAC codes most frequently assigned to RCAs is provided below in Figure 2.1. Reports listed in Figure 2.1 account for 80 percent of the RCA reports received at NCPS. Falls accounted for the largest number of RCA reports over this period of time with 1027. Figure 2.1 shows the frequency of fall related RCAs was ranked first or second (R1 and R2) from FY06 through FY11. Outpatient suicide RCAs was ranked seven (R7) in frequency in FY07 and has consistently increased to the ranking of second (R2) among all type of RCA reports in FY11.
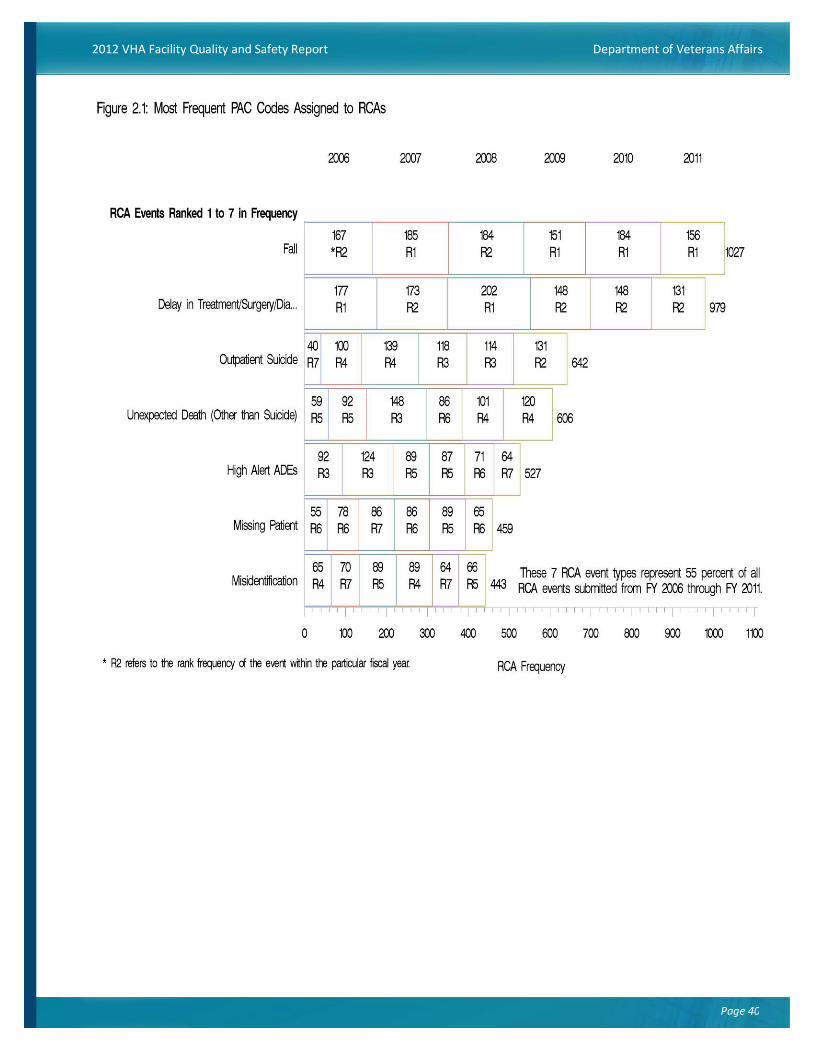
Page 40
Page 40
2012 VHA Facility Quality and Safety Report Department of Veterans Affairs Veterans Health Administration

Page 41
Page 41
2012 VHA Facility Quality and Safety Report Department of Veterans Affairs Veterans Health Administration
The information in Figures 2.2 through 2.3 below are drawn from the PAC codes for all individual RCAs submitted from FY06 through FY11 (7,548). Individual RCA cases may have multiple PAC codes. Figure 2.2 provides information on the SAC scores associated with the RCAs summarized from Figure 2.1. It is clear from the variation in SAC scores that the locally-assessed severity and likelihood of recurrence of events associated with different types of events varies, i.e., that some reported event types, when receiving single case RCAs, tend to have higher SAC scores than others.

Page 42
Page 42
2012 VHA Facility Quality and Safety Report Department of Veterans Affairs Veterans Health Administration
As stated above, RCAs include action plans, and part of the local follow-up on each RCA is to report back to NCPS after implementation and measurement on the actions to provide an assessment or perception of the effectiveness of the actions. Figure 2.3 provides the number of actions associated with the RCAs presented in Figures 2.1-2.2 above, as well as effectiveness data reported by the submitting facility. This data suggests that staff perceive the actions that are implemented as a result of conducting an RCA have a positive impact on safety.

Page 43
Page 43
2012 VHA Facility Quality and Safety Report Department of Veterans Affairs Veterans Health Administration
RCAs constitute about 1.2 percent of all adverse events and close calls reported in VHA. Overall, these counts of PAC event codes provide data on the individual adverse events that were studied in most depth by VAMCs. Approximately 43 percent of all events reported to NCPS were falls, and virtually all of these were included in an AR or the subject of an individual RCA. Those adverse events and close calls that were not the subject of an individual RCA or included in an AR were not reviewed in-depth at the VAMC level by an official VHA patient safety process, but may have received an informal ad hoc or other type of review at the facility or network level. These reports are discussed more in Section 3 below. A glossary of definitions of the PAC categories used in Figures 2.1 through 2.4 can be found at http://www.patientsafety.gov/PACGlossary.pdf.

Page 44
Page 44
2012 VHA Facility Quality and Safety Report Department of Veterans Affairs Veterans Health Administration
Section 2: Timeliness and RCAs Possessing “Strong Strings” A formal recognition program was initiated by NCPS in 2008 to help enhance the RCA process and recognize the good work done for patient safety at the facility level. Core concepts which shaped the program include:
the criteria must support the current patient safety program, without instituting
new requirements;
criteria must be consistent with the
objectives of the RCA process;
and
it should build upon current
program data and not require
additional data collection.
With these core concepts in mind, the Annual RCA Cornerstone Recognition program was formed. The idea was that each facility should be measured against the same standard criteria and facilities would receive recognition according to applied levels of achievement. After consultation with the Patient Safety Officers and leadership in the field, NCPS launched the program in FY 2008. Timeliness and RCAs possessing strong strings were metrics used in the Cornerstone Recognition program. VHA leadership has stressed the importance of completing RCAs within 45 days. Forty-five days for completion of an RCA is a TJC standard for sentinel events and also a requirement included in the VHA Patient Safety Improvement Handbook. Timely RCAs help assure that actions in response to adverse events and close calls are implemented rapidly, so as to reduce potential risk for future patients. As shown in Figure 2.4, from FY01 through FY11 great progress has been made in the timeliness of RCAs, even as the overall number of RCAs submitted has increased. As stated above, RCAs constitute only about 1.2 percent of all reported adverse events and close calls, so an increase in RCAs does not necessarily represent an increase or decrease in adverse events or overall patient harm. Figure 2.4 shows that 45-day compliance has gone from below 40 percent in FY01 to 97 percent in FY11. The rows of numbers labeled “n” at the bottom of the graph show the non-mutually exclusive facility counts in each of the three timeliness groups (<=45, 45-90, >90 days) at each FY. In 2001 only 111 of all VHA facilities submitted any RCAs within 45 days; 89 facilities had RCAs submitted that exceeded 45 days, but less than 90 days; and 89 facilities had RCAs submitted beyond 90 days. In 2011 these numbers improved dramatically to where 145 facilities submitted RCAs within 45 days; while only 2 facilities submitted RCAs greater than 90 days.

Page 45
Page 45
2012 VHA Facility Quality and Safety Report Department of Veterans Affairs Veterans Health Administration
As important as timeliness in completing the RCA may be, it is not sufficient to ensure that meaningful actions are identified and implemented by the health care facility. The safety movement within other industries has longed recognized that certain actions are much more likely to have robust and lasting effect in preventing the recurrence of similar events. Other actions, like training, may have less durable effects particularly in complex and dynamic situations. In order to quantify the degree to which an RCA contains actions likely to have a durable impact on patient safety, we have coined the term “strong string”. An RCA is considered as having a "strong string" if it possesses: 1) An action with “stronger” or “intermediate” strength; 2) A quantifiable outcome measure; 3) Management concurrence (on the stronger or intermediate action). Figure 2.6 shows the VHA-wide performance in this area across FY Quarters. Figure 2.5 shows a significant rate increase (p<0.05) across pre and post periods of cornerstone in the percentage of RCAs with strong strings. At cornerstone intervention (2008) there was no immediate significant change in the percentage of strong strings, and the rate/slope increased moderately post-cornerstone intervention (p=0.085). The graph demonstrates the steady progress that has been made in the quality of RCAs as

Page 46
Page 46
2012 VHA Facility Quality and Safety Report Department of Veterans Affairs Veterans Health Administration
measured by their inclusion of human-factor-engineering based action plans with quantifiable outcome measures.
Section 3: Information on Reports That Were Not the Subject of Single Case RCAs or Aggregate Reviews
Figure 2.6 provides summary data on safety reports that are not subject to RCA or aggregate review. Safety Report data includes reports where actual and potential SAC scores are both less than three, the facility is not required to do an RCA. Failing to enter a Safety Report into the NCPS database deprives others throughout the VA of information that can be used to identify and address systemic vulnerabilities. Whether in program development, such as ensuring correct surgery, or investigating other areas, such as tissue processing in labs or retained foreign objects, Safety Reports have been a critical component of safety programs, and have been invaluable in mitigating potential hazards. The requirement to enter this data has been clearly communicated at all levels of the organization, and is considered a required and critical component of a

Page 47
Page 47
2012 VHA Facility Quality and Safety Report Department of Veterans Affairs Veterans Health Administration
well-functioning program (http://vaww.ncps.med.va.gov/Publications/TIPS/Docs/TIPS_MarApr05.pdf#page=1). Figure 2.6 indicates that the facility average number of Safety Reports entered into the NCPS patient safety database is around 52 per 10,000 unique patients. Unique patient information across facilities was obtained from: (http://vaww.arc.med.va.gov/reports/annual/annual_reports_toc.html). The graph illustrates a large variation in the reporting of these events by the individual facilities. It is important to understand while interpreting this graph that a higher rate of reporting may indicate the facility’s healthy willingness to examine all opportunities to improve safety and performance, and is preferable to a facility submitting no safety reports.

Page 48
Page 48
2012 VHA Facility Quality and Safety Report Department of Veterans Affairs Veterans Health Administration
Section 4: Patient Safety Culture Survey
NCPS conducts a VHA-wide patient safety culture survey every three to five years to assess patient safety culture. Four national surveys have been conducted since 2000, the latest occurring in 2011 with more than 48,000 respondents. Table 2.5 lists the general themes of the 14 dimensions that make up the survey. Table 2.6 shows an analysis from the 2011 survey comparing occupational groups across the 14 dimensions of the survey, plus a separate single question (q65).
Each component question of the 14-dimensions has Likert (1-5) responses where one is worst and five best. The analysis uses ordinary least squares regression with indicator variables used for occupational groups. Dimension averages are displayed in the table wherever the regression analysis determines that an occupational group has a dimension with significantly (p<0.05) lower or higher scores among its sample population compared to the VHA sample population as a whole. Shaded cell averages indicate significantly lower scores and non-shaded cell averages indicate significantly higher scores. Blank cells indicate no significant occupation difference compared with the VHA sample population scores. The VHA sample population averages are listed in the second row of the table for comparison purposes.
Patterns of higher and lower patient safety culture dimension scores among occupational groups can quickly be discerned from the table. This is made particularly evident when looking at the different nursing occupation groups and their dimension scores. Dimension scores of RN Level I and II responders are significantly more likely to be lower than responses from RN Levels III, IV and V. Table 2.6 is most useful as a high-level starting point towards drilling deeper into VISN and then facility level data. To that end, this diagnostic technique was also used to compare different demographic features, including occupation codes, of responders within facilities and these results were made available to each patient safety program manager.

Page 49
Page 49
2012 VHA Facility Quality and Safety Report Department of Veterans Affairs Veterans Health Administration
Table 2.5: Patient Safety Culture Survey Dimensions
Dimension Descriptor
1 Overall Perceptions of Patient Safety
2 Non-punitive Response to Error
3 Education/Training/Resources
4 Shame
5 Communication, Openness
6 Teamwork within Hospital Units
7 Teamwork across Hospital Units
8 Organizational Learning—Continuous Improvement
9 Feedback & Communication about Error
10 Job Satisfaction
11 Patient Safety in Comparison to Other Facilities
12 Perceptions of Patient Safety at your Facility
13 Senior Management Awareness/Actions in Promoting Patient Safety
14 Frequency of Event Reporting
Q65 Perception of Overall Patient Safety Grade

Page 50
2012 VHA Facility Quality and Safety Report Department of Veterans Affairs Veterans Health Administration
Table 2.6: Overall VHA Dimension Averages
DIM 1 DIM 2 DIM 3 DIM 4 DIM 5 DIM 6 DIM 7 DIM 8 DIM 9 DIM 10 DIM 11 DIM 12 DIM 13 DIM 14 Q65
4.04 3.55 3.64 3.40 3.61 3.70 3.30 3.85 3.53 4.20 3.41 3.95 3.65 3.88 3.88
Occupation_Code (2011)
Administrative employee at or above the GS-15 and Title 38
equivalent level including members of facility, VISN, and CO
program office senior leadership teams(n=183)
4.48 4.12 4.28 3.65 4.12 4.33 4.02 4.52 4.23 4.66 3.95 4.49 4.55 4.11 4.47
Administrative or clerical employee working in a clinical area (for
example a Ward Secretary, Radiology Receptionist)(n=1276)3.98 3.50 3.58 3.47 3.53 3.55 3.76 4.11 3.35 3.84 3.58
Administrative, technical or professional employee at GS-9
through GS-12(n=4602)4.11 3.63 3.82 3.63 3.79 3.42 3.91 3.58 3.97 3.77 3.93 3.94
Administrative, technical or professional employee GS-13 or GS-
14(n=1338)4.25 3.85 4.05 3.46 3.88 4.12 3.63 4.19 3.87 4.42 3.66 4.20 4.10 4.09 4.15
Canteen employee(n=102)
Certified Registered Nurse Anesthetist (CRNA)(n=104) 3.25 3.24 3.09 3.20 3.42 3.61
Chaplain(n=260) 4.31 3.72 3.85 3.76 4.21 3.76 4.05 3.80 4.56 3.58 4.16 3.98 4.17
Chief Officer(n=49) 3.90 3.91 3.68 3.95 4.37 3.85 4.27 4.04 4.52 3.68 4.25 4.39 4.18 4.24
Chiropractor(n=13) 4.46
Clinical laboratory employee excluding administrative support
employees (for example Medical Technologists and
Technicians)(n=1278)
3.48 3.68 3.26 3.53 3.40 3.73 3.41 4.09 3.31 3.86 3.57 3.97 3.78
Clinical Nurse Specialist(n=152) 3.43 3.31 3.18 3.48 3.69 3.64
Contract Specialists GS-1102(n=106) 3.79 3.40 3.66 3.96 3.77 3.71
Dentist(n=226) 4.44 3.74 3.84 3.86 3.99 3.63 3.99 3.92 4.34 3.72 4.32 4.03 4.33
Diagnostic Imaging Technician excluding administrative support
employee (for example Diagnostic X-Ray or Nuclear
Medicine)(n=659)
4.15 3.53 3.52 3.74 3.42 4.27 4.02 3.53
Educator/Learning Officer (for example Nursing Educator,
Designated Learning Officer, Designated Education
Officer)(n=177)
3.69 3.98 3.98 4.35
Housekeeping employees at WG-1 through WG-3(n=676) 3.95 3.38 3.52 3.45 3.52 3.40 4.07 3.49 3.83 3.74 4.01
LPN(n=1649) 3.52 3.52 3.55 3.17 4.26 3.59 4.02
Nurse Practitioners(n=660) 3.49 3.16 3.75 3.32 3.29 3.51 3.78 3.76
Nursing Assistant(n=1205) 3.96 3.45 3.55 3.53 3.46 3.63 4.30 3.90 4.00
Optometrist(n=82) 3.24 3.58 4.15
Other administrative, technical, professional or clerical employee
at GS-1 through GS–8(n=6645)3.98 3.52 3.70 3.45 3.56 3.60 3.34 3.79 4.13 3.88 3.82
Other certified or licensed hands-on direct patient care provider
(for example a Dietitian)(n=1384)4.17 3.61 3.68 3.35 3.48 4.32 4.06 3.80 3.97
Other non-licensed hands-on direct patient care provider(n=780) 4.12 3.48 3.39 4.34 4.02 3.99
Other WG employees at WG-1 through WG-4(n=348) 3.83 3.36 3.50 3.39 3.36 3.71 4.01 3.77 3.55 3.65
Pharmacist(n=1177) 3.99 3.61 3.55 3.17 3.38 3.72 3.82
Pharmacy Technician(n=616) 3.46 3.52 3.54 3.33 3.22 3.75 4.10 3.30 3.86 3.57 3.98
Physical Medicine Therapist (for example a PT, OT or KT)(n=793) 4.21 3.73 3.68 3.87 4.32 4.04 3.75
Physician - All other physicians(n=399) 4.23 3.64 3.72 3.33 3.83 3.96 3.42 3.96 3.67 3.58 4.09 3.85 4.04
Physician - Anesthesiologist(n=84) 4.29 3.37 4.01 4.40 3.64 4.15 4.12
Physician - Medicine including all sub-specialties(n=505) 3.30 3.77 3.97 3.43 3.51 4.03 3.78
Physician - Primary Care(n=93)
Physician - Psychiatrist(n=444) 3.52 3.31 3.96 4.08 3.76
Physician - Surgeon including all sub-specialties(n=332) 4.19 3.77 3.96 3.40 3.63 4.04 4.04
Physician Assistant(n=234) 3.28 3.71 3.36 3.53
Podiatrist(n=45) 4.17
Police Officer(n=520) 3.73 3.33 3.44 3.33 3.37 3.46 3.19 3.65 3.44 3.92 3.32 3.63 3.49 3.68 3.62
Psychologist(n=840) 4.17 3.31 3.54 3.95 3.24 3.74 3.42 4.04 3.70
Respiratory Therapist (for example a RRT or CRTT)(n=336) 3.88 3.46 3.49 3.50 3.60 3.32 3.24 3.77 3.37 3.61 3.65
RN - Level I(n=1482) 3.94 3.47 3.41 3.61 3.09 3.81 3.49 3.32 3.49 3.72
RN - Level II(n=5112) 3.97 3.48 3.46 3.37 3.66 3.12 3.45 4.17 3.35 3.90 3.47 3.91 3.72
RN - Level III(n=2844) 3.64 3.65 3.85 3.22 4.00 4.29 3.98 3.84
RN - Level IV(n=292) 4.25 3.89 3.85 3.59 3.91 4.13 3.55 4.32 3.95 4.50 3.65 4.23 4.16 4.12 4.18
RN - Level V(n=84) 4.24 4.06 3.96 3.60 4.04 4.13 3.89 4.44 4.04 4.46 3.71 4.30 4.41 4.21
Social Worker(n=2079) 3.58 3.49 3.54 3.87 3.19 3.76 3.42 4.26 3.36 3.77 3.82
WG Employee at WG-5 through WG-8(n=641) 3.45 3.51 3.61 3.39 3.78 3.88 3.97
WG Employee at WG-9 or above(n=489) 3.87 3.35 3.46 3.30 3.37 3.56 3.65 3.30 4.11 3.34 3.74 3.39 3.47
Work Leader (WL) or Work Supervisor (WS)(n=530) 3.49 3.66 3.75 4.04

Page 51
Page 51
2012 VHA Facility Quality and Safety Report Department of Veterans Affairs Veterans Health Administration
Part 3: VHA Facility Quality & Safety Data Tables
The following sections are available on the VA Quality of Care Web Site using the following link http://www.va.gov/qualityofcare/reports/vha-quality-safety-data-tables-2012.xlsx
Section 1: Services, Staffing, Treatment Volumes and Accreditation
Section 2: Effective Care
Section 3: Equitable Care
Section 4: Safe Care
Section 5: Timely Care
Section 6: Patient Centered Care
Section 7: Ambulatory Care Sensitive Conditions Hospitalizations
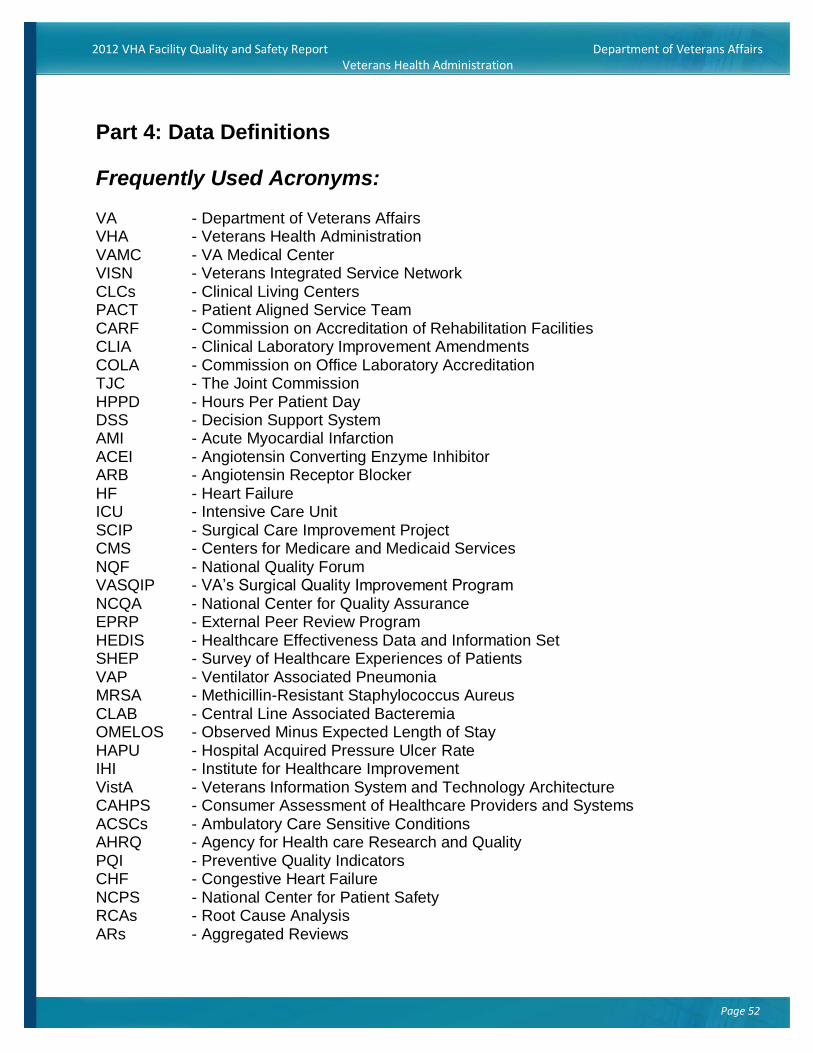
Page 52
Page 52
2012 VHA Facility Quality and Safety Report Department of Veterans Affairs Veterans Health Administration
Part 4: Data Definitions
Frequently Used Acronyms:
VA - Department of Veterans Affairs VHA - Veterans Health Administration VAMC - VA Medical Center VISN - Veterans Integrated Service Network CLCs - Clinical Living Centers PACT - Patient Aligned Service Team CARF - Commission on Accreditation of Rehabilitation Facilities CLIA - Clinical Laboratory Improvement Amendments COLA - Commission on Office Laboratory Accreditation TJC - The Joint Commission HPPD - Hours Per Patient Day DSS - Decision Support System AMI - Acute Myocardial Infarction ACEI - Angiotensin Converting Enzyme Inhibitor ARB - Angiotensin Receptor Blocker HF - Heart Failure ICU - Intensive Care Unit SCIP - Surgical Care Improvement Project CMS - Centers for Medicare and Medicaid Services NQF - National Quality Forum VASQIP - VA’s Surgical Quality Improvement Program NCQA - National Center for Quality Assurance EPRP - External Peer Review Program HEDIS - Healthcare Effectiveness Data and Information Set SHEP - Survey of Healthcare Experiences of Patients VAP - Ventilator Associated Pneumonia MRSA - Methicillin-Resistant Staphylococcus Aureus CLAB - Central Line Associated Bacteremia OMELOS - Observed Minus Expected Length of Stay HAPU - Hospital Acquired Pressure Ulcer Rate IHI - Institute for Healthcare Improvement VistA - Veterans Information System and Technology Architecture CAHPS - Consumer Assessment of Healthcare Providers and Systems ACSCs - Ambulatory Care Sensitive Conditions AHRQ - Agency for Health care Research and Quality PQI - Preventive Quality Indicators CHF - Congestive Heart Failure NCPS - National Center for Patient Safety RCAs - Root Cause Analysis ARs - Aggregated Reviews

Page 53
Page 53
2012 VHA Facility Quality and Safety Report Department of Veterans Affairs Veterans Health Administration
SAC - Safety Assessment Code PAC - Primary Analysis and Categorization

Page 54
Section 1: Infrastructure
COL Metric Description of the Data Element
SECTION 1: Services, Utilization, Staffing and Accreditation
Available Hospital Services
A Acute Medical/Surgical Services
Acute Inpatient: Medical/Surgical: A facility is designated as having acute medicine or surgery in-house services available if the number of discharges from acute medicine or surgery discharging bed sections in a VA hospital setting is greater than ten. Note: A facility is designated as “No” if they have acute medicine discharges and no acute surgery discharges; however, a facility with acute medicine discharges, average length of stay, and bed day of care measures are reported under the acute inpatient Medical/Surgery Utilization section of the report.
B Acute Mental Health Services Acute Inpatient Mental Health: A facility is designated as having acute mental health services available if the number of discharges from acute psychiatry discharging bed a VA Hospital setting is greater than ten.
in-house sections in
C Intensive Care Unit
Intensive Care Unit: A facility is designated as having an intensive care unit based on the national VA ICU survey. Medical centers and VISNs need to meet established ICU criteria that would establish their level of care from Highly complex (level 1) to Basic (level 4). Updates to the level of ICU care can be made anytime during the year in collaboration with the National Program Director for Pulmonary/Critical Care. (ICU Levels: 1-Complex, 2-Complex, 3-Moderate or 4-Basic based on the results of the FY 2007-2008 HAIG ICU Level Survey and on-going updates through the Inpatient Evaluation Center ( IPEC).
D Emergency Dept
Emergency Room Department: A facility is designated as having an emergency department available if there is outpatient encounter workload recorded using primary or secondary Decision Support System (DSS - VA’s Managerial Cost Accounting System) Identifier of 130-Emergency Department.
E Urgent Care clinics Urgent Care Clinics: A facility is designated as having an urgent care unit available if there is outpatient encounter workload recorded using primary or secondary Decision Support System (DSS) (VA’s Managerial Cost Accounting System) Identifier of 131-Urgent Care Unit.
F Community Living Center Community Living Centers: A facility is designated as having VA community living centers
2012 VHA Facility Quality and Safety Report Department of Veterans Affairs
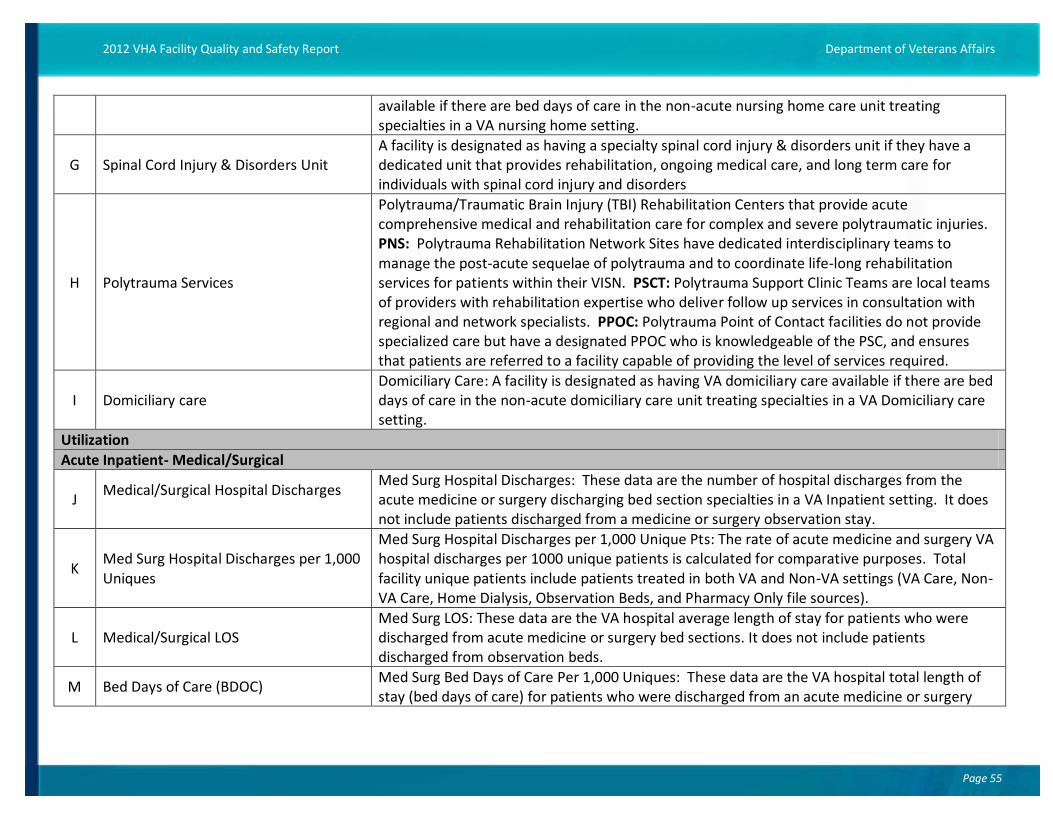
Page 55
2012 VHA Facility Quality and Safety Report Department of Veterans Affairs
available if specialties
there are bed days of care in in a VA nursing home setting.
the non-acute nursing home care unit treating
G Spinal Cord Injury & Disorders Unit A facility is designated as having a specialty spinal cord injury & disorders unit if they have a dedicated unit that provides rehabilitation, ongoing medical care, and long term care for individuals with spinal cord injury and disorders
H Polytrauma Services
Polytrauma/Traumatic Brain Injury (TBI) Rehabilitation Centers that provide acute comprehensive medical and rehabilitation care for complex and severe polytraumatic injuries. PNS: Polytrauma Rehabilitation Network Sites have dedicated interdisciplinary teams to manage the post-acute sequelae of polytrauma and to coordinate life-long rehabilitation services for patients within their VISN. PSCT: Polytrauma Support Clinic Teams are local teams of providers with rehabilitation expertise who deliver follow up services in consultation with regional and network specialists. PPOC: Polytrauma Point of Contact facilities do not provide specialized care but have a designated PPOC who is knowledgeable of the PSC, and ensures that patients are referred to a facility capable of providing the level of services required.
I Domiciliary care Domiciliary Care: A facility is designated as having days of care in the non-acute domiciliary care unit setting.
VA domiciliary care available if there are bed treating specialties in a VA Domiciliary care
Utilization
Acute Inpatient- Medical/Surgical
J Medical/Surgical
Hospital Discharges Med Surg Hospital Discharges: These data are the number of hospital discharges from acute medicine or surgery discharging bed section specialties in a VA Inpatient setting. not include patients discharged from a medicine or surgery observation stay.
the It does
K Med Surg Uniques
Hospital Discharges per 1,000 Med Surg Hospital Discharges per 1,000 Unique Pts: The rate of acute medicine and surgery VA hospital discharges per 1000 unique patients is calculated for comparative purposes. Total facility unique patients include patients treated in both VA and Non-VA settings (VA Care, Non-VA Care, Home Dialysis, Observation Beds, and Pharmacy Only file sources).
L Medical/Surgical LOS Med Surg LOS: These data are the VA hospital average length of discharged from acute medicine or surgery bed sections. It does discharged from observation beds.
stay for patients who not include patients
were
M Bed Days of Care (BDOC) Med Surg stay (bed
Bed days
Days of Care Per 1,000 Uniques: These data are the VA hospital total of care) for patients who were discharged from an acute medicine or
length of surgery

Page 56
2012 VHA Facility Quality and Safety Report Department of Veterans Affairs
bed section (excluding observation patients). The rate of acute medicine and surgery VA hospital bed days of care per 1000 unique patients is calculated for comparative purposes. Total facility uniques includes patients treated in both VA and Non-VA settings (VA Care, Non-VA Care, Home Dialysis, Observation Beds, and Pharmacy Only file sources).
N # Facility Unique Patients Unique Patients: This is the total number of unique patients at the national and facility who received care in a VA or Non VA setting (VA Care, Non-VA Care, Home Dialysis, Observation Beds, and Pharmacy Only file sources) during the reported timeframe.
level
Acute Inpatient- Mental Health
O Mental Health Hospital Discharges Mental Health Hospital Discharges: These data are the number of hospital discharges from acute psychiatry discharging bed section specialties in a VA Inpatient setting. It does not include patients who were discharged from psychiatry observation.
the
P Mental Health 1,000 Uniques
Hospital Discharges per Mental Health Hospital Discharges per 1,000 Uniques: The rate of acute mental health VA hospital discharges per 1000 unique patients is calculated for comparative purposes. Total facility uniques includes patients treated in both VA and Non-VA settings (VA Care, Non-VA Care, Home Dialysis, Observation Beds, and Pharmacy Only file sources).
Q Mental Health LOS Mental Health ALOS: These data are the VA hospital average length of stay for patients who were discharged from an acute psychiatry bed section. It does not include patients discharged from an observation bed.
R MH Bed Days of Care
Mental Health Bed Days of Care Per 1,000 Uniques: These data are the VA hospital total length of stay (bed days of care) for patients who were discharged from an acute psychiatry bed section (excluding observation patients). The rate of acute psychiatry VA hospital bed days of care per 1000 unique patients is calculated for comparative purposes. Total facility uniques includes patients treated in both VA and Non-VA settings (VA Care, Non-VA Care, Home Dialysis, Observation Beds, and Pharmacy Only file sources).
Outpatient Visits
S Primary care visits
Primary Care Outpatient Visits: These data are the VHA unduplicated encounters for outpatients who were seen in a Primary Care Clinic Stop 323 (also includes patients seen for comprehensive women's primary care (322) and geriatric primary care (350)). VHA primary care gives eligible veterans easy access to health care professionals familiar with their needs. It provides long-term patient-provider relationships, coordinates care across a spectrum of health services, educates, and offers disease prevention programs. Primary care now serves as the

Page 57
2012 VHA Facility Quality and Safety Report Department of Veterans Affairs
foundation of VHA health care and has become the first point of contact with the health care system for veterans enrolled in VHA.
Specialty Care Outpatient Visits: These data are the VHA unduplicated encounters for outpatients who were seen in a VHA facility for a broad array of Geriatric, Medicine, Mental Health, Physical Medicine & Rehabilitation, or Surgical Specialty Care services. Specialty Care is a critical component of the comprehensive medical benefits package of healthcare services provided directly by the VHA and/or arranged for outside of VHA to meet the needs of our
T Specialty care visits Veterans. (Examples of medicine and surgical specialty care include Allergen Services, Anesthesia Services, Cardiology, Critical and Pulmonary Care, Diabetes and Endocrinology, Dermatology, Emergency Medicine, Gastroenterology, Infectious Diseases, Neurology Services, Nephrology, Oncology, Ophthalmology, Optometry, Pain Management, Podiatry, and Rheumatology)
Outpatient Medical Procedures
U Upper GI endoscopy Data was obtained from the National Patient Care Database (NPCD) outpatient encounter file.
V Colonoscopy All encounters containing a CPT procedure code for one of these types of endoscopies were
W Sigmoidoscopy included in the counts [list of CPT codes used available upon request]. This data displays the
X Bronchoscopy counts for five types of endoscopic procedures performed at VA facilities during the reporting period. These procedures were performed by VA salaried, fee and contract providers on VA premises. Procedures paid for by VA but performed offsite (community fee) are not included in
Y ENT endoscopy these counts. Data is only limited by the accuracy of the CPT codes provided on the encounter record.
Z Coronary angiography The number coronary angiography and performed. The source of these data is
percutaneous coronary intervention/PCI procedures the VA CART Program. There are local variances in
AA Percutaneous coronary intervention procedure coding, these numbers may be different than codes for these procedures in Austin
Medical Imaging Services
AB CT scans A computed tomography (CT) scan sectional pictures of the body.
is an imaging method that uses x-rays to create cross-
AC MRI scans Magnetic resonance imaging (MRI) is an imaging of radio wave energy to make pictures of organs
method that uses a magnetic field and structures inside the body.
and pulses
AD Mammography Mammography is a radiographic technique that uses low-dose x-ray to exam the breast for cancer.

Page 58
2012 VHA Facility Quality and Safety Report Department of Veterans Affairs
Community Living Centers
AE Average Daily Census (ADC) Average number of residents receiving care each day during a given time period.
AF Unique Residents This is the total number of newly living center during the reported
admitted residents timeframe.
who received care in a VA community
AG Long Stay Dementia Care (42)
Although dementia specific care may be delivered in any nursing home environment where the safety of the resident is protected, the environment is appropriately stimulating, and staff competencies are evident, dementia specific units and care consider the functional deficits associated with long-term, chronic cognitive deficits. The primary resources for care include recreation therapy, KT, social work, and nursing. This population may also benefit from supportive or episodic rehabilitation as indicated with at least one therapy intervention such as PT, OT, KT, and SLP based on identified changes in functional status as documented in the MDS and/or progress notes.
AH Long Stay Skilled Nursing Care (43)
Skilled-nursing care that is time-limited, goal directed and/or for specific conditions and/or interventions that require the involvement of an RN and/or an LPN or LVN on a daily basis, but exceeds the 90 day requirement for short stay skilled nursing care. Examples of long stay skilled services include prolonged wound care; persistent Total Parenteral Nutrition (TPN), ventilator, respirator, suctioning, or tracheotomy care; tube feeding; and other interventions where the complexity of resident needs requires direct intervention by licensed nurses over a time frame greater than 90 days. This population may also benefit from supportive or episodic rehabilitation as indicated with at least one therapy intervention such as PT, OT, KT, and SLP based on identified changes in functional status as documented in the MDS and/or progress notes.
AI Long Stay Maintenance Care (44)
Emphasis of care is on maintaining function and/or preventing further decline in nursing home residents with multiple functional deficits who require supervision and oversight by an RN, but who do not require licensed nurse interventions daily. For example, veterans with long-standing chronic functional disabilities for whom active rehabilitation is no longer an option, or the deployment of an RN, LPN, or LVN, is not necessary. Primary resources for care include recreation therapy, nursing, and social work. This population may also benefit from supportive or episodic rehabilitation as indicated with at least one therapy intervention such as PT, OT, KT, and SLP based on identified changes in functional status as documented in the MDS and/or progress notes.
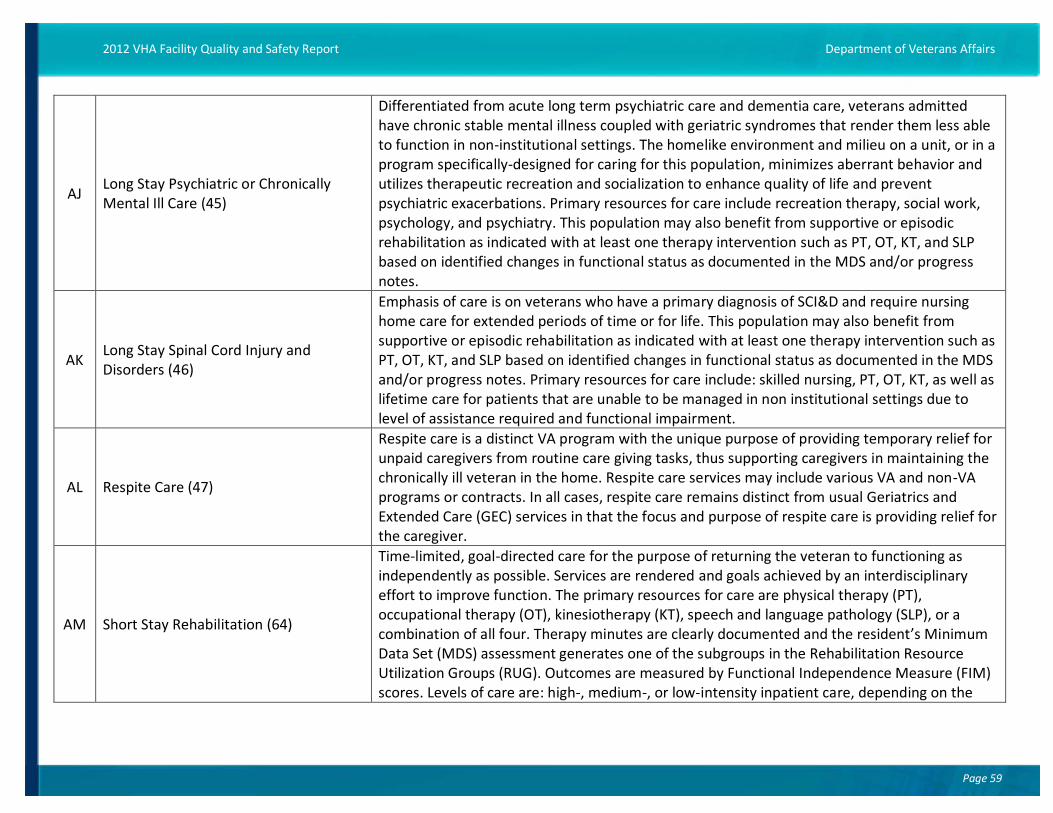
Page 59
2012 VHA Facility Quality and Safety Report Department of Veterans Affairs
AJ Long Stay Mental Ill
Psychiatric Care (45)
or Chronically
Differentiated from acute long term psychiatric care and dementia care, veterans admitted have chronic stable mental illness coupled with geriatric syndromes that render them less able to function in non-institutional settings. The homelike environment and milieu on a unit, or in a program specifically-designed for caring for this population, minimizes aberrant behavior and utilizes therapeutic recreation and socialization to enhance quality of life and prevent psychiatric exacerbations. Primary resources for care include recreation therapy, social work, psychology, and psychiatry. This population may also benefit from supportive or episodic rehabilitation as indicated with at least one therapy intervention such as PT, OT, KT, and SLP based on identified changes in functional status as documented in the MDS and/or progress notes.
AK Long Stay Disorders
Spinal (46)
Cord Injury and
Emphasis of care is on veterans who have a primary diagnosis of SCI&D and require nursing home care for extended periods of time or for life. This population may also benefit from supportive or episodic rehabilitation as indicated with at least one therapy intervention such as PT, OT, KT, and SLP based on identified changes in functional status as documented in the MDS and/or progress notes. Primary resources for care include: skilled nursing, PT, OT, KT, as well as lifetime care for patients that are unable to be managed in non institutional settings due to level of assistance required and functional impairment.
AL Respite Care (47)
Respite care is a distinct VA program with the unique purpose of providing temporary relief for unpaid caregivers from routine care giving tasks, thus supporting caregivers in maintaining the chronically ill veteran in the home. Respite care services may include various VA and non-VA programs or contracts. In all cases, respite care remains distinct from usual Geriatrics and Extended Care (GEC) services in that the focus and purpose of respite care is providing relief for the caregiver.
AM Short Stay Rehabilitation (64)
Time-limited, goal-directed care for the purpose of returning the veteran to functioning as independently as possible. Services are rendered and goals achieved by an interdisciplinary effort to improve function. The primary resources for care are physical therapy (PT), occupational therapy (OT), kinesiotherapy (KT), speech and language pathology (SLP), or a combination of all four. Therapy minutes are clearly documented and the resident’s Minimum Data Set (MDS) assessment generates one of the subgroups in the Rehabilitation Resource Utilization Groups (RUG). Outcomes are measured by Functional Independence Measure (FIM) scores. Levels of care are: high-, medium-, or low-intensity inpatient care, depending on the

Page 60
2012 VHA Facility Quality and Safety Report Department of Veterans Affairs
veteran’s needs and goals for rehabilitation.
AN Short Stay Restorative Care (66)
Time-limited care with the purpose of providing short term restorative interventions, such as bowel and bladder training and toileting; restorative dining; ambulation, etc. The purpose of the admission is to provide a transition from the hospital through short-term restorative care prior to discharge. The primary resources for care include: restorative aides, nurses, KT, and recreation therapy. This population may also benefit from supportive or low-intensity rehabilitation as indicated, with at least one therapy intervention such as PT, OT, KT, and SLP based on identified changes in functional status as documented in the MDS and/or progress notes.
AO Short Stay Maintenance Awaiting Placement (67)
Care for
those
Time-limited care for those awaiting alternative placement, such as to a community nursing home or state veterans home. The primary resources for care include social work, nursing, and therapeutic recreation or KT. This population may also benefit from supportive or episodic rehabilitation as indicated with at least one therapy intervention such as PT, OT, KT, and SLP based on identified changes in functional status as documented in the MDS and/or progress notes.
AP Short Stay Psychiatric Care (68)
Time-limited care with the purpose of providing evaluation and management, such as medication adjustment and behavioral interventions for veterans with exacerbation of medical and or behavioral symptoms. These veterans are expected to return to their previous living arrangements upon discharge. The primary resources for care include: recreation therapy, social work, nursing, and psychology and/or psychiatry. This population may also benefit from supportive or episodic rehabilitation as indicated with at least one therapy intervention such as PT, OT, KT, and SLP based on identified changes in functional status as documented in the MDS and/or progress notes.
AQ Short Stay Dementia Care (69)
Time-limited, goal-directed care with the purpose of stabilizing symptoms and developing a plan of care to meet ongoing needs within the secure environment of an existing dementia program. Staff competencies are evident; dementia-specific care centers on behaviors, functional and cognitive deficits, patient and caregiver education and support. Return to the home or discharge to the community is expected. The primary resources for care include activities and recreation therapy, social work, nursing, and psychology or psychiatry. This population may also benefit from supportive or episodic rehabilitation as indicated with at least one therapy intervention such as PT, OT, KT, and SLP based on identified changes in

Page 61
2012 VHA Facility Quality and Safety Report Department of Veterans Affairs
functional status as documented in the MDS and/or progress notes.
Hospital Accreditation
AR TJC Acute care (Hospital) The Joint Commission Full Accreditation surveys occur on a 3-year cycle which includes a
AS TJC Behavioral Health review of multiple applicable programs: e.g., Long Term Care, Hospital, Ambulatory, Behavioral
AT TJC Long term care Health, and Home Care programs). The Data is compiled from The Joint Commission Survey
AU TJC Ambulatory care reports and reflect the accreditation status as of 2010.
AV TJC Home care
Commission on Accreditation of Rehabilitation Facilities (CARF): VHA is committed to providing specialized treatment and quality rehabilitation care to Veterans with disabilities. These populations include Veterans with spinal cord injury and disorders (SCI/D), blindness or
AW CARF Accreditation severely visually impaired, traumatic brain injury, amputation, serious mental illnesses, and those who are homeless. This commitment is supported through a system-wide, long-term joint collaboration with CARF to achieve and maintain national accreditation for all appropriate VHA rehabilitation programs.
Report from Pathology & Laboratory Medicine Service, FY-10. Approximately 250 VA AX Laboratory Accreditation laboratories are accredited by the College of American Pathologists (CAP), The Joint
Commission (TJC) or COLA.
Medical Center Staffing
MD Full-time FTEE: This is the staffing of full-time physician FTEE (Full Time Employee AY Physician Full-time FTEE Equivalent) in VA budget object code 1081(Physicians-Full Time). This does not include medical
residents, trainees, physicians in a without compensation status, or contract physicians.
MD Part-time FTEE: This is the staffing of part-time physician FTEE (Full Time Employee
AZ Physician Part-time FTEE Equivalent) in VA budget object code 1082(Physicians-Part Time). medical residents, trainees, physicians in a without compensation
This does not include status, or contract
physicians.
MD FTEE per 1,000 Uniques: This is the staffing rate of full and part-time physician FTEE (Full
BA Physician FTEE Time Employee Equivalent) in VA budget object code 1081(Physicians-Full Time) and 1082 (Physicians-Part Time) per 1,000 total facility unique patients. This does not include medical residents, trainees, physicians in a without compensation status, or contract physicians.
HPPD (Hours per patient day) data The HPPD data is obtained from the DSS Nursing Hours/Costs by Ward and Ward Day report. Total Ward Days: the Source data is the DSS NDE WARD and the DSS ALB NDE
of Care PAID file.

Page 62 Page 62 Page 62 Page 62
2012 VHA Facility Quality and Safety Report Department of Veterans Affairs 2012 VHA Facility Quality and Safety Report Department of Veterans Affairs 2012 VHA Facility Quality and Safety Report Department of Veterans Affairs 2012 VHA Facility Quality and Safety Report Department of Veterans Affairs
The Ward Hours of Care include the admission and discharge days in the report. Total Patient Ward Hours: The total Hours of actual occupancy time of patients on the selected ward. For example: a patient is on WARD X from 3am until 8am they are credited with 5 ward hours of care on WARD x. if same patient transferred at 8 am to WARD Z and remains there until midnight they will be credited with 19 ward hours on WARD Z. Total Patient Ward Hours: The total Hours of actual occupancy time of patients on the selected ward. For example: a patient is on WARD X from 3am until 8am they are credited with 5 ward hours of care on WARD x. if same patient transferred at 8 am to WARD Z and remains there until midnight they will be credited with 19 ward hours on WARD Z. Total Ward Days: Calculation = Total Patient Ward Hours/24. The admission day is counted; the discharge day is counted.If a patient is admitted and discharged in the same day, then the ward hours of care (which is the actual time the patient spent on the unit) is in the ward hours count.Patients with Ward Hours of Care assigned to a MAS observation beds on a regular inpatient ward will be included in the report. ***The HPPD data has not been manipulated or changed from what appears in the DSS HPPD report. Facilities with data that appears significantly skewed (high or low) have been notified and advised to review the data with their local DSS Manager(s) to ensure that labor mapping and ward mapping (“C-Ward tables”) is correct. Additional report definitions and information may be viewed by accessing the DSS report. https://vssc.med.va.gov/dss_ssl/NURSEINP.asp Total Hours per Ward Day: Calculation = Total Nursing Hours/Total Ward Days. RN: Calculation = RN Total Nursing Hours/Total Ward Days. LPN: Calculation = LPN Total Nursing Hours/Total Ward Days. NA: Calculation = NA Total Nursing Hours/Total Ward Days.
BB Critical Care Units: Registered Nurses Clusters: E8 - Med/Surg ICU Combined; E6 - Cardiac Care Unit; E5 - Neuro ICU; E4 - Medical ICU
BC Critical Care Units: LPNs 2; E3 - Medical ICU 1; E2 - Telemetry ICU; E1 - Surg ICU
BD Critical Care Units: Nursing Assistants
BE Medical Units: Registered Nurses FT - Ward Neuro; FN - Wards Mixed Med/Int. Med 2; FM - Wards Mixed Med/Int. Med 1; ES -
BF Medical Units: LPNs Ward Gen Med/Acute 4; EP - Wards - Infectious Disease; EO - Wards
BG Medical Units: Nursing Assistants
Rheumatology/Dermatology; Gen Med/Acute 2; EK - Ward
EN - Wards Oncology; EM - Gen Med/Acute 1
Ward Gen Med/Acute 3; EL - Ward
BH Surgical Units: Registered Nurses F5 - Ward Surgery 2;
Neuro/Neuro Surgery; F1 - Wards - Surgery 1
F4 - Wards Neurosurgery; F3 - Wards - Surgery 3; F2 - Wards -
BI Surgical Units: LPNs
BJ Surgical Units: Nursing Assistants

Page 63
2012 VHA Facility Quality and Safety Report Department of Veterans Affairs
BK Mixed Med/Surg: Registered Nurses FL - Ward Mixed Med/Surg/Int. Med 2; FK - Ward Mixed Med/Surg/Int. Med 1; FJ - Wards
BL Mixed Med/Surg: LPNs Mixed Med/Surg/PSI 2; FI - Wards Mixed Med/Surg/PSI 1; FH - Wards Mixed Med/Surg 4; FG -
BM Mixed Med/Surg: Nursing Assistants Wards Mixed Med/Surg 3; FF - Wards Mixed Med/Surg 2; FE - Wards Mixed Med/Surg 1
BN Acute Mental Health: RNs HM - Wards Psychiatry Acute 4; HL - Wards Psychiatry Acute 3; H6 - Wards Psychiatry Acute 2;
BO Acute Mental Health: LPNs H5 - Wards Psychiatry Acute 1; H4 - Wards Psychiatry Mixed Detox 2; H3 - Wards Psychiatry
BP Acute Mental Health: Nursing Assistants Mixed Detox 1
BQ SCI/D Units: Registered Nurses GO - Wards SCI – Surgery; GN - Wards SCI - Ventilator 2 (only); GM - Wards SCI - Ventilator 1
BR SCI/D Units: LPNs (only); GL - Wards SCI Routine 2; GK - Wards SCI Routine 1
BS SCI/D Units: Nursing Assistants
BT CLCs: Registered Nurses G8 - Wards - NHCU Ventilator 2; G7 - Wards - NHCU Ventilator 1; G6 - Wards - Routine NHCU 6;
BU CLCs: LPNs G5 - Wards - Routine NHCU 5; G4 - Wards - Routine NHCU 4; G3 - Wards - Routine NHCU 3; G2 -
BV CLCs: Nursing Assistants Wards - Routine NHCU 2; G1 - Wards - Routine NHCU 1
BW RN Turnover The report reflects the Facility total loss rate for Registered Nurse (occupation code 0610)
BX LPN Turnover Practical Nurse (LPN/LVN - occupation code 0620) and Nursing Assistant (occupation code
BY Nursing Assistant Turnover 0621) Facility Total Loss Rate – Any loss, retirement, death, termination, voluntary separation or transfer that removes employee from the selected Facility.
Section 2: Effectiveness Measures
ORYX Inpatient Composites
AMI - Inpatient -ASA w/i 24 hours of admission; AMI - Tobacco - Inpatient Counseling – AMI; AMI - Inpatient –timely reperfusion (VA Measure); AMI - Inpatient -LVEF LT 40 on ACEI or ARB
BZ Acute Myocardial Infarction at discharge; AMI - Inpatient -Beta blockers w/i 24 hrs after admission; AMI - Inpatient - LDL - Cholesterol Assessment; AMI - Inpatient - Lipid Lowering Therapy f/ at Risk Pts GE 130; AMI - Inpatient -ASA at discharge; AMI - Inpatient -Beta blockers at discharge
HF - Inpatient - LVF assessed or planned at discharge; HF - Inpatient - LVEF LT 40 on ACEI or CA Congestive Heart Failure ARB specific at discharge; HF - Inpatient -Tobacco - Inpatient Counseling – HF; HF - Inpatient -
Discharge instructions f/ diet/wt/meds
CAP - Inpatient - O2 Assess in 24 Hours of Arrival; CAP - Inpatient - Appropriate initial antibiotic f/ immunocompromised pt in ICU; CAP - Inpatient - Appropriate initial antibiotic f/
CB Community Acquired Pneumonia immunocompromised pt Non-ICU; CAP - Inpatient - Influenza vaccination; CAP - Inpatient - Blood Cultures w/in 24 hrs of arrival - Inpatient ICU; CAP - Inpatient - Blood cultures perform in ED prior to 1st antibiotic; CAP - Inpatient - Initial antibiotic w/in 6 hrs of arrival; CAP - Inpatient
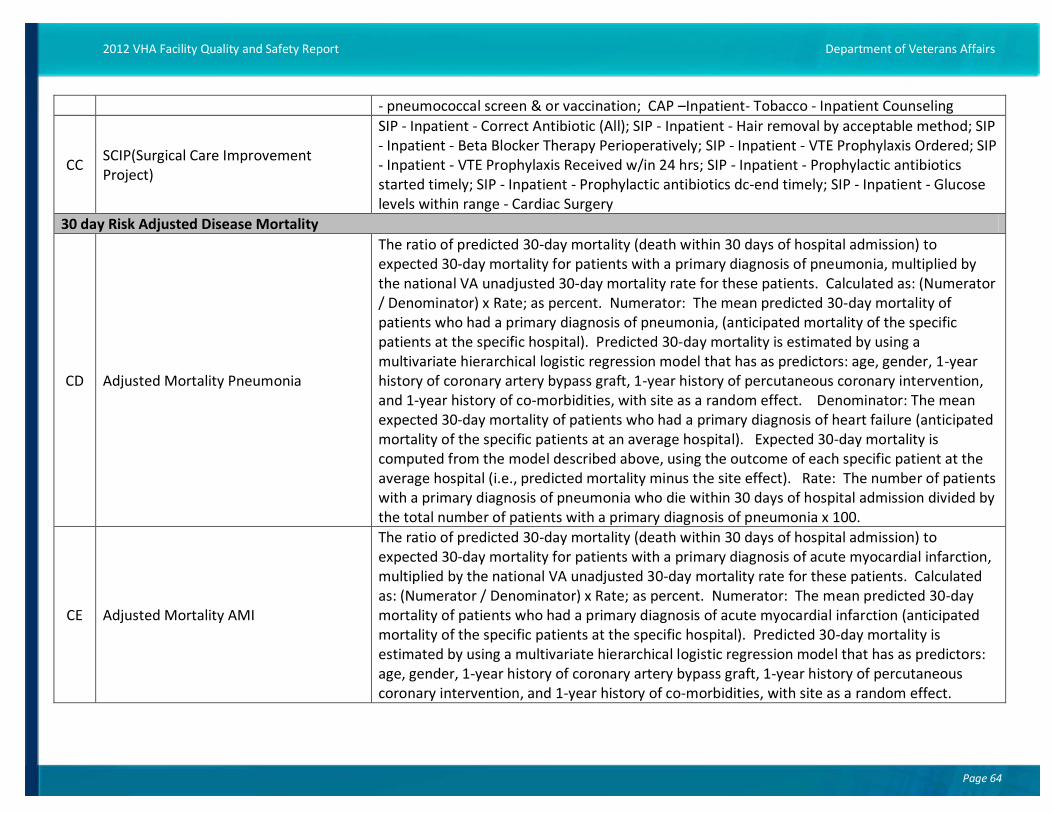
Page 64
2012 VHA Facility Quality and Safety Report Department of Veterans Affairs
- pneumococcal screen & or vaccination; CAP –Inpatient- Tobacco - Inpatient Counseling
CC SCIP(Surgical Project)
Care Improvement
SIP - Inpatient - Correct Antibiotic (All); SIP - Inpatient - Hair removal by acceptable method; SIP - Inpatient - Beta Blocker Therapy Perioperatively; SIP - Inpatient - VTE Prophylaxis Ordered; SIP - Inpatient - VTE Prophylaxis Received w/in 24 hrs; SIP - Inpatient - Prophylactic antibiotics started timely; SIP - Inpatient - Prophylactic antibiotics dc-end timely; SIP - Inpatient - Glucose levels within range - Cardiac Surgery
30 day Risk Adjusted Disease Mortality
CD Adjusted Mortality Pneumonia
The ratio of predicted 30-day mortality (death within 30 days of hospital admission) to expected 30-day mortality for patients with a primary diagnosis of pneumonia, multiplied by the national VA unadjusted 30-day mortality rate for these patients. Calculated as: (Numerator / Denominator) x Rate; as percent. Numerator: The mean predicted 30-day mortality of patients who had a primary diagnosis of pneumonia, (anticipated mortality of the specific patients at the specific hospital). Predicted 30-day mortality is estimated by using a multivariate hierarchical logistic regression model that has as predictors: age, gender, 1-year history of coronary artery bypass graft, 1-year history of percutaneous coronary intervention, and 1-year history of co-morbidities, with site as a random effect. Denominator: The mean expected 30-day mortality of patients who had a primary diagnosis of heart failure (anticipated mortality of the specific patients at an average hospital). Expected 30-day mortality is computed from the model described above, using the outcome of each specific patient at the average hospital (i.e., predicted mortality minus the site effect). Rate: The number of patients with a primary diagnosis of pneumonia who die within 30 days of hospital admission divided by the total number of patients with a primary diagnosis of pneumonia x 100.
CE Adjusted Mortality AMI
The ratio of predicted 30-day mortality (death within 30 days of hospital admission) to expected 30-day mortality for patients with a primary diagnosis of acute myocardial infarction, multiplied by the national VA unadjusted 30-day mortality rate for these patients. Calculated as: (Numerator / Denominator) x Rate; as percent. Numerator: The mean predicted 30-day mortality of patients who had a primary diagnosis of acute myocardial infarction (anticipated mortality of the specific patients at the specific hospital). Predicted 30-day mortality is estimated by using a multivariate hierarchical logistic regression model that has as predictors: age, gender, 1-year history of coronary artery bypass graft, 1-year history of percutaneous coronary intervention, and 1-year history of co-morbidities, with site as a random effect.

Page 65
2012 VHA Facility Quality and Safety Report Department of Veterans Affairs
Denominator: The mean expected 30-day mortality of patients who had a primary diagnosis of acute myocardial infarction (anticipated mortality of the specific patients at an average hospital). Expected 30-day mortality is computed from the model described above, using the outcome of each specific patient at the average hospital (i.e., predicted mortality minus the site effect). Rate: The number of patients with a primary diagnosis of acute myocardial infarction who die within 30 days of hospital admission divided by the total number of patients with a primary diagnosis of acute myocardial infarction x 100.
CF Adjusted Mortality CHF
The ratio of predicted 30-day mortality (death within 30 days of hospital admission) to expected 30-day mortality for patients with a primary diagnosis of heart failure, multiplied by the national VA unadjusted 30-day mortality rate for these patients. Calculated as: (Numerator / Denominator) x Rate; as percent. Numerator: The mean predicted 30-day mortality of patients who had a primary diagnosis of heart failure (anticipated mortality of the specific patients at the specific hospital). • Predicted 30-day mortality is estimated by using a multivariate hierarchical logistic regression model that has as predictors: age, gender, 1-year history of coronary artery bypass graft, 1-year history of percutaneous coronary intervention, and 1-year history of co-morbidities, with site as a random effect. Denominator: The mean expected 30-day mortality of patients who had a primary diagnosis of heart failure (anticipated mortality of the specific patients at an average hospital). Expected 30-day mortality is computed from the model described above, using the outcome of each specific patient at the average hospital (i.e., predicted mortality minus the site effect). Rate: The number of patients with a primary diagnosis of heart failure who die within 30 days of hospital admission divided by the total number of patients with a primary diagnosis of heart failure x 100.
Risk Adjusted Readmission Rates
CG Acute Myocardial Facility
Infarction (AMI)-
The ratio of predicted 30-day readmission (readmission within 30 days of hospital admission) to expected 30-day readmission for patients with a primary diagnosis of acute myocardial infarction, multiplied by the national VA unadjusted 30-day readmission rate for these patients. Calculated as: (Numerator / Denominator) x Rate; as percent. Numerator: The mean predicted 30-day readmission of patients who had a primary diagnosis of acute myocardial infarction (anticipated readmission of the specific patients at the specific hospital). Predicted 30-day readmission is estimated by using a multivariate hierarchical logistic regression model that has as predictors: age, gender, 1-year history of coronary artery bypass graft, 1-year history of

Page 66
2012 VHA Facility Quality and Safety Report Department of Veterans Affairs
percutaneous coronary intervention, and 1-year history of co-morbidities, with site as a random effect. Denominator: The mean expected 30-day readmission of patients who had a primary diagnosis of acute myocardial infarction (anticipated readmission of the specific patients at an average hospital). Expected 30-day readmission is computed from the model described above, using the outcome of each specific patient at the average hospital (i.e., predicted readmission minus the site effect). Rate: The number of patients with a primary diagnosis of acute myocardial infarction who are readmitted within 30 days of hospital admission divided by the total number of patients with a primary diagnosis of acute myocardial infarction x 100.
CH Acute Myocardial Infarction (AMI)- HRR Hospital contains
referral regions (HRRs) are regional market areas for tertiary medical care. Each HRR at least one hospital that performs major cardiovascular procedures and neurosurgery
CI Congestive Heart
Failure (CHF)- Facility
The ratio of predicted 30-day readmission (readmission within 30 days of hospital admission) to expected 30-day mortality for patients with a primary diagnosis of heart failure, multiplied by the national VA unadjusted 30-day readmission rate for these patients. Calculated as: (Numerator / Denominator) x Rate; as percent. Numerator: The mean predicted 30-day readmission of patients who had a primary diagnosis of heart failure (anticipated readmission of the specific patients at the specific hospital). • Predicted 30-day readmission is estimated by using a multivariate hierarchical logistic regression model that has as predictors: age, gender, 1-year history of coronary artery bypass graft, 1-year history of percutaneous coronary intervention, and 1-year history of co-morbidities, with site as a random effect. Denominator: The mean expected 30-day readmission of patients who had a primary diagnosis of heart failure (anticipated readmission of the specific patients at an average hospital). Expected 30-day readmission is computed from the model described above, using the outcome of each specific patient at the average hospital (i.e., predicted readmission minus the site effect). Rate: The number of patients with a primary diagnosis of heart failure who are readmitted within 30 days of hospital admission divided by the total number of patients with a primary diagnosis of heart failure x 100.
CJ Congestive Heart Failure (CHF)- HRR Hospital contains
referral at least
regions (HRRs) are regional one hospital that performs
market areas for tertiary medical care. Each HRR major cardiovascular procedures and neurosurgery
CK Pneumonia- Facility The ratio expected
of predicted 30-day 30-day readmission
readmission for patients
(readmission within 30 days of hospital with a primary diagnosis of pneumonia,
admission) to multiplied by

Page 67
2012 VHA Facility Quality and Safety Report Department of Veterans Affairs
the national VA unadjusted 30-day mortality rate for these patients. Calculated as: (Numerator / Denominator) x Rate; as percent. Numerator: The mean predicted 30-day readmission of patients who had a primary diagnosis of pneumonia, (anticipated readmission of the specific patients at the specific hospital). Predicted 30-day readmission is estimated by using a multivariate hierarchical logistic regression model that has as predictors: age, gender, 1-year history of coronary artery bypass graft, 1-year history of percutaneous coronary intervention, and 1-year history of co-morbidities, with site as a random effect. Denominator: The mean expected 30-day readmission of patients who had a primary diagnosis of heart failure (anticipated readmission of the specific patients at an average hospital). Expected 30-day readmission is computed from the model described above, using the outcome of each specific patient at the average hospital (i.e., predicted mortality minus the site effect). Rate: The number of patients with a primary diagnosis of pneumonia who are readmitted within 30 days of hospital admission divided by the total number of patients with a primary diagnosis of pneumonia x 100.
CL Pneumonia- HRR Hospital contains
referral at least
regions (HRRs) are regional one hospital that performs
market areas for tertiary medical care. Each HRR major cardiovascular procedures and neurosurgery
VASQIP Outcome measures
CM Surgical Mortality The VASQIP program analyzes patient data using mathematical models to predict an individual patient’s expected outcome based on the patient’s preoperative characteristics and the type and nature of the surgical procedure. Overall patient outcomes for major surgical procedures
CN Surgical Morbidity are expressed by comparing observed rates of mortality and morbidity to the expected rates for those patients undergoing the procedure as observed-to-expected (O/E) ratios. For example, if, based on patient characteristics, a facility expected 5 deaths following major surgery, but only 4 patients died, the O/E ratio would be reported as 0.8.
Outpatient Composites
Measures in the Diabetic Composite: DM - Outpatients - HbA1 > 9 or not done (poor control) in past year (HEDIS); DM - Outpatients - LDL-C < 100 (HEDIS); DM - Outpatients - BP LE 140/90;
CO Diabetes Mellitus DM - Outpatients - Retinal exam, timely by disease (HEDIS); DM - Outpatients - LDL-C measured (HEDIS) w/ 1 yr review; DM - Outpatients - Renal Testing (HEDIS); DM - Outpatients - HbA1c Annual
CP Prevention CA - Women age 50-69 screened for Breast Cancer (HEDIS); CA - Women age 21-64 screened

2012 VHA Facility Quality and Safety Report Department of Veterans Affairs
Page 68
for Cervical Cancer in the past 3 yrs (HEDIS); CA - Pts receiving appropriate Colorectal Cancer Screening (HEDIS); P-Immunizations - Pneumococcal Outpatients – Nexus; Immunizations - Outpatients - Influenza ages 50-64 - Nexus Clinics (HEDIS); Immunizations - Outpatients - Influenza ages GE 65 (HEDIS); Mov- Outpatients screened for Obesity
CQ Ischemic Heart Disease HTN - Outpatients diagnosis HTN (HEDIS); AMI - Outpatients LDL-C
& BP LT 140/90 LT 100 (HEDIS)
(HEDIS); AMI - Outpatients LDL-C measured
CR Tobacco Tobacco - Outpatients - Pts using tobacco in past yr who have been offered meds; Tobacco- Outpatients - Pts using tobacco in past yr provided w/ counseling on how to quit; Tobacco - Outpatients - Pts using tobacco in past yr offered referral to cessation program
CS Behavioral Health Screening (BHS)
SUD- Outpatients screened annually for Alcohol Misuse; PTSD- Outpatients screened at required intervals for PTSD using the PC-PTSD; MDD- Outpatients screened annually for depression ; SUD - Outpt - Pts scrn f/ alcohol misuse w/ score GE 5 w/ timely counsel; Combined scores for timely suicide evals if pos ptsd or mdd scrn
Patient Aligned Care Team (PACT) Metrics
CT % of same day appointments assigned provider
with This measures the percent of requested same day appointments (desire date = create date or walk-ins) in PC Clinics 322, 323 and 350 for PC assigned patients where the patient was seen by their Primary Care and/or Associate Provider within 1 day of the desired date. Note this metric does include walk-in appointments if entered in the appointment package.
The ratio of encounters in the reporting month for primary care assigned patients where the encounter has one of the following telephone stop codes (103, 147, 148, 169, 178, 181, 182, 199, 216, 221, 229, 324, 325, 326, 424, 425, 428, 527, 528, 530, 536, 537, 542, 545, 546, 579,
CU % of encounters by telephone
584, 597, 611, 686) in combination with any of these stop codes (322, 323, 348, 350, 531, 704, 534) and any encounters where stop code 338 is in the primary position on the encounter, divided by the total encounters for assigned primary care patients in the reporting month where the encounter has one of the following primary care stop codes (322, 323, 338, 348, 350, 531, 704, 534, 539) in the primary or secondary position on the encounter. Note that this measure looks at encounter activity across all VHA facilities for the assigned primary care patients.
CV Completed appointments (primary care)
within 7 days The % of New and Established Patient Appointments for Primary Care (clinic and 350), excluding C&P appointments, where the patient appointment was (between 0 and 7 days) of the patient’s desired date.
stops 322, 323, within 7 days

Page 69
2012 VHA Facility Quality and Safety Report Department of Veterans Affairs
CW % of visits with (Continuity)
assigned provider
This is a measure of where the patient receives his primary care and by whom. A high percentage is better. The formula is the number of Primary Care Encounters WOP with the patient’s assigned primary care (or associate) provider divided by the number of Primary Care Encounters WOP with the patient’s assigned primary care (or associate) provider plus the total VHA ER/Urgent Care WOP plus the number of Primary Care Encounters WOP with a provider other than the patient’s PCP/AP.
CX Post-discharge contact provider within 2 days
by assigned The percent of discharges (VHA and FEE inpatient discharges) for the reporting timeframe for assigned Primary Care patients where the patient was contacted by Primary Care within 2 business days post discharge. Discharges resulting in death and discharges where a patient is readmitted within 2 days of discharge are excluded from this metric.
CLC Metrics
CY Artifact Score
of culture change metric - Total Self-reported measure to assess implementation of person-centered care in a community living center. Consists of 79 questions broken down into 6 categories: Care practices, Environment, Family Community, Leadership, Workplace, and Outcomes. There are a total of 580 points possible and a higher score is better.
Artifact Percent
of culture change metric Change
– Self-reported measure to assess implementation of person-centered care in a community living center. Percent change is the percentage change from FY 11 quarter one to FY 11 quarter two. The goal is a 2% increase in score each quarter, with an overal yearly increase of 8%.
CZ Unannounced survey # of A-G findings
outcomes Results of unnanounced surveys. The survey follows CMS nursing Commission Standards. Findings are rated on the CMS Scope and are less severe or isolated incidents.
home process Severity Grid.
applying Joint These findings
DA Unannounced survey # of H-L findings
outcomes Results of unnanounced surveys. The survey follows CMS nursing Commission Standards. Findings are rated on the CMS Scope and are have either the potential for actual harm to residents, immedhealth and safety.
home process Severity Grid. iate jeopardy to
applying Joint Findings H-L residents’
DB IV infections- Central Line Associated Blood Stream Infection
Self-reported measure. Expresses the number of CLAB infections in community living centers in a given month in a standardized rate of number of CLAB infections per 1000 central line days. The definition to determine CLABSI is from the CDC.
DC UTI infections- Catheter Associated Urinary Tract Infection (symptomatic)
Self-reported measure. Expresses in a given month in a standardized definition of a symptomatic CAUTI
the number of CAUTI infections in rate of number of CAUTI per 1000 is from the CDC.
community living center catheter days. The

Page 70
2012 VHA Facility Quality and Safety Report Department of Veterans Affairs
Section 3: Equitable
Outpatient composites: Gender
DE
Diabetes Mellitus-
Male Data source: External Peer Review Program (EPRP) outpatient samples in FY2009; includes
DF Diabetes Mellitus- Female women oversamples. Scores are weighted. Diabetes Composite: Diabetes measure HbA1 GT 9
DG Diabetes Mellitus- Gender Difference or not done (poor control) in past year (DMG23H) is reversed to reflect higher performance is
DH Prevention- Male better. Stratified results are not shown if a least one of the Gender categories has less than 30
DI Prevention- Female cases for a given composite. Prevention Composite excludes preventive measures specific to
DJ Prevention- Gender Difference women (Breast Cancer and Cervical Cancer screenings).
DK Ischemic Heart Disease- Male
DL Ischemic Heart Disease- Female
DM Ischemic Heart Disease- Gender Diff.
DN Tobacco- Male
DO Tobacco- Female
DP Tobacco- Gender Difference
DQ Behavioral Health Screening- Male
DR Behavioral Health Screening- Female
DS Behavioral Diff.
Health Screening- Gender
Outpatient composites: Age
DT Diabetes Mellitus- <65yo Data source: External Peer Review Program (EPRP) outpatient samples in FY2011. Scores are weighted. Diabetes Composite: Diabetes measure HbA1 GT 9 or not done (poor control) in past year (DMG23H) is reversed to reflect higher performance is better. Stratified results are not shown if a least one of the Age categories has less than 100 cases for a given composite Prevention Composite excludes age-specific preventive measure (women age 21-64 screened for cervical cancer)
DU Diabetes Mellitus- 65+yo
DV Diabetes Mellitus- Age Difference
DW Prevention- <65yo
DX Prevention- 65+yo
DY Prevention- Age Difference
DZ Ischemic Heart Disease- <65yo
EA Ischemic Heart Disease- 65+yo
EB Ischemic Heart Disease- Age Difference
EC Tobacco- <65yo
ED Tobacco- 65+yo

Page 71
2012 VHA Facility Quality and Safety Report Department of Veterans Affairs
EE Tobacco- Age Difference
EF Behavioral Health Screening- <65yo
EG Behavioral Health Screening- 65+yo
EH Behavioral Health Screening- Age Diff.
Patient Satisfaction: Ethnic breakout
EI Satisfaction w/Inpatient Care- White Number of patients responding to the Inpatient SHEP survey Question 21: Using any number from 0 to 10, where 0 is the worst hospital possible and 10 is the best hospital possible, what number would you use to rate this hospital during your stay?
EJ Satisfaction w/Inpatient Care- White Percentage of patients responding with 9 or 10 to the Inpatient SHEP survey Question 21: Using
any number from 0 to 10, where 0 is the worst hospital possible and 10 is the best hospital possible, what number would you use to rate this hospital during your stay?
EK Satisfaction w/Inpatient Care- Other Number of patients responding to the Inpatient SHEP survey Question 21: Using any number
from 0 to 10, where 0 is the worst hospital possible and 10 is the best hospital possible, what number would you use to rate this hospital during your stay?
EL Satisfaction w/Inpatient Care- Other Percentage of patients responding with 9 or 10 to the Inpatient SHEP survey Question 21: Using
any number from 0 to 10, where 0 is the worst hospital possible and 10 is the best hospital possible, what number would you use to rate this hospital during your stay?
EM Satisfaction w/Outpatient Care- White Number of patients responding to the Outpatient SHEP survey Question
from 0 to 10, where 0 is the worst healthcare possible and 10 is the best what number would you use to rate all your VA healthcare in the last 12
10: Using any number healthcare possible, months?
EN
Satisfaction w/Outpatient Care- White Percentage of patients responding with 9 or 10 to the Outpatient SHEP survey Question 10: Using any number from 0 to 10, where 0 is the worst healthcare possible and 10 is the best healthcare possible, what number would you use to rate all your VA healthcare in the last 12 months?
EO Satisfaction w/Outpatient Care- Other Number of patients responding to the Outpatient SHEP survey Question
from 0 to 10, where 0 is the worst healthcare possible and 10 is the best what number would you use to rate all your VA healthcare in the last 12
10: Using any number healthcare possible, months?
EP
Satisfaction w/Outpatient Care- Other Percentage of patients responding with 9 or 10 to the Outpatient SHEP survey Question 10: Using any number from 0 to 10, where 0 is the worst healthcare possible and 10 is the best healthcare possible, what number would you use to rate all your VA healthcare in the last 12 months?

2012 VHA Facility Quality and Safety Report Department of Veterans Affairs
Page 72
SECTION 4: Safe
Healthcare Associated Infections
EQ Ventilator Associated Pneumonia Ventilator Associated Pneumonia (VAP) Infection Numerator: The number of VAP infections (ICU).
Rate = (numerator/denominator) x 1000 Denominator: The number of ventilator days.
ER Number of Ventilator days Total number performed at
of days of exposure the same time each
to ventilators day.
by all patients in the ICU. The count is
ES CLAB Central Line Numerator:
Associated Bloodstream (CLAB) Infection Rate = (numerator/denominator) x The number of central line infections. Denominator: The number of central
1000 line
days.
ET Number of Central line days Total number of days a central line is in place for patients in certain hospital unit. The count is performed at the same time each day. Each patient with one or more central lines at the time the count is performed is counted as one central line day.
EU ICU MRSA MRSA Infection Rate (Intensive Care Units (ICU) Only)= (numerator/denominator) x 1000 Numerator: Total number of MRSA infections (culture positive). Denominator: Bed days of care.
EV ICU MRSA Screening Rate
MRSA Composite Screening Rate (ICU only)= (numerator/denominator) x 100 Numerator: Total number of indicated nasal screens for MRSA performed timely. Denominator: Total number of indicated nasal screens for MRSA. Timely Swab: Nasal screening must be completed within 24 hours upon admission or transfer in to the unit (24 hours reflects prior to or after arrival on the unit) AND on exit from the unit.
EW Acute Care MRSA MRSA Infection Rate (Acute care ward)= (numerator/denominator) x 1000 Numerator: number of MRSA infections (culture positive). Denominator: Bed days of care.
Total
EX Acute Care MRSA Screening Rate
MRSA Composite Screening Rate (Acute care wards)= (numerator/denominator) x 100 Numerator: Total number of indicated nasal screens for MRSA performed timely. Denominator: Total number of indicated nasal screens for MRSA. Timely Swab: Nasal screening must be completed within 24 hours upon admission or transfer in to the unit hours reflects prior to or after arrival on the unit) AND on exit from the unit.
(24
Patient Safety Measures

Page 73
2012 VHA Facility Quality and Safety Report Department of Veterans Affairs
EY ICU risk adjusted Length of Stay
ICU Risk Adjusted Length of Stay (OMELOS): OMELOS is “observed minus expected length of stay” and is risk adjusted by the IPEC. The average observed patient-level unit length of stay minus expected patient-level unit length of stay for ICU stays at a given facility. If the OMELOS is less than zero, then observed unit length of stay is less than expected. If the OMELOS is greater than zero, then the observed unit length of stay is greater than expected.
EZ Insulin induced hypoglycemia
Insulin Induced Hypoglycemia BS<45 mg/dl: The percentage of patient-days in the ICU, for patients with orders written for insulin or other hypoglycemic agents, with any glucose measurements less than or equal to 45 mg/dL. Calculated as (numerator / denominator) x 100; as percent. Numerator: The total number of ICU patient-days, for patients with orders written for insulin or other hypoglycemic agents (VA Drug Class HS501 or HS502) between 8 hours before hospital admission (e.g., orders written in the ED) and unit discharge, with any glucose measurements less than or equal to 45 mg/dL. Denominator: The total number of ICU patient-days for patients with orders written for insulin or other hypoglycemic agents (VA Drug Class HS501 or HS502) between 8 hours before hospital admission (e.g., orders written in the ED) and unit discharge.
FA Hospital acquired pressure ulcers
Data is reported as the rate, calculated as: Hospital Acquired Pressure Ulcer (HAPU) Rate = (numerator / denominator) x 1000 Numerator (HAPU 2 plus Count): The number of discharged Acute Care patients who develop Hospital-Acquired Pressure Ulcers Stage II or greater as documented in the VANOD templates with a length of stay 48 hours or longer. Denominator: Discharge date minus admission date for all discharged Acute Care patients with a length of stay 48 hours or longer. **It should be noted that Data are only captured if the VANOD skin templates have been used properly. If a facility is not using all of the VANOD templates as intended, the HAPU rate may be incorrectly reflected. Additional documentation and definitions are available on the VANOD products page: http://vssc.med.va.gov/products.asp
SECTION 5: Timely
FB Primary days
care patients seen within 14
Measurement segments all primary care patients into two groups; those that are new (not seen in the clinic group in the past 24 months) and all others, or “established” patients. Wait times for new and established patients are calculated from the appointment desired date. The desired appointment date is the date on which the patient or provider wants the patient to be seen. The goal is to see patients (complete appointments) within 14 days from the desired date

Page 74
2012 VHA Facility Quality and Safety Report Department of Veterans Affairs
for all appointments. Completed appointment wait times is a Quality Indicator with benchmark for FY10 and FY11.
Measurement segments all specialty care patients into two groups; those that are new (not seen in the clinic group in the past 24 months) and all others, or “established” patients. Wait
FC Specialty days
care patients seen within 14 times for new and established patients are calculated from the appointment desired date. The desired appointment date is the date on which the patient or provider wants the patient to be seen. The goal is to see patients (complete appointments) within 14 days from the desired date for all appointments. Completed appointment wait times is a Quality Indicator with benchmark for FY10 and FY11.
SECTION 6: Patient-Centered
Satisfaction with Inpatient Care
FD Communication withNumber of surveys returned
Nurses
Question 1. During this hospital stay, how often did nurses treat you with courtesy and respect? Question 2. During this hospital stay, how often did nurses listen carefully to you? Question 3. During this hospital stay, how often did nurses explain things in a way you could understand?
FE Communication Score
with Nurses Questions 1, 2, and 3 have the following response scale: Never, Sometimes, Usually, Always. The score on each item is calculated as the percentage of responses that fall in the top category Always). Communication with Nurses is then calculated as the average of the site's scores on the three items.
FF Communication Number of surv
with eys returned
Doctors
Question 5. During this hospital stay, how often did doctors treat you with courtesy and respect? Question 6. During this hospital stay, how often did doctors listen carefully to you? Question 7. During this hospital stay, how often did doctors explain things in a way you could understand?
FG Communication Score
with Doctors Questions 5, 6, and 7 have the following response scale: Never, Sometimes, Usually, Always. The score on each item is calculated as the percentage of responses that fall in the top category (Always). Communication with Doctors is then calculated as the average of the site's scores on the three items.
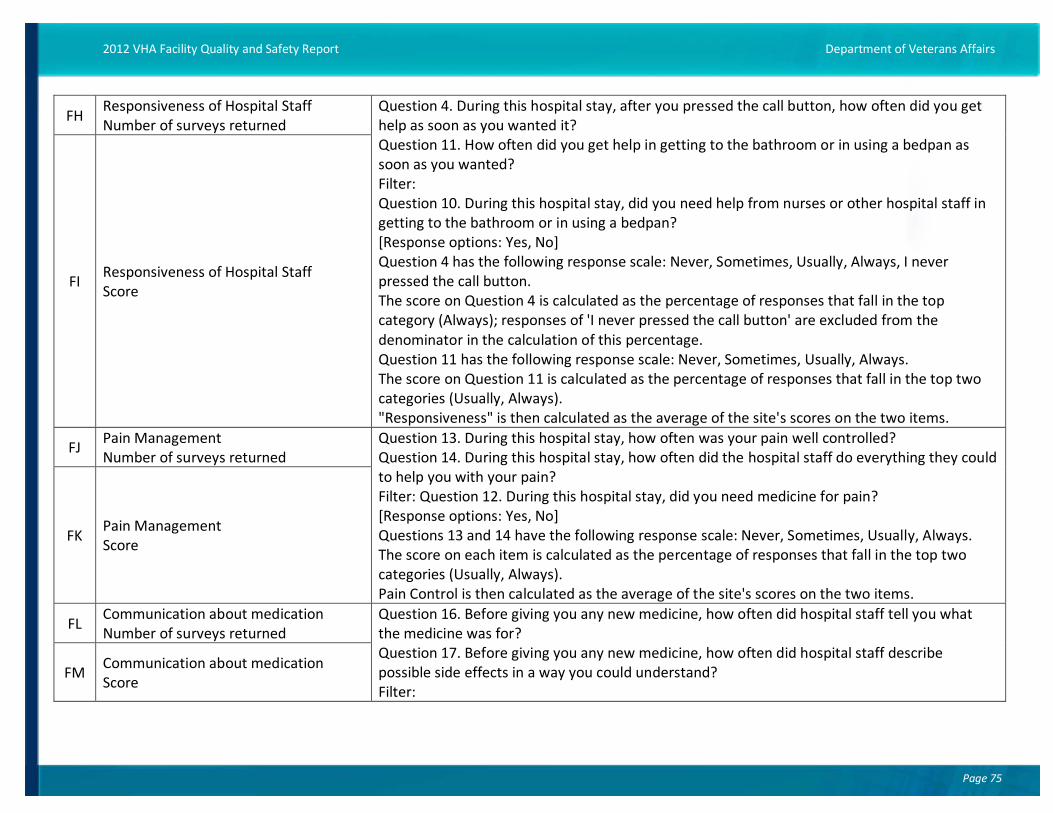
Page 75
2012 VHA Facility Quality and Safety Report Department of Veterans Affairs
FH Responsiveness of Hospital Staff Number of surveys returned
Question 4. During this hospital stay, after you pressed the call button, how often did you get help as soon as you wanted it? Question 11. How often did you get help in getting to the bathroom or in using a bedpan as soon as you wanted? Filter: Question 10. During this hospital stay, did you need help from nurses or other hospital staff in getting to the bathroom or in using a bedpan? [Response options: Yes, No] Question 4 has the following response scale: Never, Sometimes, Usually, Always, I never pressed the call button. The score on Question 4 is calculated as the percentage of responses that fall in the top category (Always); responses of 'I never pressed the call button' are excluded from the denominator in the calculation of this percentage. Question 11 has the following response scale: Never, Sometimes, Usually, Always. The score on Question 11 is calculated as the percentage of responses that fall in the top two categories (Usually, Always). "Responsiveness" is then calculated as the average of the site's scores on the two items.
FI Responsiveness Score
of Hospital Staff
FJ Pain Management Number of surveys returned
Question 13. During this hospital stay, how often was your pain well controlled? Question 14. During this hospital stay, how often did the hospital staff do everything they could to help you with your pain? Filter: Question 12. During this hospital stay, did you need medicine for pain? [Response options: Yes, No] Questions 13 and 14 have the following response scale: Never, Sometimes, Usually, Always. The score on each item is calculated as the percentage of responses that fall in the top two categories (Usually, Always). Pain Control is then calculated as the average of the site's scores on the two items.
FK Pain Management Score
FL Communication about medication Number of surveys returned
Question 16. Before giving you any new medicine, how the medicine was for? Question 17. Before giving you any new medicine, how possible side effects in a way you could understand? Filter:
often
often
did
did
hospital
hospital
staff
staff
tell you what
describe FM
Communication Score
about medication

Page 76
2012 VHA Facility Quality and Safety Report Department of Veterans Affairs
Question 15. During this hospital stay, were you given any medicine that you had not taken before? Questions 16 and 17 have the following response scale: Never, Sometimes, Usually, Always. The score on each item is calculated as the percentage of responses that fall in the top category (Always). Communication about Medication is then calculated as the average of the site's scores on the two items.
FN Cleanliness Number of
of the hospital environment surveys returned Question 8. During this hospital stay, how often were your room and bathroom kept clean?
Question 8 has the following response scale: Never, Sometimes, Usually, Always. The reporting measure is calculated as the percentage of responses that fall in the top two categories (Usually, Always).
FO Cleanliness Score
of the hospital environment
FP Quietness of the hospital environment Number of surveys returned
Quietness of the hospital environment Score
Question 9. During this hospital stay, how often was the area around your room quiet Question 9 has the following response scale: Never, Sometimes, Usually, Always. The reporting measure is calculated as the percentage of responses that fall in the top categories (Usually, Always).
at night?
two FQ
FR Discharge information Number of surveys returned
Question 19. During this hospital stay, did doctors, nurses or other hospital staff talk with you about whether you would have the help you needed when you left the hospital? Question 20. During this hospital stay, did you get information in writing about what symptoms or health problems to look out for after you left the hospital? Filter:
FS Discharge information Score
Question 18. After you left the hospital, did you go directly to your own home, to someone else’s home, or to another health facility? Questions 19 and 20 have the following response scale: Yes, No. The score on each item is calculated as the percentage of 'Yes' responses. Discharge Information is then calculated as the average of the site's scores on the two items.
FT Overall rating of hospital Number of surveys returned
Question 21. Using any number from 0 to 10, where 0 is the worst hospital possible and 10 is the best hospital possible, what number would you use to rate this hospital during your stay? Question 21 has the following response scale: 0, 1, 2, 3, 4, 5, 6, 7, 8, 9, 10. The reporting measure is calculated as the percentage of responses that fall in the top two categories (9, 10).
FU Overall Score
rating of hospital

Page 77
FV Willingness to recommend Number of surveys returned
Question 22. Would you recommend this hospital to your friends and family? Question 22 has the following response scale: Definitely no, Probably no, Probably yes, Definitely yes. The reporting measure is calculated as the percentage of responses in the top category (Definitely yes).
FW Willingness Score
to recommend
Satisfaction with Outpatient Care
FX How Well Doctors/Nurses Communicate Number of surveys returned
Question 15. In the last 12 months, how often did your personal VA doctor or nurse explain things in a way that was easy to understand? Question 16. In the last 12 months, how often did your personal VA doctor or nurse listen carefully to you? Question 18. In the last 12 months, how often did your personal VA doctor or nurse show respect for what you had to say? Question 19. In the last 12 months, how often did your personal VA doctor or nurse spend enough time with you? Filters: Question 13. A personal doctor or nurse is the one you would see if you need a checkup, want advice about a health problem or get sick or hurt. Do you have a personal VA doctor or nurse? [Response options: Yes, No] Question 14. In the last 12 months, how many times did you visit your personal VA doctor or nurse to get care for yourself? [Response options: None, 1, 2, 3, 4, 5 to 9, 10 or more] Responses to Questions 15, 16, 18, and 19 were used only if response to Question 13 was 'yes' or blank and response to Question 14 was not 'None.' Questions 15, 16, 18, and 19 have the following response scale: Never, Sometimes, Usually, Always. The score on each item is calculated as the percentage of responses that fall in the top category (Always). How Well Doctors/Nurses Communicate is then calculated as the average of the site's scores on the four items.
FY How Well Doctors/Nurses Communicate Score
FZ Rating of Personal Doctor/Nurse Number of surveys returned
Question 20. Using any number from 0 to 10, where 0 is the worst personal doctor/nurse possible and 10 is the best personal doctor/nurse possible, what number would you use to your personal VA doctor/nurse?
rate
GA Rating of Personal Doctor/Nurse
2012 VHA Facility Quality and Safety Report Department of Veterans Affairs

Page 78
2012 VHA Facility Quality and Safety Report Department of Veterans Affairs
Score Filter: Question 13. A personal doctor or nurse is the one you would see if you need a checkup, want advice about a health problem or get sick or hurt. Do you have a personal VA doctor or nurse? [Response options: Yes, No] Responses to Question 20 were used only if response to Question 13 was 'yes' or blank . Question 20 has the following response scale: 0, 1, 2, 3, 4, 5, 6, 7, 8, 9, 10. The reporting measure is calculated as the percentage of responses that fall in the top two categories (9, 10).
GB Getting Needed Care Number of surveys returned
Question 12. In the past 12 months, how often was it easy to get the care, tests or treatment you thought you needed through VA? Filter: Question 11. In the past 12 months, did you try to get any care, tests or treatment through VA? [Response options: Yes, No] Response to Question 12 was used only if response to Question 11 was 'yes' or blank. Question 22. In the last 12 months, how often was it easy to get appointments with VA specialists? Filter: Question 21. Specialists are doctors like surgeons, heart doctors, allergy doctors, skin doctors, and other doctors who specialize in one area of healthcare. In the last 12 months, did you try to make any appointments to see a VA specialist? [Response options: Yes, No] Response to Question 22 was used only if response to Question 21 was 'yes' or blank. Questions 12 and 22 have the following response scale: Never, Sometimes, Usually, Always. The score on each item is calculated as the percentage of responses that fall in the top category (Always). Getting Needed Care is then calculated as the average of the site's scores on the two items.
GC Getting Score
Needed Care
GD Overall Rating of VA Healthcare Number of surveys returned
Question 10. Using any number from 0 to 10, where 0 is the worst healthcare possible and the best healthcare possible, what number would you use to rate all your VA healthcare in last 12 months?
10 is the
GE Overall Score
Rating of VA Healthcare Question 10 has the following response scale: 0, 1, 2, 3, 4, 5, 6, 7, 8, 9, 10. The reporting measure is calculated as the percentage of responses that fall in the top two categories (9, 10).
GF Getting Care Quickly Number of surveys returned
Question 2. In the last 12 months, when you care as soon as you thought you needed?
needed care right away, how often did you get

Page 79
2012 VHA Facility Quality and Safety Report Department of Veterans Affairs
GG Getting Score
Care Quickly
Filter: Question 1. In the last 12 months, did you have an illness, injury, or condition that needed care right away in a clinic, emergency room, or doctor’s office? [Response options: Yes, No] Response to Question 2 was used only if response to Question 1 was 'yes' or blank. Question 4. In the past 12 months, not counting the times you needed care right away, how often did you get an appointment as soon as you thought you needed? Filter: Question 3. In the last 12 months, not counting the times you needed care right away, did you make any appointments for your healthcare at a doctor’s office or clinic? [Response options: Yes, No] Response to Question 4 was used only if response to Question 3 was 'yes' or blank. Questions 2 and 4 have the following response scale: Never, Sometimes, Usually, Always. The score on each item is calculated as the percentage of responses that fall in the top category (Always). Getting Care Quickly is then calculated as the average of the site's scores on the two items.
GH Overall Rating of VA Specialist Number of surveys returned
Question 24. We want to know your rating of the VA specialist you saw most often in the last 12 months. Using any number from 0 to 10, where 0 is the worst specialist possible and 10 is the best specialist possible, what number would you use to rate that VA specialist? Filters: Question 21. Specialists are doctors like surgeons, heart doctors, allergy doctors, skin doctors, and other doctors who specialize in one area of healthcare. In the last 12 months, did you try to make any appointments to see a VA Specialist? [Response options: Yes, No] Question 23. How many VA specialists have you seen in the last 12 months? [Response options: None, 1 VA specialist, 2, 3, 4, 5 or more VA specialists] Response to Question 24 was used only if response to Question 21 was 'yes' or blank and response to Question 23 was not 'None'. Question 24 has the following response scale: 0, 1, 2, 3, 4, 5, 6, 7, 8, 9, 10. The reporting measure is calculated as the percentage of responses that fall in the top two categories (9, 10).
GI Overall Score
Rating of VA Specialist
GJ Provider Number
Wait Time 20 min or of surveys returned
less Outpatient Question 32: Percentage reporting a wait time of 20 minutes or less
GK Provider Wait Time 20 min or less

Page 80
2012 VHA Facility Quality and Safety Report Department of Veterans Affairs
Score
SECTION 7: Efficient
Ambulatory Care Sensitive Conditions
GL All 12
All 12 ACSC Conditions: Hospitalizations per 1000 ACSC Patients: This is the risk standardized admission rate of ACSC hospitalizations per 1000 unique ACSC patients during the Fiscal Year reporting period. A total of 130 ICD-9 diagnosis codes associated with the 12 ACSCs listed previously were used to identify all patients with any of the ACSCs (see code detail at http://www.qualityindicators.ahrq.gov/pqi_download.htm) in any position in the inpatient, outpatient, and Fee/Contract files. Avoidable or ACSC hospitalizations were identified by matching these 130 ICD-9 codes to the principal diagnosis in the inpatient main files (certain CHF and pneumonia admissions are excluded according to AHRQ's algorithm). ACSC patients and hospitalizations were then assigned to facilities by their assignment to an associated Primary Care Provider (PCP).
GM CHF
Congestive Heart Failure (CHF): Hospitalizations per 1000 CHF ACSC Patients: This is the risk standardized admission rate of CHF ACSC hospitalizations per 1000 unique CHF ACSC patients during the Fiscal Year reporting period. A total of 25 ICD-9 diagnosis codes associated with the CHF ACSCs were used to identify all patients with any of the ACSCs (see code detail at http://www.qualityindicators.ahrq.gov/pqi_download.htm) in any position in the inpatient, outpatient, and Fee/Contract files. Avoidable or ACSC hospitalizations were identified by matching these 25 ICD-9 codes to the principal diagnosis in the inpatient main files (certain CHF admissions are excluded according to AHRQ's algorithm). CHF ACSC patients and hospitalizations were then assigned to facilities by their assignment to an associated Primary Care Provider (PCP).
GN Pneumonia
Pneumonia: Hospitalizations per 1000 Pneumonia ACSC Patients: This is the risk standardized admission rate of bacterial pneumonia ACSC hospitalizations per 1000 unique bacterial pneumonia ACSC patients during the Fiscal Year reporting period. A total of 12 ICD-9 diagnosis codes associated with the bacterial pneumonia ACSCs were used to identify all patients with any of the ACSCs (see code detail at http://www.qualityindicators.ahrq.gov/pqi_download.htm) in any position in the inpatient, outpatient, and Fee/Contract files. Avoidable or ACSC hospitalizations were identified by matching these 12 ICD-9 codes to the principal diagnosis in the inpatient main files (certain

Page 81
2012 VHA Facility Quality and Safety Report Department of Veterans Affairs
pneumonia admissions are excluded according to the AHRQ's algorithm). Bacterial Pneumonia ACSC patients and hospitalizations were then assigned to facilities by their assignment to an associated Primary Care Provider (PCP).
Acute Care Admissions not meeting GP InterQual Clinical Appropriateness
Criteria- level of care too high
Post-Admission Bed Days not meeting GQ Clinical Appropriateness Criteria-level of
care too low
Post-Admission Bed Days not meeting GR Clinical Appropriateness Criteria-level of
care too high