2012 Update on U.S. emergency care and longitudinal trends (1995-2010) Jesse M. Pines, MD, MBA, MSCE...
38
2012 Update on U.S. emergency care and longitudinal trends (1995-2010) Jesse M. Pines, MD, MBA, MSCE and Mark Zocchi, MPH AHRQ National Meeting September 10, 2012
-
Upload
ethelbert-roberts -
Category
Documents
-
view
214 -
download
0
Transcript of 2012 Update on U.S. emergency care and longitudinal trends (1995-2010) Jesse M. Pines, MD, MBA, MSCE...

2012 Update on U.S. emergency care and longitudinal trends (1995-2010)
Jesse M. Pines, MD, MBA, MSCE and Mark Zocchi, MPH
AHRQ National Meeting September 10, 2012
Disclosures Funding and support
Centers for Medicare and Medicaid Services National Quality Forum Agency for Healthcare Research and Quality Robert Wood Johnson Foundation Saudi Arabian Cultural Mission University of Cincinnati

Project co-authors / collaborators Ryan Mutter, PhD, AHRQ Lan Zhao, PhD, Social and Scientific Systems

Objectives Provide a update on emergency care for 2012
Where are we since the IOM report?
Describe emergency care policy issues and longitudinal trends in emergency care in the U.S.

Introduction Why does emergency care matter?
Asplin Ann Emerg Med 2003

Institute of Medicine Future of Emergency Care Series
(2006) Hospital-Based Emergency Care: At the
Breaking Point ED crowding, ambulance diversion, ED boarding
very common Call to end boarding, except under “extreme”
circumstances Emergency departments not prepared for mass-
casualty events Call for greater health information technology,
information-sharing
Emergency Medical Services: At the Crossroads
Emergency Care for Children: Growing Pains

Where are we in 2012? ED crowding, diversion, ED boarding very
common
Pitts Pines Ann Emerg Med 2012

Where are we in 2012? ED crowding, diversion, ED boarding very
common
Pitts Pines Ann Emerg Med 2012

What is causing crowding? Visits are going up
The total time spent in the ED is rising faster

What is causing crowding?
Pitts Pines Ann Emerg Med 2012

What is causing crowding?
Pitts Pines Ann Emerg Med 2012

Expanded literature on ED crowding ED crowding is associated with:
Poorer quality pain care Delays in medications Delays in critical tests Higher medication errors Higher rates of complications Lower quality care in pediatric asthma
ED boarding is associated with: Higher medical errors Higher mortality rates

Where are we in 2012? What has happened from a policy
perspective?
2008 ED National Quality Forum ED crowding measures ED LOS discharged, admitted, overall Left without being seen rate
2009 Diversion ban in Massachusetts
2011 – ED LOS measures released on Hospital Compare
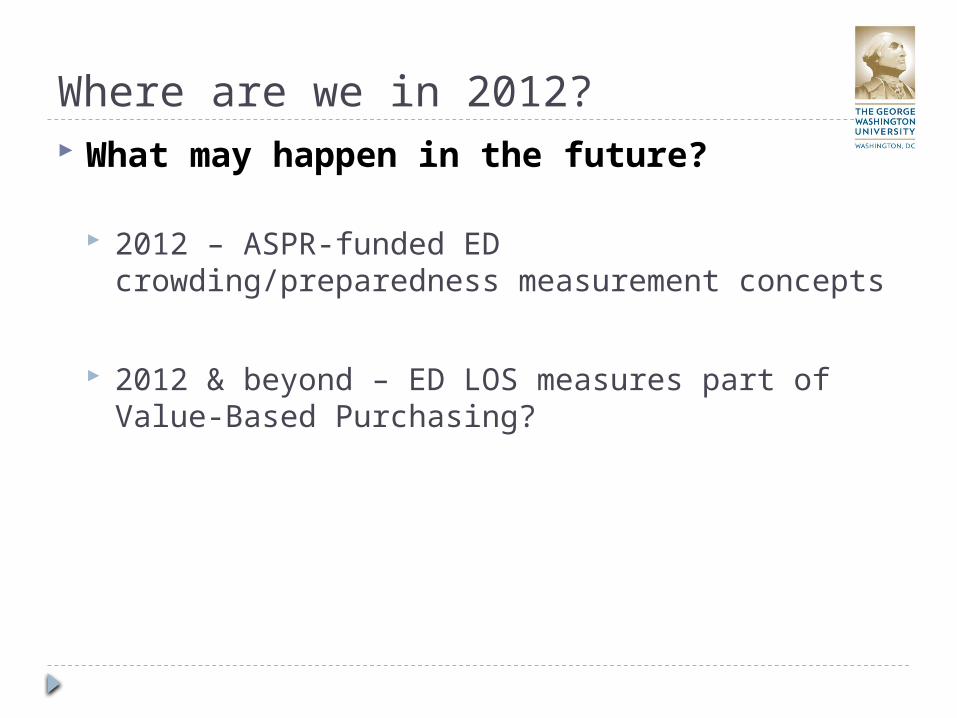
Where are we in 2012? What may happen in the future?
2012 – ASPR-funded ED crowding/preparedness measurement concepts
2012 & beyond – ED LOS measures part of Value-Based Purchasing?

Where are we in 2012? 2012 – Joint Commission Flow Standard (82% of hospitals)
EP1: Hospital has a process that supports the flow of patients throughout the hospital.
EP2: Hospital must plan and care for the patients who are admitted and whose bed is not ready or a bed is unavailable.
EP3: Hospital must plan for the care for patients who are placed in an overflow location. (Appropriate care regardless of location)
EP4: Hospital should have a policy and procedure on diversion.

Where are we in 2012? EP5: Hospitals must measure and set goals for the components of
the patient flow process.
EP 6: (2014): Hospital must measure and set goals for mitigating and managing the boarding of emergency department patients.
EP 7 (2014): Hospital staffs or individuals who manage the patient flow processes must review the measurement results.
EP8 (2014): Hospital leaders must act to improve patient flow when the goals were not achieved. Leaders who must take action involve the board, medical staff, along with the CEO and senior leadership staff.
EP9 (2014): Hospital must determine if the population at risk for boarding due to behavioral health emergencies. Hospital leaders must communicate with the behavioral health providers to improve coordination.

Next policy questions Why do people come to the ED?
Beyond the critically ill What are alternatives? How will new policy changes impact these trends?
What care are people receiving? Higher intensity care
Advanced radiography, laboratory tests, IVs Sicker patients Admissions
How is the ED changing over time, compared to other parts of the system At what cost?

Why do so many people come to the ED?
Ragin Acad Emerg Med 2005

How does the ED compare to alternatives?
Morgan Pines Am J Manag Care 2012

Policy changes and the ED Payment bundling, accountable care
organizations Will this impact the ED
How? Depends…..
Medical home model Early results that becoming a medical home is
associated with lower ED visits
Diversion of low-acuity patients to alternative settings Wellpoint; others
Has been somewhat effective, but may not reduce overall costs

Why do people come to the ED?
2009 NHAMCS data, CDC

Why do people come to the ED The reasons people
come to the ED (and get admitted to the hospital are not changing)
There are just more and more people, and the growth is outpacing population expansion

How is the intensity of care changing? More intense care, higher complexity care
SEDD 2004-2010: GA, HI, MA, MD, MO, NE, VT, WI
Emergency Department Visits: Percentage of Services (denominator = all ED records)
CPT Code 2004 2005 2006 2007 2008 2009 2010
99281 16% 15% 10% 16% 16% 16% 16%
99282 15% 14% 10% 14% 16% 15% 14%
99283 19% 19% 14% 24% 32% 34% 34%
99284 8% 9% 7% 14% 19% 21% 22%
99285 2% 3% 2% 5% 6% 7% 8%

How about hospital admissions?
2002 2003 2004 2005 2006 2007 2008 2009 20100.0
0.5
1.0
1.5
2.0
2.5
APR-DRG Severity by ED Status
ED Admission Non-ED Admission
Sev
erit
y
HCUP data, AHRQ

How about admission rates? Is the likelihood of admission increasing?

ED admission rates over time
2002 2003 2004 2005 2006 2007 2008 20090%
2%
4%
6%
8%
10%
12%
14%
16%
18%
Per
cen
t A
dm
itte
d f
rom
ED
HCUP data, AHRQ

How about specific populations? ED admission rates are increasing for older
adults CDC data 36.2% in 2001; 38.7% in 2009
Numbers of ICU admissions are increasing dramatically CDC data 2.76 million in 2002-2003 4.14 million in 2008-2009
Pines J Am Geriatric Soc 2012 (in press) ; Mullins Pines Crit Care Med (under review)

Policy questions ED visits increasing Patients are sicker, more ICU-bounds Staying for more prolonged work-ups Admission rates are unchanged on average
Perhaps preventing some hospital admissions in younger patients?
Next questions: Where are ED visits increasing more? What is happening to the supply of EDs?

Total U.S. ED volume v. # of EDs
1995 1996 1997 1998 1999 2000 2001 2002 2003 2004 2005 2006 2007 2008 2009 20100
20,000,000
40,000,000
60,000,000
80,000,000
100,000,000
120,000,000
140,000,000
0
1,000
2,000
3,000
4,000
5,000
ED
Vo
lum
e (m
illi
on
s)
Dis
cret
e E
Ds
(th
ou
san
ds)
HCUP data, AHRQ

Profit v. non-profit v. public
1995 1996 1997 1998 1999 2000 2001 2002 2003 2004 2005 2006 2007 2008 2009 20100
10,000,000
20,000,000
30,000,000
40,000,000
50,000,000
60,000,000
70,000,000
80,000,000
90,000,000
100,000,000
0
1,000
2,000
3,000
For Profit Non profit
ED
Vo
lum
e (m
illi
on
s)
Dis
cret
e E
Ds
(th
ou
san
ds)
HCUP data, AHRQ

Urban v. rural location
1995 1996 1997 1998 1999 2000 2001 2002 2003 2004 2005 2006 2007 2008 2009 20100
20,000,000
40,000,000
60,000,000
80,000,000
100,000,000
120,000,000
0
1,000
2,000
3,000
Rural
ED
Vo
lum
e (m
illi
on
s)
Dis
cret
e E
Ds
(th
ou
san
ds)
HCUP data, AHRQ
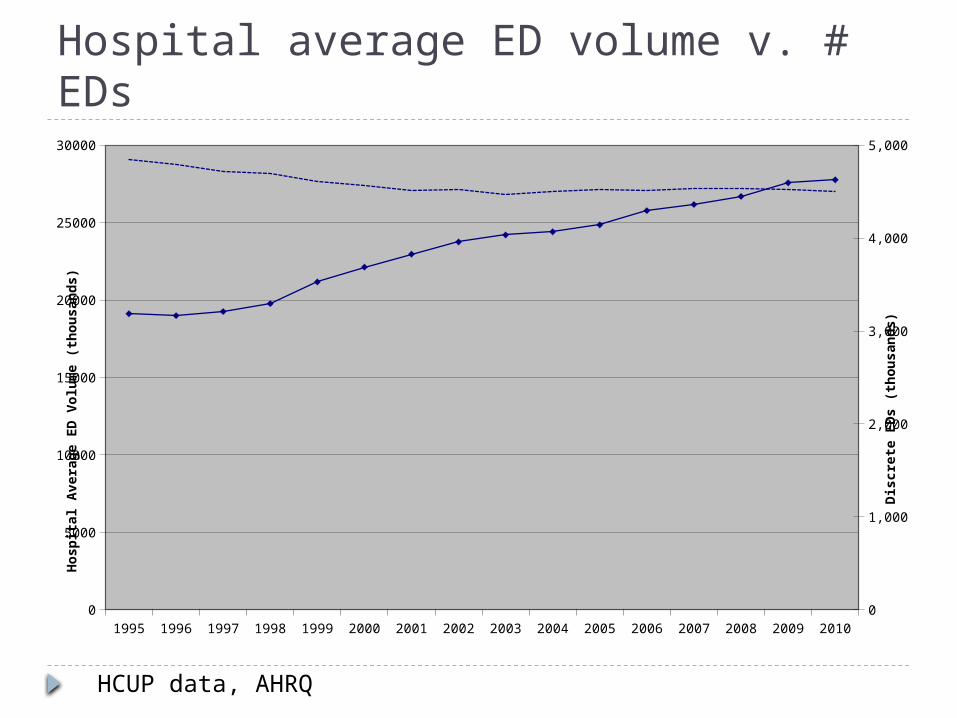
Hospital average ED volume v. # EDs
1995 1996 1997 1998 1999 2000 2001 2002 2003 2004 2005 2006 2007 2008 2009 20100
5000
10000
15000
20000
25000
30000
0
1,000
2,000
3,000
4,000
5,000
Ho
spit
al A
vera
ge
ED
Vo
lum
e (t
ho
usa
nd
s)
Dis
cret
e E
Ds
(th
ou
san
ds)
HCUP data, AHRQ

Growing role of ED admissions
Schuur Venkatesh New Engl J Med 2012

Average cost per admission
1995 1996 1997 1998 1999 2000 2001 2002 2003 2004 2005 2006 2007 2008 2009 20100
2000
4000
6000
8000
10000
12000
ED Admissions Non-ED Admissions
Ave
rag
e C
ost
of
Ad
mis
sio
ns
(in
th
ou
san
ds
2010
Do
llar
s)
Pre-2000 costs are based on 2000 ratios.
HCUP data, AHRQ
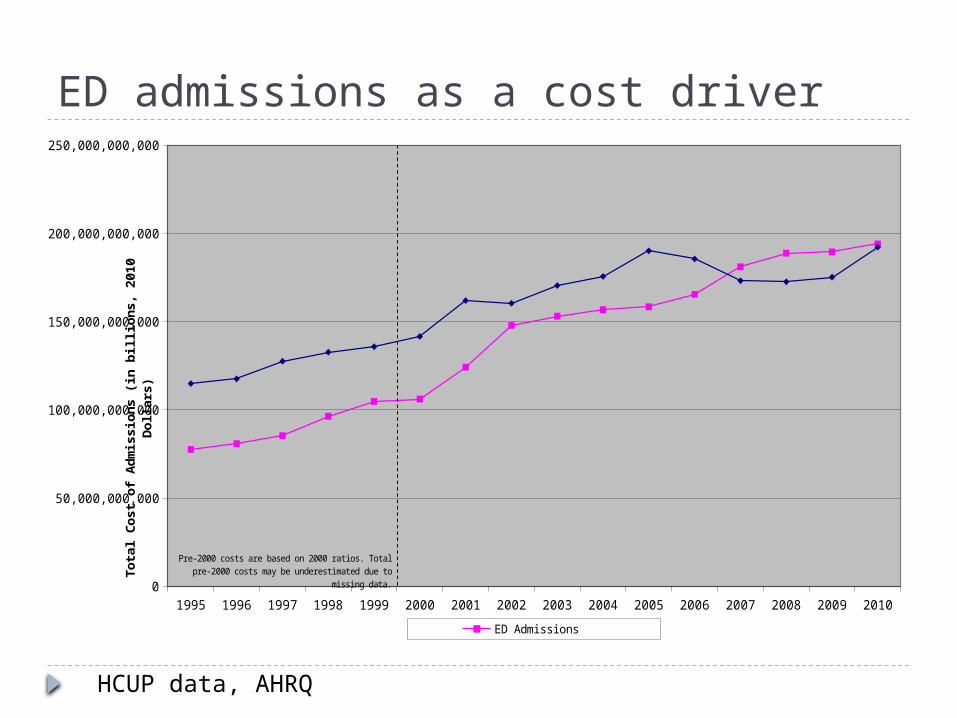
ED admissions as a cost driver
1995 1996 1997 1998 1999 2000 2001 2002 2003 2004 2005 2006 2007 2008 2009 20100
50,000,000,000
100,000,000,000
150,000,000,000
200,000,000,000
250,000,000,000
ED Admissions Non-ED Admissions
To
tal
Co
st o
f A
dm
issi
on
s (i
n b
illi
on
s, 2
010
Do
llar
s)
Pre-2000 costs are based on 2000 ratios. Total pre-2000 costs may be underestimated due to missing data.
HCUP data, AHRQ

Recap ED crowding and boarding
How far have we come since the 2006 IOM Report
Trends in demand for emergency care in the U.S. Will this go unabated? What does this mean for U.S. healthcare costs?

Questions?