2012 Tuning phase transitions and magnetocaloric ...
194
University of Wollongong Research Online University of Wollongong esis Collection University of Wollongong esis Collections 2012 Tuning phase transitions and magnetocaloric properties of novel materials for magnetic refrigeration Precious Shamba University of Wollongong Research Online is the open access institutional repository for the University of Wollongong. For further information contact the UOW Library: [email protected] Recommended Citation Shamba, Precious, Tuning phase transitions and magnetocaloric properties of novel materials for magnetic refrigeration, Doctor of Philosophy thesis, Institute for Superconducting and Electronic Materials, University of Wollongong, 2012. hp://ro.uow.edu.au/ theses/3823
Transcript of 2012 Tuning phase transitions and magnetocaloric ...

University of WollongongResearch Online
University of Wollongong Thesis Collection University of Wollongong Thesis Collections
2012
Tuning phase transitions and magnetocaloricproperties of novel materials for magneticrefrigerationPrecious ShambaUniversity of Wollongong
Research Online is the open access institutional repository for theUniversity of Wollongong. For further information contact the UOWLibrary: [email protected]
Recommended CitationShamba, Precious, Tuning phase transitions and magnetocaloric properties of novel materials for magnetic refrigeration, Doctor ofPhilosophy thesis, Institute for Superconducting and Electronic Materials, University of Wollongong, 2012. http://ro.uow.edu.au/theses/3823


Institute for Superconducting and Electronic Materials
Tuning Phase Transitions and
Magnetocaloric Properties of Novel
Materials for Magnetic Refrigeration
By
Precious Shamba, BSc (Hons), MSc
This thesis is presented as part of the requirements for the
Award of the Degree of Doctor of Philosophy
of the
University of Wollongong
December 2012

ii
DECLARATION
I, Precious Shamba, declare that this thesis, submitted in partial fulfilment of the
requirements for the award of Doctor of Philosophy, in the Institute for Superconducting
& Electronic Materials (ISEM), Faculty of Engineering, University of Wollongong,
Australia, is wholly my own work unless otherwise referenced or acknowledged. This
document has not been submitted for a qualification at any other academic institution.
Precious Shamba
December, 2012

iii
ACKNOWLEDGEMENTS
Working on this PhD has been a wonderful and often overwhelming experience. This journey
has provided me with a real learning experience on the importance of multi-tasking whilst
remaining focused. In any case, Im indebted to many people for making the time working on
my PhD an unforgettable experience.
First and foremost, I give gratitude to the Almighty Lord for granting me the wisdom and ability
to accomplish this study in spite of the numerous constraints that I encountered. I am deeply
grateful to my supervisor Professor Dou, for giving me the opportunity to embark on this PhD
study in a wonderful group that has provided me with the perfect atmosphere to do this work. I
would also like to thank Prof. Dou for his inspirational knowledge and understanding of
physics, his gentle but continuous support of any idea or suggestion I might come up with and
for his, in one way or another, always finding the time out of an incredibly busy schedule to
answer my questions or listen to my ramblings. To work with you has been a real pleasure. My
co-supervisor Dr Rong Zeng, I thank you for your persistent guidance during my PhD study. In
times when the PhD got the better of me, I thank you for your quiet but always present
encouragement and always telling me, “It‟s ok”. My co-supervisor Dr Jianli Wang, I would like
to express my profound gratitude. At a time, when I had lost hope of ever finishing this PhD,
you came on board as my co-supervisor. Your understanding and knowledge of physics has
inspired me. I thank you for your encouraging words and for being always willing to explain
things that seem difficult to me in a simple and clear way. I thank you for your patience and
kindness and most importantly your willingness to share your knowledge. To my colleagues
Sujeewa and Maryam, thank you for making my time at ISEM bearable. I would also like to
thank Jyotish and Muhammad for their suggestions and helping hand during my PhD,
particularly towards the end of my PhD.

iv
In addition, I have been very priviledged to get the opportunity to collaborate with many other
great scientists. Dr Shane Kennedy from the Bragg Institute, Australian Nuclear Science and
Technology Organisation (ANSTO). I thank you for sacrificing time out of your incredibly busy
schedule to perform experiments with me, analyse data and correct numerous manuscripts as
well as this thesis. Your help is gratefully appreciated. I would like to thank the following
beamline scientists that helped with my experiments, Dr James Hester (ANSTO), Dr Andrew
Studer (ANSTO) and Dr Qinfen Gu (Australian Synchrotron). I would like to thank Professor
Stewart Campbell and Dr Wayne Hutchison from the Australian Defence Forces Academy,
University of New South Wales, who helped with the critical reading of one of my manuscripts
and magnetic measurements respectively. I would also like to thank Professor Giovanni Hearne,
University of Johannesburg, who taught me a lot about high pressure experiments.
I would like to gratefully acknowledge the financial support of University of Wollongong,
Australian Institute of Nuclear Science and Engineering (AINSE), Australian Synchrotron and
the University of Johannesburg. I would also like to express my sincere gratitude to Dr Tania
Silver for her kind help in the critical reading of this thesis. To Kayla, I couldn‟t ask for a more
perfect daughter, it‟s as if you understood in your own little way how busy this PhD study made
me. I feel very guilty that I didn‟t get to spend as much time with you as I would have loved, but
I promise you this: now that this thesis is out of the way we can play “Amhina” anytime you
like. To my husband Sebastian, words fail me in expressing my profound gratitude. I thank you
for believing in me and sacrificing a lot (mukaka etc) to accompany me to Australia to assure
my comfort, provide endless support and encouragement during my study. Although you most
probably won‟t agree with this, I could not have done this without you. To my siblings, Walter,
Marilyn, Wellington and Wayne (or Joseph, as I prefer to call you), thank you guys for your
support over the years.

v
Contents
Abstract……………………………………………….………………………………….1
CHAPTER 1. INTRODUCTION .............................................................................................. 5
1.1 Overview and Motivation ................................................................................................. 5
1.2 Organization of Thesis ..................................................................................................... 9
CHAPTER 2. LITERATURE REVIEW ................................................................................. 13
2.1 Historical Background of Magnetic Refrigeration ......................................................... 13
2.2 Basic Theory of the Magnetocaloric Effect.................................................................... 14
2.2.1 Basic Thermodynamics of the magnetocaloric effect.............................................. 19
2.3 Research Progress of magnetic materials for room temperature magnetic
refrigeration .......................................................................................................................... 25
2.3.1 La(Fe,Si)13 based compounds .................................................................................. 26
2.3.2 MnCoGe based compounds ..................................................................................... 34
2.3.3 Nanocomposite Systems .......................................................................................... 37
2.3.4 Comparisons of different materials and outlook...................................................... 40
CHAPTER 3. EXPERIMENTAL METHODS AND PROCEDURES ................................... 52
3.1 Sample Preparation ......................................................................................................... 52
3.1.1 Nano-sized sample Preparation – Microwave assisted hydrothermal process ........ 52
3.1.2 Bulk sample Preparation – Arc melting ................................................................... 53
3.2 Structural and physical characterization of the samples................................................. 53
3.2.1 X-Ray Diffraction .................................................................................................... 53
3.2.2 Scanning Electron Microscopy ................................................................................ 54
3.2.3 Neutron Measurements ............................................................................................ 55
3.2.4 Synchrotron Measurements ..................................................................................... 57
3.3 Physical Property Measurement System (PPMS) .......................................................... 58
3.3.1 Vibrating Sample Magnetometer (VSM) ................................................................ 58
CHAPTER 4. A SIGN OF FIELD-INDUCED FIRST ORDER MAGNETIC STATE
TRANSITION AND GIANT REVERSIBLE MAGNETOCALORIC EFFECT IN
COBALT HYDROXIDE NANOSHEETS .............................................................................. 59
4.1 Introduction .................................................................................................................... 59
4.2 Experimental Procedures ................................................................................................ 60
4.3 Results and Discussion ................................................................................................... 61

vi
4.4 Conclusions .................................................................................................................... 69
CHAPTER 5. ENHANCEMENT OF THE REFRIGERANT CAPACITY IN LOW
LEVEL BORON DOPED La0.8Gd0.2Fe11.4Si1.6. ...................................................................... 72
5.1 Introduction .................................................................................................................... 72
5.2 Experimental Procedures ................................................................................................ 73
5.3 Results & Discussion ...................................................................................................... 74
5.4 Conclusions .................................................................................................................... 91
CHAPTER 6. EFFECT OF BORON DOPING ON THE MAGNETOCALORIC AND
STRUCTURAL PROPERTIES OF THE La0.8Ce0.2Fe11.4Si1.6 REFRIGERANT .................... 94
6.1. Introduction ................................................................................................................... 94
6.2 Experimental details ....................................................................................................... 95
6.3 Results and Discussion ................................................................................................... 97
6.4 Conclusions .................................................................................................................. 112
CHAPTER 7. MAGNETOCALORIC EFFECT, CRYSTAL STRUCTURE AND
CRITICAL BEHAVIOUR OF THE Mn0.94Ti0.06CoGe ALLOY .......................................... 116
7.1 Introduction .................................................................................................................. 116
7.2 Experimental details ..................................................................................................... 117
7.3 Results and Discussion ................................................................................................. 118
7.3.1 Magnetic phase transitions..................................................................................... 118
7.3.2 Magnetocaloric effect ............................................................................................ 119
7.3.3 Critical exponent analysis ...................................................................................... 123
7.3.4 Neutron diffraction ................................................................................................ 132
7.4. Conclusions ................................................................................................................. 141
CHAPTER 8. HIGH PRESSURE SYNCHROTRON X-RAY DIFFRACTION STUDY
OF THE Mn0.94Ti0.06CoGe ALLOY ..................................................................................... 147
8.1 Introduction .................................................................................................................. 147
8.2 Experimental details ..................................................................................................... 148
8.2.1 Diamond Anvil Cell ............................................................................................... 149
8.2.2 Sample preparation and Loading ........................................................................... 151
8.2.3 Pressure Determination .......................................................................................... 151
8.3 Results and Discussion ................................................................................................. 152
8.3.1 Data Reduction of Image Plate Data Using FIT2D ............................................... 153

vii
8.3.2 Effect of Pressure on Structural Properties ............................................................ 157
8.4 Conclusions .................................................................................................................. 164
CHAPTER 9. CONCLUSIONS AND OUTLOOK............................................................... 167
Publications..…………………………………….…………...…………..………...…172

viii
List of Figures
Figure 2.1 Examples of magnetic order. Arrows represent the magnetic moments of
atoms in a cubic lattice. (a) ferromagnetic order where all the spins align in the same
direction. (b) antiferromagnetic order where the spins align opposite each
other………………………………………………………………………………..…...15
Figure 2.2 Illustration of the effect of applying an external magnetic field to a
ferromagnetic
material……………………………………………………...…………………….........16
Figure 2.3 S - T diagram demonstrating the magnetocaloric
effect……………………………………………………………………………………17
Figure 2.4 Illustration of the first order phase transition with the corresponding
equations describing the
transition……………………………………………………………….…………...…..20
Figure 2.5 Illustration of the second order phase
transition………………………………………………..………………………………20
Figure 2.6 Rate of increase of published research papers per annum on the
magnetocaloric effect. The triangle represents the number of papers abstracted during
the first three-fourths of the year
2007……………………………………………………………….……………………26
Figure 2.7 Volume and lattice parameters of the MnCoGe alloy as a function of
temperature……………………………………………………………………………. 34

ix
Figure 2.8 Temperature dependences of the magnetic entropy change induced by the
application of a field on the Gd0.85Y0.15alloy in bulk and nanosized
states……………...………………………………………………………………….....38
Figure 2.9 ∆SM values of different materials measured at
2T……………………………………………………………………………………….40
Figure 3.1 Kinematical interpretation of Bragg diffraction by adjacent crystal
planes…………………………………………………………………………………...54
Figure 3.2 Schematic diagram of the Echidna
diffractometer…………………………………………………..………………………56
Figure 3.3 Schematic diagram of the Australian
Synchrotron……………………………………………………………….……………56
Figure 4.1 The x-ray diffraction pattern of β - Co(OH)2
nanosheets……………………………………………………………………..………..61
Figure 4.2 The SEM image of β - Co(OH)2
nanosheets…………………………………………………………………..………......62
Figure 4.3 M – T, 1/χ – T, δM/δT – T curves of β - Co(OH)2
nanosheets………………………………………………………………………..……..63
Figure 4.4 Selected M - H loops of β - Co(OH)2
nanosheets……………………………………………………………………………....64
x
Figure 4.5 Magnetic behaviors of β - Co(OH)2 nanosheets, M – H
curves…………………………………………………………………………………...65
Figure 4.6 Arrott-plot curves of β - Co(OH)2
nanosheets……………………………………………………………….……………...66
Figure 4.7 Magnetic-entropy changes versus temperature curves of β - Co(OH)2
nanosheets…….………………………………………………………………………...67
Figure 4.8 Magnetic-entropy changes versus applied field of β - Co(OH)2
nanosheets………………………………………………………………………………68
Figure 5.1 Rietveld plot of X-ray diffraction data for a selected sample,
x = 0.06 at 300K …...…………………………………………………………………..75
Figure 5.2 Thermomagnetization curves of La0.8Gd0.2Fe11.4Si1.6Bx
compounds…………..………..………………………….……………………………..76
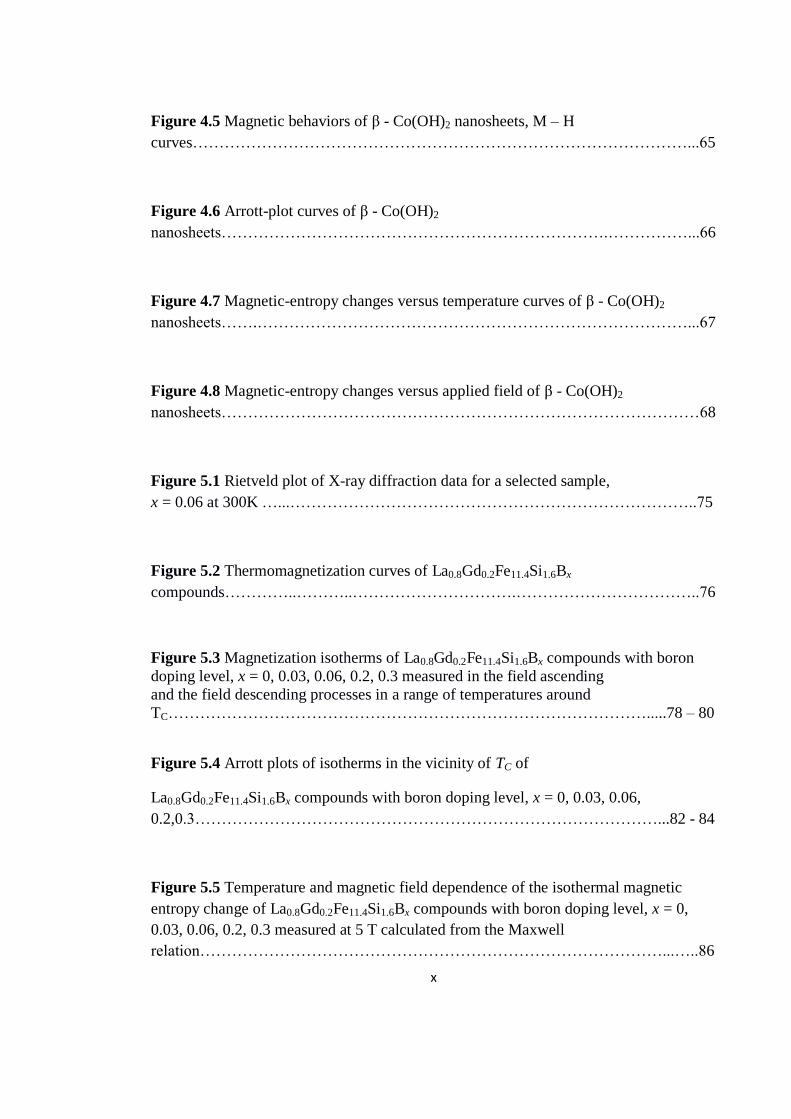
Figure 5.3 Magnetization isotherms of La0.8Gd0.2Fe11.4Si1.6Bx compounds with boron
doping level, x = 0, 0.03, 0.06, 0.2, 0.3 measured in the field ascending
and the field descending processes in a range of temperatures around
TC……………………………………………………………………………….....78 – 80
Figure 5.4 Arrott plots of isotherms in the vicinity of TC of
La0.8Gd0.2Fe11.4Si1.6Bx compounds with boron doping level, x = 0, 0.03, 0.06,
0.2,0.3……………………………………………………………………………...82 - 84
Figure 5.5 Temperature and magnetic field dependence of the isothermal magnetic
entropy change of La0.8Gd0.2Fe11.4Si1.6Bx compounds with boron doping level, x = 0,
0.03, 0.06, 0.2, 0.3 measured at 5 T calculated from the Maxwell
relation……………………………………………………………………………...…..86

xi
Figure 5.6 Field dependences of the refrigerant capacity for La0.8Gd0.2Fe11.4Si1.6Bx
compounds with boron doping level, x = 0, 0.03, 0.06, 0.2 and
0.3……………………….……………..………………………………………….……88
Figure 6.1 X-ray diffraction patterns of the La0.8Ce0.2Fe11.4Si1.6Bx samples with x = 0,
0.1 and 0.3……………………… .........................................................................…….97
Figure 6.2 Magnetization as a function of temperature in the ZFC and FC process for
the La0.8Ce0.2Fe11.4Si1.6Bx ……………………………………………………………... 98
Figure 6.3 The magnetization curves measured in the increasing
and decreasing field for the
La0.8Ce0.2Fe11.4Si1.6Bx………....……………………………………………...………..100
Figure 6.4 The temperature dependence of the hysteresis loss of
La0.8Ce0.2Fe11.4Si1.6Bx for values of x of 0, 0.1 and 0.3 measured at 2 and
5T……………………………………………………………………………………...101
Figure 6.5 Arrott plots of La0.8Ce0.2Fe11.4Si1.6Bx for values of x of 0, 0.1 and
0.3……………………………………………………………………………………..102
Figure 6.6 ∆SM vs T plots of La0.8Ce0.2Fe11.4Si1.6Bx for values of x of 0, 0.1 and
0.3……………………………………………………………………………………..104
Figure 6.7 Comparison of the ΔSM calculated using the Clausius-Clapeyron equation
and the ΔSM predicted by the Maxwell
relation………………………………………………………………………….……..105

xii
Figure 6.8 Magnetization as a function of temperature in the ZFC and FC process for
the La0.8Ce0.2Fe11.4Si1.6Bx samples with x = 0 and
0.03………………………………………………………………………..…………..107
Figure 6.9 Neutron powder diffraction data collected from the Echidna diffractometer
refined to the NaZn13 structure for La0.8Ce0.2Fe11.4Si1.6Bx samples with x = 0 and 0.03 at
room
temperature…………………………………………………………………...……….108
Figure 6.10 Neutron diffraction patterns measured at 0 T, for La0.8Ce0.2Fe11.4Si1.6Bx
samples with x = 0 and 0.03, showing negative thermal
expansion…………………………………………………………………………...…109
Figure 6.11 Neutron diffraction patterns measured at 200 K, for La0.8Ce0.2Fe11.4Si1.6Bx
samples with x = 0 and 0.03, showing negative magneto-elastic
expansion…………………………………………………………………..........…….110
Figure 6.12 Dependence of the lattice parameters extracted from Rietveld refinements
on the temperature measured at different magnetic fields for La0.8Ce0.2Fe11.4Si1.6Bx
samples with x = 0 and
0.03…………………………………………………………………………………...111
Figure 7.1 Temperature dependence of magnetization. The inset shows dM/dT vs T
used for the determination of Tstr as well as M2 vs T used for the determination of
TC…………………………………………………………………………………...…119
Figure 7.2 (a) Temperature dependence of the isothermal magnetic entropy change -
∆SM (T, H) for Mn0.94Ti0.06CoGe calculated from magnetization isotherms; (b)
Dependence of the magnetic entropy change on the parameter (µ0H/TC) 2/3
. The solid
line represents a linear fit to the
data…………………………………………………………………………………....121

xiii
Figure 7.3 Neutron diffraction patterns over the temperature range 10-340 K at 10 K
intervals. Below Tstr and above TC, the neutron pattern can be indexed well with the
space group Pnma (orthorhombic structure-hkl Miller indices without*) and space
group
P63/mmc…………………………………………………………………………….122
Figure 7.4 Isothermal magnetization curves for Mn0.94Ti0.06CoGe in the vicinity of TC.
…………...……………………………………………………………………………124
Figure 7.5 Arrott plot of M2 vs H / M at temperatures in the vicinity of
TC……………………………………………………………………………………...125
Figure 7.6 Temperature dependence of the spontaneous magnetization MS and inverse
initial susceptibility χ0-1
(solid lines are fitted to equations (7.2) and
(7.3))…………………………………………………………………………………..126
Figure 7.7 Modified arrott plot obtained by the Kouvel - Fisher method showing
isotherms of vs
with the calculated and
………………………………………………………………………………...….127
Figure 7.8 Kouvel-Fisher plot for the spontaneous magnetization and the inverse
initial susceptibility (T) (solid lines are fitted to equations (7.4) and
(7.5))……………………………………………………………………………...…...129
Figure 7.9 The critical isotherm analysis at TC .The inset shows the same plots on the
log – log scale (solid line is a linear fit to Equation
(7.6))…………………………………………………………………………………..129
Figure 7.10 Scaling plots indicating universal curves below and above TC for the
Mn0.94Ti0.06CoGe
alloy…………………………………………………………………………………...131

xiv
Figure 7.11 Neutron diffraction image for Mn0.94Ti0.06CoGe taken at
5 K steps over the temperature range 5 – 350 K……………………………………...132
Figure 7.12 Measured and calculated neutron diffraction patterns for the
Mn0.94Ti0.06CoGe alloy at 200 K, 245 K and 350 K. The points (marked by crosses) are
the experimental data while the solid lines are the calculated results. The vertical bars
indicate the peak positions that are calculated by the refinement and the bottom solid
line indicates the difference between the experimental and the calculated
results………………………………………………………………………...………..134
Figure 7.13 Quantitative phase analysis of the orthorhombic TiNiSi-type phase (space
group Pnma) and the hexagonal Ni2In-type phase (space group
P63/mmc)…………………………………………………………………..………….135
Figure 7.14 The peak intensity as a function of temperature for the (002)* and (011)
peaks…………………………………………………………………………………..136
Figure 7.15 Volume and lattice parameters as a function of temperature. Open symbols
denote the orthorhombic phase, closed symbols denote the hexagonal phase and half-
filled symbols denote the corresponding phases in the mixed phase
region………………………………………………………………………...………..138
Figure 7.16 (a) Field dependences of magnetization of the Mn0.94Ti0.06CoGe compound
measured in the vicinity of Tstr and TC with increasing field up to 8T. (b) Dependence of
the magnetic entropy change at the structural transition temperature Tstr and magnetic
phase transition temperature TC on the parameter (µ0H/TC) 2/3
. The solid line represents
a linear fit to the
data…………………………………………………………………………………...140
Figure 8.1 Experimental set-up of the high pressure x-ray powder diffraction
experiment………………...………………………………………..…………………148

xv
Figure 8.2 Merrill-Basset Diamond Anvil
Cell………………………………………………………...…………….…………….149
Figure 8.3 Schematic diagram of a diamond anvil
cell…………………………………………………………………………………….150
Figure 8.4 Tungsten gasket with a drilled hole acting as the sample
cavity………………………………………………………………………………….150
Figure 8.5 Powder diffraction image data recorded using a 2D Mar345
detector................................................................................................................153 – 155
Figure 8.6 A schematic illustrating stages of data
reduction……………………………………………………...……………………….156
Figure 8.7 Evolution of powder diffraction patterns for the Mn0.94Ti0.06CoGe alloy at
selected
pressures………………………………………………………………….……..…….157
Figure 8.8 Evolution of structural parameters for the Mn0.94Ti0.06CoGe alloy with
pressure. The dashed line through the data points is a guide to the
eye………………………………………………………………………..……………158
Figure 8.9 c/a ratio versus pressure for the Mn0.94Ti0.06CoGe alloy. The dashed line
through the data points is a guide to the
eye………………………………………………………………………………..……159

xvi
Figure 8.10 Relative volume of the Mn0.94Ti0.06CoGe alloy as a function of pressure.
The solid line represents the Birch-Murnaghan equation of state using the parameters
obtained in this
study………………………………………………………………………………...…162
Figure 8.11 Pressure dependence of the Mn – Mn interatomic distances in the
Mn0.94Ti0.06CoGe alloy. The line serves as a guide to the
eye…………………………………………………………………...…………….......163

xvii
List of Tables
Table 5.1 Magnetic hysteresis loss, lattice parameter, RCeff and bond angles of
La1-xGdxFe11.4Si1.6 compounds, measured at
5 T…………………………………………………………..…………………………..75
Table 5.2 Discrepancies in the reported MCE properties of
La1-xGdxFe11.4Si1.6 compounds, measured at
5 T………………………………………………………………………………………89
Table 6.1 Tabulated values of the refrigerant capacity RC (MR), RC (CC), and the
effective refrigerant capacity RCeff (MR) and RCeff (CC), at 5T for La0.8Ce0.2Fe11.4Si1.6Bx
for x values of 0-0.3………………………………………………………………...…107
Table 7.1 Tabulated values of the numerical coefficients and representing
the fitted orthorhombic and hexagonal phase fractions at T1 = 0 K and T2 = +∞
determined from the sigmoidal Boltzmann
fit……………………………………………………………………….……………...135
Table 8.1 Equation of state (EOS) parameters for the Mn0.94Ti0.06CoGe
alloy…………………...…………………………………………………………........161

xviii

1
Abstract
In this thesis, the magnetocaloric materials namely, the β-Co(OH)2 nanosheets,
La0.8Gd0.2Fe11.4Si1.6Bx compounds, La0.8Ce0.2Fe11.4Si1.6Bx compounds and the
Mn0.94Ti0.06CoGe alloy have been systematically investigated with their structural, magnetic
and magnetocaloric properties being studied in detail.
We report the synthesis of β-Co(OH)2 nanosheets using microwave assisted hydrothermal
and conventional chemical reaction methods. A magnetic transition at an onset temperature,
T1 = 96 K, and a sign of antiferromagnetic state transition at the Néel temperature,
TN = 9 ~ 10 K, can be determined from M-T curves and M-H curves magnetic properties
investigation. It is found that a sign of field-induced first order transition below 9 K, acts the
role of reversing the magnetocaloric effect from negative to positive value. The large
reversible magnetic-entropy change ΔSM of 17 J/kg K around 11 K for a field change of 5 T
indicates that this material is useful for refrigeration applications at low temperatures.
The effects of boron doping on the itinerant-electron metamagnetic (IEM) transition and the
magnetocaloric effects (MCEs) in the cubic NaZn13-type La0.8Gd0.2Fe11.4Si1.6 compound have
been investigated. The Curie temperature, TC, of La0.8Gd0.2Fe11.4Si1.6Bx compounds with
x = 0, 0.03, 0.06, 0.2 and 0.3 was found to increase from 200 K to 222 K with increase in
boron doping, x. The maximum values of the isothermal magnetic entropy change, ΔSM,
(derived using the Maxwell relation for a field change ΔB = 0 – 5 T) in La0.8Gd0.2Fe11.4Si1.6Bx
with x = 0, 0.03, 0.06, 0.2 and 0.3 are 14.8, 16, 15, 7.5 and 6.6 J kg-1
K-1
respectively, with
corresponding values of the refrigerant capacity, RCP of 285, 361, 346, 222 and 245 J kg-1
.

2
The large ΔSM value observed for the low level B doped La0.8Gd0.2Fe11.4Si1.6B0.03 and
La0.8Gd0.2Fe11.4Si1.6B0.06 compounds is attributed to the first order nature of the IEM transition
while the decrease of ΔSM at x = 0.2 and 0.3 is due to a change to a second order phase
transition with increase in B doping. The nature of the magnetic phase transitions is also
reflected by the magnetic hysteresis of ~ 3.7, 9, 5.7, 0.4 and 0.3 J kg-1
for x = 0.0, x = 0.03,
0.06, 0.2 and 0.3 respectively.
In an effort to improve the magnetocaloric effects (MCEs) of the NaZn13-type
La0.8Ce0.2Fe11.4Si1.6 compound, the effect of boron doping on the magnetic properties and
magnetocaloric properties has been investigated. The magnetic entropy change (ΔSM) for the
La0.8Ce0.2Fe11.4Si1.6 compound, obtained for a field change of 0 – 5 T using the Maxwell
relation exhibits a spike and appears to be overestimated and is thus corrected by using the
Clausius-Clapeyron equation (CC). The ΔSM determined from the CC equation is estimated
to be 19.6 J kg-1
K-1
. However, large hysteretic losses which are detrimental to the magnetic
refrigeration efficiency, occur in the same temperature range. In this work, we report a
significant reduction in hysteretic losses by doping the La0.8Ce0.2Fe11.4Si1.6 compound with a
small amount of boron to get La0.8Ce0.2Fe11.4Si1.6Bx compounds. The hysteresis loss decreases
from 131.5 to 8.1 J kg -1
when x increases from 0 to 0.3, while ΔSM, obtained for a field
change of 0 – 5 T, varies from 19.6 to 15.9 J kg-1
K-1
. This also simultaneously shifts the TC
from 174 K to 184 K and significantly improves the effective refrigerant capacity (RCeff) of
the material from 164 to 305 J kg-1
.

3
Structural, magnetic and magnetocaloric properties of the Mn0.94Ti0.06CoGe alloy have been
investigated using x-ray diffraction, DC magnetization and neutron diffraction measurements.
Two phase transitions have been detected at Tstr = 235 K and TC = 270 K, respectively. A
giant magnetocaloric effect has been obtained around Tstr associated with a structural phase
transition from the low temperature orthorhombic TiNiSi-type structure to the high
temperature hexagonal Ni2In-type structure, which is confirmed by neutron study. In the
vicinity of the structural transition, Tstr, the magnetic entropy change, -∆SM reached a
maximum value of 14.8 Jkg-1
K-1
under a magnetic field of 5T which is much higher than that
previously reported on the parent compound MnCoGe. To investigate the nature of the
magnetic phase transition around TC = 270 K from ferromagnetic to paramagnetic state, we
performed a detailed critical exponent study. The critical components, γ, β and δ determined
using the Kouvel-Fisher method, the modified Arrott plot as well as the critical isotherm
analysis agree well and are close to the theoretical prediction of the mean-field model.
Structural and magnetic properties of Mn0.94Ti0.06CoGe have been studied by a combination
of bulk magnetisation and neutron diffraction measurements over the temperature range 5 K -
350 K. The crystal structural transition occurs at Tstr (~ 235 K) with a change in symmetry
from the low temperature orthorhombic TiNiSi-type structure (space group Pnma) to the high
temperature hexagonal Ni2In-type structure (space group P63/mmc) and the magnetic phase
transition takes place around TC = 270 K. It is found that the structural transition around Tstr
is incomplete and there is a co-existence of the orthorhombic and hexagonal structures
between Tstr and TC (~ 270 K).
High pressure x-ray diffraction studies up to 10.4 GPa were performed on the
Mn0.94Ti0.06CoGe alloy using synchrotron radiation and a diamond anvil cell. No structural

4
phase transitions occurred in the entire range of our measurements. Unit cell parameters were
determined up to 10.4 GPa and the calculated unit cell volumes were found to be well
represented by a third order Birch-Murnaghan equation of state. The bulk modulus
determined from the pressure – volume data was found to be, B0 = 231.72 ± 7.79 GPa. This
study, employing high resolution synchrotron x-rays has helped clarify the behaviour of the
Mn0.94Ti0.06CoGe alloy under high pressure.

5
Chapter 1
INTRODUCTION
1.1 Overview and Motivation
Conventional gas compression refrigerators currently in use today, either use ozone depleting
or global warming volatile refrigerants. The use of chlorofluorocarbons (CFCs) and
hydrochlorofluorocarbons (HCFCs) as working fluids in conventional refrigeration
technology has raised serious environmental concerns. Currently, some measures, such as the
Montreal and Kyoto protocols, have been put in place to protect the environment [1, 2]. The
Montreal Protocol is an international treaty governing the protection of stratospheric ozone,
originally signed in 1987 and substantially amended in 1990 and 1992 [1]. This protocol
requires that countries phase out the production of numerous ozone-depleting substances
(ODS) (such as CFCs and halons). The Montreal Protocol has been a success, specifically in
stabilizing or decreasing levels of ozone depleting substances in the atmosphere. According
to the World Meteorological Organization (WMO), amounts of the total amount of human
produced ODS‟s in the atmosphere had decreased by approximately 8 - 9 % from the peak
observed from 1992 to 1994 [3]. The Kyoto Protocol, on the other hand is an international
agreement on the reduction of greenhouse gas emissions and on mechanisms aimed at cutting
the costs of reducing emissions, in order to address possible changes in the climate [2]. This
protocol requires the world's developed countries to cut greenhouse gas emissions by 5 %
from 1990 levels by 2008 - 2010. The Kyoto Protocol signatories succeeded in cutting
emissions, however, worldwide atmospheric CO2 levels continue to soar, now up 35 % since
1997, with most of that increase coming from the countries that were not included in the

6
protocol. Since approximately 15% of the total energy consumption worldwide is used for
refrigeration purposes, even marginal efforts in reducing power consumption in household
and industrial refrigeration will have a significantly large economic and ecological impact
due to the size of this area [4]. The fact that conventional gas compression refrigeration has
reached such a state of maturity that any improvements in this technology will only be
incremental, coupled with a serious concern for the environment reiterates the need to shift
our attention to alternative technologies such as magnetic refrigeration (MR). Scientists have
expended a lot of research effort in this new cooling technology recently because it has
several advantages over gas compression refrigeration. Magnetic refrigeration is a relatively
novel technique that employs magnetically ordered materials and is based on the
magnetocaloric effect (MCE) which results from the coupling of a system of magnetic
moments with an external magnetic field resulting in the cooling or heating of a system. This
magnetocaloric phenomenon was discovered in pure iron in 1881 by Emil Warburg [5].
Research in this field is therefore focused on the development of new materials with
properties appropriate for practical magnetic cooling applications. Numerous efforts in the
past years have been directed towards understanding the nature of the intrinsic relationships
between the composition, structure, and magneto-thermal properties in improving MCE
effects [6 - 13].
A noteable achievement in magnetic refrigeration was made in 1976 by Brown who proved
magnetic refrigeration could work at ambient temperatures by generating a temperature
difference of 47 K with a ferromagnetic refrigerant [14, 15]. In 1997, there was a major
breakthrough at Ames laboratory/Astronautics Corporation of America with Profs. Karl A.
Gschneider, Jr and V.K. Percharsky unveiling a proof of concept magnetic refrigerator
showing that magnetic refrigeration was competitive with conventional gas compression

7
cooling [16, 17]. Astronautics Corporation made a breakthrough in 2001 with the realisation
of the world‟s first successful room temperature magnetic refrigerator, in which permanent
magnets were used to generate the field [16]. To date about twenty (20) magnetic
refrigerators have been built and tested all over the world, a strong indication of the potential
of this technology [18]. These noteable achievements continue to move the magnetic
refrigerator a step closer to commercial applications.
The cooling efficiency of the best proof - of- principle magnetic refrigerator reaches 60 % of
the Carnot efficiency, which is the maximum theoretical limit, whereas the most efficient
conventional gas compression refrigerator operates well below the Carnot efficiency at
around 40 %, making MR a cost effective technology [18]. The use of MR eliminates the use
of ozone depleting chemicals as well as consumption of fossil fuels, thereby reducing CO2
emissions. Low cost, non-toxicity, compact size as well as lack of noise pollution count as
some of the considerable advantages of the MR technology.
The essential part of any magnetic refrigeration device is the magnetocaloric material that
undergoes a temperature change when subjected to a magnetic field and the characteristics of
a magnetic refrigerator are determined to a large extent by the magnetic working material,
which is figuratively speaking, the “heart” of the device. However, most magnetocaloric
materials that are promising for intermediate to room temperature applications require
magnetic fields as high as 5-10 T for efficient operation. Thus, the main aim of this work is
to seek new materials that are cost-effective and exhibit large magnetic entropy change
induced by a moderate magnetic field that can be supplied using permanent magnets. Such
materials will be vital for creating highly efficient magnetic refrigerators with
commercialization potential. This thesis will therefore focus on fundamental studies related to
the critical issues facing the application of MR.

8
1.2 Objectives of research
Generally, the objective of the present thesis is to explore novel magnetic materials with
considerable MCE for use in magnetic refrigerators. It is the aim of this work to contribute
towards a better understanding of the fundamental material characteristics, with an emphasis
on understanding the relationship between a defined structure, the crystallographic phase and
magnetic phase structure, and alteration in the magneto-thermal properties.
The specific objectives are:
1. Study the effect of stoichiometric modifications or atomic substitutions to tune
transition temperature, TC, for phase transitions to occur at higher temperatures to
enable materials to be used in room temperature devices.
2. Explore effects of the variation in composition and fabrication conditions on the
types of magnetic phase transitions and the related magneto-structural coupling.
3. Study magnetocaloric properties of these systems, by quantifying the MCE using
magnetic measurements to determine the magnetic entropy change (∆SM) and
magnetic thermal measurements to determine the adiabatic temperature change
(∆Tad).
4. Ultimate aim of the study is to synthesize high quality magnetocaloric materials
suitable for use in magnetic refrigeration. Thus, the characterization of these
magnetocaloric materials forms a critical part of the study.

9
1.3 Organization of Thesis
The present thesis aims to provide a comprehensive guidance on the optimization of the MCE
in novel magnetic materials for use in magnetic refrigeration. This thesis is organised as
follows:
The overview and motivation of the PhD research work as well as the specific objectives of
the work are outlined in Chapter 1. For a better understanding of the variation of the
magnetocaloric effect in different material systems, a thorough literature review with the
emphasis on the MCE of materials with phase transitions occurring in the room temperature
range is presented in Chapter 2.
The synthesis procedures of the various material systems investigated in this study and the
main characterization techniques used are outlined in Chapter 3. Chapter 4 details the
magnetic and magnetocaloric properties of β–Co(OH)2 2D nanostructures which, according
to the best of our knowledge, has not been reported before.
Chapter 5 details the results of the first study on the effect of boron doping on the
magnetocaloric properties of La0.8Gd0.2Fe11.4Si1.6. This study brings new light on the role of
boron (B) in tuning the magnetocaloric properties of the La0.8Gd0.2Fe11.4Si1.6 compound. A
significant enhancement of the Curie temperature, TC, and the refrigerant capacity was
achieved in La0.8Gd0.2Fe11.4Si1.6 due to boron doping. This study demonstrated how boron
doping at high levels tunes the magnetic transition from 1st to 2
nd order.
In Chapter 6, the experimental results of a study on the magnetic and magnetocaloric
properties of boron doped La0.8Ce0.2Fe11.4Si1.6 with the main aim of investigating the effect of
boron doping on the hysteresis and consequently, the refrigerant capacity of this material

10
system are presented. Neutron measurement results of the La0.8Ce0.2Fe11.4Si1.6Bx material
system are also presented in this chapter.
In Chapter 7, results on the magnetic properties and critical behaviour analysis of the
Mn0.94Ti0.06CoGe alloy are presented. Results of a temperature dependent neutron diffraction
study of the Mn0.94Ti0.06CoGe alloy are also presented in this chapter so as to elucidate the
existence of a coupling of the magneto-structural transition.
In Chapter 8, results on the high pressure x-ray diffraction studies up to 10.4 GPa performed
on the Mn0.94Ti0.06CoGe alloy using synchrotron radiation are presented. The final chapter,
Chapter 9, describes the conclusions drawn from this study as well as recommendations
regarding future work.

11
References:
[1] http://ozone.unep.org/new_site/en/montreal_protocol.php
[2] http://unfccc.int/kyoto_protocol/items/3145.php
[3] WMO. (2007). Scientific assessment of ozone depletion: (2006) Geneva, Switzerland:
World Meteorological Organization.
[4] K. A. Gschneidner and V. K. Pecharsky, Int. J. Refrig. 31, 945 (2008).
[5] E. Warburg, Ann. Phys. 13, 141(1881).
[6] O. Tegus, E. Bruck, K. H. J. Buschow and F. R. de Boer, Nature 415, 150 (2002).
[7] V. Provenzano, A. J. Shapiro and R. D. Shull, Nature 429, 853 (2004).
[8] T. Krenke, E. Duman, M. Acet, E. F. Wassermann, X. Moya, L. Manosa and A. Planes,
Nature Materials 4, 450 (2005).
[9] A. De Campos, D. L. Rocco, A. M. G. Carvalho, L. Caron, A. A. Coelho, S. Gama, L. M.
Silva, F. C. G. Gandra, A. O. Santos, L. P. Cardoso, P. J. von Ranke and N. A. Oliviera,
Nature Materials 5, 802 (2006).
[10] A. S. Mischenko, Q. Zhang, J. F. Scott, R. W. Whatmore, and N. D. Mathur, Science
311, 1270 (2006).
[11] V. K. Pecharsky, A.P. Holm, K. A. Gschneidner, Jr., R. Rink, Phys. Rev. Lett. 91,
197204 (2003).
[12] C. Magen, Z. Arnold, L. Morellon, Y. Skorokhod, P. A. Algarabel, M. R. Ibarra, and J.
Kamarad Phys. Rev. Lett. 91, 207202 (2003).

12
[13] D. H. Ryan, M. Elouneg-Jamróz, J. van Lierop, Z. Altounian, and H. B. Wang, Phys.
Rev. Lett. 90, 117202 (2003).
[14] C. B. Zimm, A. Sternberg , A. G. Jastrab, A. M. Boeder, L. M. Lawton, J. J. Chell, US
Patent 6.526.759.4, 2003 (filed in August 2001).
[15] G.V. Brown, Magnetic heat pumping, US Patent 4.069.028, 1978 (filed in November
1976).
[16] K. A. Gschneidner, Jr., V.K. Percharsky, Inter. J. Refrig. 31, 945 (2008).
[17] V. K. Pecharsky and J. K. A. Gschneidner, Phys. Rev. Lett. 78, 4494 (1997).
[18] K. A. Gschneidner, Jr., V. K. Pecharsky, and A. Tsokol, Rep. Prog. Phys. 68, 1479
(2005).

13
CHAPTER 2
LITERATURE REVIEW
2.1 Historical Background of Magnetic Refrigeration
Magnetic refrigeration is a relatively novel technique which employs magnetically ordered
materials and is based on the magnetocaloric effect (MCE). The magnetocaloric phenomenon
was discovered in pure iron in 1881 by Emil Warburg [1]. He discovered that when iron was
placed in a magnetic field it was immediately warmed, and on removal of the magnetic field
the iron sample cooled down, with the cooling effect varying between 0.5 to 2 K / T.
Langevin, in 1905, demonstrated that the changing of a paramagnet magnetization causes a
reversible temperature change [2].
In the late 1920‟s cooling via adiabatic demagnetization was independently proposed by two
scientists: Debye [3] and Giauque [4]. This cooling technology was first demonstrated
experimentally by William F. Giauque and Dr. D.P. MacDougall in 1933 for cryogenic
purposes when they attained a temperature of 0.25 K from an initial temperature of 1.5 K
with a magnetic field change of 8 kOe using gadolinium sulfate Gd2(SO4)2 ∙8H2O [5]. The
cooling process was performed in two stages namely, isothermal magnetization and adiabatic
demagnetization.
In 1933 de Haas et al. achieved 0.08 K starting from a temperature of 1.35 K with a magnetic
field change of 27.6 kOe using cerium ethylsulfate Ce(C2H5SO4)3∙9H2O [6]. In the 1950‟s

14
several magnetic refrigerators operating at temperatures between 1 and 30 K were made.
However, these could only run for a couple of days and thus were too inefficient to be used
commercially. The interest in the investigation of MCE has steadily increased over the years
with research focusing on the use of the MCE process to perform refrigeration near room
temperature.
A noteable achievement was made in 1976 by Zimm and later in 1978 by Brown who proved
magnetic refrigeration could work at ambient temperatures by generating a temperature
difference of 47 K with a ferromagnetic refrigerant [7 - 8]. In 1997, Prof. Karl A. Gschneider,
Jr at Ames laboratory/Astronautics Corporation of America unveiled a proof of concept
magnetic refrigerator showing that magnetic refrigeration was competitive with conventional
gas compression cooling [9]. Astronautics Corporation made a breakthrough in 2001, with
the realisation of the world‟s first successful room temperature magnetic refrigerator, in
which permanent magnets were used to generate the field [10]. This achievement moved the
magnetic refrigerator a step closer to commercial applications.
2.2 Basic Theory of the Magnetocaloric Effect
MCE is the response of a magnetic solid to a changing magnetic field which is manifests
itself as a change in its temperature [11]. The essential part of any magnetic refrigeration
device is the magnetocaloric material that undergoes a temperature change when subjected to
a magnetic field. It is worth noting that all magnetic materials exhibit the magnetocaloric
effect. This effect indicates that paramagnetic or soft ferromagnetic materials absorbs heat
and their magnetic entropy decreases when the magnetic field is applied isothermally or
otherwise expel heat and their magnetic entropy increases when the magnetic field is reduced

15
isothermally. In order to understand the physics behind the magnetocaloric effect, it is
important to gain an insight into the behaviour of magnetic materials under the influence of a
magnetic field.
Magnetic materials can order their magnetic moments in a variety of ways as shown in Figure
2.1, with the simplest being the so-called ferromagnetic order, in which the interactions
between the moments act to align them [12]. These interactions have a much larger effect on
the alignment than the magnetic fields we apply. When a magnetic field is applied to a
magnetic material, the unpaired spins partially comprising the material‟s magnetic moment
are aligned parallel to the magnetic field as shown in Figure 2.2. This spin ordering lowers
the entropy of the system since disorder has decreased. To compensate for the aligned spins,
the atoms of the material begin to vibrate in attempt to randomize the spins and lower the
entropy of the system again. In doing so, the temperature of the material increases. An
opposite effect occurs on removal of the applied magnetic field. At very low temperatures
Figure 2.1 Examples of magnetic order. Arrows represent the magnetic moments of atoms in
a cubic lattice. (a) ferromagnetic order where all the spins align in the same direction. (b)
antiferromagnetic order where the spins align opposite each other [12].

16
Figure 2.2 Illustration of the effect of applying an external magnetic field, H to a
ferromagnetic material [12].
or very high fields all the moments may be aligned and an increase in field will not yield a
further increase in the magnetization. The magnetization is a measurement of how much the
magnetic moments are aligned. All magnetic materials have a phase transition temperature
below which its moments are ordered and above which the moments are disordered. In the
disordered state the magnetic materials are said to be paramagnetic. Near the transition
temperature the magnetization M, changes rapidly, whereas the changes at other temperatures
are small.
The MCE is quantified through a definition of the entropy at constant pressure in a system as
a function of temperature and magnetic field, S (T, H). The entropy of a magnetic material
consists of the magnetic entropy SM, the lattice entropy SL and the electronic entropy SE as
show below:
)()(),(),( TSLSHTSHTS ELM (2.1)
where SM is a function of both H and T, whereas SL and SE are both functions of T only.
Thus, only the magnetic entropy SM can be controlled by changing the strength of the
magnetic field. Figure 2.3 is an S-T diagram for a ferromagnetic solid, showing the total

17
entropy in magnetic field H0 and H1 (H1 > H0). The diagram also illustrates the MCE which is
represented by ∆Tad or ∆SM in the vicinity of the magnetic ordering temperature (Curie
temperature, TC). The vertical arrow shows the isothermal magnetic entropy change, ∆SM
whilst the horizontal arrow shows the adiabatic temperature change, ∆Tad [13]. These arrows
represent two different transformations, described in the preceding paragraph, elucidating
further the thermodynamics of the magnetocaloric effect [13].
Figure 2.3 S - T diagram demonstrating the magnetocaloric effect [13].
In order to explain the thermodynamics of the magnetocaloric effect, two different
transformations, mentioned in the previous paragraph, are explained below:

18
i. The variation of the applied external magnetic field under isothermal conditions:
When the magnetic field is changed from H0 to H1 at a constant temperature T, the
magnetocaloric effect is then described as:
pTHHpTHMHMpHTM TSTSTSTSTS
,01,01,, )()()()()( (2.2)
The relationships between 0)( HTS and 1)( HTS at constant pressure determines the
magnitude, sign and behaviour of MS .
ii. The variation of the applied external magnetic field under adiabatic conditions:
When the magnetic field is changed from H0 to H1 under adiabatic conditions, the magnetic
entropy changes, but the total entropy remains constant i.e.: 0 MLE SSSS .
Since the magnetic entropy changes, the combined lattice and electronic entropy must change
by MEL SSS . Thus the lattice and electronic entropy vary resulting in a measurable
adiabatic temperature change adT . This isentropic difference between the corresponding
HTS )( curves known as the adiabatic temperature change can be used as a measurement of
the magnetocaloric effect of the material. The Had TT )( is a function of temperature and for
a fixed H and an arbitrary T it is defined as:
pSHHpHTad STSTTT
,01,, )()()( (2.3)
According to equation (2.2) and (2.3) when the behaviour of the total entropy of a magnetic
material is known as a function of both temperature and magnetic field, the magnetocaloric
effect can thus be fully characterized.

19
2.2.1 Basic Thermodynamics of the magnetocaloric effect
The MCE is essentially the application of the first and second law of thermodynamics to a
magnetic system. A description of the MCE in a magnetic system involves the use of
thermodynamic functions such as:
i. The internal energy U
ii. The free energy F and
iii. The Gibbs free energy G
The internal energyU , is a function of the total entropy S , the volume V and the
magnetization M as shown below
),, MVSUU (2.4)
The free energy of Helmholtz is used for systems with constant volume and is a function of
V , H and absolute temperature T . It can be written as:
HVTFF ,, (2.5)
It can also be expressed as:
TSUF (2.6)
The Gibbs free energy is a function of HT , and p and it is used for systems with constant
pressure. It can be expressed as:
MHpVTSUG 0 (2.7)

20
Figure 2.4 Illustration of the first order phase transition with the corresponding equations
describing the transition1.
Equation (2.7) is a very important expression as is it possible to define the first order and
second order transitions on the basis of this equation. A phase transition is defined to be first
order if the first derivative of the Gibbs free energy is discontinuous at the phase transition.
Generally in a first order transition the volume, magnetization and entropy of the magnetic
material might be discontinuous as shown in Figure 2.4.
Figure 2.5 Illustration of the second order phase transition1.
1 Adapted from http://www.helsinki.fi/~serimaa/soft-luento/soft-2-phase.html
Entropy
Magnetization
Volume

21
For a second order phase transition, the first derivative of the Gibbs free energy as well as the
entropy is continuous at the phase transition as shown in Figure 2.5.
The differentials of SU , and G are given below as:
HdMpdVTdSdU 0 (2.8)
HdMpdVSdTdF 0 (2.9)
MdHSdTVdpdG 0 (2.10)
Considering the free energy F, the following equations determine the internal parameters
pS, and H .
VHT
FVHTS
,
,,
(2.11)
TVM
FVMTH
,
,,
(2.12)
THV
FVHTp
,
,,
(2.13)
Considering the Gibbs free energy, the following equations determine, the internal
parameters VMS ,, :
pHT
GpHTS
,
,,
(2.14)
pTH
GpHTM
,
,,
(2.15)

22
pT
p
GpHTV
,
,,
(2.16)
Replacing the magnetic field H with the magnetic moment M as the external variable we
get:
pTM
GH
,
(2.17)
Deriving the Maxwell equations using equations (2.14) and (2.15), (2.14) and (2.16) and
(2.14) and (2.17) we get:
pHpT T
M
H
S
,,
(2.18)
pHHTT
V
p
S
,,
(2.19)
pMpT T
H
M
S
,,
(2.20)
From the second law of thermodynamics, the enthalpy variation of a reversible process can
be expressed as
T
QS (2.21)
Accordingly, the heat capacity xC of a system at constant parameters x is defined by:
x
xT
QC
(2.22)

23
Where Q is the amount of heat exchanged by the solid at temperature T giving rise to a
temperature change T . Since TdSQ , the heat capacity of the system can be expressed as:
x
xT
STC
(2.23)
From equation (2.25), the total entropy can be expressed as:
dTT
TCTdS x
x
)( (2.24)
The total differential of the total entropy of a magnetic system as a function of pT , and H
can be written as:
dpp
SdH
H
SdT
T
SdS
HTpTpH ,,,
(2.25)
Considering an adiabatic 0dS and isobaric 0dp process and using the Maxwell
relations (2.18) and (2.23), the temperature change due to a change in the magnetic field is
expressed as:
dHT
M
C
TdT
pHpH ,,
(2.26)
Using equations (2.20) and (2.24) the temperature change caused by an adiabatic and isobaric
change of magnetization is given by:
dMT
H
C
TT
pMpM ,,
(2.27)
pHC , and pMC , are the heat capacity of the material at constant pressure and constant field or
magnetization respectively.

24
If the total entropy of the system is expressed a function of pT , and M respectively, its total
differential can be written as:
dpp
SdM
M
SdT
T
SdS
MTpTpM ,,,
(2.28)
To obtain the finite temperature change adT for an adiabatic magnetization, equations (2.26)
and (2.27) are integrated as shown below:
dH
T
HTM
HTC
THTT
HH
H
H
ad
,
,,
2
1
(2.29)
dM
T
MTH
MTC
TMTT
HM
M
M
ad
,
,,
2
1
(2.30)
The integration of the Maxwell relation, equation (2.18) to give the finite entropy change
under isothermal and isobaric conditions is expressed below:
dHT
HTMHTS
H
H
H
M
2
1
,, (2.31)
From these equations it follows that the MCE (absolute values of HM TS or Had TT ) is
large when T
M
which is sometimes written as
T
is large, that is the magnetization
changes rapidly with temperature.

25
2.3 Research Progress of magnetic materials for room temperature magnetic
refrigeration
Recently, several materials with a so called giant MCE have been discovered. This includes
amongst others, Gd5Si2Ge2, MnAs1-xSbx, (Mn,Fe)2(P,As) and La(Fe,Si)13 [14 - 72]. These
materials are the main contenders for near-room temperature magnetic refrigeration based on
the MCE which is set to replace the conventional gas-compression/expansion technique.
Conventional refrigeration technologies based on the gas-compression/expansion cooling
mechanisms may gradually be replaced by the environmentally friendly and more efficient
magnetic refrigeration in the nearly future [73 – 77]. The magnetic refrigeration is based on
the magnetocaloric effect (MCE) which results from the coupling of a system of magnetic
moments with an external magnetic field resulting in the cooling or heating of a system. An
ideal material for magnetic refrigeration should be composed of relatively inexpensive raw
materials, have a high MCE demonstrated by a high change in magnetic entropy (∆SM) and a
high adiabatic temperature change (∆Tad) and have little or no thermal or magnetic hysteresis
[78]. First order transitions possess the above mentioned characteristics and have been shown
to have a consistently higher MCE than second-order transitions.
Due to rising concerns about global warming, there has been renewed interest in the magnetic
refrigeration cooling technology. Figure 2.6, shows that the number of published papers per
annum on the magnetocaloric effect has grown at an exponential rate in the past years.
Scientists are expending a lot of research effort in this field mainly because of the issue of
global warming. Global warming is exacerbated by the fact that the world‟s energy demands
keep on increasing, meaning that it will become even worse in future.

26
Figure 2.6 Rate of increase of published research papers per annum on the magnetocaloric
effect. The triangle represents the number of papers abstracted during the first three-fourths
of the year 2007 [9].
2.3.1 La(Fe,Si)13 based compounds
La(Fe13-xMx) compounds have been studied since the late 1960s [79 - 80]. The magnetic
properties of these compounds were initially measured in the mid 1980‟s by Palstra et al.
[81 - 82]. Compounds with cubic NaZn13 - type structure have attracted a lot of attention in
recent years because of their interesting magnetocaloric properties and low cost. Below their
Curie temperature, these compounds are ferromagnetic with high saturation magnetization
due to the high concentration of 3d metal and cubic symmetry structure. LaFe13-xSix

27
compounds in the ground state are ferromagnetic and have high magnetization. With
increasing Si content, the moments of Fe atoms decrease and the Curie temperature increases,
which is usually found in Invar-type alloys [81]. These compounds are enjoying renewed
interest in the magnetic materials community due to the observation of a large MCE, which
shows a large magnetic entropy change, MS =19.4 Jkg-1
at TC = 208 K [83].
In the La(Fe1-xSix)13 system, at lower Si concentration or under higher annealing temperature,
the cubic NaZn13 - type structure occurs [84]. Preparation of homogeneous La(Fe1-xSix)13
compounds is difficult and requires a lengthy homogenization heat treatment because of the
formation of a large amount of primary Fe-Si phase dendrite crystals in the cast alloys. A
simple consideration of the diffusion law suggests that refinement of the cast structure by
means of rapid solidification should significantly contribute to reducing the time required for
homogenization [83]. Bodak and Gladyshevskij investigated the phase equilibrium relations
of the La-Fe-Si ternary system, and found that the NaZn13 - derived structure within the
homogeneous composition range of LaFe11.3 – 9.8Si1.7 – 3.2 but they did not present more
detailed structural information [85]. Phase equilibria in the Fe-La-Si system are not well
known. The Fe-La and Fe-Si phase diagrams have been studied and reviewed [86,87].
However, the La-Si phase diagram is not known but six La-Si intermediate phases are known
in literature. According to the La-Fe quasi binary diagram, the temperature point of the
peritectic reaction in LaFe13-xSix compounds is around 1673 K [88].
Wen et al. prepared LaFe13-xSix compounds with x = 2.4, 2.6 and 2.8 by arc melting and
subsequently carried out magnetization measurements on these samples [89]. XRD patterns
of these samples confirmed that they crystallized in a single NaZn13 type phase. The Curie

28
temperature decreases nearly 50 K with x increasing from 2.4 to 2.8. The samples exhibit a
typical second order phase transition. The maximum values of the magnetic entropy change
of LaFe13-xSix samples are found to be 5.85, 5.9 and 3.7 J/kg. K for x = 2.4, 2.6 and 2.8 under
a field change of 0 - 5 T.
Ilyn et al. investigated the MCE in the itinerant electron metamagnetic (IEM) compounds
LaFe11.7Si1.3 and LaFe11.2 Co0.7Si1.1 by measuring directly or calculating from magnetization
data using Maxwell relation [90]. The largest values of the MCE were observed at 188 K for
LaFe11.7Si1.3 and at 274 K for LaFe11.2 Co0.7Si1.1. The isothermal magnetic entropy change
(- MS ) reached in LaFe11.7Si1.3 and LaFe11.2 Co0.7Si1.1 is 29 J/kg K and 20.3 J/kg K
respectively, at a magnetic field change of 5 T. The adiabatic temperature was measured
directly and the maximum values of T for LaFe11.7Si1.3 and LaFe11.2 Co0.7Si1.1 were 4 and
2.4 K respectively. The normalized adiabatic temperature changes of 2.9 and 2.2 K/T are
comparable with that of 2.85 K/T in Gd.
Nane et al. investigated the low field magnetic and magnetocaloric properties of LaMn1.9
Fe0.1Si2 [91]. The magnetic entropy change MS as a function of temperature and magnetic
field was derived from the Maxwell relation using M-H data measured at various
temperatures. The peak values of MS for the fields of 0.2 and 0.9 T are about 0.2 J/kgK and
o.53 J/kgK respectively. The small values in this material system is probably due to the small
value of saturization magnetization and the nature of the phase transition which is found to be
second order. The results also show that LaMn1.9 Fe0.1Si2 is ferromagnetically ordered around
285 K.

29
Liu et al. investigated the effect of annealing on the arc-melted LaFe11.6Si1.4 compound. This
compound was annealed at high temperatures of 1423 K, 1473 K and 1573 K for an hour,
respectively [92]. Metallographic microscopy and powder X-ray diffraction analyses show
that the as-cast LaFe11.6Si1.4 compound mainly consists of -Fe and LaFeSi phases.
However, after annealing, the main phase of the annealed LaFe11.6Si1.4 compound becomes
the cubic NaZn13-type phase, which increases with an increase in annealing temperature. The
maximal magnetic entropy change the sample annealed at 1573 K is 17.56J/kg K at a
magnetic field change of 0 - 5 T.
Tsuji et al. investigated the phase formation of La(Fe,Si)13 compounds with NaZn13 – type
structure using an electron probe micro analyser (EPMA) and x-ray diffraction [93].
Synthesis of the La(Fe,Si)13 compounds was via a solid-state reaction of fine elemental
powders using a spark plasma sintering (SPS) technique. This technique consists of only one
process which does not require melting, annealing, grinding or molding. The structure of
these samples were then compared to those synthesized by conventional methods including a
melt and solidification process. The conventional methods, namely, arc-melting and melt
spinning, easily caused segregation of the Fe-rich phase. However, the remarkable NaZn13 –
type structure was observed in the SPS sample. Conclusions from these experiments include
the fact that homogeneous distribution of the elements and short-range atomic diffusion are
important for forming NaZn13 - type structure efficiently.
So many studies have been devoted to the increase of the Curie temperature by substituting
Fe and La by other transition metals and rare-earths respectively or by introducing interstitial
atoms such as C, N, B or H materials [94]. This process of introducing small atoms into the

30
structure, usually from the gas phase at elevated temperatures and pressures, can lead to very
dramatic changes in the magnetic properties of these interstitially modified materials. In
particular, hydriding and nitriding lead to an expanded crystal lattice and a modified
electronic structure, commonly in the form of an increase in the density of states at the Fermi
level. Such a situation results in an elevated Curie temperature and a dramatically enhanced
MCE.
The most remarkable feature of LaFe13-xSix besides the significant MCE is the strong
dependence of its Curie temperature (TC) on element doping or external perturbations such as
magnetic field and pressure. It has been confirmed that the TC of LaFe13-xSix can be increased
by introducing N, H, C or B atoms. The intrusion of the interstitial N, H, C or B atoms into
the lattice leads to lattice expansion, which makes the Fe 3d band narrow and bring about the
increase in TC by reducing the Fe 3d overlap wave functions [95]. Small atoms like N change
the electronic structure of the compounds, which can influence the intrinsic magnetic
properties of Fe-based compounds, improving the Curie temperature due to the fact that N
weakens the negative Fe-Fe exchange by increasing the Fe-Fe distance [96]. Carbon is
usually chosen as the interstitial atom because its content can be easily controlled by direct
arc melting using Fe - C alloy compared with that for H and N by gas-solid reaction.
However, hydrides are usually chemically unstable above 150 ˚C, which is an underlying
problem for practical applications [97]. It has also been noted that the N or C addition in
LaFe13-xSix compounds as interstitial atoms has a negative impact on the MCE due to the
reduced magnetic moments and loss of the first order nature of the structural/magnetic
transition of the compound [98].

31
Xie et al. studied the influence of boron addition on the phase formation, Curie Temperature
and magnetic entropy change of NaZn13 – type La(Fe0.9Si0.1)13Bx compounds with x = 0, 0.03,
0.06, 0.1, 0.2, 0.3, 0.5 and 0.6 [99]. Results show that a small amount of B addition in
La(Fe0.9Si0.1)13 forms the solid solution NaZn13 – type structure phase by substituting B for Si
or doping B into interstitial position of the lattice, preserves its giant magnetocaloric effects
due to their first order structural/magnetic transition, as well as increasing its Curie
temperature slightly. In ∆SM the magnetic field change of 0 – 1.6 T are around 29 Jkg-1
K-1
for
samples with B < 0.3, whilst improving the TC by 2 K.
Fujita et al. revealed that the insertion of hydrogen into the LaFe13-xSix lattice considerably
increases TC towards room temperature without significantly affecting the MCE [100]. Chen
et al. also noted the same behaviour [101]. Balli et al. studied the effect of nitrogen insertion
on the crystal structure, magnetic and magnetocaloric properties of LaFe11.7Si1.3 [94]. The
Curie temperature increased with an increase in nitrogen concentration on account of volume
expansion. Compared to hydrides the entropy change of LaFe11.7Si1.3 decreased drastically
after nitrogenation. The relative cooling power of the nitride, however, remained comparable
to that of reference materials. Nitrogenation had a strong effect on the cubic phase, including
a large lattice expansion (6.2 to 10.8 %) and an increase of Curie temperature (52 K to 80 K)
and spontaneous magnetization (approximately 10 %).
Lyubina et al. investigated the structure and magnetic properties of LaFe13-xSix and Co-
substituted LaFe11.8-xCoxSi1.2 alloys prepared by melt spinning as well as LaFe11.57Si1.43Hx
hydrides prepared by reactive milling it was noted that the hysteresis in the temperature and

32
field induced phase transitions is significantly reduced as compared with conventional bulk
alloys [102].
Fujieda et al. investigated the partial substitution of Ce for La in LaFe13-xSix compounds.
They noted that this partial substitution enhanced the MCE (- MS ) but decreases the Curie
temperature TC [103]. Due to the weak ferromagnetic band character of iron, the LaFe13-xSix
compounds exhibit rather low Curie temperatures because of the short Fe-Fe distances
existing in LaFe13-xSix. The same also applies for many Fe-rich R-Fe series (R-rare-earth).
Applying an external pressure, however, causes a lattice contraction. It has been reported
that a pressure of 1GPa reduces TC by approximately 100 K, whereas a magnetic field of 5T
lifts TC by approximately 25 KpA [95].
Fujita et al. demonstrated that LaFe13-xSix compounds exhibit a first order magnetic phase
transition at the Curie temperature, TC, as well as an IEM transition above TC. The magnetic
moment induced by the IEM transition exceeds 1 B just above TC, accompanied by a large
volume change [104, 105]. Fujita et al. investigated the magnetovolume effect due to the
IEM transition in La(Fe0.88Si 0.12)13 by x-ray diffraction measurements in high magnetic fields
[106]. After the IEM transition no crystal structure change was observed. A significant
increase in the lattice constant of about 0.4 % is caused by the IEM transition. The magnetic
field dependence of the relative change in the lattice constant measured perpendicular to the
magnetic field direction is similar to that of the longitudinal linear magnetorestriction. Thus,
it is concluded that the volume change due to the IEM transition is isotropic in the studied
La(Fe0.88Si0.12)13 compound.

33
Sun et al. studied the effect of pressure on the magnetocaloric effect in a polycrystalline in
LaFe11.6Si1.4 sample [107]. At ambient pressure the Curie temperature, TC, of the sample was
measured to be 191 K, however, after the application of 8.3 kbar pressure, the Curie
temperature rapidly decreased to 80 K. At temperatures above TC, the metamagnetic
transition induced by the field becomes extremely sharp under high pressure and the critical
field HC of the transition increases fast with increasing temperature. Under 8.3 k bar pressure,
the maximum value of entropy change is 60 J/kgK for a 5T field variation. For a field
variation of 1 T, however, the maximum value of the entropy change is 34 J / kgK thus
confirming that the MCE in LaFe11.6Si1.4 is greatly enhanced by pressure, especially at low
fields. It has been proposed that the enhancement of MCE by pressure is due to the
contribution from the lattice entropy where there is a strong magnetostructural coupling
associated with the first order magnetic phase transition. It has since been proven that there
exists a strong magnetovolume effect which accompanies the first order metamagnetic
transition in LaFe13-xSix thus the above mentioned proposal seems also true for LaFe11.6Si1.4.
Jia et al. experimentally studied a field induced magnetic entropy change under high pressure
for the LaFe1.5Si1.5 compound [108]. The high pressure caused a linear decrease of the Curie
temperature from 194 to 88 K, corresponding to a variation of pressure from ambient to 1
GPa. Appropriate pressures enhance the magnetic entropy change significantly whilst
decreasing the Curie temperature.

34
2.3.2 MnCoGe based compounds
Materials which experience simultaneous crystallographic and magnetic phase transitions
have garnered a lot of interest owing to their promising applications as multifunctional
materials [109 – 111]. The intermetallic compounds MnCo1-xGe, with (0 ≤ x ≤ 0.1) have an
orthorhombic TiNiSi –type structure at room temperature whilst the compositions with
x > 0.1 have a Ni2In-type structure [112].
MnCoGe behaves like a typical ferromagnet with a second-order magnetic phase transition. It
has previously been shown that, the magnetic saturation moment MS and the magnetic
ordering temperature TC are different for these two phases. In the orthorhombic structure, the
values of MS and TC are 4.13 μB and 345 K, respectively [113]. The hexagonal form, on the
other hand exhibits a lower MS and also a lower TC, namely 2.76 μB and 275 K, respectively
[114]. It has been established that for the MnCoGe compound, the structural transition
Figure 2.7 Volume and lattice parameters of the MnCoGe alloy as a function of temperature..

35
temperature, Tstr between the orthorhombic and hexagonal phase can be changed by either
changing the composition [115 – 117], or applying an external pressure [118 – 122].
Kanomata et al. [112] clearly point out that the structural transition in MnCoGe, as shown in
Figure 2.7, is accompanied by strong thermal hysteresis (ΔThys ~ 40 K) and a large volume
change (ΔV/V ~ 4%). In order to modify the interatomic distances resulting in the tuning of
the magnetostructural coupling in MnCoGe compound, several different ways such as
substitutions, dopings and the application of physical pressure have been used [123 – 125].
Compared to the La(Fe,Si)13 based group of compounds, the MnCoGe compounds have not
been studied as much, however several research groups worldwide have reported on the MCE
of MnCoGe and related alloys, some of these finding are discussed in detail below. Wang et
al. reported on the ab initio total energy calculations on the first-order structural transition of
the ferromagnetic MnCo1−xGe intermetallic compound. They show that increasing Co
vacancies induce a transition from an orthorhombic structure to a hexagonal structure they
also observed that a concomitant high to low moment magnetic transition and a large
magnetovolume effect occur due to the change of the symmetry and the resulting coupling
distance between the magnetic atoms [114].
Markin et al. studied the concentrational dependences of the lattice parameters, spontaneous
magnetic moment, and magnetic ordering temperature of nonstoichiometric Mn1.9-xCoxGe
(0.8 < x < 1.65) compounds with a hexagonal crystal structure [126]. On increasing the Co
content, x from 1.1 to 1.2, the Curie temperature and magnetic moment were found to
increase abruptly.

36
Lin et al. [113], reported on the iron doping where a structural transformation from the
orthorhombic to the hexagonal phase was observed in the MnCo1-xFexGe alloys. For undoped
MnCoGe, the maximum magnetic entropy change is about -5.6 Jkg-1
K-1
for a magnetic field
change ΔB = 0-5 T. Meanwhile, an enhanced ΔSM value up to -9 Jkg-1
K-1
was reported for
the x = 0.2 sample. For Sn and Ge doped MnCoGe compounds for low magnetic field
change, moderate values of magnetic entropy change were obtained [127 – 128].
Trung et al. systematically studied the structural, magnetic and magnetocaloric properties of
MnFe(P,Ge) and related compounds on both bulk samples and melt-spun ribbons. By
changing either the compositions or the annealing conditions, the critical behavior of the
phase transition can be controlled. Also, the thermal hysteresis is tunable to very small values
while maintaining a large MCE in a large range of working temperatures [129].
Trung et al. studied the substitution of some Cr for Mn atoms in MnCoGe to control the
magnetic and structural transitions in this alloy to coincide, leading to a single first-order
magnetostructural transition from the ferromagnetic to the paramagnetic state with a giant
magnetocaloric effect observed near room temperature. Further increase in the Cr content in
the Mn1-xCrxCoGe alloys induces another first-order magnetoelastic transition from the
antiferromagnetic to the ferromagnetic state occurring at lower temperature [124].
Caron et al. investigated the effects of physical and chemical pressures in the Mn1−xCrxCoGe
series of compounds. Cr substitution and hydrostatic pressure play similar roles in displacing
TC to lower temperatures and coupling or decoupling magnetic and crystallographic
transitions. In this work the similarities and differences between the effects of chemical and

37
physical pressures were explored, helping unveil the nature of the first-order phase transition
presented by MnCoGe-based compounds [123].
2.3.3 Nanocomposite Systems
Nanomaterials are the latest class of materials to be characterized for the magnetocaloric
effect. Nanoparticles which are magnetic and have a size below the size domain limit are
known to exhibit superparamagnetism. Each nanoparticle by itself exhibits ferromagnetic
behaviour with a large moment, but there is no long range correlation with other neighboring
nanoparticles. So each nanoparticle behaves as a “superspin” with the whole system showing
a paramagnetic response. This magnetic character is known as superparamagnetism.
Superparamagnetic materials are synthesized by the rapid cooling of a corresponding melt.
One of the earliest investigations of the MCE of nanocomposite materials was done by Shao
et al., who prepared nanocomposite ribbons of Gd0.85Tb0.15, Gd0.85Y0.15 and Gd0.75Zr0.25 alloys
by a copper-sheathed rolling technique, which briefly consists of the following steps
[130 -131]. Heat capacity measurements made on the ribbons in the temperature range from
280 to 310K revealed its increase in all three samples with a maximum mean value of 57.9%
for Gd0.85Y0.15. On the other hand, the Curie temperature in the ribbons was reduced. Shao et
al. related these experimental results to the large amount of interface atoms arranged in
disorder, which changed the interatomic distances and lowered the number of nearest
neighbours [130]. Figure 2.8 shows temperature dependences of the magnetic entropy change
of the nanopowder ribbon Gd0.85Y0.15 sample and bulk alloy with the same composition. The
ribbon was considered to be in a superparamagnetic state (TC of the bulk alloy is 240 K). As
one can see, ∆SM in the ribbon is higher than in bulk material in the temperature interval
under consideration, which is typical for superparamagnets. However, no enhancement in the

38
Figure 2.8 Temperature dependences of the magnetic entropy change induced by the
application of a field on the Gd0.85Y0.15alloy in bulk and nanosized states [130].
MCE was observed in the investigated nanopowder Gd0.85Tb0.15and Gd0.75Zr0.25 ribbons in
comparison with the corresponding bulk materials.
Yamamoto et al. studied the influence of the magnetocaloric effect of superparamagnetic
nanocomposites by evaluating their ∆SM from magnetization data sets. They investigated the
influence of distribution of the magnetic moment size on ∆SM. They concluded that a narrow
size distribution was favourable for high performance of the MCE [132]. Kinoshita et al.
investigated the MCE of the superparamagnetic nanocomposites composed of magnetic
grains isolated by gold as a function of the size distribution width. The evaluated ∆SM was
found to increase with particle size. They concluded that a narrow size distribution would
considerably enhance the MCE of the superparamagnetic nanocomposites [133].

39
Gorsse et al. investigated the magnetic behaviour, magnetocaloric effect and refrigeration
capacity of the Gd60Al10Mn30 metallic glass containing nanocrystallites of Gd. It was found
that the temperature dependence of the magnetization exhibited multiple second-order
magnetic transitions due to the composite effect. The resulting magnetic entropy change and
adiabatic temperature change compared well with the MCE of known magnetic refrigerants.
A high refrigeration capacity of 660 J kg−1
, a large operating temperature range around 150 K
and a soft magnetic behavior make this nanocomposite an attractive candidate as magnetic
refrigerants in a temperature range where pure Dy is the best material currently available
[134].
Recently, Jones et al. investigated the temperature dependence of the magnetization of the
(Fe70Ni30)88Zr7B4Cu nanocomposite alloy and a good fit with a modified Handrich-Kobe
equation with an asymmetric exchange fluctuation parameter combined with the Arrott-
Noakes equation was obtained. They investigated the broadening of the second-order
transition arising from asymmetric exchange parameters and resulting from the fluctuations
of interatomic spacing found in an amorphous matrix and the asymmetric dependence of
exchange energy on interatomic spacing. The obtained magnetic entropy curve revealed extra
broadening with a refrigeration capacity (RC) value of 135 J/kg at 5 T. Broadening of the
magnetic entropy can lead to larger RC values and a wider working temperature range,
making nanocomposite alloys promising for magnetocaloric [135].

40
2.3.4 Comparisons of different materials and outlook
Figure 2.9 ∆SM values of different materials measured at 2 T [98].
A plot of ∆SM under a 2 T field for different materials is shown in Figure 2.9. This figure
clearly shows that the transition metal based alloys exhibit the best MCE properties at room
temperature. However, below room temperature several rare - earth compounds perform
better and their cost versus performance analysis is shown in Table 2.1 below. With all
different requirements for magnetic refrigerants taken into account, the ideal magnetocaloric
material should be composed of at least 80 % transition metals with a large magnetic moment
like Fe or Mn. The preparation route and time as well as material cost also play an important
factor for the practical application which is not suitable for those materials.

41
Table 2.1 Advantages and disadvantages of various magnetic refrigerants [98].
Factor Gd Gd5T4 RMnO3 LaFeSi MnAs FeMnPAs Ni2MnGa
Raw material
cost
0 - + + + + + + + + +
Preparation 0 - - - - - - - - - - -
Vapor Pressure 0 0 0 0 - - - - - 0
Fabrication
(sheet)
0 - - - - - -
MCE, ΔSM 0 + + - + + + +
MCE, ΔTad 0 + - - - - ?
Refrigeration
Capacity
0 + ? + ? + ?
Hysteresis 0 - - 0 - - - -
Time
dependence of
ΔTad
0 - ? - ? ? ?
Environmental
concern
0 0 0 0 - - 0
Corrosion 0 + + ? - ? ? ?
0 neither advantageous nor disadvantageous
+ advantageous
+ + more advantageous
- disadvantageous
- - more disadvantageous
- - - most disadvantageous
? unknown

42
References:
[1] E. Warburg, Ann. Phys. 13, 141 (1881).
[2] P. Langevin, Ann. Chem. Phys. 5, 70 (1905).
[3] P. Debye, Ann. Phys. 81, 1154 (1926).
[4] W. F. Giauque, J. Am. Chem. Soc. 49, 1864 (1927).
[5] W. F. Giauque, D. P. MacDougall, Phys. Rev. Lett. 43, 768 (1933).
[6] W. J. de Haas, E. C. Wiersma, H. A. Kramers, Physica 1, 1 (1933).
[7] C. B. Zimm, US Patent 6.526.759.4, 2003 (filed in August 2001).
[8] G. V. Brown, Magnetic heat pumping, US Patent 4.069.028, 1978 (filed in November
1976).
[9] K. A. Gschneidner Jr., V. K. Percharsky, Inter. J. Refrig. 31, 945 (2008).
[10] http://www.external.ameslab.gov/News/release/01magneticrefri.html
[11] K. A. Gschneidner Jr., V. K. Pecharsky, J. App. Phys. 85 (8), 5365 (1999).
[12]http://www.risoe.dtu.dk/Research/sustainable_energy/new_energy_technologies/projects/
magnetic_cooling/materials.aspx?sc_lang=en
[13] B. F. Yu, Q. Gao, B. Zhang, X. Z. Meng, Z. Chen, Inter. J. Refrig. 26, 622 (2003).
[14] V. K. Pecharsky, K. A. Gschneidner Jr., Phys. Rev. Lett. 78, 4494 (1997).
[15] X. X. Zhang, G. H. Wen, F. W. Wang, W. H. Wang, C. H. Yu, G. H. Wu, Appl. Phys.
Lett. 77, 3072 (2000).

43
[16] O. Tegus, E. Bruck, K. H. J. Buschow, F. R. de Boer, Nature (London) 415, 150 (2002).
[17] H. Wada, Y. Tanabe, Appl. Phys. Lett. 79, 3302 (2001).
[18] S. M. Benford, G.V. Brown. J. Appl. Phys. 52, 2110 (1981).
[19] B. K. Ponomarev, Instrum Exp Tech. 26, 659 (1983).
[20] B. K. Ponomarev, J Magn. Magn. Mater. 61, 129 (1986).
[21] B. R. Gopal, R. Chahine, T. K. Bose, Rev Sci Instrum 68, 1818 (1997).
[22] B. R. Gopal, R. Chahine, M. Foldeaki, T. K. Bose, Rev Sci Instrum 66, 232 (1995).
[23] M. Foldeaki, W. Schnelle, E. Gmelin, P. Benard, B. Koszegi, A. Giguere, R. Chahine,
T. K. Bose, J. Appl. Phys. 82, 309 (1997).
[24] S. A. Nikitin, Y. V. Talalayeva. Sov Phys JETP 47, 105 (1978).
[25] T. I. Ivanova, R. Z. Levitin, S. A. Nikitin, Y. V. Talalayeva, Phys Met Metallogr. 51,
196 (1981).
[26] M. D. Kuz‟min, A. M.Tishin Cryogenics 33, 868 (1993).
[27] S. Y. Dan‟kov, Y. I. Spichkin, A. M. Tishin J. Magn. Magn. Mater. 152, 208 (1996).
[28] M. Foldeaki, R. Chahine, T. K. Bose, J Appl. Phys. 77, 3528 (1995).
[29] S. Y. Dan‟kov, A. M. Tishin, Rev Sci Instrum 68, 2432 (1997).
[30] S. Y. Dan‟kov, A. M.Tishin, Phys Rev B. 57, 3478 (1998).
[31] A. M. Tishin, K. A. Gschneidner Jr, V. K. Pecharsky, Phys. Rev. B 59, 503 (1999).
[32] M. Griffel, R. E. Skochdopole, F. H. Spedding, Phys. Rev. B 93, 657 (1954).

44
[33] C. Glorieux, J. Thoen, G. Bednarz, M. A. White, D. J. W. Geldart, Phys Rev B 52,
12770 (1995).
[34] V. K. Pecharsky, J. O. Moorman, K. A. Gschneidner Jr, Rev Sci Instrum 68,
4196(1997).
[35] K. A. Gschneidner Jr, V. K. Pecharsky, Mater Sci Eng 287, 301 (2000).
[36] W. Dai, B. G. Shen, D. X. Li, Z. X. Gao, J. Alloys Compnds 311, 22 (2000).
[37] F. Canepa, S. Cirafici, M. Napoletano, F. Merlo, IEEE Trans Magn 38, 3249 (2002).
[38] X. J. Niu, K. A. Gschneidner Jr, A. O. Pecharsky, V. K. Pecharsky. J. Magn. Magn.
Mater 234, 193 (2001).
[39] V. K. Pecharsky, K. A. Gschneidner Jr Appl Phys Lett. 70, 3299 (1997).
[40] V. K. Pecharsky, K. A. Gschneidner, Phys. Rev. Lett. 78, 4494 (1997).
[41] W. Choe, V. K. Pecharsky, A. O. Pecharsky, K. A. Gschneidner, V. G. Young, G. J.
Miller, Phys. Rev. Lett. 84, 4617 (2000).
[42] L. Morellon, J. Blasco, P. A. Algarabel, M. R. Ibarra, Phys. Rev. B 62, 1022 (2000).
[43] A. O. Pecharsky, K. A. Gschneidner, V. K. Pecharsky, C. E. Schindler, J. Alloys
Compds. 338, 126 (2002).
[44] Y. Mozharivskyj, A. O. Pecharsky, V. K. Pecharsky, G. J. Miller, J. Am. Chem. Soc.
127, 317 (2005).
[45] V. K. Pecharsky, K. A. Gschneidner, J. Alloys Compds. 260, 98 (1997).
[46] L. Morellon, P. A. Algarabel, M. R. Ibarra, J. Blasco, B. Garcia- Landa, Z. Arnold, F.
Albertini, Phys. Rev. B 58, R14721 (1998).

45
[47] L. Morellon, Z. Arnold, P. A. Algarabel, C. Magen, M. R. Ibarra, Y. Skorokhod, J. Phys.
Condens. Matter 16, 1623 (2004).
[48] L. Morellon, P. A. Algarabel, C. Magen, M. R. Ibarra, J. Magn. Magn. Mater. 237, 119
(2001).
[49] E. M. Levin, V. K. Pecharsky, K. A. Gschneidner, G. J. Miller, Phys. Rev. B 64, 235103
(2001).
[50] H. Tang, V. K. Pecharsky, G. D. Samolyuk, M. Zou, K. A. Gschneidner, V. P. Antropov,
D. L. Schlagel, T. A. Lograsso, Phys. Rev. Lett. 93, 237203 (2004).
[51] L. Morellon, J. Stankiewicz, B. Garcia-Landa, P. A. Algarabel, M. R. Ibarra, Appl. Phys.
Lett. 73, 3462 (1998).
[52] A. O. Pecharsky, K. A. Gschneidner, V. K. Pecharsky, J. Appl. Phys. 93, 4722 (2003).
[53] V. K. Pecharsky, K. A. Gschneidner, J. Magn. Magn. Mater. 167, 179 (1997).
[54] V. Provenzano, A. J. Shapiro, R. D. Shull, Nature 429, 853 (2004).
[55] R. D. Shull, V. Provenzano, A. J. Shapiro, A. Fu, M. W. Lufaso, J. Karapetrova, G.
Kletetschka, V. Mikula, J. Appl. Phys. 99, 08K908 (2006).
[56] Y. H. Zhuang, J. Q. Li, W. D. Huang, W. A. Sun, W. Q. Ao, J. Alloys Compds. 421, 49
(2006).
[57] A. Giguere, M. Foldeaki, B. R. Gopal, R. Chahine, T. K. Bose, A. Frydman, J. A.
Barclay, Phys. Rev. Lett. 83, 2262 (1999).
[58] K. A. Gschneidner, V. K. Pecharsky, E. Bruck, H. G. M. Duijn, E. M. Levin, Phys. Rev.
Lett. 85, 4190 (2000).

46
[59] E. Bruck, O. Tegus, D. T. C. Thanh, K. H. J. Buschow, J. Magn. Magn. Mater. 310,
2793 (2007).
[60] A. Yucel, Y. Elerman, S. Aksoy, Proceedings of the First IIF–IIR International
Conference on Magnetic Refrigeration at Room Temperature. Montreux, Switzerland, 2005.
[61] L. Pytlik, A. Zieba, J. Magn. Magn. Mater 51, 199 (1985).
[62] H. Fjellvag, A. Kjekshus, Acta Chem. Scand. A 38, 1 (1984).
[63] C. Kuhrt, T. Schittny, K. Barner, Phys. Stat. Sol. (a) 91, 105 (1985).
[64] H. Wada, Y. Tanabe, Appl. Phys. Lett. 79, 3302 (2001).
[65] N. Menyuk, J. A. Kafalas, K. Dwight, J. B. Goodenough, Phys. Rev. 177, 942 (1969).
[66] H. Yamada, K. Terao, K. Kondo, T. Goto, J. Phys. Condens. Matter 14, 11785 (2002).
[67] H. Wada, T. Morikawa, K. Taniguchi, T. Shibata, Y. Yamada, Y. Akishige, Phys. B–
Condens. Matter 328, 114 (2003).
[68] H. Wada, T. Asano, J. Magn. Magn. Mater. 290, 703 (2005).
[69] T. Morikawa, H. Wada, R. Kogure, S. Hirosawa, J. Magn. Magn. Mater. 283, 322
(2004).
[70] H. Wada, K. Taniguchi, Y. Tanabe, Mater. Trans. JIM 43, 73 (2002).
[71] H. Wada, C. Funaba, T. Asano, M. Ilyn, A.M. Tishin, Sci. Tech. Froid comptes rendus P
1, Sp. Iss. SI (2005) 37.
[72] S. Gama, A. A. Coelho, A. de Campos, A. M. G. Carvalho, F. C. G. Gandra, P. J. von
Ranke, N. A. de Oliveira, Phys. Rev. Lett. 93, 237202 (2004).

47
[73] K. A. Gschneidner, Jr., V. K. Pecharsky and A. O. Tsokol, Rep. Prog. Phys. 68, 1479
(2005).
[74] A. M. Tishin, Y. I. Spichkin, Series in Condensed Matter, IOP, London, 2003.
[75] H. Wada and Y. Tanabe, Appl. Phys. Lett. 79, 3302 (2001).
[76] B. Li, J. Du, W. J. Ren, W. J. Hu, Q. Zhang, D. Li, and Z. D. Zhang, Appl. Phys. Lett.
92, 242504 (2008).
[77] J. Du, W. B. Cui, Q. Zhang, S. Ma, D. K. Xiong, and Z. D. Zhang, Appl. Phys. Lett. 90,
042510 (2007).
[78] K. A. Gschneidner, Jr., V. K. Pecharsky, Ann. Rev. Mat. Sci. 30, 387 (2000).
[79] P. I Kripyakevich, O. S. Zarechnyuk., E. I. Gladyshevskii and O. I. Bodak , Z. Anorg.
Chem 358, 90 (1968).
[80] O. I. Bodak and E. I.Gladyshevskii, Dopov. Akad. Nauk Ukr. RSR. Ser: A 12, 1125
(1969).
[81] T. T. M. Palstra, J. A. Myodish, G. J. Nieuwenhuys, A. M. van der Kraan and K. H. J.
Buschow, J. Magn. Magn. Mater. 36, 290 (1983).
[82] T. T. M. Palstra, H. G. C. Werij, G. J. Nieuwenhuys, J. A. Myodish, F. R. de Boer and
K. H. J. Buschow, J. Phys. F: Met. Phys. 14, 1961 (1984).
[83] F. X. Hu, B. G. Shen, J. R. Sun, Z. H. Cheng, G. H. Rao and X. X. Zhang, Appl. Phys.
Lett. 78, 3675 (2001).
[84] W. H.Tang, J. K. Liang, X. L. Chen, G. H. Rao, J. Appl. Phys. 76, 4095 (1994).

48
[85] O. I. Bodak and E. I. Gladyshevskii, Dopov. Akad. Nauk Ukr. RSR. Ser: A 12, 1125
(1969).
[86] O. Kubaschewski, Iron-Binary Phase Diagrams, Springer-Verlag, Berlin, 1982, pg. 57
[87] O. Kubaschewski, Iron-Binary Phase Diagrams, Springer-Verlag, Berlin, 1982, pg. 136
[88] K. A. Gschneidner Jr. Rare-Earth Compounds, Van Nostrand, Princeton, 1961, pg. 187
[89] G. H. Wen, R. K. Zheng, X. X. Zhang, W. H. Wang, J. L. Chen and G. H. Wu, J. Appl.
Phys. 91, 85378539 (2002).
[90] M. Ilyn, A. M. Tishin, F. X. Hu, J. Gao, J. R. Sun and B. G. Shen, J. Magn. Magn.
Mater. 290, 712 (2005).
[91] O. Nane, H. Agil, B. Ozkurt, B. Ozcelik, A. Gencer, J. Phys.: Conf. Series 153, 012063
(2009).
[92] X. B. Liu, Z. Altounian, A. H. Beath, J. Appl. Phys. 95, 6924 (2004).
[93] H. Tsuji, A. T. Saito, T. Kobayashi and S. Sakurada, International Cryocooler
Conference, Inc., Boulder, CO, (2007).
[94] M. Balli, M. Rosca, D. Fruchart and D. Gignoux, J. Magn. Magn. Mater. 321, 123
(2009).
[95] A. Fujita, S. Fujieda, K. Fukamichi, H. Mitamura and T. Goto, Phys. Rev. B 65, 14410
(2002).
[96] J. M. D. Coey, P. A. I. Smith, J. Magn. Magn. Mater. 200, 405 (1999).

49
[97] S. H. Xie, J. Q. Li, Y. H. Zhuang, J. Magn. Magn. Mater. 311, 589 (2007).
[98] E. Bruck, J. Phys. D: Appl. Phys. 38, R381 (2005).
[99] S. H. Xie, J. Q. Li, Y. H. Zhuang, J. Magn. Magn. Mater. 311, 589 (2007).
[100] A. Fujita, S. Fujieda, Y. Hasegawa, K. Fukamichi, Phys. Rev. B. 67, 104416
(2003).
[101] Z. H. Cheng, B. G. Shen, J. Appl. Phys. 91, 7836 (2002).
[102] J. Lyubina, O. Gutfleish, M. D. Kuz‟min and M. Richter, J. Magn. Magn. Mater. 320,
2252 (2008).
[103] S. Fujieda, A. Fujita, K. Fukamichi, N. Hirano, S. J. Nagaya, J. Alloys Compds. 408-
412, 1165 (2006).
[104] A. Fujita, Y. Akamatsu, K. Fukamichi, J. Appl. Phys. 85, 4756 (1999).
[105] A. Fujita, S. Fujieda, K. Fukamichi, H. Mitamura, T. Goto, Phys. Rev. B 65, 014410
(2001).
[106] A. Fujita, K. Fukamichi, K. Koyama, K. Watanabe J. Appl. Phys. 95, 6687 (2004).
[107] Y. Sun, Z. Arnold, J. Kamarad, G. J. Wang, B. G. Shen, Z. H. Cheng, Appl. Phys. Lett.
89, 172513 (2006).
[108] L. Jia, J. R. Sun, B. G. Shen, D. X. Li, S. Nimori, J. Appl. Physics 101, 106108 (2007).
[109] C. B. Rong and J. P. Liu, Appl. Phys. Lett. 90, 222504 (2007).
[110] H. Fjellvåg and A. F. Andresen, J. Magn. Magn. Mater. 50, 291 (1985).
[111] H. Wada and Y. Tanabe, Appl. Phys. Lett. 79, 3302 (2001).

50
[112] T. Kanomata, H. Ishigaki, T. Suzuki, H. Yoshida, S. Abe, and T. Kaneko, J. Magn.
Magn. Mater. 140 , 131 (1995).
[113] S. Lin, O. Tegus, E. Brück, W. Dagula, T. J. Gortenmulder and K. H. J. Buschow,
IEEE Trans. Magn. 42, 3776 (2006).
[114] J. T. Wang, D. S. Wang, C. Chen, O. Nashima and T. Kanomata, H. Mizuseki and Y.
Kawazoe, Appl. Phys. Lett. 89, 262504 (2006).
[115] J. T. Wang, D. S. Wang, C. Chen, O. Nashima and T. Kanomata, H. Mizuseki and Y.
Kawazoe, Appl. Phys. Lett. 89, 262504 (2006).
[116] K. Koyama, M. Sakai, T. Kanomata, K. Watanabe, Jpn. J. Appl. Phys. 43 (Part 1),
8036 (2004).
[117] V. Johnson, Inorg. Chem. 14, 1117 (1975).
[118] S. Niziol, A. Weselucha, W. Bazela, and A. Szytula, Solid State Commun. 39, 1081
(1981).
[119] S. Niziol, A. Zieba, R. Zach, M. Baj, L. Dmowski, J. Magn. Magn. Mater. 38, 205
(1983).
[120] S. Anzai and K. Ozawa, Phys. Rev. B 18, 2173 (1978).
[122] S. Niziol, R. Zach, J. P. Senateur, and J. Beille, J. Magn. Magn. Mater. 79, 333 (1989).
[123] L. Caron, N. T. Trung, E. Bruck, Phys. Rev. B 84, 020414(R) (2011).
[124] N. T. Trung, V. Biharie, L. Zhang, L. Caron, K. H. J. Buschow, and E. Bruck, Appl.
Phys. Lett. 96, 162507 (2010).
[125] N. T. Trung, L. Zhang, L. Caron, K. H. J. Buschow, and E. Bruck, Appl. Phys. Lett. 96,
172504 (2010).
[126] P. E. Markin, N. V. Muahnikov, V. I. Khrabrov and M. A. Korotin, The Physics of
Metals and Metallography 106 (2008) 481.

51
[127] J. B. A. Hamer, R. Daou, S. Özcan, N. D. Mathur, D. J. Fray, K. G. Sandeman, J.
Magn. Magn. Mater. 321, 3535 (2009).
[128] Y. K. Fang, C. C. Yeh, C. W. Chang, W. C. Chang, M. G. Zhu and W. Li, Scripta
Materials 57, 453 (2007).
[129] N. T. Trung, Z. Q. Ou, T. J. Gortenmulder, O. Tegus, K. H. J. Buschow and E. Bruck,
Appl. Phys. Lett. 94, 102513 (2009).
[130] Y. Shao, J. Zhang, J. K. L. Lai and C. H. Shek, J. Appl. Phys. 80, 76 (1996).
[131] Y. Z. Shao, J. K. L. Lai and C. H. Shek, J. Magn. Magn. Mater. 163, 103 (1996).
[132] T. A. Yamamoto, M. Tanaka, Y. Misaka, T. Nakagawa, T. Nakayama, K. Niihara and
T. Numazawa, Scripta Materialia 46, 89 (2002).
[133] T. Kinoshita, S. Seino, H. Maruyama, Y. Otome, K. Okitsu, T. Nakayama, K. Niihara,
T. Nakagawa, T. A. Yamamoto, J. Alloys Compnds 365, 281 (2004).
[134] S. Gorsse, B. Chevalier, G. Orveillon, Appl. Phys. Lett. 92, 122501 (2008).
[135] N. J. Jones, H. Ucar, J. J. Ipus, M. E. McHarry, D. E. Laughlin, J. Appl. Phys. 111,
07A334 (2012).

52
CHAPTER 3
EXPERIMENTAL METHODS AND PROCEDURES
The basic principles of equipment used to synthesize and characterize the properties of the
materials presented in this thesis are outlined in this chapter. Owing to the emphasis on
establishing a correlation between the structure, magnetic properties and the MCE in the
studied magnetic materials, the investigated samples were first characterized structurally and
then magnetic and magnetocaloric measurements were performed.
3.1 Sample Preparation
3.1.1 Nano-sized sample Preparation – Microwave assisted hydrothermal process
Analytically pure reagents were dissolved in appropriate amounts of distilled water under
stirring. Appropriate amounts of potassium hydroxide (KOH) was added to the solution until
the required pH was attained. This solution was stirred for 30 minutes, after which it was
transferred into a double-walled Teflon flask which consists of an inner liner and a cover
made of Teflon PFA and an outer high strength sleeve. Microwave - assisted hydrothermal
treatment was performed by placing the sealed Teflon flask in a Microwave Accelerated
Reaction System (MARS-5, CEM Corporation, USA) at 140˚C for 3 h. This system was
operated at a frequency of 2.45 GHz with a maximum power of 1200 W and could be
controlled by temperature (maximum, 300˚C) and pressure (maximum, 1500 psi). On
completion of the reaction, the resultant black precipitates were centrifuged, washed with
distilled water and then ethanol to eliminate excess ions in the final product. Finally, the
precipate was dried.

53
3.1.2 Bulk sample Preparation – Arc melting
The arc melting furnace is divided into two main sections; the chamber and the electrical
power supply. During the melting procedure, a non-consumable tungsten electrode is used on
a water cooled copper hearth. For the melting process, the power supply a high current, low
voltage power. The melting is done on a copper stage which is cooled by water supplied to
the chamber. Before starting the melting process, the copper stage is disconnected from the
chamber and is cleaned by sandblasting and is subsequently rinsed with alcohol. The copper
stage is loaded with materials, usually consisting of small pieces or pellets to be melted and is
reconnected to the chamber. The system is evacuated, filled with argon gas and the tungsten
tip is lowered until it touches the material on the copper stage. During the melting, the tip is
constantly moved uniformly over the whole area containing the material. Furthermore, the
melted samples are turned over and remelted several times to achieve homogeneous melting.
Finally, the ingot is wrapped in tantalum foil and annealed for the required time.
3.2 Structural and physical characterization of the samples
The determination of the structural properties as well as the quantification of the phases
therein was carried out using x-ray diffraction (XRD), neutron diffraction and scanning
electron microscopy (SEM). These techniques are elaborated below.
3.2.1 X-Ray Diffraction
The XRD technique is a simple non-destructive method for crystal structure analysis
requiring no elaborate sample preparation with just a finely ground powder of the sample
being used for the measurement. In the kinematical theory, as illustrated in Figure 3.1, a
monochromatic x-ray beam incident upon a crystal with lattice planes separated by a distance
d, is reflected by each plane. The path difference between two adjacent planes is 2dsinθ. The

54
reflected radiation from adjacent planes will experience constructive intereference when the
Bragg condition is satisfied:
sin2dn (3.1)
where n is an integer and λ is the wavelength of the incident x-ray beam. This Bragg
reflection is only possible if λ ≤ 2d. CuKα radiation is used for this type of measurement since
d is of the order angstrom. In this work, the x-ray diffraction patterns were collected in a
Philips PW1730 diffractometer using monochromated Cu Kα radiation of wavelength, λ =
1.5418Å to analyze the crystalline nature of the magnetocaloric materials.
Figure 3.1 Kinematical interpretation of Bragg diffraction by adjacent crystal planes.
3.2.2 Scanning Electron Microscopy
The SEM generates a variety of signals at the surface of solid specimens by using a focused
beam of high energy electrons. Electron – sample interactions generate a signal which reveals
information about the sample such as the morphology, chemical composition and crystalline
structure. Precise measurements of very small features of the sample down to the nanometer
(nm) size is possible using SEM. The SEM is also capable of quantitatively determining the

55
chemical composition using energy dispersive x-ray spectroscopy (EDS). In this technique,
only solid samples can be analysed. For electrically insulating samples, the low vacuum
mode is used or an electrically conductive coating is applied to the sample.
3.2.3 Neutron Measurements
The neutron diffraction technique is used for the determination of the atomic and / or
magnetic structure of a material. We performed our neutron experiments at The Australian
Nuclear Science and Technology Organisation (ANSTO), which houses the Open Pool
Australian Lightwater (OPAL) reactor, which is a state of the art 20 Megawatt reactor that
uses low enriched uranium fuel. A high continuous flux of neutrons is produced in the core of
this fission reactor. These neutrons are moderated to thermal velocities close to the source
and then transported to the neutron scattering instruments in neutron guide systems to targets
in a series of instruments.
For this study, Echidna and Wombat neutron beam instruments were used for the
determination of the atomic and magnetic structure of a few selected magnetocaloric
materials. A schematic diagram of the Echidna neutron diffractometer is shown in Figure 3.2.
As mentioned previously, an intense beam of neutrons is produced at the nuclear reactor and
this neutron beam is channelled through a collimator which narrows the beam such that only
neutrons travelling normal to the reactor surface are used. The neutron beam is then targeted
on a monochromators (usually graphite), which will reflect neutrons with a wavelength close
to a value determined by the angular setting of the graphite monochromator. The
monochromatic beam is then directed to the sample under investigation. When these neutrons

56
Figure 3.2 Schematic diagram of the Echidna diffractometer2
strike the target material, they scatter, producing distinctive patterns that deliver information
to researchers.
3.2.4 Synchrotron Measurements
Figure 3.3 Schematic diagram of the Australian Synchrotron3.
2 Adapted from: http://www.ansto.gov.au/__data/assets/pdf_file/0009/44595/Neutron_beam_instruments_and_National_Deuteration_Facility_brochure.pdf

57
Figure 3.3 is a schematic of the synchrotron which functions as described below:
1. Electrons are produced at the electron gun by thermionic emission from a heated tungsten
cathode. After that, the emitted electrons are then accelerated to energy of 90 keV by a 90 kV
potential difference applied across the gun, and move into the linear accelerator.
2. The linear accelerator (linac) accelerates the electron beam to energy of 100 MeV over a
distance of about 10 metres.
3. The booster is an electron synchrotron 130 metres in circumference that takes the 100 MeV
beam from the linac and increases its energy to 3 GeV. The beam is then accelerated by a
simultaneous ramping of magnet strength and cavity fields.
4. The storage ring, which can hold 200 mA of stored current with a beam lifetime of over 20
hours is the final destination for the accelerated electrons.
5. Individual beamlines are positioned to capture the synchrotron light given off by the
storage ring. The photon delivery system (also called the „beamline optics‟) which
incorporates filters, monochromators, mirrors, attenuators and other devices is used to focus
and select appropriate wavelengths for particular research techniques.
6. Experiments employing synchrotron light are conducted in customised facilities called
end-stations which are housed inside radiation shielding enclosures called „hutches‟ to protect
personnel from potentially harmful x-rays. Each beamline utilises the synchrotron light to
gather data in the form of images, chemical spectra, and/or scattered light. In our work we
used the powder diffraction beamline which has been designed to operate over the energy
range 5-30 keV.
3 Adapted from http://www.synchrotron.org.au/index.php/about-us/our-facilities/accelerator-physics/how-does-the-australian-synchrotron-
work

58
3.3 Physical Property Measurement System (PPMS)
The Quantum Design PPMS is a variable temperature – field system, designed to perform a
range of automated measurements. Samples can be measured in magnetic fields up to 14 T in
a temperature range of 1.9 – 400 K. The PPMS has the following different options:
DC and AC magnetometry
Heat capacity
Electro – transport
Thermal transport
In this work, only the DC magnetometry was used and it is described briefly below.
3.3.1 Vibrating Sample Magnetometer (VSM)
The VSM is composed of a linear motor for vibrating the sample, a coil-set puck for
detections, electronics for controlling the linear motor transport and software for automatic
control. The sample is magnetized by a constant magnetic field and the magnetic moment of
the sample is measured, producing a DC magnetization curve which can be a function of field
or temperature.

59
CHAPTER 4
A SIGN OF FIELD-INDUCED FIRST ORDER MAGNETIC
STATE TRANSITION AND GIANT REVERSIBLE
MAGNETOCALORIC EFFECT IN COBALT HYDROXIDE
NANOSHEETS
4.1 Introduction
An ideal material for magnetic refrigeration should be composed of relatively inexpensive
raw materials, have a high MCE demonstrated by a high change in magnetic entropy (∆SM)
and a high adiabatic temperature change (∆Tad) and have little or no thermal/magnetic
hysteresis [1 – 6]. First order transitions possess the above mentioned characteristics and have
been shown to have a consistently higher MCE than second-order transitions. Recently, there
has been an interest in the investigation of magnetic and MCE properties in various
nanoparticle systems [7 – 10]. Magnetic nanoparticles exhibit a higher refrigerant capacity as
compared to their bulk counterparts, owing to their reasonably large MCE over a wide
temperature range [11]. It has now been established that the shapes of nanostructured
materials have a considerable influence on their physical properties [12]. In the past decade,
one-dimensional nanostructures such as wires, rods and tubes were the main focus of intense
research, owing to their novel properties and potential applications in the fabrication of
nanostructure devices. In recent years, however, there has been a growing interest in the
investigation of two – dimensional (2D) nanosheets due to the interesting properties they
possess, owing to their high anisotropy and thinness [13]. Enhanced magnetic properties are
also expected in 2D nanostructures. For β-Co(OH)2, this area is poorly explored, and to date,

60
only a few reports on the preparation of 2D β-Co(OH)2 nanostructures have appeared in print
[12, 14]. Liang et al. and Liu et al. both synthesized single crystalline β-Co(OH)2 nanosheets.
However, these studies have not investigated the magnetic properties of the 2D β-Co(OH)2 to
investigate whether the expected enhanced magnetic properties would be observed. To the
best of our knowledge, this is the first report on the magnetic and magnetocaloric properties
of 2D β-Co(OH)2 nanostructures. Herein, we report a novel process of synthesizing β-
Co(OH)2 nanosheets through a microwave assisted hydrothermal process. It is the aim of this
work to investigate the magnetic and magnetocaloric properties of 2D β-Co(OH)2 nanosheets
and compare with those of β-Co(OH)2 nanoparticles reported in literature.
4.2 Experimental Procedures
Analytically pure reagents were used in this experiment. A precipitation and microwave
hydrothermal process was used for the synthesis of cobalt hydroxide nanoplatelets. 10 mmol
Co(NO3)2.6H2O was dissolved in 50 ml distilled water under stirring, then 2 M KOH solution
was added into the solution at a rate of 2 mL.min-1
, until the pH value of the solution reached
11. This solution was stirred for 30 minutes, after which it was transferred into a double-
walled vessel which consists of an inner liner and a cover made of Teflon PFA and an outer
high strength sleeve. The vessel was sealed and maintained in a Microwave Accelerated
Reaction System (MARS-5, CEM Corporation, USA) at 140˚C for 3 h. This system was
operated at a frequency of 2.45 GHz with a maximum power of 1200 W and could be
controlled by temperature (maximum, 300˚C) and pressure (maximum, 1500 psi). On
completion of the reaction, the resultant black precipitates were centrifuged, washed with
distilled water and then ethanol in an attempt to minimize the extra ions in the final product.
Finally, the black precipitates were dried at 80˚C in air.

61
The as-prepared sample was characterized by x-ray diffraction (XRD) and scanning electron
microscopy (SEM). The magnetization measurements for the sample was carried out using
the vibration sample magnetometer (VSM) option of a quantum design 14 T Physical
Property Measurement System (PPMS) in the temperature range of 3 – 22 K at applied fields
up to 5T. The MCE was evaluated from the calculated isothermal magnetic entropy change
∆SM (T, H) in the vicinity of the magnetic phase transition temperature according to equation
(4.1) below.
(4.1)
4.3 Results and Discussion
Figure 4.1 The x-ray diffraction pattern of β - Co(OH)2 nanosheets.
dHT
HTMHTS
H
H
H
M
2
1
,,

62
The XRD pattern and index of the cobalt hydroxide sample is shown in Figure 4.1, most of
the β-Co(OH)2 phase ( ~ 95%) and small amount of secondary phase ( ~ 5% Co3O4) was
determined through XRD Rietveld refinement.
The morphology of the β-Co(OH)2 nanoparticles was investigated by SEM, as shown in
Figure 4.2 The β-Co(OH)2 is shown to have a platelet morphology with the diameter
distribution range being 1 - 2 µm. The platelet particle is consisted of agglomerated
nanosheets with thickness of 20 to 80 nm. However, the average thickness of a single β-
Co(OH)2 nanosheet was about 10 nm, estimated from the isolated nanosheets.
Figure 4.2 The SEM image of β - Co(OH)2 nanosheets.

63
Figure 4.3 M – T, 1/χ – T, δM/δT – T curves of β - Co(OH)2 nanosheets.
The temperature dependence of the inverse magnetic susceptibility in a magnetic field of 100
Oe under field cooling (FC) and zero FC (ZFC), which contains 1/χ − T curves (1/χFC – T
curve and 1/χZFC – T curve). A sign of antiferromagnetism (AFM) transition at temperature
TN = 9 ~ 10 K can be found from these 1/χ − T curves. The TN value for β-Co(OH)2
nanoparticles in the present work is lower than the previously reported values of of 11 and
12.3 K reported in Refs. 15 and 16, respectively. A decrease in TN was observed in many
nanosized AFM systems as the grain size decreased [17 – 19]. We have established from the
SEM images that the β-Co(OH)2 nanoparticles investigated in this work had a considerably
smaller grain size, compared to those described in Refs. 15 and 16; hence the lower value of
TN in the present work could be ascribed to nanosize effects. The 1/χ − T curves also indicate
that paramagnetic to spin glass (SG) - like (we suspect it is the surface spin present SG - like

64
behaviour) transition seems to start at onset temperature defined as T1 ~ 96 K since the slope
of the curve start changing from the constant straight line (PM state) to lower value (SG –
like state) at that temperature (96 K), then the value of the slope increases (AFM state) at
temperature of 9 ~ 10 K. The SG - like behaviour of the surface spins is clearly seen as an
open hysteresis loop, as shown in Figure 4.4. This indicates that it has a loss of magnetization
during one hysteresis [20 – 21].
Figure 4.4 shows the selected isothermal M - H loops of the β-Co(OH)2 nanosheets, which
are plotted as a function of the applied magnetic field (ranging from µ0H = -5 T to 5 T) at the
temperatures of 3, 10, 20, and 100K. This figure depicts the hysteresis loop of the β-Co(OH)2
Figure 4.4 Selected M - H loops of β-Co(OH)2 nanosheets at temperature 3K, 10K, 20K,
100K.

65
nanosheets obtained at different temperatures in the presence of a magnetic field which was
scanned in the interval ± 5T. We found a magnetic hysteresis of approximately 20 Oe which
is very low. It should be noted that the M – H loops show straight-type line (PM behaviour)
at temperatures higher than 100 K, show bent-type line (SG-like behaviour of the surface
spin) at temperatures lower than 100 K, and show step-type line (field-induced AFM to FM
behaviour) at temperatures lower than 9 K.
Figure 4.5 shows the isothermal magnetization curves of the β-Co(OH)2 nanosheets, which
are plotted as a function of the applied magnetic field (ranging from µ0H = 0 to 5 T) in the
temperature range between 3 and 22 K. It should be noted that at temperatures below 9 K,
Figure 4.5 Magnetic behaviors of β - Co(OH)2 nanosheets, M – H curves at temperature from
3 K to 22 K.

66
and under a low field, the variation of the isotherm magnetizations with temperature are
rather dramatic as compared to the isotherm magnetizations at temperatures above 9 K.
However, under high magnetic field values, the variation of the isotherm magnetizations (in
the whole temperature range) becomes gradual with no saturation being observed. This non –
saturation of the magnetization confirms the presence of a large anisotropy in the β-Co(OH)2
nanosheets. Also, the fact that the M – H curves are non – saturating with gradual curvature
indicates superparamagnetic behaviour.
The Arrott plots M2
versus H/M at selected temperatures in the range 3 – 22K are shown in
Figure 4.6. Below the temperature of 9 K, Fig 4.6 shows S-shaped Arrott plots which
demonstrate demonstrate that the transition temperature is around 9 K, and the field induced
transition from the AFM to FM state is first order in nature.
Figure 4.6. Arrott-plot curves of β - Co(OH)2 nanosheets.

67
The isothermal magnetization data was analyzed using the well-known Maxwell relation
shown in Eq. (4.1). The magnetic entropy changes (∆SM) versus temperature under different
fields are shown in Figure 4.7; ∆SM was calculated from the isothermal curves according to
Eq. (4.1) of the Maxwell relation, which is discussed in detail in Refs. 22 - 24. It is apparent
that, the peak of ∆SM at Tc = 11 K for the different magnetic field changes, corresponds to
second order PM to FM - like phase transition, the ∆SM value exhibits a positive value below
9 K and under low field range, but it changes to a negative value under high field range.
Figure 4.8 shows the magnetic entropy change, ∆SM, as a function of applied field at different
temperatures. This positive ∆SM indicates inverse MCE, which has also been previously
observed in β-Co(OH)2 nanoparticles [15]
. The peak value of ∆SM is 17 J/kg K at 11 K for a
Figure 4.7 Magnetic-entropy changes versus temperature curves of β - Co(OH)2 nanosheets.

68
Figure 4.8 Magnetic-entropy changes versus applied field of β - Co(OH)2 nanosheets.
field change of 5 T. This is slightly higher than the previously reported value of ∆SM = 15 J /
kg K at 5 T for β-Co(OH)2 nanoparticles [15]. It is also worth noting that the XRD analysis of
our sample shows a small amount of a secondary phase (~ 5% Co3O4), which obviously has a
detrimental effect on the determined value of ∆SM. This therefore means that we expect our
samples to exhibit an even higher value of ∆SM once their purity has improved.
Following the above results and discussions, we find that: (i) the SG-like surface spin may
have a significant effect on the MCE (Ref. 11) and (ii) similar to what was observed by
Zhong et al. [25] the surface bond contraction effect on the magnetic performance of the β-
Co(OH)2 nanoparticles will also have a significant effect on the MCE and (iii) the sign of
field-induced first order magnetic phase transition is possibly due to the result of the

69
competition or interaction coupling of the surface spin, impure phase [Co3O4 shown in Figure
4.1], and for β-Co(OH)2 bulk magnetic behaviour. Thus more work (outlined in Chapter 9)
needs to be done to understand the nanomagnetism of this material. The β-Co(OH)2
nanosheets, however, show a very high magnetic moment, the MS ~ 110 emu / g at 3 K, as
shown in Figure 4.4, which causes a highly reversible giant MCE effect even with second
transition at a temperature above 11 K, is a sign of field-induced first order transition from
the AFM to the FM below 9 K, and acts as a role of reversing the MCE value from negative
to positive value in the low field range.
4.4 Conclusions
In conclusion, β-Co(OH)2 nanosheets have been successfully prepared by a microwave
assisted hydrothermal and conventional chemical reaction method. This material displays a
high magnetic moment and a large reversible magnetic entropy change of 17 J/kg K at 11 K
in a magnetic field change of 5 T thereby indicating the suitability of this material for use in
magnetic refrigeration.

70
References:
[1] K. A. Gschneidner, Jr., V. K. Pecharsky, and A. O. Tsokol, Rep. Prog. Phys. 68, 1479
(2005).
[2] A. M. Tishin, Y.I. Spichkin, Series in Condensed Matter (IOP, London, 2003).
[3] H. Wada and Y. Tanabe, Appl. Phys. Lett. 79, 3302 (2001).
[4] B. Li, J. Du, W. J. Ren, W. J. Hu, Q. Zhang, D. Li, and Z. D. Zhang, Appl. Phys. Lett. 92,
242504 (2008).
[5] J. Du, W. B. Cui, Q. Zhang, S. Ma, D. K. Xiong, and Z. D. Zhang, Appl. Phys. Lett. 90,
042510 (2007).
[6] K. A. Gschneidner, Jr., V. K. Pecharsky, Ann. Rev. Mat. Sci. 30, 387 (2000).
[7] Y. Du and D. O‟Hare, Inorg. Chem. 47, 3234 (2008).
[8] A. Nittke, P. Esquinazi, W. Widder and H. F. Braun, Physica C 260, 273 (1996).
[9] S. Ma, W. B. Cui, D. Li, N. K. Sun, D.Y. Geng, X. Jiang and Z. D. Zhang, Appl. Phys.
Lett. 92, 173113 (2008).
[10] S. R. Ahmed, S. B. Ogale, G. C. Papaefthymiou, R. Ramesh and P. Kofinas, Appl. Phys.
Lett. 80, 1616 (2002).
[11] M. H. Phan, M. B. Morales, C. N. Chinnasamy, B. Latha, V. G. Harris and H. Srikanth,
J. Phys. D: Appl. Phys. 42, 115007 (2009).
[12] Z. H. Liang, Y. J. Zhu, G. F. Cheng and Y. H. Huang, Can. J. Chem. 84, 1050 (2006).
[13] J. Q. Hu, Y. Bando, J. H. Zhan, Y. B. Li and T. Sekiguchi, Appl. Phys. Lett. 83, 4414
(2003).

71
[14] X. Liu, R. Yi, N. Zhang, R. Shi, X. Li and G. Qiu, Chem. Asian J. 3, 732 (2008).
[15] X. H. Liu, W. Liu, W. J. Hu, S. Guo, X. K. Lv, W. B. Cui, X.G. Zhao and Z. D. Zhang,
Appl. Phys. Lett. 93, 202502 (2008).
[16] T. Takada, Y. Bando, M. Kiyama and H. Miyamoto, J. Phys. Soc. Jpn. 21, 2726 (1966).
[17] J. P. Chen, C. M. Sorenson, K. J. Klabunde, G. C. Hadjipanayis, E. Devilin and A.
Kostikas, Phys. Rev. B 54, 9288 (1996).
[18] C. D. Spencer and D. Schroeer, Phys. Rev. B 9, 3658 (1974).
[19] T. Ambrose and C. L. Chien, Phys. Rev. Lett. 76, 1743 (1996).
[20] M. Gruyters, Phys. Rev. Lett. 95, 077204 (2005).
[21] E. L. Salabas, A. Rumplecker, F. Kleitz, F. Radu and F. Schuth, Nano Lett. 6, 2977
(2006).
[22] V. K. Pecharsky and K. A. Gschneidner, Jr., J. Appl. Phys. 86, 565 (1999).
[23] V. K. Pecharsky and K. A. Gschneidner, Jr., J. Appl. Phys. 90, 4614 (2001).
[24] H.W. Zhang, J. Shen, Q.Y. Dong, T.Y. Zhao, Y.X. Li, J.R. Sun and B.G. Shen, J.
Magn. Magn. Mater. 320, 1879 (2008).
[25] W. H. Zhong, C. Q. Sun, S. Li, H. L. Bai, E. Y. Jiang, Acta Mater. 53 (11) 3207 (2005).

72
CHAPTER 5
ENHANCEMENT OF THE REFRIGERANT CAPACITY IN
LOW LEVEL BORON DOPED La0.8Gd0.2Fe11.4Si1.6
5.1 Introduction
Magnetic refrigeration is regarded as a promising, more efficient, and environmentally
friendly alternative to gas-compression-based refrigeration due to its potential applications in
a wide range of temperatures [1 - 5]. Materials exhibiting first-order magnetic phase
transitions are of special interest since they intrinsically present a high MCE originating from
the discontinuous character of the transition [6 - 7]. The LaFe11.4Si1.6 alloy exhibits a first-
order magnetic transition and also belongs to the so-called giant magnetocaloric effect
(GMCE) group of materials which undergo a phase transition from one form of magnetic
order to another with an associated "giant" change of entropy. With the potential for high
temperature operation in mind, a drawback of this system is the relatively low ordering
temperature of TC ~195 K [8] although TC can be tuned by introducing small atoms like B, N
or C [9 – 11]. Introduction of the interstitial N, H, C or B atoms leads to expansion of the
lattice which makes the Fe 3d band narrow and brings about the increase in TC by reducing
the Fe 3d overlap wave functions [10]. Such small atoms change the electronic structure of
the compounds, which can influence the intrinsic magnetic properties of Fe-based compounds
[12].

73
The refrigerant capacity (RCP) is a measure of the heat that can be transferred between the
cold and hot reservoirs and, together with ΔSM, is a key parameter for characterising the
performance of magnetocaloric materials. We have therefore carried out a systematic study of
the influence of boron doping on the ΔSM and RCP of La0.8Gd0.2Fe11.4Si1.6Bx compounds (with
boron doping level, x = 0, 0.03, 0.06, 0.2 and 0. 3). It has been previously shown that the
partial substitution of La with Gd enhances the LaFe11.4Si1.6 magnetocaloric properties, hence
for this purpose for all our samples we substituted 20 at. % La with Gd [13]. Our results
reveal that, for low boron doping levels, the magnetic field induced phase transition remains
first order and causes a significant enhancement of RCP. However, high boron doping levels
change the phase transition from first order to second order and accordingly decreases both
ΔSM and RCP compared to undoped La0.8Gd0.2Fe11.4Si1.6. We also show that for
La0.8Gd0.2Fe11.4Si1.6Bx compounds (with boron doping level, x = 0, 0.03, 0.06, 0.2 and 0. 3),
an increase in boron doping shifts TC towards room temperature.
5.2 Experimental Procedures
Ingots of polycrystalline alloys with nominal compositions La0.8Gd0.2Fe11.4Si1.6Bx (x = 0,
0.03, 0.06, 0.2 and 0.3), where x is the boron doping level, were prepared by arc-melting
appropriate amounts of the high purity constituent elements under a high purity argon
atmosphere in a water cooled copper crucible. The purities of the starting materials were
99.9% for La, Si and Fe, 99.99% for Gd and 99.999% for B. During the arc melting process,
each ingot was turned over and remelted several times to ensure its homogeneity. The total
weight loss after the arc-melting procedure was less than 1 wt %, corresponding to La and Gd
evaporation during the fusion, which was compensated with an La and Gd mass excess (10
at. %) to ensure the compound stoichiometry. The resulting ingots were wrapped in tantalum
foil, annealed at 1323 K for 14 days in an evacuated quartz tube to improve the crystallization

74
of the samples and then quenched in water. X - ray diffraction (XRD) measurements on
powder samples were performed using Cu Kα radiation to identify the crystal structure and
the crystal lattice parameter. The magnetization was measured as a function of temperature
and magnetic field for the samples and was carried out using the vibration sample
magnetometer (VSM) option of a quantum design 14 T Physical Property Measurement
System (PPMS) in the temperature range of 150 – 300 K under applied magnetic field values
up to 5 T.
5.3 Results & Discussion
A Rietveld plot of XRD data profile refinement with the program FULLPROF for a selected
sample La0.8Gd0.2Fe11.4Si1.6B0.06 is shown in Figure 5.1. The XRD indicates that the alloys
crystallize well in the NaZn13-type cubic structure with a small amount of α-Fe and LaFeSi
existing as minor phases. It is imperative to note that the majority of published data on
LaFe13−xSix alloys, no single-phase LaFe13−xSix alloys could be obtained [14 – 17]. Table 5.1
shows the lattice parameter, a, determined by using the Rietveld refinement as a function of
the B concentration. It is clear from Table 5.1 that the addition of boron in
La0.8Gd0.2Fe11.4Si1.6Bx results in a linear increase of the lattice constant from 11.464 to 11.473
for x = 0 to x = 0.3 The lattice parameters of the NaZn13-type structure phase for the alloys
increase on the addition of boron, suggesting that the boron atoms occupy interstitial sites
resulting in the expansion of the lattice. The lattice expansion caused by the addition of B is
shown in Table 5.1 and was calculated to be ~8 % for La0.8Gd0.2Fe11.4Si1.6B0.3 compared to
the undoped sample.

75
Figure 5.1 Rietveld plot of X-ray diffraction data for a selected sample, x = 0.06 at 300 K.
Table 5.1 Magnetic hysteresis loss, lattice parameter, RCeff and bond angles of
La1-xGdxFe11.4Si1.6 compounds, measured at 5 T.
Sample Loss
(J/kg)
RCeff
(J/kg) a (Å)
Bond Lengths (Å)
La(8a)-
Fe(96i)
Fe(8b)-
Fe(96i)
Fe(96i)-
Fe(96i)
La0.8Gd0.2Fe11.4Si1.6 3.7 281 11.4637(4) 3.3468(7) 2.4519(2) 2.8292(8)
La0.8Gd0.2Fe11.4Si1.6B0.03 9.1 352 11.4641(8) 3.3470(2) 2.4520(3) 2.8294(1)
La0.8Gd0.2Fe11.4Si1.6B0.06 5.7 341 11.4646(2) 3.3471(4) 2.4521(1) 2.8295(1)
La0.8Gd0.2Fe11.4Si1.6B0.2 0.4 226 11.4649(9) 3.3472(5) 2.4522 2.8296(1)
La0.8Gd0.2Fe11.4Si1.6B0.3 0.3 249 11.4728(6) 3.3495(6) 2.4538(9) 2.8315(5)

76
The temperature-dependent magnetization was been measured in the zero-field-cooled (ZFC)
and field-cooled (FC) process for all samples in order to determine the transition temperature
and the nature of the transition. The sample was first cooled in zero-field to 5 K, then a small
field of 200 Oe was applied to the sample and after that the magnetization was measured in
the heating process up to 300 K, thus obtaining the ZFC magnetization curve (which is not
shown to enhance clarity). The FC magnetization was measured in the process of cooling
sample to 5 K with the same field. Figure 5.2 shows the FC magnetization obtained under a
magnetic field of 0.02 T for the La0.8Gd0.2Fe11.4Si1.6Bx samples with boron doping level, x =
0, 0.03, 0.06, 0.2 and 0.3. The ferromagnetic ordering TC of the samples is defined as the
temperature at which the dM/dT of the warming M - T curves is a minimum. The TC values
for the La0.8Gd0.2Fe11.4Si1.6Bx samples with x = 0 to 0.3 are found to increase linearly with
Figure 5.2 Thermomagnetization curves of La0.8Gd0.2Fe11.4Si1.6Bx compounds (with boron
doping level, x = 0, 0.03, 0.06, 0.2, 0.3).

77
The samples were measured on warming in a magnetic field of B = 0.02 T after first cooling
to 100 K in zero field. The increase in TC for La(Fe,Si)13 compounds with increasing B
concentration to TC = 200, 204, 205, 215 and 222 K respectively is consistent with results
reported in literature by Xie et al. [10]. Normally, the TC increases as the lattice expands, or
equivalently as the Fe - Fe distances increase. However, for Fe - rich rare - earth (RE)
compounds, TC depends mainly on the Fe - Fe and Fe – RE direct exchange interactions
which the Fe - Fe distance strongly influences [18]. In this work the BLOKJE program was
used to compute the La(8a) - Fe(96i), Fe(8b) - Fe(96i) and Fe(96i)-Fe(96i) bond lengths to
help explain the increase in TC. As expected, Table 5.1 shows the increase in bond length in
all the above mentioned bonds with an increase in boron doping, x. Thus, the observed
enhancement of TC in La0.8Gd0.2Fe11.4Si1.6Bx compounds with an increase of boron doping, x,
can be attributed to an increase in the Fe - Fe exchange interactions caused by the increasing
Fe - Fe distances.
Figure 5.3 shows the isothermal magnetization curves of La0.8Gd0.2Fe11.4Si1.6Bx (with boron
doping level, x = 0, 0.03, 0.06, 0.2 and 0. 3) over the temperature range 180 – 250 K which
span the paramagnetic to ferromagnetic transition regions. The magnetization isotherms were
measured for increasing and decreasing magnetic fields in the range ΔB = 0 – 5 T with the
PM - FM transitions evident in the behaviour of all five samples. The change in the saturation
magnetization is probably related to the presence of different amounts of the α-Fe in the
compounds. Figure 5.3 also demonstrates hysteresis for the La0.8Gd0.2Fe11.4Si1.6,
La0.8Gd0.2Fe11.4Si1.6B0.03 and La0.8Gd0.2Fe11.4Si1.6B0.06 samples compared with the insignificant
hysteresis in the La0.8Gd0.2Fe11.4Si1.6B0.2 and La0.8Gd0.2Fe11.4Si1.6B0.3 samples. These hysteretic
effects confirm the first-order nature of the magnetic transitions for the x = 0.0, 0.03 and 0.06

78
Figure 5.3 Magnetization isotherms of La0.8Gd0.2Fe11.4Si1.6Bx compounds with boron doping
level, x = 0 and 0.03measured in the field ascending and the field descending processes in a
range of temperatures around TC.
79
Figure 5.3 Magnetization isotherms of La0.8Gd0.2Fe11.4Si1.6Bx compounds with boron doping
level, x = 0.06 and 0.2 measured in the field ascending and the field descending processes in a
range of temperatures around TC.

80
Figure 5.3 Magnetization isotherms of La0.8Gd0.2Fe11.4Si1.6Bx compounds with boron doping
level, x = 0.3 measured in the field ascending and the field descending processes in a range of
temperatures around TC.
samples while the behaviour of the x = 0.2 and 0.3 samples is typical of a second order
magnetic transition. The isothermal magnetisation curves exhibit typical ferromagnetic
behaviour for all samples below their respective magnetic ordering temperatures. The
La0.8Gd0.2Fe11.4Si1.6Bx samples with boron doping level, x = 0 , 0.03 and 0.06 show S -
shaped magnetization curves typical for the itinerant electro-metamagnetism [12] while the
magnetization curves for La0.8Gd0.2Fe11.4Si1.6B0.3 are characteristic of a second order
transition. These results are confirmed by the Arrott plots in Figure 5.4. The Arrott plots were
used to determine the type of phase transition of the sample near TC according to the Inoue-

81
Shimizu model19
. In this model, the free energy (F) of a magnetic system is expressed by the
Landau expansion in powers of magnetization, M shown in Equation (5.1) below:
(5.1)
The type of transition is related to the sign of the Landau coefficient c3 (T) at the Curie
temperature (c3 (TC)). If c3 (TC) is negative, the transition is first order, otherwise the
transition will be second order. The sign of c3 (TC) can be obtained from the Arrott plots. If
there are S - shaped curves near TC in the Arrott plots, c3 (TC) is negative, otherwise, it is
positive. As seen in Figure 5.4, the La0.8Gd0.2Fe11.4Si1.6Bx samples (with boron doping level, x
= 0, 0.03, 0.06, 0.2 and 0. 3) near their respective TC exhibit S - shaped curves with negative
slopes. The negative slopes and inflection points in these three samples confirms the
occurrence of metamagnetic transitions from FM to PM state above TC, indicating that both
compounds undergo a first-order transition. This therefore means that for the low level boron
doping, the B atoms do not significantly influence the shape of the density of states around
the Fermi level and a strong IEM behaviour is still retained. However, the absence of S –

82
Figure 5.4 Arrott plots of isotherms in the vicinity of TC of La0.8Gd0.2Fe11.4Si1.6Bx compounds
with boron doping level, x = 0 and 0.03.

83
Figure 5.4 Arrott plots of isotherms in the vicinity of TC of La0.8Gd0.2Fe11.4Si1.6Bx compounds
with boron doping level, x = 0.06 and 0.2.

84
Figure 5.4 Arrott plots of isotherms in the vicinity of TC of La0.8Gd0.2Fe11.4Si1.6Bx compounds
with boron doping level, x = 0.3.
shaped curves with negative slope or an inflection point in the Arrott plot for
La0.8Gd0.2Fe11.4Si1.6B0.2 and La0.8Gd0.2Fe11.4Si1. 6B0.3 (but rather an almost linear behaviour of
the Arrott plot), confirms the occurrence of a second-order transition in these samples.
It has been shown recently that the magnetic entropy change (ΔSM) of materials with
hysteretic first order transitions should be calculated carefully using the Maxwell relation as
the value of ΔSM calculated from the increasing field differs from that calculated using the

85
decreasing field [20]. The ΔSM calculated using the increasing field has been shown to exhibit
an erroneous spike, whilst the ΔSM calculated using the decreasing field consists of a much
reduced spike with a plateau [20]. Hence, for this reason, in this work we calculated ΔSM
using the decreasing field. Thus, the magnetic entropy change (ΔSM) was calculated from the
isothermal magnetization curves close to TC using the Maxwell relation shown in Equation
(5.2) below:
∆𝑆 ∫ (𝜕
𝜕𝑇)
𝑑 (5.2)
Figure 5.5 shows the 3D plots of magnetic entropy change as a function of temperature and
magnetic field, H for La0.8Gd0.2Fe11.4Si1.6Bx compounds with boron doping level, x = 0, 0.03,
0.06, 0.2 and 0.3. Similar to what Demuner et al. observed, the ΔSM curves for the
La0.8Gd0.2Fe11.4Si1.6Bx compounds with x = 0 and 0.03 have asymmetric peaks near TC which
is attributed to the field induced metamagnetic transition above TC with the maximum
magnetic entropy changes being 14.8 and 16 J kg -1
K-1
respectively [13]. However, a further
increase in the boron doping (x = 0.03, 0.06, 0.2 and 0.3) significantly broadens the ΔSM
versus T curve and in the case for the samples with x = 0.2 and 0.3, reducing the maximum
magnetic entropy change to 7.5 and 6.6 J kg -1
K-1
respectively. This reduction in the
magnetocaloric properties is explained by the fact that the increase of B content in
La0.8Gd0.2Fe11.4Si1.6Bx drives the FM – PM transition towards second order and eliminates the
meta-magnetic transition. Also, the introduction of boron atoms leads to an increase of TC,
which results in the shift of ΔSM peaks towards higher temperatures. Thus for the
La0.8Gd0.2Fe11.4Si1.6Bx compounds, optimum boron doping occurs at low levels since the
lowly boron doped sample (x = 0.03) exhibits the highest magnetic entropy change.

86
Figure 5.5 Temperature and magnetic field dependence of the isothermal magnetic entropy
change of La0.8Gd0.2Fe11.4Si1.6Bx compounds with boron doping level, x = 0, 0.03, 0.06, 0.2,
0.3 measured at 5 T calculated from the Maxwell relation.

87
In order to assess the usefulness of the La0.8Gd0.2Fe11.4Si1.6Bx alloys as magnetic refrigerant
materials, the RCP is calculated according to equation (5.3) below:
∆𝑆 (5.3)
where is the width at half maximum obtained from the temperatures at half the
maximum peak value of the ΔSM versus T curve. The calculated results of RCP for
La0.8Gd0.2Fe11.4Si1.6Bx samples with boron level, x = 0, 0.03, 0.06, 0.2 and 0. 3 plotted as a
function of the magnetic field are shown in Figure 5.6. For all the samples, the maximum
values of RCP are found to increase with an increase in the applied magnetic field and reach
the values of 285, 361, 346, 222 and 245 J kg-1
for the La0.8Gd0.2Fe11.4Si1.6Bx samples with
boron level, x = 0, 0.03, 0.06, 0.2 and 0. 3 respectively under a field change of 0 – 5 T. This
figure, clearly illustrates the fact that the lowly doped sample (x = 0.03 and 0.06) exhibit
significantly higher RCP compared to the undoped sample, whilst the highly doped samples
(x = 0.2 and 0.3) exhibit significantly lower RCP values as compared to the undoped sample.
Table 5.1 shows the hysteresis loss, defined as the area enclosed by the ascending and
descending branches of the magnetization curve. The maximal hysteresis losses around TC
for La0.8Gd0.2Fe11.4Si1.6Bx samples with boron level, x = 0, 0.03, 0.06, 0.2 and 0. 3 are 3.7,
9.1, 5.7, 0.4 and 0.3 J kg−1
measured under a 5 T field respectively. This reduction in
hysteresis losses at high boron doping levels (i.e, x = 0.2 and 0.3) is attributed to the
weakening of the field induced first order magnetic transition (FOMT) from the
paramagnetic to the ferromagnetic state due to the addition of boron. By subtracting the
hysteresis loss from the calculated RCP, we obtained the effective refrigerant capacity, RCeff
which is also shown in Table 5.1, calculated for magnetic field values of 5 T. As boron

88
Figure 5.6 Field dependences of the refrigerant capacity for La0.8Gd0.2Fe11.4Si1.6Bx
compounds with boron doping level, x = 0, 0.03, 0.06, 0.2 and 0.3 measured at 5 T.
doping, x varies from 0 to 0.3, the RCeff shows a similar trend to that observed in the RCP.
These results indicate that the introduction of interstitial boron atoms significantly improves
the cooling capacity of the La0.8Ce0.2Fe11.4Si1.6 material system at all values of the applied
magnetic field, H
Clearly of the five samples investigated, La0.8Gd0.2Fe11.4Si1.6B0.03 is the preferred magnetic
refrigerant material as it would support the transport of the greatest amount of heat in a
practical refrigerator. Therefore, low level boron doping enhances the MCE in the
La0.8Gd0.2Fe11.4Si1.6Bx material system.

89
Table 5.2 shows a summary of the present results, as well as the MCE properties of
La1-xGdxFe11.4Si1.6 compounds with Gd and LaFe11.4Si1.6 included for comparison. The
inconsistency of the reported MCE properties is apparent even for compounds with the same
composition and is discussed in detail below. Investigation of La substitution by the rare-
earth element Gd was first reported in 2007 by Passamani et al. They found that for 5 at. %
La substituted by Gd, the first order transition is destroyed leading to a drastic reduction of its
maximum magnetic entropy change [8]. This seems to be in disagreement with the work of
Demuner et al. (2009) which shows that for 5 at. % La substituted by Gd, the magnetic
transition remains first order and the maximum magnetic entropy change remains relatively
Table 5.2 Discrepancies in the reported MCE properties of La1-xGdxFe11.4Si1.6 compounds,
measured at 5 T.
Sample Order of
transition
TC (K) -ΔSM
(J kg -1
K-1
)
RCP
(J kg -1
)
Ref
*Gd 2
nd 294 10.2 410 22
*LaFe11.4Si1.6 1
st 195 18 324 8
La0.95Gd0.05Fe11.4Si1.6 2nd
215 7 210 8
La0.95Gd0.05Fe11.4Si1.6 1st ~210 ~15 - 13
La0.8Gd0.2Fe11.4Si1.6 2nd
215 7.9 - 21
La0.8Gd0.2Fe11.4Si1.6 1st 200 14.8 285 This work
La0.8Gd0.2Fe11.4Si1.6B0.03 1st 204 16 361 This work
La0.8Gd0.2Fe11.4Si1.6B0.06 1st 205 15 346 This work
La0.8Gd0.2Fe11.4Si1.6B0.2 2nd
215 7.5 222 This work
La0.8Gd0.2Fe11.4Si1.6B0.3 2nd
222 6.6 245 This work
*These samples are shown for the purposes of comparison.

90
high [13]. In 2008, Kumar et al. investigated the MCE properties of La0.8Gd0.2Fe11.4Si1.6. This
group observed a drastic reduction in the maximum magnetic entropy change of the above
mentioned compound with the first order transition being destroyed [21]. Thus, the
discrepancies in the MCE properties of La1-xGdxFe11.4Si1.6 compounds studied by the several
groups mentioned above can be attributed to the presence of different impurities in samples
with the same composition thereby influencing the MCE properties. Also, it has been
previously established that the TC of Si based compounds is strongly dependent on the Si
content in the NaZn13-type structure, hence the discrepancy in the TC of the La1-xGdxFe11.4Si1.6
compounds in Table 2 can be attributed to the different Si content in the actual compositions
of the compounds even though they may have the same Si content in the nominal
compositions [22 – 23].
Our investigation reveals that for 20 at. % La substituted by Gd, the maximum magnetic
entropy change remains relatively high (compared to LaFe11.4Si1.6) whilst the magnetic
transition remains first order, which is in contrast to Kumar et al. [15] We then studied the
influence of boron doping on La0.8Gd0.2Fe11.4Si1.6 and our results show that at low boron
doping levels (x = 0.03 and 0.06), the TC, ΔSM and RCP are all significantly enhanced, whilst
the magnetic transition remains first order. However, at high boron doping levels (x =0.2 and
0.3), TC increases whilst both ΔSM and RCP are significantly reduced with the first transition
order being destroyed. MCE changes due to interstitial or substitutional modifications are
common in La(Fe,Si)13-based compounds due to the fact that the magnetic properties of these
compounds are dominated by the characteristics of the Fe 3d electron band structures.
Therefore, the variation of TC in these compounds is mainly associated with the lattice
constant in keeping the characteristic band structure. As reported in the Ref 24, the hydrogen

91
atoms in the interstitial positions expand the lattice parameter and in so doing, changes the
magnetic properties. So the interstitial atoms play two roles on modifying the magnetic
properties: (1) expanding the lattice parameter and (2) varying the chemical environments.
However, in the present case, unless we perform the external pressure experiment, it is
difficult to separate these roles.
5.4 Conclusions
We have investigated the effect of boron doping on the magnetic and magnetocaloric
properties of La0.8Gd0.2Fe11.4Si1.6Bx compounds (with boron doping level, x = 0, 0.03, 0.06,
0.2 and 0. 3). We have shown that the paramagnetic to ferromagnetic transition in
La0.8Gd0.2Fe11.4Si1.6Bx compounds, which is first-order for x = 0, 0.03 and 0.06 can be tuned
to second-order at high boron doping levels (x = 0.2 and 0.3). A considerable enhancement of
TC, ΔSM and RCP was observed at low boron doping levels (x = 0.03 and 0.06). Thus, at low
boron doping levels, the enhancement of MCE in La0.8Gd0.2Fe11.4Si1.6Bx alloys makes this
material system a promising candidate for magnetic refrigeration near room temperature.

92
References:
[1] V. K. Pecharsky and K. A. Gschneidner, Jr., Phys. Rev. Lett. 78, 4494 (1997).
[2] H. Wada and Y. Tanabe, Appl. Phys. Lett. 79, 3302 (2001).
[3] O. Tegus, E. Brück, K. H. Buschow and F. R. de Boer, Nature 415, 150 (2002).
[4] F. X. Hu, B. G. Shen, J. R. Sun, Z. H. Chen, G. H. Rao and X. X. Zhang, Appl. Phys.
Lett. 78, 3675 (2001).
[5] S. Gama, A. A. Coelho, A. de Campos, A. Magnus G. Carvalho and F. C.G. Gandra,
Phys. Rev. Lett. 93, 237202 (2004).
[6] K. Fukamichi, A. Fujita, S. Fujieda, J. Alloys Compd. 408 - 412, 307 (2006).
[7] E. Bruck, in Handbook of Magnetic Materials, Vol. 17, (Ed.:K. H. J. Buschow), North-
Holland, Amsterdam 2008.
[8] E.C. Passamani, A. Y. Takeuchi, A. L. Alves, A. S. Demuner, E. Favre-Nicolin, C.
Larica, and J.R. Proveti, J. Appl. Phys. 102, 093906 (2007).
[9] J. Shen, B. Gao, H.W. Zhang, F. X. Hu, Y. X. Li, J. R. Sun and B.G. Shen Appl. Phys.
Lett. 91, 142504 (2007).
[10] S. H. Xie, J. Q. Li and Y. H. Zhuang, J. Magn. Magn. Mater. 311, 589 (2007).
[11] J. M. D Coey and P. A. I. Smith, J. Magn. Magn. Mater. 200, 405 (1999).
[12] T. Goto, K. Fukamichi K and H. Yamada Physica B 300, 167 (2001).
[13] A. S. Demuner, A.Y. Takeuchi, E. C. Passamani, J. R. Proveti, C. Larica, E. Favre-
Nicolin and A.M. Gomes, J. Magn. Magn. 321, 1809 (2009).

93
[14] H. Zhang, Y. Long, Q. Cao, Ya Mudryk, M. Zou, K.A. Gschneidner and V. K.
Pecharsky, J. Magn. Magn. 322, 1710 (2010).
[15] M. Phejar, V. Paul – Boncour and L. Bessais, Intermetallics 18, 2301 (2010).
[16] M. Balli, D. Frutchart and D. Gignoux, J. Phys.: Condens. Matter 19, 236230 (2007).
[17] J. Lyubina, O. Gutfleisch, M. D. Kuz‟min and M. Richter, J. Magn. Magn. 320, 2252
(2008).
[18] D. Givord, R. Lemaire, IEEE Trans. Magn. 10, 109 (1974).
[19] J. Inoue, M. Shimizu, J. Phys. F: met. Phys. 12, 1811 (1982).
[20] A. Giguère, M. Foldeaki, B. Ravi Gopal, R. Chahine, T. K. Bose, A. Frydman and J. A.
Barclay, Phys Rev. Lett 83, 2262 (1999).
[21] P. Kumar, N. K Singh, K. G. Suresh and A. K. Nigam, Physica B 403, 1015 (2008).
[22] A. Fujita, S. Fujieda, K. Fukamichi, H. Mitamura and T. Goto, Phys. Rev. B 65, 014410
(2001).
[23] A. Fujita, S. Fujieda, Y. Hasegawa and K. Fukamichi, Phys. Rev B. 67, 104416 (2003).
[24] K. Fukamichi, A. Fujita and S. Fujieda, J Alloys Compd 408 – 412, 307 (2006).

94
CHAPTER 6
EFFECT OF BORON DOPING ON THE MAGNETOCALORIC
AND STRUCTURAL PROPERTIES OF THE La0.8Ce0.2Fe11.4Si1.6
REFRIGERANT
6.1. Introduction
Amid growing concerns regarding global warming and the ever-increasing energy
consumption which is being worsened by the current use of conventional vapour-
compression refrigeration technologies, scientists have expended a lot of research effort to
find magnetic materials with a large ambient magnetic entropy change which can be used in
magnetic refrigeration (MR) as an alternative cooling technology [1 - 5]. Magnetic materials
having a first order transition exhibit large MCEs and are thus suitable candidates for
magnetic refrigerants [6 - 8]. Of the several compounds discovered exhibiting large MCEs
with first order magnetic phase transition (FOMT), the LaFe13−xSix compounds with cubic
NaZn13-type structure are one of the most attractive because of their considerably large
MCEs and low cost. These large MCEs in LaFe13−xSix result from the itinerant-electron
metamagnetic (IEM) transition in the vicinity of the first-order phase transition temperature
[9 - 11]. However, the first order transition is usually accompanied by a considerable level of
thermal and magnetic hysteresis, bringing about hysteresis loss which is detrimental to the
refrigerant capacity. Under field or temperature cycling, this irreversibility appears as an
undesirable heating of the magnetocaloric material. To date, several studies have been done
to reduce or eliminate hysteresis in LaFe13−xSix based alloys [12 - 19]. These include a study
by Lyubina et al. in 2008 where melt spinning was shown to significantly reduce hysteresis in

95
LaFe13−xSix based alloys compared to the bulk material [20]. However, the most common
method of reducing the hysteretic losses in LaFe13−xSix based compounds is by the addition of
substitutional or interstitial atoms [12 - 19, 21 - 24]. It has been shown that partially replacing
La with Pr, Nd and Ce in LaFe13−xSix not only increases the MCE but leads also to a
significant increase in hysteresis loss in the IEM transition process [21 - 24].
As such, the control of hysteresis due to the first order transition is imperative for the
improvement in performance of magnetic refrigerants. In view of this, we have studied the
magnetic and magnetocaloric properties of boron doped La0.8Ce0.2Fe11.4Si1.6 with the main
aim of investigating the effect of boron doping on the hysteresis and consequently, the
refrigerant capacity of this material system. Since hysteretic losses add to the cost in energy
and must be considered when calculating the usefulness of a magnetic refrigerant material
when subjected to a cycling field, such a study is of paramount importance in determining the
suitability of using this material system for practical applications in room temperature
magnetic refrigerators.
6.2 Experimental details
Ingots of polycrystalline alloys with nominal compositions La0.8Ce0.2Fe11.4Si1.6Bx (x = 0, 0.03,
0.1, 0.3 and 1) were prepared by arc-melting appropriate amounts of the high purity
constituent elements under a high purity argon atmosphere in a water cooled copper crucible.
The purities of the starting materials were 99.9% for La, Si and Fe, 99.99% for Ce and
99.999% for B. 10 at. % excess La and Ce were used to compensate for the weight loss
during the arc melting. During the arc melting process, each ingot was turned over and
remelted several times to ensure its homogeneity. The resulting ingots were wrapped in
tantalum foil, annealed at 1323 K for 14 days in an evacuated quartz tube to improve the

96
crystallization of the samples and then quenched in water. The crystal structure of the
samples was determined by room temperature powder x- ray diffraction (XRD) with Cu Kα
radiation. The magnetization was measured as a function of temperature and magnetic field
for the samples and was carried out using the vibration sample magnetometer (VSM) option
of a quantum design 14 T Physical Property Measurement System (PPMS) in the temperature
range of 140 – 240 K at applied fields of up to 5T.
For the neutron diffraction experiment, the La0.8Ce0.2Fe11.4Si1.6, La0.8Ce0.2Fe11.4Si1.6B0.03 and
La0.8Ce0.2Fe11.4Si1.6B1 alloys were synthesized as described above, using a different arc
melting system. The neutron data was collected in the temperature range 10 - 350 K and in
the magnetic field range of 0 – 6 T at the high resolution powder diffractometer, Echidna at
OPAL research reactor at the Australian Nuclear Science and Technology Organization
(ANSTO) with an incident neutron wavelength of λ = 2.4177 Å.

97
6.3 Results and Discussion
6.3.1 Reduction of hysteresis losses in the magnetic refrigerant La0.8Ce0.2Fe11.4Si1.6 by the
addition of boron
Figure 6.1 X-ray diffraction patterns of the La0.8Ce0.2Fe11.4Si1.6Bx samples with x = 0, 0.1 and
0.3.
The x-ray diffraction (XRD) results, shown in Figure 6.1 indicate that all the alloys
crystallized in a single phase with the NaZn13-type cubic structure except for the presence of
a few percent of α-Fe. Subsequent magnetic measurements were performed on the three
samples namely, La0.8Ce0.2Fe11.4Si1.6, La0.8Ce0.2Fe11.4Si1.6B0.1 and La0.8Ce0.2Fe11.4Si1.6B0.3.
Fig. 6.2

98
Figure 6.2 Magnetization as a function of temperature in the ZFC and FC process for the
La0.8Ce0.2Fe11.4Si1.6Bx samples with x = 0, 0.1 and 0.3.
shows the temperature dependencies of the magnetization measured in the heating and
cooling processes under a low magnetic field of 0.02T and temperature range from 140 K to
220 K of La0.8Ce0.2Fe11.4Si1.6Bx samples with x = 0, 0.1 and 0.3. The Curie temperature, TC,
which is defined as the temperature at which the dM / dT of the heating M-T curves is a
minimum is found to increase with an increase in boron content from 174 K, 182 K and
finally to 184 K for x = 0, 0.1 and 0.3 respectively. This increase in TC with increasing boron
doping, x, can be attributed to the lattice expansion caused by the introduction of interstitial
boron atoms since previous investigations on the relation between unit cell volume and TC for
LaFe13-xSix based compounds have verified that the introduction of interstitial boron can

99
cause TC to increase through expanding the lattice of the compounds [13]. In our study, the
M-T curve for the undoped sample shows a considerable thermal hysteresis (17.4 K) which
indicates the first-order nature of this transition. However, on increasing the boron doping, x,
it is evident from Figure 6.2 that the thermal hysteresis is reduced to 12.7 K and 11.7 K for x
= 0.1 and 0.3 respectively. This implies that the boron doping in the La0.8Ce0.2Fe11.4Si1.6
material system can decrease the thermal-induced first order magnetic transition at TC.
Figure 6.3 displays the magnetization curves for the La0.8Ce0.2Fe11.4Si1.6Bx (x = 0, 0.1 and 0.3)
alloys. The sweep rate of the field is slow enough to ensure that the M-H curves are recorded
in an isothermal process. The M-H curves show a field induced metamagnetic transition. A
stepwise magnetic behaviour is observed in the vicinity of TC, signifying the coexistence of
ferromagnetic and paramagnetic phases. The first abrupt increase of magnetization marks the
contribution of the FM phase, while the subsequent step-like variation signifies the field-
induced metamagnetic transition of the PM phase to the FM phase with the inflexion point of
this step-like transitional region being the critical field value, HC. For the
La0.8Ce0.2Fe11.4Si1.6Bx samples with x = 0, 0.1 and 0.3, HC linearly depends on temperature
with a rate of 0.21, 0.20 and 0.17 T / K respectively. A similar trend was observed in
Mn0.99Fe0.01As [25]. Furthermore, the M-H curves measured under increasing and decreasing
fields exhibit significant magnetic hysteresis loops for La0.8Ce0.2Fe11.4Si1.6Bx with x = 0, 0.1
and 0.3. For each sample, the magnetization curves above TC, (= 174 K for x = 0, 181 K for
x = 0.1 and 184 K for x = 0.3) exhibit a discontinuous magnetization change with hysteresis.
It can be clearly seen that the hysteresis becomes smaller with an increase in boron doping, x.

100
Figure 6.3 The magnetization curves measured in the increasing and decreasing field for the
La0.8Ce0.2Fe11.4Si1.6Bx (x = 0, 0.1 and 0.3).

101
Figure 6.3 shows the temperature dependence of the hysteresis loss, defined as the area
enclosed by the ascending and descending branches of the magnetization curve. It can be
seen that the hysteretic losses are negligible below TC and grow rapidly to reach a maximum
around TC and then decrease with a further increase in temperature above TC. The maximal
hysteresis losses around TC are 131.5, 30.4 and 8.1 J kg -1
measured under a 5T field for x = 0,
0.1 and 0.3 respectively and are shown in Figure 6.4. The insert shows the maximum
hysteresis loss measured under a 2 T field, which is also found to decrease with an increase in
x. This result indicates the effectiveness of the interstitial boron atoms introduced into the
La0.8Ce0.2Fe11.4Si1.6 material system in depressing the hysteresis loss. This reduction in
hysteresis losses is attributed to the weakening of the field induced FOMT from the
paramagnetic to ferromagnetic state due to the addition of boron.
Figure 6.4 The temperature dependence of the hysteresis loss of La0.8Ce0.2Fe11.4Si1.6Bx for
values of x of 0, 0.1 and 0.3 measured at 2 and 5 T.

102
Figure 6.5 Arrott plots of La0.8Ce0.2Fe11.4Si1.6Bx for values of x of 0, 0.1 and 0.3.

103
Figure 6.5 shows Arrott plots of La0.8Ce0.2Fe11.4Si1.6Bx for values of x of 0, 0.1 and 0.3. It is
clear enough to see that the experimental points near TC show S – shaped curves. Such
S – shaped curves suggest the phase transitions of all three samples are first order.
The magnetic entropy changes reach maximum near their TC. In an isothermal process, the
magnetic entropy change of the materials can be derived from the Maxwell relation which is
shown below.
∆𝑆 ∆ ∆ ∫ *𝜕 𝑇
𝜕𝑇+
𝑑
(6.1)
The maximum ΔSM for La0.8Ce0.2Fe11.4Si1.6Bx samples with x = 0, 0.1 and 0.3 range from
72.2 J kg-1
K-1
to16.4 J kg-1
K-1
measured under a field of 5T and are shown in Figure 6.6. The
ΔSM for the pure La0.8Ce0.2Fe11.4Si1.6 compound derived from the Maxwell relation is in good
agreement with Ref 24. However, the presence of the ΔSM spikes shown in Figure 6.6 are a
reason for concern as their presence implies that the ΔSM predicted by the Maxwell relation
could be erroneous. Previously, Pecharsky et al., [26] showed that no ΔS spikes are expected
for a normal first order transition. Thus ΔSM is recalculated using the CC equation which is
shown below.
∆𝑆 ∆
(6.2)
Where ΔM is the difference of magnetization between the low and high field parts in the M-H
curves shown in Figure 6.3.

104
Figure 6.6 ∆SM vs T plots of La0.8Ce0.2Fe11.4Si1.6Bx for values of x of 0, 0.1 and 0.3.

105
Thus, Figure 6.7 shows a comparison of the ΔSM calculated using the CC equation and the
ΔSM predicted by the Maxwell relation. The maximum ΔSM calculated using the CC equation
for the La0.8Ce0.2Fe11.4Si1.6Bx samples with x = 0, 0.1 and 0.3 are 20.8, 12.4 and 8.9 J kg-1
K-1
respectively and similar to what Balli et al. [25] observed in Mn0.99Fe0.01As, the ΔSM peaks
for these samples derived from the CC equation are centred at slightly higher temperatures
than the MCE peaks derived from the Maxwell relation.
The efficiency or the performance of a solid-state cooling device is determined by the
magnitude of the figure-of-merit, the refrigerant capacity, RC (i.e. the heat that can be
transferred between the cold and hot reservoirs), which is calculated by numerically
Figure 6.7 Comparison of the ΔSM calculated using the Clausius-Clapeyron equation and the
ΔSM predicted by the Maxwell relation.

106
integrating the area under the ΔSM - T curve, with the integration limits being the
temperatures at half maximum of the peak. To enhance the performance of the
La0.8Ce0.2Fe11.4Si1.6 material system, we carried out a boron doping study to optimize the RC.
Tabulated values of the RC as a function of B field at 5 T calculated using ΔSM obtained
using the Maxwell relation and the Clausius-Clapeyron equation, RC (MR) and RC (CC)
respectively are shown in Table 6.1. For the La0.8Ce0.2Fe11.4Si1.6Bx alloys with x = 0 to 0.3,
both the RC (MR) and RC (CC) increase with an increase in magnetic field up to 5T. Also,
there is an increase in both the RC (MR) and RC (CC) with an increase in boron doping, x.
However, it is imperative to note that for most of the samples, the calculated RC (MR) is
significantly higher than the RC (CC). This is due to the fact that in calculating RC (MR), an
overestimated value of ΔSM, obtained from the Maxwell relation is used, thus leading to an
overestimation of RC (MR). Hence for the La0.8Ce0.2Fe11.4Si1.6Bx material system, RC (CC)
gives a reasonable estimate of the refrigerant capacity. Although La0.8Ce0.2Fe11.4Si1.6Bx
compounds exhibit high RC values, they also have a large hysteresis loss, demonstrated in
Figure 6.3, which reduces the MCE of the material.
By subtracting the hysteresis loss from the calculated RC (MR) and RC (CC), we obtained
the effective refrigerant capacities RCeff (MR) and RCeff (CC) which are shown in Table 6.1,
calculated for magnetic field values of 5 T. For the La0.8Ce0.2Fe11.4Si1.6Bx alloys as x varies
from 0 to 0.3, both the RCeff (MR) and RCeff (CC) show a similar trend to that observed in the
RC (MR) and RC (CC), with RCeff (CC) being a reasonable estimate of the effective
refrigerant capacity. These results indicate that the introduction of interstitial boron atoms
significantly improves the cooling capacity of the La0.8Ce0.2Fe11.4Si1.6 material system. Thus,

107
Table 6.1 Tabulated values of the refrigerant capacity RC (MR), RC (CC), and the effective
refrigerant capacity RCeff (MR) and RCeff (CC), at 5T for La0.8Ce0.2Fe11.4Si1.6Bx for x values of
0, 0.1, and 0.3.
Sample H RC (MR) RC (CC) RCeff (MR) RCeff (CC)
La0.8Ce0.2Fe11.4Si1.6 5 176.6 295.5 45.1 164
La0.8Ce0.2Fe11.4Si1.6B0.1 5 437.2 335.4 406.8 305
La0.8Ce0.2Fe11.4Si1.6B0.3 5 461.8 306.1 453.7 298
a proper comparison between magnetocaloric materials can be made with the use of RCeff as
opposed to simply comparing the ΔSM.
6.3.2. Neutron powder diffraction studies on La0.8Ce0.2Fe11.4Si1.6Bx alloys
Figure 6.8 Magnetization as a function of temperature in the ZFC and FC process for the
La0.8Ce0.2Fe11.4Si1.6Bx samples with x = 0 and 0.03.

108
Figure 6.8 shows the FC and ZFC magnetization obtained under a magnetic field of 0.02 T
for the La0.8Ce0.2Fe11.4Si1.6Bx samples with boron doping level, x = 0 and 0.03. The M-T
curves of both samples confirm the presence of a large amount of the α-Fe phase. Due to this
reason, it was impossible to study the effect of boron doping on the magnetic structure of the
La0.8Ce0.2Fe11.4Si1.6Bx samples. Figure 6.9 shows a Rietveld plot of the measured and
calculated neutron diffraction patterns for the La0.8Ce0.2Fe11.4Si1.6 and La0.8Ce0.2Fe11.4Si1.6B0.03
samples. The red points are the experimental data, while the solid black lines are the
calculated results. The green vertical bars indicate the peak positions that are calculated by
the refinement. The bottom blue line indicates the difference between the experimental and
Figure 6.9 Neutron powder diffraction data collected from the Echidna diffractometer
refined to the NaZn13 structure for La0.8Ce0.2Fe11.4Si1.6Bx samples with x = 0 and 0.03 at room
temperature.

109
Figure 6.10 Neutron diffraction patterns measured at 0 T, for La0.8Ce0.2Fe11.4Si1.6Bx samples
with x = 0 and 0.03, showing negative thermal expansion.
calculated results. These neutron diffraction patterns confirm that both samples crystallize in
the NaZn13 structure with a significant amount of the alpha Fe phase. The Rietveld
refinement was used to calculate the lattice parameters of the La0.8Ce0.2Fe11.4Si1.6 and
La0.8Ce0.2Fe11.4Si1.6B0.03 samples measured at different temperatures and fields, which will be
discussed in detail in the ensuing paragraphs.
Figure 6.10 shows the neutron diffraction patterns of the La0.8Ce0.2Fe11.4Si1.6 and
La0.8Ce0.2Fe11.4Si1.6B0.03 samples measured at room temperature and at zero field. For both

110
Figure 6.11 Neutron diffraction patterns measured at 200 K, for La0.8Ce0.2Fe11.4Si1.6Bx
samples with x = 0 and 0.03, showing negative magneto-elastic expansion.
samples, an increase in temperature causes the peaks in Figure 6.10 to shift to the right,
which is an indication of contraction of the unit cell. Therefore, for both samples an increase
in temperature causes a negative thermal expansion.
Figure 6.11 shows the neutron diffraction patterns of the La0.8Ce0.2Fe11.4Si1.6 and
La0.8Ce0.2Fe11.4Si1.6B0.03 samples measured at 200 K and at 0, 1 and 6 T. For both samples, the
application of a field causes the peaks in Figure 6.11 to shift to the right, which is an

111
Figure 6.12 Dependence of the lattice parameters extracted from Rietveld refinements on the
temperature measured at different magnetic fields for La0.8Ce0.2Fe11.4Si1.6Bx samples with x =
0 and 0.03.

112
indication of contraction of the unit cell. In this case, for both samples, an application of a
magnetic field gives rise to a negative-magneto-elastic expansion.
Figure 6.12 shows a dependence of the lattice parameters to the temperature for the
La0.8Ce0.2Fe11.4Si1.6 and La0.8Ce0.2Fe11.4Si1.6B0.03 samples. At 0 T, a decrease in temperature
from 300 to 200 K causes both compounds to undergo a normal thermal contraction.
However, on decreasing the temperature further from 200 K, a large volume change occurs in
the vicinity of the ferromagnetic to paramagnetic transition. In this region, a decrease in
temperature results in an expansion of the lattice parameter. Wang et al. attributed this
expansion to the spontaneous magnetostriction cancelling the normal contraction with a
decrease in temperature [25]. Therefore, in this region, the co-existence of a large volume
change as well as a spontaneous magnetostriction jump gives rise to a first order magnetic
transition. The dependence of the lattice parameters on the temperature for the
La0.8Ce0.2Fe11.4Si1.6 and La0.8Ce0.2Fe11.4Si1.6B0.03 samples at 1 and 6 T follow a similar trend to
the trend measured at 0 T described above.
6.4 CONCLUSIONS
In conclusion, we have found that large ΔSM and RC values and a small hysteresis loss can be
simultaneously achieved in the La0.8Ce0.2Fe11.4Si1.6Bx compounds. Results obtained from this
study show that the introduction of interstitial boron atoms into the La0.8Ce0.2Fe11.4Si1.6
material system could be a promising method of depressing the hysteresis loss whilst
maintaining the large MCE, since the boron containing alloys are much improved magnetic
refrigerants for near-room-temperature applications. The determination of ΔSM for
La0.8Ce0.2Fe11.4Si1.6Bx compounds using the Clausius-Clapeyron equation yields reasonable
estimates of the MCE in these compounds. Our results demonstrate that the hysteresis

113
behaviour of a material is critical in evaluating its potential as a functional magnetic
refrigerant. Also, high resolution neutron diffraction was employed to investigate the crystal
structure of the La0.8Ce0.2Fe11.4Si1.6Bx compounds. We found that, in the vicinity of the FM –
PM transition there is co-existence of a large volume change as well as a spontaneous
magnetostriction jump, which gives rise to a first order magnetic transition.

114
References
[1] V. K. Pecharsky, K. A. Gschneidner, Jr., Phys. Rev. Lett. 78, 4494 (1997).
[2] Z. B. Guo, Y. W. Du, J. S. Zhu, H. Huang, W. P. Ding, D. Feng, Phys. Rev. Lett. 78,
1142 (1997).
[3] F. X. Hu, B. G. Shen, J. R. Sun, Z. H. Cheng, G. H. Rao, X. X. Zhang, Appl. Phys. Lett.
78, 3675 (2001).
[4] H. Wada, Y. Tanabe, Appl. Phys. Lett. 79, 3302 (2001).
[5] O. Tegus, E. Bruck, K. H. J. Buschow, F. R. de Boer, Nature 415, 150 (2002).
[6] H. Wada, S. Tomekawa, M. Shiga, Cryogenics 39, 915 (1999).
[7] M. P. Annaorazov, K. A. Asatryan, G. Myalikgulyev, S. A. Nikitin, A. M. Tishin, A. L.
Tyurin, Cryogenics 32, 867 (1992).
[8] M. P. Annaorazov, S. A. Nikitin, A. L. Tyurin, K. A. Asatryan, A. Kh. Dovletov, J. Appl.
Phys. 79, 1689 (1996).
[9] H. Yamada, Phys. Rev. B 47, 11211 (1993).
[10] A. Fujita, Y. Akamatsu, K. Fukamichi, J. Appl. Phys. 85, 4756 (1999).
[11] A. Fujita, S. Fujieda, K. Fukamichi, H. Mitamura, T. Goto, Phys. Rev. B. 65, 014410
(2002).
[12] S. Fujieda, A. Fujita, K. Fukamichi, IEEE Trans. Magn. 41, 2787 (2005).
[13] S. H. Xie, J.Q. Li, Y.H. Zhuang, J. Magn. Magn. Mater. 311, 589 (2007).
[14] J. Shen, B. Gao, H.W. Zhang, F. X. Hu, Y.X . Li, J. R. Sun, B. G. Shen, Appl. Phys.
Lett. 91, 142504 (2007).
[15] J. Shen, Y. X. Li, J. Zhang, B. Gao, F. X. Hu, H. W. Zhang,Y. Z. Chen, C. B. Rong, R.
Sun, Appl. Phys. Lett. 103, 07B317 (2008).
[16] S. Fujieda, A. Fujita, K. Fukamichi, J. Magn. Magn. Mater. 321, 3567 (2009).

115
[17] B. Gao, F. X. Hu, J. Wang, J. Shen, J. R. Sun, B. G. Shen, J. Appl. Phys. 105, 07A916
(2009).
[18] J. Shen, F. Wang, J. L. Zhao, J. F. Wu, M. Q. Gong, F. X. Hu, Y. X. Li, J. R. Sun, B.G.
Shen, J. Appl. Phys. 107, 09A909 (2010).
[19] J. L. Zhao, J. Shen, F. X. Hu, Y. X. Li, J. R. Sun, B. G. Shen, J. Appl. Phys. 107, 113911
(2010).
[20] J. Lyubina, O. Gutfleisch, M. D. Kuz‟min, M. Richter, J. Magn. Magn. Mater. 320, 2252
(2008).
[21] S. Fujieda, A. Fujita, K. Fukamichi, N. Hirano, S. Nagaya, J. Alloys Compd. 408, 1165
( 2006).
[22] S. Fujieda, A. Fujita, K. Fukamichi, J. Magn. Magn. Mater. 310, e1004 (2007).
[23] D. T. Kim Anh, N. P. Thuy, N. H. Duc, T. T. Nhien, N. V. Nong, J. Magn. Magn. Mater.
262, 427 (2003).
[24] C. Xu, G. D. Li, L. G. Wang, J. Appl. Phys. 99, 123913 (2006).
[25] F.Wang, G. J. Wang, F. X. Hu, A. Kurbakov, B. G. Shen, Z. H. Cheng, J. Phys.:
Condens. Matter 15, 5269 (2003).

116
CHAPTER 7
MAGNETOCALORIC EFFECT, CRYSTAL STRUCTURE
AND CRITICAL BEHAVIOUR OF THE Mn0.94Ti0.06CoGe
ALLOY
7.1 Introduction
Materials which experience simultaneous crystallographic and magnetic phase transitions
have garnered a lot of interest owing to their promising applications as multifunctional
materials [1 – 3]. Recently, it has been reported that this magnetostructural coupling in the
MnCoGe-based materials can lead to a large magnetocaloric effect (MCE) around room
temperature [4 – 5]. Thus, the MnCoGe-related systems exhibit great potential to be used as
refrigerants in magnetic refrigeration (MR). MR is regarded as a promising, environmentally
friendly and more efficient alternative to the currently used conventional gas-compression
based refrigeration [6]. Up to now, a lot of studies have been done on the tuning of the
magnetostructural coupling in the MnCoGe system [4, 5, 7]. The parent MnCoGe compound
is a ferromagnet with a Curie temperature TC ~ 345 K which crystallizes in the orthorhombic
TiNiSi-type crystal structure (space group Pnma) at room temperature and undergoes a
diffusionless crystallographic phase transition to the high temperature hexagonal Ni2In-type
structure (space group P63/mmc) on heating at the structural transition temperature,
Tstr ~ 650 K [5, 8 – 11]. In order to modify the interatomic distances resulting in the tuning of
the magnetostructural coupling in MnCoGe compound, several different ways such as
substitutions, dopings and the application of physical pressure have been used [4, 5, 7].
We have investigated the substitution of Ti into Mn1-xTixCoGe compounds with x = 0.02,
0.04 and 0.06 and we found that for the, x = 0.06 substitution most successfully shifted the

117
structural change and magnetic phase transition into our interested temperature range leading
to the attainment of a giant magnetocaloric effect. In this chapter, we focus on the magnetic
and structural properties as well as the critical behaviour of the Mn0.94Ti0.06CoGe alloy. Thus
in an effort to understand the nature of the magnetic transition in Mn0.94Ti0.06CoGe, we
performed a critical exponent analysis in the vicinity of the ferromagnetic (FM) -
paramagnetic (PM) region [12 – 14]. In order to probe further the magnetostructural coupling
and fully understand the role of structural and magnetic transformation in enhancing the
magnetic entropy change, we performed a temperature dependent neutron diffraction
experiment over the temperature range 5 – 350 K.
7.2 Experimental details
Polycrystalline Mn1-xTixCoGe (x = 0, 0.02, 0.04 and 0.06) ingots were prepared by arc
melting the appropriate amounts of Mn (99.9%), Ti (99.999%) powder, Co (99.9%) and Ge
(99.999%) chips in an argon atmosphere. During arc melting, a 3% excess Mn over the
stoichiometric amount was added to compensate the weight loss of Mn. The polycrystalline
ingots were melted five times to achieve good homogeneity. The ingots were then wrapped in
tantalum foil, sealed in a quartz ampoule and subsequently annealed at 850 oC for 120 hours
and then quenched in water at room temperature. The magnetization measurements were
carried out using the vibration sample magnetometer option of a Quantum Design 14 T
Physical Property Measurement System (PPMS) and a Quantum Design Physical Property
Measurement System (MPMS) in the temperature range of 100 – 340 K at applied fields of
up to 5 T. For critical exponent study, magnetization isotherms were measured in the
temperature range 249 – 299 K with an interval of 2 K at applied fields of up to 5 T. Around
1 gram powder sample of the Mn0.94Ti0.06CoGe alloy was placed in a vanadium sample

118
holder, which was then fitted inside a cryocooler and then mounted on the sample stage of the
diffractometer for the neutron diffraction measurements. The neutron data was collected in
the temperature range 5 - 350 K at the high intensity powder diffractometer, Wombat at
OPAL with an incident neutron wavelength of λ = 2.4177 Å. To determine the structural
parameters the neutron diffraction patterns were analysed using Rietveld [15 – 16]
refinements with the Fullprof package.
7.3 Results and Discussion
7.3.1 Magnetic phase transitions
Temperature dependence [100 K to 340 K] of the magnetization of the Mn0.94Ti0.06CoGe
alloy measured in a magnetic field of µ0H = 0.01 T is shown in Figure 7.1. The sample was
measured on warming in a field of 0H = 0.01 T after first cooling in zero field (marked as
ZFC). The field-cooled cooling magnetization curve, FC, was then recorded on cooling from
340 K to 5 K in an applied field of 0H = 0.01 T. A decoupling of the structural and magnetic
transitions is clearly observed in the M-T curve as a two-step transition, which was later
confirmed by neutron experiment. Bayreuther et al. showed that TC determined from the
linear extrapolation of M2 (T) to M = 0 as suggested by the molecular field theory yields a
value closer to the true transition temperature as opposed to the TC determined from the
minimum of dM/dT [17]. The inset shows a plot of M2 vs T, which reveals a magnetic
transition from FM to PM at the ordering temperature, TC ~ 270 K as well as a plot of dM/dT
showing the structural transition at Tstr ~ 235 K. The absence of thermal hysteresis in the
vicinity of the magnetic PM to FM transition is a clear evidence of the second order nature

119
Figure 7.1 Temperature dependence of magnetization. The inset shows dM/dT vs T used for
the determination of Tstr as well as M2 vs T used for the determination of TC.
of this transition. However, a notable thermal hysteresis is observed in the vicinity of the
magneto-structural transition from the antiferromagnetic TiNiSi-type to the ferromagnetic
Ni2In-type structure confirming its first order nature. It has been previously established that
the presence of a small hysteresis at Tstr is indicative of a magnetoelastic character at the FM
to AFM transition [4].
7.3.2 Magnetocaloric effect
In an isothermal process, the magnetic entropy change of the materials can be derived from
the Maxwell relation as shown below:

120
∆𝑆 ∆ ∆ ∫ *𝜕 𝑇
𝜕𝑇+
𝑑
(7.1)
The magnetic entropy changes, ∆SM of materials have been calculated using the Maxwell
relation [18] and shown in Figure 7.2 (a) as a function of temperature and field. Although the
use of Maxwell‟s relation for 1st order systems is still questionable, Caron et al. successfully
established a method of determining the magnetic entropy change of 1st order systems by
using the decreasing field [19]. In our work, we have also evaluated the magnetic entropy
change, ∆SM in the decreasing field mode, which is shown by the dotted curves in
Figure 7.2(a). A comparison of the ∆SM values calculated using increasing and decreasing
fields respectively shows that the difference between these values is very small, which
confirms that there is negligible hysteresis loss occurring in the vicinity of the structural
transition thus demonstrating the applicability of the Maxwell relation. As expected, -∆SM
increases with the increase in the applied magnetic field. The inset showing the variation of
the magnetic entropy with temperature at 1 T, clearly displays two maxima, one occurring at
the structural transition and the other at the magnetic transition. Interestingly, the maximum
magnetic entropy change is found to be in the vicinity of Tstr. and is about -11.3 Jkg-1
K-1
for a
magnetic field change ∆B of 5 T, which is about one order of magnitude higher than that
found in the undoped MnCoGe (≃ 4.8 Jkg-1
K-1
at 5 T) [4]. Around the FM to PM transition
temperature TC, -∆SM is found to be about 3 Jkg-1
K-1
for a magnetic field change ∆B of 5 T.
The difference of -∆SM at Tstr. and TC can be understood in the terms of the difference in the
order of phase transitions. Compared with some alloys with second order magnetic transition,
the -∆SM peak in Mn0.94Ti0.06CoGe is comparable to that in Gd [20] (≃ 10.2 Jkg
-1K
-1 at 5 T).

121
Figure 7.2 (a) Temperature dependence of the isothermal magnetic entropy change -∆SM (T,
H) for Mn0.94Ti0.06CoGe calculated from magnetization isotherms; (b) Dependence of the
magnetic entropy change on the parameter (µ0H/TC) 2/3
. The solid line represents a linear fit
to the data.
Figure 7.2 (b) shows the dependence of the magnetic entropy change on the parameter
(µ0H/TC) 2/3
. The mean field theory predicts that in the vicinity of second-order phase

122
transitions, ∆SM is proportional to (μ0H/TC)2/3
[21 – 22]. The linear fit to the data in Figure
2(b) clearly demonstrates that the relationship ∆SM ∝ (μ0H/TC)2/3
is valid around TC.
As shown by neutron diffraction study (Figure 7.3)), the phase transition at Tstr includes the
changes in both the crystal symmetry and magnetic properties. The change of symmetry is
from the low-temperature orthorhombic TiNiSi-type structure (space group Pnma) to the
high-temperature hexagonal Ni2In-type structure (space group P63 /mmc) while the change of
magnetic properties are related to the difference of the magnetic moment for these two
phases. For the parent MnCoGe compound it was found that in the hexagonal structure, the
values of the saturation moment, MS is 2.76 B while in the orthorhombic structure with a
Figure 7.3 Neutron diffraction patterns over the temperature range 10-340 K at 10 K
intervals. Below Tstr and above TC, the neutron pattern can be indexed well with the space
group Pnma (orthorhombic structure-hkl Miller indices without*) and space group P63/mmc.

123
(hexagonal - hkl Miller indices with*), respectively. Between Tstr and TC, the pattern
indicates the coexistence of the orth. phase and the hex. phase.
higher MS =4.13 B [23]. Therefore, the entropy changes around Tstr includes both magnetic
and structural contribution while the ∆SM around TC only includes the magnetic entropy
change.
Moreover, it was found from Figure 7.3 that the structural transition around Tstr is not
complete. There is a coexistence of the orthorhombic and hexagonal structures below TC. The
phase fraction is shown as an inset in Figure 7.3. The details of refinement for neutron
patterns will be presented in the ensuing section. From the crystallographic point of view, the
TiNiSi-type unit-cell can be considered as an orthorhombic distortion of the hexagonal Ni2In-
type unit-cell. However, the chemical environment has a significant change after the structure
change. For example, at T = 235 K where the phase fraction is 65.3% for Pnma and 34.7 %
for P63/mmc. In the TiNiSi-type unit-cell, the closest distance between Mn-Mn is 2.985 Å
while in the Ni2In-type unit-cell it changes to 2.651 Å.
7.3.3 Critical exponent analysis
In an effort to further clarify the nature of the FM – PM phase transition, we performed an
analysis of the critical behaviour near TC. We measured the isothermal magnetization versus
the applied field around TC using an interval of 2 K as shown in Figure 7.4. A plot of H/M
versus M2, known as the standard Arrott plot, is shown in Figure 7.5 for the temperatures in
the vicinity of TC. According to the criterion proposed by Banerjee [24], the order of

124
magnetic transition can be determined from the slope of the isotherm plot. If the H/M versus
M2
curves show a negative slope, the transition is first order while a positive slope
corresponds to a second order transition. For the Mn0.94Ti0.06CoGe alloy, the positive slope of
the H/M versus M2
curves throughout the transition temperature indicates that the phase
transition is second order. This result is consistent with the absence of thermal hysteresis in
the vicinity of the PM – FM transition as shown in Figure 7.1, thereby confirming the second
order nature of this transition. However, a close inspection of the H2 versus M
2curves reveals
that all the curves are not parallel to each other (see the parallel dashed lines in Figure 7.5),
indicating that the critical exponents of β = 0.5 and γ = 1 are not satisfied.
Figure 7.4 Isothermal magnetization curves for Mn0.94Ti0.06CoGe in the vicinity of TC.

125
Figure 7.5 Arrott plot of M2 vs H / M at temperatures in the vicinity of TC.
The scaling hypothesis postulates that a second order magnetic phase transition near TC is
characterized by a set of critical exponents namely, β, γ and δ [25]. In this work, we have
used different methods to investigate the critical behaviour of the Mn0.94Ti0.06CoGe alloy,
namely the modified Arrott plots (MAPs), Kouvel-Fisher method, critical isotherm analysis
and the Widom scaling relation. The first method used to calculate the critical exponents is
the MAPs method, which is based on the Arrott-Noakes equation of state [26]. Quantitative
fits are made to the Arrott plots using the following equations [27].
(7.2)

126
Figure 7.6 Temperature dependence of the spontaneous magnetization MS and inverse initial
susceptibility χ0-1
(solid lines are fitted to equations (7.2) and (7.3)).
(7.3)
where M0 and h0 are constants and ε (= (T-TC)/TC) is the reduced temperature. Initial values
of β and γ are selected, then a plot of M1/β
versus (H/M)1/γ
is obtained. MS is then determined
from the intersection of the linearly extrapolated curve with the M1/β
axis. It is imperative to
note that only the high field linear region is used for the analysis because MAPs tend to
deviate from linearity at low field due to the mutually misaligned magnetic domains [28].
Next, MS is plotted as a function of temperature. To determine a similar procedure is
used in conjunction with the (H/M)1/γ
axis. The values of and MS (T) are plotted as
a function of temperature in Figure 7.6 and these plots are then fitted with equations (7.2) and

127
Figure 7.7 Modified arrott plot obtained by the Kouvel - Fisher method showing isotherms of
vs
with the calculated and .
(7.3), thus obtaining values of β and γ. These new critical exponent values are then used to
construct new MAPs. These steps are repeated until the iterations converge to the optimum β,
γ and TC values. Using equations (7.2) and (7.3), the MAPs shown in Figure 7.6 yielded
critical parameters, β = 0.61 ± 0.04 and γ = 0.91 ± 0.02. The modified Arrott plots are drawn
in Figure 7.7 which shows clearly that all lines are parallel to each other (dashed lines as an
eye guide).

128
The Kouvel - Fisher method which makes use of the equations (7.4) and (7.5) shown below,
is a more accurate way of determining the critical exponents β and γ [29].
𝑇
𝑇 𝑇
(7.4)
𝑇
𝑇 𝑇
𝑇 𝑇
(7.5)
According to the equations (7.4) and (7.5), plotting [𝑑 𝑑 ] and
[𝑑
𝑑 ] versus temperature yields straight lines with slopes of 1/β and 1/γ respectively as
shown in Figure 7.8. The value of TC is obtained from the intercepts on the x-axis. The
critical exponents β and γ as well as TC obtained using the Kouvel-Fisher method are β = 0.61
± 0.04, TC = 276 K and γ = 0.91 ± 0.03, TC = 275 K. A comparison of the critical exponents β
and γ obtained using the MAPs and those obtained using the KF method reveals that these
values match extremely well. The value of the critical component δ can be determined
directly from the critical isotherm M(TC, H) according to equation (7.6) below.
CT TTDHMC
,0,/1
(7.6)
Figure 7.9 shows the magnetic field dependence of magnetization at TC = 275 K for the

129
Figure 7.8 Kouvel-Fisher plot for the spontaneous magnetization and the inverse
initial susceptibility (T) (solid lines are fitted to equations (7.4) and (7.5)).
Figure 7.9 The critical isotherm analysis at TC .The inset shows the same plots on the log –
log scale (solid line is a linear fit to Equation (7.6)).

130
Mn0.94Ti0.06CoGe alloy. The insert shows the critical isotherm on a log – log scale. From
equation (7.6) a plot of log (M) versus log (H) is expected be a straight line with slope 1/δ.
The obtained δ value from the critical isotherm is 2.59. Another way of obtaining the critical
component δ is by using the Widom scaling relation shown in equation (7.7):
(7.7)
Using equation (7.6) and the critical parameters β and γ obtained using the MAPs and those
obtained using the Kouvel-Fisher method, the deduced δ values are 2.52 and 2.49
respectively. Thus, the Widom scaling relation has confirmed the reliability of the critical
exponents deduced from the experimental data. The reliability of the calculated exponents β
and γ can be confirmed by using the scaling theory. In the critical region, according to the
scaling theory, the magnetic equation of state can be written as:
M (H, ε) = εβf ± (H / ε
β+γ) (7.8)
Where ε is the reduced temperature (T – TC) / TC and f+ and f- are regular analytical functions
above and below TC respectively. Using β and γ obtained from the Kouvel-Fisher method, the
plots of M / εβ versus H / ε
(β+γ) (shown in Figure 7.10) yield two universal curves, one for
temperatures above TC and the other one for temperatures below TC, in agreement with the
scaling theory. This therefore confirms that the obtained values of the critical components as
well as the TC are reliable and in agreement with the scaling hypothesis.

131
Figure 7.10 Scaling plots indicating universal curves below and above TC for the
Mn0.94Ti0.06CoGe alloy.
It is well accepted that the order parameter of phase transition around magnetic transition
temperature is fluctuating on all available length scales and those fluctuations smear out the
microscopic details of the interactions in the continuous phase transition system [30]. The
mean field interaction model for long range ordering has theoretical critical exponents of β
= 0.5, γ = 1.0 and δ = 3.0 [31]
while the theoretical values based on the three dimensional
Heisenberg model corresponding to short range interactions are β = 0.365, γ = 1.386 and
δ =4.80 [32]. The δ, β, γ values derived for the Mn0.94Ti0.06CoGe alloy are close to the mean
field values, thus indicating that long range interactions dominate the critical behavior around
TC in this compound. Thus, the critical behaviour analysis in the vicinity of TC determined
that the magnetism of the Mn0.94Ti0.06CoGe alloy is governed by long range interactions,

132
which is in agreement with the linear fit to the data in Figure 7.2 (b) which clearly
demonstrates that the relationship ∆SM ∝ (μ0H/TC)2/3
is valid around TC..
7.3.4 Neutron diffraction
A temperature dependent neutron diffraction image for selected 2 region is shown in Figure
7.11 with the orthorhombic phase (hkl) Miller indices (space group Pnma) being marked
without * and the hexagonal phase (hkl) Miller indices (space group P63/mmc) with *. It can
be seen clearly that with increasing temperature one structure transition takes place starting
Figure 7.11 Neutron diffraction image for Mn0.94Ti0.06CoGe taken at 5 K steps over the
temperature range 5 - 350 K.
from around 220 K and completing at 270 K, which agrees well with our magnetic study
measurements (discussed above) revealing a phase transition at approximately 235 K.

133
Compared with the parent MnCoGe compound where the structure change occurring at Tstr
650 K, the substitution of 6 percent Ti for Mn leads to a significant reduction in Tstr. In order
to show the transition clearly, we draw the neutron diffraction patterns at selected
temperatures (T = 200 K, 245 K and 350 K) in Figure 7.12.
It can be seen from Figure 7.12 that at 200 K the compound crystallizes in the orthorhombic
TiNiSi-type structure (space group Pnma) while at 350 K the crystal structure changes to the
hexagonal Ni2In-type (space group P63/mmc). At 245 K, there is a co-existence of both
phases, thus confirming our expectations from magnetic measurements. Further analysis of
the neutron diffraction data using the Rietveld refinement resulted in the determination of the
lattice parameters as well as the volume phase fractions for the orthorhombic and hexagonal
phases. Figure 7.13 shows the evolution of the orthorhombic and hexagonal phase fractions
as a function of temperature. The volume phase fractions as a function of temperature have
been fitted using the sigmoidal Boltzmann equation shown in Equation (7.91) below:
*𝑇 𝑇
𝑇+ , (7.9)
where represents the temperature dependence of the orthorhombic or hexagonal phase
fraction with T1 = 0 K and T2 = +∞, Tstr is the transition temperature and dT is the
temperature width of the transition.

134
Figure 7.12 Measured and calculated neutron diffraction patterns for the Mn0.94Ti0.06CoGe
alloy at 200 K, 245 K and 350 K. The points (marked by crosses) are the experimental data
while the solid lines are the calculated results. The vertical bars indicate the peak positions
that are calculated by the refinement and the bottom solid line indicates the difference
between the experimental and the calculated results.

135
Figure 7.13 Quantitative phase analysis of the orthorhombic TiNiSi-type phase (space group
Pnma) and the hexagonal Ni2In-type phase (space group P63/mmc).
Table 7.1 Tabulated values of the numerical coefficients and representing the
fitted orthorhombic and hexagonal phase fractions at T1 = 0 K and T2 = +∞ determined from
the sigmoidal Boltzmann fit.
Phase
Pnma 98.8 ± 1.59 6.99 ± 1.87
P63/mmc 1.2 ± 1.59 93.01 ± 1.87

136
Figure 7.14 The peak intensity as a function of temperature for the (002)* and (011) peaks.
The numerical coefficients and representing the fitted orthorhombic and
hexagonal phase fractions at T1 and T2 are listed in Table 7.1. The orthorhombic and
hexagonal phase fractions represented by the fitting coefficients and are 98.8
and 6.99 as well as 1.2 and 93.01 vol. % respectively. The orthorhombic phase fraction
determined from the neutron diffraction pattern measured at 5 K is approximately 100 vol. %
which is in excellent agreement to the value of 98.8 ± 1.59 determined from the
sigmoidal Boltzmann fit.
The peak intensities of the selected reflections (002)* (for P63/mmc) and the (011) (for Pnma)
as a function of temperature are shown in Figure 7.14. The peak intensity of the (011)
reflection which decreases with an increase in temperature corresponds to the decrease of the

137
Pnma phase fraction whilst the peak intensity of the (002)* reflection which increases with an
increase in temperature corresponds to the increase of the P63/mmc phase fraction with
temperature. Figure 7.15 shows the refined structural parameters of the Mn0.94Ti0.06CoGe
compound as a function of temperature from neutron diffraction data. The lattice parameters
and volumes between these two structures can be described by a = aortho = chex, b = bortho =
ahex, c = cortho = √3ahex, and V = Vortho = 2Vhex [33 - 34]. The lattice parameter b, indicates the
exchange interaction between the Mn-Mn moments along this axis and a change in this
parameter strongly influences the Curie temperature. Around the structural transition
temperature, Tstr ~ 235 K, it is clearly evident in Figure 7.15 that when the symmetry changes
from orthorhombic to hexagonal, there is a large volume change (V=1/2Vorth-Vhex=2.65 Å3
so approximately V/V=3.45%). By comparison, Kanomata et al.
[9] estimated the
difference in the unit cell volume at Tstr V ~ 3 Å3 for the MnCoGe alloy. For first order
magnetic phase transitions it is assumed that the total field-induced magnetic entropy change
∆Stot can be expressed as the sum of the conventional second-order magnetic entropy change
(∆SM) and the entropy differences of the two different crystallographic polymorphs (∆Sst), i.e.
∆Stot =∆SM + ∆Sst. It was reported that the structural entropies are proportional to the volume
differences of the phases involved in the transition [35]. Such a difference in the volume
change around Tstr for Mn0.94Ti0.06CoGe will lead to a significant structural entropy change
then resulting in the total magnetic entropy change.

138
Figure 7.15 Volume and lattice parameters as a function of temperature. Open symbols
denote the orthorhombic phase, closed symbols denote the hexagonal phase and half-filled
symbols denote the corresponding phases in the mixed phase region.

139
Moreover, around Tstr the closest distance between Mn-Mn is determined to be 2.985 Å in the
TiNiSi-type unit-cell while it changes to 2.651 Å in the Ni2In-type unit-cell. The bond lengths
were calculated using the BLOKJE program [36]. According to Goodenough‟s theory which
explains the localized character of the magnetic moment in alloys, in the Mn0.94Ti0.06CoGe
compound, the moment is carried by the Mn and Co atoms [37]. At 5 K the calculated
saturation moments µMn and µCo are 2.86 and 1.63 µB respectively with µMn=2.76 and
µCo=1.68 µB at 200 K. At 245 K we have two phases co-existing and too many parameters
causing the refinement to become unstable so we have to make assumption. If we assume that
the magnetic moments for Mn and Co atoms for the Pnma phase do not change between 200
K and 245 K, then the derived values of µMn and µCo for P63/mmc at 245 K are 1.0 and 1.3
µB, respectively.
At 200 K in the TiNiSi-type unit-cell, the closest distance between Mn-Mn is 2.984 Å while
at 345 K in the Ni2In-type unit-cell the closest distance between Mn-Mn changes to 2.658 Å.
In this work, the quality of the obtained neutron data was such that the calculated magnetic
moment for the hexagonal phase was unreliable. If we assume that the magnetic moments for
Mn and Co atoms for the Pnma phase do not change between 200 K and 245 K , the derived
values of µMn and µCo for P63/mmc at 245 K are 1.0 and 1.3 µB, respectively. The reduction
of the saturation moment is expected in the hexagonal phase compared with the orthorhombic
phase [38]. Fig.7.16 (a) shows the isothermal magnetization curves measured in the vicinity
of Tstr and TC for the Mn0.94Ti0.06CoGe compound in increasing field up to 8T. The figure
clearly displays two transitions as marked by arrows and a significant hysteresis in the
vicinity of Tstr. Also, it can be clearly seen that there is a gradual drop in magnetization
around Tstr with temperature. This large change in magnetization in the vicinity of Tstr implies
that the magnetic state also significantly changes when the structure changes, which is

140
Figure 7.16 (a) Field dependences of magnetization of the Mn0.94Ti0.06CoGe compound
measured in the vicinity of Tstr and TC with increasing field up to 8T. (b) Dependence of the
magnetic entropy change at the structural transition temperature Tstr and magnetic phase
transition temperature TC on the parameter (µ0H/TC) 2/3
. The solid line represents a linear fit
to the data.
expected to contribute to the large magnetic entropy change near this transition. It is clear
that the structural transition at Tstr ~ 235 K, Tstr accompanied with the modification of
magnetic properties indicates the existence of strong magneto-structural coupling, similar to
what was observed by Samanta et. al.[39]. It is clearly evident in Figure 7.16 (b), that the
change of the peak of the magnetic entropy change is steep at Tstr, whilst that at TC is gradual,
meaning that a prominent peak in ∆SM would be expected in the vicinity of Tstr. The transition
at Tstr. is 1st order whilst that at TC is 2
nd order and the entropy changes around Tstr includes
both magnetic and structural contribution while the ∆SM around TC only includes the
magnetic contribution. Also, the difference of -∆SM at Tstr. and TC can be understood in the
terms of the difference in the order of phase transitions.

141
So, the observed giant MCE around Tstr (approximately 18 J/kg K for ∆B= 8 T) in the
Mn0.94Ti0.06CoGe compound can be attributed to the combined effect of an abrupt change in
magnetization as well as volume in the vicinity of the structural transition (structural entropy
change).
7.4. Conclusions
A giant MCE associated around 235 K has been observed for Mn0.94Ti0.06CoGe alloy which
has been found to be related to a first-order structural transformation. The giant MCE values
are comparable with those reported for materials that exhibit a giant MCE in this temperature
range. An excellent agreement of the critical exponents of the Mn0.94Ti0.06CoGe alloy
determined using the isothermal magnetization in the vicinity of TC based on various
techniques such as the Kouvel-Fisher method, the modified Arrott plot as well as the critical
isotherm was obtained. Moreover, all critical exponents fulfil the Widom scaling law. The
validity of the calculated critical components was confirmed by the scaling equation with the
obtained magnetization, field and temperature data below and above TC collapsing into two
different curves. Thus, the scaling of the magnetization data above and below TC obtained
using the respective critical exponents and the consistency in the values of the critical
exponents determined by different methods confirm that our calculated exponents are
unambiguous and intrinsic. The determined critical exponents are close to those predicted by
the mean-field theory, with long range interactions.
The lattice parameters as well as volume phase fractions for the orthorhombic and hexagonal
phases of the Mn0.94Ti0.06CoGe alloy have been determined from neutron powder diffraction
data measured in the temperature range 5 – 350 K using Rietveld refinement. The volume

142
phase fractions as a function of temperature were fitted using the sigmoidal Boltzmann
equation and the numerical coefficients and representing the fitted orthorhombic
and hexagonal phase fractions at T1 = 0 K and T2 = +∞ were determined. A large volume
change ∆V/V= 3.45% was detected at the structural transition Tstr ~ 235 K with a significant
drop in magnetization being observed. Both changes in crystal structure and magnetization
around Tstr are found to contribute to the larger magnetocaloric effects determined.

143
References
[1] C. B. Rong and J. P. Liu, Appl. Phys. Lett. 90, 222504 (2007).
[2] H. Fjellvåg and A. F. Andresen, J. Magn. Magn. Mater. 50, 291 (1985).
[3] H. Wada and Y. Tanabe, Appl. Phys. Lett. 79, 3302 (2001).
[4] N. T. Trung, V. Biharie, L. Zhang, L. Caron, K. H. J. Buschow, and E. Bruck, Appl. Phys.
Lett. 96, 162507 (2010).
[5] N. T. Trung, L. Zhang, L. Caron, K. H. J. Buschow, and E. Bruck, Appl. Phys. Lett. 96,
172504 (2010).
[6] V. K. Pecharsky and K. A. Gschneidner, Phys. Rev. Lett. 78, 4494 (1997).
[7] L. Caron, N. T. Trung, E. Bruck, Phys. Rev. B 84, 020414(R) (2011).
[8] O. Beckman and L. Lundgen, Handbook of Magnetic Materials, Vol. 6 (Elsevier,
Amsterdam, 1991), pp. 181 – 287.
[9] T. Kanomata, H. Ishigaki, T. Suzuki, H. Yoshida, S. Abe, and T. Kaneko, J. Magn. Magn.
Mater. 140 – 144, 131 (1995).
[10] E. Bruck, O. Tegus, D. T. Cam Thanh, Nguyen T. Trung, K. H. J. Buschow, Int. J.
Refrig. 31, 767 (2008).
[11] J. B. A. Hamer, R. Daou, S. Ozcan, N. D. Mathur, D. J. Fray, and K. G. Sanderman, J.
Magn. Magn. Mater. 321, 3535 (2009).
[12] I. K. Ghosh, C. J. Lobb, R. L. Greene, S. G. Karabashev, D. A. Shulyatev, A. A.
Arsenov and Y. Mukovskii, Phys. Rev. Lett. 81, 4740 (1998).

144
[13] J. Y. Fan, L. S. Ling, B. Hong, L. Zhang, L. Pi, and Y. H. Zhang, Phys. Rev. B 81, 14
4426 (2010).
[14] R. Cabassi, F. Bolzoni, A. Gauzzi and F. Licci, Phys. Rev. B 74, 184425 (2006).
[15] H. M. Rietveld Acta Cryst. 22, 151 (1967).
[16] H. M. Rietveld Acta Cryst. 2, 65 (1969).
[17] G. Bayreuther, F. Bensch, V. Kottler, J. Appl. Phys. 79(8), 4509 (1996).
[18] N. A De. Oliveira, P. J. Von Ranke Phys. Rev. B 77 (21), 1 (2008).
[19] L. Caron, Z.Q.Ou, T.T.Nguyen, D.T.Cam Thanh , O.Tegus , E.Bruck, J. Magn. Magn.
Mater. 321, 3559 (2009).
[20] A. M. Tishin, K. A. Gschneidner, V. K. Pecharsky, Physical Review B 59, 503 (1999).
[21] J. L. Wang, S. J. Campbell, R. Zeng, C. K. Poh, S. X. Dou, J. Appl. Phys.105, 07A909
(2009).
[22] H. Oesterreicher and F. T. Parker, J. Appl. Phys. 55, 4334 (1984).
[23] S. Lin, O. Tegus, E. Brück, W. Dagula, T. J. Gortenmulder, and K. H. J. Buschow, IEEE
Trans. Magn. 42, 3776 (2006).
[24] S. K. Banerjee, Phys. Lett. 12, 16 (1964).

145
[25] H. E. Stanley, Introduction to Phase Transitions and Critical Phenomena (Oxford
University Press, London, 1971).
[26] A. Arrott and J. E. Noakes, Phys. Rev. Lett. 19, 786 (1967).
[27] M. Sahana, U. K. Rossler, N. Ghosh, S. Elizabeth, H. L. Bhat, K. Dorr, D. Eckert, M.
Wolf, and K. -. Muller, Phys. Rev. B 68, 144408 (2003).
[28] A. Aharoni, Introduction to the Theory of Ferromagnetism (Oxford University Press,
New York, 1971).
[29] J. S. Kouvel, M. E. Fisher, Physical Review B 136, A1626 (1964).
[30] M. Ahlberg, P. Korelis, G. Andersson, and B. Hjorvarsson, Physical Review B 85,
224425 (2012).
[31] V. Franco, A. Conde, E. J. M. Romero, J. S. Blazquez, J. Phys: Condens. Matter 20
285207 (2008).
[32] S. N. Kaul J. Magn. Magn. Mater. 53 (5) (1985).
[33] J.T. Wang, D. S. Wang, C. Chen, O. Nashima, T. Kanomata, H. Mizuseki and Y.
Kawazoe Appl. Phys. Lett., 89, 262504 (2006).
[34] K. Koyama, M. Sakai, T. Kanomata, K. Watanabe, Jpn. J. Appl. Phys. 43 (Part 1),
8036 (2004).
[35] K. A. Gschneidner, Jr., Y. Mudryk and V.K. Pecharsky, Scripta Materialia 67, 572
(2012).
[36] L. Gelato, J. Appl. Crystallogr., 14, 151 (1981).

146
[37] J. B. Goodenough, J. Solid State Chem. 7, 428 (1973).
[38] S. Kaprzyk and S. Niziol, J. Magn. Magn. Mater. 87, 267 (1990).
[39] T. Samanta, I. Dubenko, A. Quetz, S. Stadler and N. Ali. J. Magn. Magn. Mater. 330, 88
(2013).

147
CHAPTER 8
HIGH PRESSURE SYNCHROTRON X-RAY DIFFRACTION
STUDY OF THE Mn0.94Ti0.06CoGe ALLOY
8.1 Introduction
Normally, chemical pressure is used to simultaneously tune separate magnetic and
crystallographic transitions to coincide, to give rise to a coupled first order magnetic
transition. Unlike, the chemical pressure, physical pressure does not suffer from parasitic
effects originating in the substitution itself, since it retains the composition and purity of the
sample. Thus hydrostatic pressure provides a clean way of probing the spin-lattice coupling
and is useful in elucidating the effects of chemical pressure. Previous studies have
demonstrated successfully that the pressure tuning of MCE in certain magnetocaloric
materials is an effective way of improving magnetic refrigeration [1 - 2]. The major aim of
this work, however, is to study the stability of the different crystallographic structures under
an applied hydrostatic pressure. In this work, we intend to probe the response of the structural
transition to the applied hydrostatic pressure. A thorough understanding of this response will
enable us to determine the exact pressure which gives us a structural transition occurring at
the same temperature as the magnetic phase transition. Hence this will be of paramount
importance in the design of novel magnetic refrigerants with magnetostructural couplings.
Generally, in high pressure experiments the investigated sample sizes are normally very small
since high pressure can only be generated within small anvil cells. However, a small sample
volume results in a low count rate in an x-ray scattering experiment. Therefore, in this work

148
synchrotron radiation has been essential in obtaining high resolution powder diffraction data
using the diamond-anvil cell, which is impossible using typical laboratory diffractometers.
Thus, it is has been efficient to perform this high pressure x-ray diffraction experiment at the
Australian Synchrotron light source where the incoming photon flux is orders of magnitude
higher than that of a typical laboratory diffractometer.
Figure 8.1 Experimental set-up of the high pressure x-ray powder diffraction experiment.
8.2 Experimental details
High-pressure X-ray diffraction was performed at the Powder Diffraction beamline at the
Australian Synchrotron using a gasketed diamond anvil cell (DAC). The experimental set-up
for a high-pressure X-ray powder diffraction experiment is represented in Figure 8.1. The
DAC utilised in this work was based on developments by Merrill and Bassett in 1974 [3]. A
photograph of the Merrill-Bassett diamond-anvil cell is shown in Figure 8.2. The DAC is
small in size (~ 5 cm in diameter) and operates on a simple principle. A metallic gasket, with
a hole in the middle, is compressed between the two small flat faces of the diamond anvils.
When a force (generated by tightening the screws shown in Figure 8.2) is applied over this
small area, high pressures are generated within the gasket hole, which is filled with a 4:1
methanol- ethanol mixture acting as a pressure transmitting medium. The limit of the pressure
one can produce depends on many factors such as the strength and shape of the diamonds, the

149
type of gasket used and the ability of the cell to withstand the applied stress. The Merrill-
Bassett diamond anvil cell is small enough to fit on a standard goniometer head, and it can be
used on a normal diffractometer.
Figure 8.2 Merrill-Basset Diamond Anvil Cell.
8.2.1 Diamond Anvil Cell
A schematic diagram of the diamond anvil cell is shown in Figure 8.3. The DAC consists of
four (4) main components:
1. The force generating device
The Merrill-Bassett diamond anvil cell has a casing with the screws. Tightening of these
screws moves the casings and the diamonds closer together and builds pressure.
2. The two opposing diamonds in between which the pressure is created
The diamonds used are high quality flawless diamonds whose tips are cut and polished.
They are placed perfectly parallel to each other in order to produce uniform pressure.

150
Figure 8.3 Schematic diagram of a diamond anvil cell.
3. The gasket
The gasket which is made of a thin tungsten foil (~ 0.2 mm thickness at ambient pressure)
separates the diamonds. A photograph of a gasket similar to the one used in this
experiment is shown in Figure 8.4. The main role of the gasket is to contain the sample,
Figure 8.4 Tungsten gasket with a drilled hole acting as the sample cavity.
151
ruby pieces (acting as pressure calibrants) and the pressure transmitting medium in the
drilled hole.
4. Pressure transmitting medium
A 4:1 methanol-ethanol mixture was loaded additionally into the cavity to act as pressure
transmitting medium. It should be noted in Figure 8.3 that the sample and ruby piece are
completely immersed in the pressure transmitting medium.
8.2.2 Sample preparation and Loading
For the sample preparation, three elements are needed which are, the pressure transmitting
medium, the pressure calibrant (small ruby chips) and the material of interest which in this
case, is the Mn0.94Ti0.06CoGe alloy. The samples used in these high pressure measurements
are very small in size usually less than 1 µm in diameter. The tiny sample is initially loaded
into the gasket hole along with two small chips of ruby. Great care must be taken in order to
avoid flushing out either the sample or the ruby chips during the subsequent flooding of the
sample chamber with the pressure transmitting medium. Also, it is imperative to ensure that
the gasket does not impinge on the sample or the ruby pieces so as to avoid additional
stresses being applied either to the sample or ruby pieces upon gasket extrusion, which would
result in sample destruction or “pinching” of ruby chips which introduces uncertainty in the
pressure calibration.
8.2.3 Pressure Determination
The ruby fluorescence method is the most commonly used method for the determination of
pressure in DACs. This method uses the known pressure dependence of the wavelengths of
the R1 and R2 lines of ruby. Small ruby chips are enclosed in the sample chamber during the

152
sample preparation as described above. These ruby chips are excited by an Ar+ laser. One of
the ruby chips in the sample chamber is focused under a microscope and the laser light is
injected. The signal coming from the ruby is sent through a fibre optic cable to a grating
spectrometer where it is spectrally analyzed and amplified by a photo multiplier. The signal is
then recorded by a computer. At ambient pressure, the R1 and R2 lines of ruby are found at
694.25 and 692.70 nm respectively. With increasing pressure they are shifted to higher wave
lengths. Since the intensity of the R1 line is much higher than that of the R2 line the R1 line is
used for pressure determination. This is done by determination of its wavelength and
calculation of the pressure using equation 8.1 below:
(((∆
) )
) (8.1)
where ∆λ = λ − λ0 is the difference between the determined wave length λ under pressure and
the wave length λ0 at ambient pressure. Mao et al. were able to derive the pressure
dependence (Equation 8.1) of the wave length of the R1 line of ruby by performing x-ray
diffraction on Ag, Co, Mo, and Pd and measuring the volumes of the unit cells of these
metals and by using their compressibility[4 – 6] .
8.3 Results and Discussion
The data presented herein was collected at the high resolution Powder Diffraction beamline
(PD) at the Australian Synchrotron. Data is collected on an image plate detector (Mar345)
and is processed according to the procedure outlined in the ensuing section.

153
8.3.1 Data Reduction of Image Plate Data Using FIT2D
The powder diffraction data was recorded using a 2-dimensional (2D) Mar345 detector. 2D
powder diffraction image data were generated during the experiment and are shown in Figure
8.5.
Figure 8.5 Powder diffraction image data recorded using a 2D Mar345 detector.

154
Figure 8.5 Powder diffraction image data recorded using a 2D Mar345 detector.

155
Figure 8.5 Powder diffraction image data recorded using a 2D Mar345 detector.
In order to perform Rietveld refinements of the powder diffraction data using the Fullprof
software to obtain the lattice parameters, the 2D powder diffraction data must be converted to
a series of one- dimensional (1D) powder patterns. For this process, the Fit2D software
program was used [7]. This program allowed for the detector calibration and integration of
powder diffraction data from 2D to 1D 2θ scans. The data reduction is performed by first
loading the image plate data using Fit2D. The z-scaling is set to weak peaks in order to make
the image plate data more visible in order to see enough details. Finally, the masking of the
beam mask and other intense single-crystal reflections from the diamond and ruby. A
schematic illustrating the stages of data reduction is shown in Figure 8.6. The raw image
collected on the Mar345 detector is shown in (a). The concentric rings correspond to the
diffracted intensities from the sample; the several dark spots in the image are intense diamond
reflections from the DAC. This can be masked to avoid contamination of the sample
diffraction pattern. The masking process is shown in Figure 8.6 (b) with the red regions being
the masked regions. Figure 8.6 (c) shows the integrated 1D data. The large background

156
common to such data collections is due to the inelastic Compton scattering from the
diamonds and is subtracted prior to data refinement.
Figure 8.6 A schematic illustrating stages of data reduction.

157
8.3.2 Effect of Pressure on Structural Properties
Figure 8.7 Evolution of powder diffraction patterns for the Mn0.94Ti0.06CoGe alloy at selected
pressures.
Figure 8.7 shows a series of diffraction patterns of the Mn0.94Ti0.06CoGe alloy collected at
different pressures. At ambient pressure all peaks can be indexed according to the hexagonal
Ni2In-type structure (space group P63/mmc). As can be seen in Figure 8.7, with increasing
pressure, the peaks shift to the right due to contraction of the lattice. On closer inspection, the
peaks appear to start broadening with an increase in pressure. There are no indications of a
phase transition and the signatures of the orthorhombic phase persist in the entire range of our
measurements.

158
Figure 8.8 Evolution of structural parameters for the Mn0.94Ti0.06CoGe alloy with pressure.
The dashed line through the data points is a guide to the eye.
The application of pressure modifies the structural parameters and Figure 8.8 shows the
evolution of structural parameters for the Mn0.94Ti0.06CoGe alloy with pressure. It is clear
from Figure 8.8 that the lattice parameters a and c, monotonically decrease in the entire range

159
of our measurements. The fact that both lattice parameters a and c exhibit a similar
monotonic pressure dependence, indicates the absence of substantial anisotropy in the
compressibility along a and c. The pressure dependence of the volume does not include any
discontinuity, confirming that there is no phase transition occurring in the entire range of our
measurements. In an effort to probe further the anisotropy, we investigated the pressure
dependence of the c/a ratio, shown in Figure 8.9. This figure shows that there is a decrease of
c/a ratio with pressure in the entire range of our measurements. The absence of a sudden
jump in the c/a ratio with pressure confirms that there is no structural phase transition
occurring in the entire range of our measurements.
Figure 8.9 c/a ratio versus pressure for the Mn0.94Ti0.06CoGe alloy. The dashed line through
the data points is a guide to the eye.

160
Unit cell dimensions were derived by Le Bail fitting to the observed powder diffraction
patterns by means of the general structure analysis system using FULLPROF [8]. The
experimental pressure – volume data for the Mn0.94Ti0.06CoGe alloy were fitted to a
Murnaghan equation of state (EOS) [5]:
[
] (8.1)
where V0, B0 and B′ are the volume, bulk modulus at its first derivative at ambient pressure.
The experimental pressure – volume data was also fitted using a third order Birch –
Murnaghan EOS shown below:
[
] { [ ]} (8.2)
The bulk modulus (B0) and its pressure derivative (B′) were extracted by fitting the
experimentally observed pressure versus volume data to;
i. the Murnaghan EOS.
ii. the third order Birch – Murnaghan EOS (using a constrained value of B′ ).
iii. the third order Birch – Murnaghan EOS (using an unconstrained value of B′ ).
In all three cases, the fitting was done using the computer program EOS - FIT V5.2 [9]. As an
input to the program, initial values of V0 = 68.14 Å3 as well B0 = 140 GPa were used. It
should be noted that the extraction of the EOS parameters using the Murnaghan EOS was for

161
comparative purposes only. However, the use of the third order Birch – Murnaghan EOS for
the determination of the EOS parameters for the Mn0.94Ti0.06CoGe alloy is justified since this
equation provides an excellent description of the compression of most solids [10 – 13]. The
pressure – volume data has been analysed first by assuming and fixing B′ to be 4, and
secondly by allowing B′ to be 4 to vary during the fitting process. The value of B
′ = 4 has
been experimentally shown to reproduce compression data for a wide variety of substances
[14]. The refined values of B0 and B′ are shown in Table 8.1. In this case, the use of the
unconstrained value of B′ determined the bulk modulus to be B0 = 222.64 ± 36.9. The
uncertainty in the determined B0 is too large, therefore we consider the fit with B′ fixed at 4,
to yield the best value for the bulk modulus which is determined to be B0 = 231.72 ± 7.79. It
also worth noting that the EOS parameters determined using the Murnaghan EOS are a close
match to those determined using the third order Birch – Murnaghan EOS (using a constrained
value of B′ ).
Table 8.1 Equation of state (EOS) parameters for the Mn0.94Ti0.06CoGe alloy.
EOS B0 (G Pa) dB/dP ( B
′ )
Comment
Murnaghan 232 ± 7.79 4 (assumed) B′ constrained
3rd
order Birch - Murnaghan 231.72 ± 7.79 4 (assumed) B′ constrained
3rd
order Birch - Murnaghan 222.64 ± 36.9 5.79 ± 7.066 B′ unconstrained

162
Figure 8.10 Relative volume of the Mn0.94Ti0.06CoGe alloy as a function of pressure. The
solid line represents the Birch-Murnaghan equation of state using the parameters obtained in
this study.
The variation of the relative volume with pressure data shown in Figure 8.10 was fitted using
the third order Birch – Murnaghan EOS (using a constrained value of B′ ). The result of the fit
is shown as a solid line in Figure 8.10 demonstrating the excellent agreement between the
fitted curve and the experimental data.
The application of pressure modifies the structural parameters such as the Mn-Mn interatomic
distance of the Mn0.94Ti0.06CoGe alloy. The bond lengths were calculated using the BLOKJE

163
program [15]. Figure 8.11 shows that with increasing pressure, the Mn-Mn interatomic
distance monotonically decreases up to 10.4 GPa. At ambient pressure the closest distance
between Mn-Mn is determined to be 2.644 Å in the TiNiSi-type unit-cell while it changes to
2.552 Å at a pressure of 10.4 GPa. It was reported in MnCoGe related compounds that, for
the orthorhombic phase, the larger distance between the dominant Mn–Mn magnetic coupling
will lead to the narrower 3d bandwidths and a large exchange splitting between the majority
and minority bands then result in the larger moment [16]. On the contrary, the hexagonal
phase with shorter Mn-Mn distances has the smaller magnetic moment due to the stronger
Mn–Mn coupling and the resulting wider 3d band. In this study, the reduction in the Mn-Mn
distance due to the application of pressure will be expected to lead to a further decrease of
magnetic moment as detected for Mn1-xCrxCoGe compounds in ref [17].
Figure 8.11 Pressure dependence of the Mn – Mn interatomic distances in the
Mn0.94Ti0.06CoGe alloy. The line serves as a guide to the eye.

164
8.4 Conclusions
High pressure x-ray diffraction studies were performed on the Mn0.94Ti0.06CoGe alloy up to a
pressure of 10.4 GPa. The hexagonal Ni2In-type structure (space group P63/mmc) structure
is stable in the investigated pressure regime and no phase transition is found to occur. Unit
cell parameters were determined and the calculated volumes were found to be well
reproduced by the third order Birch – Murnaghan equation of state. The bulk modulus B0 =
231.72 ± 7.79 GPa has been determined from the observed pressure – volume data. The
determination of the EOS parameters and the investigation of the phase stability with
pressure of the Mn0.94Ti0.06CoGe alloy are useful guidelines that can be used together with
theoretical calculations to predict crystallographic phase transitions.

165
References
[1] A. Fujita, K. Fukamichi, M. Yamada, T. Goto, J. Appl. Phys. 93, 7263 (2003).
[2] S. Gama, A.A Coelho, A. de Campos, A. M. G Carvalho and F. C. G Ghandra, Phys. Rev.
Lett. 93, 237202 (2004).
[3] L. Merrill, W. A. Bassett, Rev Sci Instrum 45, 290 (1974).
[4] D. L. Decker, J Appl Phys 42, 3239 (1971).
[5] F. D. Murnaghan, Am J Math 59, 235 (1937).
[6] F. Birch, Phys Rev 71, 809 (1947).
[7] A. P. Hammersley, S. O. Svensson, M. Hanfland, A. N. Fitch, D. Hausermann High Press
Res 14, 235 (1996).
[8] R. Carvajal, “FULLPROF: A program for Rietveld Refinement and pattern Matching
Analysis” at the Satellite Meeting on Powder Diffraction of the VVIUCr Congress, 127
(1990).
[9] R. J. Angel, in High Pressure, High Temperature Crystal Chemistry Reviews in
Mineralogy and Geochemistry, Vol. 41, edited by R. M. Hazen and R. T. Downs (the
Geological Society of America, Boulder, CO, 2001) pg. 35.
[10] F. Birch, J. Geophys. Res. 83, 1257 (1978).
[11] F. Birch, J. Geophys. Res. 57, 227 (1952).
[12] E. Knittle, in Mineral Physics and Crystallography, A Handbook of Physical Constants,
edited by T. J. Ahrens (American Geophysical Union press, Washington, DC) (AGU, 1995),
pg. 98 – 142.
[13] R. Jeanloz, J. Geophys. Res. 94, 5873 (1989).
166
[14] E. Knittle, R. B. Kaner, R. Jeanloz, M. L. Cohen, Phys. Rev. B 51, 12149 (1995).
[15] L. Gelato, J. Appl. Crystallogr., 14, 151 (1981).
[16] J. T. Wang, D. S. Wang, C. Chen, O. Nashima, T. Kanomata, H. Mizuseki, and Y.
Kawazoe, Appl. Phys. Lett. 89, 262504 (2006).
[17] L. Caron, N. T. Trung, E. Bruck, Phys. Rev. B 84, 020414(R) (2011).

167
CHAPTER 9
CONCLUSIONS AND OUTLOOK
In this thesis, the magnetocaloric materials namely, the β-Co(OH)2 nanosheets,
La0.8Gd0.2Fe11.4Si1.6Bx compounds, La0.8Ce0.2Fe11.4Si1.6Bx compounds and the
Mn0.94Ti0.06CoGe alloy have been systematically investigated with their structural, magnetic
and magnetocaloric properties being studied in detail. The aim of this doctoral work was to
contribute towards a better understanding of the fundamental material characteristics, with an
emphasis on understanding the relationship between a defined structure, the crystallographic
phase and magnetic phase structure, and alteration in the magnetocaloric properties. This
work has important contributions towards an understanding of the role of atomic substitution
in tuning the magnetocaloric properties. The main results of the thesis are summarized as
follows:
β-Co(OH)2 nanosheets have been successfully prepared by a microwave assisted
hydrothermal and conventional chemical reaction method. The material displays a
very high magnetic moment of MS ~ 110 emu / g at 3 K, which causes a highly
reversible giant MCE of 17 J/kg K at 11 K in a magnetic field change of 5 T thereby
indicating the suitability of this material for use in magnetic refrigeration. The study
of the magnetism of the β-Co(OH)2 nanosheets, revealed that the spin-glass-like
surface spins may have a significant effect on the MCE of this material system and
the sign of the field-induced first order magnetic phase transition is possibly a result

168
of a competition or coupling of the surface spin, impure phase and the β-Co(OH)2
bulk magnetic behaviour. Since this material system synthesizes in the nanostructured
form, it would be beneficial to carry out an indepth study to elucidate the grain – grain
boundary characteristics of this material system in order to gain an insight into the
nanomagnetism of this material.
We have investigated the effect of boron doping on the magnetic and magnetocaloric
properties of La0.8Gd0.2Fe11.4Si1.6Bx compounds (with boron doping level, x = 0, 0.03,
0.06, 0.2 and 0. 3). This study brings new light on the role of boron (B) in tuning the
magnetocaloric properties of the La0.8Gd0.2Fe11.4Si1.6 compound. We achieved a
significant enhancement of the Curie temperature and the refrigerant capacity in
La0.8Gd0.2Fe11.4Si1.6 due to boron doping. We also demonstrated how boron doping at
high levels tunes the magnetic transition from 1st to 2
nd order. These results thus
support the role of low level boron doping in the enhancement of the magnetocaloric
effect in La0.8Gd0.2Fe11.4Si1.6Bx alloys, thus making this material system a promising
candidate for magnetic refrigeration near room temperature.
Results from our study reveal that large ΔSM and RC values and a small hysteresis
loss can be simultaneously achieved in the La0.8Ce0.2Fe11.4Si1.6Bx compounds and the
introduction of interstitial boron atoms into the La0.8Ce0.2Fe11.4Si1.6 material system
could be a promising method of depressing the hysteresis loss whilst maintaining the
large MCE. The determination of ΔSM for La0.8Ce0.2Fe11.4Si1.6Bx compounds using the
Clausius-Clapeyron equation yields reasonable estimates of the MCE in these
compounds. Our results demonstrate that the hysteresis behaviour of a material is
critical in evaluating its potential as a functional magnetic refrigerant. Also, high

169
resolution neutron diffraction measurements performed on the La0.8Ce0.2Fe11.4Si1.6Bx
compounds revealed that, in the vicinity of the FM – PM transition there is a co-
existence of a large volume change as well as a spontaneous magnetostriction jump,
which gives rise to a first order magnetic transition.
We report the results of the role of titanium (Ti) in tuning the magnetocaloric
properties of the MnCoGe compound. We have investigated the substitution of Ti into
Mn1-xTix CoGe compounds with x = 0.02, 0.04 and 0.06 and we found that the,
x = 0.06 substitution most successfully shifted the structural change and magnetic
phase transition into our interested temperature range leading to the attainment of a
giant magnetocaloric effect. A comprehensive neutron diffraction investigation of the
Mn0.94Ti0.06CoGe alloy was performed in order to probe further the magnetostructural
coupling and fully understand the role of structural and magnetic transformation in
enhancing the magnetic entropy change. A large volume change ∆V/V= 3.45% was
detected at the structural transition Tstr ~ 235 K with a significant drop in
magnetization being observed. Both changes in crystal structure and magnetization
around Tstr were found to contribute to the larger magnetocaloric effect determined. A
giant MCE around 235 K has been observed for the Mn0.94Ti0.06CoGe alloy which has
been found to be related to a first-order structural transformation. An excellent
agreement of the critical exponents of the Mn0.94Ti0.06CoGe alloy determined using
the isothermal magnetization in the vicinity of TC based on various techniques such as
the Kouvel-Fisher method, the modified Arrott plot as well as the critical isotherm
was obtained. Moreover, all critical exponents fulfilled the Widom scaling law. The
determined critical exponents are close to those predicted by the mean-field theory,
with long range interactions.

170
High pressure x-ray diffraction studies up to 10.4 GPa were performed on the
Mn0.94Ti0.06CoGe alloy using synchrotron radiation and a diamond anvil cell. No
structural phase transitions occurred in the entire range of our measurements. Unit
cell parameters were determined up to 10.4 GPa and the calculated unit cell
volumes were found to be well represented by a third order Birch-Murnaghan
equation of state. The bulk modulus determined from the pressure – volume data
was found to be, B0 = 231.72 ± 7.79 GPa. This study, employing high resolution
synchrotron x-rays has helped clarify the behaviour of the Mn0.94Ti0.06CoGe alloy
under high pressure.
The work carried in this doctoral study has provided an insight on the effect of atomic
substitutions in tuning the magnetocaloric effect as well as the magnetic phase transitions
of various magnetocaloric materials. It is my hope that this work may act as a foundation
for further research in the development of new materials that can fulfil specific
requirements of cooling devices. Future work may include:
It would be very interesting to tune the surface anisotropy of the β - Co(OH)2
nanosheets by coating with various antiferromagnetic material. An in depth study
of the effect of tuning the surface anisotropy of the β - Co(OH)2 nanosheets on the
magnetocaloric properties will provide an insight into an alternative way of tuning
the MCE properties.
There is a need to perform pressure dependent magnetisation measurements of the
Mn0.94Ti0.06CoGe alloy in the diamond anvil cell up to a pressure of 15 GPa. Such
an experiment will help to explain if at all, its possible to physically tune (by the

171
application of pressure) the structural and magnetic transitions to enable them to
coincide, giving rise to a giant magnetocaloric effect. It is also desirable to
investigate the influence of pressure on the critical field BC, hysteresis, ∆SM and
refrigerant cooling capacity (RCP) for the above mentioned sample as well as
other material systems.
It will be very interesting to perform resistivity measurements as a function of
pressure on the Mn0.94Ti0.06CoGe alloy (as well as other material systems) to track
magnetic or structural transitions to much high pressures (e.g., routinely to 30
GPa).

172
Publication List
1. P. Shamba, J. L. Wang, J. C. Debnath, S. J. Kennedy, R. Zeng, M. F Md Din, F. Hong, Z.
X. Cheng, A. J. Studer & S. X. Dou , “Critical behaviour and magnetocaloric effect in
Mn0.94Ti0.06CoGe.” (Journal of Physics: Condensed Matter) 25, 056001 (2013)
doi:10.1088/0953-8984/25/5/056001
2. P. Shamba, R. Zeng, J. L. Wang, S. J. Campbell & S. X. Dou “Enhancement of the
refrigerant capacity in low level boron doped La0.8Gd0.2Fe11.4Si1.6” (Journal of Magnetism
and Magnetic Materials) 331, 102 (2013)
3. P. Shamba, R. Zeng, J. L. Wang, S. J. Kennedy & S. X. Dou, “On the structural properties
of the Mn0.94Ti0.06CoGe alloy” (Journal of Applied Physics) (accepted) (2013)
4. P. Shamba, J. C. Debnath, R. Zeng, J. L. Wang, S. J. Kennedy, S. J. Campbell & S. X.
Dou, (2011). “Reduction of hysteresis losses in the magnetic refrigerant La0.8Ce0.2Fe11.4Si1.6
by the addition of boron”. (Journal of Applied Physics). 109, 07A940 (2011)
5. P. Shamba, R. Zeng, J.Q. Wang, & S.X. Dou, “ A sign of field-induced first order
magnetic state transition and giant reversible magnetocaloric effect in cobalt hydroxide
nanosheets”, (Journal of Applied Physics) 107, 09A919 (2010)
6. J. C. Debnath, P. Shamba, A. M. Strydom, J. L. Wang, S. X. Dou, “Investigation of
critical behaviour in Mn0.94Nb0.06CoGe alloy by using the field dependence of magnetic
entropy change”, (Journal of Applied Physics) 113, 093902 (2013)
7. M. F. Md Din, J. L. Wang, R. Zeng, P. Shamba, J. C. Debnath & S. X. Dou. “Effects of
Cu substitution on structural and magnetic properties of La0.7Pr0.3Fe11.4Si1.6 compounds”
(Intermetallics) 36, 1 (2013) DOI: http://dx.doi.org/10.1016/j.intermet.2012.12.013

173
8. R. Zeng, J.C. Debnath, D. Chen, P. Shamba, J. L. Wang, S. J. Kennedy, S. J. Campbell,
& S. X. Dou, (2011). “Magnetic properties in polycrystalline and single crystal Ca-doped
LaCoO3”, (Journal of Applied Physics) 109, 07E146 (2011)
9. J. C. Debnath, R. Zeng, J. Kim, P. Shamba & S. X. Dou, (2011). “Reduction of hysteresis
loss in LaFe11.7Si1.3Hx hydrides with significant magnetocaloric effects”. (Applied Physics A:
Materials Science & Processing). (Accepted) DOI: 10.1007/s00339-011-6571-1
10. J. C. Debnath, R. Zeng, J. Kim, P. Shamba & S. X. Dou, “Effect of frozen spin on the
magnetocaloric property of La0.7Ca0.3CoO3 polycrystalline and single crystal samples”.
(Journal of Alloys and Compounds) 510 (1) 125 (2012)
11. R. Zeng, S. Q. Wang, G. D. Du, J. L. Wang, J. C. Debnath, P. Shamba, Z. Y. Fang &
S. X. Dou, “Abnormal magnetic behaviors and large magnetocaloric effect in MnPS3
nanoparticles” , (Journal of Applied Physics) 111, 07E144 (2012)
12. R. Zeng, C. F. Zhang, J. C. Debnath, P. Shamba, J. L. Wang, Z. X. Chen, Z. P. Guo
& S. X. Dou, “Extremely Large Magnetic Entropy Changes, Quantum Phases, Transitions
and Diagram in Gd(OH)3 Single Crystal Nanowires - Quasi-1D Large Spin (S = -7/2) Chain
Antiferromagnet”, (Journal of Applied Physics) (accepted) (2012)
13. P. Shamba, R. Zeng, J. L. Wang, S. J. Campbell & S. X. Dou , “Effect of boron doping
on Magnetocaloric effect and heat capacity of La0.8Ce0.2Fe11.4Si1.6 alloys” (In preparation)
14. P. Shamba, R. Zeng, J. L. Wang, J.C. Debnath, S. J. Campbell, S. J. Kennedy & S. X.
Dou, “La0.8Ce0.2Fe11.4Si1.6Bx : A neutron diffraction study” (In preparation)
15. P. Shamba, J. C. Debnath, J. L. Wang, R. Zeng, , S. J. Kennedy & S. X. Dou , “Effect of
high pressure on the structural properties of the Mn0.94Ti0.06CoGe alloy” (In preparation)
https://misprd.uow.edu.au/ris_public/WebObjects/RISPublic.woa/wa/Staff/selectPerson?id=8715&group=37
https://misprd.uow.edu.au/ris_public/WebObjects/RISPublic.woa/wa/Staff/selectPerson?id=8715&group=37
https://misprd.uow.edu.au/ris_public/WebObjects/RISPublic.woa/wa/Staff/selectPerson?id=8715&group=37

174
16. P. Shamba, R. Zeng, S. Aminorroaya-Yamini, J. L. Wang, J.C Debnath and S. X.
Dou, “Modification of hydrogenation and magnetocaloric properties of the La0.8Ce0.2FeSi
compound induced by interstitial boron” (In preparation)