2012 STRATEGIC DIRECTIONS IN THE U.S.WATER UTILITY … · 2012-07-05 · Welcome to the inaugural...
39
2012 STRATEGIC DIRECTIONS IN THE U.S.WATER UTILITY INDUSTRY BLACK &VEATCH Building a world of difference.
Transcript of 2012 STRATEGIC DIRECTIONS IN THE U.S.WATER UTILITY … · 2012-07-05 · Welcome to the inaugural...

2012 STRATEGIC DIRECTIONS IN THE U.S.WATER UTILITY INDUSTRY
BLACK &VEATCH Building a world of difference.


TABLE OF CONTENTS
INTRODUCTION 2 The Black & Veatch Analysis Team 3
About the 2012 Survey 4
INDUSTRY OVERVIEW 6
FINANCIAL OVERVIM 14
SUSTAINABILITY AND THE WATER-ENERGY NEXUS 20
ASSET MANAGEMENT OVERVIEW 26
A PATH FORWARD 34

Welcome to the inaugural Black & Veatch Strategic Directions in the U.S. Water Utility
Industry Report. This report serves to provide insights on the common challenges - and opportunities facing the water and wastewater industry based on the analysis of survey responses from water utility leaders.
As we reviewed survey results and conducted subsequent
analysis, common themes emerged that centered on
financial issues, sustainability and optimized asset
management practices. What is unique is that these are
not stand-atone themes. Rather, each is intertwined with
the others in terms of alleviating challenges or hindering
future opportunity.
The survey results confirm that the financial needs of
water utilities truly are the overarching challenge for
the industry. Funding is grossly inadequate to upgrade
infrastructure that, for the most part, is well past its
useful tifespan. Sustainability and asset management
are key solutions to the financial puzzle. By reducing
energy needs, conserving water, prioritizing capital and
implementing asset management frameworks, utilities
can do more with less. The challenge is that all of these
solutions still require funding and force the continuous
cycle of "do what you can" prioritization.
New thinking is needed to break this cycle and boost
infrastructure spending and invest in the future of our
nation's infrastructure. This report not only demonstrates
the current views of industry and utility leaders related
to key issues but also provides recommendations and
opportunities to propel the industry forward.
Black & Veatch is grateful to everyone who participated in
our inaugural survey. We would also like to acknowledge
the Black & Veatch professionals who contributed their
insights and analysis for this report. To continuously
improve our products for the industry, we welcome your
questions and comments regarding this report and other
items. You can reach us at ConsultingInfoabv.com .
Sincerely,
CINDY WALLIS-LAGE I PRESIDENT
]OHN CHEVRETTE I PRESIDENT
Black & Veatch's global water business
Black & Veatch's management consulting division
This report is available electronically on the Black & Veatch website, www.bv.com/survey.
ATECIC DIRECTIONS IN THE U.S. WATER UTILITY INDUSTRY
THE BLACK & VEATCH ANALYSIS TEA
INDUSTRY OVERVIEW
Cindy Wallis-Lage is President of Black & Veatch's global
water business and is a recognized thought leader within
the industry. Throughout her 25-year career, Cindy has
worked with water and wastewater utilities to develop
sustainable water and wastewater solutions. She has been
involved in industrial and municipal projects worldwide,
and has authored more than 50 papers, 20 technical
articles and 10 textbook chapters. In addition, Cindy
is an active leader in numerous industry forums
and associations.
SUSTAINABILITY OVERVIEW
Steve Tarallo is the North America Business Lead
for Sustainable Water and Energy Solutions within
Black & Veatch's global water business. Steve has more
than 21 years of experience in municipal wastewater
treatment research and development, design and project
development. Steve works with utilities in assessing
treatment deficiencies, developing process alternatives,
energy optimization studies and sustainability
assessments.
Bob Hulsey is the Director of Water Treatment Technology
in Black & Veatch's global water business where he leads
a group of Ph.D.- and Master's-level process engineers
and scientists in implementing advanced treatment
technologies such as desalination, micro-contaminant
removal, high-rate sedimentation and flotation,
membrane and biological filtration, ozone, and UV
disinfection, among other solutions.
FINANCIAL OVERVIEW
John Kersten is a Vice President in Black & Veatch's
management consulting division and has extensive
consulting experience associated with municipal electric,
natural gas, water, wastewater and reclaimed water
utilities. His experience encompasses a full range of
utility finance issues, including wholesale and retail
ratemaking, revenue bond financial feasibility reports,
valuations studies for acquisitions and mergers, capital
financing analyses, economic feasibility studies, and
strategic and business planning.
ASSET MANAGEMENT OVERVIEW
Will Williams is a Director within Black & Veatch's
management consulting division where he leads and
provides a full range of strategic and tactical asset
management services for global water and power
clients. Will has more than 21 years of experience in
asset management planning, including asset failure
analysis, risk assessment, performance benchmarking,
maintenance optimization and business change
management, among other areas.
CONCLUDING THOUGHTS
John Chevrette is the President of Black & Veatch's
management consulting division and leads the
company's efforts to address key challenges affecting
today's water, electric and gas utilities. Chevrette has
more than 20 years of industry consulting experience,
and has worked with domestic and international clients
in the electric utility, energy technology, gas pipeline,
telecommunications and water industries.
BL AC K ,IATC H

Wasterwater-only systems and/or plants
r Water and wastewater systems and/or plants
ABOU T H E 2012 SURVEY Black & Veatch's first water utility industry survey was conducted from 22 February through 13 March 2012. Analyzed survey responses are from
qualified water utility industry participants. Statistical significance testing was conducted, and represented results have a 95 percent confidence level,
FIGURE 7
SURVEY PARTICIPANTS BY TYPE OF SYSTEMS/ASSETS MANAGED
FIGURE 2
SURVEY PARTICIPANTS BY ORGANIZATION TYPE
Water-only systems
and/or plants
Special District
Municipal Utility Commission/Authority
County
Utility District
Water District
Investor Owned .
State
40.4%
2 1.7%
18.1%
10.3%
3.0%
2.8%
2.8%
0.3%
Municipal Department
Source: Black & Veatch
Source: Black & Veatch Utility respondents represented a broad cross section of the industry
Utilities that are municipal departments or special districts
and country Responses represent utilities serving customers in represented more than 60 percent of qualified respondents. 45 states and the District of Columbia.
4 STRATEGIC DIRECTIONS IN THE U.S. WATER UTILITY NDUSTRY
Less than 50,000
50,000- 100,000
FIGURE 3
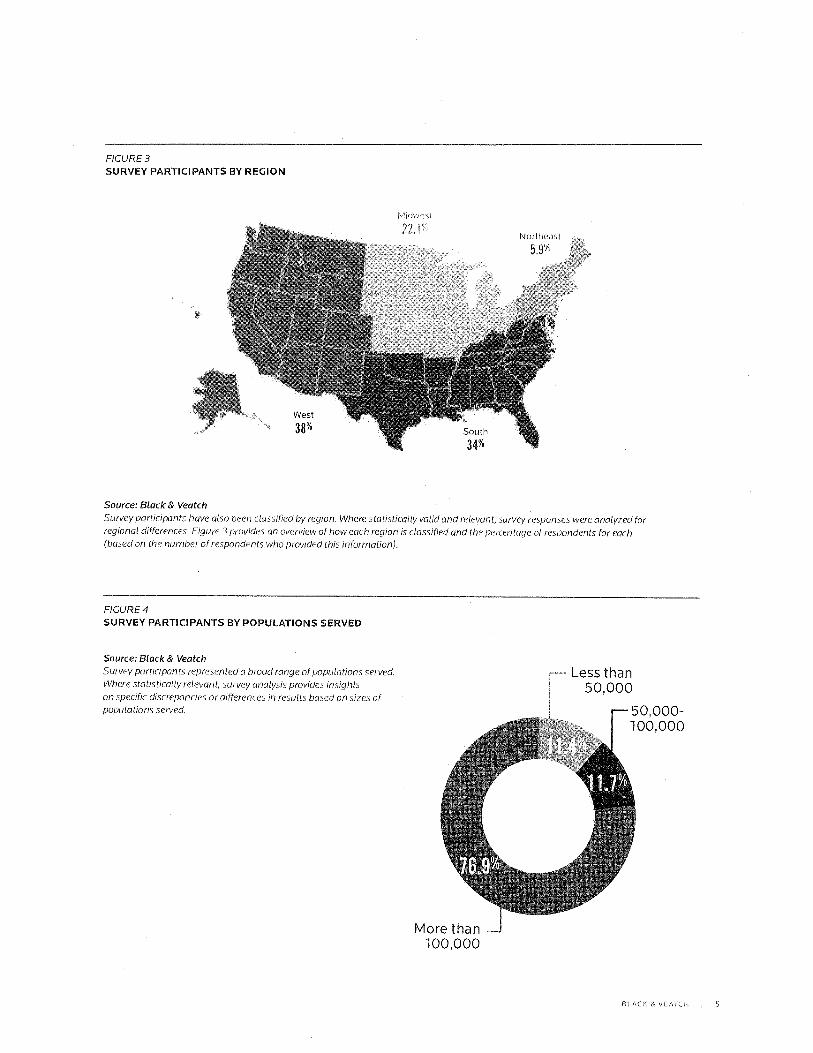
SURVEY PARTICIPANTS BY REGION
Northeast
5.9%
Source: Black & Veatch
Survey participants have also been classified by region. Where statistically valid and relevant, survey responses were analyzed for regional differences. Figure 3 provides an overview of how each region is classified and the percentage of respondents for each (based on the number of respondents who provided this information).
FIGURE 4
SURVEY PARTICIPANTS BY POPULATIONS SERVED
Source: Black & Veatch
Survey participants represented a broad range of populations served.
Where statistically relevant, survey analysis provides insights
on specific discrepancies or differences in results based on sizes of populations served.
More than 100,000
BLACK & VEATCH

INDUSTRY OVERVIEW
INDUSTRY OVERVIEW BY CINDY WALLIS-LAGE
Black gz Veatch's first water utility survey confirmed much of what. the
company's water industry leaders and specialists have seen unfolding over the past few years. In the following report, we've summarized the water industry
survey findings and expanded the analysis to address the three overlapping
mega-issues impacting utilities today: financial challenges, sustainability and asset management.
FINANCIAL CHALLENGES
First and foremost the survey confirms that financial
issues, and all issues that drive investment or costs,
are front and center with water utility leaders. When
asked to rate the importance of major industry issues,
survey respondents considered aging water and sewer
infrastructure as the most important issue facing
our industry, with managing capital costs, funding or
availability of capital, and energy costs following closely
behind. Increasing or expanding regulation, treatment
technology, the aging work force and chemical costs are
also comparatively important (Figure 5).
Considering the massive expansion of U.S. water systems
in the immediate post-World War II era, followed by
wastewater treatment projects spurred by the Clean Water
Act in the 1970s, with comparatively limited investments
since that time, it is not surprising that aging infrastructure
is viewed by the industry as the top challenge. Nor is
it surprising that aging infrastructure and associated
replacement and rehabilitation demands have a strong
impact on the financial health of water utilities (Figure 6
on page 8).
6 STRATEGIC DIRE
OHS THE U.S WATER UTILITY INDUSTRY

Increasing/expanding regulation
Treatment technology
Chemical costs
Aging workforce
Information technology
Security problem
FIGURE 5
IMPORTANCE OF INDUSTRY ISSUES
4.59
Aging water and sewer infrastructure
4.50
4.48
4.42
4.28
4.04
4.00
4.00
3.93
3.54
Managing capital costs
Funding or availability of capital
Energy costs
Source: Black & Veatch
Survey participants were asked to rate the importance of each of the above referenced issues to the water industry based on a scale of 1 to 5, where 7 indicates "very unimportant" and 5 indicates "very important." The results above show the average response for each issue.
BACK & VEATCH
7
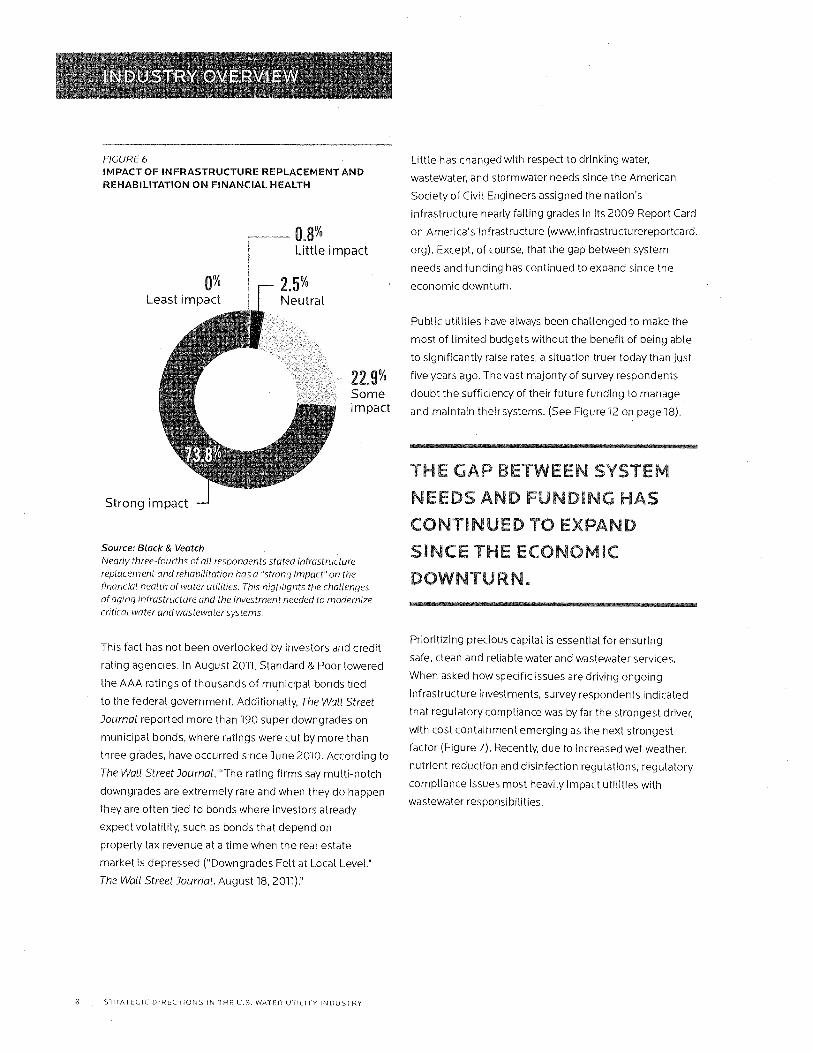
2.5% Neutral Least impact
22.9% Some impact
Strong impact
INDUSTRY OVERVIEW
FIGURE 6 IMPACT OF INFRASTRUCTURE REPLACEMENT AND REHABILITATION ON FINANCIAL HEALTH
— 0.0 % Little impact
Source: Black & Veatch
Nearly three-fourths of all respondents stated infrastructure
replacement and rehabilitation has a "strong impact" on the financial health of water utilities. This highlights the challenges
of aging infrastructure and the investment needed to modernize
critical water and wastewater systems.
This fact has not been overlooked by investors and credit
rating agencies. In August 2011, Standard & Poor lowered
the AAA ratings of thousands of municipal bonds tied
to the federal government. Additionally, The Wall Street
Journal reported more than 190 super downgrades on
municipal bonds, where ratings were cut by more than
three grades, have occurred since June 2010. According to
The Wall Street Journal, "The rating firms say multi-notch
downgrades are extremely rare and when they do happen
they are often tied to bonds where investors already
expect volatility, such as bonds that depend on
property tax revenue at a time when the real estate
market is depressed ("Downgrades Felt at Local Level."
The Wall Street Journal. August 18, 2011)."
Little has changed with respect to drinking water,
wastewater, and stormwater needs since the American
Society of Civil Engineers assigned the nation's
infrastructure nearly failing grades in its 2009 Report Card
on America's Infrastructure (www.infrastructurereportcard.
orgy. Except, of course, that the gap between system
needs and funding has continued to expand since the
economic downturn.
Public utilities have always been challenged to make the
most of limited budgets without the benefit of being able
to significantly raise rates, a situation truer today than just
five years ago. The vast majority of survey respondents
doubt the sufficiency of their future funding to manage
and maintain their systems. (See Figure 12 on page 18).
THE P LiETWFTN STEM
NEEDS AND FUNDING HAS
CONTINUED TO EXPAND
SINCE THE ECONOMIC
DOWNTURN.
Prioritizing precious capital is essential for ensuring
safe, clean and reliable water and wastewater services.
When asked how specific issues are driving ongoing
infrastructure investments, survey respondents indicated
that regulatory compliance was by far the strongest driver,
with cost containment emerging as the next strongest
factor (Figure 7). Recently, due to increased wet weather,
nutrient reduction and disinfection regulations, regulatory
compliance issues most heavily impact utilities with
wastewater responsibilities.
8 : STRATEGIC DIRECTIONS IN THE U.S. WATER UTILITY INDUSTRY
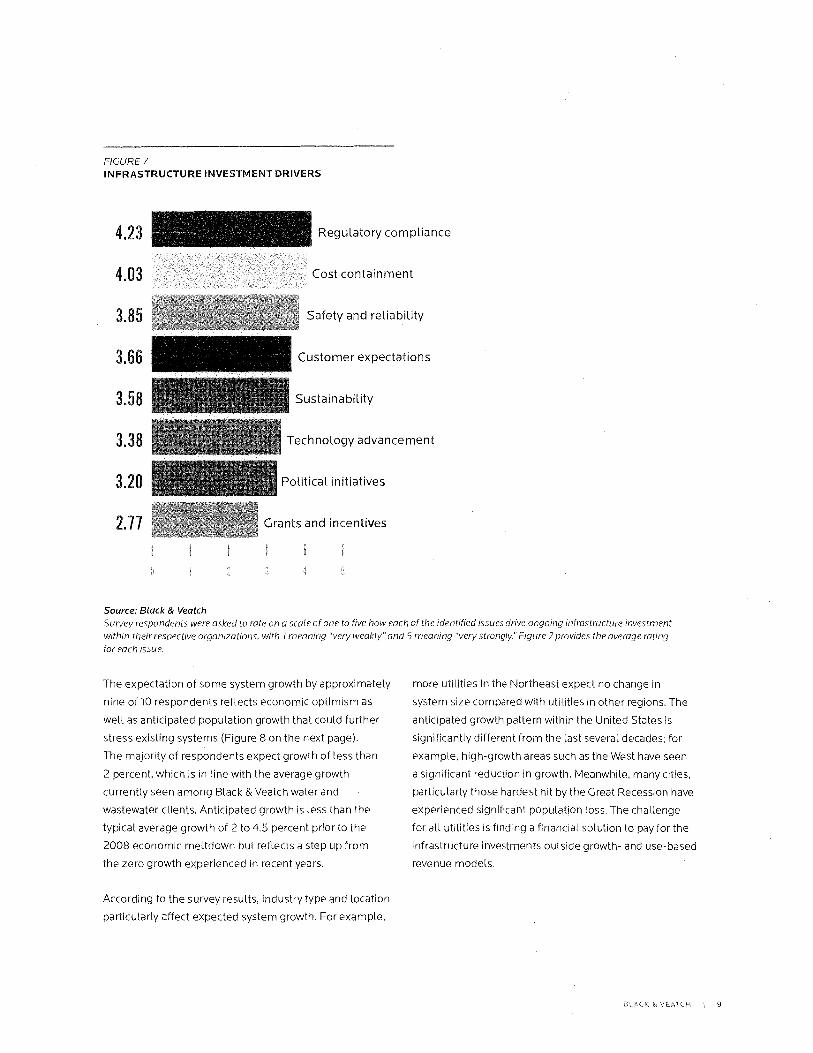
4.23
4.03
3.85
3.66
3.58 ■
3.38 ■
3.20
2.77
Regulatory compliance
Cost containment
Safety and reliability
Customer expectations
Sustainability
Technology advancement
Political initiatives
Grants and incentives
FIGURE 7
INFRASTRUCTURE INVESTMENT DRIVERS
Source: Black & Veatch Survey respondents were asked to rate on a scale of one to five how each of the identified issues drive ongoing infrastructure investment
within their respective organizations, with 1 meaning "very weakly"and 5 meaning "very strongly." Figure 7 provides the average rating
for each issue.
The expectation of some system growth by approximately
nine of 10 respondents reflects economic optimism as
well as anticipated population growth that could further
stress existing systems (Figure 8 on the next page).
The majority of respondents expect growth of less than
2 percent, which is in line with the average growth
currently seen among Black & Veatch water and
wastewater clients. Anticipated growth is less than the
typical average growth of 2 to 4.5 percent prior to the
2008 economic meltdown but reflects a step up from
the zero growth experienced in recent years.
According to the survey results, industry type and location
particularly affect expected system growth. For example,
more utilities in the Northeast expect no change in
system size compared with utilities in other regions. The
anticipated growth pattern within the United States is
significantly different from the last several decades; for
example, high-growth areas such as the West have seen
a significant reduction in growth. Meanwhile, many cities,
particularly those hardest hit by the Great Recession have
experienced significant population loss. The challenge
for all utilities is finding a financial solution to pay for the
infrastructure investments outside growth- and use-based
revenue models.
BLACK & VEATCH

INDUSTRY OVERVIEW
4% and above
0% growth
2% to less -- than 4%
Greater than 0 % to less than 2'
FIGURE 8
EXPECTED ANNUAL SYSTEM GROWTH
1.4% Negative
Source: Black & Veatch
SUSTAINABILITY
The Nexus of Water and Energy
Sustainability is important to the vast majority of
survey respondents, and energy use is the overriding
sustainability issue. The water-energy nexus affects water
utilities in many ways; it takes a lot of energy to produce,
move, treat and distribute water. Energy costs can account
for as much as 30 percent of most utilities' operating
budgets.
The effects of energy use and cost on the Triple Bottom
Line (economic, environment, social/community)
performance of water and wastewater utilities are
impossible to ignore. Rising energy costs are putting
additional pressure on utilities' finances. The economic
impact on water and wastewater utilities is particularly
stressful during challenging times when budgets are
being squeezed through decreased revenues and
funding constraints.
More than three-fourths of respondents' utilities have
taken basic steps to reduce energy consumption
through efficiency, optimization or similar planning and
management measures (See Figure 17 on page 24). Some
utilities strive to become energy neutral, and at least one
has recently become a net energy producer by recovering
more energy from the treatment process than what is
needed to power facilities.
ENERGY COSTS CAN
ACCOUNT FOR AS MUCFI AS
30 PERCENT OF MOST
UTILITIES' OPERATING
BINDGETS.
Water is Water
Water conservation and water reuse present direct
opportunities for achieving economic, environmental and
social sustainability. Although there is some variation in
survey responses based on specific utility functions, the
overall analysis emphasizes that water is water. Water
utilities are all essentially managing the same water
resource, diverted from nature's one-and-only water cycle.
In addition, utilities are increasingly finding it necessary
to manage and balance other resources along with water.
Sometimes the management of multiple resources is
synergistic; sometimes it requires more complex planning
or investment; and sometimes tradeoffs are necessary.
The ongoing practice of classifying water into different
categories (i.e., potable, stormwater and wastewater)
creates division about water value and its potential uses.
These divisions also contribute to communications
challenges with public and government entities that
can confound capital projects and resource recovery
efforts. Globally, organizations that integrate water and
wastewater functions find it easier to balance their water
portfolios and gain public and financial support for
investment in water infrastructure.
10 ; STRATEC1C D ■ RECTIONS IN THE U.S WATER UTILITY INDUSTRY
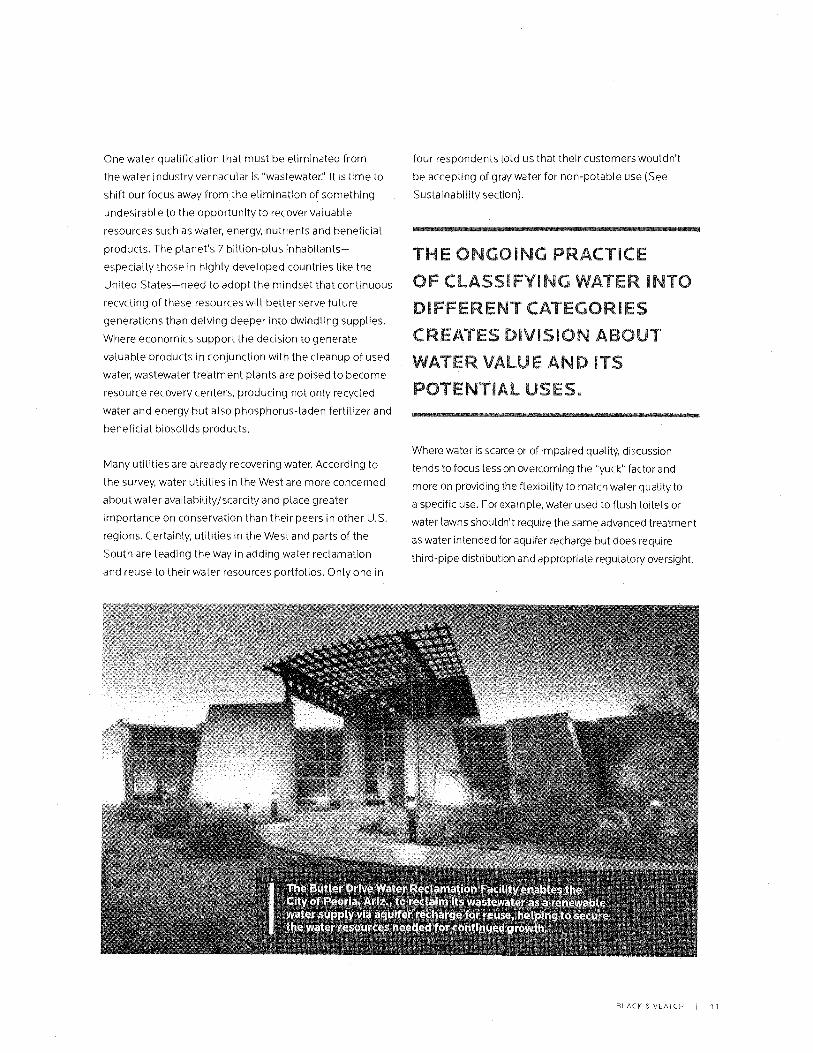
The Butler Drive Water Reclamation Facility enables t City of Peoria, Ariz., to reclaim its wastewater as a renews water supply via aquifer recharge for reuse, helping to sec the water resources needed for continued growth.
One water qualification that must be eliminated from
the water industry vernacular is "wastewater:' It is time to
shift our focus away from the elimination of something
undesirable to the opportunity to recover valuable
resources such as water, energy, nutrients and beneficial
products. The planet's 7 billion-plus inhabitants—
especially those in highly developed countries like the
United States—need to adopt the mindset that continuous
recycling of these resources will better serve future
generations than delving deeper into dwindling supplies.
Where economics support the decision to generate
valuable products in conjunction with the cleanup of used
water, wastewater treatment plants are poised to become
resource recovery centers, producing not only recycled
water and energy but also phosphorus-laden fertilizer and
beneficial biosolids products.
Many utilities are already recovering water. According to
the survey, water utilities in the West are more concerned
about water availability/scarcity and place greater
importance on conservation than their peers in other U.S.
regions. Certainly, utilities in the West and parts of the
South are leading the way in adding water reclamation
and reuse to their water resources portfolios. Only one in
four respondents told us that their customers wouldn't
be accepting of gray water for non-potable use (See
Sustainability section).
THE ONGOING PRACTICE
OF CLASSIFYING WA'ER INTO
DIFFERENT cAnGeizo CREATES DIVISION ABOU";
WATER VALUE AND ITS
POTENTIAL USES.
Where water is scarce or of impaired quality, discussion
tends to focus less on overcoming the "yuck" factor and
more on providing the flexibility to match water quality to
a specific use. For example, water used to flush toilets or
water lawns shouldn't require the same advanced treatment
as water intended for aquifer recharge but does require
third-pipe distribution and appropriate regulatory oversight.
BLACK & VEATCH 11

INDUSTRY OVERVIEW
ASSET MANAGEMENT
One activity that would significantly help utilities more
efficiently manage water resources is the collection and
analysis of real-time data through smart infrastructure/
grid programs. Wireless communications offer the
potential for greater efficiency as compared with system
elements that operate independently. Immediate access
to the right data moves decision-making closer to
real-time and can greatly improve efficiency within the
water industry.
Overall, integrated planning to most effectively manage
all utility resources is becoming one of the most important
activities for utilities moving forward. This requires a
holistic evaluation of all assets and resources using
life-cycle analysis to determine the economic impacts of
potential energy reduction and resource recovery actions.
Social and environmental objectives often must be
considered along with financial factors.
Achieving this balance isn't easy. White beneficial
results can be identified in isolation, the best balance
is found through big-picture evaluation. For example,
in many respects it is considered a success when a
water management approach, such as a conservation
program, results in decreased energy consumption for
water production, recovered capacity within existing
infrastructure, and less wear and tear on system assets.
However, equally important is the recognition that such a
program may have financial impacts for utility providers
that typically have significant fixed costs, including
decreased revenue. In other situations, there are tradeoffs
between required water quality and operating impacts.
The capital costs to add new facilities or processes can
be significant; meeting regulations and replacing critical
infrastructure tends to take top priority when budgets
are tight. This adds to the challenge of making holistic
decisions that factor in all resources - energy, water,
beneficial byproducts and optimization of existing assets.
The Asset Management Section of this report shows
approximately two-thirds of respondents have conducted
assessments and/or are implementing improvement
programs. This is a critical first step in developing
comprehensive solutions for reducing costs and improving
services related to reliability and regulatory concerns.
CONCLUDING THOUGHTS
The three mega-issues identified within this report have
been companions of water utility Leaders for decades.
While these issues are not new, the gap between what we
have and what we need continues to grow. Closing this gap
will require innovation in financing, technology application
and utility operations.
Traditionally, the U.S. water industry has relied on central
government sourcing for funding water and wastewater
infrastructure needs. While some funding relief may be on
the horizon, the current fiscal and political environment
suggests it will not be sufficient, or may not occur at all.
Additionally, as noted earlier, many municipalities have
challenges associated with credit rating downgrades
that are increasing the cost of obtaining capital through
traditional municipal bonds. As a result, water industry and
municipal leaders will need to explore additional options.
12 STRATEGIC DIRECTIONS IN THE U.S. WATER UTILITY INDUSTRY

Public-private partnerships provide an alternative
means of bridging the gap between available capital and
necessary capital expenditures. The availability of nearly
$200 billion in private capital could enhance funding to
accelerate infrastructure projects, yet, according to survey
results, utility leaders — or perhaps their governing bodies
— show little interest in pursuing private financing.
There is also much work to be done in educating
consumers and government leaders on the value of
water and the true costs associated with providing water
and wastewater services. On a global level, industry and
national leaders are recognizing the true significance
of precious water resources. Secretary of State Hillary
Clinton recently referred to water as "the new oil," casting
water as the next great catalyst for future diplomatic
tensions and possibly even military conflict.
At the local level, water and sanitation services are viewed
as basic necessities, and elected officials are hesitant to
raise rates or explore private involvement. Under these
constraints, most utilities are searching for innovative
solutions to support infrastructure funding needs along
with new technologies that optimize existing assets and
offset the high costs of producing safe drinking water and
returning clean water to the environment. Fortunately,
these technologies exist and are well proven. And, as
survey results show, utilities are moving forward with
implementing these cost-cutting measures.
When considering the significant system needs and
fiduciary constraints, water utility leaders are to be
commended for their consistency in delivering reliable
and safe water and wastewater services to their customers.
However, this consistency masks the underlying problems
that our water and wastewater services are, in many areas,
one event away from significant disruption. Water utility
leaders and the local governments they serve must move
forward with infrastructure rehabilitation and replacement.
Consumers must understand the value of water and the
true costs associated with delivering these services, and
politicians must be willing to make the hard decisions
related to financing and rate adjustments.
President Franklin Roosevelt once stated, "Confidence
and courage are the essentials of success in carrying
out our plan." Today's water utility leaders know the
challenges and needs. Together with local, state and
national leaders, we must push forward with confidence
and courage to preserve and protect precious water
resources, maximize energy efficiencies and seek out
new ways to fund vital capital improvements. Failure
today to move forward only places greater burden on
future generations.
500=MSMSD NOWNMINI4=
"CONFIDENCE AND.COURAGE ARE THE ,.;:SS.:;ENTIAI S
OF SUCCESS IN CARRYING OUT OUR PLAN."
— FRANKLIN DELANO ROOSEVELT
BLACKVEA CH 13
FINANCIAL OVERVIEW
FINANCIAL OVERVIEW BY JOHN KERSTEN
To those who work in or around the water/wastewater industry, it is "old news"
that there is a pent-up demand for the renewal and replacement of aging
infrastructure. In fact, the need is so large as to represent a literal crisis in many communities across the country.
With cost estimates for required system investment
ranging from the hundreds of billions of dollars to a
trillion dollars by 2035, industry respondents ranked
aging infrastructure as the single most important water
industry issue today. Regardless of an exact dollar value,
the bottom line is the potential for catastrophic failures in
our water/wastewater infrastructure is a ticking time bomb
waiting for a place to happen.
Responding to the growing surge of renewal and
replacement needs will not be a one-time challenge. Most
of our nation's utility infrastructure was built in the post-
World War II era, starting with significant projects launched
in the 1950s, and these aging assets are only the starting
point. Once issues with 1950s assets are addressed
there are projects from the 1960s and 1970s, and so on
that wilt require extensive maintenance to comply with
regulatory mandates, contain costs and improve system
reliability and safety, and other key drivers of water utility
investment. Simply put water utilities recognize that
they will be dealing with the renewal and replacement of
infrastructure for as long as people need water - forever.
The best way to confront this issue is to address the
need immediately by analyzing system needs correctly,
developing long-term management plans and finding
funding sources thoughtfully. Perhaps most importantly,
we will need to find the courage and political will to
raise rates to fund these improvements appropriately.
Patchwork and marginal actions today will only lead to
even larger challenges tomorrow.
INEINEERMOMMIR SWAM MOM a
THE BOTTOM LoINE IS
THE POTENTI FOR
CATASTROPHIC FAILURES
IS A 'PICKING TIME COMB
WAIT/NG FOR A PLACE
TO HAPPEN.
Complicating the options for utility executives and
municipal boards is that 85.4 percent of industry
respondents believe that the average man or woman
on the street has little to no understanding of the gap
between the cost of producing safe water and the current
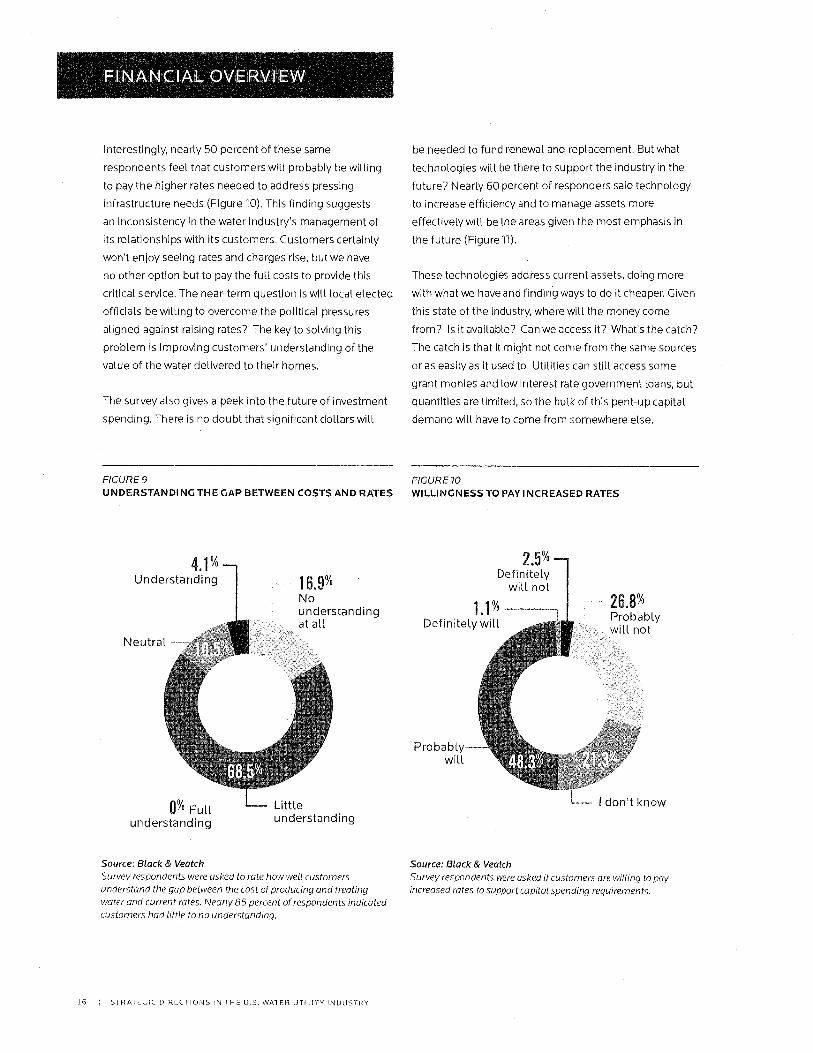
rates paid by consumers (Figure 9 on page 16). In most
cases, the public has virtually no concept of the value of
water. This lack of awareness is clearly a "call to arms"
for the water industry.
14 STRATEGIC DIRECTIONS IN THE U.S. WATER UTILITY INDUSTRY

,:.,,.
'*•^Fri a
r~
,'~.r J`
-.~;a
.~, . £
,t,
Neutral -
4.1% Understanding 16.9 %
No understanding at all
2.5% Definitely
will not
1.1% Definitely will
Probably will
26.8% Probably will not
- I don't know 0% Full
understanding
Little understanding
FINANCIAL OVERVIEW
Interestingly, nearly 50 percent of these same
respondents feel that customers wilt probably be witting
to pay the higher rates needed to address pressing
infrastructure needs (Figure 10). This finding suggests
an inconsistency in the water industry's management of
its relationships with its customers. Customers certainly
won't enjoy seeing rates and charges rise, but we have
no other option but to pay the full costs to provide this
critical service. The near-term question is will local elected
officials be willing to overcome the political pressures
aligned against raising rates? The key to solving this
problem is improving customers' understanding of the
value of the water delivered to their homes.
The survey also gives a peek into the future of investment
spending. There is no doubt that significant dollars will
FIGURE 9
UNDERSTANDING THE GAP BETWEEN COSTS AND RATES
be needed to fund renewal and replacement. But what
technologies will be there to support the industry in the
future? Nearly 60 percent of responders said technology
to increase efficiency and to manage assets more
effectively will be the areas given the most emphasis in
the future (Figure11).
These technologies address current assets, doing more
with what we have and finding ways to do it cheaper. Given
this state of the industry, where will the money come
from? Is it available? Can we access it? What's the catch?
The catch is that it might not come from the same sources
or as easily as it used to. Utilities can still access some
grant monies and low interest rate government loans, but
quantities are limited, so the bulk of this pent-up capital
demand will have to come from somewhere else.
FIGURE 70
WILLINGNESS TO PAY INCREASED RATES
Source: Black & Veatch
Survey respondents were asked to rate how well customers
understand the gap between the cost of producing and treating
water and current rates. Nearly 85 percent of respondents indicated
customers had little to no understanding.
Source: Black & Veatch
Survey respondents were asked if customers are willing to pay
increased rates to support capital spending requirements.
16 STRATEGIC DIRECTIONS IN .11-1E U.S
ATER UTILITY INDUSTRY

29.0%
30.9%
FIGURE 11 NEW TECHNOLOGY EMPHASIS
13.3% 6 .4%
Technologies to assure
safety
J414`4r14.4
1.9 %
Technologies to meet
regulatory requirement
18.5%
Technologies to increase efficiency
Technologies to manage
assets more effectively
Technologies to control
costs
Technologies to improve services to customers
Source: Black & Veatch Survey participants were asked to select one of the above choices regarding technologies the industry should emphasize.
Nearly 74 percent of respondents feel that infrastructure
renewal has a strong impact on the financial health of their
utility. Physical assets are examined, deterioration rates
are estimated, and in many cases, the operational impacts
of aging infrastructure are analyzed and quantified. But
finding the resources to respond to these needs continues
to be difficult. According to respondents, only 27 percent
believe that funding will be sufficient (Figure 12 on the
next page).
Respondents suggest that the revenue bond market will
be their primary financing vehicle, but post-2008 financial
due diligence standards are significantly more stringent
than before, making it unlikely that the market will support
the vast quantity of bonds necessary to fund needed
projects. Rating agencies and institutional investors
expect significantly increased disclosure of operating and
financial conditions, and solid reports on non-financial,
regulatory, management and local economic conditions
are required for municipalities to obtain favorable
ratings and interest rates. For many water utilities and
municipalities, this will require the search for alternative
funding streams, many of which have not yet been
examined (Figure 13 on the next page).
Numerous industry forecasts, reviews, outlooks and
projections indicate that the capital requirements to solve
the aging infrastructure problem are so large that the
public sector will have to consider other sources beyond
just traditional bond financing. Yet the respondents
indicate very limited interest in any form of public-
private partnerships. The hurdles are likely varied in
different locations, and may reflect political resistance,
management resistance, or perceptions regarding legal
constraints or the costs and value of potential financial
arrangements.
Privately managed infrastructure funds with billions of
dollars available for investment in water/wastewater
infrastructure should recognize that regardless of the
reason, private investment in municipal water assets is
still viewed with suspicion. Proponents of public-private
partnerships have significant work ahead of them if
they are to become a meaningful part of the answer to
the water industry's thirst for capital, but those within
the industry must recognize that the old ways of doing
business have circled the drain.
BLACK & VEATCH i 17

34.0% 29.6% 26.7% 9 .7%
Funding will not be enough
Funding will just meet the requirement Funding will
be sufficient
I'm not sure
FIGURE 72
FUNDING AVAILABILITY FOR CAPITAL INFRASTRUCTURE PROJECTS
Source: Black & Veatch
Survey participants were asked, "How available is funding for capital infrastructure projects for your utility during the next ve to 10 years?" Just over one-fourth stated ''Funding will be sufficient."
FIGURE 13
FINANCING METHODS ADOPTED OR CONSIDERED TO SUPPORT CAPITAL NEEDS
■ Adopted already
-• Considering for the • Not adopted or upcoming years considered at all
00
U,
O
Alternative Alternative Municipal State Regional Public- Other rate structure tax general revolving tax sharing private
structures obligation or funds partnerships revenue bonds
Source: Black & Veatch
18 I STRATEGIC DIRECTIONS IN THE U.S WATER UTILITY INDUSTRY

SUSTAINABILITY AND THE WATER-ENERGY NEXUS BY STEVE TARALLO AND BOB HULSEY
More than five years have passed since the concept of "sustainability" entered
the mainstream of the water industry. "Exactly what does sustainability mean and how does it apply to my utility?" and "Is sustainability just a passing fad?" were recurring questions when the term originally surfaced.
Today, local and national association conferences,
seminars, webinars and other water industry events,
typically include elements devoted to all things
"sustainable." Industry research organizations develop
and support projects that investigate sustainability
concepts and assessment methods and toots. In addition,
a growing number of utilities are applying sustainability
tools and methods to address significant operational
challenges and capitalize on opportunities to advance
strategic objectives.
The water industry generally now accepts that
sustainability can mean different things to different
utilities and that it is certainly not a passing fad.
Rather, sustainability is now widely viewed as a utility
management framework that can provide significant
benefits. Evidence of this trend is reflected in the survey
results: Nearly all of the respondents think sustainability is
important, and more than half consider it to be a strategic
focus for their utilities (Figure 14).
The issues and challenges that drive water utilities to
seek sustainable solutions are as diverse as the industry
itself. Although it is generally accepted that using
less non-renewable energy, chemicals and water is
environmentally sustainable and the right thing to do,
many utilities historically have assigned more weight to
practical, local economic and community/social issues
when making decisions. These economic and community/
social considerations are region- and utility-specific and
often drive utility strategic planning activities. Meeting
regulatory requirements and serving the community
are generally paramount. In appraising the potential to
invest in largely discretionary sustainability programs
and projects, the industry has embraced, and many
utilities have begun to apply, the Triple Bottom Line
20 STRATEGIC DIRECTIONS iN THE U.S. WATER UTILITY INDUSTRY
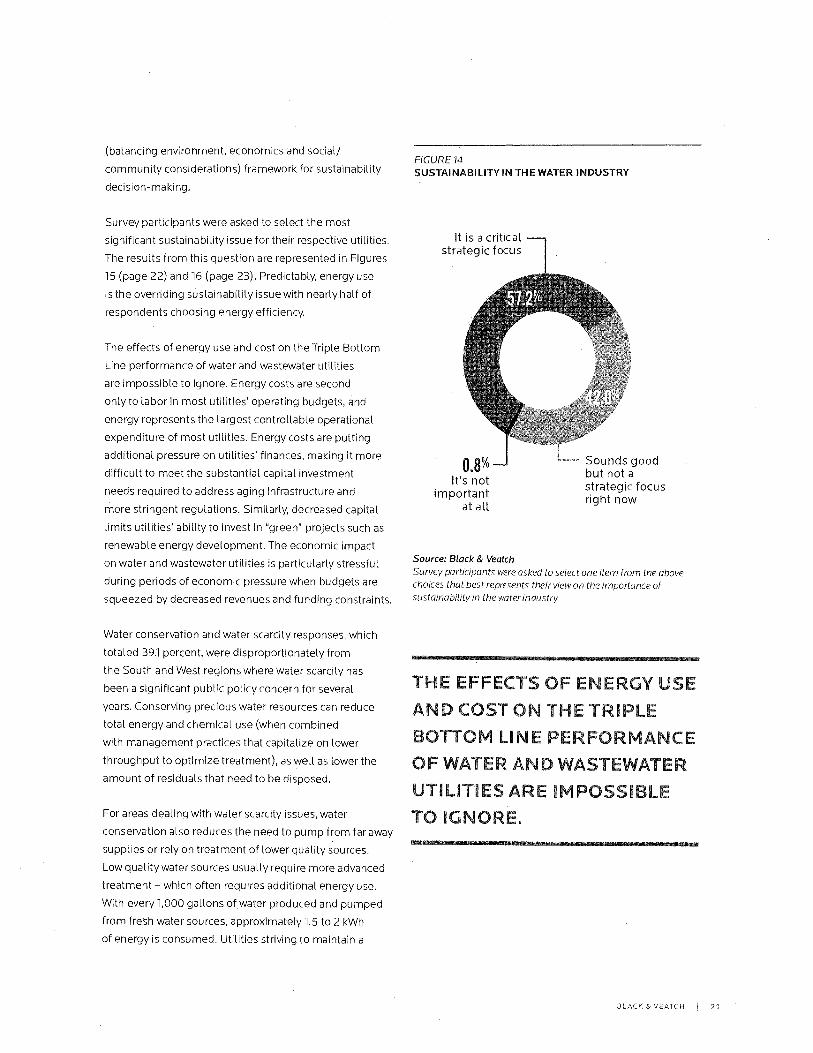
It is a critical strategic focus
0.8% — It's not
important at all
Sounds good but not a strategic focus right now
(balancing environment, economics and social/
community considerations) framework for sustainability
decision-making.
Survey participants were asked to select the most
significant sustainability issue for their respective utilities,
The results from this question are represented in Figures
15 (page 22) and 16 (page 23). Predictably, energy use
is the overriding sustainability issue with nearly half of
respondents choosing energy efficiency.
The effects of energy use and cost on the Triple Bottom
Line performance of water and wastewater utilities
are impossible to ignore. Energy costs are second
only to labor in most utilities' operating budgets, and
energy represents the largest controllable operational
expenditure of most utilities. Energy costs are putting
additional pressure on utilities' finances, making it more
difficult to meet the substantial capital investment
needs required to address aging infrastructure and
more stringent regulations. Similarly, decreased capital
limits utilities' ability to invest in "green" projects such as
renewable energy development. The economic impact
on water and wastewater utilities is particularly stressful
during periods of economic pressure when budgets are
squeezed by decreased revenues and funding constraints.
Water conservation and water scarcity responses, which
totaled 39.1 percent, were disproportionately from
the South and West regions where water scarcity has
been a significant public policy concern for several
years. Conserving precious water resources can reduce
total energy and chemical use (when combined
with management practices that capitalize on lower
throughput to optimize treatment), as well as lower the
amount of residuals that need to be disposed.
For areas dealing with water scarcity issues, water
conservation also reduces the need to pump from far away
supplies or rely on treatment of lower quality sources.
Low quality water sources usually require more advanced
treatment - which often requires additional energy use.
With every 1,000 gallons of water produced and pumped
from fresh water sources, approximately 1.5 to 2 kWh
of energy is consumed. Utilities striving to maintain a
FIGURE 14 SUSTAINABILITY IN THE WATER INDUSTRY
Source: Black & Veatch Survey participants were asked to select one item from the above choices that best represents their view on the importance of sustainability in the water industry.
..TSIEWSN
THE • VrECTS OF ENERGY USE
AND COST C A THE "TRIPLE
BOTTOM UNE PERFORMANCE
OF WATER AND 7. - 2ASTEWATER
UTILITIES 'ARE IMPOSSIBLE
TO IGNORE. - ASIOMMUESM=VISM
BLACK & VEATCH 21

Energy efficiency
Other -
21.6% Water
scarcity
Water conservation
5.3 Chemical use
sustainable supply of potable water need to also consider
the energy required to move water from its source to
consumers' taps.
Where brackish water merits consideration as a primary or
secondary source, energy is a major factor. An additional
1 to 4 kWh of electricity is required for every 1,000 gallons
of produced potable water. Furthermore, inland systems
face additional issues related to the disposal of the brine
produced from desalting. Although research in this area is
uncovering novel uses for the salt content of treated brine,
including the production of salable fertilizer products,
managing brine is still a significant challenge for utilities.
Saving water means saving energy and chemicals, which
in turn makes an important resource - capital - more
available for other uses.
While research into more effective means of separating
salt from seawater has reduced the energy needs of
desalination, it is still more sustainable to treat water with
tower dissolved solids - especially when, as the survey
shows, an alternative source such as "gray water" reuse is
an option. Reclaimed wastewater is of growing interest to
utilities worldwide as a reliable, pathogen-free source for
irrigation and other industrial uses. This holds true even
when advanced treatment for nutrient removal is required,
as using the water closest to the need, lowest in salinity
and in plentiful supply can satisfy growing requirements
for industrial, agricultural and other non-potable
demands.
Of the nearly 8 percent of respondents who think
"other" issues are most important, a large majority
..v!4.14 ,41110111011111111MINIOSIIIII
FIGURE 15
MOST SIGNIFICANT SUSTAINABILITY ISSUES
Source: Black & Veatch
Survey participants were asked which of the above sustainability issues is the most significant for their water utility.
a”ISERVMG PRECIOUS
WATER RESOURCES CAN
REDUCE TOTAL ENERGY Art)
CHEWICAL USE, ar‘S WELL
AS LOWER THE AMOUNT OF
RESIDUALS THAT NEED TO
BE DISPOSE.
22 STRATEGIC DIRECTIONS IN THE U.S WATER UTILITY INDUSTRY

identified "aging infrastructure" and "fiscal sustainability/
economics" as the most significant sustainability issues.
These results reflect the generally strong connections in
the minds of utility personnel among asset management,
financial health and sustainability.
Sustainability is increasingly viewed within the water utility
industry as a driver for investment and positive returns
(a value mindset) as opposed to strictly an environmental
concept. Asset management facilitates a positive feedback
Loop between investments in energy efficiency and aging
infrastructure. A clear example of this loop is the repair/
replacement of deteriorating pipes to reduce water loss/
leakage from a water distribution system, which includes
energy-intensive pumping within the cycle. Every day,
approximately 7 billion gallons of precious potable water
is lost through leaking pipes and mains. This represents
a tremendous amount of energy that must be used to
replace water tosses within the system. By minimizing
leaks, asset management activities reduce energy
consumption, conserve water and reduce other negative
environmental impacts, while extending the life and value
of the water distribution assets. Wastewater utilities can
reduce energy requirements and simultaneously improve
effluent quality through process control automation and
replacement of aged, oversized blowers and pumps with
new, high-efficiency blowers and pumping systems.
Energy costs can account for as much as 30 percent of
most utilities' operating budgets and account for more
than 85 percent of water utility greenhouse gas emissions.
It is not surprising that the survey results indicate that
FIGURE 16
REGIONAL VIEW OF MOST SIGNIFICANT SUSTAINABILITY ISSUES
co Cv)
Northeast South Midwest West
Energy Chemical
Water
Water I Other Efficiency Use
Conservation Scarcity
Source: Black & Veatch
BLACK & VEATCH 1 23

Energy efficiency/optimization/management
Energy recovery from biosolids
Sustainable water planning
the focus for sustainable energy management efforts
is first on planning and "low-hanging fruit" solutions for
energy efficiency/conservation, such as installing variable
frequency drives and premium efficiency motors. More
than 75 percent of the survey respondents said their
utilities had undertaken "energy efficiency/optimization/
management" for "water sustainability in relationship to
energy" (Figure 17).
Energy management activities can range from reducing
energy consumption through fragmentary application of
energy efficiency measures, to becoming energy-neutral
(generating as much energy as consumed) or even
becoming net energy producers. Increasing automation
of high energy-consuming processes and systems, such
as aeration at wastewater treatment plants or distribution
system pumping for water utilities, and making treatment
plant operations more energy efficient are good starting
points. This is especially true for smaller utilities that want
to reduce energy use and save money but do not have
the financial or staff resources to effectively implement
larger-scale programs that involve major capital
expenditures and higher risk tolerance.
FIGURE 17 ACTIONS UTILITIES HAVE TAKEN FOR WATER SUSTAINABILITY IN RELATION TO ENERGY
77.5%
35.1%
32.9%
30.4%
30.4%
20.5%
12.3%
4.1%
4.7%
6.3% ir
Cogeneration/CHP
Solar power
Greenhouse gas emissions management
Hydro power
Wind power
I'm not sure
Other
20 1 30
80' 88 100
Source: Black & Veatch
Survey respondents were asked to select from all of the above actions they have taken in regards to energy use.
24 STRATEGIC DIRECTIONS IN THE U.S. WATER UTILITY INDUSTRY
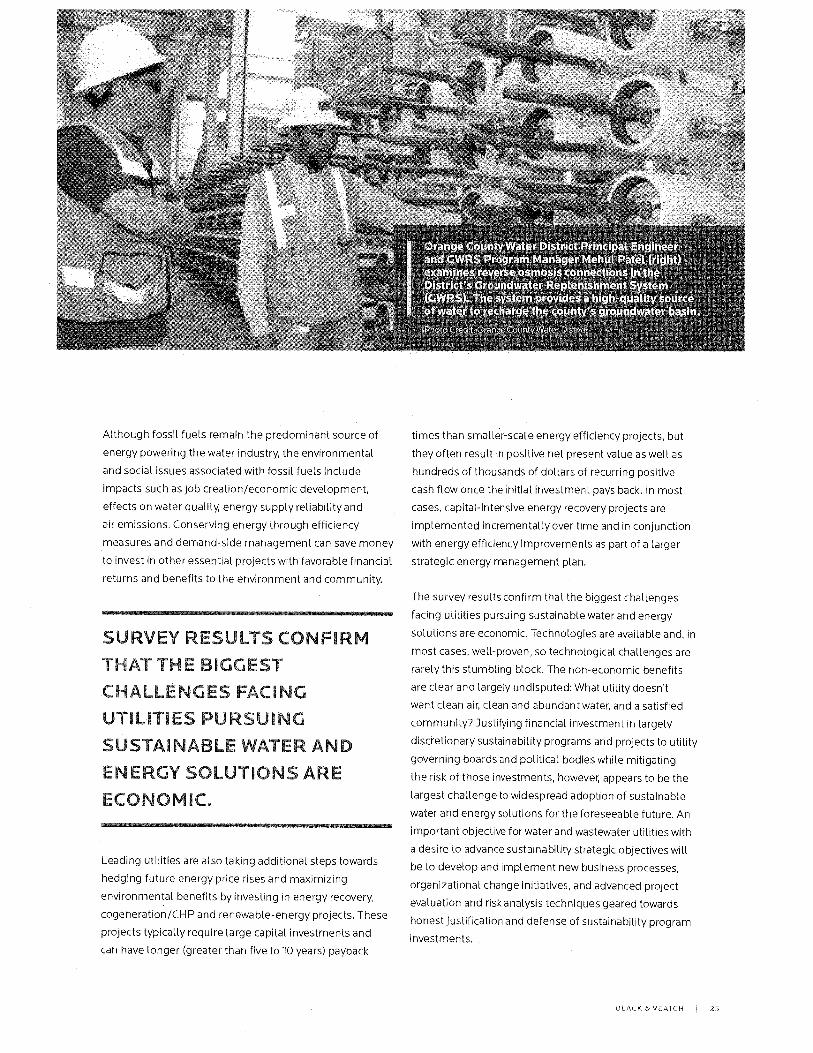
ty ng rogram Manager Mehul Patel (right) erse osmosis connections in the undwater Replenishment System system provides a high-quality source charge the county's groundwater basi
Although fossil fuels remain the predominant source of
energy powering the water industry, the environmental
and social issues associated with fossil fuels include
impacts such as job creation/economic development,
effects on water quality, energy supply reliability and
air emissions. Conserving energy through efficiency
measures and demand-side management can save money
to invest in other essential projects with favorable financial
returns and benefits to the environment and community.
MaWes5V`i
SURVEY RESULTS CONFIR,
HAT THE b1GGEST
CHALLENGES r2ACING
UTILITIES PURSUING
SUSTAINABLE WATER. AND
ENERGY SOLUTIONS ARE
ECONOMIC. g REIMM
Leading utilities are also taking additional steps towards
hedging future energy price rises and maximizing
environmental benefits by investing in energy recovery,
cogeneration/CHP and renewable-energy projects. These
projects typically require large capital investments and
can have longer (greater than five to 10 years) payback
times than smaller-scale energy efficiency projects, but
they often result in positive net present value as well as
hundreds of thousands of dollars of recurring positive
cash flow once the initial investment pays back, In most
cases, capital-intensive energy recovery projects are
implemented incrementally over time and in conjunction
with energy efficiency improvements as part of a larger
strategic energy management plan.
The survey results confirm that the biggest challenges
facing utilities pursuing sustainable water and energy
solutions are economic. Technologies are available and, in
most cases, welt-proven, so technological challenges are
rarefy this stumbling block. The non-economic benefits
are clear and largely undisputed: What utility doesn't
want clean air, clean and abundant water, and a satisfied
community? Justifying financial investment in largely
discretionary sustainability programs and projects to utility
governing boards and political bodies white mitigating
the risk of those investments, however, appears to be the
largest challenge to widespread adoption of sustainable
water and energy solutions for the foreseeable future. An
important objective for water and wastewater utilities with
a desire to advance sustainability strategic objectives will
be to develop and implement new business processes,
organizational change initiatives, and advanced project
evaluation and risk analysis techniques geared towards
honest justification and defense of sustainability program
investments.
BLACK & VEATCH I 25

ASSET MANAGEMENT OVERV!EV BY WILL WILLIAMS
Aging water and wastewater infrastructure was identified by the water utilities
participating in the survey as one of the most important issues currently facing the industry, along with managing capital costs, energy costs and obtaining
capital funding. The potential for system deterioration due to age is further compounded by expectations for growth (90 percent of survey participants
indicated annual system growth was forecasted) that would further stress existing facilities.
To deal with these issues, many water utilities are
implementing asset management programs. However, in
many respects, the United States is playing catch up to
leading water utilities in the UK and Australia where asset
management has been at the forefront of delivering high
levels of service to customers and efficiencies within the
industry for years. In those markets, regulation has been
the main driver of water utility action and we note that
survey respondents identified regulatory compliance as
one of the main drivers for infrastructure investment here
in the United States as well.
Less than 27 percent of survey participants believe
that funding will be sufficient to meet future operating
needs. Also noted was the need to do more with existing
infrastructure. Good asset management practices
represent a proven methodology for water and wastewater
utilities to maximize ratepayers' ROl, extend asset life
and reduce life-cycle costs. In plain terms, an asset
management framework allows an organization to
determine:
• What assets it owns.
• What condition its assets are in.
• How these assets are performing.
• What service it currently delivers and what it needs to deliver in the future
• What risks there are to the services
• What assets will cost over their planned life
• When assets need to be repaired or replaced and how.
• What may need to be done differently in the future
26 STRATEGIC DIRECTIONS IN THE U.S.WATER UTILITY INDUSTRY

FIGURE 78
CURRENT STATUS OF ASSET MANAGEMENT PROGRAMS
No asset management
maturity assessment/
review or improvement
program
Maturity assessment/ review carried
out but no improvement
program in place
Maturity assessment/ review carried
out and improvement
program being implemented
Improvement program being implemented,
but no formal asset management
maturity assessment
or review has been
carried out
32% 16% 35%
Source: Black & Veatch
Survey participants were asked to select one of the above choices that best represents the status of asset management programs at their utilities.
In seeking to improve asset management within an
organization, it is advisable to undertake an asset
management maturity assessment or gap analysis
and compare results against good practice. From this
assessment an asset management improvement program
can be developed. Survey participants were asked if
their utility had carried out a gap analysis and/or were
implementing an improvement program. Overall, roughly
a third (32 percent) of respondents stated no asset
management assessment or improvement programs were
in place or ongoing (Figure 18).
Interestingly, 17 percent of respondents were
implementing an improvement program without having
carried out an initial asset management assessment.
It is difficult to implement an effective improvement
program without first identifying what the existing
gaps are and what the priorities are for improvement.
Black & Veatch always recommends undertaking some
form of assessment before deploying capital. The highest
proportion of utilities implementing an improvement
plan without an assessment are located in the Northeast
(36 percent).
There is a tremendous disparity among utilities serving
smaller populations versus larger utilities when it comes
to implementation of asset management programs.
Nearly two-thirds (63 percent) of utilities serving
populations less than 50,000 stated they had no asset
management assessments or improvement program
(Figure 19 on the next page). Here there is clearly room
for improvement from the smaller organizations. Size
is not a barrier to development of asset management
programs and effective measures of service.
BLACK VEARH 27

FIGURE 79
CURRENT STATUS OF ASSET MANAGEMENT ASSESSMENTS AND/OR IMPROVEMENT PROGRAMS BY SIZE OF POPULATION SERVED
M Population less than 50,000
Population between M Population greater 50,0000 and 100,000 than 100,000
No asset Maturity Maturity Improvement management assessment/ assessment/ program being
maturity
assessment/review
review carried out,
but no improvement review carried out
and improvement implemented, but
no formal asset or improvement program in place plan being management
program implemented maturity assessment
or review has been
carried out
Source: Black & Veatch
28 I STRATEGIC DiRECTIONS IN THE U.S. WATER UTILITY INDUSTRY
DATA QUALITY
High-quality data has the potential to transform a utility's
operations through improved business processes and
streamlined operations, as well as prioritize capital
investments. However, success in maximizing efficiencies
is directly determined by the quality of data received from
the asset management systems. Survey participants were
asked to rate the quality of their asset information. This
information is depicted in Figure 20 on the next page and
shows the percentage of respondents who chose "good"
or "very good" when asked about the quality of specific
asset data.
Nearly 70 percent of respondents believe their basic asset
information, such as the number of assets, type, size,
capacity and age, as noted in the "asset characteristic"
section is largely viewed as good or very good (note:
77 percent of water-only utility participates selected good
or very good). For other data, such as asset condition and
performance as well as replacement costs and value,
the percentage of respondents who select "good" or
"very good" declines. Also noteworthy is that there is
no significant difference between utilities that provide
water only services, water and wastewater services, or
wastewater only services, related to the quality of data in
these areas, indicating this is an industry-wide challenge.
However, this still leaves nearly half of respondents who
reported their data as being average, poor or very poor.
This is an important area for improvement, as without
good quality data, utility leaders will be hard-pressed
to plan, prioritize and justify capital programs and
improvements.
RISK MANAGEMENT
Risk management is a key component of effective asset
management and can be described as achieving the
optimal balance between cost, risk and performance (or
levels of service). Again, data is the essential ingredient
for managing and improving utility operations in this area.
Survey participants were asked how risk was managed
within their utility. Responses to this question indicate
the majority of respondents use risk management
for some asset groups or the majority of their assets
(Figure 21 on page 31). Most of the utilities that stated that
risk assessment processes were in place for the majority
of assets also answered "Yes - for the majority of the
assets" to the other three questions on risk management.
Another valuable set of data for utilities is level of service
indicators. Industry best practice calls for levels of service
indicators to be based on stakeholder requirements in
order to be most effective and meaningful. Examples
of levels of service indicators include water quality
compliance, number of main breaks per 100 miles,
number of sanitary sewer overflows per 100 miles and
wastewater treatment compliance. Service levels should
be key drivers in asset management planning. With
sufficient data and good models, impacts on levels of
service can be analyzed for different investment scenarios.
THERE IS A TR . JENDOUS DISPARITY AMONG wasmis
SERVING SMALLER POPULATIONS VERSUS LARGEv.
UTILITIES WHEN IT COMES TO IMPLEMENTI,LON OF ASSET
JAGEMENT PROGRAMS -. SIZE IS NOT A BARRIER TO
DEVELOPMENT OF ASSET MANAGEMENT PRCGRAMS AND
CTIVE MEASURES OF SERVICE.
BLACK VEATCH 29

FIGURE 20 QUALITY OF DATA ON UTILITY ASSETS RATED "GOOD" OR "VERY GOOD"
Asset characteristics (number, type, size, capacity,
age, etc.)
Asset operation and maintenance
costs
Asset condition and performance
Asset replacement costs/asset
value
68% 53 % 57%
47%
Source: Black & Veatch Survey participants were asked to describe the quality of their information on the assets their utility owns and operates. The chart above provides total percentage of respondents who ranked data as "good" or "very good" for each area.
Survey participants were also asked how their
organizations use levels of service indicators to measure
service provided to customers and to inform their asset
management planning. The results show that the majority
(84 percent) of utilities monitor levels of service provided
to customers. However, only 30 percent of respondents
said that their levels of service indicators were influenced
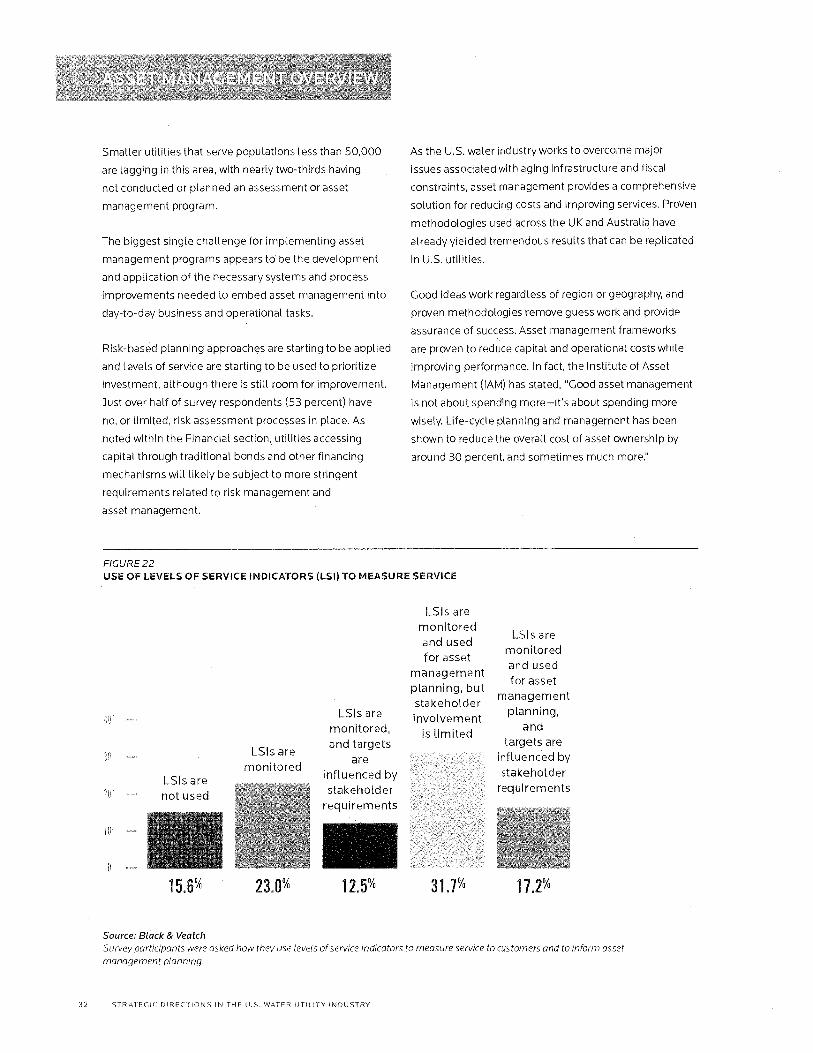
by stakeholder requirements (Figure 22 on page 32).
The following provides additional survey data related to
level of service indicators:
e Nearly half (49 percent) of respondents are incorporating levels of service in their asset management planning.
a A higher proportion of water-only utilities (57 percent) use levels of service in planning as compared with water and wastewater (49 percent) and wastewater-only utilities (47 percent).
a 38 percent of utilities serving a population of less than 50,000 do not use levels of service indicators. This is a significant difference when compared with utilities serving larger populations
CHALLENGES AND CONCLUSION
With nearly half of all survey participants indicating they
have no assessment or asset management programs
ongoing or in place, we now took at the challenges of
implementing this essential toot for utility organizations.
Survey participants were asked to identify the main
challenge for implementing an asset management
program at their utility and results of this question are
highlighted in Figure 23 on page 33.
The majority of respondents identified developing the
required systems and processes needed to improve asset
30 STRATEGIC DIRECTIONS IN THE U.S. WATER UTILITY INDUSTRY

Impacts on levels of
service are incorporated within risk
assessments
Risk assessment
processes are in place and
in use
Asset renewal/
replacement programs are
based on assessment of asset risk
ITS.
Critical assets have been identified and risk
assessments carried out on them
FIGURE 27
STATUS OF ASSET RISK MANAGEMENT PROGRAMS
No
To a M For some
Yes - for the limited extent asset groups majority of
assets
Source: Black & Veatch
Survey respondents were asked to select the appropriate response for each of the above statements related to how asset risk is managed at their utility.
management as their main challenge. This appears to be
more of a challenge for medium-sized utilities (100-499
employees), where 73 percent selected this answer. By
comparison, 50 percent of small utilities (less than 100
employees) and 55 percent of large utilities (more than
500 employees) selected this response. The responses
to this question came from a broad range of utilities
that were at various stages of their asset management
programs and therefore there was no bias, either from
utilities that had not yet started their program or those
that were already at an advanced stage of implementation.
There was no correlation between those utilities that
selected lack of asset data as their main challenge and
those that reported their asset data as being poor. In fact,
a number reported their data was good or very good. This
leads us to conclude that utilities do not have uniform
coverage or quality of data across their complete asset
stock and that data improvement is still a key challenge.
In order to get the most out of their asset management
programs, utilities need to be able to perform
sophisticated analysis on the asset data, so its quality
and quantity are important factors that require
careful consideration and investment in long-term
improvement plans.
Overall, the picture is one of a utility sector that is
beginning to rise to the challenge of implementing
asset management programs. The majority (68 percent)
of respondents have started an asset management
improvement program in some form. Decisions are
being made based on asset data that is generally of
good quality, with nearly half of utilities now basing their
asset management decisions around levels of service.
BLACK E. VEATCH 31
Smaller utilities that serve populations less than 50,000
are lagging in this area, with nearly two-thirds having
not conducted or planned an assessment or asset
management program.
The biggest single challenge for implementing asset
management programs appears to be the development
and application of the necessary systems and process
improvements needed to embed asset management into
day-to-day business and operational tasks.
Risk-based planning approaches are starting to be applied
and levels of service are starting to be used to prioritize
investment, although there is still room for improvement.
Just over half of survey respondents (53 percent) have
no, or limited, risk assessment processes in place. As
noted within the Financial section, utilities accessing
capital through traditional bonds and other financing
mechanisms will likely be subject to more stringent
requirements related to risk management and
asset management.
As the U.S. water industry works to overcome major
issues associated with aging infrastructure and fiscal
constraints, asset management provides a comprehensive
solution for reducing costs and improving services. Proven
methodologies used across the UK and Australia have
already yielded tremendous results that can be replicated
in U.S. utilities.
Good ideas work regardless of region or geography, and
proven methodologies remove guess work and provide
assurance of success. Asset management frameworks
are proven to reduce capital and operational costs while
improving performance. In fact, the Institute of Asset
Management (IAM) has stated, "Good asset management
is not about spending more—it's about spending more
wisely. Life-cycle planning and management has been
shown to reduce the overall cost of asset ownership by
around 30 percent, and sometimes much more."
FIGURE 22
USE OF LEVELS OF SERVICE INDICATORS (LSI) TO MEASURE SERVICE
LSIs are not used
LSIs are monitored
LSIs are monitored, and targets
are influenced by stakeholder
requirements
LSIs are monitored and used for asset
management planning, but stakeholder involvement
is limited
LSIs are monitored and used for asset
management planning,
and targets are
influenced by stakeholder
requirements
15.6%
23.0%
12.5 %
31.7%
17.2%
Source: Black & Veatch
Survey participants were asked how they use levels of service indicators to measure service to customers and to inform asset
management planning.
32 STRATEGIC DIRECTIONS IN THE U.S. WATER UTILITY INDUSTRY
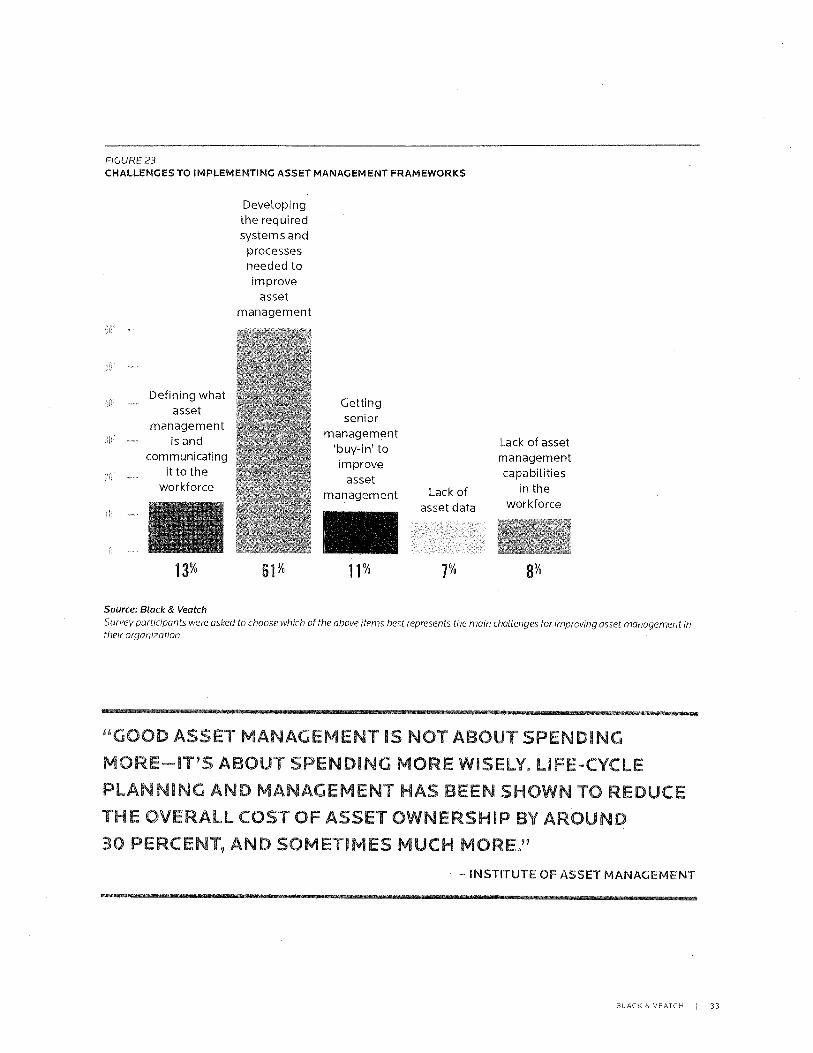
FIGURE 23 CHALLENGES TO IMPLEMENTING ASSET MANAGEMENT FRAMEWORKS
Developing the required
systems and processes needed to improve
asset
management
Defining what asset
management is and
communicating it to the
workforce
Getting senior
management 'buy-in' to improve
asset management Lack of
asset data
Lack of asset management capabilities
in the workforce
13% 61%
11%
7% 8%
Source: Black & Veatch
Survey participants were asked to choose which of the above items best represents the main challenges for improving asset management in their organization.
"GOOD ASS ANAGEMENT IS NOT .".BOUT SPENDING
MORE-IT'S ABOUT SPENDING MORE WISELY. LIFE-CYCLE
PLANNING AND MANAGEWNT HAS BEEN SHOWN TO REDUCE
THE OVERALL COST OF ASSET OWNERSHIP BY AROUND
30 PERCEN AND SOMETIMES MUCH MORE"
- INSTITUTE OF ASSET MANAGEMENT
BLACK & VEATCH 33
7 Q
BY JOHN CHEVRETTE
In the wake of the Great Recession many municipalities are managing their
finances in a fashion similar to U.S. households in the pre-crisis days. Rather than focusing on strategic, long-term investments, municipalities are operating
essentially paycheck-to-paycheck on a year-in and year-out cash budget. In response to falling property and sales tax revenues, municipalities are putting off essential items in order to pay for past spending, and just as it impacts
individuals, this behavior ultimately affects the long-term financial health and livability of a community.
Unlike consumers, however, municipalities don't have
the option of simply cutting back or going to discount
stores and big-box retailers to help save on essential
needs. Fixed costs, such as tabor, pension obligations
and infrastructure maintenance are heavy burdens on
municipal finances that lag the overall economic recovery.
As a result, cities are forced to make hard decisions
related to spending in other areas, such as fire and police
department budgets, parks and other essential services
that make cities safe and desirable places to live.
The result of this cycle is to kick the proverbial can
of capital improvements and maintenance of critical
infrastructure down the road to the next year, and the year
after that, for as far as the cycle and the condition of the
assets will allow. Breaking the cycle requires a significant
change in how utilities develop and implement strategic
and capital plans, New and innovative thinking is required
when it comes to rates, funding mechanisms, and the
prioritization and implementation of capital. But, one
lesson should be clear in the minds of all involved in the
decision making process—it costs significantly less to
maintain and enhance an existing system than it does to
build or replace one.
VJNlCiPALITIES DON'T
HAVE THE OPTION
SIMPLY CUTTING BACK ...
TO HELP SAVE ON
ESSENTIAL NEEDS. FIXED
COSTS, SUCH AS LABOI:,
PENSION OBLIGATIONS
AND INFRASTRUCTURE
MAI NTE NAN C E ARE HEAVY
BURDENS ON MUNICIPAL
FINANCES THAT LAG 'FHE
OVERALL EC NOMIC
RECOVERY.
34 STRATEGIC DIREC TIONS IN THE U.S. WATER UTILITY INDUSTRY

Moving ahead, the water industry needs to look at the
rate structure and adjust how rates are determined to
encourage utilities to promote conservation without
creating additional financial hardship for municipalities. In
source-rich, capital-intensive systems, conservation efforts
and consumption-based revenue can be at loggerheads as
decreased consumption denies providers of much needed
funds. The deployment of new smart infrastructure
technologies can help increase overall system efficiency
and provide the critical data streams that would allow new
approaches to pricing.
Further, consumers must come to the harsh reality and
understand that water is not free. Consumers rely on the
critical infrastructure services provided by municipalities
to obtain and dispose of this precious resource. Water is
a critical element of goods and services, and the systems
must be paid for in an equitable and responsible manner.
While many other goods and services—perhaps a latte at
the local coffee shop or the latest electronic device—have
immediate "can't live without" appeal, without water, that
won't be an issue.
Investments at the local level supports construction and
engineering jobs, promotes sales among local business
for goods and services, and can act as a general jump start
for struggling local economies. The need is there and so
too are the opportunities to tap into a new water future.
0 [XS i0U" .0 BO'
CLEAR !NDS ALL
INVOLVED IN XISION
MAKING 7.-) ROC.:.it- -Ii COSTS
SIGNIFICANTLY LEES TO
MAINTAIN AND ENHANC
AN EXIST NG SYSTEM
F. DOES TO BUILD OR
REPLACE Oli ' " f
In addition to the new responsibilities of water utilities and
consumers, municipal government leaders, namely city
councils, mayors and city managers, must understand the
fiscal realities of the post-financial crisis era. City leaders
must look at all avenues for funding critical infrastructure
improvements, including increased involvement with
the private sector through public-private partnerships.
Rather than focus on the issue of "who controls what," we
must broaden the conversation to focus on the long-term
benefits to the residents, ratepayers and the environment.
Political will and courage must be drawn up in order to do
what is right for the long term.
The good news associated with increasing rates and
spending on critical water and wastewater infrastructure is
the profound economic benefits this investment provides
at a local, regional and national level. In 2009, the Clean
Water Council published its report "Sudden Impact" that
states, "Investment in water and wastewater infrastructure
has immediate, substantial and far-reaching effects on
the economy. At the national level, an investment of
$1 billion almost triples in size as total demand for goods
and services reaches an estimated $2.87 to $3.46 billion."
BLACK & VEATCH 35
LEGAL NOTICE
Please be advised, this Survey was complied primarily based on information Black & Veatch received from third-parties and Black & Veatch was not requested to independently verify any of this information. Thus, Black & Veatch's reports' accuracy solely depends upon the accuracy of the information provided to us and is subject to change at any time. As such, it is merely provided as an additional reference toot, in combination with other due diligence inquiries and resources of user. Black & Veatch assumes no legal liability or responsibility for the accuracy, completeness, or usefulness of any information,
or process disclosed, nor does Black & Veatch represent that its use would not infringe on any privately owned rights. This Survey may include facts, views, opinions and recommendations of individuals and organizations deemed of interest and assumes the reader is sophisticated in this industry. User waives any rights it might have in respect of this Survey under any doctrine of third-party beneficiary. including the Contracts (Rights of Third Parties) Act 1999.
Use of this Survey is at users sole risk and no reliance should be placed upon any other oral or written agreement. representation or warranty relating to the information herein.
THIS REPORT IS PROVIDED ON AN "AS-IS" BASIS. BLACK & VEATCH DISCLAIMS ALL WARRANTIES OF ANY KIND, EXPRESSED OR IMPLIED,
INCLUDING, WITHOUT LIMITATION, ANY WARRANTY OF MERCHANTABILITY, FITNESS FOR A PARTICULAR PURPOSE OR NON-INFRINGEMENT.
BLACK & VEATCH. NOR ITS PARENT COMPANY, MEMBERS, SUBSIDIARIES, AFFILIATES, SERVICE PROVIDERS, LICENSORS, OFFICERS, DIRECTORS OR EMPLOYEES SHALL BE LIABLE FOR ANY DIRECT, INDIRECT, INCIDENTAL, SPECIAL OR CONSEQUENTIAL DAMAGES ARISING OUT OF OR RELATING TO THIS REPORT OR RESULTING FROM THE USE OF THIS REPORT, INCLUDING BUT NOT LIMITED TO DAMAGES FOR LOSS OF PROFITS, USE, DATA OR OTHER INTANGIBLE DAMAGES, EVEN IF SUCH PARTY HAS BEEN ADVISED OF THE POSSIBILITY OF SUCH DAMAGES,
In addition, user should place no reliance on the summaries contained in the Surveys, which are not intended to be exhaustive of the material provisions
of any document or circumstances. If any point is of particular significance, reference should be made to the underlying documentation and not to this - Survey. This Survey (and the content and information included therein) is copyrighted and is owned or licensed by Black & Veatch. Black & Veatch may restrict your access to this Survey, or any portion thereof, at any time without cause. User shall abide by all copyright notices, information, or restrictions contained in any content or information accessed through this Survey. User shall not reproduce, retransmit, disseminate, sell, distribute, perform, display, publish, broadcast, circulate, create new works from, or commercially exploit this Survey (including the content and information made available through this Survey), in whole or in part, in any manner, without the written consent of Black & Veatch, nor use the content or information made available through this Survey for any unlawful or unintended purpose.
36 STRATEGIC DIRECTIONS IN THE U.S. WATER UTILITY INDUSTRY
LDING A WORLD OF r:•IFF RENCE* stack & Veatch is an employee-owned, global leader in building Critical Ruman Infrastructure' in Energy, Water, Telecommunicat ons and Government Services. Since 1915, we have helped our clients improve the lives of people in over 100 countries through consulting, engineering, construction, operations and program management. Our revenues in 2011 were US $2.6 billion. Follow us on www.bv.com and in social media.
BLACK & VEATCH
11401 Lamar Avenue, Overland Park, KS 66211 P +1 913-458-2000 W bvcom
MIX Piper from
responible sources FSC
s
PSC' C103291
CO Black & Veatch Corporation, 2012. All Rights Reserved. The Black & Veatch name and logo are registered trademarks of Black & Veatch Holding Company. REV 2012-05
BLACK &VEATCH Building a world of difference.