2012 Report vF - Robert W. Baird &...
32
M&A Market Analysis Summer 2013 Industrial Distribution Industry Update Jason P. Kliewer Managing Director [email protected] +1.813.273.8242 Thomas E. Lange Managing Director [email protected] +1.813.273.8248 David M. Silver Managing Director Head of European Investment Banking [email protected] +44.207.667.8216 Anthony Siu Managing Director Head of Asia Investment Banking [email protected] +86.21.6182.0980 Satoshi Matsumoto Managing Director Director of Japan M&A [email protected] +1.312.609.5446 J. David Cumberland, CFA Director, M&A Research [email protected] +1.312.609.5429
Transcript of 2012 Report vF - Robert W. Baird &...

M&A Market Analysis Summer 2013
Industrial Distribution
Industry Update
Jason P. Kliewer Managing Director [email protected] +1.813.273.8242
Thomas E. Lange Managing Director [email protected] +1.813.273.8248
David M. Silver Managing Director Head of European Investment Banking [email protected] +44.207.667.8216
Anthony Siu Managing Director Head of Asia Investment Banking [email protected] +86.21.6182.0980
Satoshi Matsumoto Managing Director Director of Japan M&A [email protected] +1.312.609.5446
J. David Cumberland, CFA Director, M&A Research [email protected] +1.312.609.5429

Table of Contents Page
Please refer to Appendix – Disclaimers and Other Disclosures on page 29.
Executive Summary ............................................................................................ 1
Industrial Distribution Performance ................................................................... 2
Industrial Distribution M&A Analysis.................................................................. 6
Baird Industrial Distribution Research ............................................................. 10
Industrial Distribution Overview ...................................................................... 12
Sector Updates ................................................................................................. 13
Spotlight Transaction ....................................................................................... 17
Selected Companies ......................................................................................... 18
Selected LTM M&A Transactions ....................................................................... 22
Baird’s Recent Transaction Experience ............................................................. 24
Baird’s Industrial Distribution Team ................................................................ 26
Investment Banking Contact List ..................................................................... 28
Appendix – Disclaimers and Other Disclosures ................................................. 29
The following report has been prepared by the Investment Banking Department of Robert W. Baird & Co. This report is an overview and analysis of industry and consolidation trends and is not intended to provide investment recommendations on any specific industry or company. A complete listing of all companies covered by Baird U.S. Equity Research and applicable research disclosures can be accessed at <http://www.rwbaird.com/researchdisclosure>. You can also call 1-800-792-2473 or write: Robert W. Baird, Equity Research, 24th Floor, 777 E. Wisconsin Avenue, Milwaukee, WI 53202. Robert W. Baird & Co. (“Baird”) is a leading middle-market focused investment bank serving the M&A and equity financing needs of our clients throughout the U.S., Europe and Asia. Since 2004, we have advised on 447 M&A transactions totaling more than $78.5 billion and have served as an underwriter on more than 519 equity offerings totaling $133.0 billion in capital raised. Since 2004, Baird’s Distribution Group has completed 29 M&A transactions totaling more than $6.2 billion and 29 financing transactions totaling more than $12.7 billion. Since 2011, Baird had advised on 22 industrial distribution transactions totaling approximately $12 billion. Baird’s balanced buy- and sell-side practice provides expertise for public and private companies, while our dedicated financial sponsor coverage further expands opportunities and financing resources for our clients. Through close coordination between our U.S., European and Asian bankers, we work to optimize opportunities and results for clients in the international marketplace. Approximately half of our M&A activity over the past five years has involved international transactions.

Executive Summary
Robert W. Baird & Co. 1
Introduction. Baird’s Distribution Group is pleased to present Industrial Distribution – Industry Update. This report, created by Baird’s Investment Banking Distribution Team, highlights capital markets and M&A trends and recent events that impact companies within the industrial distribution sector.
Since the mid-1990s our team has enjoyed the privilege of serving clients across numerous industrial distribution verticals, including the automotive and heavy duty truck aftermarket, building, infrastructure and roofing products, electrical / electrical utilities and automation, flow control, jan / san, industrial supply, integrated supply, PVF and safety distribution sectors, among others. Industrial distribution is a highly diverse “sector” that spans multiple end markets and encompasses varied business models, ranging from branch-based distributors emphasizing local relationships, to “catalog” models serving customers through a centralized distribution center. Industrial distribution is a global sector, with long-established and entrenched distribution models in North America and Europe, as well as new and rapidly evolving distribution channels in emerging economies.
Industrial Distribution Performance Review. This report details the financial and stock price performance for 19 publicly traded North American industrial distributors (shown on pages 13-15) with combined annualized sales of approximately $66 billion. Q1 2013 Revenue Growth
Median Q1 2013 revenue growth was 2.6% sequentially, while year-over-year Q1 revenue growth was 2.7%
Median full year 2012 revenue growth was 8.9%
EBITDA Growth Median Q1 2013 EBITDA growth was 4.8%
sequentially, while year-over-year Q1 EBITDA growth was 5.2%
Median full year 2012 EBITDA growth was 10.9%
2013 Outlook
The median consensus 2013 estimated revenue growth is 7.8% and EBITDA growth is 13.6%
LTM Stock Price Performance Review. Outperforming broader market indices, our industrial distribution stock price index increased significantly over the last twelve months (“LTM”). In the LTM period ended June 30, 2013, our market cap weighted index increased 27.6%.
Industrial Distribution Stock Performance
_____________________ Source: Capital IQ as of June 30, 2013. Note: The Industrial Distribution Index return is adjusted to reflect dividends.
Positive Economic Trends. U.S. GDP expanded at a 2.1% annual rate in the first three months of 2013, with growth largely driven by a pick-up in consumer spending and a faster rate of inventory accumulation. Unemployment hit a four-year low in April at 7.5% followed by 7.6% in May and June. The Dow Jones and S&P 500 surpassed all-time highs in May and returned 18.1% and 20.6% respectively in the LTM ended June 30, 2013. Economic conditions remain favorable, as an accommodating monetary policy and positive market momentum continue into Q3 2013. M&A Activity. M&A activity remains strong in the industrial distribution sector. Baird tracked 89 industrial distribution M&A transactions YTD through June 30,
2013, in line with the 91 transactions tracked in YTD 2012. In full year 2012, Baird tracked 182 industrial distribution M&A transactions globally. The deal value was disclosed for 35 of these transactions, with an aggregate reported value of $12.0 billion and an average enterprise value of $343.6 million. Transaction activity includes a diverse buyer universe, with larger, platform distributors generating strong interest from both domestic and international strategic buyers, as well as private equity buyers.
The healthy M&A environment is fueled by sizable levels of unallocated financial sponsor capital, improved credit conditions, strong corporate balance sheets and, despite some volatility, generally stable macro-economic conditions. We expect these factors to continue to support M&A activity through 2013, as the long-term consolidation trend within the distribution sector continues.
90%
100%
110%
120%
130%
140%
Jun-12 Aug-12 Oct-12 Dec-12 Feb-13 Apr-13 Jun-13
Industrial DistributionS&P 500S&P SmallCap 600
23.6%
27.6%
17.9%

Industrial Distribution Performance
Robert W. Baird & Co. 2
INDUSTRIAL DISTRIBUTION PERFORMANCE Revenue Growth. Reported revenue growth for our distribution group moderated in Q1 2013, following strong growth in 2012. Median Q1 2013 revenue growth was 2.6%
sequentially, while year-over-year Q1 revenue growth was 2.7%
Median full year 2012 revenue growth for our distribution group was 8.9%
Full year 2012 year-over-year revenue growth was positive for 17 of 19 distributors in our group
8 of 19 distributors reported double digit revenue growth in 2012
Large distributors continue to achieve growth in excess of the end markets they serve through share gains and strategic acquisitions.
Revenue growth is expected to accelerate through 2013 for our distribution group, with median consensus estimated revenue growth of 7.8%.
EBITDA Growth. Our distribution group reported slower EBITDA growth in Q1 2013 after healthy gains in 2012. Median Q1 2013 EBITDA growth was 4.8%
sequentially, while year-over-year Q1 EBITDA growth was 5.2%
Median full year 2012 year-over-year EBITDA growth rate for our distribution group was 10.9%.
7 of 19 companies generated double digit EBITDA growth in 2012
EBITDA growth exceeded revenue growth, demonstrating operating leverage
Based on consensus analyst forecasts, strong EBITDA growth is anticipated in 2013. The median projected EBITDA growth for 2013 is 13.6%.
Median Year-Over-Year Revenue and EBITDA Growth
_____________________ Source: Capital IQ. Consensus estimates as of June 30, 2013. Baird’s North American Industrial Distribution Index includes Airgas, Anixter International, Applied Industrial Technologies, Beacon Roofing Supply, BlueLinx Holdings, Builders FirstSource, DXP Enterprises, Edgen Group, Fastenal Company, Genuine Parts Company, Houston Wire and Cable, Lawson Products, MRC Global, MSC Industrial Direct, Pool Corporation, Watsco, Wesco Aircraft Holdings, WESCO International and W.W. Grainger.
16.2%
8.0%
5.3%
7.2%
2.7%
8.9%7.8%
19.0%
13.6% 13.7%
8.8%
5.2%
10.9%
13.6%
0%
5%
10%
15%
20%
Q1 2012 Q2 2012 Q3 2012 Q4 2012 Q1 2013 2012 2013E
Year
-Ove
r-Ye
ar C
hang
e
Revenue EBITDA
Industrial Distribution Performance
Robert W. Baird & Co. 3
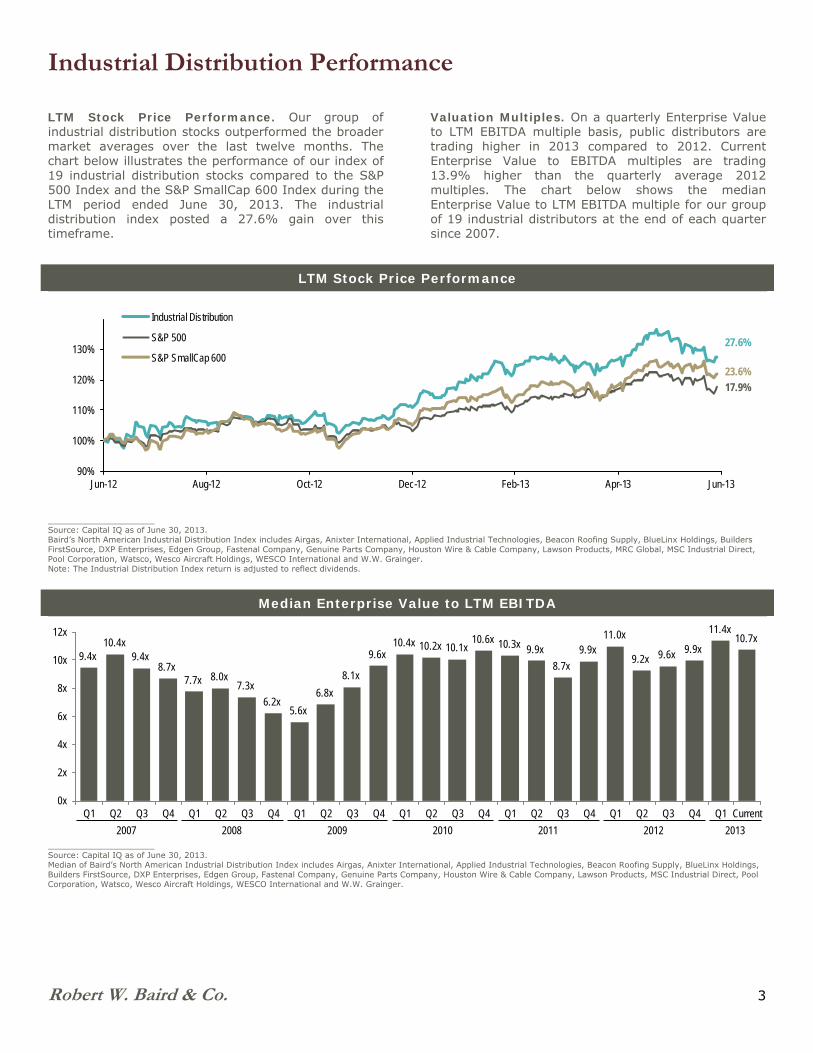
LTM Stock Price Performance. Our group of industrial distribution stocks outperformed the broader market averages over the last twelve months. The chart below illustrates the performance of our index of 19 industrial distribution stocks compared to the S&P 500 Index and the S&P SmallCap 600 Index during the LTM period ended June 30, 2013. The industrial distribution index posted a 27.6% gain over this timeframe.
Valuation Multiples. On a quarterly Enterprise Value to LTM EBITDA multiple basis, public distributors are trading higher in 2013 compared to 2012. Current Enterprise Value to EBITDA multiples are trading 13.9% higher than the quarterly average 2012 multiples. The chart below shows the median Enterprise Value to LTM EBITDA multiple for our group of 19 industrial distributors at the end of each quarter since 2007.
LTM Stock Price Performance
_____________________ Source: Capital IQ as of June 30, 2013. Baird’s North American Industrial Distribution Index includes Airgas, Anixter International, Applied Industrial Technologies, Beacon Roofing Supply, BlueLinx Holdings, Builders FirstSource, DXP Enterprises, Edgen Group, Fastenal Company, Genuine Parts Company, Houston Wire & Cable Company, Lawson Products, MRC Global, MSC Industrial Direct, Pool Corporation, Watsco, Wesco Aircraft Holdings, WESCO International and W.W. Grainger. Note: The Industrial Distribution Index return is adjusted to reflect dividends.
Median Enterprise Value to LTM EBITDA
_____________________ Source: Capital IQ as of June 30, 2013. Median of Baird’s North American Industrial Distribution Index includes Airgas, Anixter International, Applied Industrial Technologies, Beacon Roofing Supply, BlueLinx Holdings, Builders FirstSource, DXP Enterprises, Edgen Group, Fastenal Company, Genuine Parts Company, Houston Wire & Cable Company, Lawson Products, MSC Industrial Direct, Pool Corporation, Watsco, Wesco Aircraft Holdings, WESCO International and W.W. Grainger.
90%
100%
110%
120%
130%
Jun-12 Aug-12 Oct-12 Dec-12 Feb-13 Apr-13 Jun-13
Industrial Distribution
S&P 500
S&P SmallCap 60027.6%
17.9%
23.6%
9.4x10.4x
9.4x8.7x
7.7x 8.0x7.3x
6.2x5.6x
6.8x
8.1x
9.6x10.4x 10.2x 10.1x
10.6x 10.3x 9.9x
8.7x
9.9x11.0x
9.2x 9.6x 9.9x
11.4x10.7x
0x
2x
4x
6x
8x
10x
12x
Q1 Q2 Q3 Q4 Q1 Q2 Q3 Q4 Q1 Q2 Q3 Q4 Q1 Q2 Q3 Q4 Q1 Q2 Q3 Q4 Q1 Q2 Q3 Q4 Q1 Current
2008 2009 201220112010 20132007

Industrial Distribution Performance
Robert W. Baird & Co. 4
Several key trends in the distribution space were prevalent throughout 2012 and are expected to continue through 2013.
Strong M&A Activity Continues. Distribution M&A activity since 2010 has been strong as market conditions continue to improve and the industry consolidates. Strategic buyers are focused on penetrating new geographies and expanding their product lines to better serve existing customers. Private equity activity remains healthy.
Distributors Build Global Presence. Larger distributors continue to expand their geographic footprint on a global scale.
Leveraging Technology. As competition among distributors increases, companies innovate by leveraging technology to focus resources and improve operations. Top distributors are focused on improving analytics to better understand sales, marketing and product trends to drive value-added solutions and streamline operations. Distributors are also refining their online platforms to develop eCommerce ordering capabilities and sales force management tools.
Vending Model Driving Growth. The onsite vending model is increasingly recognized as a key growth opportunity as it accelerates sales with customers, improves distribution efficiency and increases customer loyalty.
Year-Over-Year Margin Performance
_____________________ Source: Robert W. Baird & Co. Analysis.
Margin Expansion. Distributors in Baird’s quarterly Distribution Surveys reported healthy gains in gross margin through 2012 and modest gains in the first half of 2013. The first three quarters of 2012 saw strong margin expansion, while the fourth quarter experienced a slowdown, perhaps due to increased uncertainty around the presidential election, then anticipated fiscal cliff and other economic concerns. Pricing also improved through 2012 in many sectors, with an overall median quarterly improvement of 1.6%. Margin and price performances were up slightly in Q1 and Q2 2013.
Sector Trends. Healthy sector trends were seen through 2012 and into Q2 2013, with the quarterly performance for each sector summarized below.
LTM Revenue and Pricing Trends by Sector Q3 2012 Q4 2012 Q1 2013 Q2 2013 Revenue
Growth Pricing Revenue Growth Pricing
Revenue Growth Pricing
Revenue Growth Pricing
PVF – Water & Sewer 4.9% 1.5% 0.4% (0.5%) 11.6% 0.1% 6.4% 2.7% Pool & Spa 1.1% 1.7% 3.2% 0.6% 10.1% 2.2% 5.1% 2.2% Plumbing 2.7% 0.5% 6.0% 2.2% 9.6% (0.2%) 9.2% 0.7% Rental Equipment 7.4% 2.4% 8.2% 0.0% 8.0% 0.4% 28.1% 0.5% Building Materials 5.5% 5.1% 5.2% 5.1% 7.8% 8.0% 1.1% (3.3%) Datacomm 4.0% (0.3%) 2.7% 0.5% 3.9% 1.6% 4.6% 1.8% HVAC 4.0% 0.4% 2.7% 0.5% 3.4% 0.6% 5.8% 0.4% Electrical 4.8% 1.5% 4.5% 0.9% 2.9% 0.7% 1.9% 1.0% Gases & Cylinder Rental 7.0% 5.4% 4.2% 1.3% 2.3% 2.3% 3.4% 1.3% PVF – Industrial & Energy (1.0%) (6.0%) 3.7% (1.0%) 2.0% (0.3%) (7.0%) (3.3%) Roofing 2.4% 0.0% 1.6% 0.2% 2.0% 1.6% 3.3% 1.3% Welding Hardgoods 5.4% 2.5% 3.6% 1.0% 1.9% 1.7% (4.2%) 0.9% Overall 4.1% 1.5% 3.0% 1.0% 1.9% 0.9% 2.6% 0.5% Safety 5.0% 1.8% 1.7% 1.7% �.7% 0.8% 4.1% 0.6% Fasteners 4.9% 1.3% 2.1% 0.2% 1.1% 0.1% 2.8% 1.8% General Industrial (MRO) 3.7% 2.3% 1.8% 1.4% 0.6% 0.5% 2.0% 0.7% Cutting Tools 4.2% 1.8% 8.1% 1.7% 0.2% 1.3% (1.5%) 1.2% Janitorial/Sanitation 4.7% 2.2% 5.1% 1.5% (0.8%) 0.6% 2.0% 3.3% Other 5.8% 1.1% 0.9% 0.5% (1.0%) 0.6% 0.0% 3.3% Mechanical/Power Transmission 2.1% 2.3% 0.5% 0.9% (2.5%) 0.4% (0.5%) 0.1% _____________________ Source: Robert W. Baird & Co. Analysis.
80 bps
50 bps40 bps 40 bps
1.5%
1.0%0.9%
0.5%
0.0%
0.5%
1.0%
1.5%
2.0%
20 bps
40 bps
60 bps
80 bps
100 bps
120 bps
Q3 2012 Q4 2012 Q1 2013 Q2 2013
Margin Improv ement Price Improv ement

Industrial Distribution Performance
Robert W. Baird & Co. 5
Economic Indicators. Recent economic indicators have shown signs of continued recovery. Momentum in key economic indicators, including the unemployment rate, which recently reached its lowest level since December 2008, suggests a positive outlook for distributors in 2013.
Industrial production growth reached 1.6% in May 2013, marking 40 consecutive months of expansion. Capacity utilization has gradually improved over the past two years, reaching 77.6 in May 2013 while remaining below its 79.7 average from 1986 to 2013.
The Purchasing Managers Index (PMI) has indicated expansion for 43 of the past 45 months. PMI registered 50.9 in June 2013, indicating moderating expansion. The New Orders Index has indicated expansion for 39 of the past 45 months and registered 51.9 in June, illustrating modest gains.
Steady industrial production trends continue to drive performance for our industrial distribution group. In this environment, original equipment manufacturers (OEMs) continue to rely on distributors to deliver critical supplies both for production of finished goods and equipment maintenance.
Industrial Production Growth
_____________________ Source: U.S. Federal Reserve. Year over year change in industrial production, seasonally adjusted.
PMI
_____________________ Source: Institute for Supply Management. Seasonally adjusted index.
New Orders Index
_____________________ Source: Institute for Supply Management. Seasonally adjusted index.
(20%)
(15%)
(10%)
(5%)
0%
5%
10%
Apr-03 May-05 May-07 May-09 May-11 May-13
1.6%
20
30
40
50
60
70
May-03 May-05 May-07 May-09 May-11 Jun-13
Expansion
Contr action
50.9
20
30
40
50
60
70
80
Apr-03 Apr-05 Apr-07 May-09 May-11 Jun-13
Expansion
Contr action
51.9

Industrial Distribution M&A Analysis
Robert W. Baird & Co. 6
The global industrial distribution sector experienced robust M&A activity in recent years. Since the start of 2005, Baird identified approximately 1,200 majority-stake M&A transactions. Among deals with a reported value, the aggregate value over this period was $95 billion.
Drivers of consolidation activity include: Fragmented Markets Economies of Scale Cross-selling and Product Portfolio Expansion Entry into New Geographies Access to New Capabilities
Fragmented Markets. The industrial distribution sector remains highly fragmented, with consolidation opportunities in a number of end markets. Revenue concentration is low among the leading participants in the key sub-verticals. Within the $100+ billion North American Industrial
Supply distribution market, the top eight distributors represent only 31% of total sales
In the $94 billion Electrical Products distribution vertical, the five leading distributors account for 32% of revenue, and the balance of the top 200 make up 30%, leaving nearly 40% of the category to about 8,000 mostly local distributors
In the $100+ billion Building Products market, more than 85% of sales occur through distributors outside of the top five
The $300+ billion vehicle aftermarket is highly fragmented, with distributors differentiated by both channel focus (e.g., independent, OES, retail) and product focus (e.g., heavy duty truck repair, replacement tires). For example, the top eight wholesale distributors in the $30 billion specialty aftermarket represent less than 40% of industry sales
The prevalence of smaller, local distributors has resulted in a slow and steady consolidation process. With the large majority of the market still controlled by local independent distributors, consolidation will likely continue for some time.
Economies of Scale. Industrial distributors often choose to acquire rather than open a greenfield location in order to quickly gain scale economies, which are extremely beneficial in the sector. Scale advantages stemming from higher sales volumes and increased power in the channel include: Technology and Logistics Sourcing Capabilities Volume Discounts from Suppliers Management Resources Recruiting and Retention of Talent Access to Growth Capital
We believe that larger distributors will grow faster than the market through secular share gains (enabled by scale advantages) and acquisitions. Scale advantages typically translate to higher gross margins and increased leverage on existing infrastructure, reinforcing a stronger competitive position. Larger distributors have the resources to invest in technology and logistics that enable differentiated services. Strategic buyers with large, established businesses have greater ability to reduce costs for acquired firms post-transaction.
Cross-selling and Product Portfolio Expansion. Acquisitions that add customers and products allow distributors to leverage an existing customer base and product portfolio through cross-selling, resulting in incremental revenue opportunities. Distributors also make acquisitions to become more relevant to customers by offering a more comprehensive set of services and products.
Entry into New Geographies. Larger distributors often have the capabilities and expertise to add branches in new locations. Additional facilities enable distributors to serve customers with multiple sites, facilitating sales to high-volume national and regional accounts. Acquisitions may be the most practical and cost effective means of entering new markets in certain distribution sectors.
Access to New Capabilities. M&A can enable distributors to access new capabilities. For example, a distributor of technical products may acquire complementary fabrication capabilities. Similarly, a less technically-focused distributor may acquire an engineering or design team to better support customer demands.
Industrial Distribution M&A Analysis
Robert W. Baird & Co. 7
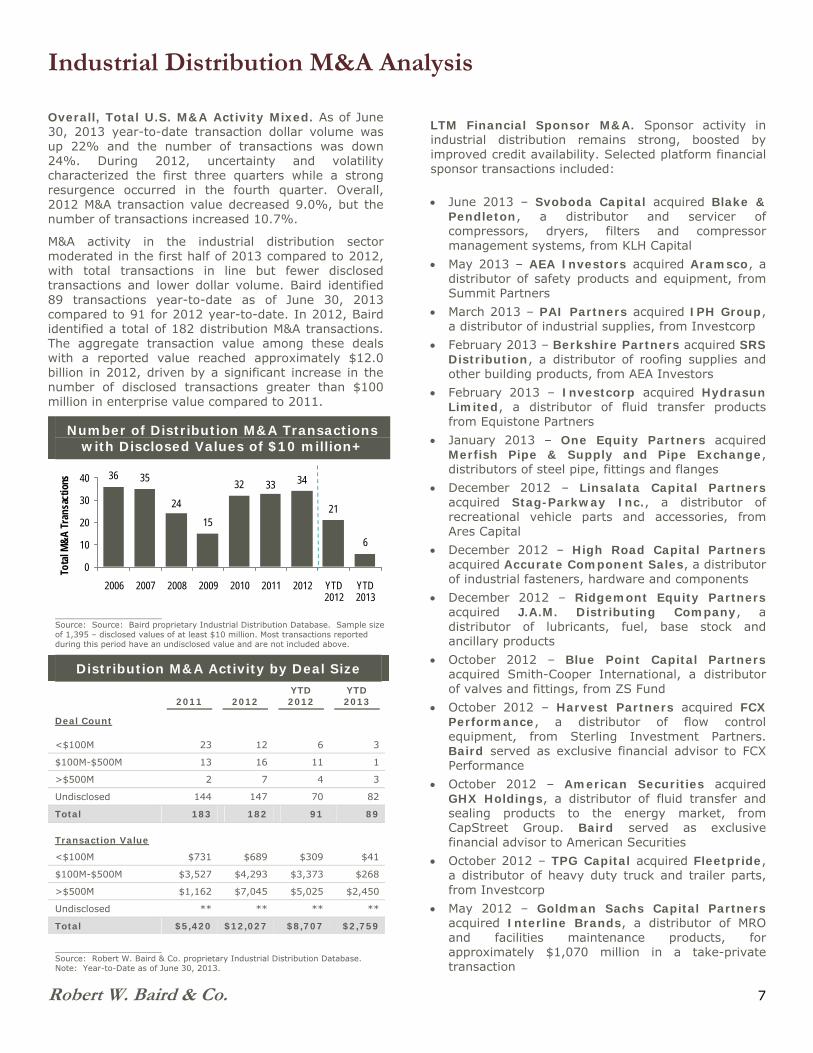
Overall, Total U.S. M&A Activity Mixed. As of June 30, 2013 year-to-date transaction dollar volume was up 22% and the number of transactions was down 24%. During 2012, uncertainty and volatility characterized the first three quarters while a strong resurgence occurred in the fourth quarter. Overall, 2012 M&A transaction value decreased 9.0%, but the number of transactions increased 10.7%.
M&A activity in the industrial distribution sector moderated in the first half of 2013 compared to 2012, with total transactions in line but fewer disclosed transactions and lower dollar volume. Baird identified 89 transactions year-to-date as of June 30, 2013 compared to 91 for 2012 year-to-date. In 2012, Baird identified a total of 182 distribution M&A transactions. The aggregate transaction value among these deals with a reported value reached approximately $12.0 billion in 2012, driven by a significant increase in the number of disclosed transactions greater than $100 million in enterprise value compared to 2011.
Number of Distribution M&A Transactions with Disclosed Values of $10 million+
_____________________ Source: Source: Baird proprietary Industrial Distribution Database. Sample size of 1,395 – disclosed values of at least $10 million. Most transactions reported during this period have an undisclosed value and are not included above.
Distribution M&A Activity by Deal Size
2011 2012 YTD 2012
YTD 2013
Deal Count
<$100M 23 12 6 3
$100M-$500M 13 16 11 1
>$500M 2 7 4 3
Undisclosed 144 147 70 82
Total 183 182 91 89
Transaction Value
<$100M $731 $689 $309 $41
$100M-$500M $3,527 $4,293 $3,373 $268
>$500M $1,162 $7,045 $5,025 $2,450
Undisclosed ** ** ** **
Total $5,420 $12,027 $8,707 $2,759
_____________________ Source: Robert W. Baird & Co. proprietary Industrial Distribution Database. Note: Year-to-Date as of June 30, 2013.
LTM Financial Sponsor M&A. Sponsor activity in industrial distribution remains strong, boosted by improved credit availability. Selected platform financial sponsor transactions included: June 2013 – Svoboda Capital acquired Blake &
Pendleton, a distributor and servicer of compressors, dryers, filters and compressor management systems, from KLH Capital
May 2013 – AEA Investors acquired Aramsco, a distributor of safety products and equipment, from Summit Partners
March 2013 – PAI Partners acquired IPH Group, a distributor of industrial supplies, from Investcorp
February 2013 – Berkshire Partners acquired SRS Distribution, a distributor of roofing supplies and other building products, from AEA Investors
February 2013 – Investcorp acquired Hydrasun Limited, a distributor of fluid transfer products from Equistone Partners
January 2013 – One Equity Partners acquired Merfish Pipe & Supply and Pipe Exchange, distributors of steel pipe, fittings and flanges
December 2012 – Linsalata Capital Partners acquired Stag-Parkway Inc., a distributor of recreational vehicle parts and accessories, from Ares Capital
December 2012 – High Road Capital Partners acquired Accurate Component Sales, a distributor of industrial fasteners, hardware and components
December 2012 – Ridgemont Equity Partners acquired J.A.M. Distributing Company, a distributor of lubricants, fuel, base stock and ancillary products
October 2012 – Blue Point Capital Partners acquired Smith-Cooper International, a distributor of valves and fittings, from ZS Fund
October 2012 – Harvest Partners acquired FCX Performance, a distributor of flow control equipment, from Sterling Investment Partners. Baird served as exclusive financial advisor to FCX Performance
October 2012 – American Securities acquired GHX Holdings, a distributor of fluid transfer and sealing products to the energy market, from CapStreet Group. Baird served as exclusive financial advisor to American Securities
October 2012 – TPG Capital acquired Fleetpride, a distributor of heavy duty truck and trailer parts, from Investcorp
May 2012 – Goldman Sachs Capital Partners acquired Interline Brands, a distributor of MRO and facilities maintenance products, for approximately $1,070 million in a take-private transaction
36 35
24
15
32 33 34
21
6
0
10
20
30
40
2006 2007 2008 2009 2010 2011 2012 YTD2012
YTD2013
Tota
l M&
A T
rans
actio
ns

Industrial Distribution M&A Analysis
Robert W. Baird & Co. 8
M&A Activity by Buyer Type. Distribution M&A activity since 2011 has been led by strategic buyers, with financial sponsors primarily engaging in transactions on behalf of an existing portfolio company. Strategic acquirors are most active in this space due to strong combination benefits that exist between distributors. Distributors can capitalize on scalable business models, strong operating leverage, significant cost synergies, an expanded customer base and the ability to better serve existing customers through an enhanced product offering. Financial sponsors seek investment in distributors due to their scalable business models, ability to quickly integrate acquisitions, high margins, cycle resiliency and strong and reliable cash flows. We expect the majority of 2013 distribution transactions to be completed by strategics or on behalf of strategics as the industry continues to consolidate.
M&A Activity by Vertical. The diversity of the industrial distribution space is illustrated by the chart above. Since 2011, M&A activity has been concentrated in the Industrial/ MRO, Construction/Infrastructure, Automotive and Electrical verticals. Industrial/MRO represented the most active vertical with 28% of deal volume.
M&A by Buyer Type Since 2011
_____________________ Note: Based on 459 distribution announced distribution transactions tracked by Baird.
M&A Activity by Vertical Since 2011
_____________________ Note: Based on 459 announced distribution transactions tracked by Baird.
Cross-Border M&A. In the LTM, several key cross-border transactions were completed. Selected cross-border transactions include: April 2013 – U.S.-based LKQ Corporation acquired
Netherlands-based Sator Beheer, a distributor of auto parts, tools and equipment, for approximately $268 million. Baird served as exclusive financial advisor to LKQ Corporation
March 2013 – U.S. based Genuine Parts Company acquired the remaining stake in Exego Group, a distributor of aftermarket automotive replacement parts
October 2012 – U.S.-based WESCO International acquired Canada-based EECOL, a distributor of electrical parts and service, for approximately $1,170 million
August 2012 – France-based Sonepar acquired U.S.-based Codale Electric Supply, a distributor of electrical products with approximately $220 million in sales
May 2012 – France-based Rexel acquired U.S.-based Platt Electric Supply, a distributor of electrical products and services, for approximately $380 million
Strategic Buyer67%
Sponsor-Backed
Strategic Buyer19%
Sponsor Buyer14%
Industrial / MRO28%
Construction / Infrastructure
15%Vehicle Supply14%
Electrical13%
Chemical / Gas7%
Heavy Equipment
5%
PVF5%
Safety / Jan San4%
Aerospace4%
Other5%

Industrial Distribution M&A Analysis
Robert W. Baird & Co. 9
Impact of Company Size on Valuation Multiples. Since 2000, Baird has tracked 1,366 distribution M&A transactions, 104 with disclosed multiples. Disclosed transactions indicate a significant relationship between company size and EV/EBITDA valuation multiples. As enterprise values increase, EV/EBITDA multiples also tend to increase. The historical median transaction multiple for companies with $0-$50 million in enterprise value is 5.4x, while the median multiple for transactions with over $1 billion in enterprise value is 10.1x.
Industrial Distribution – Historical Multiple Analysis
_____________________ Source: Baird proprietary Industrial Distribution Database. Sample size of 1,395 – 108 with disclosed multiples.
2013 Outlook. The recent M&A environment has become more challenging, but several key variables favor deal activity. M&A is expected to remain strong in 2013, as the conditions that supported deal-making in 2012 remain in place. 2013 is off to a mixed start, with aggregate deal
value increasing despite a decrease in transaction count
Deal count could accelerate as many prospective buyers and sellers deferred decisions due to heightened uncertainties in 2012
Credit markets remain conducive to M&A, with steadily increasing leverage multiples and tighter pricing. Investors continue to search for yield, evidenced by significant inflows into leveraged loan funds. Middle-market lenders are aggressively searching for opportunities to deploy capital, particularly for stronger credits
Financial sponsors are holding aging portfolios and significant uninvested capital ($400+ billion).
Strategic acquirors with large cash holdings continue to seek growth via M&A to supplement moderate organic growth opportunities
Key fundamentals continue to improve the U.S. economy, including equity capital markets conditions, housing recovery, positive GDP growth and four-year low unemployment
The industrial distribution sector remains highly fragmented. With the large majority of the market still controlled by local independent distributors, the industry remains poised for consolidation. Over the long term, we expect M&A activity in industrial distribution to remain robust. Strategic buyers will seek to grow their businesses through transactions that add products, services and geographies. Financial sponsors will look for opportunities to combine an acquired business with an existing portfolio company or to enter an attractive sector through a platform investment.
5.4x
8.5x 8.7x9.9x 10.1x
0x
2x
4x
6x
8x
10x
12x
$0 –$50
$50 –$200
$200 –$500
$500 –$1,000
+$1,000
Med
ian
EBIT
DA
Mul
tiple

Baird Industrial Distribution Research
Robert W. Baird & Co. 10
Baird’s top-ranked* research department provides active equity research on various Industrial Distribution companies. Excerpts from recent research notes are below. Click on the quote to read the entire note and related disclosures.
Baird Research Commentary
“With growth more weighted towards gases as the cycle progresses, any upside to revenue growth should read through at high incremental profitability. As such, we continue to recommend this long-term value creator and continue to like the stock, particularly on pullbacks.”
— Research note on 5/2/13
“Long term, we believe Anixter can achieve mid- to upper-single-digit organic sales growth with EPS growing in the mid-teens. The company is also positioned to supplement organic growth through acquisitions, and continues to invest in various growth initiatives focused on product line/serving offering expansion, geographic expansion, and share gains.”
— Research note on 4/24/13
“We view BECN as a very attractive, defensive, and domestic growth stock with mostly recurring revenue streams and catalysts from new construction, pricing, storms, and ongoing consolidation of the highly fragmented industry. BECN has now delivered two consecutive years of organic growth within the company’s targeted +5-10% range.”
— Research note on 7/12/13
“We believe there is outperformance over the next 1-2 years based upon our mid-cycle thesis, augmented by several growth catalysts and excellent execution overall.”
— Research note on 7/11/13
“GWW reported 2Q13 EPS slightly above expectations, as better-than-expected gross margin and SG&A leverage more than offset slightly softer sales growth. Management tweaked the low end of EPS guidance higher, similar to last quarter, although corresponding sales growth guidance was reduced 1% at the high end. While guidance continues to bracket Street expectations, July sales growth is trending slightly lower than June.”
— Research note on 7/17/13
“Management continues to expect overall revenues to be up vs. 2012, reflecting an ongoing cautious tone with respect to both end markets and geographies. Encouragingly, however, management commented that underlying same-store trends in April improved vs. March.”
— Research note on 5/10/13 _____________________ * Baird ranked No. 1 for “most trusted research” for the tenth consecutive year and No. 1 for “most important” research firm in the 2013 Greenwich Associates Survey (2004-
2013). Surveys conducted with U.S. small-cap and mid-cap fund managers.

Baird Industrial Distribution Research
Robert W. Baird & Co. 11
Baird Research Commentary
“Both the Flow Control acquisition and Celanese global supply contract are consistent with our favorable secular view of MRC, namely that the company should benefit from additional accretive acquisitions and future global supply contract wins, while we believe increasing domestic energy production should also drive infrastructure additions.”
— Research note on 6/18/13
“MSM reported solid 3QF13 results despite continued lackluster end-market trends, consistent with our 2Q13 survey. Encouragingly, BDNA is proceeding on schedule, and gross margin is expected to ramp meaningfully in 1QF14.”
— Research note on 7/11/13
“With new construction and major renovation starting to accelerate, we believe the company is at a transition point where top-line growth will drive more earnings growth relative to cost leverage. That said, we believe the company is well-positioned to make this transition.”
— Research note on 6/19/13
“We believe Watsco will continue to take market share from the fragmented group of 1,300+ HVAC distributors in the US given benefits of scale (higher rebates, better sourcing, management resources, breadth of products, etc.). Sales of parts and supplies via the Carrier Enterprise JV should also lead to share gains and outsized growth in these categories.”
— Research note on 4/18/13
“We continue to like WCC due to excellent execution and for investors seeking higher industrial beta, especially as we look forward to reaccelerating economic growth in 2H13. We also view the recently completed EECOL Electric acquisition favorably, which we see as a very good strategic fit with the potential for significant sales synergies longer term.”
— Research note on 4/18/13
“2QF13 operating results were above expectations, highlighted by contributions from new/expanded contracts, with favorable non-operating items. Corresponding F2013 guidance was also raised (but by less than the 2QF13 outperformance) -- likely conservative -- but nonetheless implying 2HF13 operating results below previous expectations.”
— Research note on 4/29/13

Industrial Distribution Overview
Robert W. Baird & Co. 12
SELECTED MARKET SEGMENTS Distributors, as we define them, are businesses offering a variety of products from various suppliers, together with the complementary value-added services required to make the use, installation or design of these products more convenient for customers.
Leading industrial distributors play a critical role in the supply chain between manufacturers and customers. Often serving as the outsourced sales and inventory management function for manufacturers, distributors provide comprehensive solutions and timely delivery of products to a typically diverse and fragmented customer base.
Building Products. The North American Building Products distribution market is approximately $100+ billion annually and includes firms distributing products such as lumber, roofing products, siding, windows and insulation. This market tends to be cyclical and has shown
historical correlations to economic growth, interest rates and population growth
The Building Products market is influenced by commercial and residential construction projects. Projects range from home improvements to large, multi-year commercial developments
Electrical Products. The North American Electrical Products distribution market is approximately $94 billion in size and includes firms distributing products such as connectors, controls, enclosures, lighting products, power systems and wire and cable. This market is generally tied to growth in the
industrial economy as well as residential and commercial construction cycles
Electrical distributors are poised to benefit from upgrades to energy infrastructure and long-term growth in energy consumption
Green energy initiatives are an emerging trend in this market, with advances in alternative energy expected to require significant supporting infrastructure
Industrial Supply. The North American Industrial Supply distribution market represents approximately $100 billion and includes firms distributing products such as abrasives, fasteners, janitorial supplies, safety products and tools. Industrial Supply distributors provide products that are necessary to maintain facilities and operate equipment. This market generally grows in line with GDP and
has shown historical correlations to the U.S. Purchasing Managers Index (PMI)
Product availability is a key competitive factor, as are price and service
Vehicle Aftermarket. The U.S vehicle aftermarket is approximately $300+ billion and includes firms distributing replacement products such as chassis, batteries, brakes, driveline components, filtration products, C-class MRO products and tires. The vehicle aftermarket includes multiple channels, including both one- and two-step distribution models, to service independent repair shops and OES and retail centers, which in turn serve the end customer. The market tends to be less cyclical than the new
vehicle market, as vehicles are maintained throughout the economic cycle
The number of vehicles on the road, growth in new vehicles, total miles driven and average vehicle age impact sales in the aftermarket channel

Building Products Sector Update
Robert W. Baird & Co. 13
LTM Stock Performance
_____________________ Source: Capital IQ as of June 30, 2013. Building Products includes: Beacon Roofing Supply, BlueLinx Holdings, Builders FirstSource, Pool Corporation and Watsco.
Valuation and Operating Statistics
_____________________ Source: Capital IQ. LTM as of June 30, 2013.
Median Trading Multiples
Revenue EBITDA EBIT
_____________________ Source: Capital IQ. Current multiples as of June 30, 2013. Median multiples are based on enterprise values as of the end of the period indicated divided by the income statement figure for the period indicated.
70%
90%
110%
130%
150%
Jun-12 Aug-12 Oct-12 Dec-12 Feb-13 Apr-13 Jun-13
Building Products / Facilities Maintenance
S&P 500
S&P SmallCap 60020.6%
27.4%
35.5%
Enterprise LTM LTM Margins Revenue Growth EBITDA Growth LTM Enterprise Value /Ticker Company Value ($mil) Revenue ($mil) EBITDA EBIT 2012 2013E 2012 2013E Revenue EBITDA EBIT
BECN Beacon Roofing Supply, Inc. $2,123.6 $2,088.6 7.7% 6.5% 8.7% 14.8% 16.8% 15.8% 1.0x 13.1x 15.8xBXC Bluelinx Holdings Inc. 657.9 1,957.3 0.7% 0.3% 8.7% N/M N/M N/M 0.3 N/M N/M BLDR Builders FirstSource, Inc. 816.1 1,171.0 0.8% (0.1% ) 37.4% 36.6% N/M N/M 0.7 N/M N/M POOL Pool Corp. 2,710.2 1,962.4 8.4% 7.8% 9.0% 4.8% 19.4% 10.2% 1.4 16.4 17.7WSO Watsco Inc. 3,278.5 3,511.8 7.2% 6.7% 15.2% 8.6% 14.3% 15.8% 0.9 12.9 13.8
Mean $1,917.3 $2,138.2 5.0% 4.2% 15.8% 16.2% 16.8% 13.9% 0.9x 14.1x 15.8xMedian 2,123.6 1,962.4 7.2% 6.5% 9.0% 11.7% 16.8% 15.8% 0.9 13.1 15.8
0.8x
0.5x0.5x 0.6x
0.7x 0.6x
0.8x0.9x
0.0x
0.2x
0.4x
0.6x
0.8x
1.0x
1.2x
2006 2007 2008 2009 2010 2011 2012 Current
9.2x8.2x 8.9x
15.6x
11.8x 11.5x12.4x 13.1x
0.0x
5.0x
10.0x
15.0x
20.0x
2006 2007 2008 2009 2010 2011 2012Current
9.9x 9.8x 10.0x
13.9x 13.5x12.2x 12.8x
15.8x
0.0x
5.0x
10.0x
15.0x
20.0x
2006 2007 2008 2009 2010 2011 2012 Current

Electrical Products Sector Update
Robert W. Baird & Co. 14
LTM Stock Performance
_____________________ Source: Capital IQ as of June 30, 2013. Electrical Products includes: Anixter International, Houston Wire & Cable Company and WESCO International.
Valuation and Operating Statistics
_____________________ Source: Capital IQ. LTM as of June 30, 2013.
Median Trading Multiples
Revenue EBITDA EBIT
_____________________ Source: Capital IQ. Current multiples as of June 30, 2013. Median multiples are based on enterprise values as of the end of the period indicated divided by the income statement figure for the period indicated.
90%
110%
130%
150%
Jun-12 Aug-12 Oct-12 Dec-12 Feb-13 Apr-13 Jun-13
Electrical Products
S&P 500
S&P SmallCap 600 32.9%
20.6%
27.4%
Enterprise LTM LTM Margins Revenue Growth EBITDA Growth LTM Enterprise Value /Ticker Company Value ($mil) Revenue ($mil) EBITDA EBIT 2012 2013E 2012 2013E Revenue EBITDA EBIT
AXE Anixter International Inc. $3,310.5 $6,221.3 5.9% 5.4% 1.7% 1.9% (7.0% ) 9.6% 0.5x 9.0x 9.9xHWCC Houston Wire & Cable Compan 299.8 392.9 8.0% 7.3% (0.9% ) 2.8% (8.0% ) 4.1% 0.8 9.5 10.5WCC WESCO International Inc. 4,555.7 6,781.3 6.3% 5.7% 7.4% 16.5% 1.0% 51.0% 0.7 10.7 11.8
Mean $2,722.0 $4,465.2 6.7% 6.1% 2.8% 7.0% (4.7%) 21.6% 0.7x 9.8x 10.7xMedian 3,310.5 6,221.3 6.3% 5.7% 1.7% 2.8% (7.0%) 9.6% 0.7 9.5 10.5
0.6x0.6x
0.4x
0.4x
0.6x0.5x
0.6x
0.7x
0.0x
0.1x
0.2x
0.3x
0.4x
0.5x
0.6x
0.7x
0.8x
2006 2007 2008 2009 2010 2011 2012 Current
8.7x
7.1x
4.5x
9.3x
12.7x
8.5x 9.0x9.5x
0.0x
2.0x
4.0x
6.0x
8.0x
10.0x
12.0x
14.0x
2006 2007 2008 2009 2010 2011 2012 Current
9.4x
7.8x
4.7x
11.0x
13.9x
9.1x9.7x
10.5x
0.0x
3.0x
6.0x
9.0x
12.0x
15.0x
2006 2007 2008 2009 2010 2011 2012Current

Industrial Supplies Sector Update
Robert W. Baird & Co. 15
LTM Stock Performance
_____________________ Source: Capital IQ as of June 30, 2013. Industrial Supplies includes: Airgas, Applied Industrial Technologies, DXP Enterprises, Edgen Group, Fastenal Company, Genuine Parts Company, Lawson Products, MRC Global, MSC Industrial Direct, W.W. Grainger and Wesco Aircraft Holdings.
Valuation and Operating Statistics
_____________________ Source: Capital IQ. LTM as of June 30, 2013.
Median Trading Multiples Revenue EBITDA EBIT
_____________________ Source: Capital IQ. Current multiples as of June 30, 2013. Median multiples are based on enterprise values as of the end of the period indicated divided by the income statement figure for the period indicated.
85%
105%
125%
145%
Jun-12 Aug-12 Oct-12 Dec-12 Feb-13 Apr-13 Jun-13
Industrial Supplies
S&P 500
S&P Small Cap 600 27.4%31.8%
20.6%
Enterprise LTM LTM Margins Revenue Growth EBITDA Growth LTM Enterprise Value /Ticker Company Value ($mil) Revenue ($mil) EBITDA EBIT 2012 2013E 2012 2013E Revenue EBITDA EBIT
ARG Airgas, Inc. $9,592.5 $4,957.5 18.0% 12.2% 7.1% 3.0% 8.2% 7.2% 1.9x 10.7x 15.8xAIT Applied Industrial Technologies, 1,993.5 2,441.7 8.3% 7.3% 5.2% 4.0% 6.3% 6.8% 0.8 9.8 11.2DXPE DXP Enterprises, Inc. 1,158.9 1,134.9 10.0% 8.2% 35.9% 16.1% N/M 15.2% 1.0 10.2 12.4EDG Edgen Group Inc. 672.4 1,959.3 6.4% 4.8% 22.9% (11.4% ) 15.2% (16.2% ) 0.3 5.4 7.1FAST Fastenal Company 13,424.5 3,213.7 23.6% 21.8% 13.3% 7.4% 17.4% 11.2% 4.2 17.7 19.2GPC Genuine Parts Company 12,181.1 13,031.4 8.6% 7.8% 4.5% 9.6% 12.3% 16.9% 0.9 10.9 12.0LAWS Lawson Products Inc. 139.8 286.5 (2.1% ) (3.8% ) (7.8% ) 1.9% N/M N/M 0.5 N/M N/M MRC MRC Global Inc. 3,854.3 5,493.3 8.2% 7.3% 15.3% (0.5% ) N/M (6.1% ) 0.7 8.5 9.6MSM MSC Industrial Direct Co. Inc. 4,662.0 2,419.1 18.5% 16.7% 14.0% 6.9% 14.7% (0.9% ) 1.9 10.4 11.5GWW W.W. Grainger, Inc. 17,694.8 9,037.0 15.0% 13.4% 10.8% 7.0% 9.6% 19.7% 2.0 13.1 14.6WAIR Wesco Aircraft Holdings, Inc. 2,289.8 838.5 21.7% 20.3% 8.9% 14.5% (5.0% ) 14.9% 2.7 12.6 13.4
Mean $6,151.3 $4,073.9 12.4% 10.6% 11.8% 5.3% 9.8% 6.9% 1.5x 10.9x 12.7xMedian 3,854.3 2,441.7 10.0% 8.2% 10.8% 6.9% 10.9% 9.2% 1.0 10.6 12.2
0.8x0.9x
0.5x 0.6x
0.7x0.8x
0.9x1.0x
0.0x
0.2x
0.4x
0.6x
0.8x
1.0x
1.2x
2006 2007 2008 2009 2010 2011 2012 Current
9.9x9.1x
6.7x
8.5x
10.3x10.8x
9.9x10.6x
0.0x
3.0x
6.0x
9.0x
12.0x
2006 2007 2008 2009 2010 2011 2012 Current
11.2x 10.7x
7.7x
10.7x
15.1x
12.7x
11.3x12.2x
0.0x
4.0x
8.0x
12.0x
16.0x
2006 2007 2008 2009 2010 2011 2012 Current
European Distribution Update
Robert W. Baird & Co. 16
LTM Stock Performance
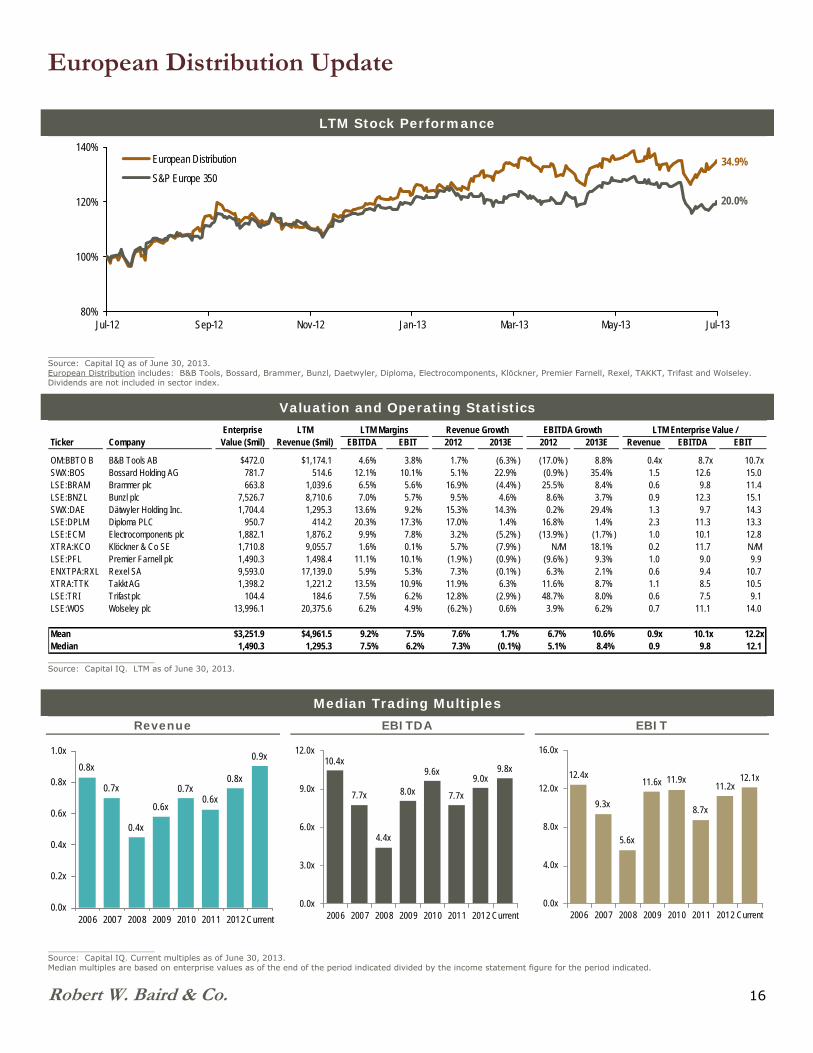
_____________________ Source: Capital IQ as of June 30, 2013. European Distribution includes: B&B Tools, Bossard, Brammer, Bunzl, Daetwyler, Diploma, Electrocomponents, Klöckner, Premier Farnell, Rexel, TAKKT, Trifast and Wolseley. Dividends are not included in sector index.
Valuation and Operating Statistics
_____________________ Source: Capital IQ. LTM as of June 30, 2013.
Median Trading Multiples Revenue EBITDA EBIT
_____________________ Source: Capital IQ. Current multiples as of June 30, 2013. Median multiples are based on enterprise values as of the end of the period indicated divided by the income statement figure for the period indicated.
80%
100%
120%
140%
Jul-12 Sep-12 Nov-12 Jan-13 Mar-13 May-13 Jul-13
European Distribution
S&P Europe 350
34.9%
20.0%
Enterprise LTM LTM Margins Revenue Growth EBITDA Growth LTM Enterprise Value /Ticker Company Value ($mil) Revenue ($mil) EBITDA EBIT 2012 2013E 2012 2013E Revenue EBITDA EBIT
OM:BBTO B B&B Tools AB $472.0 $1,174.1 4.6% 3.8% 1.7% (6.3% ) (17.0% ) 8.8% 0.4x 8.7x 10.7xSWX:BOS Bossard Holding AG 781.7 514.6 12.1% 10.1% 5.1% 22.9% (0.9% ) 35.4% 1.5 12.6 15.0LSE:BRAM Brammer plc 663.8 1,039.6 6.5% 5.6% 16.9% (4.4% ) 25.5% 8.4% 0.6 9.8 11.4LSE:BNZL Bunzl plc 7,526.7 8,710.6 7.0% 5.7% 9.5% 4.6% 8.6% 3.7% 0.9 12.3 15.1SWX:DAE Dätwyler Holding Inc. 1,704.4 1,295.3 13.6% 9.2% 15.3% 14.3% 0.2% 29.4% 1.3 9.7 14.3LSE:DPLM Diploma PLC 950.7 414.2 20.3% 17.3% 17.0% 1.4% 16.8% 1.4% 2.3 11.3 13.3LSE:ECM Electrocomponents plc 1,882.1 1,876.2 9.9% 7.8% 3.2% (5.2% ) (13.9% ) (1.7% ) 1.0 10.1 12.8XTRA:KCO Klöckner & Co SE 1,710.8 9,055.7 1.6% 0.1% 5.7% (7.9% ) N/M 18.1% 0.2 11.7 N/M LSE:PFL Premier Farnell plc 1,490.3 1,498.4 11.1% 10.1% (1.9% ) (0.9% ) (9.6% ) 9.3% 1.0 9.0 9.9ENXTPA:RXL Rexel SA 9,593.0 17,139.0 5.9% 5.3% 7.3% (0.1% ) 6.3% 2.1% 0.6 9.4 10.7XTRA:TTK Takkt AG 1,398.2 1,221.2 13.5% 10.9% 11.9% 6.3% 11.6% 8.7% 1.1 8.5 10.5LSE:TRI Trifast plc 104.4 184.6 7.5% 6.2% 12.8% (2.9% ) 48.7% 8.0% 0.6 7.5 9.1LSE:WOS Wolseley plc 13,996.1 20,375.6 6.2% 4.9% (6.2% ) 0.6% 3.9% 6.2% 0.7 11.1 14.0
Mean $3,251.9 $4,961.5 9.2% 7.5% 7.6% 1.7% 6.7% 10.6% 0.9x 10.1x 12.2xMedian 1,490.3 1,295.3 7.5% 6.2% 7.3% (0.1%) 5.1% 8.4% 0.9 9.8 12.1
0.8x
0.7x
0.4x
0.6x
0.7x0.6x
0.8x
0.9x
0.0x
0.2x
0.4x
0.6x
0.8x
1.0x
2006 2007 2008 2009 2010 2011 2012 Current
10.4x
7.7x
4.4x
8.0x
9.6x
7.7x
9.0x9.8x
0.0x
3.0x
6.0x
9.0x
12.0x
2006 2007 2008 2009 2010 2011 2012 Current
12.4x
9.3x
5.6x
11.6x 11.9x
8.7x
11.2x12.1x
0.0x
4.0x
8.0x
12.0x
16.0x
2006 2007 2008 2009 2010 2011 2012 Current
Spotlight Transaction
Robert W. Baird & Co. 17
Spotlight Transaction: Sale of Barnes Distribution North America to MSC Industrial
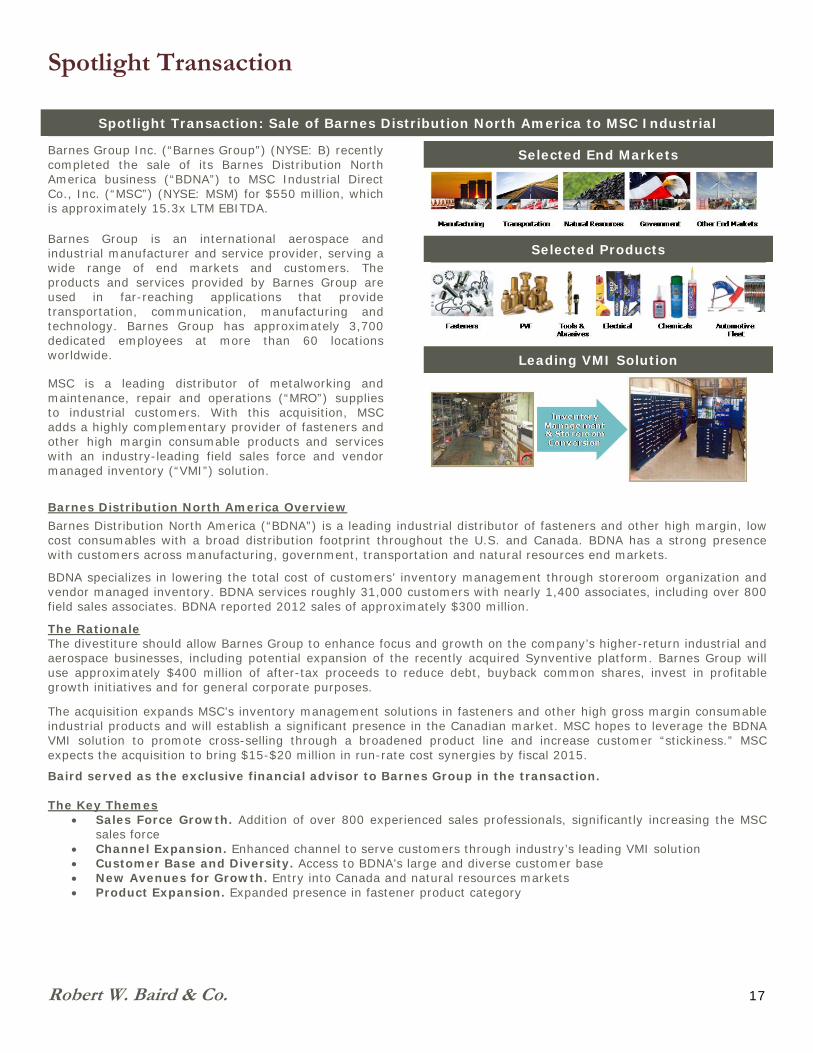
Barnes Group Inc. (“Barnes Group”) (NYSE: B) recently completed the sale of its Barnes Distribution North America business (“BDNA”) to MSC Industrial Direct Co., Inc. (“MSC”) (NYSE: MSM) for $550 million, which is approximately 15.3x LTM EBITDA. Barnes Group is an international aerospace and industrial manufacturer and service provider, serving a wide range of end markets and customers. The products and services provided by Barnes Group are used in far-reaching applications that provide transportation, communication, manufacturing and technology. Barnes Group has approximately 3,700 dedicated employees at more than 60 locations worldwide.
MSC is a leading distributor of metalworking and maintenance, repair and operations (“MRO”) supplies to industrial customers. With this acquisition, MSC adds a highly complementary provider of fasteners and other high margin consumable products and services with an industry-leading field sales force and vendor managed inventory (“VMI”) solution.
Selected End Markets
Selected Products
Leading VMI Solution
Barnes Distribution North America Overview Barnes Distribution North America (“BDNA”) is a leading industrial distributor of fasteners and other high margin, low cost consumables with a broad distribution footprint throughout the U.S. and Canada. BDNA has a strong presence with customers across manufacturing, government, transportation and natural resources end markets.
BDNA specializes in lowering the total cost of customers’ inventory management through storeroom organization and vendor managed inventory. BDNA services roughly 31,000 customers with nearly 1,400 associates, including over 800 field sales associates. BDNA reported 2012 sales of approximately $300 million.
The Rationale The divestiture should allow Barnes Group to enhance focus and growth on the company’s higher-return industrial and aerospace businesses, including potential expansion of the recently acquired Synventive platform. Barnes Group will use approximately $400 million of after-tax proceeds to reduce debt, buyback common shares, invest in profitable growth initiatives and for general corporate purposes.
The acquisition expands MSC’s inventory management solutions in fasteners and other high gross margin consumable industrial products and will establish a significant presence in the Canadian market. MSC hopes to leverage the BDNA VMI solution to promote cross-selling through a broadened product line and increase customer “stickiness.” MSC expects the acquisition to bring $15-$20 million in run-rate cost synergies by fiscal 2015.
Baird served as the exclusive financial advisor to Barnes Group in the transaction.
The Key Themes Sales Force Growth. Addition of over 800 experienced sales professionals, significantly increasing the MSC
sales force Channel Expansion. Enhanced channel to serve customers through industry’s leading VMI solution Customer Base and Diversity. Access to BDNA’s large and diverse customer base New Avenues for Growth. Entry into Canada and natural resources markets Product Expansion. Expanded presence in fastener product category

Selected Companies
Robert W. Baird & Co. 18
Company Name / Headquarters Ticker LTM Sales ($mil) Employees Founded
Airgas, Inc. Radnor, PA
NYSE: ARG $4,957.5 15,000 1982
Angst + Pfister Group Zurich, Switzerland
N/A N/A N/A N/A
Anixter International Inc. Glenview, IL
NYSE: AXE $6,221.3 8,300 1957
Applied Industrial Technologies, Inc. Cleveland, OH
NYSE: AIT $2,441.7 5,000 1923
B&B Tools AB Stockholm, Sweden
OM: BBTO B $1,174.1 2,780 1906
Beacon Roofing Supply, Inc. Peabody, MA
NASDAQ: BECN $2,088.6 2,781 1928
Berner GmbH Kunzelsau, Germany
N/A N/A 8,100 1957
BlueLinx Holdings Inc. Atlanta, GA
NYSE: BXC $1,957.3 1,900 1996
Bossard Holding AG Zug, Switzerland
SWX: BOS $514.6 1,812 1831
Brammer plc Manchester, United Kingdom
LSE: BRAM $1,039.6 2,592 1920
Builders FirstSource, Inc. Dallas, TX
NASDAQ: BLDR $1,171.0 2,750 1998
Bunzl plc London, United Kingdom
LSE: BNZL $8,710.6 11,738 1940
Daetwyler Holding Inc. Altdorf, Switzerland
SWX: DAE $1,295.3 6,670 1958
Diploma plc London, United Kingdom
LSE: DPLM $414.2 1,117 1931
DXP Enterprises, Inc. Houston, TX
NASDAQ: DXPE $1,134.9 2,817 1908
Edgen Group Baton Rouge, LA
NYSE: EDG $1,959.3 597 2011
Electrocomponents plc Oxford, United Kingdom
LSE: ECM $1,876.2 6,300 1928
ERIKS N.V. Alkmaar, Netherlands
N/A N/A 5,073 N/A
Fastenal Company Winona, MN
NASDAQ: FAST $3,213.7 13,212 1967
Genuine Parts Company Atlanta, GA
NYSE: GPC $13,031.4 31,900 1928
_____________________
Source: Capital IQ and company websites.

Selected Companies
Robert W. Baird & Co. 19
Business Description
Airgas is a distributor of industrial, medical, and specialty gases, as well as hard goods in the United States.
Angst + Pfister is an international technical distributor of high-end industrial components.
Anixter International is a distributor of communications products, specialty wire and cable products, fasteners, and small parts.
Applied Industrial Technologies is a distributor of various industrial products in North America.
B&B Tools is a distributor of industrial consumables, industrial components, and related services for the industrial sector in the Nordic region.
Beacon Roofing Supply is a distributor of residential and commercial roofing materials in the United States and Canada.
Berner is a distributor to the building, construction, and automotive sectors.
BlueLinx Holdings is a distributor of building products in North America.
Bossard Holding is a distributor of fasteners and small component parts in Europe, America, and Asia.
Brammer is a distributor of power transmission components and related inventory management, procurement, and logistics services in Europe.
Builders FirstSource is a distributor of structural and related building products for residential new construction in the United States.
Bunzl is a distributor of non-food consumable products to various customer markets in the Americas, Europe, and Australasia.
Daetwyler is a distributor of industrial, engineering, and electronic components primarily to the manufacturing, pharmaceutical, and datacomm industries.
Diploma plc is a distributor technical products and services in the United Kingdom, the rest of Europe, and North America.
DXP Enterprises is a distributor of maintenance, repair, and operating products, equipment, and services to industrial customers in the United States.
Edgen Group is a distributor of specialty steel products to the energy sector.
Electrocomponents is a distributor of electronic, electrical, industrial, and commercial supplies and services to engineers worldwide.
ERIKS is a distributor of a range of mechanical engineering components in Europe, the United States, and Southeast Asia.
Fastenal Company is a distributor of fasteners and industrial supplies.
Genuine Parts Company is a distributor of automotive replacement parts, industrial replacement parts, office products, and electrical/electronic materials.
_____________________ Source: Capital IQ and company websites.

Selected Companies
Robert W. Baird & Co. 20
Company Name / Headquarters Ticker LTM Sales ($mil) Employees Founded
Houston Wire & Cable Company Houston, TX
NASDAQ: HWCC $392.9 427 1975
Interline Brands, Inc. Jacksonville, FL
N/A $1,389.5 4,100 1978
Klöckner & Co Aktiengesellschaft Duisburg, Germany
XTRA: KCO $9,055.7 10,212 1906
Lawson Products, Inc. Des Plaines, IL
NASDAQ: LAWS $286.5 1,550 1952
MRC Global Houston, TX
NYSE:MRC $5,493.3 4,810 1921
MSC Industrial Direct Co., Inc. Melville, NY
NYSE: MSM $2,419.1 4,923 1941
Pool Corporation Covington, LA
NASDAQ: POOL $1,962.4 3,400 1993
Premier Farnell plc London, United Kingdom
LSE: PFL $1,498.4 4,400 1939
Rexel S.A. Paris, France
ENXTPA: RXL $17,139.0 30,416 1967
TAKKT AG Stuttgart, Germany
XTRA: TTK $1,221.2 2,351 1945
Trifast plc Uckfield, United Kingdom
LSE: TRI $184.6 1,029 1973
W.W. Grainger, Inc. Lake Forest, IL
NYSE: GWW $9,037.0 21,750 1927
Watsco, Inc. Coconut Grove, FL
NYSE: WSO $3,511.8 4,600 1945
Wesco Aircraft Holdings, Inc. Valencia, CA
NYSE: WAIR $838.5 1,200 1953
WESCO International, Inc. Pittsburgh, PA
NYSE: WCC $6,781.4 9,000 1922
Wolseley plc Nr Reading, United Kingdom
LSE: WOS $20,375.6 40,000 1887
Wurth Group Kunzelsau, Germany
N/A $13,175.7 66,113 1945
_____________________ Source: Capital IQ and company websites.

Selected Companies
Robert W. Baird & Co. 21
Business Description
Houston Wire & Cable Company is a distributor of specialty wire and cable products.
Interline Brands is a distributor of maintenance, repair, and operations products in the United States, Canada, and Central America.
Klöckner is a distributor of steel and metal products.
Lawson Products is a distributor of maintenance, repair, and operating products to the industrial, commercial, institutional, and governmental marketplaces in the United States and Canada.
MRC Global is a distributor of pipes, valves, fittings and related products and services to the energy industry worldwide.
MSC Industrial Direct is a distributor of metalworking and maintenance, repair, and operations supplies to industrial customers throughout the United States.
Pool Corporation is a distributor of swimming pool supplies, equipment, and related leisure products in North America and Europe.
Premier Farnell is a distributor of electronic, electrical, and industrial products to the design, maintenance, and repair sectors in Europe, North America, and the Asia Pacific.
Rexel is a distributor of electrical products worldwide.
TAKKT is a distributor of office, business, and warehouse equipment in Europe, North America, and Asia.
Trifast is a distributor of industrial fasteners and associated components.
W.W. Grainger is a distributor of industrial supplies and other related products and services.
Watsco is a distributor of air conditioning, heating, and refrigeration equipment and related parts and supplies in the United States.
Wesco Aircraft is a distributor of aerospace hardware, bearings, electronic components, and machined parts, as well as a provider of supply chain management solutions to the aerospace industry.
WESCO International is a distributor of electrical and industrial maintenance, repair, and operating supplies.
Wolseley is a distributor of heating and plumbing products to the professional market, as well as a supplier of building materials in Europe and North America.
Wurth is a distributor of assembly and fastening products.
_____________________ Source: Capital IQ and company websites.

Selected LTM M&A Transactions
Robert W. Baird & Co. 22
Date Announced
PE to PE Transaction Acquiror
PE Buyer Target Target Business Description
Transaction Value ($mil)
Target Trailing Sales ($mil)
Enterprise Value/
Sales EBITDA
6/10/2013 Yes Svoboda Capital Yes Blake & Pendleton Distributor of air compressors, dryers, filters and compressor management systems
– – – –
6/7/2013 Shook and Fletcher National Insulation Co. Distributor of commercial and industrial insulation, including Fiberglass, Foamglas, PVC's, jacketing, tapes, Rubatex, aluminum & stainless steel bands & elbows
– – – –
6/3/2013 Singer Equities Stewart-Hunt Distributor of fluid energy; specializes in the sales, service, testing and repair of hydraulic pumps, motors, cylinders and other hydraulic components
– – – –
5/24/2013 RelaDyne Maxum Petroleum (Lubricants and tank wagon fuel businesses)
Distributor of a comprehensive offering of refined petroleum products and services
– – – –
5/22/2013 Yes AEA Investors Yes Aramsco Distributor of safety products, equipment and supplies – – – –
5/15/2013 Monroe Engineering R.J. Vedovell Distributor of O-rings, gaskets, seals and molded rubber – – – –
5/3/2013 Turtle & Hughes Mid-Island Electric Supply Distributor of electrical products – – – –
4/25/2013 LKQ Corporation Sator Beheer Distributor of auto parts, tools and equipment $268.0 – 0.7x 8.6x
4/25/2013 Distribution International
Midwest Sales Distributor of commercial and industrial insulation – – – –
4/17/2013 DXP Enterprises National Process Equipment
Distributor of pumps and related process equipment – $69.0 – –
4/9/2013 ERIKS Klaus Technische Grosshandlung GmbH
Distributor of industrial hoses and accessories, seals, tools and pumps
– – – –
3/29/2013 TriMark USA Strategic Equipment and Supply Corporation
Distributor of foodservice equipment – – – –
3/28/2013 American Tire Distributors Inc.
Regional Tire Distributors Distributor of tires – – – –
3/26/2013 ABC Supply Co Inc. Lee Wholesale Supply Distributor of roofing, siding and other building products – – – –
3/11/2013 Genuine Parts Company Exego Group Distributor of automotive replacement parts 800.0 – – –
3/6/2013 Yes PAI Partners Yes IPH Group Distributor of industrial supplies – 1,124.0 – –
2/28/2013 Yes Berkshire Partners Yes SRS Distribution Distributor of roofing supplies – – – – 2/22/2013 MSC Industrial Direct Barnes Distribution North
America (subsidiary of Barnes Group)
Distributor of MRO supplies 550.0 300.0 1.8 15.3
2/18/2013 Yes Investcorp International, Inc.
Yes Hydrasun Limited Distributor of fluid transfer products – 140.5 – –
2/6/2013 Praxair NuCO2 Distributor of carbonation gasses for soda products 1,100.0 250.0 – 9.6
1/10/2013 Bunzl plc Vicsa Safety Distributor of personal protection equipment – 60.0 – –
1/9/2013 FCX Performance Pierce Pump Company Distributor of pumps, mechanical seals and compressed air equipment
– – – –
1/8/2013 One Equity Partners Yes Merfish Pipe & Supply and Pipe Exchange
Distributors of steel pipe, fittings and flanges – – – –
1/7/2013 Morrison Supply Express Pipe & Supply Distributor of residential plumbing products – – – –
1/2/2013 BlackHawk Industrial EF Bailey Industrial Supply
Distributor of cutting tools, abrasives, fluids and engineered products
– – – –
1/2/2013 F.W. Webb Systemation Distributor of measurement and flow control products – – – –
12/31/2012 Rawson (ERIKS) Regal-Brown Distributor of instrumentation, process control and filtration systems equipment
– – – –
12/31/2012 Stock Building Supply Total Building Services Group
Distributor of structural components and architectural millwork
– – – –
12/28/2012 Beacon Roofing Supply Ford Wholesale and Construction Materials Supply
Distributor of commercial roofing and related accessories – 60.0 – –
12/20/2012 Yes Linsalata Capital Partners
Yes Stag-Parkway Inc. Distributor of recreational vehicle parts and accessories – – – –
12/19/2012 Advance Auto Parts B.W.P Distributors Distributor of automotive aftermarket parts – – – –
12/19/2012 Ridgemont Equity Partners
Yes J.A.M. Distributing Company
Distributor of lubricants, fuel, base stock and ancillary products
– – – –
________________ Source: Baird Investment Banking internal database. Shading indicates Baird transaction.

Selected LTM M&A Transactions
Robert W. Baird & Co. 23
Date Announced
PE to PE Transaction Acquiror
PE Buyer Target Target Business Description
Transaction Value ($mil)
Target Trailing Sales ($mil)
Enterprise Value/
Sales EBITDA
12/18/2012 The Hillman Companies, Inc.
H. Paulin & Co. Distributor and manufacturer of fasteners, fluid system products and retail hardware
$103.7 $146.7 0.7x 11.6x
12/17/2012 W.W. Grainger Techni-Tool and Wassco Distributors of electronic production, maintenance, and voice/video and data equipment
– 88.0 – –
12/11/2012 Edgen Group HSP Group Distributor of valves – 37.0 – – 12/6/2012 High Road Capital
Partners Yes Accurate Component
Sales Distributor of industrial fasteners, hardware and components
– – – –
12/5/2012 GHX Industrial Express Hose & Fittings II Distributor of hose, fittings and other products – – – –
12/4/2012 Interline Brands JanPak Distributor of cleaning and packaging supplies 82.5 232.0 0.4 9.4
12/3/2012 PetroChoice Craft Oil Corporation Distributor of motor oil and lubricants – – – –
12/1/2012 Industrial Controls / ERIKS
IEC Control Shop Distributor of HVAC controls – – – –
11/30/2012 American Tire Distributors
TriCan Tire Distributors Distributor of tires 97.5 – – –
11/30/2012 MRC Global Production Specialty Services
Distributor of pipes, valves, fittings and other MRO products
– 127.0 – –
11/28/2012 Rugby IPD Corp. F.W. Honerkamp Co. Distributor of architectural based building products – – – –
11/21/2012 HD Supply Water Products (3 businesses)
Distributor of water, sewer and gas system installations and maintenance products and repair services
– – – –
11/8/2012 Bearing Distributors, Inc.
Bearing Sales Distributor of bearings – – – –
11/2/2012 Wolseley Burdens Limited Distributor of drainage an civil engineering products 38.4 – – –
11/2/2012 Penfund Yes Jet Equipment and Tools Distributor and marketer of tools, materials handling equipment and abrasives
– – – –
10/31/2012 Rexel Munro Distributing Company
Distributor of electrical, safety and energy efficient solutions 150.0 – – –
10/25/2012 Bossard Group KVT Fastening Distributor of high quality, special fastening and sealing applications
214.0 128.5 1.7 –
10/18/2013 Yes Blue Point Capital Yes Smith-Cooper International
Distributor of valves and fittings – – – –
10/22/2012 United Stationers O.K.I. Supply Distributor of welding, safety and industrial products 90.0 150.0 0.6 –
10/18/2012 Yes Harvest Partners Yes FCX Performance Distributor of flow control equipment – – – –
10/17/2012 WESCO International EECOL Electric Corporation
Distributor of electrical products and services 1,177.0 900.0 1.3 10.0
10/15/2012 Invicta Holdings Kian Ann Engineering Distributor of heavy machinery parts and diesel engine components
155.4 139.6 1.1 8.7
10/10/2012 United Central Industrial Supply
GHX Holdings Distributor of fluid transfer and sealing products 240.0 259.0 0.9 –
10/9/2012 Yes TPG Capital Yes Fleetpride Distributor of heavy duty truck and trailer parts – – – –
10/8/2012 Lindstrom Metric Bossard Metrics Distributor of metric fasteners – – – – 10/3/2012 Reliance Steel &
Aluminum Sunbelt Steel Texas Distributor of special alloy
steel bar and heavy-wall tubing products
– 48.0 – –
9/27/2012 Crescent Electric Supply Stoneway Electric Supply Distributor of electrical products – 130.0 – –
8/29/2012 Russel Metals Apex Distribution Distributor of industrial and oilfield products and services 253.0 – – –
8/22/2012 Sonepar Codale Electric Supply Distributor of electrical products – 220.0 – –
8/16/2012 Wencor Group AmSafe Aftermarket Spares and Services business
Distributor of aftermarket commercial aviation parts – – – –
8/13/2012 Kaman Corporation Zeller Distributor of electrical and automation components – 80.0 – –
8/8/2012 Wencor Group Absolute Aviation Services and Soundair Aviation Services
Distributors of MRO products and services – – – –
8/1/2012 Arrowhead Electrical Products
Power Sports Industries / All Balls Racing
Distributor of bearing kits and suspension components for ATVs and motorcycles
– – – –
7/20/2012 Pilot Flying J Yes Maxum Petroleum Distributor of refined petroleum products – – – –
7/12/2012 Anixter International Jorvex Distributor of electrical wire, cable, PVC, HDPE pipe and conveyor belts
– 115.0 – –
6/25/2012 B/E Aerospace Interturbine Group Distributor of chemicals, consumables, composites and other MRO products
251.0 – – –
6/20/2012 FCX Performance Pump Pros Distributor of industrial pumps – – – – 6/18/2012 WESCO International Conney Safety Products Distributor of workplace safety
and first aid supplies – 85.0 – –
________________ Source: Baird Investment Banking internal database. Shading indicates Baird transaction.

Baird’s Recent Transaction Experience
Robert W. Baird & Co. 24
Selected M&A Transactions
Shading = LTM Transactions
________________ Note: Selected transactions since 2006. Please visit rwbaird.com/investmentbanking for a complete list of transactions.

Baird’s Recent Transaction Experience
Robert W. Baird & Co. 25
Selected Financing Transactions
Shading = LTM Transactions
________________ Note: Select transactions since 2004. Please visit rwbaird.com/investmentbanking for a complete list of transactions.
$186,875,000Common Stock
Follow-on Offering
$127,075,000Common Stock
Initial Public Offering
$276,718,750Common Stock
Follow-on Offering
$169,337,500Common Stock
Follow-on Offering
$215,625,000Common Stock
Initial Public Offering

Baird’s Industrial Distribution Team
Robert W. Baird & Co. 26
THOMAS LANGE – MANAGING DIRECTOR, HEAD OF INDUSTRIAL DISTRIBUTION GROUP
T: +1.813.273.8248 E: [email protected]
Tom Lange joined Baird in January 1996, and is the leader of the distribution team within Baird’s investment banking group. Since 2000, Baird has completed over $18 billion in equity capital markets and advisory transactions on behalf of Baird distribution and supply chain clients. Prior to joining Baird, he was a partner in the securities and mergers and acquisitions practice of the law firm of Foley & Lardner. He is a member of the State Bar of Florida, and the American Institute of Certified Public Accountants. Tom graduated, magna cum laude, from Notre Dame Law School, and received a BBA degree with a concentration in Accounting, cum laude, from the University of Notre Dame. He began his career in the Chicago office of Ernst & Whinney.
JASON KLIEWER – MANAGING DIRECTOR
T: +1.813.273.8242 E: [email protected]
Jason Kliewer joined Baird in July 1998, and is a member of the distribution team within Baird's investment banking group. Jason has extensive M&A and capital markets experience working with distribution clients on both sides of the Atlantic. Jason was a founder member of Baird's M&A team in Europe and was based in Baird's London office for five years. Jason received an MBA from the University of Cambridge, where he was a Gates Cambridge Scholar, and graduated with a BS degree in Finance, with highest honors, from the University of Florida.
DAVID SILVER – MANAGING DIRECTOR, HEAD OF EUROPEAN INVESTMENT BANKING
T: +44.207.667.8216 E: [email protected]
David Silver joined Baird in January 1998 having practiced as a corporate and banking lawyer at Berwin Leighton. He is a founder member of Baird’s M&A team in Europe and has extensive experience advising private equity clients, corporates and entrepreneurs in the US and Europe. Mr. Silver is Head of European Investment Banking and is responsible for Baird’s Investment Banking and European business services practice and coverage of the financial sponsor community. Mr. Silver has an MBA, with distinction, from London Business School and a law degree from Leeds University.
ANTHONY SIU – MANAGING DIRECTOR, HEAD OF INVESTMENT BANKING FOR GREATER CHINA
T: +86.21.6182.0980 E: [email protected]
Anthony Siu is a Managing Director and the Head of Investment Banking for Greater China. He has over 18 years of investment banking experience in Asia. Prior to joining Baird in 2008, Anthony was a Director of Corporate Finance & Advisory at Standard Chartered Bank, responsible for cross-border M&A activities in the region. Before joining Standard Chartered, Anthony was a Senior Vice President at Daiwa Securities SMBC. He also worked at Dresdner Kleinwort Wasserstein and Schroders where he was involved in a variety of M&A and capital market transactions. Anthony received his Executive MBA degree from the Kellogg School of Management at Northwestern University and HKUST and holds a B.A. degree from Pomona College. He is a CPA certified in California.

Baird’s Industrial Distribution Team
Robert W. Baird & Co. 27
SATOSHI MATSUMOTO – MANAGING DIRECTOR, DIRECTOR OF JAPAN M&A
T: +1.312.609.5446 E: [email protected]
Satoshi is a Managing Director and Director of Japan M&A based in Baird’s Chicago office. In his role, Satoshi leads the firm's cross-border M&A origination and execution efforts involving Japanese companies, working across all of Baird's industry groups and geographies. Satoshi has an extensive background in cross-border M&A involving Japanese companies. Prior to joining Baird in 2012, Satoshi was a Managing Director and Head of Japan Consumer Retail at Barclays Capital. Prior to joining Barclays in 2009, he was a Managing Director at Nomura Securities, which had acquired Lehman Brothers' former Asian & European operations. Prior to Nomura, Satoshi spent 11 years at Lehman Brothers in Tokyo and New York. In 2006 he was asked to build the Japan Consumer/Retail Coverage team at Lehman, which became one of the most successful Consumer / Retail teams in Japan with a leading position in cross-border M&A in the Consumer / Retail sector. Prior to joining Lehman Brothers in 1997, Satoshi worked at Long-Term Credit Bank of Japan for 4 years. Satoshi has a B.A. in Economics from Keio University, Tokyo.

Investment Banking Contact List
Robert W. Baird & Co. 28
Steven G. Booth Head of Investment Banking
414.298.7661 [email protected]
Rodney L. Tyson Managing Director
Chief Operating Officer 312.609.4984
Richard F. Waid Vice Chairman 404.264.2210
C.H. Randolph Lyon Vice Chairman 312.609.4931
Services Brian S. Doyal Managing Director +1.312.609.4916 [email protected] Christopher W. Hildreth Managing Director +1.312.609.4937 [email protected] Howard P. Lanser Managing Director +1.312.609.5478 [email protected] John R. Lanza Managing Director +1.414.298.7669 [email protected] Kiran Paruchuru Managing Director +1.414.298.7642 [email protected] Breton A. Schoch Managing Director +1.312.609.4965 [email protected] Andrew K. Snow Managing Director +1.312.609.4972 [email protected] Ross W. Williams Managing Director +1.414.298.6235 [email protected] Daniel M. Alfe Director +1.312.609.4922 [email protected]
Consumer Paul T. Rogalski Managing Director +1.312.609.4912 [email protected] Jason Abt Managing Director +1.415.627.3215 [email protected]
Christopher Harned Managing Director +1.414.765.3908 [email protected] Andrew Martin Managing Director +1.704.553.6615 [email protected]
Nicholas Pavlidis Managing Director +1.312.609.4977 [email protected] Joe Pellegrini Managing Director +1.704.553.6612 [email protected]
Christopher J. Sciortino Managing Director +1.312.609.4923 [email protected] Robert Rosenfeld Director +1.312.609.4971 [email protected] Kurt Roth Director +1.312.609.4689 [email protected]
Industrial Paul T. Rogalski Managing Director +1.312.609.4912 [email protected] Christopher C. McMahon Managing Director Head of Global M&A +1.312.609.4983 [email protected] Brian P. McDonagh Managing Director Co-Head of M&A +1.704.553.6611 [email protected] Justin T. Albert Managing Director +1.303.270.6381 [email protected] Joel A. Cohen Managing Director +1.312.609.4924 [email protected] Jim Conniff Managing Director +1.312.609.4976 [email protected] Christopher R. Cooper Managing Director +1.312.609.5490 [email protected] Stephen B. Guy Managing Director +1.414.765.7247 [email protected] Trisha K. Hansen Managing Director +1.414.765.3521 [email protected] Jason P. Kliewer Managing Director +1.813.273.8242 [email protected] Thomas W. Lacy Managing Director +1.414.298.7648 [email protected] Thomas E. Lange Managing Director +1.813.273.8248 [email protected] Joseph T. Packee Managing Director +1.414.298.7644 [email protected] Christian Colucci Director +1.312.609.4475 [email protected] Adam W. Czaia Director +1.414.298.7358 [email protected] Michael Lindemann Director +1.414.298.7408 [email protected]
Technology Greg Ingram Managing Director +1.415.627.3279 [email protected] John Moriarty Managing Director +1.650.424.3811 [email protected]
Louis Draper Managing Director +1.650.858.3821 [email protected] Stephen B. Guy Managing Director +1.414.765.7247 [email protected] Michael Horwitz Managing Director +1.415.627.3284 [email protected] Brian Sapp Director +1.415.627.3288 [email protected]
Energy Richard F. Waid Vice Chairman +1.404.264.2210 [email protected] Curtis Goot Managing Director +1.314.445.6540 [email protected] Frank Murphy Managing Director +1.314.445.6532 [email protected] John R. Lanza Managing Director +1.414.298.7669 [email protected] Kjell Lundal Director +1.314.445.6533 [email protected] Jim Penilla Director +1.314.445.6536 [email protected]
Real Estate Steven Goldberg Managing Director +1.703.918.7808 [email protected] James O’Brien Managing Director +1.703.918.7814 [email protected] Jeff Rogatz Managing Director +1.703.918.7823 [email protected] Lindsey Houser Managing Director +1.704.553.6610 [email protected] Justin Glasgow Director +1.703.821.5763 [email protected] Adam Lefkowitz Director +1.703.918.7817 [email protected]
Healthcare Brian S. Doyal Managing Director +1.312.609.4916 [email protected] David S. Schechner Managing Director +1.617.426.5424 [email protected] Bill Suddath Managing Director +1.404.264.2222 [email protected] Benjamin A. Brown Director +1.414.298.7013 [email protected] Travis Lacey Director +1.312.609.4935 [email protected] Ryan Mausehund Director +1.650.858.3817 [email protected]
Chad W. Moore, CPA, CFA Director +1.312.609.5475 [email protected]
Financial Institutions Jim Hemmer Managing Director +1.312.609.7065 [email protected] Mark C. Micklem Managing Director +1.703.821.5787 [email protected]
Financial Sponsors
C. Christopher Coetzee Managing Director +1.312.609.4913 [email protected] Leslie Cheek IV Managing Director +1.617.426.5789 [email protected] Thomas W. Lacy Managing Director +1.414.298.7648 [email protected]
John Moriarty Managing Director +1.650.424.3811 [email protected] Jeffrey M. Seaman Managing Director +1.312.609.4687 [email protected] David M. Wierman Managing Director +1.404.264.2211 [email protected] Benjamin A. Brown Director +1.414.298.7013 [email protected]
Mergers & Acquisitions Christopher C. McMahon Managing Director Head of Global M&A +1.312.609.4983 [email protected] Brian P. McDonagh Managing Director Co-Head of M&A +1.704.553.6611 [email protected] Christopher Harned Managing Director +1.414.765.3908 [email protected] Owen L. Hart Managing Director +1.415.627.3273 [email protected] Howard P. Lanser Managing Director +1.312.609.5478 [email protected] Satoshi Matsumoto Managing Director Director of Japan M&A +1.312.609.5446 [email protected] J. David Cumberland, CFA Director, M&A Research +1.312.609.5429 [email protected]
Equity Capital Markets Peter S. Kies Managing Director +1.414.765.7262 [email protected] Greg Ingram Managing Director +1.415.627.3279 [email protected] Lance R. Lange Managing Director +1.414.765.7079 [email protected] Gary R. Placek Managing Director +1.414.765.3611 [email protected] Corporate Restructuring William G. Welnhofer Managing Director +1.312.609.5476 [email protected]
Europe London†
John A. Fordham Chairman of Baird International +44.207.667.8438 [email protected] David M. Silver Managing Director Head of European Investment Banking +44.207.667.8216 [email protected] Nicholas R. Sealy Managing Director Co-Head, European Investment Banking +44.207.667.8370 [email protected] Paul Bail Managing Director +44.207.667.8271 [email protected] Jonathan Bourn Managing Director +44.207.667.8308 [email protected] Vinay Ghai Managing Director +44.207.667.8225 [email protected] Jonathan Harrison Managing Director +44.207.667.8414 [email protected] Matthew Gehrke Director +44.207.667.8268 [email protected] Gary Page Director +44.207.667.8242 [email protected]
Frankfurt Joachim Beickler Managing Director +49.69.13.01.49.51 [email protected] Michael Wolff Managing Director +49.69.13.01.49.49 [email protected] Sven Harmsen Director +49.69.13.01.49.56 [email protected]
Asia Shanghai
Anthony Siu Managing Director Head of Asia Investment Banking +86.21.6182.0980 [email protected]
† Robert W. Baird Limited is authorized and regulated by the Financial Conduct Authority.

Appendix – Disclaimers and Other Disclosures
Robert W. Baird & Co. 29
DISCLAIMERS This is not a complete analysis of every material fact regarding any company, industry or security. The opinions expressed here reflect our judgment at this date and are subject to change. The information has been obtained from sources we consider to be reliable, but we cannot guarantee the accuracy.
ADDITIONAL INFORMATION ON COMPANIES MENTIONED HEREIN IS AVAILABLE UPON REQUEST
The Dow Jones Industrial Average, S&P 500, S&P 400 and Russell 2000 are unmanaged common stock indices used to measure and report performance of various sectors of the stock market; direct investment in indices is not available.
Baird is exempt from the requirement to hold an Australian financial services license. Baird is regulated by the United States Securities and Exchange Commission, FINRA, and various other self-regulatory organizations and those laws and regulations may differ from Australian laws. This report has been prepared in accordance with the laws and regulations governing United States broker-dealers and not Australian laws.
Copyright 2013 Robert W. Baird & Co. Incorporated. No part of this publication may be reproduced or distributed in any form or by any means without our prior written approval. However, you may download one copy of the information for your personal, non-commercial viewing only, provided that you do not remove or alter any trade mark, copyright or other proprietary notice.
OTHER DISCLOSURES UK disclosure requirements for the purpose of distributing this report into the UK and other countries for which Robert W Baird Limited holds an ISD passport.
This report is for distribution into the United Kingdom only to persons who fall within Article 19 or Article 49(2) of the Financial Services and Markets Act 2000 (financial promotion) order 2001 being persons who are investment professionals and may not be distributed to private clients. Issued in the United Kingdom by Robert W Baird Limited, which has offices at Mint House 77 Mansell Street, London, E1 8AF, and is a company authorized and regulated by the Financial Conduct Authority.
Robert W Baird Limited ("RWBL") is exempt from the requirement to hold an Australian financial services license. RWBL is regulated by the Financial Conduct Authority ("FCA") under UK laws and those laws may differ from Australian laws. This document has been prepared in accordance with FCA requirements and not Australian laws.

Robert W. Baird & Co. www.rwbaird.com 800.RW.BAIRD
Equity Capital Markets and Private Equity Office Locations
U.S. Offices Atlanta One Buckhead Plaza 3060 Peachtree Road Suite 1815 Atlanta, GA 30305 888.792.9478 Boston One Post Office Square Suite 3617 Boston, MA 02109 888.661.5431 Charlotte 4725 Piedmont Row Drive Piedmont Town Center Two Suite 750 Charlotte, NC 28210 704.553.6600 Chicago 227 West Monroe Street Suite 2100 Chicago, IL 60606 800.799.5770 Denver 210 University Boulevard Suite 460 Denver, CO 80206 800.792.2473 Milwaukee 777 East Wisconsin Avenue Milwaukee, WI 53202 888.224.7326 Nashville 2525 West End Avenue Suite 1000 Nashville, TN 37203 888.454.4981
New York City 3 Rockefeller Plaza 610 Fifth Avenue New York, NY 10112 800.792.2473 Palo Alto 1661 Page Mill Road Suite A Palo Alto, CA 94304 650.858.3800 San Francisco 50 California Street Suite 450 San Francisco, CA 94111 866.715.4024 555 California Street Suite 4900 San Francisco, CA 94104 415.627.3270 St. Louis 8000 Maryland Avenue Suite 500 St. Louis, MO 63105 888.792.7634 Stamford 100 First Stamford Place 3rd Floor Stamford, CT 06902 800.380.3247 Tampa 401 East Jackson Street Suite 2900 Tampa, FL 33602 888.238.2672 Washington, D.C. 1717 K Street NW Suite 910 Washington, DC 20036 202.303.1800
International Locations* Frankfurt Neue Mainzer Strasse 28 60311 Frankfurt Germany 011.49.69.13.01.49.0 London Mint House 77 Mansell Street London E1 8AF UK 011.44.207.488.1212 Shanghai Rm 42-022, 42/F, Hang Seng Bank Tower No.1000 Lujiazui Ring Road Pudong Shanghai 200120, China 011.86.21.6182.0980
*Baird and its operating affiliates have offices in the United States, Europe and Asia. Robert W. Baird & Co. Incorporated. Member SIPC. Robert W. Baird Ltd. and Baird Capital Partners Europe are authorized and regulated in the UK by the Financial Conduct Authority. ©2013 Robert W. Baird & Co. Incorporated.