2012 Georgia Medical School Graduate Survey Report
17
2012 Georgia Medical School Graduate Survey Report GEORGIA BOARD FOR PHYSICIAN WORKFORCE DECEMBER 2012 2 PEACHTREE STREET, NW, 36 TH FLOOR, ATLANTA, GA 30303 PHONE (404) 232-7972 / FAX (404) 656-2596 Cherri Tucker, Executive Director, Colette Jeffery, Cheryl Culp and G.E. Alan Dever, M.D., Ph.D., contributors. www.gbpw.georgia.gov
Transcript of 2012 Georgia Medical School Graduate Survey Report
2012 Georgia Medical School
Graduate Survey Report
GEORGIA BOARD FOR PHYSICIAN WORKFORCE
DECEMBER 2012
2 PEACHTREE STREET, NW, 36TH FLOOR, ATLANTA, GA 30303
PHONE (404) 232-7972 / FAX (404) 656-2596
Cherri Tucker, Executive Director, Colette Jeffery, Cheryl Culp and
G.E. Alan Dever, M.D., Ph.D., contributors.
www.gbpw.georgia.gov
2
Table of Contents Executive Summary and Key Findings ................................................................................ 3-4 Table 1: Specialty matched during PGY 1 year ........................................................................ 5 Table 2: Specialty distribution declared by graduates ............................................................. 6 Table 3: When decision was made regarding specialty choice ................................................ 7 Table 4: Factors which influenced specialty choice ................................................................. 8 Table 5: GME match information ........................................................................................... 9 Table 6: GME match information-location ............................................................................. 9 Table 7: Georgia GME match information ............................................................................ 10 Table 8: Georgia GME match information-number of programs ........................................... 10 Table 9: Top three choices of Georgia programs ................................................................... 11 Table 10: Georgia medical school graduates that ranked GA programs in top three .............. 12 Table 11: Percentage of graduates that matched to GA or out-of-state program .................. 13 Table 12: Primary reason for choosing an out-of-state program ........................................... 14 Table 13: Factors influencing selection of residency program ............................................... 15 Table 14: Plans to practice in an underserved area ............................................................... 16 Table 15: Underserved area location ................................................................................... 16 Map: Location where graduates plan to practice .................................................................. 17
2012 Georgia Medical School Graduate Survey Report
3
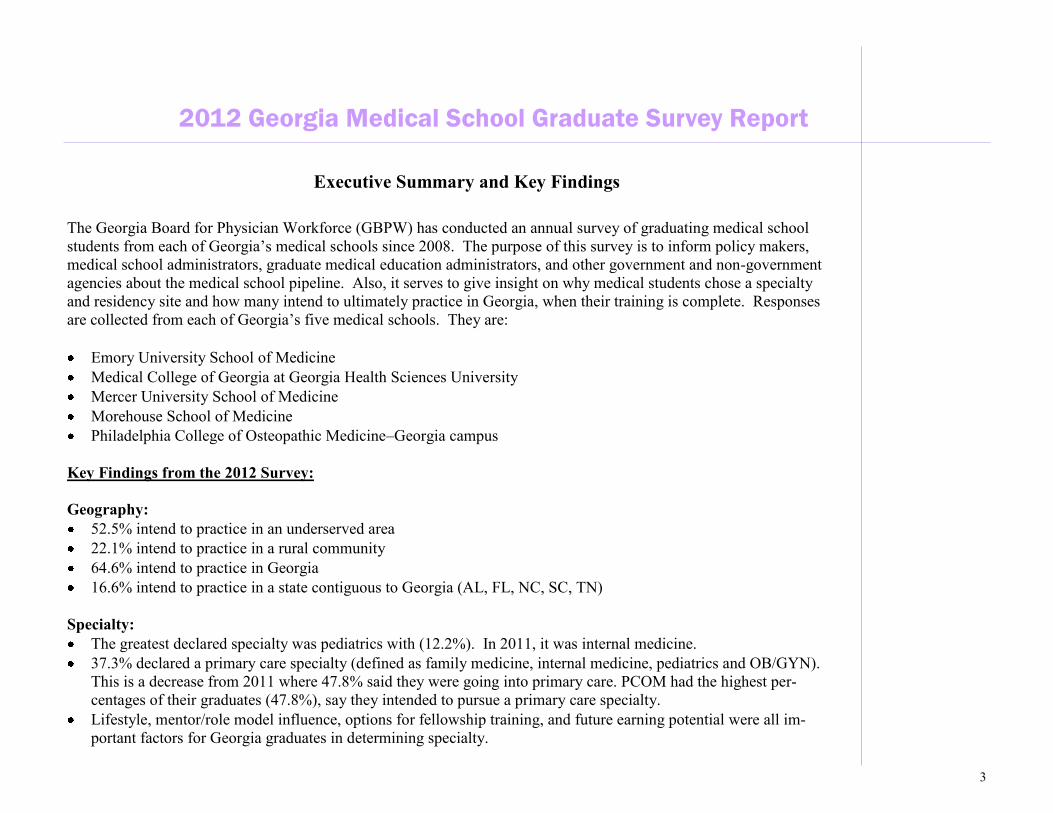
Executive Summary and Key Findings
2012 Georgia Medical School Graduate Survey Report
The Georgia Board for Physician Workforce (GBPW) has conducted an annual survey of graduating medical school
students from each of Georgia’s medical schools since 2008. The purpose of this survey is to inform policy makers,
medical school administrators, graduate medical education administrators, and other government and non-government
agencies about the medical school pipeline. Also, it serves to give insight on why medical students chose a specialty
and residency site and how many intend to ultimately practice in Georgia, when their training is complete. Responses
are collected from each of Georgia’s five medical schools. They are:
Emory University School of Medicine
Medical College of Georgia at Georgia Health Sciences University
Mercer University School of Medicine
Morehouse School of Medicine
Philadelphia College of Osteopathic Medicine–Georgia campus
Key Findings from the 2012 Survey:
Geography:
52.5% intend to practice in an underserved area
22.1% intend to practice in a rural community
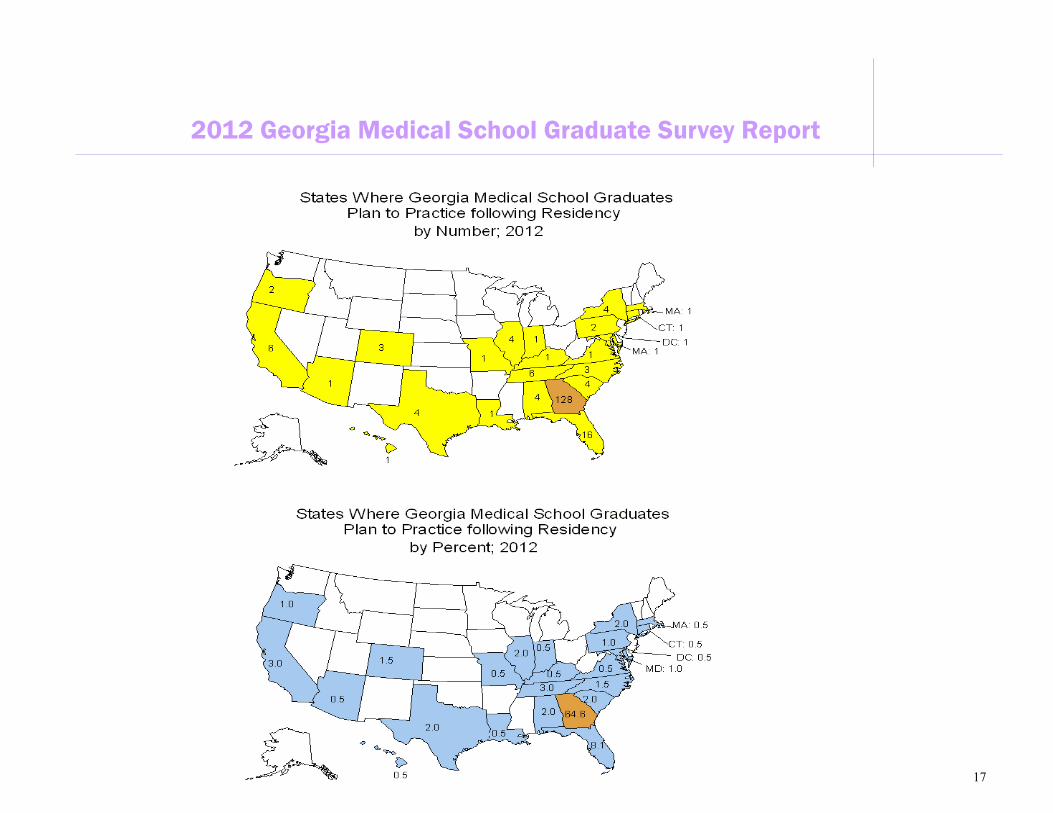
64.6% intend to practice in Georgia
16.6% intend to practice in a state contiguous to Georgia (AL, FL, NC, SC, TN)
Specialty:
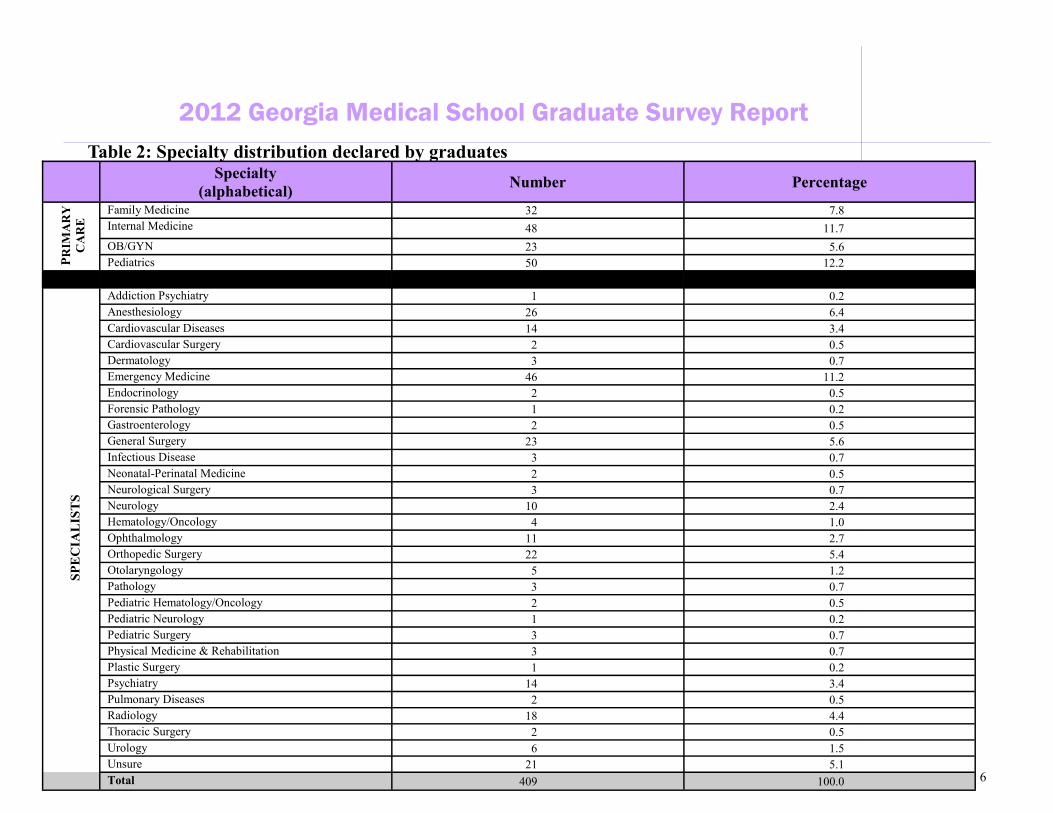
The greatest declared specialty was pediatrics with (12.2%). In 2011, it was internal medicine.
37.3% declared a primary care specialty (defined as family medicine, internal medicine, pediatrics and OB/GYN).
This is a decrease from 2011 where 47.8% said they were going into primary care. PCOM had the highest per-
centages of their graduates (47.8%), say they intended to pursue a primary care specialty.
Lifestyle, mentor/role model influence, options for fellowship training, and future earning potential were all im-
portant factors for Georgia graduates in determining specialty.
4
Executive Summary and Key Findings
2012 Georgia Medical School Graduate Survey Report
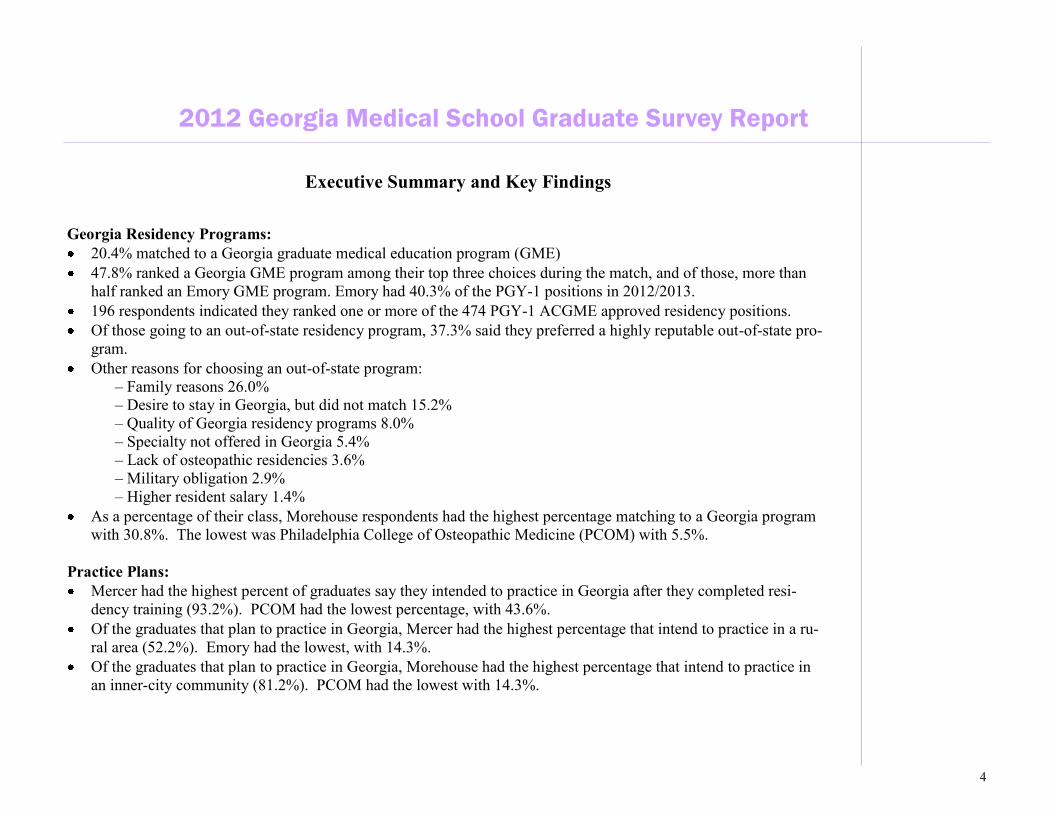
Georgia Residency Programs:
20.4% matched to a Georgia graduate medical education program (GME)
47.8% ranked a Georgia GME program among their top three choices during the match, and of those, more than
half ranked an Emory GME program. Emory had 40.3% of the PGY-1 positions in 2012/2013.
196 respondents indicated they ranked one or more of the 474 PGY-1 ACGME approved residency positions.
Of those going to an out-of-state residency program, 37.3% said they preferred a highly reputable out-of-state pro-
gram.
Other reasons for choosing an out-of-state program:
– Family reasons 26.0%
– Desire to stay in Georgia, but did not match 15.2%
– Quality of Georgia residency programs 8.0%
– Specialty not offered in Georgia 5.4%
– Lack of osteopathic residencies 3.6%
– Military obligation 2.9%
– Higher resident salary 1.4%
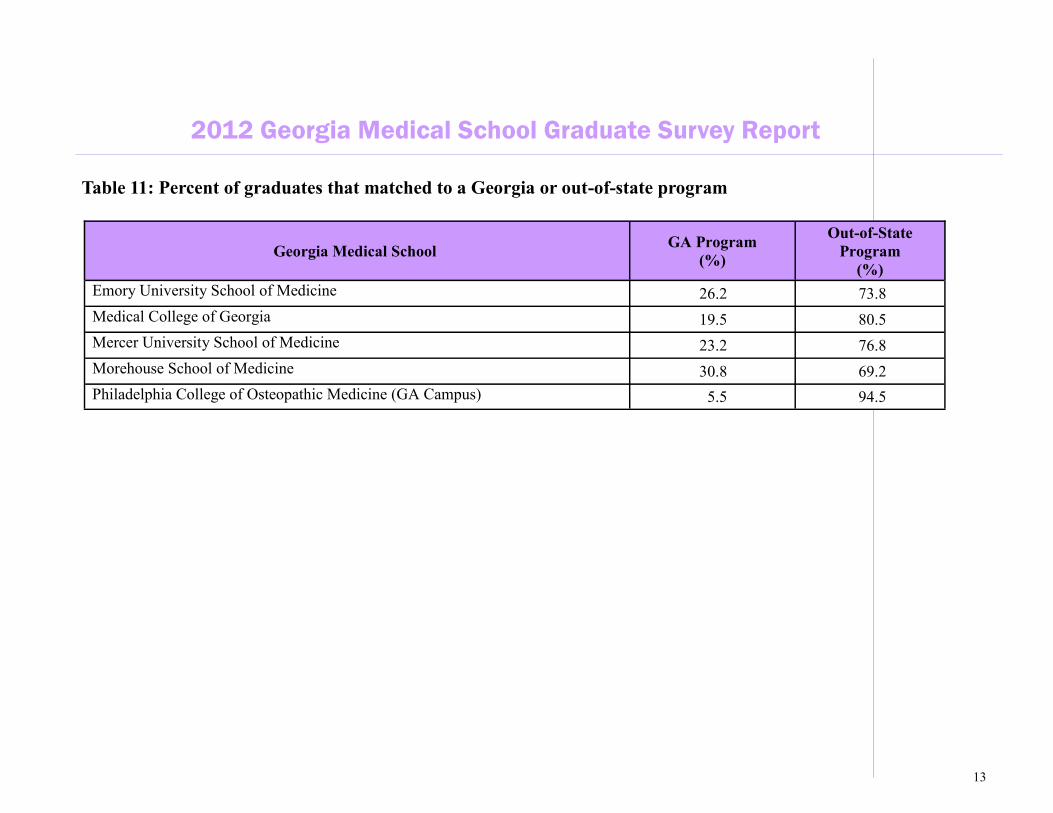
As a percentage of their class, Morehouse respondents had the highest percentage matching to a Georgia program
with 30.8%. The lowest was Philadelphia College of Osteopathic Medicine (PCOM) with 5.5%.
Practice Plans:
Mercer had the highest percent of graduates say they intended to practice in Georgia after they completed resi-
dency training (93.2%). PCOM had the lowest percentage, with 43.6%.
Of the graduates that plan to practice in Georgia, Mercer had the highest percentage that intend to practice in a ru-
ral area (52.2%). Emory had the lowest, with 14.3%.
Of the graduates that plan to practice in Georgia, Morehouse had the highest percentage that intend to practice in
an inner-city community (81.2%). PCOM had the lowest with 14.3%.
5
2011
Specialty
(alphabetical) Number Percentage
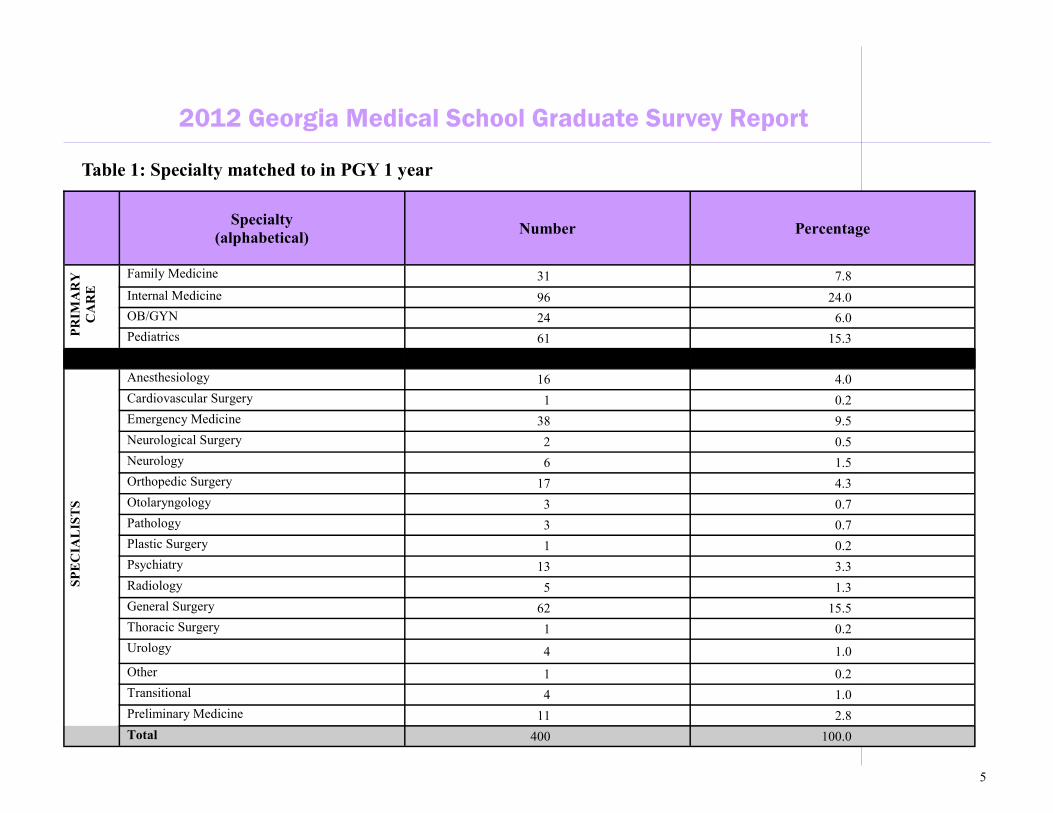
Family Medicine 31 7.8
Internal Medicine 96 24.0
OB/GYN 24 6.0
Pediatrics 61 15.3
Anesthesiology 16 4.0
Cardiovascular Surgery 1 0.2
Emergency Medicine 38 9.5
Neurological Surgery 2 0.5
Neurology 6 1.5
Orthopedic Surgery 17 4.3
Otolaryngology 3 0.7
Pathology 3 0.7
Plastic Surgery 1 0.2
Psychiatry 13 3.3
Radiology 5 1.3
General Surgery 62 15.5
Thoracic Surgery 1 0.2
Urology 4 1.0
Other 1 0.2
Transitional 4 1.0
Preliminary Medicine 11 2.8
Total 400 100.0
PR
IMA
RY
CA
RE
SP
EC
IAL
IST
S
2012 Georgia Medical School Graduate Survey Report
Table 1: Specialty matched to in PGY 1 year
6
Specialty
(alphabetical) Number Percentage
Family Medicine 32 7.8
Internal Medicine 48 11.7
OB/GYN 23 5.6
Pediatrics 50 12.2
Addiction Psychiatry 1 0.2
Anesthesiology 26 6.4
Cardiovascular Diseases 14 3.4
Cardiovascular Surgery 2 0.5
Dermatology 3 0.7
Emergency Medicine 46 11.2
Endocrinology 2 0.5
Forensic Pathology 1 0.2
Gastroenterology 2 0.5
General Surgery 23 5.6
Infectious Disease 3 0.7
Neonatal-Perinatal Medicine 2 0.5
Neurological Surgery 3 0.7
Neurology 10 2.4
Hematology/Oncology 4 1.0
Ophthalmology 11 2.7
Orthopedic Surgery 22 5.4
Otolaryngology 5 1.2
Pathology 3 0.7
Pediatric Hematology/Oncology 2 0.5
Pediatric Neurology 1 0.2
Pediatric Surgery 3 0.7
Physical Medicine & Rehabilitation 3 0.7
Plastic Surgery 1 0.2
Psychiatry 14 3.4
Pulmonary Diseases 2 0.5
Radiology 18 4.4
Thoracic Surgery 2 0.5
Urology 6 1.5
Unsure 21 5.1
Total 409 100.0
PR
IMA
RY
CA
RE
S
PE
CIA
LIS
TS
2012 Georgia Medical School Graduate Survey Report
Table 2: Specialty distribution declared by graduates
7
2012 Georgia Medical School Graduate Survey Report
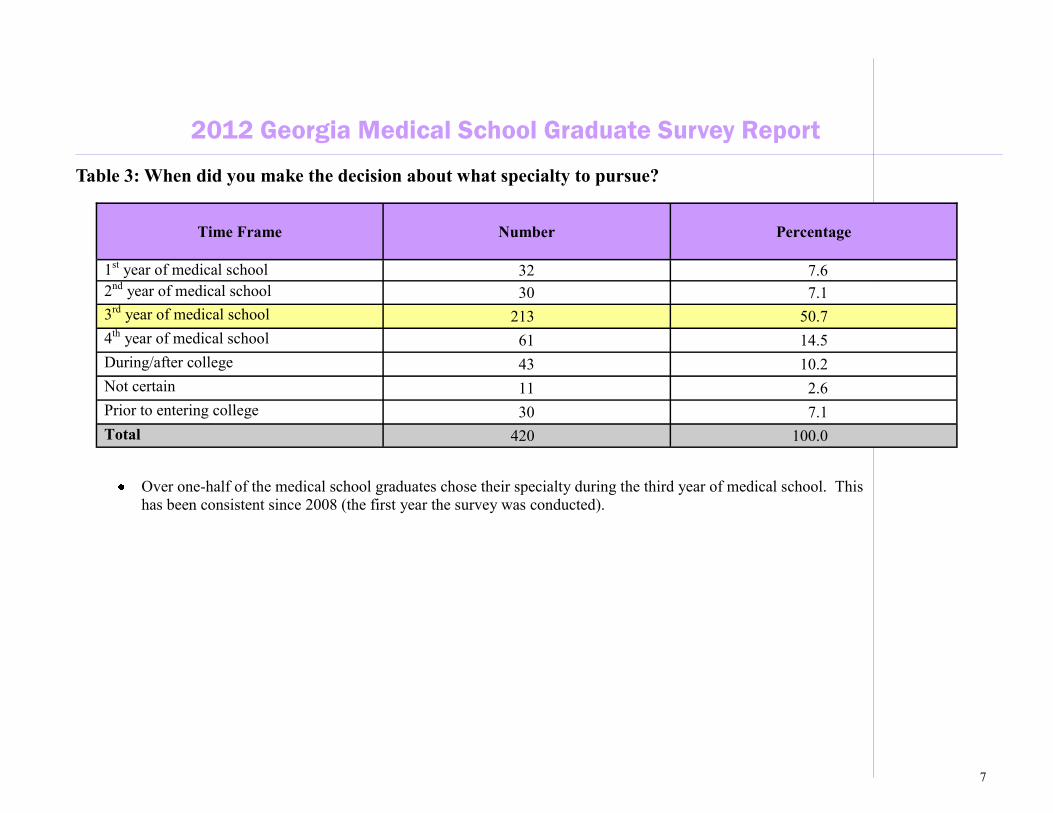
Table 3: When did you make the decision about what specialty to pursue?
Time Frame
Number Percentage
1st year of medical school 32 7.6
2nd year of medical school 30 7.1
3rd year of medical school 213 50.7
4th year of medical school 61 14.5
During/after college 43 10.2
Not certain 11 2.6
Prior to entering college 30 7.1
Total 420 100.0
Over one-half of the medical school graduates chose their specialty during the third year of medical school. This
has been consistent since 2008 (the first year the survey was conducted).
8
2012 Georgia Medical School Graduate Survey Report
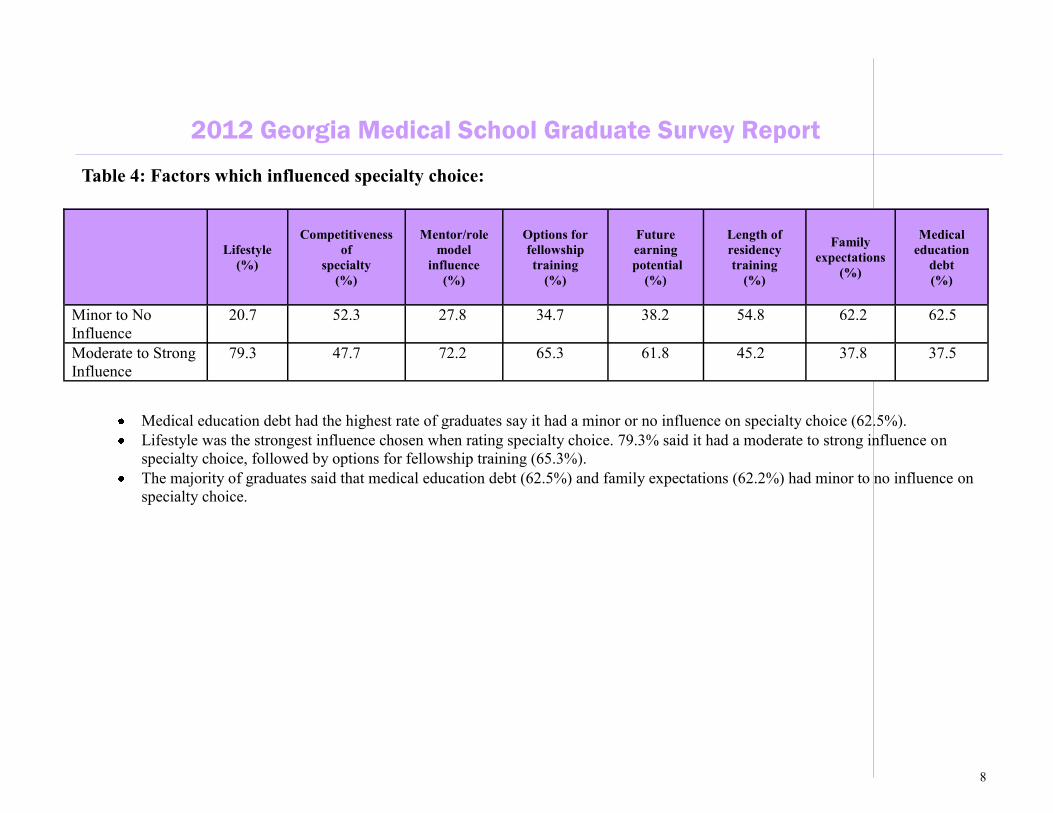
Table 4: Factors which influenced specialty choice:
Lifestyle
(%)
Competitiveness
of
specialty
(%)
Mentor/role
model
influence
(%)
Options for
fellowship
training
(%)
Future
earning
potential
(%)
Length of
residency
training
(%)
Family
expectations
(%)
Medical
education
debt
(%)
Minor to No
Influence
20.7 52.3 27.8 34.7 38.2 54.8 62.2 62.5
Moderate to Strong
Influence
79.3 47.7 72.2 65.3 61.8 45.2 37.8 37.5
Medical education debt had the highest rate of graduates say it had a minor or no influence on specialty choice (62.5%).
Lifestyle was the strongest influence chosen when rating specialty choice. 79.3% said it had a moderate to strong influence on
specialty choice, followed by options for fellowship training (65.3%).
The majority of graduates said that medical education debt (62.5%) and family expectations (62.2%) had minor to no influence on
specialty choice.
9
Number Percentage
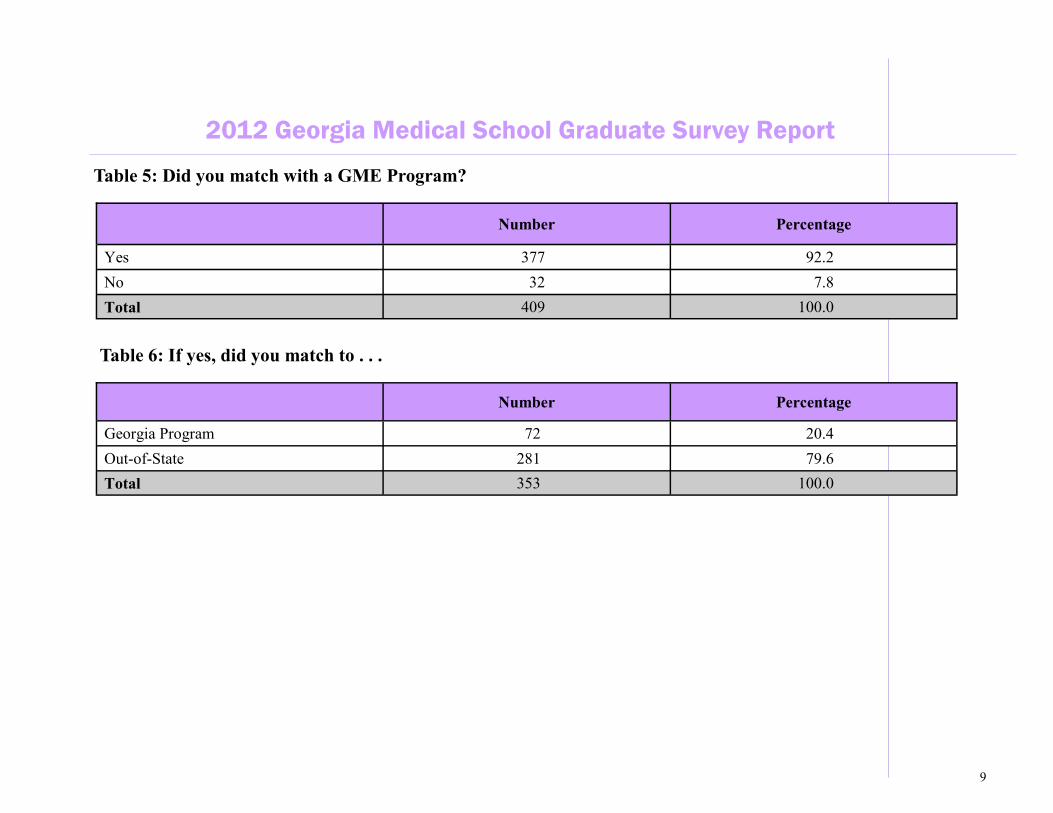
Yes 377 92.2
No 32 7.8
Total 409 100.0
Table 6: If yes, did you match to . . .
Number Percentage
Georgia Program 72 20.4
Out-of-State 281 79.6
Total 353 100.0
2012 Georgia Medical School Graduate Survey Report
Table 5: Did you match with a GME Program?
10
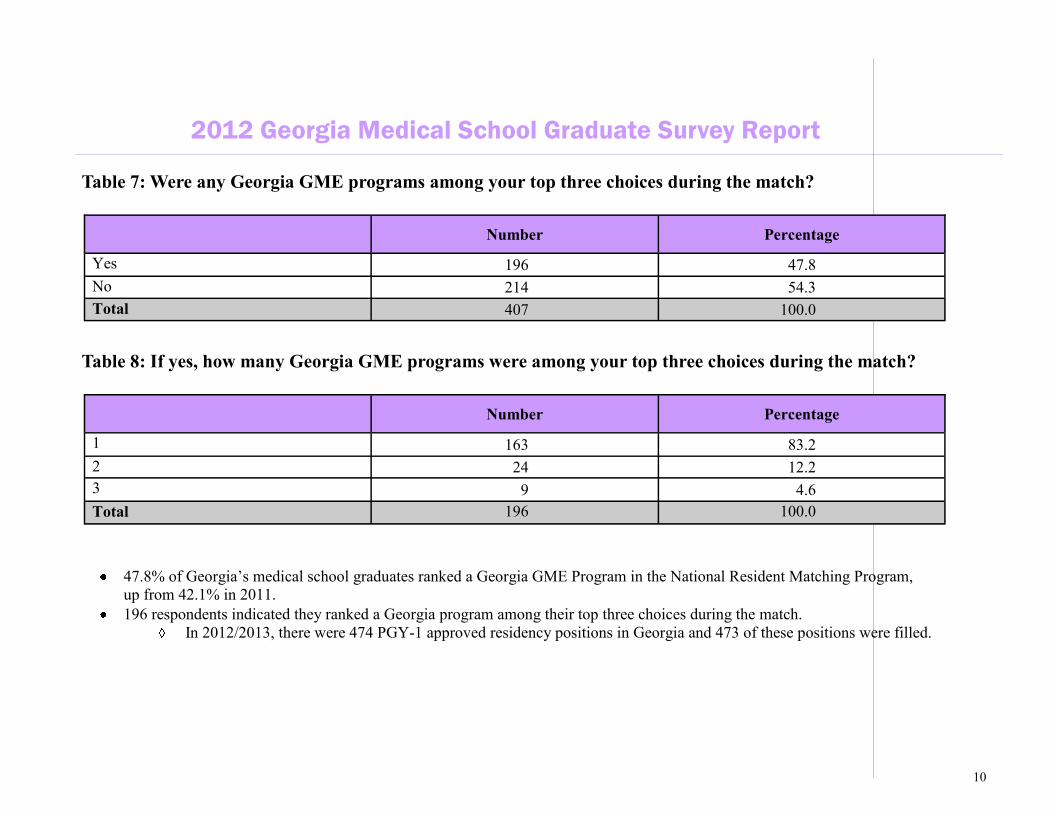
Table 8: If yes, how many Georgia GME programs were among your top three choices during the match?
Number Percentage
Yes 196 47.8
No 214 54.3
Total 407 100.0
Number Percentage
1 163 83.2
2 24 12.2
3 9 4.6
Total 196 100.0
47.8% of Georgia’s medical school graduates ranked a Georgia GME Program in the National Resident Matching Program,
up from 42.1% in 2011.
196 respondents indicated they ranked a Georgia program among their top three choices during the match.
In 2012/2013, there were 474 PGY-1 approved residency positions in Georgia and 473 of these positions were filled.
2012 Georgia Medical School Graduate Survey Report
Table 7: Were any Georgia GME programs among your top three choices during the match?
11
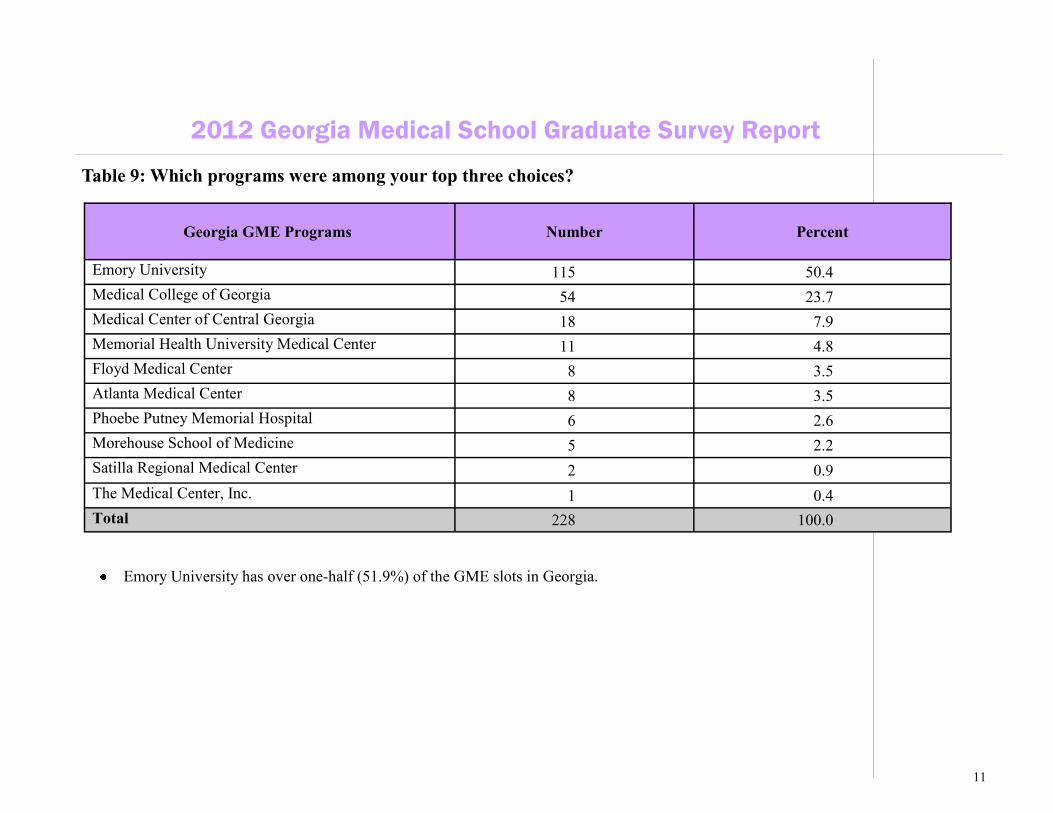
Georgia GME Programs
Number
Percent
Emory University 115 50.4
Medical College of Georgia 54 23.7
Medical Center of Central Georgia 18 7.9
Memorial Health University Medical Center 11 4.8
Floyd Medical Center 8 3.5
Atlanta Medical Center 8 3.5
Phoebe Putney Memorial Hospital 6 2.6
Morehouse School of Medicine 5 2.2
Satilla Regional Medical Center 2 0.9
The Medical Center, Inc. 1 0.4
Total 228 100.0
2012 Georgia Medical School Graduate Survey Report
Table 9: Which programs were among your top three choices?
Emory University has over one-half (51.9%) of the GME slots in Georgia.
12
2011
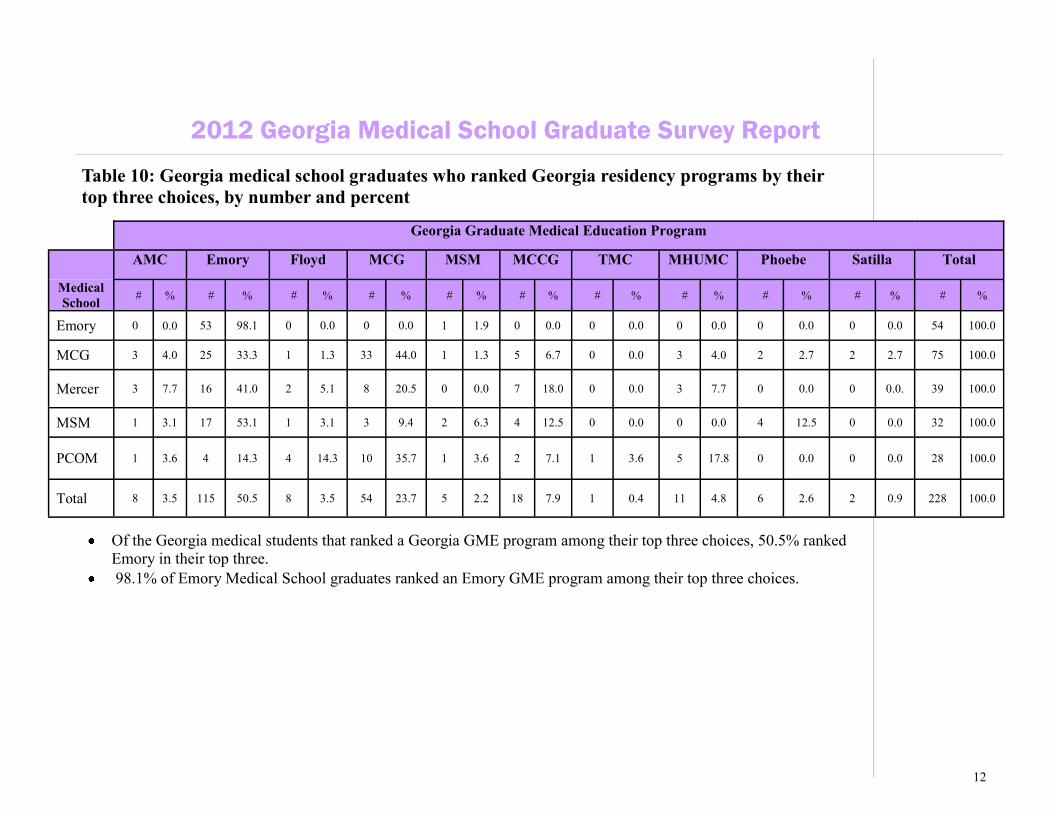
Georgia Graduate Medical Education Program
AMC Emory Floyd MCG MSM MCCG TMC MHUMC Phoebe Satilla Total
Medical
School # % # % # % # % # % # % # % # % # % # % # %
Emory 0 0.0 53 98.1 0 0.0 0 0.0 1 1.9 0 0.0 0 0.0 0 0.0 0 0.0 0 0.0 54 100.0
MCG 3 4.0 25 33.3 1 1.3 33 44.0 1 1.3 5 6.7 0 0.0 3 4.0 2 2.7 2 2.7 75 100.0
Mercer 3 7.7 16 41.0 2 5.1 8 20.5 0 0.0 7 18.0 0 0.0 3 7.7 0 0.0 0 0.0. 39 100.0
MSM 1 3.1 17 53.1 1 3.1 3 9.4 2 6.3 4 12.5 0 0.0 0 0.0 4 12.5 0 0.0 32 100.0
PCOM 1 3.6 4 14.3 4 14.3 10 35.7 1 3.6 2 7.1 1 3.6 5 17.8 0 0.0 0 0.0 28 100.0
Total 8 3.5 115 50.5 8 3.5 54 23.7 5 2.2 18 7.9 1 0.4 11 4.8 6 2.6 2 0.9 228 100.0
Of the Georgia medical students that ranked a Georgia GME program among their top three choices, 50.5% ranked
Emory in their top three.
98.1% of Emory Medical School graduates ranked an Emory GME program among their top three choices.
2012 Georgia Medical School Graduate Survey Report
Table 10: Georgia medical school graduates who ranked Georgia residency programs by their
top three choices, by number and percent
13
2012 Georgia Medical School Graduate Survey Report
Table 11: Percent of graduates that matched to a Georgia or out-of-state program
Georgia Medical School GA Program
(%)
Out-of-State
Program
(%)
Emory University School of Medicine 26.2 73.8
Medical College of Georgia 19.5 80.5
Mercer University School of Medicine 23.2 76.8
Morehouse School of Medicine 30.8 69.2
Philadelphia College of Osteopathic Medicine (GA Campus) 5.5 94.5
14
Reason for Leaving Number Percent
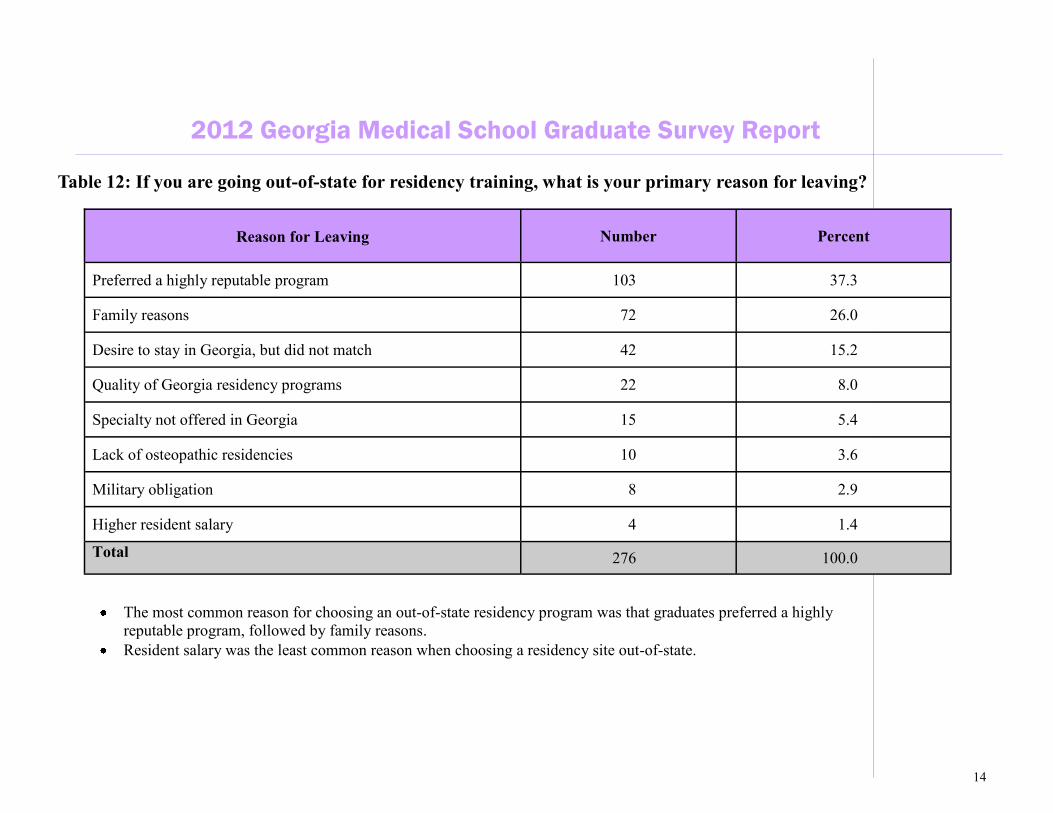
Preferred a highly reputable program 103 37.3
Family reasons 72 26.0
Desire to stay in Georgia, but did not match 42 15.2
Quality of Georgia residency programs 22 8.0
Specialty not offered in Georgia 15 5.4
Lack of osteopathic residencies 10 3.6
Military obligation 8 2.9
Higher resident salary 4 1.4
Total 276 100.0
2012 Georgia Medical School Graduate Survey Report
Table 12: If you are going out-of-state for residency training, what is your primary reason for leaving?
The most common reason for choosing an out-of-state residency program was that graduates preferred a highly reputable program, followed by family reasons.
Resident salary was the least common reason when choosing a residency site out-of-state.
15
Family
(%)
Location
(%)
Reputation of
residency program
(%)
Availability of
residence positions in
desired specialty
(%)
Resident
salary
(%)
Minor to No
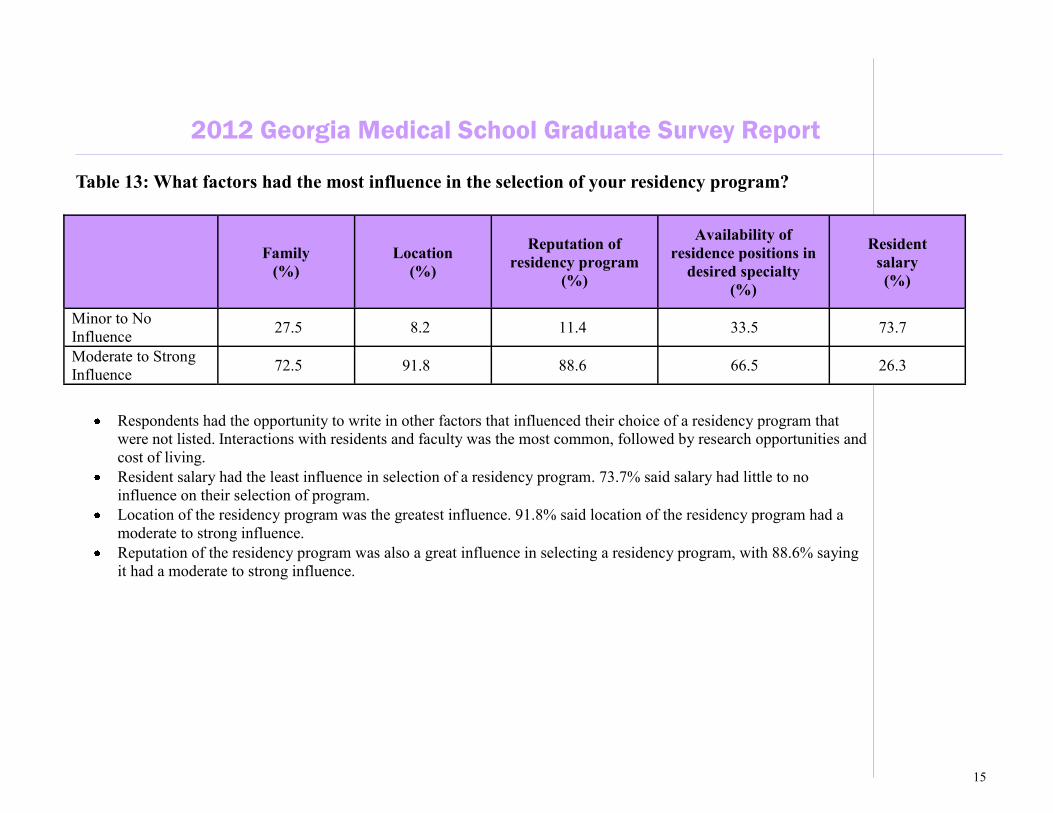
Influence 27.5 8.2 11.4 33.5 73.7
Moderate to Strong
Influence 72.5 91.8 88.6 66.5 26.3
Respondents had the opportunity to write in other factors that influenced their choice of a residency program that
were not listed. Interactions with residents and faculty was the most common, followed by research opportunities and
cost of living.
Resident salary had the least influence in selection of a residency program. 73.7% said salary had little to no
influence on their selection of program.
Location of the residency program was the greatest influence. 91.8% said location of the residency program had a
moderate to strong influence.
Reputation of the residency program was also a great influence in selecting a residency program, with 88.6% saying
it had a moderate to strong influence.
2012 Georgia Medical School Graduate Survey Report
Table 13: What factors had the most influence in the selection of your residency program?

16
Number Percent
Yes 211 52.5
No 191 47.5
Total 402 100.0
Table 15: If yes, indicate the location:
Number Percent
Inner-City Community 122 57.8
Rural Community 89 42.2
Total 211 100.0
2012 Georgia Medical School Graduate Survey Report
Table 14: Do you plan to locate your practice in a underserved area?
17
2012 Georgia Medical School Graduate Survey Report