2012 - Aveo · FKP is a leading Australian property and investment group. Our strategy of...
132
Annual Report 2012
Transcript of 2012 - Aveo · FKP is a leading Australian property and investment group. Our strategy of...

Annual Report 2012

FKP is a leading Australian property and investment group. Our strategy of diversification and integration has enabled us to build a comprehensive portfolio, centred around property that capitalises on our proven expertise in development, land subdivision, retirement village ownership and management, construction, property investment and asset management.
Over more than 30 years, our portfolio has expanded to include residential, retirement, mixed-use, commercial and industrial assets that help hundreds of thousands of people to decide how they wish to live, work, retire and invest.
Corporate Calendar
Release of full year results: 28 August 2012
Taxation statements dispatched to securityholders: 31 August 2012
Full year distribution payment: 28 September 2012
Annual General Meeting: 30 November 2012
Annual General Meeting
The FKP Annual General Meeting will be held at 10am Friday 30 November 2012 at the Brisbane Convention and Exhibition Centre, Corner Merivale and Glenelg Streets, South Bank, Brisbane.
Architect-designed Aveo Mingarra is within 40 minutes of the Melbourne CBD and is close to key conveniences like Croydon, Arndale and Eastland shopping centres, golf clubs, hospitals and public transport.

CONTENTS
About FKP p 02
Executive Chairman’s Report p 04
Board of Directors p 06
Senior Management Team p 07
Operational Review p 08
Our Responsibility p 12
Financial Overview p 14
Financial Report p 15

Retirement LivingOUR BUSINESS
So much under one roof
Our operations span a diverse range of retirement, property development and investment activities throughout Australia.
Retirement Living
Residential Communities
Commercial and Industrial
FKP is one of Australia’s leading retirement, property development and diversified investment groups. We have over 30 years’ experience in providing superior products and services in the retirement, residential and commercial property sectors.
With over $3.7 billion of assets under management across a diversified property portfolio, our innovative responses to market trends are guided by an unparalleled range and depth of experience in site selection, design and project management.
Founded on geographic and product diversification, our core portfolio is well positioned to deliver solid, consistent results. We are a market leader in retirement and continue to deliver our residential development pipeline of approximately 6,700 lots and apartments across the country.
Under the Aveo brand we are a leading owner and operator of retirement villages with 75 villages in prime locations around Australia under FKP management.
Our scale in the retirement sector enables us to offer senior Australians unrivalled access to the full range of lifestyle choices and provide the highest quality of service to over 12,000 residents.
As Australia’s population continues to age, our retirement portfolio will continue to service a larger proportion of Australians and will be a major contributor to the Group’s recurring income streams.
2 | FKP ANNUAL REPORT 2012
Hobart
Cairns
Sydney
Melbourne
Adelaide
Brisbane
Sunshine Coast
Gold Coast
Murwillumbah
Mackay

Commercial and IndustrialResidential Communities
Key Facts
30+ years operating history
1,500 employees nationwide
75 villages managed in prime locations
12,000 residents in our retirement communities
4,700 lots to be developed
2,000 apartments in the development pipeline
Our History
FKP has a longstanding history in the Australian property industry. Our foundations were forged in 1966 when Peter Kurts Properties established itself in Australia to consolidate the interests of the Kurts family who had been active in real estate activity since 1953, in residential property trading and land sub-division. Peter Kurts Properties became a publicly listed company in 1970.
Forrester Parker Group emerged from a venture formed in 1979 between Rodney Forrester and Philip Parker. Incorporated as Forrester Parker Group in 1987 and listed on the ASX in 1993, the company then merged with Peter Kurts Properties in 1998 forming Forrester Kurts Properties.
In 2001, Forrester Kurts Properties changed its name to FKP and expanded its activities across Australia to include residential and commercial development, retirement village ownership and management, construction and property investment and asset management.
In 2003, FKP entered the S&P/ASX 200 index, confirming our place among Australia’s top 200 listed companies. In 2004, FKP securities stapled together with FKP Funds Management and transformed into FKP Property Group.
To this day, FKP remains committed to generating long term value for securityholders through our strategic objectives of diversifying our operating activities and geographical spread, building on our integrated business model and maintaining recurring earnings above 50 per cent.
We have a well positioned and highly coveted portfolio of apartments and masterplanned communities across Australia providing a pipeline of
approximately 4,700 lots and 2,000 apartments to be developed for future growth. Our residential communities will play an increasingly important part in helping to alleviate Australia’s residential property shortage.
Our ability to select premium and strategically located sites provides a platform to create quality offerings ranging from luxury inner-city apartments to coastal masterplanned communities. The key to creating our successful residential communities is our ability to instil a shared sense of identity and belonging.
FKP has a long heritage and specialist expertise in creating integrated work spaces and facilities.
We are committed to keeping pace with the country’s changing working styles; creating working environments and communities that encourage sociability and redefine the experience that Australians have at work.
Our multifaceted portfolio is responsible for projects ranging from the creation of mixed-use commercial precincts to the refurbishment of existing buildings to industrial subdivisions.
FKP ANNUAL REPORT 2012 | 3

4 | FKP ANNUAL REPORT 2012
In FY12, FKP delivered an underlying profit after tax of $94.7 million. This result excludes abnormal, non-recurring items and was in line with revised market guidance. In response to the current difficult market environment, the Board adopted more conservative valuation assumptions and as a result impaired the Group’s retirement portfolio and selective development assets. Post these writedowns and other abnormal items, FKP reported a full year statutory loss of $350.3 million.
FKP delivered underlying earnings per stapled security after tax of 7.9 cents for the year while net tangible assets per stapled security decreased to $0.90 at 30 June 2012. The total distribution for the year was 2.8 cents per stapled security.
Improved capital position
FKP successfully raised $208 million in August 2012 through an entitlement offer which received strong support from both institutional and retail securityholders. Approximately 97 per cent of FKP’s eligible institutional stapled securityholders subscribed to take up their entitlements. The proceeds will be used to further reduce debt. The Group’s total debt is expected to drop, on a pro-forma basis, from $938 million to $738 million. This will further decrease on the settlement of the Aerial apartment development in Melbourne by approximately $120 million. As a result of the entitlement offer, NTA per stapled security reduced from $0.90 at 30 June 2012 to $0.58 on a pro-forma basis.
FKP can now move forward from a position of renewed strength and is focused on extracting the embedded value in our market leading retirement portfolio. A key initiative is to streamline our retirement platforms and potentially pursue a separation of the retirement and development businesses in order to better reflect their intrinsic values.
Throughout the year, FKP embarked on an active capital management program. In December 2011 the Group successfully refinanced $340 million of debt facilities, executed a $50 million Project Finance Facility for the Luxe apartment development in Sydney and completed a new five year $80 million facility for Forest Place Group. FKP also continued to divest non-core assets and successfully disposed of Peregian Springs Shopping Centre and Browns Plains Bulky Goods Centre in the second half of the year with proceeds used to lower our debt position.
Strategic review of the retirement business
The Board believes substantial value can be reflected in FKP’s retirement portfolio with its high-quality assets, one of the largest footprints across the country and an enviable brownfield development pipeline. Consequently, FKP undertook and completed a strategic review of its retirement portfolio during the year in order to lay out a road map to unlock the embedded value from its three distinct retirement platforms.
The outcome of this review is that FKP will aim to streamline the ownership structure and operations of the three retirement platforms, continue to explore a separation of its retirement and development businesses; and, in the medium term, continue to seek to reposition the retirement business model to meet evolving resident needs with continuum of care a prime focus.
In line with this strategy, FKP has made good progress in streamlining the ownership of the retirement assets. The Group took full control of the fund management rights of Retirement Villages Group (RVG) and subsequently successfully merged three retirement platforms in New Zealand – Metlifecare, Vision Senior Living and Private Life Care – on behalf of RVG.
“ The Board believes substantial value can be reflected in FKP’s retirement portfolio with its high-quality assets, one of the largest footprints across the country and an enviable brownfield development pipeline.”
Property assets well positioned for growth
The near term earnings environment for FKP will be constrained by weak property markets and fragile investor sentiment. However, the Board is optimistic following signs of improvement, with settlements in the retirement portfolio up 46 per cent in the second half of the year and strong demand at the mixed-use development Gasworks in Brisbane. Bank of Queensland has pre-committed to relocate its headquarters to Gasworks, taking up approximately 13,100sqm of space.
Executive Chairman’s Report
A credible result in a very challenging market
4 | FKP ANNUAL REPORT 2012

In addition, FKP transacted approximately $50 million in sales at its industrial estate Industroplex in Mackay.
These are encouraging indicators for specific market sectors which, as conditions improve, will likely flow through to other property segments.
FKP’s Retirement division continues to provide the largest profit contribution and recurring income for the Group, delivering an underlying profit of $113.1 million in FY12. Retirement operating profit was impacted by reduced management fees and a lower contribution from buyback and development activity. A total of 504 settlements were secured during the year.
The Residential division reported an underlying profit of $18.9 million for the year, a decrease of 48 per cent on the previous year, due largely to sustained weakness in the residential property market and $24.0 million of underlying profit expected from settlements at Aerial being deferred to FY13. Regardless, this was a credible result given the market conditions and the portfolio remains well positioned for a market rebound.
“ FKP’s Retirement division continues to provide the largest profit contribution and recurring income for the Group, delivering an underlying profit of $113.1 million in FY12.”
The Commercial and Industrial division recorded an underlying profit of $9.3 million for the year. The result was impacted by no major development projects being completed during the period. FKP completed the refurbishment of 465 Victoria Avenue in Chatswood in the latter part of the year and successfully executed leases over all 15 levels of the commercial office tower.
“ FKP is adopting a back-to-basics approach, simplifying its business activities and extracting greater cost efficiencies. We have adjusted our business plan to have a stronger focus on cash generation and will continue to delever and improve liquidity through non-core asset disposals while streamlining our various operating platforms.”
Outlook
FKP is adopting a back-to-basics approach, simplifying its business activities and extracting greater cost efficiencies. We have adjusted our business plan to have a stronger focus on cash generation and will continue to delever and improve liquidity through non-core asset disposals while streamlining our various operating platforms.
Recently the Group’s Managing Director and CEO Peter Brown retired from his position after leading FKP for the last ten years. Over his tenure, Peter transformed FKP from a Queensland centric property developer with an interest in retirement to a national diversified property group with one of the largest retirement portfolios in the country. On behalf of the Board, we wish him well for his future endeavours. In the interim, I will lead the Group as Executive Chairman until the search for a replacement CEO is concluded.
In an effort to further bolster the independence and experience of the Board, I would like to welcome Walter McDonald and Alan Zammit as Independent Non-Executive Directors. Finally and most importantly, I would like to thank our securityholders, for your ongoing support of FKP in a very difficult environment.
FKP ANNUAL REPORT 2012 | 5
Seng Huang Lee
Executive Chairman

6 | FKP ANNUAL REPORT 2012
Seng Huang LeeExecutive Chairman
Leonard McKinnonNon-Executive Director
Jim FrayneNon-Executive Director
Walter McDonaldNon-Executive Director
Board of Directors
6 | FKP ANNUAL REPORT 2012
Mr Lee joined the Board in February 2006 and was appointed as Chairman in February 2009 and Executive Chairman in August 2012. Mr Lee was educated at the University of Sydney in Australia and has wide ranging financial services and real estate investment experience in the Asian region. He has previously served, in various capacities, on the board of directors of Lippo Limited and Lippo China Resources Limited in Hong Kong, Auric Pacific Group Limited in Singapore and the Export and Industry Bank, Inc. in the Philippines. He is currently the Executive Chairman of Mulpha International Berhad (a Malaysian listed conglomerate with operations in Southeast Asia, Australia and China) as well as Mulpha Australia Limited and is a Non-Executive Director of Mudajaya Group Berhad, a company listed on the Bursa Malaysia Securities Berhad.
Mr McKinnon joined the Board in May 2005. He has extensive experience in property and financing gained through more than 25 years in investment banking. Mr McKinnon was responsible for establishing the property finance business of Bankers Trust Australia Limited in 1993. In 1999, Mr McKinnon set up his own specialist financial group, Winchester Property Services Limited. He was also previously a Director of Gresham Property Funds Management Limited (April 2000 to October 2009) which manages mezzanine loan funds for property development and investment. He continues to be a member of the Investment Committees for these institutionally supported funds. In addition Mr McKinnon was appointed as Chairman of the Investment Committee of property finance firm Ashe Morgan Winthrop. Mr McKinnon was appointed Chairman of the Audit Committee effective 13 December 2010. Mr McKinnon was appointed a member of the Remuneration Committee effective 8 June 2011 and was appointed Chairman effective 22 February 2012.
Mr Frayne joined the Board in July 2008. He has over 40 years’ experience in chartered accountancy in audit and corporate services fields. Mr Frayne was appointed as a partner of PKF Chartered Accountants and Business Advisers in 1983 and from that time headed up the Audit and Assurance Division of PKF Brisbane until his retirement in June 2006. He is currently a Director of Black & White Holdings Limited (1 July 2008 to date). Mr Frayne was appointed as a member of the Audit Committee effective 13 December 2010 and was appointed as a member of the Remuneration Committee effective 22 February 2012.
Mr McDonald joined the Board in August 2012. He is recognised as one of Australia’s leading legal practitioners with many years’ experience in advising major government and corporate clients. Currently, Mr McDonald is a partner in the Corporate Division at the national law firm Piper Alderman. Prior to joining Piper Alderman, Mr McDonald was a senior partner at Clayton Utz where he had previously held a number of senior positions including the national positions of Departmental Managing Partner, Corporate, and Chairman, Energy and Resources Group. Mr McDonald has gained experience across a wide range of areas of law including corporate, property, government, M&A, energy and resources, corporate finance, intellectual property, workout/recovery, major projects and TMT.
Board of Directors and Senior Management Team

Alan Zammit AM
Non-Executive Director
Winson ChowAlternate Director
Senior Management Team
FKP ANNUAL REPORT 2012 | 7
Mr Zammit joined the Board in August 2012. Mr Zammit has over 40 years’ experience in urban, regional and community development and has been providing corporate and property advisory services since stepping down as a property developer in 2006. Mr Zammit was formerly a director of Rouse Hill Infrastructure Pty Limited and an executive director of land development, home building and real estate agency companies in the former Hooker (now Australand) group. More recently Mr Zammit was responsible for the planning, development, marketing and sales of Norwest Business Park in Sydney, Australia. Mr Zammit continues to chair Norwest Association Limited and acts as a director of Caprock Limited, Affordable Community Housing Limited and Wentwest Limited. Mr Zammit is also a member of the national board of Edmund Rice Education Australia, chairs the University of Western Sydney Board of Trustees Audit and Risk Management Committee and serves as an independent member of the Audit and Risk Committees for the NSW Land and Housing Corporation, Teachers Housing Authority and the NSW Department of Planning and Infrastructure.
Mr Chow was appointed as Alternate Director to Seng Huang Lee in November 2011. Mr Chow was also appointed Chief Operational Officer of Mulpha Australia Limited in October 2011, and was previously Managing Director at China Resources group. Mr Chow holds degrees in Civil and Environmental Engineering and Environmental Planning and has extensive experience in property development, management and construction.
David Hunt Chief Financial Officer
Mr Hunt was appointed as Chief Financial Officer in April 2010, having previously been the Chief Financial Officer of ING Real Estate Investment Management. Mr Hunt has over 20 years’ experience in property and financial services, including earlier roles as Group General Manager Finance at Stockland, Group Financial Controller and Finance Manager at Zurich Financial Services Australia Limited and Group Finance Manager at Legal & General Australia Limited. Mr Hunt is Director of Forest Place Group (ASX: FPG) and Port Bouvard Limited (ASX: PBD).
Geoff Grady Chief Operating Officer
Mr Grady joined FKP as Chief Operating Officer in March 2009, having previously been the Chief Executive Officer of Mulpha Sanctuary Cove since 2002. Mr Grady holds degrees in Commerce and Law with honours from the University of Queensland. He is a chartered accountant and a solicitor of the Supreme Court of Queensland. Mr Grady is a Director of Metlifecare Limited (NZX: MET) and Chief Executive Officer of Retirement Villages Group.
Mark Jewell Director of Development
Mr Jewell joined FKP in July 2011 and was appointed Director of Development in August 2012. Mr Jewell is a senior property executive with over 20 years’ experience in the Australian development industry. Mr Jewell spent a number of years as an Executive Director of Sunland Group Limited and prior to joining the Consolidated Group was the Chief Operating Officer of Sunland Group, Australian operations. Prior to that, he had executive roles as General Manager of PRD Realty and as Development Director of Thakral Holdings Group. Mr Jewell is a Director of Port Bouvard Limited (ASX: PBD).

8 | FKP ANNUAL REPORT 2012
In a persistently difficult trading environment, the retirement business delivered flat sales volumes during the year and reduced development and refurbishment activity. In addition, market sentiment impacted sales volumes across FKP’s residential development projects. However, margins were largely maintained due to FKP maintaining a premium product offering.
Despite the difficult market conditions, both FKP’s Residential Communities and Retirement divisions delivered a credible profit result – testament to the underlying quality of FKP’s residential development assets and the strength of FKP’s market leading retirement portfolio.
To ensure that the growth potential of the development property portfolio remains intact, FKP is selectively rolling out established projects and building on the momentum of its current pipeline, particularly at The Rochedale Estates, Saltwater Coast and Gasworks.
Retirement Living
FKP retains a market leading position in the Australian retirement sector. With a high quality portfolio of retirement assets in strategically located positions with significant redevelopment potential, the Retirement division is a key platform for the future growth of FKP.
FKP’s Retirement division continues to provide the largest profit and recurring income contribution to the Group. This year, the Retirement division delivered an underlying profit of $113.1 million, a decrease of approximately 10 per cent on the previous year. This comprised an operating profit of $33.2 million and underlying retirement revaluation contribution of $79.9 million.
Although sales volumes were largely flat on FY11, the operating profit was impacted by the general slowdown in the Australian residential sector reflected by reduced management fees and a lower contribution from buyback and development activity. Despite relatively low sales volumes with a total of 504 settlements secured during the year, 299 settlements were recorded in the second half, an increase of 46 per cent over the first half of the year and an increase of 17 per cent over the previous corresponding period in FY11.
A key strategic goal for FKP is to continue to streamline its three retirement platforms. The Group made significant progress on this front this year. FKP took full control of the fund management rights of Retirement Villages Group (RVG) and subsequently successfully merged three retirement platforms in New Zealand – Metlifecare, Vision Senior Living and Private Life Care – on behalf of RVG. The six month transition of the RVG management platform is now complete and RVG is stabilised and fully embedded in the FKP group.
A strategic review of FKP’s retirement platforms was undertaken and completed this year. As a consequence of this review, FKP will aim to further streamline the ownership of the retirement platforms and will continue to explore a demerger or other separation of the Retirement division from the Development division.
Residential Communities
The residential property market in Australia again endured soft conditions; however FKP’s Residential Communities division delivered a credible result in a difficult market. While sales volumes were lower across the portfolio, the number of deposits on hand increased due to the higher number of projects in pre-sales stage.
Operational Review
Solid performance in difficult conditions from FKP’s high quality property portfolio
With a softening economy and a subdued residential real estate market, FKP faced strong headwinds over the past year.
8 | FKP ANNUAL REPORT 2012
The Milton is Brisbane’s first major integrated transit oriented development and will comprise 298 apartments along with a range of resort style facilities, including a roof top sky deck and podium deck with pools, gymnasium, residents’ lounge, landscaped barbeque retreats and sauna.
ARTIST IMPRESSION

The Residential Communities division reported an underlying profit of $18.9 million for the year. This represented a decrease of 48 per cent on the previous year and was largely due to the deferral of settlements at the Aerial apartment development in Melbourne, coupled with sustained weakness in the residential property market.
FKP expects Aerial to settle in FY13 which will contribute approximately $24.0 million of underlying profit.
In Victoria, where the property market deterioration was particularly pronounced, FKP was able to hold margins at its flagship masterplanned community Saltwater Coast in Point Cook. As expected, sales volumes at Saltwater Coast normalised from the previous years’ exceptional levels with approximately 140 settlements recorded over FY12. The Group remains confident that the superior product offering at Saltwater Coast positions it well for a market upturn.
In Queensland, FKP’s residential focus is on The Milton in Brisbane which continues to achieve strong sales volumes with over 55 per cent of the 298 apartment development sold to date. Early works are scheduled to start on site in early 2013 with full construction expected to begin soon after.
The Hudson, the first stage of the Albion Mill urban renewal project, was launched in late 2011. Just 4.5 kilometres from Brisbane’s city centre atop Albion Hill in Brisbane’s inner north, The Hudson will feature 134 apartments upon completion and will form the cornerstone for what is set to become a $330 million landmark lifestyle precinct. Approximately 20 per cent of The Hudson is pre-sold.
The Rochedale Estates, one of Brisbane’s newest and largest masterplanned communities located 12 kilometres from Brisbane’s CBD, recorded 105 settlements for the year. The Rochedale Estates builders’ display village ‘Display World’, which is set to become Queensland’s largest, opened in May this year and has significantly increased foot traffic to the estate.
The Sunshine Coast market continues to remain challenging, particularly at the upper end, impacting sales at Peregian Springs and Ridges at Peregian Springs. FKP is targeting approximately 80 to 100 lot sales across Peregian Springs and Ridges in FY13.
In New South Wales, construction continues to progress well at the Luxe apartment development in Sydney and is expected to be completed in FY14. The project is approximately 75 per cent pre-sold.
Mulgoa Rise, a masterplanned community in western Sydney, recorded its first settlements during the year. Upon completion Mulgoa Rise will comprise 600 lots set over 57 hectares situated on a ridge at the foothills of the Blue Mountains.
Commercial and Industrial
FKP’s Commercial and Industrial division contributed an underlying profit of $9.3 million in FY12. The division’s performance was impacted by no major development projects being completed during the period.
FKP ANNUAL REPORT 2012 | 9
Just five kilometres from the Brisbane CBD, Aveo Clayfield is set high on the former St Columbans College site in Albion and offers residents panoramic views and easy access to all the activities and amenities of a premier neighbourhood.

FKP completed the refurbishment of 465 Victoria Avenue in Chatswood and successfully leased all 15 levels of the office tower. Consistent with FKP’s strategy of focusing on capital efficiency and maximising asset value, this property has now been taken to the market.
In Queensland, FKP has secured anchor tenants at Gasometer 1, a retail and commercial building and Gasometer 2, a 13 level commercial tower at Gasworks in Brisbane. Construction is underway at Gasometer 1 which encompasses 8,000sqm of retail space and 9,000sqm of A-grade office space over four levels. Over 80 per cent of the retail space has been pre-committed. Bank of Queensland has pre-committed to 13,100sqm of Gasometer 2, in what will become stage 3 of Gasworks’ urban renewal development.
Further north, progress continues at Industroplex in Mackay as FKP capitalises on one of the fastest growing regional industrial areas in Australia with approximately $50 million of sales transacted in the latter part of FY12.
The capital recycling program continued this year with the successful disposal of 8 Spring Street in Sydney in September 2011 and the sales of Peregian Springs Shopping Centre for over $20 million and Browns Plains Bulky Goods Centre for approximately $24 million achieved during the second half of the financial year.
Outlook
FKP has adjusted its business plan in response to the challenging market environment. The Group will focus on continuing to delever and improve its liquidity through the continued asset sales program, further implementing a
stringent capital management policy and maintaining a focus on cost control measures throughout the business.
In addition, a key strategy for the Group is to generate cash flow from the Retirement division through a number of initiatives including increasing the turnover of units. To increase turnover and lower balance sheet stock levels the Group has reduced unit list prices by an average of 6 per cent across the portfolio at the start of FY13. In line with this focus on cash flow generation, FKP will also seek to reduce buyback activity of retirement units and focus on undertaking refurbishments on units still owned by outgoing residents.
FKP believes there is substantial untapped value in its retirement portfolio with the potential to develop additional units on available land, and the opportunity to redevelop a number of villages and increase site density over the medium to long term. However, any development activity is dependent on the selling environment and availability of capital.
Despite a tough trading environment FKP will seek to build on the sales momentum achieved in the second half of FY12 and is targeting a stronger performance from the Retirement division in FY13.
The Group will continue to extract value from its embedded residential, commercial and industrial development pipeline and selectively roll out established projects, where it makes economic sense.
FKP remains well positioned to benefit from improved property and global investment market conditions.
Operational Review
10 | FKP ANNUAL REPORT 2012
Launched in May 2012 at our 1,000 home masterplanned community The Rochedale Estates, Display World is set to become Queensland’s largest display of residential excellence, with 48 never-before-seen homes from Australia’s leading builders and designers.

Bank of Queensland has pre-committed to 13,100sqm of a 13 level commercial building known as Gasometer 2, in what will be the third stage of our $1.1 billion Gasworks urban renewal development in Newstead, Brisbane.
FKP ANNUAL REPORT 2012 | 11
ARTIST IMPRESSION

Community connectivity
FKP advocates and encourages growth of social capital within our communities. Through careful planning and implementation of community hubs across our key land developments, our masterplanned communities offer residents a unique lifestyle, increased civic engagement and an attractive investment in the Australian property market.
Over the past year we delivered three major community hubs which offer an exceptional range of facilities for residents. Earlier this year our Ridges at Peregian Springs masterplanned community on Queensland’s Sunshine Coast welcomed a $4.5 million Rec Club to its neighbourhood. Complete with an eight lane lap pool, kids’ pool, two tennis courts, barbeques, exercise grounds, a gymnasium, café and meeting rooms, the Rec Club enhances the social environment for residents by providing a convenient, accessible and exciting communal space.
At Saltwater Coast in Point Cook, Victoria, the development of a $6 million residents only Lifestyle Centre added a valuable dimension to the premium lifestyle-focused community. Winner of the 2012 Sir Osborn McCutcheon Award for demonstrating excellence in design, the residents only centre is economically maintained through annual body corporate memberships and includes a comprehensive range of facilities, from three swimming pools to a 100 seat function room. The quality of amenity available at the Lifestyle Centre ensures its place as the recreational, sporting and social focal point within the Saltwater Coast community.
This year we also completed a resident lifestyle centre at our masterplanned community The Rochedale Estates in Brisbane. Following the success of similar facilities at Ridges and Saltwater Coast, The Rochedale Estates’ $5 million Lifestyle Centre complements the existing recreational options within
the estate, such as the vast areas of parkland, walkways and cycle tracks. In response to the growing community, more facilities are anticipated to be developed, including a childcare centre, café and adjoining convenience centre.
Recreational and social facilities also form community hubs across our extensive portfolio of 75 retirement villages across Australia. Our villages offer self-contained leisure centres with an emphasis on providing high grade amenities to enrich the lives of over 12,000 senior Australians. From bowling greens to libraries to swimming pools, there is a diverse array of facilities at each village which cater to even the most active of retirees. For residents with less mobility our communities offer a number of activities including bingo, cinema and arts and crafts.
Strength in sustainability
FKP’s holistic approach to projects ensures that we strategically assess the impact our activities have on the natural environment. As a result, we actively pursue sustainable long-term solutions and commit to raising the benchmark in environmental sustainability so that our developments align with evolving community standards.
In May 2012, we completed an extensive $15 million green refurbishment of 465 Victoria Avenue in Chatswood, upgrading our 15 level office tower to achieve a commitment agreement for a 5-star NABERS rating and a 4-star Green Star rating.
In collaboration with Krikis Tayler Architects and Graypuksand, we implemented a project specific Environmental Management Plan for the refurbishment, ensuring existing materials in the tower were recycled. At least 90 per cent of the original façade was reused and 80 per cent of all mass was recycled for reuse.
Our Responsibility
Building a sustainable future for our communities
As part of our commitment to be a responsible corporate citizen, FKP is actively engaged with the communities in which we operate on social and environmental levels. This year, we delivered a number of high-quality projects that have enriched each community and added market value to these investments.
12 | FKP ANNUAL REPORT 2012
The centrepiece of Saltwater Coast is the architecturally designed Lifestyle Centre. Available only for the use of residents and their guests, the centre features a broad range of the latest sporting and recreation facilities.
124 hectares of significant conservation area has been established within and around Peregian Springs and its adjoining Ridges precinct, our flagship masterplanned residential communities in Queensland, in an effort to minimise our footprint on the environment and protect the local flora and fauna.

FKP ANNUAL REPORT 2012 | 13
A range of Ecologically Sustainable Development features were also incorporated, including energy efficient lighting designs to help maximise natural sunlight, sophisticated water and energy metering, rainwater tanks providing 20,000 litres of supply and a modified air conditioning and ventilation system.
465 Victoria Avenue’s new design offers a significant reduction in predicted greenhouse gas emissions, bringing it below the conditional requirement and ensuring it remains below 110 kilograms of carbon dioxide per square metre per annum.
An overhaul of the building’s street frontage, existing ground floor podium and mezzanine area also dramatically reduces the tower’s overall energy and water consumption, while the new three level basement car park provides 235 car spaces along with cyclist facilities and 50 bike spaces to encourage bike usage.
FKP’s commitment to environmental sustainability is further demonstrated at Saltwater Coast. As part of the residential masterplan we created a wetland park within Saltwater Coast to complement the surrounding 52 hectares of open space, parklands and wetlands, including the internationally significant Cheetham Wetlands.
Protected under international treaty, the Cheetham Wetlands attracts rare, migrating birds to the Point Cook area. The wetlands provide the perfect environment for these shorebirds, which travel to Point Cook from all over the world each year.
Our man-made wetland park is also landscaped with an emerging mosaic of sedges, reeds and ground covers which draw inspiration from the local environment. The indigenous plantings, many of which are unique to the area, contribute
a strong local character and identity to our Saltwater Coast community.
In an effort to preserve the health and integrity of Cheetham Wetlands, our Saltwater Coast wetland park is also designed to protect the area by holding, treating and purifying the urban stormwater from surrounding areas in a balanced and functional natural system.
Further north on Queensland’s Sunshine Coast, our masterplanned Peregian Springs residential community and its adjacent Ridges precinct comprises 124 hectares of conservation area which provides a healthy ecosystem for a number of vulnerable and endangered flora and fauna.
In partnership with the Environmental Protection Agency, University of the Sunshine Coast, Greening Australia and other community groups, FKP is actively participating in a five year recovery program to protect the endangered Emu Mountain Sheoak population from further decline and resuscitate the species long term. With a patchy distribution of 14,000 across the Sunshine Coast area, the recovery program has already successfully increased Sheoak numbers by 1,300.
Steady progress has also been made within the conservation area to promote Acid frog population growth via a water quality treatment system. Vegetated swales located immediately upstream from the conservation area collect stormwater and runoff and direct it to the lake system for treatment, before releasing approximately 90 per cent of purified water back into the conservation area.
Across our portfolio of developments, FKP strives to achieve a harmonious fit between our business operations, the community in which we operate and the environment. With a forward-thinking approach to each project we undertake, FKP aims to provide sustainable solutions that balance the needs of our stakeholders with the needs of the environment.
FKP recognises the importance of well appointed community hubs across our 75 retirement villages in Australia and as such provides residents in our villages with a number of active social programs and a vast range of excellent recreational facilities.
465 Victoria Avenue is a two-time category finalist in the 2012 NSW UDIA Award for Excellence for best Retail/Commercial Development and best Sustainable Development.
FKP ANNUAL REPORT 2012 | 13

14 | FKP ANNUAL REPORT 2012
Financial Overviewas at 30 June 2012
EBITDA divisional contribution before corporate overhead allocation
1. Pro-forma NTA per stapled security post Entitlement Offer announced on 28 August 2012 is $0.58.2. Pro-forma gearing post Entitlement Offer announced on 28 August 2012 is 32.1%.3. Underlying profit for the Consolidated Group was adopted for the years ended 30 June 2010, 30 June 2011 and 30 June 2012 in accordance with AICD/Finsia principles of recording
underlying profit and has not been audited. Underlying profit for the years ended 30 June 2008 and 30 June 2009 was not in accordance with AICD/Finsia principles of recording underlying profit and has not been audited.
• Retirement $113.1m
• Residential Communities $18.9m
• Commercial and Industrial $9.3m
• Funds Management and Investments $13.9m
73%
12%
6%
9%
Net underlying profit after tax3 $m
0
20
40
60
80
100
120
140
160
20
12
20
11
20
10
20
09
20
08
15
0
10
9
12
1
95
77
$94.7m $0.90Underlying profit after tax of $94.7 million, in line with guidance range of $91.9 to $104.3 million
Net Tangible Assets (NTA) per stapled security at $0.901
7.9c 39.1%Underlying earnings per security of 7.9 cents per stapled security
Gearing of 39.1 per cent at year end2
74% $140.3m74 per cent of income was recurring EBITDA of $140.3 million
2.8c $(350.3)mDistribution of 2.8 cents per stapled security Statutory loss after tax of $350.3 million

FKP ANNUAL REPORT 2012 | 15
ContentsDirectors’ Report 16
Auditor’s Independence Declaration 29
Remuneration Report 30
Corporate Governance Statement 42
Financial Statements 49
Statements of Comprehensive Income 49
Balance Sheets 50
Statements of Changes in Equity 51
Cash Flow Statements 53
Notes to the Financial Statements 54
Directors’ Declaration 122
Independent Auditor’s Report 123
Securityholders 125
Securityholder Information 126
5 Year Financial Summary 127
Directory 128
FKP Property Group(Consisting of consolidated financial reports of FKP Limited ABN 28 010 729 950 and its controlled entities and FKP Property Trust ARSN 099 648 754 and its controlled entities)
Notes to Financial Statements1. Statement of Significant Accounting Policies 54
2. Revenue 68
3. Expenses 68
4. Taxation 69
5. Earnings Per Security 71
6. Cash and Cash Equivalents 71
7. Trade and Other Receivables 72
8. Other Financial Assets 75
9. Inventories 75
10. Investment Properties 76
11. Equity-accounted Investments 78
12. Other Assets 81
13. Assets Classified as Held for Sale 81
14. Property, Plant and Equipment 81
15. Intangible Assets 83
16. Trade and Other Payables 84
17. Interest Bearing Loans and Borrowings 85
18. Provisions 88
19. Other Financial Liabilities 88
20. Contributed Equity 89
21. Reserves and Retained Profits/(Losses) 90
22. Dividends and Distributions 91
23. Non-Controlling Interests 92
24. Notes to the Cash Flow Statements 92
25. Segment Information 94
26. Commitments 97
27. Contingent Liabilities 97
28. Finance Costs Capitalised 97
29. Key Management Personnel Disclosures 98
30. Share-Based Payments 101
31. Related Party Transactions 104
32. Auditor’s Remuneration 107
33. Controlled Entities 108
34. Parent Entity 109
35. Financial Risk Management Objectives 109
36. Derivative Financial Instruments 116
37. Deed of Cross Guarantee 117
38. Business Combinations and Disposals 120
39. Events After Balance Sheet Date 121
FKP 2012 Financial Report

16 | FKP ANNUAL REPORT 2012
Your Directors present their report on the Consolidated Group consisting of FKP Limited (‘Parent Entity’) and its controlled entities and FKP Property Trust (‘Property Trust’) and its controlled entities (‘Consolidated Property Trust’) for the year ended 30 June 2012 and the Auditor’s Report thereon.
DIRECTORSThe Directors of FKP Limited and FKP Funds Management Limited (‘Responsible Entity’), as responsible entity of FKP Property Trust, during the financial year and until the date of this report are as follows:
Director Position Period of directorship
SH Lee Non-Executive Chairman Full year
P R Brown1 Managing Director and Chief Executive Officer Full year
L R McKinnon Non-Executive Director Full year
J E F Frayne Non-Executive Director Full year
G C Dyer Non-Executive Director Full year – resigned 30 July 2012
M Jewell2 Executive Director Partial year – appointed 20 July 2011
W Chow Non-Executive Alternate Director for SH Lee Partial year – appointed 25 November 2011
P Parker Non-Executive Director Partial year – resigned 21 February 2012
1. Mr Brown announced his decision to retire as Managing Director and Chief Executive Officer of the Consolidated Group on 20 August 2012. Mr Brown will continue as
Managing Director and Chief Executive Officer until no later than February 2013.
2. Mr Jewell retired from the Board of Directors effective 20 August 2012, but will continue as an employee of the Consolidated Group as Director of Development.
Additional Directors – appointment effective 29 August 2012
W L McDonald and A J Zammit have agreed to be appointed as additional Non-Executive Directors effective 29 August 2012.
Information on DirectorsSH Lee Non-Executive Chairman (Age 38)
Mr Lee joined the Board in February 2006 and was appointed as Chairman on 12 February 2009. Mr. Lee was educated at the University of Sydney in Australia and has wide ranging financial services and real estate investment experience in the Asian region. He has previously served, in various capacities, on the board of directors of Lippo Limited and Lippo China Resources Limited in Hong Kong, Auric Pacific Group Limited in Singapore, the Export and Industry Bank, Inc. in the Philippines as well as East West Resources PLC (formerly known as Ambrian Capital PLC), a company listed on the Alternative Investment Market of the London Stock Exchange. He is currently the Executive Chairman of Mulpha International Berhad (a Malaysian listed conglomerate with operations in Southeast Asia, Australia and China) as well as Mulpha Australia Limited and is a Non-Executive Director of Mudajaya Group Berhad, a company listed on the Bursa Malaysia Securities Berhad. Mr Lee will take on the role of Executive Chairman until a replacement for Mr Brown has been found (refer below P R Brown).
P R Brown LLB (Hons) BCom Managing Director and Chief Executive Officer (Age 46)
Mr Brown joined the Board as Managing Director in February 2003 and announced his retirement as Managing Director and Chief Executive Officer on 20 August 2012, effective no later than February 2013. He has in excess of 20 years’ experience in property development having held senior executive positions in national ASX listed companies including Thakral Holdings Group Limited, Walker Corporation Limited and Australand Property Group. Mr Brown is a Director of Metlifecare Limited (25 November 2005 to date), a company listed on the New Zealand Stock Exchange and was a Director of Port Bouvard Limited (23 July 2010 to 8 August 2012).
L R McKinnon BA LLB MCom Non-Executive Director (Age 59)
Mr McKinnon joined the Board in May 2005. He has extensive experience in property and financing gained through more than 25 years in investment banking. Mr McKinnon was responsible for establishing the property finance business of Bankers Trust Australia Limited in 1993. In 1999, Mr McKinnon set up his own specialist financial group, Winchester Property Services Limited. He was also previously a Director of Gresham Property Funds Management Limited (April 2000 to October 2009) which manages mezzanine loan funds for property development and investment. He continues to be a member of the Investment Committees for these institutionally supported funds. In addition Mr McKinnon was appointed as Chairman of the Investment Committee of property finance firm Ashe Morgan Winthrop. Mr McKinnon was appointed Chairman of the Audit Committee effective 13 December 2010 and was appointed a member of the Remuneration Committee effective 8 June 2011.
Directors’ Report

J E F Frayne BCom FCA GAICD Non-Executive Director (Age 65)
Mr Frayne joined the Board in July 2008. He has over 40 years’ experience in chartered accountancy in audit and corporate services fields. Mr Frayne was appointed as a partner of PKF Chartered Accountants and Business Advisers in 1983 and from that time headed up the Audit and Assurance Division of PKF Brisbane until his retirement in June 2006. He is currently a Director of Black & White Holdings Limited (1 July 2008 to date). Mr Frayne was appointed a member of the Audit Committee effective 13 December 2010.
G C Dyer BEc LLB ACA Non-Executive Director (Age 53)
Mr Dyer joined the Board as a Director in March 2009 and was a Non-Executive Director until his resignation on 30 July 2012. He holds degrees in Economics and Law and qualified as a Chartered Accountant while working for KPMG. He has broad commercial experience in a range of industries, including media, advertising, defence, technology and property and has held management and corporate director positions in Australia, New Zealand and the USA. Mr Dyer was a Director and Chief Financial Officer of Mulpha Australia Limited. Mr Dyer was appointed a member of the Audit Committee effective 8 June 2011 until his resignation on 30 July 2012. He was previously Mr Lee’s Alternate.
M Jewell BCom Dip Acc CA(SA) Executive Director (Age 57)
Mr Jewell was appointed as an Executive Director to the Board effective 20 July 2011 and retired from the Board effective 20 August 2012. Mr Jewell will continue on with the Consolidated Group as Director of Development. Over his career, he has had extensive experience in the Australian property industry, having held a number of senior executive management positions. Mr Jewell spent a number of years as an Executive Director of Sunland Group Limited and prior to joining the Consolidated Group was the Chief Operating Officer of Sunland Group, Australian operations.
W Chow Non-Executive Alternate Director (Age 49)
Mr Chow was appointed as Alternate Director for Mr Lee in November 2011. Mr Chow was also appointed Chief Operational Officer of Mulpha Australia Limited in October 2011 and was previously Managing Director at China Resources Group. Mr Chow holds degrees in Civil and Environmental Engineering and Environmental Planning and has extensive experience in property development, management and construction.
P Parker Retired Non-Executive Director (Age 66)
Mr Parker joined the Board in July 1987. He was a Non-Executive Director of FKP Limited and Chairman of the Remuneration Committee from the beginning of the financial year until his resignation on 21 February 2012. Mr Parker was a founding Director of FKP Limited and has over 35 years’ experience as a real estate agent and property developer. Mr Parker continues to be a Director of Forest Place Group Limited since joining the Board in April 2004. Mr Parker is a registered real estate agent having operated real estate businesses in Darwin and on the Sunshine Coast, and spent seven years in Brisbane and the Northern Territory in a marketing capacity for one of Queensland’s largest land developers. In 1975, Mr Parker relocated to the Sunshine Coast and subsequently established his own real estate business expanding into property management, body corporate administration and the sale and leasing of commercial buildings.
COMPANY SECRETARYM B Shannon BA LLB (Hons)
Mr Shannon was appointed to the position of Company Secretary on 29 June 2011. He holds a Bachelor of Arts and a Bachelor of Laws (Hons) from the University of Queensland and is currently Company Secretary of Forest Place Group Limited. Mr Shannon is a Solicitor of the Supreme Court of Queensland.
FKP ANNUAL REPORT 2012 17

18 FKP ANNUAL REPORT 2012
Directors’ Report continued
DIRECTORS’ MEETINGSThe number of meetings of Directors (including meetings of committees of Directors) held during the year and the number of meetings attended by each director was as follows:
Directors’ Audit Remuneration Meetings Committee Meetings Committee Meetings
Held1 Attended2 Held1 Attended2 Held1 Attended2
SH Lee 7 7 – – 2 2
P R Brown 7 7 – – – –
L R McKinnon 7 7 5 5 2 2
J E F Frayne 7 7 5 5 – –
G C Dyer3 7 7 5 5 – –
M Jewell4 7 6 – – – –
P Parker5 5 4 – – 2 2
1. Reflects the number of meetings held in the time the Director held office during the year.
2. Reflects the number of meetings attended by the Director or his alternate.
3. Mr Dyer resigned as a Director effective 30 July 2012.
4. Mr Jewell resigned as a Director on the Board effective 20 August 2012, but will continue as an employee of the Consolidated Group as Director of Development.
5. Mr Parker resigned as a Director effective 21 February 2012.
All Directors were eligible to attend all meetings held.
Committee membership
As at the date of this report, the Consolidated Group has an Audit Committee and a Remuneration Committee.
Members acting on the Committees of the Board during the year were:
Audit Remuneration
L R McKinnon (Chairman) L R McKinnon (Chairman)2
J E F Frayne SH Lee
G C Dyer1 J E F Frayne3
P Parker (Chairman)4
1. Mr Dyer resigned as a member of the Audit Committee on 30 July 2012.
2. Mr McKinnon was appointed Chairman of the Remuneration Committee effective 22 February 2012.
3. Mr Frayne was appointed as a member of the Remuneration Committee effective 22 February 2012.
4. Mr Parker resigned as Chairman of the Remuneration Committee effective 21 February 2012, in line with his resignation from the Board of Directors on 21 February 2012.
PRINCIPAL ACTIVITIESThe principal activities of the Consolidated Group during the course of the financial year were:
— development for resale of land and residential, retail, commercial and industrial property;
— investment in, and development and management of, retirement villages;
— investment in, and management of, income producing retail, commercial and industrial property;
— commercial, industrial and residential building and construction for the Consolidated Group; and
— funds and asset management.
There have been no significant changes in the nature of these activities during the year.
STATE OF AFFAIRSThere have been no material changes in the state of the Consolidated Group’s affairs since the date of the last Report, other than as disclosed in this report and the accompanying financial statements.

FKP ANNUAL REPORT 2012 19
REVIEW AND RESULTS OF OPERATIONSKey financial headlines of the Consolidated Group’s 30 June 2012 results are as follows:
— statutory profit/loss after tax decreased 526% to a loss of $350.3m;
— underlying profit after tax1 of $94.7m, down 22%;
— full year distributions of 2.8 cents per stapled security, down 7%;
— net tangible assets per stapled security decreased to $0.90; and
— earnings per stapled security on underlying profit after tax decreased 23% to 7.9 cents.
1. Underlying profit reflects statutory profit as adjusted to reflect the Directors’ assessment of the result for the ongoing business activities of the Consolidated Group, in accordance
with AICD/Finsia principles of recording underlying profit.
Financial results
The Consolidated Group’s statutory loss after tax for the year ended 30 June 2012 was $350.3m. A reconciliation of the Consolidated Group’s statutory loss after tax to the statement of comprehensive income is detailed as follows:
Consolidated Group
2012 2011 $m $m
(Loss)/profit from continuing operations after income tax (359.9) 90.1
Less: Other non-controlling interest 9.6 (7.8)
Net (loss)/profit after tax attributable to stapled securityholders of the Consolidated Group (350.3) 82.3
The following table summarises key reconciling items between the Consolidated Group’s statutory (loss)/profit and underlying profit after tax.
Consolidated Group
2012 2011 $m $m
Underlying profit after tax1 94.7 121.0
Change in fair value of derivatives (28.9) 7.2
Change in fair value of retirement investment property portfolio (224.9) (1.1)
Change in fair value of Property Trust portfolio (27.8) (12.6)
Change in fair value of investment in RVG (55.5) (14.1)
Change in fair value of investment in MFKP (36.1) –
Change in fair value of other equity accounted investments (3.1) (8.5)
Business combination related impairments (21.5) –
Development impairment – Currumbin (35.0) –
Other development impairments (4.8) (0.9)
Provision for development losses (2.5) –
Other (4.9) (8.7)
(Loss)/profit after tax attributable to stapled securityholders of the Consolidated Group (350.3) 82.3
Add: Other non-controlling interest (9.6) 7.8
(Loss)/profit from continuing operations after income tax (359.9) 90.1
1. Underlying profit after tax has not been audited.

20 FKP ANNUAL REPORT 2012
Directors’ Report continued
REVIEW AND RESULTS OF OPERATIONS CONTINUEDFinancial results continued
The Consolidated Group’s underlying profit after tax for the year ended 30 June 2012 was $94.7m, down 22% on the prior year (2011: $121.0m). In the opinion of the Directors, the Consolidated Group’s underlying profit reflects the results generated from ongoing operating activities and is calculated in accordance with AICD/Finsia principles. The non-operating adjustments outlined above are considered to be non-recurring in nature. These items are included in the Group’s consolidated statutory result but excluded from the underlying result. The Group’s distribution policy is based upon underlying profit.
The decline in underlying profit after tax reflects the difficult trading conditions that have continued throughout the year. Weak property markets and fragile investor sentiment have continued to challenge short-term earnings outcomes in the retirement and residential businesses in particular. Despite these challenges, the Consolidated Group has achieved a credible underlying result while ensuring that the portfolio remains well positioned for the long-term.
The 30 June 2012 statutory result reflects the impact of a number of significant non-operating items. These include the following:
— Change in the fair value of derivatives – reflects the impact associated with the Consolidated Group’s interest rate swaps, convertible bond and the PSA derivative;
— Change in fair value of investment property portfolio – Management undertook a review of the key valuation assumptions and has adopted an appropriate position given current market conditions. This review resulted in changes to subsequent resident turnover and long-term price assumptions. Subsequent resident turnover increased from nine to ten years, future price growth changed from 5% per annum to an average 3.5% over the first five years (range between 3% and 4%) and 4.5% from year six onwards;
— Change in fair value of Property Trust portfolio – reflects the impact of revaluing Property Trust assets to align with the latest internal valuations. These valuations reflect Management’s intention to sell remaining Property Trust assets by 30 June 2013. The fair value adjustment includes an allowance for selling costs;
— Change in fair value of RVG – relates to the impairment of RVG following the revaluation of the Australian and New Zealand retirement portfolios. This was also impacted by the accounting treatment associated with the merger of Metlifecare and Private Life Care (‘PLC’);
— Change in fair value of Mulpha FKP Pty Limited (‘MFKP’) – relates to the impairment of the Consolidated Group’s 49.9% interest in MFKP. This reflects the application of appropriate assumptions across key development projects in light of current market conditions;
— Business combination related impairments – relates to the impairment of Port Bouvard prior to consolidation and also the write down of intangibles arising from previous acquisitions; and
— Development impairment – Currumbin – relates to the revaluation of the Currumbin development to reflect current market conditions and the related uncertainty around the near term outlook for this project.
Review of operations
Key divisional contributions to the underlying performance of the Consolidated Group included:
2012 2011 Divisional Divisional underlying underlying profit profit Change Division $m $m $m
Retirement 113.1 125.9 (12.8)
Residential Communities and Apartments1 18.9 36.4 (17.5)
Commercial and Industrial 9.3 29.5 (20.2)
Funds and Investments 13.9 15.8 (1.9)
Corporate overheads (14.9) (17.3) 2.4
EBITDA2 140.3 190.3 (50.0)
Depreciation and amortisation (2.9) (3.0) 0.1
EBIT3 137.4 187.3 (49.9)
Interest and borrowings expense (12.5) (26.5) 14.0
Income tax expense (25.0) (34.1) 9.1
Non-controlling interest (5.2) (5.7) 0.5
Underlying profit after tax 94.7 121.0 (26.3)
1. Includes equity-accounted profits of development investment, Mulpha FKP Pty Ltd.
2. EBITDA represents earnings before interest, income tax, depreciation and amortisation.
3. EBIT represents earnings before interest and income tax.

FKP ANNUAL REPORT 2012 21
ResidentialBusiness overview
The Residential Communities Division has a well-positioned portfolio of apartments and master planned communities providing a strong pipeline for future growth. The key to developing our successful Residential Communities business is our ability to instil a shared sense of identity and belonging within each development. Our apartments and master planned communities are geographically diversified with a focus on the east coast of Australia. This provides a strong base from which to withstand any temporary slowdown in local residential markets.
The Consolidated Group has remained focused on laying the foundations to successfully develop the pipeline of master planned communities and apartments into solid profit contributors in the near to medium term. During the financial year, the Consolidated Group has achieved strong sales at The Milton (QLD), which is now approaching pre-sales commitments. Further, Albion Mill (QLD) was successfully launched with 20% of apartments pre-sold to 30 June 2012. The future stages of Saltwater Coast, Point Cook (VIC), Peregian Springs and Ridges (QLD) are continuing to be developed, along with the state-of-the-art community centres that accompany these premier communities.
Operational overview
While Residential Communities contribution for the year ended 30 June 2012 of $18.9m is down compared to its contribution of $36.4m in the previous year, this is largely due to the delays in completing the Aerial Apartments, Camberwell (practical completion delayed from March 2012 to October 2012). The Aerial development consists of 144 apartments and is expected to contribute $26.7m gross profit in the 2013 financial year. Residential Communities contribution was also negatively impacted by the weak residential market and in this context has delivered a credible result.
i) Master planned communities:
The Consolidated Group’s current master planned communities include The Rochedale Estates (QLD), Saltwater Coast, Point Cook (VIC), Peregian Springs and Ridges (QLD), Shearwater on the Island (VIC) and The Highlands in Maitland (NSW). For the year ended 30 June 2012, the Consolidated Group settled 380 lots across six master planned communities.
First settlements were booked at Rochedale Estates with 105 lots settled. The builder’s display village opened with 48 homes from leading builders including Adenbrook Homes, Clarendon Homes, Indigo Homes, Metricon, Plantation Homes, AusBuild Homes and Nuvo Homes and the new Community and Lifestyle centre is currently under construction. On the display villages opening weekend over 3,000 attended and since this time there has been an average of 40 visitors each week.
The Sunshine Coast market continues to remain challenging, particularly at the upper end, impacting sales at Peregian Springs and Ridges.
During the 2012 financial year, Saltwater Coast, Point Cook saw the opening of the new community centre exclusive to local residents. In addition, an englobo site was sold on the premise of being developed into a school site, further adding to the appeal of the master planned community. Similar to Rochedale, a builder’s display village is also planned at Saltwater Coast with 18 homes planned and a number of different builders contributing to the village. The expected completion date is September 2013.
Mulpha FKP (‘MFKP’), a joint venture with Mulpha Australia, has continued to deliver a consistent contribution. The master planned communities include Beaumont Rise, Bella Vista Waters, Central Park at the Lakes, Mulgoa Rise, The Greens at the Lakes and The Pointe. All developments are located in New South Wales. The key features of the contribution for the year to 30 June 2012 include the sale of land at Balmoral Road to the State Government and the first settlements at the master planned community, Mulgoa Rise, Mulgoa. These settlements achieved positive pricing outcomes in what continues to be a difficult market. This master planned community is well positioned to contribute to future volume growth. Aside from Mulgoa the majority of MFKP’s pipeline of residential developments are located at Norwest in Sydney’s north-west growth corridor.
ii) Apartments:
During the year ended 30 June 2012, the Consolidated Group has been focused on converting the existing development pipeline into profit contribution for future years. In particular, construction is nearing completion at Aerial, Camberwell (settlements due in October or November 2012 with 86% pre-sold) and has commenced at Luxe, Woolloomooloo. In addition, there has been a significant focus on launching The Hudson at Albion Mill, Albion and revitalising the sales campaigns at The Milton. The development teams have also commenced planning the residential towers at Gasworks, Newstead.

22 FKP ANNUAL REPORT 2012
REVIEW AND RESULTS OF OPERATIONS CONTINUEDReview of operations continuedResidential continuedResidential division outlook
The Consolidated Group is well placed to deliver further growth in residential sales through a strong pipeline of projects. Residential Communities projects have a consolidated inventory of 4,725 lots still to be developed with an expected remaining life of up to six years or more, including six years for Peregian Springs, and five years for Saltwater Coast, Mulgoa Rise and The Rochedale Estates. The existing pipeline of built form projects is expected to deliver in excess of 2,000 apartments over the next six years, with estimated Consolidated revenue of $1,357m.
Residential profit contribution in the 2013 financial year is expected to be underpinned by the Aerial settlements and continued sales at Rochedale, Saltwater Coast, Peregian Springs and Ridges.
Demand over the short to medium term is anticipated to remain moderate as continued affordability pressures may be coupled with further increases in the general costs of living over the year. Despite this, the medium to long-term sector fundamentals remain positive, underpinned by strong employment rates and expected long-term population growth.
Retirement Business overview
The Consolidated Group, operating under the Aveo Live Well banner is Australia’s leading provider of retirement villages and communities. With more than 20 years’ experience and 76 retirement villages (46 owned/controlled and operated and 30 managed) Australia wide, Aveo Live Well is committed to providing retirement lifestyles, facilities and services that enable retirees to live the lives they have always wanted. The Consolidated Group has interests in a fully diversified portfolio with villages and communities located in prime metropolitan locations across Australia.
The Consolidated Group’s success in operating and managing retirement villages and communities is due to providing a wide offering of services, a range of affordable units, practical amenities and caring on-site teams. As at 30 June 2012, the Consolidated Group was responsible for the management of 9,824 units across Australia, with a development pipeline of 1,207 units. The average unit prices across the FKP portfolio for Independent Living Units are $325,000 and for Serviced Apartments are $163,000.
Operational overview
The Retirement Division continues to provide the largest profit contribution and recurring income for the Consolidated Group delivering an underlying profit of $113.1m (2011: $125.9m). The Retirements underlying profit was impacted by reduced management fees and a lower contribution from buy back and development activity. For the year ended 30 June 2012, the Retirements Division secured a total of 504 settlements (in relation to owned villages). This reflects a decrease of 14 units (3%) compared to settlements of 518 units in the previous financial year. This trend has largely been driven by the close link between Retirement performance and the prevailing conditions in the broader residential market (i.e. the majority of potential new residents are reliant on selling their homes prior to entering a Retirement Village).
The Consolidated Group has concentrated efforts on recycling stock, with buyback sales up 51% compared to the prior comparative period. Management is committed to efficient capital management whilst maximising the profitability of the Group and maintaining a balanced sales mix. Further, Management has remained focused on the development pipeline to provide the foundation for future growth. For the year ended 30 June 2012, construction was completed on 35 new units across the FKP portfolio at Albany Creek, Durack and Island Point.
Retirement division outlook
Retirements is expected to generate moderate profit growth in the 2013 financial year. This is based on expectations that the broader residential market will remain stable and an increase in DMF contribution driven by a slight shift in mix away from buy back sales and towards more profitable resident-to-resident resales. There will also be continued focus on the development pipeline.
Commercial and Industrial Business overview
The Consolidated Group’s Commercial and Industrial Division has specialist expertise in creating integrated work, retail, storage and utility spaces and facilities. Management of the Consolidated Group is committed to keeping pace with Australia’s changing working styles, creating working environments and communities that encourage sociability and redefine what it means to come to work. With a presence in Queensland, New South Wales and Victoria, the Commercial and Industrial Division forms an essential part of the Consolidated Group’s continuing strategy as an integrated and diversified property group.
Directors’ Report continued

FKP ANNUAL REPORT 2012 23
The year ended 30 June 2012 was one of consolidation and planning for the Commercial and Industrial Division and setting in place a platform to build on for future years. Profit contribution of $9.3m reflects a decline of 68% from the $29.5m contribution achieved in the prior financial year. This decline is largely due to property trust asset sales (resulting in lower rental revenues) and the refurbishment of Victoria Avenue contributing to reduced rentals in the current financial year. The prior year also benefited from the final Energex profits in relation to the first stage of the Gasworks development.
Developments – operational overview and outlook
Management has had a successful year securing anchor tenants at both Gasometer One, the retail and commercial building and Gasometer Two, the 14 level commercial tower. Construction has commenced at Gasometer One which encompasses 7,831 sqm of net lettable area of retail space and 9,226 sqm of net lettable area of A-grade office accommodation over four levels. In total over 77% of the retail space has been pre-leased. The anchor tenant of Gasometer Two has taken up 12,500 sqm in what will become Stage 3 of the Gasworks Development. The Consolidated Group is planning to commence construction of this stage in the near future. There remains a further development pipeline of 113,000 sqm consisting of retail, commercial and residential space.
Momentum continues with the Mackay Turf Farm development as the Consolidated Group capitalises on one of the fastest growing regional industrial areas in Australia.
Property Trust – operational overview and outlook
The Consolidated Group remains focused on capital efficiency. Negotiations are continuing with potential buyers for the remaining Property Trust assets as Management works to maximise the value of these properties. At 30 June 2012, the Property Trust held four properties with a book value of $155.0m.
Funds Management and InvestmentsBusiness overview
The Consolidated Group’s Funds Management and Investments division is an active manager seeking to deliver genuine value creation with each asset under investment. In recent years there has been a strategy of divesting assets that have maximised their value. This strategy has continued in the current year resulting in $5m of capital being returned to the Consolidated Group from FKP Core Plus Fund and FKP Core Plus Two Fund. In the near term the Consolidated Group remains focused on continuing this strategy while retaining interests in selected key investments.
Operational overview
Funds Management and Investments recorded an operating profit contribution of $13.9m in the year to 30 June 2012. This reflects a reduction of $1.9m or 12% when compared to the contribution of $15.8m in the prior financial year. The reduction is partly due to the reduced contribution from Retirement Village Group (‘RVG’) which has been impacted by volume and margin pressures in both its Australian and New Zealand markets.
During the year ended 30 June 2012, the Consolidated Group successfully acquired the remaining 50% share of Retirement Villages Group Management (‘RVGM’) (effective from 12 January 2012). The Consolidated Group has completed the integration of RVGM and the transitional arrangements with Macquarie Bank have now ceased.
Port Bouvard continues to sell down apartments at the Oceanique development with a further 10 sales in the year ended 30 June 2012. Given that environmental approvals are now in place, first settlements at Point Grey are expected in FY13. US Senior Living has contributed $1.3m to underlying profit as the US economy continues to recover. The Group continues to review its investment into the US market.
Retirement Villages Group (‘RVG’) outlook
The year ended 30 June 2012 saw a number of changes in RVG including the merger of Metlifecare, Private Life Care, and Vision Senior Living in New Zealand (completed in July 2012). The New Zealand merger will provide Metlifecare with a strong development platform and will put the company in a strong position in the New Zealand retirement market. Management will focus on unlocking value from the integration of these organisations and realising synergies across the three businesses.
The focus in Australia will be to position the company for growth in FY13 and beyond, to deliver operational efficiencies and to improve retirement settlements compared to FY12.
Funds Management and Investments division outlook
The Funds Management Division remains focused on the strategy of returning liquidity to investors through the divestment of assets which have maximised their value in the FKP Core Plus Fund and the FKP Core Plus Fund Two. In addition Management will continue to work closely with its investments to ensure the optimal platforms are achieved. Since FKP has become sole manager of RVG, the Consolidated Group will continue to play a significant role in the fund and asset management of RVG.

24 FKP ANNUAL REPORT 2012
Directors’ Report continued
REVIEW AND RESULTS OF OPERATIONS CONTINUEDCapital managementKey achievements
— Successful refinancing of the Development Multi Option Facility (‘MOF’), which includes a $240.0m cash advance facility and a $32.0m bank guarantee facility on improved pricing. $200.0m of the Development MOF refinance is for a further three years until 31 July 2015;
— $105.0m Property Trust Facility refinanced for a further three years to 30 June 2015;
— Facility agreement executed for a $50.0m Project Finance Facility to fund the construction of the Luxe apartment development; and
— $80.0m Forest Place Group debt facility executed, maturing on 30 March 2017.
Included in current liabilities is $276.3m of interest bearing bank debt maturing in the next 12 months. This includes a $79.8m project finance facility that will be settled following the completion of Aerial and a $43.6m facility related to Port Bouvard. There is no recourse to FKP in respect of the Port Bouvard facility. Also included in current liabilities is a $122.9m bank facility which is due to expire on 30 June 2013. While the Consolidated Group’s statement of financial position classifies this banking facility as current, there has been a significant amount of work undertaken regarding the renewal or refinancing of this facility with a number of financial institutions. The Directors are confident that the renewal or refinancing of this facility will be executed prior to the expiration date.
Capital management metrics
30 June 2012 30 June 2011
Statutory balance sheet gearing1 26% 19%
Adjusted balance sheet gearing2 39% 29%
Covenant gearing3 51% 40%
Interest coverage ratio 2.7x 2.9x
Total interest bearing debt $975.6m $803m
Weighted average borrowing cost 8.07% 8.48%
Weighted average debt maturity4 2.3 years 2.2 years
Hedged percentage on drawn debt4 73% 85%
Hedged percentage on facility limit4 64% 69%
Weighted average hedge maturity4 2.8 years 3.9 years
1. Statutory balance sheet gearing, measured as net debt divided by total assets.
2. Adjusted balance sheet gearing, measured as net debt divided by total assets net of cash and resident loans.
3. Covenant gearing, measured as total liabilities net of resident obligations and deferred tax liabilities divided by total tangible assets less resident obligations and deferred tax
liabilities (Covenant limit: 55%).
4. Excludes Port Bouvard Limited.
— Interest coverage ratio at 2.7 times against the Consolidated Group covenant of greater than or equal to 2.0 times.
— Weighted average debt maturity to 2.3 years.
— Hedged at 64% of facility limit at 30 June 2012 with a weighted average time to maturity of 2.8 years and a weighted average fixed rate of 5.45% (excluding margins and line fees).
— All debt covenants have been met.
— Interim distribution 1.4 cents, in line with 1.4 cents for the previous corresponding period (‘pcp’); final distribution 1.4 cents, down from 1.6 cents for the pcp.

FKP ANNUAL REPORT 2012 25
A summary of the Consolidated Group’s key financial covenants is as follows:
Covenant 2012 Required
Development Multi Option Facility/Retirement Facilities
(Total liabilities – resident loans – deferred tax liability)/ (total tangible assets – resident loans – deferred tax liability) Gearing 51% <55%
(Underlying EBITDA – non-cash component of underlying retirement valuation)/(net finance costs – loan establishment fees) Interest Cover 2.7x >2.0x
The amount by which total tangible assets exceed total liabilities Net Tangible Assets $1.2b >$1.0b
Retirement Syndicate Facility
Cash receipts (as defined)/net finance costs – loan establishment fees Interest Cover 2.0x >1.75x
Loan amount outstanding/mortgaged property valuation Loan to Valuation Ratio 43% <50%
Property Trust
Net rent/interest expense Interest Cover 1.8x >1.5x
Loan amount outstanding/mortgaged property valuation Loan to Valuation Ratio 68% <68%
The Consolidated Group committed to an active capital management programme during the year and continued to divest non-core assets over the last 12 months. When managing capital, Management’s objective is to ensure the Consolidated Group uses a mix of funding options while remaining focused on the objective of optimising returns to securityholders. Management aims to maintain a capital structure that ensures the lowest weighted average cost of capital available.
Management may adjust the Consolidated Group’s capital structure to take advantage of favourable changes in the cost of capital. This could include changing the amount of dividends to be paid to securityholders, returning capital to securityholders or adjusting debt levels.
Underlying profit is determined by adjusting the statutory profit to reflect the Directors’ assessment of the result for the ongoing business activities of the Consolidated Group in accordance with AICD/Finsia principles. To determine the realised underlying profit, the retirement revaluation which is included in the underlying profit is excluded.
Primarily due to the delay in Aerial settlements the Board gearing has increased to 39% and distributions from underlying profit is 79%.
Under the Development MOF, the retirement syndicate facility and the convertible bonds, there is a requirement to maintain net tangible assets with a carrying value per the financial statements of at least $1,000.0m at all times.
The Consolidated Group is not subject to any other externally imposed capital requirements.
Going concern
The balance sheet of the Consolidated Group discloses total current assets of $509.3m and total current liabilities of $1,763.9m. This largely arises because resident loans are classified in full as a current liability, whereas the asset to which the loans relate, investment properties, is classified as a non-current asset. Resident loans are classified as a current liability because the Consolidated Group does not have an unconditional right to defer settlement of resident loans for at least 12 months after the reporting period. In practice, the rate at which the Consolidated Group’s retirements’ residents vacate their units, and hence the rate at which the resident loans will fall due for repayment, can be estimated on the basis of statistical tables.
The Consolidated Group’s best estimate is that of the total resident loans of $1,275.5m, only $120.0m is statistically likely to be paid within the next 12 months. Further, if this amount was repayable, it is estimated that incoming contributions of more than $182.9m would be received from new residents.
After excluding those resident loans not expected to be payable within the next 12 months, current assets exceed current liabilities by $20.9m. Included in current liabilities is $276.3m of interest bearing bank debt maturing in the next 12 months. This includes a $79.8m project finance facility that will be settled following the completion of Aerial and a $43.6m facility related to Port Bouvard. There is no recourse to FKP in respect of the Port Bouvard facility. Also included in current liabilities is a $122.9m bank facility which is due to expire on 30 June 2013. While the Consolidated Group’s statement of financial position classifies this banking facility as current, there has been a significant amount of work undertaken regarding the renewal or refinancing of this facility with a number of financial institutions. The Directors are confident that the renewal or refinancing of this facility will be executed prior to the expiration date.

26 FKP ANNUAL REPORT 2012
Directors’ Report continued
REVIEW AND RESULTS OF OPERATIONS CONTINUEDGoing concern continued
The Consolidated Group announced its intention to undertake a capital raise on 28 August 2012. The capital raise is designed to strengthen the Consolidated Group’s capital position, reduce leverage levels and improve liquidity.
The proposed capital raise will be structured as a 6 for 7 entitlement offer and will raise gross proceeds of $208.0m ($200.0m net of transaction costs). Rosetec Investments Limited, Mulpha Australia Limited, Mulpha Strategic Limited and HDFI Nominees Pty Ltd (each a Mulpha Entity and collectively Mulpha Entities) have made irrevocable commitments to take up their pro-rated entitlement of $54.1m. The capital raise is fully underwritten subject to the usual terms and conditions associated with underwriting arrangements. The capital raise will become unconditional following the close of the Retail Offer on 17 September 2012. The Consolidated Group considers it likely that the terms and conditions will be met and therefore that the capital raise will complete with the full $208.0m gross proceeds raised.
Whilst unlikely, in the event that the terms and conditions of the underwriting agreement are not satisfied, the Mulpha Entities irrevocable commitment means that the minimum guaranteed capital raise is $54.1m in gross proceeds. Under this scenario, the Consolidated Group will need to complete a number of asset sales in order to meet working capital requirements during the next 12 months.
After considering all available current information, the Directors have concluded that there are reasonable grounds to believe that the Consolidated Group will be able to pay its debts as and when they fall due and payable and the basis of preparation of the financial report on a going concern basis is appropriate.
DIVIDENDS AND DISTRIBUTIONSDistributions paid or declared by the Consolidated Group to securityholders since the end of the previous financial year were:
Cents per Total Distributions security amount $m Date of payment
Final 2011 1.60 19.0 30 September 2011
Interim 2012 1.40 16.8 30 March 2012
Final 2012 1.40 16.9 28 September 2012
ENVIRONMENTAL REGULATIONThe Consolidated Group undertakes property development in various states in Australia. It is subject to legislation regulating development. Consents, approvals and licences are generally required for all developments and it is usual for them to be granted subject to conditions. The Consolidated Group complies with these requirements by ensuring that all necessary consents, approvals and licences are obtained prior to any project being commenced and consents, approvals and licences are implemented in order to ensure compliance with conditions. To the best of the Directors’ knowledge, all projects are, and have been undertaken, in compliance with these requirements.
LIKELY DEVELOPMENTS AND EXPECTED RESULTS OF OPERATIONSThe Consolidated Group will continue to pursue its target of increasing the profitability of its major business segments during the next financial year. Additional comments on expected results of certain operations of the Consolidated Group are included in this report under ‘Review and Results of Operations’.
Further information on likely developments in the operations of the Consolidated Group and the expected results of operations have not been included in this report because the Directors believe it would be likely to result in an unreasonable prejudice to the Consolidated Group.
OPTIONSDuring the financial year 4,000,000 (2011: 3,000,000) options were issued by the Consolidated Group. No options were exercised during the financial year (2011: nil).
REMUNERATION REPORTThe Remuneration Report set out on pages 30 to 41 provides details of the remuneration and equity holdings of the Directors and Key Management Personnel and forms part of the Directors’ Report.

FKP ANNUAL REPORT 2012 27
SIGNIFICANT EVENTS AFTER THE BALANCE DATEThe Consolidated Group announced its intention to undertake a capital raise on 28 August 2012. The capital raise is designed to strengthen the Consolidated Group’s capital position, reduce leverage levels and improve liquidity. Refer to Going Concern above for further details.
No other matters or circumstances have arisen since the end of the financial year and up until the date of this report which significantly affect or may significantly affect the operations of the Consolidated Group, the results of those operations, or the state of affairs of the Consolidated Group in subsequent years.
DIRECTORS’ INTERESTSAt the date of this Report, the relevant interests of the Directors in the securities of the Consolidated Group are:
Number of ordinary securities
2012 2011
SH Lee1 317,846,566 302,728,743
P R Brown2 8,621,334 3,535,564
P Parker3 19,944,124 44,097,684
L R McKinnon – –
J E F Frayne 54,788 54,788
G C Dyer4 – –
M Jewell5 – –
W Chow – –
1. Mr Lee acquired a controlling interest in Mulpha International Bhd (‘MIB’) on 16 July 2008. MIB is the 100% beneficial owner of Mulpha Australia Limited, Mulpha Investments Pty
Ltd, Mulpha Strategic Limited, HDFI Nominees Pty Ltd and Rosetec Investments Limited (collectively the ‘Mulpha Group’). The Mulpha Group is a substantial securityholder in the
Consolidated Group.
2. Mr Brown announced his decision to retire as Managing Director and Chief Executive Officer of the Consolidated Group on 20 August 2012. Mr Brown will continue as Managing
Director and Chief Executive Officer until no later than February 2013.
3. Mr Parker resigned as a Director on 21 February 2012.
4. Mr Dyer resigned as a Director on 30 July 2012.
5. Mr Jewell retired from the Board of Directors effective 20 August 2012 but will continue on with the Consolidated Group as Director of Development.
INDEMNIFICATION AND INSURANCE OF OFFICERS AND AUDITORSIndemnification
Pursuant to the Constitutions of the Parent Entity and the Responsible Entity, all Directors and company secretaries (‘Officers’), past and present, have been indemnified against all liabilities allowed under the law. The Parent Entity and the Responsible Entity have also entered into agreements with each of the Directors and Officers to indemnify them against all liabilities to another person which may arise from their positions as officeholders of the Consolidated Group to the extent permitted by law. The agreements stipulate that the Parent Entity and the Responsible Entity will meet the full amount of any such liabilities, including reasonable legal costs and expenses.
Since the end of the previous financial year, neither the Parent Entity nor the Responsible Entity has indemnified or agreed to indemnify any person who is or has been an auditor of the Parent Entity or the Responsible Entity against any liabilities.
Insurance premiums
During the financial year, the Consolidated Group paid premiums in respect of Directors’ and Officers’ liability insurance contracts, for the current and former Directors and Officers, including executive officers and secretaries of the Consolidated Group.
Under the terms of the insurance contracts, disclosure of the extent of the cover and the amount of the premium is prohibited by a confidentiality clause.

28 FKP ANNUAL REPORT 2012
Directors’ Report continued
NON-AUDIT SERVICESThe Board has considered the services provided during the year by the external auditor and in accordance with advice provided by the Audit Committee, is satisfied that the provision of those services during the year is compatible with, and did not compromise, the auditor independence requirements of the Corporations Act 2001 for the following reasons:
— all non-audit services were subject to the corporate governance procedures adopted by the Consolidated Group and have been reviewed by the Audit Committee to ensure they do not impact the integrity and objectivity of the external auditor; and
— the non-audit services provided do not undermine the general principles relating to auditor independence as set out in the Code of Conduct APES 110 Code of Ethics for Professional Accountants issued by the Accounting Professional & Ethical Standards Board, as they did not involve reviewing or auditing the external auditor’s own work, acting in a management capacity for the Consolidated Group, acting as an advocate for the Consolidated Group or jointly sharing risks or rewards.
The following amounts were paid or are payable by the Consolidated Group for non-audit services provided during the year:
2012 2011 $ $
Ernst & Young:
Tax compliance – 4,000
Non-assurance services – 48,000
Total Ernst & Young remuneration for non-audit services – 52,000
AUDITOR’S INDEPENDENCE DECLARATION UNDER SECTION 307C OF THE CORPORATIONS ACT 2001We confirm that we have obtained the Auditor’s Independence Declaration which is set out on page 29.
ROUNDINGThe Consolidated Group is an entity of a kind referred to in ASIC Class Order 98/100 and in accordance with that Class Order, amounts in the Financial Report and Directors’ Report are rounded to the nearest hundred thousand dollars, unless otherwise stated.
Signed in accordance with a resolution of the Directors:
P R Brown Managing Director and Chief Executive Officer
Sydney 28 August 2012

FKP ANNUAL REPORT 2012 29
Auditor’s Independence Declaration
Auditor’s Independence Declaration to the Directors of FKP Limited and the Directors of FKP Funds Management Limited as Responsible Entity for the FKP Property Trust
In relation to our audit of the financial report of FKP Property Group comprising FKP Limited and the entities it controlled and FKP Property Trust and the entities it controlled from time to time during the financial year ended 30 June 2012, to the best of my knowledge and belief, there have been no contraventions of the auditor independence requirements of the Corporations Act 2001 or any applicable code of professional conduct.
Ernst & Young
Douglas Bain Partner
28 August 2012

30 FKP ANNUAL REPORT 2012
Remuneration Report
REMUNERATION REPORT – AUDITEDThe Remuneration Committee (the ‘Committee’) is pleased to provide the FKP Property Group Remuneration Report (‘Report’) for the year ended 30 June 2012, which has been audited in accordance with section 308(3C) of the Corporations Act 2001.
The Committee’s primary objective is to provide a remuneration structure which attracts, retains and motivates staff, reflects FKP’s strategic goals, is aligned with securityholder interests, and addresses current market and stakeholder views.
The Committee and the Board believe that FKP remunerates its executives appropriately, taking account of the market sectors in which the Consolidated Group operates, the prevailing conditions in those sectors, and the skills and experience of the individuals it employs. The Committee and the Board further believe that the split between fixed and variable remuneration is balanced and reflective of a desire to align securityholder and executive interests over the short and longer term.
The Report sets out the current remuneration arrangements for FKP Directors and Executives, under the following sections:
1. Introduction
1.1 Definitions
1.2 Key Management Personnel (‘KMP’) defined
1.3 Actual remuneration received in FY12
2. Remuneration framework
2.1 Remuneration governance
2.2 Remuneration policy
2.3 External advisers
2.4 Termination provisions
3. Link between remuneration and performance
4. Remuneration of Non-Executive Directors (‘NEDs’)
4.1 Directors’ fees
4.2 Retirement benefits
4.3 Performance-based remuneration
4.4 Equity-based remuneration
5. Remuneration of KMP (excluding NEDs)
5.1 Target and FY12 achieved mix of remuneration components
5.2 Fixed remuneration
5.3 Short-term incentives
5.4 Long-term incentives
6. Remuneration tables
6.1 Directors
6.2 KMP excluding Directors – FY12
6.3 KMP excluding Directors – FY11

FKP ANNUAL REPORT 2012 31
1. INTRODUCTION1.1 Definitions
DPS Dividend/distribution per Security
DSP Directors’ Security Plan
EOP Employee Option Plan subject to performance conditions
EOPS Employee Option Plan subject to service period conditions
EPS Earnings per Security
ESP Employee Security Plan
KMP Key Management Personnel: Those persons who, during the course of the year ended 30 June 2012, had the authority and responsibility for planning, directing and controlling the activities of the Consolidated Group, directly or indirectly, including any Director (whether executive or otherwise).
LTI Long-Term Incentive: The FKP LTI is largely equity-based compensation which provides KMP with securities or options, which may vest into FKP stapled securities dependent upon performance against defined conditions typically over a three year performance period.
NED Non-Executive Director
STI Short-Term Incentive: A 12 month incentive plan which provides cash awards for performance against key financial and non-financial targets during any one financial year.
TFR Total Fixed Remuneration: The fixed component of remuneration which includes base pay, superannuation and salary packaged benefits.
TSR Total Shareholder Return: Security price growth plus dividends notionally reinvested in securities, over the assessment period.
UPT Underlying Profit after Tax: reflects statutory profit after tax, as adjusted to reflect the Directors’ assessment of the result for the ongoing business activities of the Consolidated Group, in accordance with AICD/Finsia principles of recording underlying profit.
1.2 Key Management Personnel (‘KMP’) defined
The table below shows the name, position and period of employment/directorship for each KMP whose remuneration is disclosed in this report.
NEDs Position KMP 2012 KMP 2011
SH Lee Chairman (Non-Executive) Full Year Full Year
L R McKinnon Non-Executive Director Full Year Full Year
J E F Frayne Non-Executive Director Full Year Full Year
G C Dyer1 Non-Executive Director Full Year Full Year
W Chow2 Non-Executive Alternate Director (to SH Lee) Partial Year –
P Parker3 Non-Executive Director Partial Year Full Year
Executive Directors
P R Brown4 Managing Director and Chief Executive Officer Full Year Full Year
M Jewell5 Executive Director Partial Year –
Other KMP
D A Hunt Chief Financial Officer Full Year Full Year
G E Grady Chief Operating Officer Full Year Full Year
E L Delfabbro6 Executive General Manager – Developments NSW & Victoria – Full Year
J M Laboo6 Executive General Manager – Retirement – Full Year
A M Hall6 Executive General Manager – Funds Management – Full Year
M Tucker6 Executive General Manager – Retirement Development – Full Year
32 FKP ANNUAL REPORT 2012
Remuneration Report continued
1. INTRODUCTION CONTINUED1.2 Key Management Personnel (‘KMP’) defined continued
1. Mr Dyer resigned from the Board of Directors on 30 July 2012.
2. Mr Chow was appointed as an Alternate Director to Mr Lee on 25 November 2011.
3. Mr Parker resigned from the Board of Directors on 21 February 2012.
4. Mr Brown announced his decision to retire as Managing Director and Chief Executive Officer of the Consolidated Group on 20 August 2012. Mr Brown will continue as Managing
Director and Chief Executive Officer until no later than February 2013.
5. Mr Jewell was appointed Executive Director on 20 July 2011 and retired from the Board effective 20 August 2012. Mr Jewell will continue on with the Consolidated Group as
Director of Development.
6. A restructure of the FKP Executive group took place in the year ended 30 June 2012 with the changes taking effect from 1 July 2011. The restructures resulted in all property
sector Executives now reporting directly through to the Chief Operating Officer and newly appointed Executive Director (Director of Developments effective 20 August 2012).
Therefore, Ms Delfabbro, Mr Laboo, Mr Hall and Mr Tucker were no longer considered to be KMP for the purpose of this report. However, the total of the remuneration received
in 2011 has been disclosed in Section 6.3 of this report to provide consistency with figures reported in the prior year.
1.3 Actual remuneration received in FY12
The following table provides a summary of remuneration received by the Executive Directors and other KMP (excluding NEDs), for the year ended 30 June 2012 (‘FY12’). The figures below are the amounts that each individual received in cash and not the amounts calculated in accordance with the Australian Accounting Standards. They contain no allowance for annual or long service leave accrual, nor the security option expense required to be recognised by Accounting Standard AASB 2: ‘Share-Based Payment’. Consequently, the figures below may not correspond to those in later sections of this report. Specific details of the FY12 remuneration received by these executives, prepared in accordance with the statutory obligations and accounting standards, are provided on pages 40 to 41.
Actual remuneration received – KMP (excluding NEDs)
Total Fixed annual actual 2012 remuneration STI LTI Other remuneration ($)1 ($)2 ($)3 ($)4 ($)
P R Brown 1,591,172 675,000 – 25,291 2,291,463
M Jewell5 889,615 – – – 889,615
D A Hunt 496,100 105,000 – 9,669 610,769
G E Grady 438,939 193,000 – – 631,939
1. Fixed annual remuneration includes superannuation benefits together with salary packaged benefits calculated on a ‘cost to FKP’ basis, grossed up for fringe benefits tax (‘FBT’)
payable. Such benefits include motor vehicle costs, car parking and club memberships.
2. KMP remuneration is structured such that the payment of 30% of STIs is deferred to 1 July of the following year. The STI deferral arrangements were first introduced in 2010 for
bonuses relating to the year ended 30 June 2010 (‘FY10’). For bonuses relating to the year ended 30 June 2011 (‘FY11’) and beyond, the deferral applies only to annual bonuses
greater than $100,000. Thus the STIs disclosed in this table represent 70% of FY11 STIs greater than 100,000 and 30% of all STIs granted for FY10. Mr Brown’s Employment
Contract was executed in 2007. While Mr Brown’s Employment Contract expired on 30 June 2011, he entered into an open ended rolling contract as agreed with the Board,
with terms consistent with the expired contract terms. The STI deferral arrangements were introduced in 2010 and therefore Mr Brown’s STI is exempt from deferral. Mr Brown
announced his retirement as Managing Director and Chief Executive Officer on 20 August 2012, effective no later than February 2013.
3. Excludes the $1,000 worth of FKP Property Group securities issued at no cost to employees under the Employee Security Plan. Refer to section 5.4 of the Remuneration Report
for further details.
4. Includes fringe benefits provided to executives which are not salary packaged.
5. Mr Jewell was appointed Executive Director on 20 July 2011 and retired from the Board effective 20 August 2012. Mr Jewell will continue on with the Consolidated Group as
Director of Development.

FKP ANNUAL REPORT 2012 33
2. REMUNERATION FRAMEWORK2.1 Remuneration governance
The Board has established a Remuneration Committee, which is responsible for determining and reviewing remuneration arrangements for Directors (Executive and Non-Executive) and other KMP. The members of the Committee during the year were:
— L R McKinnon (Chairman)1;
— SH Lee;
— J E F Frayne2; and
— P Parker (Chairman)3.
1. Mr McKinnon was appointed Chairman of the Remuneration Committee effective 22 February 2012.
2. Mr Frayne was appointed as a member of the Remuneration Committee effective 22 February 2012.
3. Mr Parker resigned as Chairman of the Remuneration Committee effective 21 February 2012, in line with his resignation from the Board of Directors on 21 February 2012.
The Committee is responsible for ensuring that the remuneration levels for the Consolidated Group are set at appropriate levels to ensure the Consolidated Group has access to the skills and capabilities it needs to operate successfully.
2.2 Remuneration policy
The Consolidated Group’s remuneration policy is to ensure that remuneration packages properly reflect the person’s duties and responsibilities and that the remuneration is competitive in attracting, retaining and motivating people of the highest quality.
The structure of remuneration, as explained below, is designed to attract suitably qualified candidates, reward the achievement of strategic objectives, and achieve the broader outcome of long-term value creation for securityholders. The remuneration structures take into account a range of factors, including the following:
— the capability, skills and experience of the KMP;
— the ability of KMP to impact achievement of the strategic objectives of the Consolidated Group;
— the performance of the KMP in their roles;
— the Consolidated Group’s overall performance;
— the remuneration levels being paid by competitors for similar positions; and
— the need to ensure continuity of executive talent and smooth succession planning.
In assessing the performance of an executive, regard is had to a mix of quantitative and qualitative factors in addition to the Consolidated Group’s immediate underlying profit and loss performance. The nature of property development and investment is such that decisions are constantly being taken that may not generate profit for several years. Examples include the acquisition of land for future development, the process of development itself, and the upgrading of systems and procedures. The likelihood of success of such longer-term projects is considered in establishing measures of executive performance for remuneration purposes. Measures of executive performance include the executive’s effectiveness in developing a capable support team, demonstrating leadership qualities and instilling positive cultural values within their division.
2.3 External advisers
In January 2012, the Parent Entity engaged Deloitte to prepare a report expressing an opinion on the fair value of executive share options granted in FY12.
For the provision of this advice the advisers were commissioned by, and addressed reports directly to, the Board of Directors.
2.4 Termination provisions
The following table provides details of the termination provisions for the KMP (excluding NEDs) as identified in this report.
Payment Treatment Treatment Notice in lieu of of STI on of LTI on Name Position period notice termination termination
P R Brown Managing Director and Chief Executive Officer Pro-rated for time
M Jewell2 Executive Director and performance,
D A Hunt Chief Financial Officer subject to Board Board
G E Grady Chief Operating Officer 6 months 6 months discretion discretion1
1. In determining how an LTI is treated on cessation of employment the Board considers such factors as the duration of the performance period that has elapsed, performance up
to the date of cessation, tenure in KMP role and the total number of years of employment at FKP.
2. Mr Jewell was appointed Executive Director on 20 July 2011 and retired from the Board effective 20 August 2012. Mr Jewell will continue on with the Consolidated Group as
Director of Development.

34 FKP ANNUAL REPORT 2012
Remuneration Report continued
3 LINK BETWEEN REMUNERATION AND PERFORMANCEProfit, EPS and other key financial performance measures over the last five years for the Consolidated Group are set out below.
2012 2011 2010 2009 2008
Net profit/(loss) ($m) (350.3) 82.3 50.8 (319.4) 145.3
Underlying profit ($m)2,3,4 94.7 121.0 108.6 76.8 150.2
EPS (cents)1 (29.2) 7.0 4.5 (70.3) 38.7
Dividends/distributions ($m) 33.7 35.4 17.5 12.3 83.7
DPS – ordinary (cents) 2.8 3.0 1.5 3.5 31.7
Security price at year end ($) 0.38 0.70 0.68 0.52 4.90
Market capitalisation ($m) 460.6 829.6 792.8 183.2 1,300.3
1. Reported earnings per security for the year ended 30 June 2008 has been modified for adjustments made to securities for increases as a result of the renounceable Entitlement
Offer announced on 25 June 2009.
2. Underlying profit reflects statutory profit as adjusted to reflect Directors’ assessment of the result for the ongoing business activities of the Consolidated Group, in accordance
with AICD/Finsia principles of recording underlying profit.
3. Underlying profit for the Consolidated Group was adopted for the years ended 30 June 2010, 30 June 2011 and 30 June 2012. Underlying profit for the years ended 30 June 2008
to 30 June 2009 was not in accordance with AICD/Finsia principles of recording underlying profit.
4. For a reconciliation of the underlying profit after tax for the Consolidated Group to statutory profit after tax for the year ended 30 June 2012 refer to the Directors’ Report.
Remuneration component Link to Consolidated Group performance
Fixed remuneration Fixed remuneration is not linked to Consolidated Group performance. It is set with reference to the individual’s role, responsibilities and performance and remuneration levels for similar positions in the market.
STI STIs are awarded to individuals based on achievement of Consolidated Group and divisional financial targets in individual balanced scorecards, subject to the Consolidated Group’s profitability and ability to pay STI awards. The Board maintains the right to adjust downwards the aggregate pool available to fund STIs if the Consolidated Group’s actual underlying profit after tax (‘UPT’) is below target. UPT is deemed an appropriate performance measure for the granting of STIs to senior executives given that it is the key target hurdle referenced by the Board in preparing its annual budgets and measuring Consolidated Group performance. UPT presents a figure which reflects the Directors’ assessment of the result for the ongoing business activities of the Company by excluding non-cash, one-off market related items which are usually out of Management’s control.
LTI The Consolidated Group provides LTIs in the form of equity-based remuneration to executives through the operation of the following plans:
– ESP: In compliance with taxation legislation, there are no performance hurdles underpinning the ESP.
– EOPS: Participants in the EOPS must remain employed with FKP for three years from grant in order for the options to vest. The exercise price, which functions as an intrinsic performance hurdle, is set by the Board and is typically equal to or greater than the Consolidated Group’s stapled security price at the date of grant. There will be no further issues of options under the EOPS.
– EOP: The vesting of options granted under the EOP is subject to performance hurdles including TSR and UPT targets, set by the Board. All future grants of options will be subject to performance conditions including UPT and TSR targets. UPT is deemed an appropriate measure for granting 50% of LTIs as it provides a consistent performance measure with that used for awarding STIs. This ensures that senior executives are both short-term and long-term focused by providing a comparable basis for reporting Consolidated Group results for a period of up to three years. TSR is applied by the Consolidated Group as the performance measure for awarding the remaining 50% of LTIs as it is the most prevalent LTI performance measure among companies with an executive LTI plan, with 69% of the top 100 companies with an executive LTI plan using this benchmark.

FKP ANNUAL REPORT 2012 35
4 REMUNERATION OF NON-EXECUTIVE DIRECTORS (‘NEDS’)4.1 Directors’ fees
In 2006, securityholders resolved that the maximum aggregate fee pool available to NEDs be increased to $650,000 per year.
For the period 1 April 2009 to 30 June 2011, the Directors resolved to reduce their Directors’ fees by 50%. The Directors’ fees reverted back to the original level for the year ended 30 June 2012. Mr Parker received a base fee of $65,385 per annum inclusive of superannuation (with an entitlement to retirement benefits). Mr Parker received an additional $181,155 in accrued retirement benefits upon his resignation on 21 February 2012. All other Directors received a base fee of $85,000 per annum inclusive of superannuation.
These fees cover all main Board activities. Additionally, the Chairman of the Audit Committee received $5,000 per annum and the other members of the Audit Committee received $1,000 per annum. Audit Committee fees increased effective 1 January 2012 to $12,000 per annum for the Audit Committee Chairman and $2,000 per annum for the other members as a result of the increased work required in 2012/2013 following the introduction of the Consolidated Group’s Internal Audit function in 2012. No additional fees were paid to members of the Remuneration Committee.
4.2 Retirement benefits
The Consolidated Group’s Directors’ Retirement Benefits Scheme applies only to Directors appointed before 30 June 2004 who have served as Directors for more than five years. The benefit payable is the amount equal to the fees paid to the Director for the three year period immediately prior to the Director’s retirement, less any payment made in respect of superannuation. This Scheme has not been approved by securityholders as it complies with the requirements of the Corporations Act 2001. Mr Parker was the only Director with an entitlement under this scheme. There were no Directors remaining as at 30 June 2012 with an entitlement under this scheme.
4.3 Performance-based remuneration
NEDs do not receive any performance-based remuneration.
4.4 Equity-based remuneration
The Consolidated Group’s DSP was approved at the 2002 Annual General Meeting (‘AGM’) and amended at the 2003 and 2004 AGMs. Under the DSP, eligible NEDs can elect to receive their Directors’ fees by way of securities in the Consolidated Group, in lieu of cash, after taking into account any FBT payable by the Consolidated Group. Securities allocated under the DSP can either be issued by the Consolidated Group or purchased on market. This plan continues to operate, however no Directors to date have elected to receive their Directors’ fees by way of securities in the Consolidated Group.
5 REMUNERATION OF KMP (EXCLUDING NEDS)5.1 Target and FY12 achieved mix of remuneration components
Executive remuneration packages include a mix of fixed remuneration, bonuses and equity-based remuneration. The target remuneration mix for executives, expressed as a percentage of total remuneration, is detailed in the table below.
Target mix At risk remuneration (%)
Deferred Total TFR STI STI 2 LTI 1 Total at risk remuneration (%) (%) (% ) (% ) (%) (%)
Managing Director and Chief Executive Officer 40.0 40.0 – 20.0 60.0 100.0
Executive Director3 Chief Financial Officer and Chief Operating Officer 50.0 17.5 7.5 25.0 50.0 100.0
1. LTI target percentage is calculated based on the annual amortised expense as required under Accounting Standard AASB 2: ‘Share-Based Payment’.
2. Refers to the deferral of FY12 STI.
3. Mr Jewell was appointed Executive Director on 20 July 2011 and retired from the Board effective 20 August 2012. Mr Jewell will continue on with the Consolidated Group
as Director of Development.

36 FKP ANNUAL REPORT 2012
Remuneration Report continued
5 REMUNERATION OF KMP (EXCLUDING NEDS) CONTINUED5.1 Target and FY12 achieved mix of remuneration components continued
FY12 achieved At risk remuneration (%)
Deferred Total TFR STI STI 2 LTI 1 Total at risk remuneration (%) (%) (% ) (% ) (%) (%)
Managing Director and Chief Executive Officer
P R Brown 100.0 – – – – 100.0
Executive Director
M Jewell3 99.1 – – 0.9 0.9 100.0
Chief Financial Officer
D A Hunt 85.2 – – 14.8 14.8 100.0
Chief Operating Officer
G E Grady 80.5 – – 19.5 19.5 100.0
1. LTI target percentage is calculated based on the annual amortised expense as required under Accounting Standard AASB 2: ‘Share-Based Payment’.
2. Refers to the deferral of FY12 STI.
3. Mr Jewell was appointed Executive Director on 20 July 2011 and retired from the Board effective 20 August 2012. Mr Jewell will continue on with the Consolidated Group
as Director of Development.
The Committee considers the weighting of total remuneration between fixed, performance-based and equity-based, including the allocation of STIs between immediate payments and deferred payments for executives, to be appropriate.
The Committee may exercise its discretion to vary the size of the available performance pool, as well as the target mix of remuneration components, in any given year as appropriate, by reference largely to the financial performance against target earnings and comparative periods.
5.2 Fixed remuneration
Fixed remuneration consists of base remuneration (which is calculated on a total cost basis and includes salary packaged benefits grossed up for FBT payable including motor vehicles, car parking and other specified benefits), as well as employer contributions to superannuation funds.
Remuneration levels are reviewed periodically by the Committee.
Managing Director and Chief Executive Officer (‘CEO’)
The Managing Director and CEO’s Employment Agreement, which was effective from 1 July 2007, expired on 30 June 2011 and was extended with an open ended rolling contract entered into thereafter as agreed with the Board. Mr Brown announced his retirement as Managing Director and CEO on 20 August 2012, effective no later than February 2013.
Executive Director (‘ED’), Chief Financial Officer (‘CFO’) and Chief Operating Officer (‘COO’)
The TFR of the ED, CFO and COO are set annually, as agreed with the Managing Director and CEO, based on role specifications, responsibilities and performance.
5.3 Short-term incentives
STIs are performance based remuneration, awarded largely in the form of cash bonuses. With the exception of NEDs, KMP may receive cash bonuses determined at the discretion of the Committee.
STIs for executives are paid in cash and expensed to the respective year’s underlying profit. The cash payment of bonuses is subject to a 30% deferral component, which is paid on 1 July of the following year (with the exception of the Managing Director and CEO). The deferral applies only to annual bonuses greater than $100,000. STIs depend on an individual’s performance using a range of quantitative and qualitative measures with a long-term focus. They represent a significant part of executives’ remuneration and are capped at appropriate levels.
Refer to Section 3 ‘Link between remuneration and performance’ above for further details on the correlation between the Consolidated Group’s performance and performance based payments.

FKP ANNUAL REPORT 2012 37
Managing Director and CEO
The Managing Director and CEO is entitled to receive an annual cash bonus of up to 100% of TFR, subject to achieving performance hurdles based on the financial and operational performance of the Consolidated Group, and other priorities specified each year by the Committee.
The annual cash bonus is weighted as follows:
— 50% is awarded if the UPT for FY12 increased on FY11, in line with communications to the market in August 2011 (target percentage increases are set by the Board annually); and
— The balance of the bonus is subject to the achievement of various quantitative and qualitative performance hurdles agreed with the Committee, which are aligned with securityholders’ interests and encourage sustainable business and financial outcomes, enhance the Consolidated Group’s brand and reputation with key stakeholders, develop workforce capability and culture to maximise competitive advantage, and ensure sustainable business practices and strong corporate responsibility.
Performance hurdles are revised annually by the Committee.
ED, CFO and COO
The ED, CFO and COO are entitled to receive an annual bonus of up to 50% of TFR, 30% of which is deferred to 1 July of the following year, subject to achieving performance hurdles based on the financial and operational performance of the Consolidated Group, and other priorities specified each year by the Managing Director and CEO. The deferral applies only to annual bonuses greater than $100,000.
The annual cash bonus is weighted as follows:
— 50% is awarded if the UPT for FY12 increased on FY11, in line with communications to the market in August 2011 (target percentage increases are set by the Board annually); and
— The balance of the bonus is subject to the achievement of various quantitative and qualitative performance hurdles agreed with the Managing Director and CEO, where applicable, consistent with those hurdles prescribed for the Managing Director and CEO.
The Board may exercise its discretion to award the ED, CFO and COO a maximum annual bonus of up to 100% of TFR (a twofold increase in the ED, CFO and COO’s target annual bonus), in any given year as appropriate, should performance at a Consolidated Group level and/or at an individual level significantly exceed pre-determined targets. The maximum annual bonus is also subject to the 30% deferral arrangement, whereby payment of 30% of the maximum annual bonus is deferred to 1 July of the following year. The deferral applies only to annual bonuses greater than $100,000.
Performance hurdles are revised annually by the Committee.
5.4 Long-term incentives
The Consolidated Group provides LTIs in the form of equity-based remuneration to executives through the operation of the following plans:
— ESP;
— EOPS1; and
— EOP.
1. EOPS are no longer issued to executives and staff.
During the financial year 3,000,000 (2011: 3,000,000) security options and 4,346 (2011: 11,424) equity securities were granted to KMPs as part of their remuneration.
The Consolidated Group’s Security Trading Policy and the Committee’s policy in relation to the hedging of equity-based remuneration prohibit the use of derivative or hedging arrangements by KMP in relation to unvested FKP securities or vested FKP securities which are still subject to a FKP imposed holding lock. Adherence to this policy is monitored on an annual basis and involves each KMP signing an annual declaration of compliance with the hedging policy.
ESP
The ESP provides all full-time or part-time employees (with the exception of NEDs), upon completion of one year’s service, the opportunity to be rewarded for their service to the Consolidated Group by offering them $1,000 worth of FKP Property Group securities at no cost to the employee. Securities are restricted for a minimum of three years or until cessation of employment. In compliance with taxation legislation, there are no performance hurdles underpinning the ESP.

38 FKP ANNUAL REPORT 2012
Remuneration Report continued
5 REMUNERATION OF KMP (EXCLUDING NEDS) CONTINUED5.4 Long-term incentives continuedEOPS
The EOPS is an LTI, with the purpose being to retain key employees and align remuneration with the long-term performance of the Consolidated Group. Under the EOPS, executives may be issued with options over stapled securities of the Consolidated Group, which are exercisable on a one-for-one basis. There is no amount paid or payable to the Consolidated Group by the executives on receipt of a grant of options under the EOPS. Between vesting and expiry, participants have one year during which they may exercise their options by paying the exercise price for their options to the Consolidated Group.
Participants in the EOPS must remain employed with FKP for three years from grant in order for the options to vest. The exercise price, which functions as an intrinsic performance hurdle, is set by the Board and is typically equal to or greater than the Consolidated Group’s stapled security price at the date of grant.
There will be no further issues of options under the EOPS to executives and staff.
EOP
The EOP is an LTI, with the purpose being to retain key employees and align remuneration with the long-term performance of the Consolidated Group. Under the EOP, executives may be issued with options over stapled securities of the Consolidated Group, which are exercisable on a one-for-one basis. There is no amount paid or payable to the Consolidated Group by the executives on receipt of a grant of options under the EOP. Between vesting and expiry, participants have one year during which they may exercise their options by paying the exercise price for their options to the Consolidated Group.
The vesting of options granted under the EOP is subject to performance hurdles including TSR and UPT targets, set by the Board.
All future grants of options will be under the EOP i.e. subject to performance conditions.
EOPS grants affecting remuneration for year ended 30 June 2012
There were no EOPS granted as remuneration to KMPs during the year ended 30 June 2012 and no existing tranches were exercised and/or vested.
No options have been granted or vested since the end of the financial year. Further information on the options is set out in Note 30 ‘Share-based payments’.
EOP grants affecting remuneration for year ended 30 June 2012
Details of options over stapled securities in the Consolidated Group provided as remuneration to each KMP are set out below.
Value of options Value of options Value of options granted during exercised forfeited during the year, during the year, the year, Number of Number of calculated calculated calculated options granted options vested at grant at exercise at forfeiture KMP during the year during the year $ 1 $ $ 2
M Jewell 3,000,000 – 16,800 – –
No options have been granted or vested since the end of the financial year. Further information on the options is set out in Note 30 ‘Share-based payments’. During the reporting period, no options were exercised.
EOP grants made in year ended 30 June 2012
The table below shows details of the terms and conditions of each grant made to KMP under the EOP during the reporting period.
Fair value per option Date when at grant date Exercise price options may Incumbent name Grant date ($) ($) be exercised Expiry date
M Jewell 25/11/2011 0.0056 0.95 1/09/2013 31/08/2014
1. Calculated as the number of options granted to Executives multiplied by the fair value of those options at grant.
2. Calculated as the number of options forfeited multiplied by the fair value of those options at grant.

FKP ANNUAL REPORT 2012 39
EOP grants made in year ended 30 June 2012 (continued)Options granted on 25 November 2011 are subject to performance conditions over a two year performance period from 1 July 2011 to 30 June 2013, as follows:
— Relative total shareholder return (‘TSR’) hurdle to apply to 50% of options. In order for any of the TSR grants to vest, FKP’s TSR over the performance period must be at or above the 50th percentile of a comparator group of companies (constituents of the S&P ASX200 A-REIT index). The proportion of the option grant that vests based on TSR will be determined based on FKP’s TSR relative to the comparator group as follows:
TSR of FKP Relative to TSR of Comparator Group Companies Proportion of option grant vesting based on TSR
Less than the 50th percentile 0%
50th percentile 50%
Between 50th percentile and 75th percentile Straight line vesting between 50% and 100%
75th percentile 100%
— Underlying profit after tax (‘UPT’) hurdle to apply to 50% of options. The UPT grant will vest 100% if aggregate UPT over the performance period exceeds the sum of the UPT targets for the performance period. The UPT targets for each financial year will be determined by the Board annually. The target for FY12 is an increase on the FY11 result, in line with communications to the market in August 2011.
EOPS grants affecting remuneration in future reporting periods
Estimate of maximum value of grant 2 Grant date Financial year 1 ($ )
10/11/09 FY13 295,763
The minimum value of EOPS grants affecting compensation in this and future reporting periods is zero.
EOP grants affecting remuneration in future reporting periods
Estimate of maximum value of grant 2 Grant date Financial year 1 ($ )
22/02/2011 FY14 261,000
25/11/2011 FY14 16,800
The minimum value of EOP grants affecting compensation in this and future reporting periods is zero.
1. Financial years beyond FY12, in which the options granted are due to vest.
2. Calculated as the number of options granted to executives multiplied by the fair value of those options at grant.

40 FKP ANNUAL REPORT 2012
Remuneration Report continued
6 REMUNERATION TABLES6.1 Directors Short-term Post-employment Other employee benefits benefits compensation Share-based payments
Aggregate Aggregate excluding including AASB 2 AASB 2 Proportion of expense AASB 2 expense Proportion Proportion of remuneration Other relating to AASB 2 expense relating to of remuneration consisting of Non- post- securities/ expense relating to securities/ remuneration non- securities/ Salary monetary Super employment Termination security relating to security security performance performance security and fees Bonus benefits benefits benefits 1 benefits options securities options options related related options Year $ $ $ $ $ $ $ $ $ $ % % %
NEDs
SH Lee 2012 161,468 – – 14,532 – – 176,000 – – 176,000 – 100.0 –
2011 39,450 – – 3,550 – – 43,000 – – 43,000 – 100.0 –
L R McKinnon 2012 85,780 – – 7,720 – – 93,500 – – 93,500 – 100.0 –
2011 40,787 – – 3,671 – – 44,458 – – 44,458 – 100.0 –
J E F Frayne 2012 79,358 – – 7,142 – – 86,500 – – 86,500 – 100.0 –
2011 39,450 – – 3,550 – – 43,000 – – 43,000 – 100.0 –
G C Dyer2 2012 79,358 – – 7,142 – – 86,500 – – 86,500 – 100.0 –
2011 38,991 – – 3,509 – – 42,500 – – 42,500 – 100.0 –
P Parker3 2012 39,991 – – 3,599 – 181,155 6 224,745 – – 224,745 – 100.0 –
2011 29,993 – – 2,699 (29,992) – 2,700 – – 2,700 – 100.0 –
D C Crombie4 2012 – – – – – – – – – – – –
2011 14,676 – – 1,321 – 196,155 212,152 – – 212,152 – 100.0 –
Executive Directors
P R Brown 2012 1,566,172 – 25,291 25,000 – – 1,616,463 – – 1,616,463 – 100.0 –
2011 1,566,172 675,000 24,208 25,000 – – 2,290,380 – – 2,290,380 29.5 70.5 –
M Jewell5 2012 840,192 – – 49,423 – – 889,615 – 8,400 898,015 0.9 99.1 0.9
2011 – – – – – – – – – – – – –
Director Totals 2012 2,852,319 – 25,291 114,558 – 181,155 3,173,323 – 8,400 3,181,723 0.3 99.7 0.3
2011 1,769,519 675,000 24,208 43,300 (29,992) 196,155 2,678,190 – – 2,678,190 25.2 74.8 –
1. Other post-employment benefits include movements in accrued retirement benefits during the year.
2. No compensation is received by Mr Dyer personally. All compensation paid in exchange for Mr Dyer’s services is paid to a company within the Mulpha Group. Mr Dyer resigned
as NED on 30 July 2012.
3. Mr Parker resigned as NED effective 21 February 2012.
4. Mr Crombie resigned as NED on 26 November 2010.
5. Mr Jewell was appointed Executive Director on 20 July 2011 and retired from the Board of Directors effective 20 August 2012. Mr Jewell will continue on with the Consolidated
Group as Director of Development.
6. Mr Parker was the only remaining Director with an entitlement under the Retirement Benefits scheme. There were no Directors remaining as at 30 June 2012 with an entitlement
under this scheme.

FKP ANNUAL REPORT 2012 41
6.2 KMP excluding Directors – FY12 Post- Short-term employment Other employee benefits benefits compensation Share-based payments
Aggregate Aggregate excluding including AASB 2 AASB 2 Proportion of expense AASB 2 expense Proportion Proportion of remuneration relating to AASB 2 expense relating to of remuneration consisting of Non- securities/ expense relating to securities/ remuneration non- securities/ Salary monetary Super Termination security relating to security security performance performance security and fees 1 Bonus 2 benefits 3 benefits benefits options securities options 4 options related related options Year $ $ $ $ $ $ $ $ $ % % %
KMP excluding Directors
D A Hunt 2012 471,100 – 9,669 25,000 – 505,769 1,000 87,159 593,928 14.8 85.2 14.8
2011 456,961 150,000 9,669 25,000 – 641,630 1,000 86,921 729,551 32.6 67.4 12.1
G E Grady 2012 412,012 – – 26,927 – 438,939 1,000 105,506 545,445 19.5 80.5 19.5
2011 380,356 190,000 – 46,747 – 617,103 1,000 105,218 723,321 41.0 59.0 14.7
Total 2012 883,112 – 9,669 51,927 – 944,708 2,000 192,665 1,139,373 17.1 82.9 17.1
2011 837,317 340,000 9,669 71,747 – 1,258,733 2,000 192,139 1,452,872 36.8 63.2 13.4
1. Includes annual leave and salary packaged benefits including car parking, motor vehicles and club memberships calculated at a ‘cost to FKP’ basis, grossed up for FBT payable.
2. 30% of STIs to be paid on 1 July of the following year. Refer to section 1.3 of this report for further details.
3. Comprises fringe benefits paid to employees which are not salary packaged.
4. The security options are required to be expensed by Accounting Standard AASB 2: ‘Share-Based Payment’. The Consolidated Group’s security price at 30 June 2012 was
$0.38 (2011: $0.70), compared to an exercise price of $0.85 for tranche 4 and $0.95 for tranches 5 and 7 meaning the options were ‘out of the money’ by $0.47 and
$0.57 respectively. Tranche 4 expires in August 2013 and tranches 5 and 7 expire in August 2014.
6.3 KMP excluding Directors – FY11 Post- Short-term employment Other employee benefits benefits compensation Share-based payments
Aggregate Aggregate Excluding including AASB 2 AASB 2 Proportion of Expense AASB 2 expense Proportion Proportion of remuneration Relating to AASB 2 Expense relating to of remuneration consisting of Non- Securities/ Expense Relating to securities/ remuneration non- securities/ Salary monetary Super Termination Security Relating to security security performance performance security and fees 1 Bonus 2 benefits 3 benefits benefits Options Securities options options related related options Year $ $ $ $ $ $ $ $ $ % % %
KMP excluding Directors
E L Delfabbro4 2011 383,043 190,000 – 25,000 – 598,043 1,000 85,867 684,910 40.4 59.6 12.7
J M Laboo4 2011 332,851 130,000 – 39,407 – 502,258 1,000 84,018 587,276 36.6 63.4 14.5
A M Hall4 2011 311,881 50,000 – 34,369 – 396,250 1,000 53,763 451,013 23.2 76.8 12.1
M Tucker4 2011 330,627 50,000 – 39,188 – 419,815 1,000 48,945 469,760 21.3 78.7 10.6
S Stewart5 2011 352,147 – – 25,000 246,366 623,513 1,000 – 624,513 – 100.0 –
Total 1,710,549 420,000 – 162,964 246,366 2,539,879 5,000 272,593 2,817,472 24.8 75.2 9.9
1. Includes annual leave and salary packaged benefits including car parking, motor vehicles and club memberships calculated at a ‘cost to FKP’ basis, grossed up for FBT payable.
2. 30% of STIs to be paid on 1 July of the following year. Refer to section 1.3 of this report for further details.
3. Comprises fringe benefits paid to employees which are not salary packaged.
4. Following the restructure of the Executive group effective 1 July 2011, E L Delfabbro, J M Laboo, A M Hall and M Tucker were no longer considered to be KMP for the purpose
of this report. The total remuneration received in 2011 has been disclosed above to provide consistency with figures reported in the prior year.
5. S Stewart resigned on 29 June 2011.

42 FKP ANNUAL REPORT 2012
Corporate Governance Statement
The Board of Directors is responsible for the corporate governance of the Consolidated Group. This Statement outlines the main corporate governance practices in place and the extent to which the Consolidated Group has followed the recommendations of the ASX Corporate Governance Council throughout the year, including the Council’s revised Corporate Governance Principles and Recommendations (2nd edition) published in August 2007 as amended in 2010 (‘Guidelines’).
The Guidelines set out core principles and practices that the ASX Corporate Governance Council believes underlie good corporate governance and all listed entities are required to disclose the extent to which they depart from the Recommendations.
A copy of this Statement is available on the Consolidated Group’s website at ww w.fkp.com.au under the Corporate Governance section.
PRINCIPLE 1: LAY SOLID FOUNDATIONS FOR MANAGEMENT AND OVERSIGHTThe Board’s primary role is the creation of long-term securityholder value through the development of the strategic direction of the Consolidated Group, the implementation of efficient internal delegations and controls, the effective oversight of senior management, the promotion of high ethical standards of behaviour, the offering of high quality products to the market, and commitment to the constant improvement of the Consolidated Group’s corporate governance practices.
The Board’s responsibilities and functions include:
— strategic planning;
— capital management and financial reporting;
— approving and monitoring major capital expenditure, acquisitions and disposals;
— appointing or removing, or ratifying the appointment or removal of, senior management;
— approving and monitoring the risk management framework; and
— overseeing the Consolidated Group’s accountability systems and code of conduct.
Further details of the specific philosophy, values and responsibilities of the Board are contained in the Board Charter available on the Consolidated Group’s website under the Corporate Governance section.
The Board has delegated to the Managing Director and Chief Executive Officer responsibility for the day-to-day management of the Consolidated Group and the implementation and delivery of the Board’s strategic direction. The Board delegates authority and functions to the Managing Director and Chief Executive Officer and senior management in accordance with a formal delegation document.
The Managing Director and Chief Executive Officer is responsible for the induction of senior management. Each year the Managing Director and Chief Executive Officer and the Remuneration Committee undertake a formal process of reviewing the performance of senior management by reference to key performance indicators identified annually for each executive. The measures generally relate to the performance of the Consolidated Group, the performance of the executive’s division and the performance of the executive individually. Performance evaluations for senior management have taken place during the financial year in accordance with the approved processes of the Consolidated Group. Further details relating to the assessment criteria for the Managing Director and Chief Executive Officer and senior management remuneration are disclosed in the Remuneration Report.
The Chief Executive Officer and Managing Director, Mr Peter Brown, resigned on 20 August 2012 but will continue until no later than February 2013 after which time a new Chief Executive Officer will be recruited. During the transitional period the current Non-Executive Chairman Mr Seng Huang Lee will become Executive Chairman.
PRINCIPLE 2: STRUCTURE THE BOARD TO ADD VALUEDuring the financial year, the Board comprised two Executive Directors (the Managing Director and Chief Executive Officer) and five Non-Executive Directors, one of whom retired from the Board on 21 February 2012. The names, skills and experience of the Directors who held office during the financial year and the period of office of each Director are set out in the Directors’ Report.

FKP ANNUAL REPORT 2012 43
Independence of Directors
For the purposes of determining Director independence, the Board considers any material previous or current business relationships which could reasonably be perceived to interfere with or compromise each Director’s independent judgement in accordance with the Guidelines.
The following factors and relationships are considered by the Board in assessing whether a Director is independent:
— being a substantial securityholder or company that has a substantial security holding in the Consolidated Group, or being an officer of or being otherwise associated with, either directly or indirectly, a substantial securityholder;
— being employed in an executive capacity by the Consolidated Group within the last three years;
— being a principal of a material professional adviser or a material consultant to the Consolidated Group, within the last three years;
— being, or being associated with, a material supplier or customer of the Consolidated Group;
— being in a material contractual relationship with the Consolidated Group other than as a Director of the Consolidated Group; and
— having any other interest or relationship that could materially interfere with the Director’s ability to act in the best interests of the Consolidated Group and independently of Management.
The Board has not set any tests as to the number of terms or years on the Board that would be regarded as undermining judgement.
The Board assesses the independence of Directors each year having regard to each Director’s specific circumstances and the disclosures made by the Director. The Board makes more frequent assessments if a Director discloses a new interest or relationship relevant to that Director’s independence.
The Board considers that of the Non-Executive Directors who held office during the year, the following have been assessed as independent.
— P Parker (resigned 21 February 2012);
— L R McKinnon; and
— J E F Frayne.
Mr Parker was a founding Director of the Parent Entity and was previously a substantial securityholder in the Consolidated Group. However, Mr Parker has not served in an executive capacity for many years and has no material contractual relationship with the Consolidated Group. The Board does not consider that Mr Parker’s previous relationship and length of service on the Board affects his ability to act independently and in the best interests of the Consolidated Group.
Mr Frayne ceased to be a partner of PKF Chartered Accountants, a former material consultant to the Consolidated Group, in June 2006. The Board does not consider that Mr Frayne’s previous relationship affects his ability to act independently and in the best interests of the Consolidated Group.
Mr Lee and Mr Dyer (resigned 30 July 2012) do not meet the independence test set out in the Guidelines as they are associated directly with Mulpha Australia Limited, a substantial securityholder of the Consolidated Group.
While the Board believes that all of the Non-Executive Directors of the Consolidated Group bring independent judgement to bear in the decision making process, the Board acknowledges that following the resignation of Mr Crombie during the year, the majority of Directors did not meet the independence test as set out in the Guidelines.
To facilitate independent judgement in decision making, each Director has the right to seek independent professional advice in relation to the execution of Board responsibilities. Such advice may be obtained at the Consolidated Group’s expense with prior approval of the Chairman, which will not be unreasonably withheld. Directors may share advice obtained with the other Directors where appropriate.
Role of Chairman
Mr Lee was appointed Chairman of the Consolidated Group on 12 February 2009. Mr Lee is not an independent Director for the purposes of the Guidelines as Mr Lee is directly associated with Mulpha Australia Limited, a substantial securityholder of the Consolidated Group.
The Board has not appointed a lead independent Director as the Board does not believe that any such appointment could increase the exercise of independent judgement by the Board. The Board considers that the Chairman facilitates the effective contribution of all Directors and promotes constructive and respectful relations between Directors and between the Board and senior management.
The roles of Chairman, Managing Director and Chief Executive Officer are exercised by separate individuals. The Board recognises the importance of ensuring that the Chairman and the Managing Director and Chief Executive Officer have defined roles within the organisation and function within clear functional lines. Further information in relation to the Role of the Chairman has been published on the Consolidated Group’s website, under the Corporate Governance section.
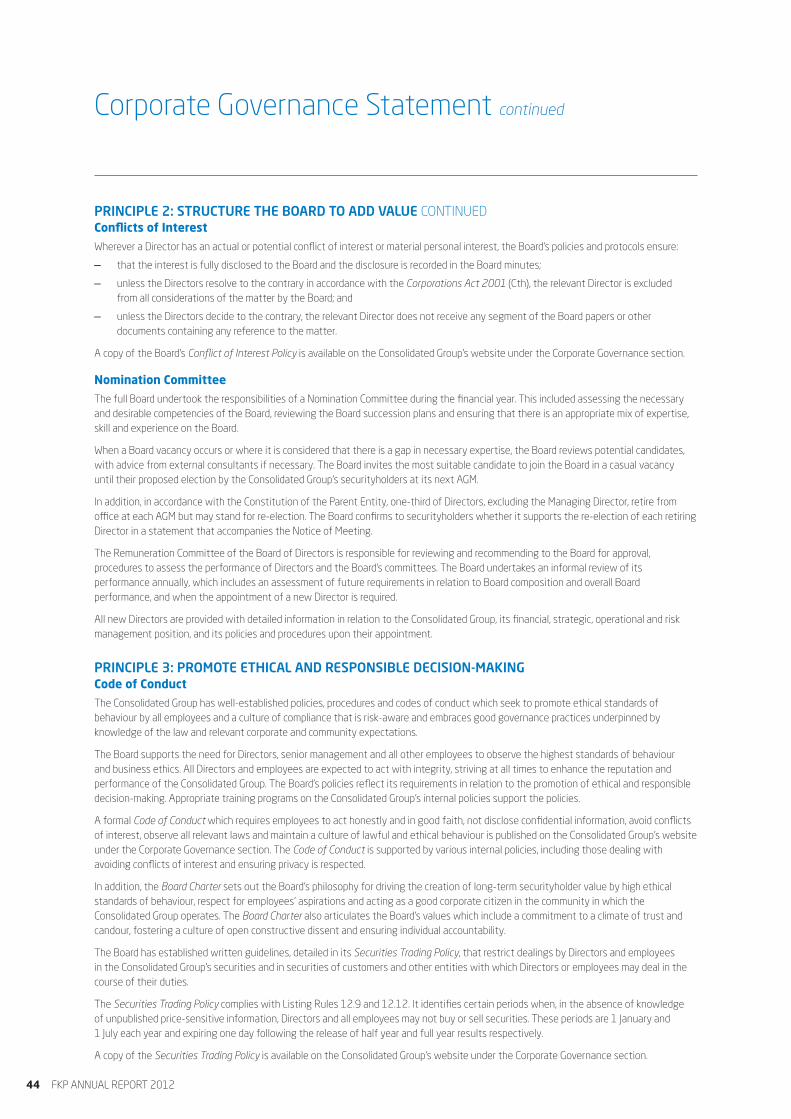
44 FKP ANNUAL REPORT 2012
Corporate Governance Statement continued
PRINCIPLE 2: STRUCTURE THE BOARD TO ADD VALUE CONTINUEDConflicts of Interest
Wherever a Director has an actual or potential conflict of interest or material personal interest, the Board’s policies and protocols ensure:
— that the interest is fully disclosed to the Board and the disclosure is recorded in the Board minutes;
— unless the Directors resolve to the contrary in accordance with the Corporations Act 2001 (Cth), the relevant Director is excluded from all considerations of the matter by the Board; and
— unless the Directors decide to the contrary, the relevant Director does not receive any segment of the Board papers or other documents containing any reference to the matter.
A copy of the Board’s Conflict of Interest Policy is available on the Consolidated Group’s website under the Corporate Governance section.
Nomination Committee
The full Board undertook the responsibilities of a Nomination Committee during the financial year. This included assessing the necessary and desirable competencies of the Board, reviewing the Board succession plans and ensuring that there is an appropriate mix of expertise, skill and experience on the Board.
When a Board vacancy occurs or where it is considered that there is a gap in necessary expertise, the Board reviews potential candidates, with advice from external consultants if necessary. The Board invites the most suitable candidate to join the Board in a casual vacancy until their proposed election by the Consolidated Group’s securityholders at its next AGM.
In addition, in accordance with the Constitution of the Parent Entity, one-third of Directors, excluding the Managing Director, retire from office at each AGM but may stand for re-election. The Board confirms to securityholders whether it supports the re-election of each retiring Director in a statement that accompanies the Notice of Meeting.
The Remuneration Committee of the Board of Directors is responsible for reviewing and recommending to the Board for approval, procedures to assess the performance of Directors and the Board’s committees. The Board undertakes an informal review of its performance annually, which includes an assessment of future requirements in relation to Board composition and overall Board performance, and when the appointment of a new Director is required.
All new Directors are provided with detailed information in relation to the Consolidated Group, its financial, strategic, operational and risk management position, and its policies and procedures upon their appointment.
PRINCIPLE 3: PROMOTE ETHICAL AND RESPONSIBLE DECISION-MAKINGCode of Conduct
The Consolidated Group has well-established policies, procedures and codes of conduct which seek to promote ethical standards of behaviour by all employees and a culture of compliance that is risk-aware and embraces good governance practices underpinned by knowledge of the law and relevant corporate and community expectations.
The Board supports the need for Directors, senior management and all other employees to observe the highest standards of behaviour and business ethics. All Directors and employees are expected to act with integrity, striving at all times to enhance the reputation and performance of the Consolidated Group. The Board’s policies reflect its requirements in relation to the promotion of ethical and responsible decision-making. Appropriate training programs on the Consolidated Group’s internal policies support the policies.
A formal Code of Conduct which requires employees to act honestly and in good faith, not disclose confidential information, avoid conflicts of interest, observe all relevant laws and maintain a culture of lawful and ethical behaviour is published on the Consolidated Group’s website under the Corporate Governance section. The Code of Conduct is supported by various internal policies, including those dealing with avoiding conflicts of interest and ensuring privacy is respected.
In addition, the Board Charter sets out the Board’s philosophy for driving the creation of long-term securityholder value by high ethical standards of behaviour, respect for employees’ aspirations and acting as a good corporate citizen in the community in which the Consolidated Group operates. The Board Charter also articulates the Board’s values which include a commitment to a climate of trust and candour, fostering a culture of open constructive dissent and ensuring individual accountability.
The Board has established written guidelines, detailed in its Securities Trading Policy, that restrict dealings by Directors and employees in the Consolidated Group’s securities and in securities of customers and other entities with which Directors or employees may deal in the course of their duties.
The Securities Trading Policy complies with Listing Rules 12.9 and 12.12. It identifies certain periods when, in the absence of knowledge of unpublished price-sensitive information, Directors and all employees may not buy or sell securities. These periods are 1 January and 1 July each year and expiring one day following the release of half year and full year results respectively.
A copy of the Securities Trading Policy is available on the Consolidated Group’s website under the Corporate Governance section.

FKP ANNUAL REPORT 2012 45
Diversity
The Consolidated Group is committed to diversity and equality in the workplace as it adds value to the organisation by actively creating opportunities for all employees to use their knowledge, skills and abilities. The Board has adopted a Diversity Policy which is available on the Consolidated Group’s website under Corporate Governance. The Board has adopted measurable objectives for achieving gender diversity which are disclosed in the Diversity Policy. Reporting in respect of the Diversity Policy will be a periodic item on the Board agenda.
As of 30 June 2012 the proportion of women employees in the whole Consolidated Group, women in senior executive positions and women on the Board is as follows:
Position % Female Employees
Board Nil
Senior Executive 11
Consolidated Group 69
PRINCIPLE 4: SAFEGUARD INTEGRITY IN FINANCIAL REPORTINGThe Consolidated Group has an established Audit and Risk Committee (‘Committee’) which operates under written terms of reference approved by the Board and embodied in the Audit and Risk Committee Charter. The Committee assists the Board to verify and safeguard the integrity of the Consolidated Group’s financial reporting, internal control structures and risk management systems and oversees the independence of the external auditor.
The Committee is also responsible for making recommendations to the Board in relation to the selection, appointment and rotation of the external audit engagement partners and overseeing and appraising the quality and effectiveness of audit work performed by the external auditor.
The Committee comprises three Non-Executive Directors with a majority of Directors being independent. The Committee is chaired by an independent Chairman who is not the Chairman of the Board. The structure and functions of the Committee comply with the recommendations in the Guidelines and therefore Listing Rule 12.7.
The primary responsibilities of the Committee are to review and recommend for approval to the Board:
— the integrity of the Consolidated Group’s financial reports and external audit;
— the appropriateness of the Consolidated Group’s accounting policies;
— the effectiveness of the Consolidated Group’s financial reporting controls and procedures;
— the effectiveness of the Consolidated Group’s internal control environment; and
— compliance with relevant laws and regulations.
The current members of the Committee are Mr McKinnon (Chairman), Mr Frayne and Mr Dyer and the qualifications of each member are set out in the Directors’ Report. Meetings of the Committee are attended, by invitation, by the Chief Financial Officer, the Company Secretary, the engagement partner from the Consolidated Group’s external auditor, and such other senior staff or professional advisers as may be appropriate from time to time. The number of meetings of the Committee held during the year is set out in the Directors’ Report. Minutes of all Committee meetings are provided to the Board, and the Chairman of the Committee also reports to the Board after each Committee meeting.
When considering the Committee’s review of financial reports, the Board also receives a written statement in accordance with section 295A of the Corporations Act 2001 signed by the Managing Director and Chief Executive Officer and the Chief Financial Officer affirming that the Consolidated Group’s Financial Report gives a true and fair view, in all material respects, of the Consolidated Group’s financial position and complies in all material respects with relevant accounting standards.
The Audit and Risk Committee Charter is available on the Consolidated Group’s website under the Corporate Governance section.
The Consolidated Group’s external auditor has declared its independence to the Committee during the year. The Committee has examined detailed material provided by the external auditor and by Management and has satisfied itself that the standards for auditor independence and associated issues have been complied with.

46 FKP ANNUAL REPORT 2012
PRINCIPLE 5: MAKE TIMELY AND BALANCED DISCLOSUREThe Consolidated Group has established a Continuous Disclosure Policy and also External Communications and Continuous Disclosure Protocols which are intended to enhance the Consolidated Group’s compliance with the continuous disclosure requirements of the Corporations Act 2001 and the ASX Listing Rules. These documents set out procedures to identify relevant material information, report material information to the Company Secretary for review, and ensure compliance with the continuous disclosure requirements. A copy of the Continuous Disclosure Policy is available on the Consolidated Group’s website under the Corporate Governance section.
The Company Secretary has primary responsibility for communications with the ASX, including responsibility for ensuring compliance with the continuous disclosure requirements of the ASX Listing Rules and overseeing information sent to the ASX and securityholders.
The Directors have obligations under a Disclosure of Interests and Transactions in Securities Agreement entered into by each of them with the Consolidated Group to inform the Consolidated Group of any trading by them in the Consolidated Group’s securities and of any other interests in contracts the Director may have with a Consolidated Group entity.
All significant announcements made by the Consolidated Group to the ASX are published on the Consolidated Group’s website.
PRINCIPLE 6: RESPECT THE RIGHTS OF SHAREHOLDERSThe Consolidated Group aims to keep securityholders informed of the Consolidated Group’s performance and all major developments in an ongoing manner and has established a formal Communications Policy. A copy of the Communications Policy is available on the Consolidated Group’s website under the Corporate Governance section. Information on the Consolidated Group’s activities is communicated to securityholders through:
— the publication of all media releases made by the Consolidated Group on the Consolidated Group‘s website under the News Room section;
— announcements made to the ASX during the course of the year which are also published on the Consolidated Group‘s website under the Corporate Governance section;
— the Annual Report, which is available for distribution to all securityholders (unless specifically requested otherwise);
— the Half Year Financial Report, which contains summarised financial information and a review of the operations during the period since the Annual Report; and
— other correspondence to securityholders as required.
Securityholders are also encouraged to participate in the AGM to ensure a high level of accountability and identification with the Consolidated Group’s strategies and goals. The senior engagement partner of the Consolidated Group’s external auditor attends the Consolidated Group’s AGM and is available to answer questions from securityholders about the conduct of the audit and the preparation and content of the auditor’s report. The Chairman advises the securityholders of this at the commencement of each AGM.
In addition, the AGM and the half year and full year results presentations are webcast and a summary of the transcript of the results presentation is available on the Consolidated Group’s website.
Securityholders can also register with the Consolidated Group’s share registry, Computershare Investor Services, to receive email notification when relevant information, including ASX announcements, is posted onto the Consolidated Group’s website. To further promote the use of electronic communications to securityholders the Consolidated Group has joined the eTree initiative. This is an incentive to encourage securityholders to receive communications from the Consolidated Group, such as Notices of Meetings and Annual Reports, by way of email. Not only does this initiative reduce costs, it also promotes environmental responsibility.
PRINCIPLE 7: RECOGNISE AND MANAGE RISKOversight of the Risk Management Function
The Consolidated Group recognises the importance of managing risk and controlling its business activities in a manner which enables it to maximise profitable opportunities, avoid or reduce risks which may cause injury or loss, ensure compliance with applicable laws and regulations, and enhance resilience to external events.
The Board is responsible for approving and reviewing the Consolidated Group’s risk management strategy and policy. The Board is assisted in its oversight function by the Audit Committee. The active identification of risks and the design and implementation of the risk management framework are the responsibilities of Management, while business units are responsible for integrating the risk management framework within their business processes and systems.
Corporate Governance Statement continued

FKP ANNUAL REPORT 2012 47
Over many years the Board has developed and implemented procedures to ensure that the material risks facing the Consolidated Group are adequately and regularly identified, assessed, monitored and managed throughout the whole organisation. Through the measures referred to below, Management reports to the Board as to the effectiveness of the Consolidated Group’s management of its material business risks:
— annual budgets, divisional business plans and the Consolidated Group’s strategic plan are prepared for approval by Directors;
— actual trading results for the Consolidated Group and each division are presented to the Board at each Board Meeting and compared against budget and forecasts;
— comprehensive Board papers containing relevant operational, strategic, financial and legal information are prepared by each divisional Executive General Manager and circulated to Directors before each Board meeting;
— monthly project reviews are attended by senior management to monitor the progress of each individual project and the risk environment applicable. Material developments or changes are reported to the Board at the next Board meeting;
— financial authority limits have been set by the Board to delegate the Board’s approval process for various matters, including site acquisitions and developments. Where the cost is above those delegated authorities, the approval of the full Board is required; and
— insurance cover appropriate to the size and nature of the Consolidated Group’s operations is carried to reduce the financial impact of any significant insurable losses.
Within the framework, and in addition to the daily management of business activities, each business unit is required to formally profile its risk environment, which is reviewed and updated on a regular basis through a detailed risk register. This includes the identification and review of material risks, providing a risk rating, assessment of the key controls in place to manage the risk and the person(s) responsible for implementing and reviewing controls. The outcome of each risk review is reported on a periodic basis to the Audit Committee. Minutes of the Audit Committee are circulated to the full Board.
It is the responsibility of the Executive Managers of the Consolidated Group to ensure that the risk register is regularly reviewed and updated and to bring any extreme risks promptly to the attention of the Managing Director and Chief Executive Officer and the Chairman for consideration. If it is considered necessary, the Chairman will convene a meeting of the Board to consider and provide direction on how the risk should be managed.
The Board also receives regular updates from the Managing Director and Chief Executive Officer, the Chief Financial Officer, other senior managers and, where relevant, external parties, on material risks faced by the Consolidated Group and the ongoing assessment and level of effectiveness of management of those risks.
The Chief Financial Officer reports in writing to, and attends, all Board meetings. The Chief Financial Officer also attends all meetings of the Audit Committee and provides written reports to that Committee, as required.
In addition, the Audit Committee reviews and reports to the Board in relation to the integrity of the Consolidated Group’s financial reporting, internal control structures and risk management systems with regard to financial risks and the external audit function.
The Consolidated Group has established a Risk Management Policy, which is available on the Consolidated Group’s website under the Corporate Governance section. The Risk Management Policy and underlying procedures are reviewed annually by the Board to ensure their continued application and relevance.
The Consolidated Group has established an internal audit function overseen by external accountants.
The Consolidated Group’s Compliance Committees oversee the operation of the Managed Investment Schemes (‘Schemes’). The Compliance Committees meet on a quarterly basis in order to monitor compliance and risk management systems with the Schemes’ compliance plans and to report on their findings to the Board of FKP Funds Management Limited as Responsible Entity of the Schemes. The Responsible Entity also has a Risk Management Policy in place, which sets out the procedures required to be followed to ensure compliance with its risk management obligations under the Corporations Act 2001 (Cth) and its Australian Financial Services Licence.
Certification of Risk Management Controls
The Managing Director and Chief Executive Officer and the Chief Financial Officer state in writing to the Board each financial year that the declarations made by them in accordance with section 295A of the Corporations Act 2001 (Cth) in relation to the integrity of the Consolidated Group’s Financial Report are founded on a sound system of risk management and internal control and that the system is operating effectively in all material respects in relation to financial reporting risks.
The Statements from the Managing Director and Chief Executive Officer and the Chief Financial Officer are based on a formal sign-off framework established throughout the Consolidated Group and reviewed by the Audit Committee as part of the financial reporting process.

48 FKP ANNUAL REPORT 2012
Corporate Governance Statement continued
PRINCIPLE 8: REMUNERATE FAIRLY AND RESPONSIBLYThe Board has established a Remuneration Committee (‘Committee’) which operates under written terms of reference approved by the Board and embodied in the Remuneration Committee Charter. The Committee assists the Board in fulfilling its corporate governance and oversight responsibilities in relation to the remuneration and incentive framework for the Consolidated Group’s senior executives and Directors.
A copy of the Remuneration Committee Charter is available on the Consolidated Group’s website under the Corporate Governance section.
The Committee comprises three Non-Executive Directors with a majority of Directors being independent. The Committee is chaired by an independent chairman who is not the Chairman of the Board. The structure and functions of the Committee comply with the recommendations in the Guidelines and therefore Listing Rule 12.8.
The primary responsibilities of the Committee are to review and recommend for approval to the Board:
— remuneration policies and practices which are consistent with the Consolidated Group’s strategic goals and which enable the Consolidated Group to attract and retain executives and Directors who will create value for securityholders;
— the quantum and structure of remuneration for Directors and senior executives, having regard to the performance of the Consolidated Group, the performance of the executives and the general remuneration environment; and
— policies and procedures to attract, motivate and retain appropriately skilled persons to meet the Consolidated Group’s needs including remuneration by gender.
The current members of the Committee are Mr McKinnon (Chairman), Mr Lee and Mr Frayne and the qualifications of each member are set out in the Directors’ Report. The Committee may invite any executives of the Consolidated Group and other external advisers to attend any meetings of the Committee; however, no person is responsible for assessing their own performance or solely responsible for recommending the quantum or structure of their own remuneration for Board approval. The number of meetings of the Committee held during the year is set out in the Directors’ Report. Minutes of all Committee meetings are provided to the Board and the Chairman of the Committee also reports to the Board after each Committee meeting.
The structure of Non-Executive Directors’ remuneration and that of senior management is set out in the Remuneration Report within the Directors’ Report. Remuneration packages for senior management involve a balance between fixed and incentive-based remuneration, reflecting short and long-term performance objectives appropriate to the Consolidated Group’s circumstances and goals.
Non-Executive Directors’ remuneration is clearly distinguished from that of senior management, with remuneration solely by way of Directors’ fees, statutory superannuation entitlements, and in the case of certain Directors, participation in the Directors’ Retirement Scheme. That Scheme entitles retiring Non-Executive Directors who were appointed prior to 30 June 2004 and who have held office for at least five years to receive a benefit equal to the amount of remuneration paid to them in the three years preceding retirement. Included in this amount is superannuation accumulated under the Superannuation Guarantee provisions. This scheme has not been approved by securityholders as the scheme complies with that allowed under the Corporations Act 2001. The Board has suspended this scheme for any Non-Executive Directors appointed after 30 June 2004.
Details of the nature and amount of each element of the remuneration of each Director and the key management personnel for the financial year are also disclosed in the Remuneration Report.

FKP ANNUAL REPORT 2012 49
Statements of Comprehensive IncomeFOR THE YEAR ENDED 30 JUNE 2012
Consolidated Group Consolidated Property Trust
2012 2011 2012 2011 Note $m $m $m $m
Continuing operationsSale of goods and construction contract revenue 2 115.8 229.6 – –
Revenue from rendering of services 2 85.4 102.4 15.3 28.2
Other revenue 2 12.6 19.1 23.2 21.5
Revenue 213.8 351.1 38.5 49.7Cost of sales (100.5) (183.2) – –
Gross profit 113.3 167.9 38.5 49.7
Change in fair value of investment properties 10 (367.2) 75.2 (22.1) (12.6)
Change in fair value of resident loans 10 86.7 (6.3) – –
Change in fair value of financial assets/derivative financial liabilities (41.3) 10.2 – –
Employee expenses (36.0) (44.7) – –
Marketing expenses (9.3) (12.6) – –
Occupancy expenses (4.1) (3.8) – –
Administration expenses (15.3) (20.4) (0.9) (1.8)
Loss on sale of investment properties (6.9) (0.6) (6.9) (0.6)
Inventory write-down to net realisable value (51.0) (1.3) – –
Impairment of trade and other receivables (5.3) 2.7 – (1.8)
Impairment of property, plant and equipment 14 (6.3) – – –
Impairment of intangible assets 15 (10.8) (2.0) – –
Other expenses (12.8) (11.8) (5.8) (8.5)
Finance costs 3 (12.9) (26.0) – (8.7)
Share of net loss of associates and joint ventures accounted for using the equity method 11(c) (113.2) (8.3) (0.2) (6.4)
(Loss)/profit from continuing operations before income tax (492.4) 118.2 2.6 9.3Income tax benefit/(expense) 4(a) 132.5 (28.1) – –
(Loss)/profit from continuing operations after income tax (359.9) 90.1 2.6 9.3
Other comprehensive incomeForeign currency translation differences for foreign operations 6.2 (17.4) 0.4 (3.2)
Income tax on items of other comprehensive income (1.8) 4.3 – –
Other comprehensive income for the period, net of tax 4.4 (13.1) 0.4 (3.2)
Total comprehensive income for the period (355.5) 77.0 3.0 6.1
(Loss)/profit for the period is attributable to:Owners of FKP Limited (352.9) 73.0 – –
Non-controlling interests
Members of FKP Property Trust 2.6 9.3 2.6 9.3
Other non-controlling interests 23 (9.6) 7.8 – –
(359.9) 90.1 2.6 9.3
Total comprehensive income for the period is attributable to:Owners of FKP Limited (348.9) 63.1 – –
Non-controlling interest
Owners of FKP Property Trust 3.0 6.1 3.0 6.1
Other non-controlling interest (9.6) 7.8 – –
(355.5) 77.0 3.0 6.1
Earnings per security (cents per security):Basic earnings per stapled security 5 (29.2) 7.0 0.2 0.8
Diluted earnings per stapled security 5 (29.2) 7.0 0.2 0.8
The above statements of comprehensive income should be read in conjunction with the accompanying notes.

50 FKP ANNUAL REPORT 2012
Balance SheetsAS AT 30 JUNE 2012
Consolidated Group Consolidated Property Trust
2012 2011 2012 2011 Note $m $m $m $m
Current assetsCash and cash equivalents 6 18.2 14.5 4.0 2.5Trade and other receivables 7 66.3 42.8 0.5 16.8Inventories 9 257.8 171.0 – –Other financial assets 8 1.6 2.1 – –Assets classified as held for sale 13 155.0 73.5 155.0 73.5Other assets 12 10.4 8.2 1.4 0.9
Total current assets 509.3 312.1 160.9 93.7
Non-current assetsTrade and other receivables 7 7.5 6.9 355.6 249.9Inventories 9 613.7 541.8 – –Investment properties 10 2,427.5 2,857.5 – 158.4Equity-accounted investments 11 159.7 297.9 15.9 19.2Property, plant and equipment 14 23.8 30.7 – –Intangible assets 15 2.8 2.8 – –Other financial assets 8 0.9 2.5 – –Other assets 12 – 4.0 – 4.0
Total non-current assets 3,235.9 3,744.1 371.5 431.5
TOTAL ASSETS 3,745.2 4,056.2 532.4 525.2
Current liabilitiesTrade and other payables 16 56.2 57.8 20.2 3.2Interest bearing loans and borrowings 17 291.6 129.9 12.9 98.2Provision for income tax 4(a) 0.1 – – –Provisions 18 21.5 24.4 9.7 13.1Other financial liabilities 19 23.3 4.8 – –Deferred revenue 95.7 80.5 0.3 0.3
Total current liabilities (excluding resident loans) 488.4 297.4 43.1 114.8Resident loans 1(z) 1,275.5 1,314.2 – –
Total current liabilities 1,763.9 1,611.6 43.1 114.8
Non-current liabilitiesTrade and other payables 16 14.3 19.2 – –Interest bearing loans and borrowings 17 684.0 672.9 92.1 –Deferred tax liabilities 4(d) 70.4 199.6 – –Provisions 18 1.8 1.7 – –Other financial liabilities 19 39.5 19.3 – –Deferred revenue 0.1 0.5 – –
Total non-current liabilities 810.1 913.2 92.1 –
TOTAL LIABILITIES 2,574.0 2,524.8 135.2 114.8
NET ASSETS 1,171.2 1,531.4 397.2 410.4
EquityContributed equity 20 790.9 779.3 522.6 518.3Retained (losses)/profits 21 (48.0) 318.1 (124.4) (106.5)Reserves 21 (41.1) (28.9) (1.0) (1.4)
Total equity attributable to securityholders 701.8 1,068.5 397.2 410.4
Non-controlling interestsFKP Property Trust 397.2 410.4 – –Other non-controlling interest 23 72.2 52.5 – –
Total equity attributable to non-controlling interests 469.4 462.9 – –
TOTAL EQUITY 1,171.2 1,531.4 397.2 410.4
The above balance sheets should be read in conjunction with the accompanying notes.

FKP ANNUAL REPORT 2012 51
Statements of Changes in EquityFOR THE YEAR ENDED 30 JUNE 2012
Attributable to securityholders of FKP Limited
Non- controlling interest attributable Retained to FKP Other non- Share profits/ Property controlling Total capital (losses) Reserves Sub-total Trust interests equity Note $m $m $m $m $m $m $m
Balance at 1 July 2010 769.0 258.0 (12.6) 1,014.4 422.8 37.0 1,474.2
Comprehensive income:
Profit for the period 21,23 – 73.0 – 73.0 9.3 7.8 90.1
Other comprehensive income – – (9.9) (9.9) (3.2) – (13.1)
Total comprehensive income for the period – 73.0 (9.9) 63.1 6.1 7.8 77.0
Transactions with owners in their capacity as owners:
Dividends and distributions provided for 18,22 – (12.9) – (12.9) (22.5) (0.7) (36.1)
Non-controlling interests on consolidation of subsidiaries 23 – – (6.1) (6.1) – 8.4 2.3
Equity settled employee benefits 20,21 0.4 – (0.3) 0.1 0.2 – 0.3
Issue of securities 20 9.9 – – 9.9 3.8 – 13.7
Total transactions with owners in their capacity as owners 10.3 (12.9) (6.4) (9.0) (18.5) 7.7 (19.8)
Balance at 30 June 2011 779.3 318.1 (28.9) 1,068.5 410.4 52.5 1,531.4
Balance at 1 July 2011 779.3 318.1 (28.9) 1,068.5 410.4 52.5 1,531.4
Comprehensive income:
(Loss)/profit for the period 21,23 – (352.9) – (352.9) 2.6 (9.6) (359.9)
Other comprehensive income – – 4.0 4.0 0.4 – 4.4
Total comprehensive income for the period – (352.9) 4.0 (348.9) 3.0 (9.6) (355.5)
Transactions with owners in their capacity as owners:
Dividends and distributions provided for 18,22 – (13.2) – (13.2) (20.5) (0.2) (33.9)
Transactions with non-controlling interests – – 0.6 0.6 – (3.2) (2.6)
Non-controlling interests on consolidation of subsidiaries 23,28 – – – – – 32.7 32.7
Revaluation reserve – – (17.5) (17.5) – – (17.5)
Equity settled employee benefits 20,21 0.4 – 0.7 1.1 – – 1.1
Issue of securities 20 11.2 – – 11.2 4.3 – 15.5
Total transactions with owners in their capacity as owners 11.6 (13.2) (16.2) (17.8) (16.2) 29.3 (4.7)
Balance at 30 June 2012 790.9 (48.0) (41.1) 701.8 397.2 72.2 1,171.2
The above statements of changes in equity should be read in conjunction with the accompanying notes.

52 FKP ANNUAL REPORT 2012
Statements of Changes in Equity continuedFOR THE YEAR ENDED 30 JUNE 2012
Attributable to unit holders of FKP Property Trust
Retained Share capital profits/(losses) Reserves Total equity Note $m $m $m $m
Balance at 1 July 2010 514.3 (93.3) 1.8 422.8
Comprehensive income:
Profit for the period 21 – 9.3 – 9.3
Other comprehensive income – – (3.2) (3.2)
Total comprehensive income for the period – 9.3 (3.2) 6.1
Transactions with owners in their capacity as owners:
Distributions provided for 18, 22 – (22.5) – (22.5)
Issue of securities 20 4.0 – – 4.0
Total transactions with owners in their capacity as owners 4.0 (22.5) – (18.5)
Balance at 30 June 2011 518.3 (106.5) (1.4) 410.4
Balance at 1 July 2011 518.3 (106.5) (1.4) 410.4
Comprehensive income:
Profit for the period 21 – 2.6 – 2.6
Other comprehensive income – – 0.4 0.4
Total comprehensive income for the period – 2.6 0.4 3.0
Transactions with owners in their capacity as owners
Distributions provided for 18, 22 – (20.5) – (20.5)
Issue of securities 20 4.3 – – 4.3
Total transactions with owners in their capacity as owners 4.3 (20.5) – (16.2)
Balance at 30 June 2012 522.6 (124.4) (1.0) 397.2
The above statements of changes in equity should be read in conjunction with the accompanying notes.
FKP ANNUAL REPORT 2012 53
Cash Flow StatementsFOR THE YEAR ENDED 30 JUNE 2012
Consolidated Consolidated Group Property Trust
2012 2011 2012 2011 Note $m $m $m $m
Cash flows from operating activities
Receipts from customers 265.6 436.4 17.9 41.5
Payments to suppliers and employees (246.1) (326.5) (7.0) (16.4)
Interest received 1.6 2.0 0.1 0.3
Finance costs including interest and other costs of finance paid (71.0) (70.0) (6.0) (8.7)
Dividends and distributions received 6.1 20.1 1.1 1.3
GST recovered/(paid) 2.3 (7.6) (0.5) (2.5)
Net cash flows (used in)/from operating activities 24(b) (41.5) 54.4 5.6 15.5
Cash flows from investing activities
Payments for property, plant and equipment (2.1) (1.0) – –
Proceeds from sale of property, plant and equipment 0.1 0.1 – –
Payments for intangible assets (1.2) (1.6) – –
Payments for investment properties, including investment properties classified as held for sale (94.9) (84.3) (22.6) (3.0)
Proceeds from the sale of investment properties 81.9 57.6 81.9 57.6
Payments for equity-accounted investments (14.1) (20.8) – –
Return of equity from equity-accounted investments 6.9 8.6 2.9 7.6
Payments for subsidiaries, net of cash acquired (12.2) (1.4) – –
Loans to related parties – – (114.9) (39.1)
Repayment of loans by related parties – – 61.5 19.9
Net cash flows (used in)/from investing activities (35.6) (42.8) 8.8 43.0
Cash flows from financing activities
Dividends and distributions paid (21.1) (14.5) (19.7) (17.3)
Proceeds from convertible bond issue – 125.0 – –
Transaction costs associated with convertible bond issue – (3.8) – –
Proceeds from borrowings 439.1 403.8 93.8 –
Repayment of borrowings (337.2) (546.7) (87.0) (42.8)
Net cash flows from/(used in) financing activities 80.8 (36.2) (12.9) (60.1)
Net increase/(decrease) in cash and cash equivalents 3.7 (24.6) 1.5 (1.6)
Cash and cash equivalents at the beginning of the year 14.5 39.1 2.5 4.1
Cash and cash equivalents at the end of the year 24(a) 18.2 14.5 4.0 2.5
The above cash flow statements should be read in conjunction with the accompanying notes.

54 FKP ANNUAL REPORT 2012
1. STATEMENT OF SIGNIFICANT ACCOUNTING POLICIESFKP Property Group (‘Consolidated Group’) is a group domiciled and incorporated in Australia. FKP Property Group’s registered office and its principal place of business is Level 5, 120 Edward Street, Brisbane, Queensland, 4000. The financial report of FKP Property Group consists of the financial statements of the Consolidated Group comprising FKP Limited (‘Parent Entity’) and its controlled entities and FKP Property Trust (‘Property Trust’) and its controlled entities (‘Consolidated Property Trust’). None of the entities whose securities are stapled is a parent of the other entity and the entities do not have a common parent. The financial report has been drawn up in accordance with ASIC Class Order 05/642 relating to combining accounts under stapling and for the purpose of fulfilling the requirements of the ASX. The financial report is presented in Australian dollars.
The significant accounting policies adopted in the preparation of the financial report are set out below. These policies have been consistently applied to all years presented, unless otherwise stated.
(a) Basis of preparation
This general purpose financial report has been prepared in accordance with the requirements of the Corporations Act 2001, Australian Accounting Standards and other authoritative pronouncements of the Australian Accounting Standards Board. The financial report has been prepared on a historical cost basis except for ‘financial assets and liabilities at fair value through profit or loss’, investment property and ‘non-current assets held for sale’, which have been measured at fair value.
The financial report also complies with International Financial Reporting Standards (‘IFRS’) as issued by the International Accounting Standards Board.
Stapling
On 12 November 2004, under an arrangement approved by the courts and FKP Limited shareholders, FKP Property Trust units were stapled to FKP Limited shares. The Consolidated Group is a Stapled Entity which comprises FKP Limited (‘Parent Entity’) and its controlled entities and FKP Property Trust (‘Property Trust’) and its controlled entities. The Consolidated Group was established for the purpose of facilitating a joint quotation of the Property Trust and the Parent Entity on the ASX. The stapled securities cannot be traded or dealt with separately.
The constitutions of the Parent Entity and the Property Trust ensure that, for as long as the two entities remain jointly quoted, the number of units in the Property Trust and the number of shares in the Parent Entity shall be equal and that unit holders and shareholders will be identical, except for 10 units in the Property Trust owned by the Parent Entity.
FKP Limited has been identified as the acquirer and the parent for the purposes of preparing the Consolidated Group’s financial statements. The Property Trust has been consolidated under the stapling arrangement and is identified as the acquiree.
The net assets of the acquiree have been identified as non-controlling interests and presented in the balance sheet within equity, separately from the Parent Entity’s equity. The profit of the acquiree has also been separately disclosed in the statement of comprehensive income.
Although the interests of the equity holders of the acquiree are treated as non-controlling interests, the equity holders of the acquiree are also the equity holders in the acquirer by virtue of the stapling arrangement.
(b) New accounting standards and interpretations
There were no new standards and interpretations adopted since the Annual Financial Report for the year ended 30 June 2011, deemed to have a material impact on the financial statements or performance of the Consolidated Group.
The following standards, amendments to standards and interpretations have been identified as those which may impact the Consolidated Group in the period of initial application. They have not been applied in preparing these financial statements:
AASB 9: ‘Financial Instruments: Classification and Measurement’
This standard specifies new recognition and measurement requirements for financial assets and liabilities within the scope of AASB 139. It requires financial assets to be measured at fair value through the profit and loss unless the criteria for amortised cost measurement are met or the entity qualifies and elects to recognise gains and losses on equity securities that are not held for trading directly in other comprehensive income. The standard is applicable for annual reporting periods beginning on or after 1 January 2015. The Consolidated Group has assessed the impact of this standard and deemed there to be no material impact on the financial statements of the Consolidated Group in the period of initial application.
AASB 10: ‘Consolidated Financial Statements’
This standard replaces AASB 127: ‘Consolidated and Separate Financial Statements’ and is applicable for the annual period beginning on or after 1 January 2013. This new standard introduces a new definition of control that determines which entities are consolidated. This new definition of control may potentially lead to the consolidation of entities that were not previously included in the Consolidated Group resulting in more assets and liabilities on the books. The Consolidated Group has assessed the impact of this standard and deemed there to be no material impact on the financial statements of the Consolidated Group in the period of initial application.
Notes to the Financial StatementsFOR THE YEAR ENDED 30 JUNE 2012

FKP ANNUAL REPORT 2012 55
AASB 11: ‘Joint Arrangements’
This standard replaces AASB 131: ‘Interests in Joint Ventures’ and is applicable for annual periods beginning on or after 1 January 2013. This new standard introduces new rules which classify joint arrangements as either a joint operation or a joint venture. Under the new standard, proportionate consolidation is not allowed and all joint ventures must be equity accounted. All joint arrangements held by the Consolidated Group will need to be reassessed to determine whether the joint operation or joint venture classification is appropriate, and therefore the potential impacts of a change on the presentation of the financial statements. The Consolidated Group has assessed the impact of this standard and deemed there to be no material impact on the financial statements of the Consolidated Group in the period of initial application.
AASB 12: ‘Disclosure of Interests in Other Entities’
This standard is applicable for annual reporting periods beginning on or after 1 January 2013. This standard sets out the required disclosures for entities reporting under the two new standards, AASB 10 and AASB 11, and replaces the disclosure requirements currently found in AASB 127 and AASB 128. Application of this standard by the Consolidated Group will not affect any of the amounts recognised in the financial statements, but will impact the type of information disclosed in relation to the Consolidated Group’s investments.
AASB 13: ‘Fair Value Measurement’
This standard establishes a single source of guidance for determining the fair value of assets and liabilities. The Consolidated Group has assessed the impact of this new standard and deemed there to be no material impact on the Consolidated Group in future reporting periods.
Revised AASB 119: ‘Employee Benefits’
The revisions to this standard result in significant changes in accounting for defined benefit pension plans. There are also a number of other changes including modifications to the timing of recognition for termination benefits, the classification of short-term benefits and
disclosures of deferred benefit plans. The Consolidated Group does not have defined benefit pension plans. Management does not expect there to be material impact on the Consolidated Group in future reporting periods.
There are no other standards that are not yet effective and that are expected to have a material impact on the entity in the current or future reporting periods.
(c) Basis of consolidation
The Consolidated Group financial statements comprise the financial statements of FKP Limited (‘Parent Entity’) and its controlled entities and FKP Property Trust (‘Property Trust’) and its controlled entities (‘Consolidated Property Trust’) as at and for the year ended 30 June 2012.
Subsidiaries are all those entities over which the Consolidated Group has the power to govern the financial and operating policies so as to obtain benefits from their activities. The existence and effect of potential voting rights that are currently exercisable or convertible are considered when assessing whether a group controls another entity.
The financial statements of the subsidiaries are prepared for the same reporting period as the parent company, using consistent accounting policies. In preparing the consolidated financial statements, all intercompany balances, transactions, unrealised gains and losses resulting from intra-group transactions and dividends are eliminated in full. The financial statements of controlled entities are included in the financial report from the date that control commences until the date that control ceases.
Investments in subsidiaries held by the Consolidated Group are accounted for at cost in the separate financial statements of the Parent Entity less any impairment charges. Dividends received from subsidiaries are recorded as a component of other revenues in the separate income statement of the Parent Entity, and do not impact the recorded cost of the investment. Upon receipt of dividend payments from subsidiaries, the parent will assess whether any indicators of impairment of the carrying value of the investment in the subsidiary exist.
Where such conditions exist, to the extent that the carrying value of the investment in the subsidiary exceeds its recoverable amount, an impairment loss is recognised.
The acquisition of subsidiaries is accounted for using the acquisition method of accounting. The acquisition method of accounting involves recognising at acquisition date, separately from goodwill, the identifiable assets acquired, the liabilities assumed and any non-controlling interest in the acquiree. The identifiable assets acquired and the liabilities assumed are measured at their acquisition date fair values (see Note 1(q)).
After initial recognition, goodwill is measured at cost less any accumulated impairment losses. For the purpose of impairment testing, goodwill acquired in a business combination is, from the acquisition date, allocated to each of the Consolidated Group’s cash-generating units that are expected to benefit from the combination, irrespective of whether other assets or liabilities of the acquirer are assigned to those units.
Where goodwill forms part of a cash-generating unit and part of the operation within that unit is disposed of, the goodwill associated with the operation disposed of is included in the carrying amount of the operation when determining the gain or loss on disposal of the operation. Goodwill disposed of in this circumstance is measured based on the relative values of the operation disposed of and the portion of the cash-generating unit retained.
Non-controlling interests in the net assets of consolidated entities are allocated their share of net profit after tax in the statement of comprehensive income, and are presented within equity in the balance sheet, separately from the equity of the owners of the Parent. Losses are attributed to the non-controlling interest even if that results in a deficit balance. A change in ownership interest of a subsidiary that does not result in loss of control is accounted for as an equity transaction.

56 FKP ANNUAL REPORT 2012
Notes to the Financial Statements continuedFOR THE YEAR ENDED 30 JUNE 2012
1. STATEMENT OF SIGNIFICANT ACCOUNTING POLICIES CONTINUED(d) Going concern
The balance sheet of the Consolidated Group discloses total current assets of $509.3m and total current liabilities of $1,763.9m. This largely arises because resident loans are classified in full as a current liability, whereas the asset to which the loans relate, investment properties, is classified as a non-current asset. Resident loans are classified as a current liability because the Consolidated Group does not have an unconditional right to defer settlement of resident loans for at least 12 months after the reporting period. In practice, the rate at which the Consolidated Group’s retirements’ residents vacate their units, and hence the rate at which the resident loans will fall due for repayment, can be estimated on the basis of statistical tables.
The Consolidated Group’s best estimate is that of the total resident loans of $1,275.5m, only $120.0m is statistically likely to be paid within the next 12 months. Further, if this amount was repayable, it is estimated that incoming contributions of more than $182.9m would be received from new residents.
After excluding those resident loans not expected to be payable within the next 12 months, current assets exceed current liabilities by $20.9m. Included in current liabilities is $276.3m of interest bearing bank debt maturing in the next 12 months. This includes a $79.8m project finance facility that will be settled following the completion of Aerial and a $43.6m facility related to Port Bouvard. There is no recourse to FKP in respect of the Port Bouvard facility. Also included in current liabilities is a $122.9m bank facility which is due to expire on 30 June 2013. While the Consolidated Group’s statement of financial position classifies this banking facility as current, there has been a significant amount of work undertaken regarding the renewal or refinancing of this facility with a number of financial institutions. The Directors are confident that the renewal or refinancing of this facility will be executed prior to the expiration date.
The Consolidated Group announced its intention to undertake a capital raise on 28 August 2012. The capital raise is designed to strengthen the Consolidated Group’s capital position, reduce leverage levels and improve liquidity.
The proposed capital raise will be structured as a 6 for 7 entitlement offer and will raise gross proceeds of $208m. Rosetec Investments Limited, Mulpha Australia Limited, Mulpha Strategic Limited and HDFI Nominees Pty Ltd (each a Mulpha Entity and collectively Mulpha Entities) have made irrevocable commitments to take up their pro-rated entitlement of $54.1m. The capital raise is fully underwritten subject to the usual terms and conditions associated with underwriting arrangements. The capital raise will become unconditional following the close of the Retail Offer on 17 September 2012. The Consolidated Group considers it likely that the terms and conditions will be met and therefore that the capital raise will complete with the full $208m gross proceeds raised.
Whilst unlikely, in the event that the terms and conditions of the underwriting agreement are not satisfied, the Mulpha Entities irrevocable commitment means that the minimum guaranteed capital raise is $54.1m gross proceeds. Under this scenario, the Consolidated Group will need to complete a number of asset sales in order to meet working capital requirements during the next 12 months.
After considering all available current information, the Directors have concluded that there are reasonable grounds to believe that the Consolidated Group will be able to pay its debts as and when they fall due and payable and the basis of preparation of the financial report on a going concern basis is appropriate.
(e) Revenue recognition
Revenue is recognised and measured at the fair value of the consideration received or receivable to the extent that it is probable that the economic benefits will flow to the Consolidated Group and the revenue can be reliably measured. No revenue is recognised if there is significant uncertainty regarding recoverability of the consideration due, if the costs incurred or to be incurred cannot be measured reliably or there is continual Management involvement to the degree usually associated with ownership. The following specific criteria must also be met before revenue is recognised:
Sale of goods(i) Land subdivision
Revenues from land subdivisions are recognised upon settlement of the contract of sale.
(ii) Residential development properties
Revenues from the sale of residential development properties are recognised when the developments are completed and sales are settled.
(iii) Commercial development projects
Revenues from commercial development projects, being the development of commercial property, are recognised upon 100 per cent completion of the project and on the exchange of unconditional sales contracts.
(iv) Construction contracts
Construction revenue received under fixed price contracts is recognised in accordance with the percentage of completion method. Stage of completion is measured by reference to actual costs incurred as a percentage of estimated total costs for each contract. Where it is probable that a loss will arise from a construction contract, the excess of total costs over revenue is recognised as an expense immediately. No revenue is recognised if there are significant uncertainties regarding recovery of the consideration due, the costs incurred or to be incurred cannot be measured reliably, or there is continuing Management involvement to the degree usually associated with ownership.

FKP ANNUAL REPORT 2012 57
The percentage of completion and the revenue to recognise are determined on the basis of a large number of estimates. The Consolidated Group has an internal financial budgeting and reporting system as well as monthly project reviews which enable it to review each month the estimates of contract revenue and contract costs as the contracts progress.
Rendering of services
When the outcome of a contract to provide services can be estimated reliably, revenue is recognised by reference to the percentage of the services performed, specifically:
(i) Deferred Management Fees (‘DMF’)
DMF revenue on retirement village assets is earned while the resident occupies the independent living unit or serviced apartment and is recognised as income over the resident’s expected tenure. The expected tenure is calculated with reference to Australian Bureau of Statistics current data relating to life expectancy and historical trends of roll-overs within the Consolidated Group. DMF revenue is not discounted to present value, as the income is earned by reducing the existing resident loan.
More specifically:
— ‘entry’ based contracts calculate the expected final DMF receivable based on the entry market value amortised over the expected average period of tenure of the resident; and
— ‘exit’ based contracts calculate the expected DMF receivable based on the current market value amortised over the expected average period of tenure of the resident.
(ii) Gross rental income
Rental income from operating leases is recognised on a straight-line basis over the lease term. Rent not received at balance date is reflected in the balance sheet as a receivable or if paid in advance, as deferred revenue. Lease incentives granted are recognised over the lease term, on a straight-line basis, as a reduction of rent.
(iii) Interest revenue
Interest revenue is recognised in the statement of comprehensive income as it accrues using the effective interest method and if not received at balance date, is reflected in the balance sheet as a receivable.
(iv) Management fee revenue
Management fees are recognised when the relevant entity has performed the associated services to which the management fees relate.
(v) Government grants
Grants from the government are recognised at their fair value when there is reasonable assurance that the grant will be received and the Consolidated Group will comply with all attached conditions.
Government grants relating to costs are deferred and recognised in the statement of comprehensive income over the period necessary to match them with the costs that they are intended to compensate for.
(vi) Dividends and distributions
Revenue from dividends and distributions from controlled entities and other investments are recognised in the statement of comprehensive income on the date the entity’s right to receive payment is established, being the date when they are declared by those entities.
(f) Goods and services tax (‘GST’)
Revenues, expenses and assets (other than receivables) are recognised net of the amount of GST, except:
— when the GST incurred on a purchase of goods and services is not recoverable from the taxation authority, in which case the GST is recognised as part of the cost of acquisition of the asset or as part of the expense item as applicable; and
— receivables and payables, which are stated with the amount of GST included.
The net amount of GST recoverable from, or payable to, the taxation authority, is included as part of receivables or payables in the balance sheet. Cash flows are included in the cash flow statements on a gross basis and the GST component of cash flows arising from investing and financing activities, which is recoverable from, or payable to, the taxation authority is classified as part of operating cash flows.
(g) Income tax
Current tax assets and liabilities for the current period are measured at the amount expected to be recovered from or paid to the taxation authorities based on the current period’s taxable income. The tax rates and tax laws used to compute the amount are those that are enacted or substantively enacted at the reporting date.
Current income tax relating to items recorded directly in equity is recognised in equity and not in the statement of comprehensive income. Management periodically evaluates positions taken in the tax returns with respect to situations in which applicable tax regulations are subject to the interpretation and establishes provisions where appropriate.
Deferred income tax is provided on all temporary differences at the reporting date between the tax bases of assets and liabilities and their carrying amount for financial reporting purposes.
Deferred income tax liabilities are recognised for all taxable temporary differences except:
— when the deferred income tax liability arises from the initial recognition of goodwill or of an asset or liability in a transaction that is not a business combination and that, at the time of the transaction, affects neither the accounting profit nor taxable profit or loss; or
— when the taxable temporary difference is associated with investments in subsidiaries, associates or interests in joint ventures, and the timing of the reversal of the temporary difference can be controlled and it is probable that the temporary difference will not reverse in the foreseeable future.

58 FKP ANNUAL REPORT 2012
1. STATEMENT OF SIGNIFICANT ACCOUNTING POLICIES CONTINUED(g) Income tax continued
Deferred income tax assets are recognised for all deductible temporary differences, carry-forward or unused tax credits and unused tax losses, to the extent that it is probable that taxable profit will be available against which the deductible temporary differences and the carry-forward of unused tax credits and unused tax losses can be utilised, except:
— where the deferred income tax asset relating to the deductible temporary difference arises from the initial recognition of an asset or liability in a transaction that is not a business combination and, at the time of the transaction, affects neither the accounting profit nor taxable profit or loss; or
— when the deductible temporary difference is associated with investments in subsidiaries, associates or joint ventures, in which case a deferred tax asset is only recognised to the extent that it is probable that the temporary difference will reverse in the foreseeable future and taxable profit will be available against which the temporary difference can be utilised.
The carrying amount of deferred income tax assets is reviewed at each reporting date and reduced to the extent that it is no longer probable that sufficient taxable profit will be available to allow all or part of the deferred income tax asset to be utilised. Unrecognised deferred income tax assets are reassessed at each reporting date and are recognised to the extent that it has become probable that future taxable profit will allow the deferred tax asset to be recovered.
Deferred income tax assets and deferred income tax liabilities are measured at the tax rates that are expected to apply to the financial year when the asset is realised or the liability is settled, based on tax rates (and tax laws) that have been enacted or substantively enacted at the reporting date.
Deferred income tax assets and deferred income tax liabilities are offset only if a legally enforceable right exists to set off current tax assets against current tax liabilities and the deferred tax assets and liabilities relate to the same taxable entity and the same taxation authority.
Tax Consolidation Legislation
FKP Limited and its wholly-owned Australian controlled entities have implemented the tax consolidation legislation as of 1 July 2003.
The Head Entity, FKP Limited, and the controlled entities in the tax consolidated group continue to account for their own current and deferred tax amounts. These tax amounts are measured as if each entity in the tax consolidated group continues to be a standalone taxpayer in its own right.
In addition to its own current and deferred tax amounts, FKP Limited also recognises the current tax liabilities (or assets) and the deferred tax assets arising from unused tax losses and unused tax credits assumed from controlled entities in the tax consolidated group to the extent that it is probable that future taxable profits of the tax consolidated group will be available against which the asset can be utilised.
The entities in the tax consolidated group have entered into a tax sharing agreement to limit the joint and several liability of the wholly-owned entities in the case of a default by the Head Entity. A tax funding agreement where the wholly-owned entities fully compensate the Head Entity for any current tax receivable and deferred tax assets related to unused tax losses or unused tax credits that are transferred to the Head Entity under the tax consolidation legislation has also been entered into. The transfer of such amounts to the Head Entity is recognised as intercompany receivables or payables.
Trust Taxation
Under current tax legislation the Property Trust is not liable for income tax, provided the taxable income and taxable capital gains are fully distributed to unit holders each year. The Property Trust fully distributes its taxable income in accordance with the Trust Deed. Tax allowances for buildings and plant and equipment are distributed to unit holders in the form of a tax deferred component of distributions.
Tax losses and realised capital losses are not distributed to unit holders but are carried forward in the Property Trust to be offset against future taxable income and capital gains of the Property Trust.
Taxation of Financial Arrangements (TOFA)
Legislation is in place which changes the tax treatment of financial arrangements. The Consolidated Group has assessed the potential impact of these changes on the Consolidated Group’s tax position. No impact has been recognised and no adjustments have been made to the deferred tax and income tax balances at 30 June 2012 (2011: $nil). To date the Consolidated Group has made no elections under the TOFA rules.
(h) Cash and cash equivalents
Cash and cash equivalents on the balance sheet comprise cash at bank and in hand and short-term deposits with an original maturity of three months or less that are readily convertible to known amounts of cash and which are subject to an insignificant risk of changes in value.
For the purposes of the cash flow statements, cash and cash equivalents consist of cash and cash equivalents as defined above, net of outstanding bank overdrafts. Bank overdrafts are included within interest-bearing loans and borrowings in current liabilities on the balance sheet.
Notes to the Financial Statements continuedFOR THE YEAR ENDED 30 JUNE 2012

FKP ANNUAL REPORT 2012 59
(i) Other financial assets
Financial assets in the scope of AASB 139: ‘Financial Instruments: Recognition and Measurement’ are classified as either ‘financial assets at fair value through profit or loss’, ‘held-to-maturity investments’, ‘loans and receivables’ or ‘available-for-sale financial assets’. The classification depends on the purpose for which the investments were acquired. Designation is re-evaluated at each reporting date, but there are restrictions on reclassifying to other categories.
When financial assets are recognised initially, they are measured at fair value plus, in the case of investments not at fair value through profit or loss, directly attributable transaction costs.
Recognition and derecognition
All regular way purchases and sales of financial assets are recognised on the trade date, i.e. the date that the Consolidated Group commits to purchase the asset. Regular way purchases or sales are financial assets under contracts that require delivery of the assets within the period established generally by regulation or convention in the market place. Financial assets are derecognised when the right to receive cash flows from the financial assets has expired or when the entity transfers substantially all of the risks and rewards of the financial assets. If the entity neither retains nor transfers substantially all of the risks and rewards it derecognises the assets if it has transferred control of the assets.
Subsequent measurement(i) Financial assets at fair value through profit or loss
Financial assets classified as ‘held for trading’ are included in the category ‘financial assets at fair value through profit or loss’. Financial assets are classified as ‘held for trading’ if they are acquired for the purpose of selling in the near term with the intention of making a profit. Derivatives are also classified as ‘held for trading’ unless they are designated as effective hedging instruments. Gains or losses on financial assets ‘held for trading’ are recognised in profit or loss.
(ii) Held-to-maturity investments
‘Held-to-maturity investments’ are non-derivative financial assets with fixed or determinable payments and fixed maturities that Management has a positive intention and ability to hold to maturity. If the Consolidated Group was to sell more than an insignificant amount of ‘held-to-maturity’ financial assets, the whole category would be tainted and reclassified as ‘available-for-sale’. ‘Held-to-maturity’ financial assets are included in non-current assets, with the exception of those with maturities less than 12 months from the end of the reporting period, which are classified as current assets.
(iii) Loans and receivables
‘Loans and receivables’ are non-derivative financial assets with fixed or determinable payments that are not quoted in an active market. Such assets are carried at amortised cost using the effective interest rate method. Gains or losses are recognised in profit or loss when the ‘loans and receivables’ are derecognised or impaired. These are included in current assets, except for those with maturities greater than 12 months after balance date, which are classified as non-current.
(iv) Available-for-sale assets
‘Available-for-sale’ assets are those non-derivative financial assets that are designated as ‘available-for-sale’ or are not classified as any of the three preceding categories. After initial recognition, ‘available-for-sale’ assets are measured at fair value with gains or losses being recognised as a separate component of equity until the investment is derecognised or until the investment is determined to be impaired, at which time the cumulative gain or loss previously reported in equity is recognised in profit or loss.
The fair values of investments that are actively traded in organised financial markets are determined by reference to quoted market bid prices at the close of business on the balance sheet date. For investments with no active market, fair values are determined using valuation techniques. Such techniques include: using recent arm’s length market transactions; reference to the current market value of another instrument that is substantially the same; discounted cash flow analysis; and option pricing models.
(j) Investments in associates
The Consolidated Group’s investments in its associates are accounted for using the equity method of accounting in the Consolidated financial statements and at cost in the Parent. The Associates are entities over which the Consolidated Group has significant influence and that are neither subsidiaries nor joint ventures.
Under the equity method, investments in associates are carried in the consolidated balance sheet at cost plus post-acquisition changes in the Consolidated Group’s or Consolidated Property Trust’s share of net assets of the associates. Goodwill relating to an associate is included in the carrying amount of the investment and is not amortised. After application of the equity method, the Consolidated Group determines whether it is necessary to recognise any impairment loss with respect to the Consolidated Group’s net investments in associates. Goodwill included in the carrying amount of the investments in associates is not tested separately, rather the entire carrying amount of the investments is tested for impairment as a single asset. If an impairment is recognised, the amount is not allocated to the goodwill of the associate.
The Consolidated Group and Consolidated Property Trust’s share of an associate’s profits or losses is recognised in the statement of comprehensive income, and its share of movements in reserves is recognised in reserves. The cumulative movements are adjusted against the carrying amount of the investment. Dividends receivable from associates are recognised as a reduction in the equity accounted investment in the Consolidated Group’s financial statements.

60 FKP ANNUAL REPORT 2012
Notes to the Financial Statements continuedFOR THE YEAR ENDED 30 JUNE 2012
1. STATEMENT OF SIGNIFICANT ACCOUNTING POLICIES CONTINUED(j) Investments in associates continued
After application of the equity method, the Consolidated Group determines whether it is necessary to recognise an additional impairment loss on investments in associates. The Consolidated Group determines at each reporting date whether there is any objective evidence that the investment in the associate is impaired. If this is the case, the Consolidated Group calculates the amount of impairment as the difference between the recoverable amount of the associate and its carrying value and recognises the amount in the ‘share of net profit of associates accounted for using the equity method’ in the statement of comprehensive income.
When the Consolidated Group and Consolidated Property Trust’s share of losses in an associate equals or exceeds its interest in the associate, including any unsecured long-term receivables and loans, the Group does not recognise further losses, unless it has incurred obligations or made payments on behalf of the associate.
(k) Interests in jointly controlled operations
A joint venture is a contractual arrangement whereby two or more parties undertake an economic activity that is subject to joint control. A jointly controlled operation involves the use of assets and other resources of the venturers rather than the establishment of a separate entity. The Consolidated Group recognises its interests in the jointly controlled operations by recognising its interest in the assets and liabilities of the joint venture. The Consolidated Group also recognises the expense that it incurs and its share of the income that it earns from the sale of goods or services by the jointly controlled operation.
(l) Interests in jointly controlled entities
Interests in jointly controlled entities in which the Consolidated Group is a venturer (and so has joint control) are accounted for under the equity method in the consolidated financial statements. Details of the jointly controlled entities are set out in Note 11.
(m) Trade and other receivables
Trade and other receivables are recognised initially at fair value and subsequently measured at amortised cost using the effective interest method, less any allowance for impairment.
Collectability of trade and other receivables is reviewed on an ongoing basis at an operating unit level. Individual debts that are known to be uncollectible are written off when identified. An impairment provision is recognised when there is objective evidence that the Consolidated Group will not be able to collect the receivable. The amount of the impairment loss is the receivable carrying amount compared to the present value of estimated future cash flows, discounted at the original effective interest rate.
(n) Inventories
Inventories are carried at the lower of cost and net realisable value. Net realisable value is determined on the basis of sales for each class of inventory in the ordinary course of business less estimated costs of completion and the estimated costs necessary to make the sale.
Development work in progress
Costs have been assigned to inventory quantities on hand at balance date using the first-in first-out basis. Cost comprises all costs of purchase and conversion including material, labour, sub-contract charges and direct contract expenses and an appropriate proportion of fixed and variable overheads.
The amount of any write-down of inventories to net realisable value is recognised as an expense in the statement of comprehensive income. The amount of any reversal of write-down of inventory arising from a change in the circumstances that gave rise to the original write-down, is recognised as a reduction in the impairment of inventories recognised as an expense on the statement of comprehensive income.
Property held for resale
Development properties are stated at the lower of cost and net realisable value. Cost includes the costs of acquisition, development and holding costs such as borrowing costs, rates and taxes. Holding costs are capitalised where the development is regarded as a qualifying asset. Holding costs incurred after completion of development are expensed.
(o) Property, plant and equipment
Property, plant and equipment are stated at historical cost less accumulated depreciation and any accumulated impairment losses. Such cost includes the cost of replacing parts that are eligible for capitalisation when the cost of replacing the parts is incurred. All other repairs and maintenance are recognised in the statement of comprehensive income as incurred.
All items of property, plant and equipment, other than freehold and leasehold land, are depreciated using the straight-line method.
Depreciation rates used are as follows:
Depreciation rate
Residential aged care facilities 2.5%
Freehold buildings 2.5%
Leasehold improvements 2.5% – 20.0%
Plant and equipment 6.0% – 40.0%
Plant and equipment (leased asset) 7.5% – 20.0%
These rates are consistent with the prior year.
The assets’ residual values, useful lives and amortisation methods are reviewed, and adjusted if appropriate, at each financial year end.

FKP ANNUAL REPORT 2012 61
Gains and losses on disposal are determined by comparing proceeds with the carrying amount. These are included in the statement of comprehensive income.
An item of property, plant and equipment is derecognised upon disposal or when no further future economic benefits are expected from its use or disposal.
(p) Investment properties
Investment properties comprise investment interests in land and buildings (including integral plant and equipment) held for the purpose of letting to produce rental income, capital appreciation, or both.
Investment properties are measured initially at cost, including transaction costs. The carrying amount includes the cost of replacing part of an existing investment property when that cost is incurred if it is probable that the future economic benefits embodied within the item will flow to the Consolidated Group and the cost can be measured reliably. All other costs are recognised in the statement of comprehensive income as an expense as incurred. The gain or loss on disposal of revalued assets is calculated as the difference between the carrying amount of the asset at the time of disposal and the net proceeds on disposal and is included in the statement of comprehensive income in the year of disposal. Subsequent to initial recognition, investment properties are measured at fair value, representing open-market value determined annually/bi-annually by internal and external valuations. Gains or losses arising from changes in the fair values of investment properties are recognised in the statement of comprehensive income in the year in which they arise.
Investment property under construction represents works in progress which are classified as investment properties and stated at fair value at each balance date, with fair value movements recognised in the statement of comprehensive income in the year in which they arise. Where the Consolidated Group determines that the fair value of an investment property under construction is not reliably determinable, the investment property under construction is measured at cost until either its fair value becomes reliably determinable or
construction is completed (whichever is earlier). Fair value is assessed with reference to the percentage completion of the development, reliable estimates of future cash flows, risks associated with the forecast completion of the asset, forecast cost of the development and current market evidence for similar assets.
For a transfer from investment property to owner-occupied property or inventories, the deemed cost of property for subsequent accounting is its fair value at the date of change in use. If the property occupied by the Consolidated Group as an owner-occupied property becomes an investment property, the Consolidated Group accounts for such property in accordance with the policy stated under property, plant and equipment up to the date of change in use. For a transfer from inventories to investment property, any difference between the fair value of the property at that date and its previous carrying amount is recognised in the statement of comprehensive income.
Retirement villages
Retirement villages are investment properties held to earn revenues and capital appreciation over the long-term comprising independent living units, serviced apartments, common facilities and integral plant and equipment.
Refer to Note 10(b) for details on the valuation basis for retirement villages.
Commercial and retail properties
The carrying amount of investment properties is the fair value of the property as determined by a registered appraiser having a recognised professional qualification and recent experience in the location and category of property being valued. Fair values were determined having regard to recent market transactions of similar properties in similar locations to the Consolidated Group’s investment properties. Where external valuations are not obtained within the financial year, an internal Directors’ valuation is performed.
Refer to Note 10(a) for details on the valuation basis for commercial and retail properties.
(q) Business combinations
Business combinations are accounted for using the acquisition method. The consideration transferred in a business combination shall be measured at fair value, which shall be calculated as the sum of the acquisition-date fair values of the assets transferred by the acquirer, the liabilities incurred by the acquirer to former owners of the acquiree and the equity issued by the acquirer, and the amount of any non-controlling interest in the acquiree measured at either fair value or at the proportionate share of the acquiree’s identifiable net assets. Acquisition-related costs are expensed as incurred, and included in administrative expenses.
When the Consolidated Group acquires a business, it assesses the financial assets and liabilities assumed for appropriate classification and designation in accordance with the contractual terms, economic conditions, the Consolidated Group’s operating or accounting policies and other pertinent conditions as at the acquisition date. This includes the separation of embedded derivatives in host contracts by the acquiree.
If the business combination is achieved in stages, the acquisition date fair value of the acquirer’s previously held equity interest in the acquiree is remeasured to fair value at the acquisition date through profit or loss.
Any contingent consideration to be transferred by the acquirer will be recognised at the fair value at the acquisition date. Subsequent changes to the fair value of the contingent consideration which is deemed to be an asset or liability will be recognised in accordance with AASB 139: ‘Financial Instruments: Recognition and Measurement’ in the statement of comprehensive income. If the contingent consideration is classified as equity, it should not be remeasured until it is finally settled within equity.

62 FKP ANNUAL REPORT 2012
Notes to the Financial Statements continuedFOR THE YEAR ENDED 30 JUNE 2012
1. STATEMENT OF SIGNIFICANT ACCOUNTING POLICIES CONTINUED(r) Non-current assets classified as held for sale
Non-current assets are classified as ‘held for sale’ if the carrying amount will be recovered principally through a sale transaction rather than the continuing use. This condition is regarded as met only when the asset is available for immediate sale in its present condition subject only to terms that are usual and customary for such a sale and the sale is highly probable. The sale must be expected to be completed within a year from the date of classification, except in the circumstances out of the Consolidated Group’s control and the Consolidated Group remains committed to a sale.
Investment properties which are classified as ‘non-current assets classified as held for sale’ are carried at fair value as the measurement provisions of AASB 5: ‘Non-current assets held for sale and discontinued operations’ do not apply to investment properties.
Non-current assets are not depreciated or amortised while they are classified as ‘held for sale’.
(s) Impairment of assets(i) Financial assets
A financial asset is assessed at each reporting date to determine whether there is any objective evidence that it is impaired. A financial asset is considered to be impaired if objective evidence indicates that one or more events have had a negative effect on the estimated future cash flows of that asset.
An impairment loss in respect of a financial asset measured at amortised cost is calculated as the difference between its carrying amount, and the present value of the estimated future cash flows discounted at the original effective interest rate. An impairment loss in respect of an ‘available-for-sale’ financial asset is calculated by reference to its fair value.
Individually significant financial assets are tested for impairment on an individual basis. The remaining financial assets are assessed collectively in groups that share similar credit risk characteristics.
All impairment losses are recognised in the statement of comprehensive income. Any impairment loss is reversed if the reversal can be related objectively to an event occurring after the impairment loss was recognised. For financial assets measured at amortised cost, the reversal is recognised in the statement of comprehensive income. For ‘available-for-sale’ financial assets that are equity securities, the reversal is recognised directly in equity.
(ii) Non-financial assets other than goodwill and indefinite life intangibles
Non-financial assets other than goodwill and indefinite life intangibles are tested for impairment whenever events or changes in circumstances indicate that the carrying amount may not be recoverable. If any indication of impairment exists, an estimate of the asset’s recoverable amount is calculated.
An impairment loss is recognised for the amount by which the asset’s carrying amount exceeds its recoverable amount. Recoverable amount is the higher of an asset’s fair value less costs to sell and value in use. For the purposes of assessing impairment, assets are grouped at the lowest levels for which there are separately identifiable cash inflows that are largely independent of the cash inflows from other assets or groups of assets (cash-generating units). Non-financial assets other than goodwill that suffered an impairment are tested for possible reversal of impairment whenever events or changes in circumstances indicate that the impairment may be reversed.
(iii) Goodwill
Goodwill is tested for impairment annually. For the purpose of impairment testing, goodwill acquired in a business combination is, from the acquisition date, allocated to each of the Consolidated Group’s cash-generating units that are expected to benefit from the synergies of the combination, irrespective of whether other assets or liabilities of the Consolidated Group are assigned to those units. Each unit to which the goodwill is allocated represents the lowest level within the entity at which the goodwill is monitored for internal management purposes, and is not larger than an operating segment.
Impairment is determined by assessing the recoverable amount of the cash-generating unit to which the goodwill relates. The recoverable amount is the greater of its value in use and its fair value less costs to sell. In assessing value in use, the estimated future cash flows are discounted to their present value using a pre-tax discount rate that reflects current market assessments of the time value of money and the risks specific to the asset. When the recoverable amount of the cash-generating unit is less than the carrying amount, an impairment is recognised.
Impairment losses for goodwill are not subsequently reversed.
(iv) Intangibles with indefinite useful lives
Intangible assets with indefinite useful lives are tested for impairment annually either individually or at the cash-generating unit level consistent with the methodology outlined for goodwill above. Such intangibles are not amortised. The useful life of an intangible asset with an indefinite useful life is reviewed each reporting period to determine whether the indefinite life assessment continues to be supportable. If not, the change in the useful life assessment from indefinite to finite is accounted for as a change in an accounting estimate and is thus accounted for on a prospective basis.

FKP ANNUAL REPORT 2012 63
(t) Lease incentives
Initial indirect costs incurred by the lessor which relate to an operating lease and lease incentives are deferred by the lessor and amortised over the lease term in proportion to the rental recognised in each financial year.
(u) Leased assets
Leases under which the Consolidated Group assumes substantially all the risks and benefits of ownership are classified as finance leases. Other leases are classified as operating leases.
(i) Consolidated Group as lessee
Finance leases, which transfer to the Consolidated Group substantially all the risks and benefits incidental to ownership of the leased item, are capitalised at the inception of the lease at the fair value of the leased asset, or, if lower, at the present value of the minimum lease payments. A lease liability equal to the value of the leased asset recognised is recorded at the inception of the lease. Lease payments are apportioned between the finance charges and reduction of the lease liability so as to achieve a constant rate of interest on the remaining balance of the liability. Finance charges are recognised in finance costs in the statement of comprehensive income.
Capitalised leased assets are depreciated over the shorter of the estimated useful life of the asset and the lease term if there is no reasonable certainty that the Consolidated Group will obtain ownership by the end of the lease term.
Operating lease payments are recognised as an operating expense in the statement of comprehensive income on a straight-line basis over the lease term except where an alternative basis is more representative of the pattern of benefits to be derived from the leased property. Operating lease incentives are recognised as a liability when received and subsequently reduced by allocating lease payments between rental expense and reduction of the liability.
(ii) Consolidated Group as lessor
Leases in which the Consolidated Group retains substantially all the risks and benefits of ownership of the leased asset are classified as operating leases. Initial direct costs incurred in negotiating an operating lease are added to the carrying amount of the leased asset and recognised as an expense over the lease term on the same basis as rental income.
(v) Intangible assets
Intangible assets are initially measured at cost. Following initial recognition, intangible assets are carried at cost less any accumulated amortisation and any accumulated impairment losses. The useful lives of intangible assets are assessed to be either finite or indefinite. Intangible assets with finite lives are amortised over their useful life and tested for impairment whenever there is an indication that the intangible asset may be impaired (see Note 1(s)). The amortisation period and the amortisation method for an intangible asset with a finite useful life are reviewed at least at each financial year end. Changes in the expected useful life or expected pattern of consumption of future economic benefits embodied in the asset are accounted for prospectively by changing the amortisation period or method, as appropriate, which is a change in accounting estimate. The amortisation expense on intangible assets with finite lives is recognised in the statement of comprehensive income in the expense category consistent with the function of the intangible asset.
Licences to operate residential aged care facilities and hostels acquired are carried at cost as there is no active market and they have an indefinite useful life. The licences are issued for an unlimited period and there is no foreseeable limit to the period over which the asset is expected to generate net cash inflows for the Consolidated Group. Directors review the carrying value of licences for impairment and write off as an expense any reduction of recoverable amount below cost.
The exclusive right to market a specified number of retirement villages for the Forest Place Retirement Village Syndicates, acquired from third parties, is carried at cost and amortised on a proportionate basis over the period in which the retirement villages are sold, as and when units are sold.
(w) Trade and other payables
Trade and other payables are carried at amortised cost. They represent liabilities for goods and services provided to the Consolidated Group prior to the end of the financial year that are unpaid and arise when the Consolidated Group becomes obliged to make future payments in respect of the purchase of these goods and services.
(x) Interest bearing loans and borrowings
Interest bearing loans and borrowings are initially recognised at the fair value of consideration received less directly attributable transaction costs. After initial recognition, interest bearing loans and borrowings are subsequently measured at amortised cost using the effective interest rate method. Borrowings are classified as current liabilities unless the Consolidated Group has an unconditional right to defer settlement of the liability for at least 12 months after the reporting date.
The fair value of the liability portion of a convertible bond is determined using a market interest rate for an equivalent non-convertible bond. This amount is recorded as a liability on an amortised cost basis until extinguished on conversion or maturity of the bonds. The remainder of the proceeds represent the fair value of the conversion option, such that the fair value of the underlying host debt contract together with the fair value of the embedded derivative equals the face value of the convertible bonds issued.
Where the Consolidated Group issues convertible bonds which contain a settlement option that allows it to either deliver a fixed number of shares when the investors exercise their rights to convert or deliver cash equal to the fair value of those shares at the date of conversion, the conversion option is not an equity instrument, but rather an embedded derivative i.e. ‘a written call option issued by the Consolidated Group over its own shares’ which is split out and accounted for separately from the host debt contract and recognised as a derivative under AASB 139: ‘Financial Instruments: Recognition and Measurement’ – i.e. a financial liability recognised at fair value through profit and loss (refer to Note 1(y)).
64 FKP ANNUAL REPORT 2012
1. STATEMENT OF SIGNIFICANT ACCOUNTING POLICIES CONTINUED(x) Interest bearing loans and borrowings continued
Borrowing costs
Borrowing costs directly attributable to the acquisition, construction or production of a qualifying asset (i.e. an asset that necessarily takes a substantial period of time to get ready for its intended use or sale) are capitalised as part of the cost of that asset. For non-specific borrowings, borrowing costs are capitalised using a weighted average capitalisation rate. All other borrowing costs are expensed in the period they occur. Borrowing costs consist of interest and other costs that an entity incurs in connection with the borrowing of funds.
(y) Derivative financial instruments and hedging
The Consolidated Group uses derivative financial instruments to hedge its risks associated with interest rate fluctuations. Such derivative financial instruments are initially recognised at fair value on the date on which a derivative contract is entered into and are subsequently remeasured to fair value. Fair value of derivatives is determined using a generally accepted pricing model based on discounted cash flow analysis using assumptions supported by observable market rates.
Derivatives are carried as assets when their fair value is positive and as liabilities when their fair value is negative.
Any gains or losses arising from changes in the fair value of derivatives are taken directly to the statement of comprehensive income for the year. The Consolidated Group does not adopt hedge accounting and as such the offsetting gain or loss from the interest rate swaps is taken directly to the statement of comprehensive income.
(z) Resident loans
Resident loans are measured at the principal amount less unearned income, plus the residents’ share of any increases in market value based on the expected market value of the underlying property at turnover and are then discounted to fair value at balance sheet date. Fair value adjustments are recognised in the statement of comprehensive income.
Resident loans are non-interest bearing and are payable at the end of the resident contract. In most cases this is greater than 12 months; however, they are classified as current liabilities because the Consolidated Group does not have an unconditional right to defer settlement.
The rate at which the Consolidated Group’s retirements’ residents vacate their units, and hence the rate at which the resident loans will fall due for repayment, is estimated on the basis of statistical tables.
(aa) Employee benefits(i) Wages and salaries, annual leave and sick leave
Liabilities for wages and salaries, including non-monetary benefits, annual leave and accumulating sick leave expected to be settled within 12 months of the balance date are recognised as other payables in respect of service up to the balance date and are measured at the amounts expected to be paid when the liabilities are settled.
(ii) Long service leave
The liability for long service leave is recognised in the employee benefits provision and measured as the present value of expected future payments to be made in respect of services provided by employees up to the balance date. Consideration is given to future wage and salary levels, experience of employee departures and periods of service.
(iii) Staff incentive scheme
In 2003 the Parent Entity introduced a staff incentive scheme. The scheme provides for the payment of bonuses to employees who deserve recognition for exceptional performance.
The Consolidated Group recognises a liability and an expense for the incentive scheme based on the calculations determined by the scheme.
(bb) Share-based payments
The Consolidated Group provides benefits to its employees (including key management personnel) in the form of share-based payments, whereby employees render services in exchange for shares or rights over shares (equity-settled transactions).
The cost of these equity-settled transactions with employees is measured by reference to the fair value of the equity instruments at the date at which they are granted. The Black-Scholes and Binomial models are the primary pricing models used by the Consolidated Group in calculating fair value. Fair value is calculated with reference to the exercise price of the option, expected life of the option, spot price of the underlying share, expected volatility of the share price over the life of the option based largely on historical trends adjusted for anomalies, and the risk-free interest rate for the life of the option.
The cost of equity-settled transactions is recognised in the statement of comprehensive income as an employee expense with a corresponding increase in equity, over the period in which the performance and/or service conditions are fulfilled (the vesting period), ending on the date on which the relevant employees become fully entitled to the award (the vesting date).
Notes to the Financial Statements continuedFOR THE YEAR ENDED 30 JUNE 2012

FKP ANNUAL REPORT 2012 65
At each subsequent reporting date until vesting, the cumulative charge to the statement of comprehensive income is the product of:
(a) the grant date of the award;
(b) the fair value of the options granted, which includes any market performance conditions;
(c) the current best estimate of the number of awards that will vest, taking into account such factors as the likelihood of employee turnover during the vesting period and the likelihood of service and non-market performance conditions being met; and
(d) the expired portion of the vesting period.
The charge to the statement of comprehensive income for the period is the cumulative amount as calculated above less the amounts already charged in previous periods. There is a corresponding entry to equity.
(cc) Provisions
A provision is recognised where there is a present obligation (legal or constructive) as a result of a past event, it is probable that an outflow of resources embodying the economic benefits will be required to settle the obligation and a reliable estimate can be made of the obligation.
Provisions are measured at the present value of Management’s best estimate of the expenditure required to settle the present obligation at the reporting date. The discount rate used to determine the present value reflects current market assessments of the time value of money and the risks specific to the liability. The increase in the provision resulting from the passage of time is recognised in finance costs.
Warranty maintenance
Provisions for warranty-related costs are made for claims received and claims expected to be received in relation to construction work performed prior to reporting date. Recognition is based on historical claim rates, adjusted for specific information arising from internal quality assurance processes.
(dd) Contributed equity
Ordinary securities are classified as equity. Incremental costs directly attributable to the issue of ordinary securities and security options are shown in equity as a deduction, net of tax, from the proceeds.
(ee) Foreign currency translationFunctional and presentation currency
The Consolidated Group’s financial statements are presented in Australian dollars, which is FKP Limited’s functional and presentation currency.
Transactions and balances
Foreign currency transactions are translated into the functional currency using the exchange rates prevailing at the dates of the transactions. Foreign exchange gains and losses resulting from the settlement of such transactions and from the translation at year end exchange rates of monetary assets and liabilities denominated in foreign currencies are recognised in the statement of comprehensive income, except when they are deferred in equity as qualifying cash flow hedges and qualifying net investment hedges or are attributable to part of the net investment in a foreign operation.
Non-monetary items that are measured at fair value in a foreign currency are translated using the exchange rates at the date when the fair value was determined. Translation differences on assets and liabilities carried at fair value are reported as part of the fair value gain or loss.
Group companies
The results and financial position of foreign operations that have a functional currency different from the presentation currency are translated into the presentation currency as follows:
— assets and liabilities for each balance sheet presented are translated at the closing rate at the date of that balance sheet;
— income and expenses for each statement of comprehensive income are translated at average exchange rates (unless this is not a reasonable approximation of the cumulative effect of the rates prevailing on the transaction dates, in which case income and expenses are translated at the dates of the transactions); and
— all resulting exchange differences are recognised in other comprehensive income.
On consolidation, exchange differences arising from the translation of any net investment in foreign entities are recognised in other comprehensive income. When a foreign operation is sold a proportionate share of such exchange difference is reclassified to profit or loss, as part of the gain or loss on sale where applicable.
(ff) Financial guarantee contracts
Financial guarantee contracts are recognised as a financial liability at the time a guarantee is issued. The liability is initially measured at fair value and subsequently at the higher of the amount determined in accordance with AASB 137: ‘Provision, Contingent Liabilities and Contingent Assets’ and the amount initially recognised less cumulative amortisation, where appropriate.
The fair value of the financial guarantee is determined as the present value of the difference in net cash flows between the contractual payments under the debt instrument and the payments that would be required without the guarantee, or the estimated amount that would be payable to a third party for assuming the obligations.

66 FKP ANNUAL REPORT 2012
Notes to the Financial Statements continuedFOR THE YEAR ENDED 30 JUNE 2012
1. STATEMENT OF SIGNIFICANT ACCOUNTING POLICIES CONTINUED(gg) Syndicate put options
The Consolidated Group has entered into put and call options as part of the syndicate arrangements for the Forest Place Cleveland Syndicate and Forest Place Clayfield Syndicate. The estimated value of the put options exercised, but for which payment is not yet due, is recognised in the financial report as both an asset (rights to acquire syndicate shares) and a corresponding liability (put option liabilities). The estimated value of the remaining put options not yet exercised is recognised as a financial liability with a corresponding balance recognised in equity reserves.
The classification between current and non-current is based on the commitment to make payment for these put options at the rate of one share per syndicate per calendar month.
(hh) Accounting estimates and judgements
The preparation of these financial statements requires the use of certain critical accounting estimates. It also requires Management to exercise its judgement in the process of applying the Consolidated Group’s accounting policies.
Estimates and judgements are continually evaluated and are based on historical experience as adjusted for current market conditions and other factors, including expectations of future events that are believed to be reasonable under the circumstances.
The estimates and assumptions that have a significant risk of causing a material adjustment to the carrying amounts of assets and liabilities within the next financial year include:
Valuation of assets and recoverable amounts(i) Estimates of net realisable value of inventories
Estimates of net realisable value are based on the most reliable evidence available at the time the estimates are made, of the amount the inventories are expected to realise and the estimate of costs to complete. Refer to Note 1(n) for further details.
(ii) Investment property excluding retirement living assets
The carrying amount of investment property is the fair value of the property as determined by Directors’ valuations, with external valuations performed every three years at a minimum. This approach requires assumptions and judgements in relation to the future receipts of contractual rentals, expected future market rentals, void periods, maintenance regulations, and property capitalisation rates, together with reference to market evidence of transaction prices for similar properties. For further details refer to Note 10(a).
(iii) Retirement living assets and liabilities
For details on the valuation basis of retirement living assets and liabilities refer to Notes 1(z) and 10(b).
Critical accounting judgments in applying the Consolidated Group’s accounting policies
In the process of applying the Consolidated Group’s accounting policies, the Consolidated Group makes various judgements, apart from those involving estimations, that can significantly affect the amounts recognised in the consolidated financial statements. These include:
— when all the significant risks and rewards of ownership of development properties are substantially transferred to the purchaser;
— the percentage completion on construction work performed; and
— whether the substance of the relationship between the Consolidated Group and an entity indicates that the entity should be consolidated by the Consolidated Group or recognised as an investment in an associate.
There have been no significant changes in estimates on the prior year.
(ii) Rounding of amounts
The Consolidated Group is a kind referred to in Class Order 98/100, issued by the Australian Securities and Investments Commission, relating to the ‘rounding off’ of amounts in the financial report. Amounts in the financial report have been rounded off in accordance with the Class Order to the nearest hundred thousand dollars, or in certain circumstances, the nearest thousand dollars or the nearest dollar.
(jj) Parent entity financial information
The financial information for the parent entities FKP Limited and FKP Property Trust disclosed in Note 34 has been prepared on the same basis as the Consolidated Group’s financial statements except as set out below.
Controlled entities
Investments in controlled entities are carried in the Parent’s balance sheet at the lower of cost and recoverable amount. Dividends and distributions are brought to account in the statement of comprehensive income when they are declared by the controlled entities.
Associates and joint ventures
In the Parent Entity’s financial statements, investments in associates and joint venture entities are carried at the lower of cost and recoverable amount. Dividends and distributions received from associates/joint venture entities are recognised in the statement of comprehensive income as revenue.

FKP ANNUAL REPORT 2012 67
Tax consolidation legislation
FKP Limited and its wholly-owned Australian controlled entities have implemented the tax consolidation legislation as of 1 July 2003. The Head Entity and the controlled entities in the tax consolidated group continue to account for their own current and deferred tax amounts. These tax amounts are measured as if each entity in the tax consolidated group continues to be a stand-alone taxpayer in its own right.
In addition to its own current and deferred tax amounts, the Parent Entity also recognises the current tax liabilities (or assets) and the deferred tax assets arising from unused tax losses and unused tax credits assumed from controlled entities in the tax consolidated group. The entities in the tax consolidated group have entered into tax sharing/funding agreements to limit the joint and several liabilities of the wholly-owned entities in the case of a default by the Head Entity. A tax funding agreement where the wholly-owned entities fully compensate the Head Entity for any current tax receivable and deferred income tax assets related to unused tax losses or unused tax credits that are transferred to the Head Entity under the tax consolidation legislation has also been entered into. The transfer of such amounts to the Head Entity is recognised as inter-company receivables or payables.
(kk) Operating segments
An operating segment is a component of an entity that engages in business activities from which it may earn revenues and incur expenses (including revenues and expenses relating to transactions with other components of the same entity), whose operating results are regularly reviewed by the entity’s chief operating decision makers to make decisions about resources to be allocated to the segment and assess its performance and for which discrete financial information is available. Management will also consider other factors in determining operating segments such as the existence of a line manager and the level of segment information presented to the Board of Directors.
Operating segments have been identified based on the information provided to the chief operating decision makers.
(ll) Earnings per share
Basic earnings per share is calculated as net profit attributable to members of the Parent Entity, adjusted to exclude any costs of servicing equity (other than dividends) and preference share dividends, divided by the weighted average number of ordinary shares, adjusted for any bonus element.
Diluted earnings per share is calculated as net profit attributable to members of the Parent Entity, adjusted for:
— costs of servicing equity (other than dividends) and preference share dividends;
— the after tax effect of dividends and interest associated with dilutive potential ordinary shares that have been recognised as expenses; and
— other non-discretionary changes in revenues or expenses during the period that would result from the dilution of potential ordinary shares, divided by the weighted average number of ordinary shares and dilutive potential ordinary shares, adjusted for any bonus element.

68 FKP ANNUAL REPORT 2012
Notes to the Financial Statements continuedFOR THE YEAR ENDED 30 JUNE 2012
2. REVENUE Consolidated Consolidated Group Property Trust
2012 2011 2012 2011 $m $m $m $m
From continuing operations
Sale of goods and construction contract revenue
Sale of goods 112.4 171.8 – –
Construction contract revenue 3.4 57.8 – –
115.8 229.6 – –
Rendering of services
Rent received 15.9 29.0 15.3 28.2
Deferred management fees 53.3 54.4 – –
Government grants 8.3 7.8 – –
Other 7.9 11.2 – –
85.4 102.4 15.3 28.2
Other revenues
Interest received/receivable 1.7 2.0 22.9 20.7
Management fee received 10.1 12.4 – –
Other 0.8 4.7 0.3 0.8
12.6 19.1 23.2 21.5
Government grants
Aged care grants of $8.3m (2011: $7.8m) were recognised as revenue from rendering of services by the Consolidated Group during the financial year. There are no unfulfilled conditions or other contingencies attached to these grants. The Consolidated Group did not benefit directly from any other forms of government assistance.
3. EXPENSES Consolidated Consolidated Group Property Trust
2012 2011 2012 2011 $m $m $m $m
Profit before income tax includes the following specific expenses:
Depreciation
Plant and equipment 0.9 1.5 – –
Residential aged care facilities 0.2 0.3 – –
Freehold buildings 0.2 – – –
1.3 1.8 – –
Amortisation
Leasehold improvements 1.2 1.2 – –
Other intangibles 0.5 0.2 – –
1.7 1.4 – –
Finance costs at amortised cost
Interest and amortisation of borrowing costs from bank loans and overdraft 81.3 80.3 6.0 8.7
Less: capitalised finance costs (68.4) (54.3) (6.0) –
12.9 26.0 – 8.7
Impairment of assets
Trade and other receivables 5.3 (2.7) – 1.8
Property, plant and equipment 6.3 – – –
Intangible assets 10.8 2.0 – –
Inventories 51.0 1.3 – –

FKP ANNUAL REPORT 2012 69
4. TAXATION Consolidated Consolidated Group Property Trust
2012 2011 2012 2011 $m $m $m $m
(a) Income tax expenseCurrent income tax
Current income tax charge 0.1 – – –
Adjustments in respect of current income tax of previous years – (3.8) – –
0.1 (3.8) – –
Deferred income tax
Current year movement (132.6) 30.2 – –
Under provisions – 1.7 – –
Income tax expense reported in the statement of comprehensive income (132.5) 28.1 – –
(b) Numerical reconciliation between aggregate tax (benefit)/expense recognised in the statement of comprehensive income and tax expense calculated per the statutory income tax rateAccounting (loss)/profit before income tax (492.4) 118.2 2.5 9.3
Tax at the Australian tax rate of 30% (2011: 30%) (147.7) 35.5 0.7 2.8
Tax effect of amounts which are not deductible/taxable in calculating taxable income
Non-assessable income (4.8) (10.6) (0.7) (2.8)
Assessable income not booked 0.3 0.5 – –
Non-deductible expenses 20.2 5.2 – –
Other deductible expenses (0.5) (0.4) – –
(132.5) 30.2 – –
Under/(over) provisions – (2.1) – –
Income tax (benefit)/expense (132.5) 28.1 – –
(c) Deferred tax assetsThe balance comprises temporary differences attributable to:
Amounts recognised in the statement of comprehensive income
Provisions 11.5 8.7 – –
Accrued expenditure 1.3 1.5 – –
Tax losses 114.0 86.0 – –
Unearned revenue 27.9 23.5 – –
Other 0.6 0.2 – –
Deferred tax assets 155.3 119.9 – –Less: amounts set off against deferred tax liabilities (155.3) (119.9) – –
Net deferred tax assets – – – –
MovementsBalance at the beginning of the year 119.9 104.7 – –
Provisions 0.9 (2.0) – –
Accrued expenditure (0.4) (1.6) – –
Tax losses 28.2 12.0 – –
Unearned revenue 6.6 3.0 – –
Other – 0.1 – –
(Over)/under provisions 0.1 3.7 – –
Balance at the end of the year 155.3 119.9 – –Less: amounts set-off against deferred tax liabilities (155.3) (119.9) – –
Net deferred tax assets – – – –

70 FKP ANNUAL REPORT 2012
Notes to the Financial Statements continuedFOR THE YEAR ENDED 30 JUNE 2012
4. TAXATION CONTINUED Consolidated Consolidated Group Property Trust
2012 2011 2012 2011 $m $m $m $m
(d) Deferred tax liabilities
The balance comprises temporary differences attributable to:
Amounts recognised in the statement of comprehensive income
Accrued income 3.0 1.8 – –
Fair value of investment properties 547.3 661.5 – –
Fair value of resident loans (269.6) (322.3) – –
Differences in depreciation and amortisation of property, plant and equipment for accounting and income tax purposes (7.8) (4.4) – –
Intangibles 0.2 0.6 – –
Equity-accounted profits (21.4) (1.6) – –
Other expenditure currently deductible for tax but deferred and amortised for accounting (16.4) (3.2) – –
Amounts charged directly to equity (9.6) (12.9) – –
Deferred tax liabilities 225.7 319.5 – –
Less: amounts set-off against deferred tax assets (155.3) (119.9) – –
Net deferred tax liabilities 70.4 199.6 – –
Movements
Balance at the beginning of the year 319.5 279.0 – –
(Under)/over provisions – 1.6 – –
Accrued income 1.2 (2.0) – –
Fair value of investment properties (78.3) 61.3 – –
Fair value of resident loans 16.8 (33.1) – –
Differences in depreciation and amortisation of property, plant and equipment for accounting and income tax purposes (3.2) 17.7 – –
Equity-accounted profits (19.8) (4.0) – –
Prepaid expenses – (2.8) – –
Other expenditure currently deductible for tax but deferred and amortised for accounting (13.8) 4.6 – –
Amounts charged directly to equity 3.3 (2.8) – –
Balance at the end of the year 225.7 319.5 – –
Less: amounts set-off from deferred tax assets (155.3) (119.9) – –
Net deferred tax liabilities 70.4 199.6 – –
(e) Tax lossesUnused tax losses for which no deferred tax asset has been recognised 25.2 24.4 – –
Potential tax benefit at Australian tax rate of 30% (2011: 30%) 7.6 7.3 – –
All unused tax losses were incurred by Australian entities.
(f) Tax consolidation legislation
The Consolidated Group has implemented the tax consolidation legislation as of 1 July 2003. The accounting policy in relation to this legislation is set out in Note 1(g).

FKP ANNUAL REPORT 2012 71
5. EARNINGS PER SECURITY Consolidated Consolidated Group Property Trust
2012 2011 2012 2011 $m $m $m $m
(a) Earnings used in calculating earnings per security(Loss)/profit from continuing operations after income tax (359.9) 90.1 2.6 9.3
Less: non-controlling interest – external 9.6 (7.8) – –
Net profit/(loss) after income tax attributable to equity holders of the Consolidated Group (350.3) 82.3 2.6 9.3
Consolidated Consolidated Group Property Trust
2012 2011 2012 2011 number number number number
(b) Weighted average number of securities used as the denominatorWeighted average number of ordinary securities used in calculating basic earnings per security 1,197,979,540 1,174,532,705 1,197,979,550 1,174,532,715
Weighted average number of ordinary securities used in calculating diluted earnings per security 1,321,253,701 1,233,636,755 1,321,253,711 1,233,636,765
(c) Other informationThe weighted average number of convertible bond options converted or lapsed during the year included in the calculation of diluted earnings per security 328,875,211 123,274,162 328,875,214 123,274,162
(d) Anti-dilutive
The following security options could potentially dilute basic earnings per security in the future but were not included in the calculation of diluted earnings per security because they are anti-dilutive.
Number of options outstanding 18,885,000 17,487,509 18,885,000 17,487,509
6. CASH AND CASH EQUIVALENTS Consolidated Consolidated Group Property Trust
2012 2011 2012 2011 $m $m $m $m
Cash at bank 13.7 12.0 1.8 2.5
Capital replacement funds1 2.3 2.5 – –
Short-term deposits 2.2 – 2.2 –
Cash and cash equivalents 18.2 14.5 4.0 2.5
1. A statutory charge, imposed under the Retirement Villages Act 1999 (QLD), exists over all amounts held in capital replacement funds, which restricts the use for which these
funds can be applied.

72 FKP ANNUAL REPORT 2012
Notes to the Financial Statements continuedFOR THE YEAR ENDED 30 JUNE 2012
7. TRADE AND OTHER RECEIVABLES Consolidated Consolidated Group Property Trust
2012 2011 2012 2011 $m $m $m $m
Current
Trade receivables 49.3 23.3 0.2 2.4
Other receivables 19.8 18.5 – 0.7
Trade receivables (extended terms) 2.5 6.6 – –
Allowance for impairment (14.7) (14.0) – (1.9)
56.9 34.4 0.2 1.2
Due from related parties – interest bearing
Due from associates1 6.0 – – –
Due from Parent Entity2 – – – 15.0
Allowance for impairment1 (4.3) – – –
Due from related parties – non-interest bearing
Due from associates3 7.7 8.4 0.3 0.6
Total current receivables 66.3 42.8 0.5 16.8
Non-current
Trade receivables 1.8 – – –
Other receivables 0.8 1.7 – 0.6
Trade receivables (extended terms) 2.0 – – –
4.6 1.7 – 0.6
Due from related parties – interest bearing
Due from associates1 8.5 12.2 – –
Due from Parent Entity2 – – 349.0 249.3
Allowance for impairment1 (5.6) (7.0) – –
Due from related parties – non-interest bearing
Due from Parent Entity – – 6.6 –
Due from associates 1.7 1.7 – –
Allowance for impairment (1.7) (1.7) – –
Total non-current receivables 7.5 6.9 355.6 249.9
1. For terms and conditions relating to interest-bearing receivables due from associates refer to Note 31(e).
2. For terms and conditions relating to receivables due from the Parent Entity refer to Note 31(d).
3. For terms and conditions relating to non-interest bearing receivables due from associates refer to Note 7(g).
(a) Fair value and credit risk
The maximum exposure to credit risk is the fair value of receivables, except for trade receivables with extended trading terms where the receivable is secured by first registered mortgage. For the fair values of trade and other receivables refer to Note 35.
(b) Ageing of trade receivables
Trade receivables as disclosed below are generally aged on 30 day terms. Included in the current category of ageing of trade receivables is $22.6m (2011: $1.7m) of trade receivables on deferred payment terms from 30 to 90 days, depending on the terms of the contract. These deferred payment terms relate to roll-overs and sales of new stock within the Retirement division and hence become due to the Consolidated Group on the turnover of an individual resident’s unit. For trade debtors with extended settlement terms refer to part (f) of this Note. An allowance for impairment is recognised when there is objective evidence that an individual trade receivable is impaired. Indicators of impairment include where there is objective evidence of significant financial difficulties, debtor bankruptcy, financial reorganisation or default in payment. All impairment losses have been provided for and all other and related party receivables are neither past due nor impaired and therefore are considered to be recoverable.

FKP ANNUAL REPORT 2012 73
The ageing of trade receivables including those on deferred payment terms for the Consolidated Group at the reporting date was:
31–60 31–60 61–90 61–90 +91 +91 days days days days days days Total Current PDNI 1 CI 2 PDNI 1 CI 2 PDNI 1 CI 2 $m $m $m $m $m $m $m $m
2012
Consolidated Group 49.3 29.0 4.3 – 2.4 – 10.3 3.3
Consolidated Property Trust 0.2 0.2 – – – – – –
2011
Consolidated Group 23.3 8.5 2.8 – 0.9 – 5.8 5.3
Consolidated Property Trust 2.4 0.1 0.1 – 0.1 – 0.1 2.0
1. Past Due Not Impaired (‘PDNI’)
2. Considered Impaired (‘CI’)
Trade receivables past due but not considered to be impaired at 30 June 2012 are: Consolidated Group $17.0m (2011: $9.5m) and Consolidated Property Trust $nil (2011: $0.3m). These trade receivables comprise customers who have good credit histories and hence the balances are considered recoverable. Other balances within trade and other receivables do not contain impaired assets and are not past due. It is expected that these other balances will be received when due.
Consolidated Consolidated Group Property Trust
2012 2011 2012 2011 $m $m $m $m
(c) Total trade and other receivables impairment loss
The movement in the allowance for impairment during the year is as follows:
Balance at the beginning of the year 22.7 27.7 1.9 0.1
Consolidation of subsidiary 2.8 – – –
Provision for impairment recognised during the year 3.0 2.4 – 1.8
Receivables written off as uncollectible (1.8) (2.3) (1.7) –
Unused amounts reversed (0.4) (5.1) (0.2) –
Balance at the end of the year 26.3 22.7 – 1.9
(d) Interest – trade receivables
This represents amounts to be settled on due dates nominated in written contracts. If settlement does not occur on the date or within normal trading terms the contracts provide for interest to accrue at commercial rates until settlement.
(e) Security – trade receivables
Trade and other receivables totalling $0.8m (2011: $0.8m) are secured by first registered mortgage over real property assets of the debtors, with $1.8m (2011: $3.6m) secured by second mortgage. Limited security has also been granted from the Retirement Villages Group (‘RVG’) over amounts included in due from associates (non-interest bearing) in relation to the Australian Property Services Agreement between the Parent Entity and RVG.

74 FKP ANNUAL REPORT 2012
Notes to the Financial Statements continuedFOR THE YEAR ENDED 30 JUNE 2012
7. TRADE AND OTHER RECEIVABLES CONTINUED(f) Trade receivables with extended terms
Debtors with extended settlement terms are expected to settle as follows:
Consolidated Consolidated Group Property Trust
2012 2011 2012 2011 $m $m $m $m
Within one year 2.5 4.6 – –
One year or later and no later than five years 2.0 2.0 – –
Later than five years – – – –
Trade receivables (extended terms) 4.5 6.6 – –
The majority of debtors with extended terms relate to land sales with a small proportion relating to property developments within Queensland. These debtors are under contractual vendor financing arrangements, with extended terms ranging from one month to 19 months. All other trade receivables are subject to normal terms of trade which provide for settlement within 30 days or are subject to a contractual settlement date within 12 months of year end. Other receivables that are non-current are contractual obligations due after the reporting date.
Extended term debtors with a carrying value of $1.8m (2011: $3.6m) are considered impaired and an allowance for impairment of $1.8m (2011: $2.0m) has been raised against these amounts.
(g) Related party receivables
Included in due from associates (non-interest bearing) are the following:
Consolidated Consolidated Group Property Trust
2012 2011 2012 2011 $m $m $m $m
Retirement Villages Group1 5.8 5.4 – –
FKP Core Plus Fund2 0.7 1.4 – 0.3
FKP Core Plus Fund Two2 0.4 0.5 0.3 0.3
Brookvale Strata 0.3 0.5 – –
Other 0.5 0.6 – –
Due from related parties – non-interest bearing 7.7 8.4 0.3 0.6
1. Retirement Villages Group (‘RVG’): Under the Australian Property Services Agreement between the Consolidated Group and RVG, RVG is required to pay management fees,
development management service fees and sales fees.
2. FKP Core Plus Funds (‘the Funds’): Management fees received by FKP Funds Management Limited as Responsible Entity to the Funds and distributions receivable from the Funds.
For terms and conditions of related party receivables refer to Note 31.

FKP ANNUAL REPORT 2012 75
8. OTHER FINANCIAL ASSETS Consolidated Consolidated Group Property Trust
2012 2011 2012 2011 $m $m $m $m
CurrentFair value through profit or loss financial assets
Interest rate cap – 0.6 – –
Other financial assets
Rights to acquire syndicate shares 1.6 1.5 – –
Total current other financial assets 1.6 2.1 – –
Non-currentOther financial assets
Rights to acquire syndicate shares 0.9 2.5 – –
Total non-current other financial assets 0.9 2.5 – –
(a) Financial assets recognised at fair value through profit or loss
Changes in the fair value of fair value through profit or loss financial assets are recorded in the statement of comprehensive income.
(b) Rights to acquire syndicate shares
Rights to acquire syndicate shares constitute put options over Cleveland Syndicate and Clayfield Syndicate units which have been exercised but for which payment is not yet due. A corresponding liability is recognised under financial liabilities. The amount recognised is equal to the net present value of the amount payable based upon a formula set out in the Syndicate deeds, calculated as the amount actually paid for the shares less distributions received to date, compounded at 5% per year.
9. INVENTORIES Consolidated Consolidated Group Property Trust
2012 2011 2012 2011 $m $m $m $m
CurrentLand and development properties held for resale:
Cost of land acquisition 50.6 44.6 – –
Capitalised development costs 167.3 109.2 – –
Other capitalised costs 51.7 19.3 – –
Less: diminution in value (12.7) (4.6) – –
256.9 168.5 – –
Construction work in progress:
Construction costs incurred and attributable to net profit 6.7 10.9 – –
Less: progress billings (including retention allowances) (5.8) (8.4) – –
0.9 2.5 – –
Total current inventories 257.8 171.0 – –
Non-current inventories Land and development properties held for resale
Cost of land acquisition 386.6 362.6 – –
Capitalised development costs 178.3 114.0 – –
Other capitalised costs 146.6 126.7 – –
Less: diminution in value (97.8) (61.5) – –
Total non-current inventories 613.7 541.8 – –
(a) Inventory pledged as security
Inventory of $725.8m (2011: $489.5m) is pledged as first mortgage security for bank overdraft and bank loans. Bank loans are secured by floating charge over assets of the Consolidated Group (refer to Note 17 for further details).

76 FKP ANNUAL REPORT 2012
10. INVESTMENT PROPERTIES Consolidated Consolidated Group Property Trust
2012 2011 2012 2011 $m $m $m $m
At fair value
Balance at the beginning of the year 2,857.5 2,671.9 158.4 275.8
Capitalised subsequent expenditure 92.1 82.4 19.9 2.7
Capitalised interest1 7.3 1.6 6.0
Additions resulting from consolidation of the Syndicates2 – 135.2 – –
Change in fair value of investment properties3 (359.1) 75.2 (14.0) (12.6)
Disposals (49.9) (35.6) (49.9) (35.6)
Transfer to assets classified as held for sale (120.4) (71.9) (120.4) (71.9)
Transfers to property, plant and equipment – (1.3) – –
Balance at the end of the year 2,427.5 2,857.5 – 158.4
1. Refer to Note 28.
2. Effective 1 July 2010, the Cleveland and Clayfield Syndicate accounts were consolidated into the Consolidated Group.
3. Excludes change in fair value of investment properties classified as held for sale at the beginning of the year, being a fair value loss of $8.1m (2011: nil).
Amounts recognised in the statement of comprehensive income for investment property
Rental income 15.3 28.2 15.3 28.2
Change in fair values of investment properties1 (367.2) 75.2 (22.1) (12.6)
Change in fair value of resident loans 86.7 (6.3) – –
Direct operating expenses from properties that generated rental income (4.8) (6.1) (4.8) (6.1)
(270.0) 91.0 (11.6) 9.5
1. Includes change in fair value of investment properties classified as held for sale.
Leasing arrangements
Minimum lease payments due to the Consolidated Group under non-cancellable operating leases of investment property not recognised in the financial statements are receivable as follows:
Within one year 12.8 16.4 12.8 16.4
Later than one year but not later than five years 42.5 46.7 42.5 46.7
Later than five years 25.4 32.9 25.4 32.9
80.7 96.0 80.7 96.0
Notes to the Financial Statements continuedFOR THE YEAR ENDED 30 JUNE 2012

FKP ANNUAL REPORT 2012 77
(a) Valuation basis – commercial and retail properties
The carrying amount of investment property is the fair value of the property as determined by Directors’ valuations. The Directors’ valuations were based on current market offers and external valuations performed during the financial year by an independent appraiser with a recognised professional qualification and recent experience in the location and category of property being valued. In addition, the valuations were updated for market conditions as at 30 June 2012. Fair values of the Consolidated Group’s investment properties were determined with regard to recent market transactions of similar properties in similar locations to the Consolidated Group’s investment properties, capitalised rental returns and discounted cash flows. The capitalisation rates used in the Directors’ valuations ranged from 8.00% to 10.00% (2011: 7.75% to 8.75%) for the office sector and ranged from 9.00% to 11.50% (2011: 8.00% to 9.00%) for the retail sector.
(b) Valuation basis – retirement villages
The fair value method to account for investment property requires any movements in the fair value of the investment property to be taken directly to the statement of comprehensive income. The fair value has been determined by Directors’ valuation using the discounted cash flow valuation methodology. These valuations are based on projected cash flows using the current market value of individual retirement units and individual resident contracts. In determining these market values, a rolling program of external valuations is undertaken so that each unit is independently valued every three years. During the intervening period, Management separately assesses the value of individual units on a six-monthly basis to reaffirm valuations and incorporate the most current pricing and market conditions. The most recent independent valuation was completed at 30 June 2012. Key assumptions used in the Directors’ valuations are: the discount rate of 12.5% (2011: 12.5%); long-term property growth rate of 3.0% in year one, followed by 3.25% in year two, 3.50% in year three, 3.75% in year four, 4.0% in year five, and 4.5% from year six onwards (2011: 5% year on year); and average subsequent tenure period of 10 years for independent living units (ILU) and 4 years for serviced apartments (SA) (2011: ILU: 9 years, SA: 4 years).
(c) Valuation reconciliation
Valuations are reconciled to the investment property value as follows:
Consolidated Consolidated Group Property Trust
2012 2011 2012 2011 $m $m $m $m
Valuation 2,427.5 2,862.2 – 163.1
Less: operating lease receivables and incentives – (4.7) – (4.7)
Adjusted fair value 2,427.5 2,857.5 – 158.4

78 FKP ANNUAL REPORT 2012
11. EQUITY-ACCOUNTED INVESTMENTS(a) Ownership interests
Details of ownership interests in equity-accounted investments are as follows:
Consolidated Consolidated Group Property Trust
Country of incorporation/ 2012 2011 2012 2011 Associate/joint venture formation Activity % % % %
Associates
Retirement Villages Group1 Australia Retirement Villages 21.5 19.7 – –
FKP Core Plus Fund2 Australia Property Investment 14.7 14.7 14.7 14.7
FKP Core Plus Fund Two Australia Property Investment 27.9 27.9 27.9 27.9
Port Bouvard Limited3 Australia Property Developer – 29.5 – –
Retirement Villages Group R.E. Limited/Retirement Villages Group Management Pty Limited4 Australia Responsible Entity – 50.0 – –
Joint ventures
Mulpha FKP Pty Ltd Australia Property Developer 49.9 49.9 – –
Brookvale Strata5 Australia Property Developer 68.6 78.1 – –
Carrum Downs JV Pty Ltd Australia Property Developer 50.0 50.0 – –
Formica Pty Ltd6 Australia Property Developer 50.1 50.1 – –
Big Hepher JV Pty Ltd Australia Property Developer 50.0 50.0 – –
US Senior Living Property Trust Australia Retirement Villages 50.0 50.0 50.0 50.0
US Senior Living Tenant Trust Australia Retirement Villages 50.0 50.0 – –
Stirling Lakes7 Australia Property Developer 50.0 – – –
1. The investment in Retirement Villages Group (‘RVG’) has been treated as an investment in an associate as the Consolidated Group has the power to participate in operating policy
decisions. The Consolidated Group participates in the policy-making process through a 50% voting right in the fund manager. In addition, there exist material transactions between
the Consolidated Group and RVG. The Consolidated Group has an interest holding in RVG of 21.5%.
2. The investment in FKP Core Plus Fund has been treated as an investment in an associate as the Consolidated Group has the power to participate in operating policy decisions.
The Consolidated Group participates in the policy-making process through one-third representation on the Investment Committee.
3. Historically, Port Bouvard has been treated as an investment in an associate and accounted for under the equity method. Effective 31 May 2012, the accounts of Port Bouvard
were consolidated into the Consolidated Group. Refer to Note 38 for further details.
4. The Consolidated Group became the sole manager of Retirement Villages Group (‘RVG’) on 12 January 2012, following an agreement signed with Macquarie Capital Group Limited
on 22 December 2011. Refer to Note 38 for further details.
5. The Consolidated Group entered into a joint venture known as the Lifestyle Working Brookvale Strata Joint Venture (‘Brookvale’) subject to a joint venture agreement dated
10 December 2004, to develop a site for residential and commercial strata use. Previously, the Consolidated Group recognised the joint venture as an equity accounted investment
with a 78.1% participating interest in the output of the joint venture and joint control over key financial and operating decisions. A Deed of Amendment was executed in July 2011.
The Deed of Amendment was executed to apportion the residual asset base of the joint venture between the venture partners. The investment in Brookvale continues to be
recognised as an equity accounted investment with profits of the joint venture and proceeds from asset sales distributed in line with the designation of lots. The investment
has been treated as an investment in a joint venture as the Consolidated Group has a 50% voting right, through 50% representation on the Venture Board. All key constitutional
changes to the arrangement and decision making are subject to approval by the Venture Board.
6. The Formica Pty Ltd Constitution provides that the Consolidated Group has a 50% voting right; however key decision-making requires a majority vote on key constitutional
changes and decision making.
7. Midland Court Mortgage Finance (NSW) Pty Ltd, a 100% controlled entity of Port Bouvard Limited, has a 50% interest in the following four companies: M.M.M Developments
Pty Ltd, D.D. Developments Pty Ltd, Lighthouse Investments Pty Ltd and Goodrock Corporation Pty Ltd. These four companies are party to a joint venture agreement which
has undertaken the development of the Princeton Private Estate in Stirling. The interest in the Stirling Lakes Joint Venture is accounted for in the Consolidated Group’s financial
statements using the equity method of accounting. The Consolidated Group’s share of accumulated losses in the joint venture at year end totalled $1.4m (2011: $1.6m).
Notes to the Financial Statements continuedFOR THE YEAR ENDED 30 JUNE 2012

FKP ANNUAL REPORT 2012 79
(b) Carrying amounts
Details of the carrying amounts of equity-accounted investments are as follows:
Consolidated Consolidated Group Property Trust
2012 2011 2012 2011 $m $m $m $m
Associates
Retirement Villages Group 68.7 127.2 – –
FKP Core Plus Fund 1.7 7.1 2.3 5.2
FKP Core Plus Fund Two 4.7 7.0 3.4 5.6
Port Bouvard Limited – 24.8 – –
Retirement Villages Group R.E. Limited/Retirement Villages Group Management Pty Limited – 7.9 – –
Joint ventures
Mulpha FKP Pty Ltd 71.2 107.9 – –
Brookvale Strata 3.2 7.6 – –
Carrum Downs JV Pty Ltd – – – –
Formica Pty Ltd – – – –
Big Hepher JV Pty Ltd – – – –
US Senior Living Property Trust 10.2 8.4 10.2 8.4
US Senior Living Tenant Trust – – – –
Stirling Lakes – – – –
159.7 297.9 15.9 19.2
(c) Movements in carrying amounts
Consolidated Consolidated Group Property Trust
2012 2011 2012 2011 $m $m $m $m
Carrying amount at the beginning of the year 297.9 357.3 19.2 37.8
Purchase of equity-accounted investments 20.9 20.8 – –
Reclassification of Brookvale – 7.9 – –
Share of net loss after income tax (113.2) (8.3) (0.2) (6.4)
Dividends received/receivable (5.7) (20.1) (0.7) (1.3)
Share of (decrement)/increase in foreign currency translation reserve 6.4 (17.4) 0.5 (3.2)
Share of fair value reserve (18.4) – – –
Return of capital (6.9) (8.6) (2.9) (7.7)
Consolidation of subsidiaries1 (21.3) (33.7) – –
Carrying amount at the end of the year 159.7 297.9 15.9 19.2
1. This captures the consolidation of the Clayfield and Cleveland Syndicates effective 1 July 2010, the consolidation of Retirement Villages Group R.E. Limited and Retirement
Villages Group Management Pty Limited effective 12 January 2012 and the consolidation of Port Bouvard effective 31 May 2012. Prior to the consolidation these entities
were treated as associates and accounted for under the equity method (refer to Note 38 for further details).

80 FKP ANNUAL REPORT 2012
Notes to the Financial Statements continuedFOR THE YEAR ENDED 30 JUNE 2012
11. EQUITY-ACCOUNTED INVESTMENTS CONTINUED(d) Summarised financial information of equity-accounted investments
Consolidated Group’s share of
Assets Liabilities Revenue Profit/(loss) $m $m $m $m
2012
Associates
Retirement Villages Group 374.0 305.3 7.4 (59.1)
FKP Core Plus Fund 1.8 0.1 0.9 0.5
FKP Core Plus Fund Two 9.9 5.2 1.4 (1.6)
Joint ventures
Mulpha FKP Pty Ltd 136.8 65.6 28.0 (31.7)
Brookvale 3.2 – 2.0 (2.6)
Carrum Downs JV Pty Ltd 0.2 1.4 0.1 (0.1)
Formica Pty Ltd 1.2 1.4 – –
Big Hepher JV Pty Ltd 2.9 8.5 – (3.7)
US Senior Living Property Trust 27.5 17.3 2.7 1.3
US Senior Living Tenant Trust 2.3 5.3 5.6 (1.2)
Stirling Lakes 1.8 3.2 0.2 0.2
2011
Associates
Retirement Villages Group 497.8 370.6 17.7 (10.4)
FKP Core Plus Fund 7.7 0.6 1.8 0.1
FKP Core Plus Fund Two 11.9 4.9 1.3 (1.2)
Port Bouvard Limited 44.5 19.7 20.1 2.6
Retirement Villages Group R.E. Limited/Retirement Villages Group Management Pty Limited 8.5 0.6 2.2 (2.8)
Joint ventures
Mulpha FKP Pty Ltd 194.3 86.4 14.4 2.0
Brookvale 7.6 – 0.3 (0.3)
Carrum Downs JV Pty Ltd 1.5 2.6 10.4 (0.6)
Formica Pty Ltd 1.8 2.0 3.5 –
Big Hepher JV Pty Ltd 5.9 7.8 – (1.9)
US Senior Living Property Trust 24.8 16.4 3.6 (6.4)
US Senior Living Tenant Trust 1.8 3.5 7.5 (1.8)
(e) Share of expenditure commitments of equity-accounted investments
There are no expenditure commitments contracted for at balance date that are payable but not provided for.
(f) Contingent liabilities of associates
There are no known contingent liabilities.
(g) Summarised financial information of joint ventures
Consolidated Group’s share of
Current Non-current Current Non-current assets assets liabilities liabilities Income Expenses $m $m $m $m $m $m
2012 151.1 24.8 62.7 40.0 38.6 76.4
2011 206.3 31.4 65.9 52.8 39.7 48.1

FKP ANNUAL REPORT 2012 81
12. OTHER ASSETS Consolidated Consolidated Group Property Trust
2012 2011 2012 2011 $m $m $m $m
Current
Deposits 0.3 0.1 – –
Prepayments 10.1 8.1 1.4 0.9
Total current other assets 10.4 8.2 1.4 0.9
Non-current
Lease incentives – 4.0 – 4.0
Total non-current other assets – 4.0 – 4.0
13. ASSETS CLASSIFIED AS HELD FOR SALEAt fair value
Investment property 155.0 73.5 155.0 73.5
Total non-current assets classified as held for sale 155.0 73.5 155.0 73.5
These assets relate to the Commercial and Industrial segment of the Consolidated Group.
14. PROPERTY, PLANT AND EQUIPMENT Consolidated Consolidated Group Property Trust
2012 2011 2012 2011 $m $m $m $m
Freehold land
At cost 7.2 7.2 – –
Accumulated impairment (6.3) – – –
0.9 7.2 – –
Residential aged care facilities
At cost 14.3 14.3 – –
Accumulated depreciation (1.8) (1.6) – –
12.5 12.7 – –
Freehold buildings
At cost 8.2 5.7 – –
Accumulated depreciation (0.7) (0.5) – –
7.5 5.2 – –
Leasehold improvements
At cost 7.1 6.6 – –
Accumulated amortisation (5.5) (4.3) – –
1.6 2.3 – –
Plant and equipment
At cost 8.0 9.5 – –
Accumulated depreciation (6.8) (6.5) – –
1.2 3.0 – –
Plant and equipment under finance lease
At cost 0.6 0.7 – –
Accumulated depreciation (0.5) (0.4) – –
0.1 0.3 – –
Total property, plant and equipment 23.8 30.7 – –

82 FKP ANNUAL REPORT 2012
14. PROPERTY, PLANT AND EQUIPMENT CONTINUED Consolidated Consolidated Group Property Trust
2012 2011 2012 2011 $m $m $m $m
Movements during the year
Freehold land
Balance at the beginning of the year 7.2 7.2 – –
Impairment (6.3) – – –
Balance at the end of the year 0.9 7.2 – –
Residential aged care facilities
Balance at the beginning of the year 12.7 12.9 – –
Additions 0.2 0.1 – –
Disposals at written down value (0.2) – – –
Depreciation (0.2) (0.3) – –
Balance at the end of the year 12.5 12.7 – –
Freehold buildings
Balance at the beginning of the year 5.2 5.0 – –
Additions 0.9 0.2 – –
Transfers 1.6 – – –
Depreciation (0.2) – – –
Balance at the end of the year 7.5 5.2 – –
Leasehold improvements
Balance at the beginning of the year 2.3 2.8 – –
Additions 0.5 0.7 – –
Amortisation (1.2) (1.2) – –
Balance at the end of the year 1.6 2.3 – –
Plant and equipment
Balance at the beginning of the year 3.3 3.6 – –
Acquired in business combinations 0.2 – – –
Additions 0.5 – – –
Depreciation (0.9) (1.5) – –
Disposals (0.2) (0.1) – –
Transfers (1.6) – – –
Transfers to investment properties – 1.3 – –
Balance at the end of the year 1.3 3.3 – –
Notes to the Financial Statements continuedFOR THE YEAR ENDED 30 JUNE 2012

FKP ANNUAL REPORT 2012 83
15. INTANGIBLE ASSETS Consolidated Consolidated Group Property Trust
2012 2011 2012 2011 $m $m $m $m
Goodwill
At carrying value – 0.1 – –
Licences
At cost 1.6 1.6 – –
Accumulated amortisation (0.7) (0.2) – –
0.9 1.4 – –
Rights
At cost 1.1 1.1 – –
Accumulated amortisation (0.5) (0.5) – –
0.6 0.6 – –
Development costs
At cost 1.3 0.7 –
Total intangible assets 2.8 2.8 – –
Movements during the year
Goodwill
Balance at the beginning of the year 0.1 0.6 – –
Impairment (0.1) (0.5) – –
Balance at the end of the year – 0.1 – –
Licences
Balance at the beginning of the year 1.4 0.5 – –
Additions – 1.1 – –
Amortisation charge (0.5) (0.2) – –
Balance at the end of the year 0.9 1.4 – –
Rights
Balance at the beginning of the year 0.6 2.1 – –
Acquired in business combinations1 10.1 – – –
Impairment1 (10.1) (1.5) – –
Balance at the end of the year 0.6 0.6 – –
Development costs
Balance at the beginning of the year 0.7 0.2 – –
Additions 1.2 0.5 – –
Impairment (0.6) – – –
Balance at the end of the year 1.3 0.7 – –
1. Refer to Note 38 for details.

84 FKP ANNUAL REPORT 2012
Notes to the Financial Statements continuedFOR THE YEAR ENDED 30 JUNE 2012
15. INTANGIBLE ASSETS CONTINUED(a) Impairment tests for goodwillGoodwill is allocated to the Consolidated Group’s Cash Generating Units (‘CGUs’) identified according to business segment.
A segment level summary of goodwill is presented below:
Consolidated Consolidated Group Property Trust
2012 2011 2012 2011 $m $m $m $m
Goodwill – Residential Communities segment – 0.1 – –
(b) Impairment tests for licences
Included in the carrying value of licences are residential aged care facility bed licences. These are not amortised as they have an indefinite useful life. The licences are issued for an unlimited period and there is no foreseeable limit to the period over which the asset is expected to generate net cash inflows for the Consolidated Group.
Residential aged care facility bed licences are allocated to the Consolidated Group’s CGUs identified according to business segment.
A segment level summary of licences is presented below:
Consolidated Consolidated Group Property Trust
2012 2011 2012 2011 $m $m $m $m
Licences – Retirements segment 0.5 0.5 – –
16. TRADE AND OTHER PAYABLES Consolidated Consolidated Group Property Trust
2012 2011 2012 2011 $m $m $m $m
Current
Trade accounts payable 18.6 19.7 – 0.7
Other payables 30.5 27.9 3.8 1.2
Payable to Parent Entity – – 16.4 1.3
Interest payable 7.1 10.2 – –
Total current payables 56.2 57.8 20.2 3.2
Non-current
Other payables 14.3 19.2 – –
Total non-current trade payables 14.3 19.2 – –
Trade accounts payable are usually due within 30 days. No interest is charged on balances paid outside normal terms.
(a) Fair values
The carrying amounts of payables approximate fair values. Refer to Note 35.
(b) Secured amounts payable
None of the payables are secured.

FKP ANNUAL REPORT 2012 85
17. INTEREST BEARING LOANS AND BORROWINGS Consolidated Consolidated Group Property Trust
2012 2011 2012 2011 $m $m $m $m
Current
Secured
Bank loans (b) 276.3 111.7 12.9 98.2
Loan from associate 11.8 15.3 – –
Other loans 3.4 2.7 – –
Finance lease liabilities 0.1 0.2 – –
Total current interest bearing loans and borrowings 291.6 129.9 12.9 98.2
Non-current
Secured
Bank loans (b) 567.7 558.2 92.1 –
Other loans – 0.3 – –
Finance lease liabilities – 0.1 – –
567.7 558.6 92.1 –
Unsecured
Convertible bonds (a) 116.3 114.3 – –
Total non-current interest bearing loans and borrowings 684.0 672.9 92.1 –
(a) Convertible bonds
The Consolidated Group issued $125.0m of senior, unsecured, guaranteed convertible bonds, due 5 January 2016, on 6 January 2011.
The convertible bonds carry a fixed coupon of 8.0%, payable on a semi-annual basis, for a term of five years. The initial conversion price of the convertible bonds is $1.014 (‘Conversion Price’), representing a 20% premium to the reference price of $0.845, being the closing price of the Consolidated Group’s stapled securities on 9 December 2010. The Conversion Price is subject to adjustment in certain circumstances.
Unless previously redeemed, purchased, converted or cancelled, the convertible bonds will be redeemed at par on 5 January 2016. Convertible bond holders have a put option at 5 January 2014 to redeem the convertible bonds. The Consolidated Group has the option to call the Convertible Bonds, in whole but not in part after 5 January 2014 if the volume weighted average price (‘VWAP’) of the Consolidated Group’s stapled securities is at least 130% of the Conversion Price for any 20 consecutive trading day period.
The convertible bonds are presented in the balance sheet as follows:
Consolidated Consolidated Group Property Trust
2012 2011 2012 2011 $m $m $m $m
Face value of bonds issued1 121.2 121.2 – –
Less: value of conversion rights2 (Note 19) (8.1) (8.1) – –
113.1 113.1 – –
Interest expense3 18.2 6.2 – –
Interest payable3 (15.0) (5.0) – –
116.3 114.3 – –
1. Net of transaction costs.
2. Represents the fair value of the conversion rights at initial recognition.
3. Interest expense/payable to date since issue on 6 January 2011.

86 FKP ANNUAL REPORT 2012
17. INTEREST BEARING LOANS AND BORROWINGS CONTINUED(b) Bank loans
The weighted average interest rate excluding margin and line fees on all loans at 30 June 2012 was 8.12% (2011: 8.48%). The following facilities were successfully refinanced/executed during the year:
— $240.0m Development Multi Option Facility (‘MOF’) refinanced for a further three years on improved pricing;
— $105.0m Property Trust Facility refinanced for a further three years to 30 June 2015;
— $80.0m Forest Place Group debt facility executed, maturing on 30 March 2017; and
— $50.0m Project Finance Facility executed to fund the construction of the Luxe apartment development.
Under the facility agreements, updated valuations of all security properties are to be provided every 24 months by the Consolidated Group. Included in current liabilities is $276.3m of interest bearing bank debt maturing in the next 12 months. This includes a $79.8m project finance facility that will be settled following the completion of Aerial and a $43.6m facility related to Port Bouvard. There is no recourse to FKP in respect of the Port Bouvard facility. Also included in current liabilities is a $122.9m bank facility which is due to expire on 30 June 2013. While the Consolidated Group’s statement of financial position classifies this banking facility as current, there has been a significant amount of work undertaken regarding the renewal or refinancing of this facility with a number of financial institutions.
(c) Financing arrangements
The Consolidated Group has access to the following lines of credit:
Consolidated Consolidated Group Property Trust
2012 2011 2012 2011 $m $m $m $m
Total facilities available
Bank loans (including bank overdraft) 898.4 865.2 105.0 103.2
Convertible bond 125.0 125.0 – –
Loan from associate 11.8 15.3 – –
Other loans 3.4 3.0 – –
Bank guarantee facilities 58.8 58.7 – –
Finance lease facility 0.1 0.3 – –
1,097.5 1,067.5 105.0 103.2
Facilities utilised at balance date
Bank loans (including bank overdraft) 844.0 669.9 105.0 98.2
Convertible bond 125.0 125.0 – –
Loan from associate 11.8 15.3 – –
Other loans 3.4 3.0 – –
Bank guarantee facilities 37.5 32.6 – –
Finance lease facility 0.1 0.3 – –
1,021.8 846.1 105.0 98.2
Facilities not utilised at balance date
Bank loans (including bank overdraft) 54.4 195.3 – 5.0
Convertible bond – – – –
Loan from associate – – – –
Other loans – – – –
Bank guarantee facilities 21.3 26.1 – –
Finance lease facility – – – –
75.7 221.4 – 5.0
(d) Restrictions as to use or withdrawal
There are no restrictions on the use or withdrawal of any facilities. However the facilities are subject to the Consolidated Group complying with covenants concerning such matters as minimum interest times cover, maximum loan to value ratio, current ratios and net tangible assets. As a result, the facilities not utilised at balance date are limited to $54.4m (2011: $76.8m).
Notes to the Financial Statements continuedFOR THE YEAR ENDED 30 JUNE 2012

FKP ANNUAL REPORT 2012 87
(e) Bank overdrafts
Interest on bank overdrafts is charged at prevailing market rates. There were no bank overdrafts at 30 June 2012 (2011: nil).
(f) Bank guarantee facilities
These facilities are used to provide bank guarantees related to projects. Fees applicable to the facilities provided by financial institutions range from 1.25% to 2.5% (2011: 1.0% to 2.5%).
(g) Assets pledged as security
In accordance with the security arrangements of liabilities, all current and non-current assets of the Consolidated Group are secured by floating charge. Those assets that are also secured by mortgage or finance lease are as follows:
Consolidated Consolidated Group Property Trust
2012 2011 2012 2011 $m $m $m $m
Current
First mortgage
Inventories 228.3 162.1 – –
Investment properties 155.0 73.5 155.0 73.5
383.3 235.6 155.0 73.5
Floating charge
Cash and cash equivalents 18.2 14.5 4.0 2.5
Trade and other receivables 66.3 42.8 0.5 16.8
Inventories 29.5 8.9 – –
Other financial assets 1.6 2.1 – –
Other assets 10.4 8.2 1.4 0.9
126.0 76.5 5.9 20.2
Total current assets pledged as security 509.3 312.1 160.9 93.7
Non-current
First mortgage
Inventories 497.5 327.4 – –
Investment properties 2,427.5 2,857.5 – 158.4
2,925.0 3,184.9 – 158.4
Finance lease
Leased plant and equipment 0.2 0.2 – –
0.2 0.2 – –
Floating charge
Trade and other receivables 7.5 6.9 355.6 249.9
Inventories 116.2 214.4 – –
Equity-accounted investments 159.7 297.9 15.9 19.2
Property, plant and equipment 23.6 30.5 – –
Intangible assets 2.8 2.8 – –
Other financial assets 0.9 2.5 – –
Other assets – 4.0 – 4.0
310.7 559.0 371.5 273.1
Total non-current assets pledged as security 3,235.9 3,744.1 371.5 431.5
(h) Defaults and breaches
During the current and prior year, there were no defaults or breaches on any of the loans.

88 FKP ANNUAL REPORT 2012
Notes to the Financial Statements continuedFOR THE YEAR ENDED 30 JUNE 2012
18. PROVISIONS Consolidated Consolidated Group Property Trust
2012 2011 2012 2011 $m $m $m $m
Current
Employee benefits 4.1 4.2 – –
Warranty maintenance 0.4 0.7 – –
Distributions payable 17.0 19.5 9.7 13.1
Total current provisions 21.5 24.4 9.7 13.1
Non-current
Employee benefits 1.8 1.7 – –
Total non-current provisions 1.8 1.7 – –
Reconciliations
Reconciliation of the carrying amounts of each class of provision, except for employee benefits, is set out below:
Consolidated Consolidated Group Property Trust
2012 2011 2012 2011 $m $m $m $m
Warranty maintenance
Carrying amount at the beginning of the year 0.7 0.9 – –
Payments made during the year (0.3) – – –
Unused amounts reversed – (0.2) – –
Carrying amount at the end of the year 0.4 0.7 – –
Distributions payable
Carrying amount at the beginning of the year 19.5 11.6 13.1 11.6
Provisions made during the year1 34.0 36.1 20.5 22.7
Payments made during the year (36.5) (28.2) (23.9) (21.2)
Carrying amount at the end of the year 17.0 19.5 9.7 13.1
1. Date of payment for the final dividend/distribution for the year ended 30 June 2012 is 28 September 2012 (2011: 30 September 2011).
19. OTHER FINANCIAL LIABILITIESCurrent
Interest rate swap derivative 12.2 2.2 – –
Put option liability to acquire syndicate shares1 1.8 2.6 – –
PSA derivative liability2 9.3 – – –
Total current other financial liabilities 23.3 4.8 – –
Non-current
Interest rate swap derivative2 28.5 7.6 – –
Put option liability to acquire syndicate shares1 5.9 7.1 – –
PSA derivative liability 3.9 – – –
Conversion rights3 1.2 4.6 – –
Total non-current other financial liabilities 39.5 19.3 – –
1. Refer to Note 31(f) for further details.
2. Pursuant to the Australian Property Services Agreement (‘PSA’) with Retirement Villages Group (‘RVG’), executed in November 2008, the Consolidated Group committed to
reinvesting $50.3m in present value terms, of the fees payable to it under the agreement, to pay up fully paid RVG securities. The PSA derivative liability arises as a result of the
shortfall between the PSA fees reinvested and the Consolidated Group’s proportionate share of the underlying RVG fund. The liability of $13.2m is measured at fair value through
profit and loss and is recognised to capture the future cumulative shortfalls expected to arise. Refer to Note 31(f) for further details.
3. Relates to the conversion option on the convertible bonds issued in the prior year. Refer to Note 17(a).
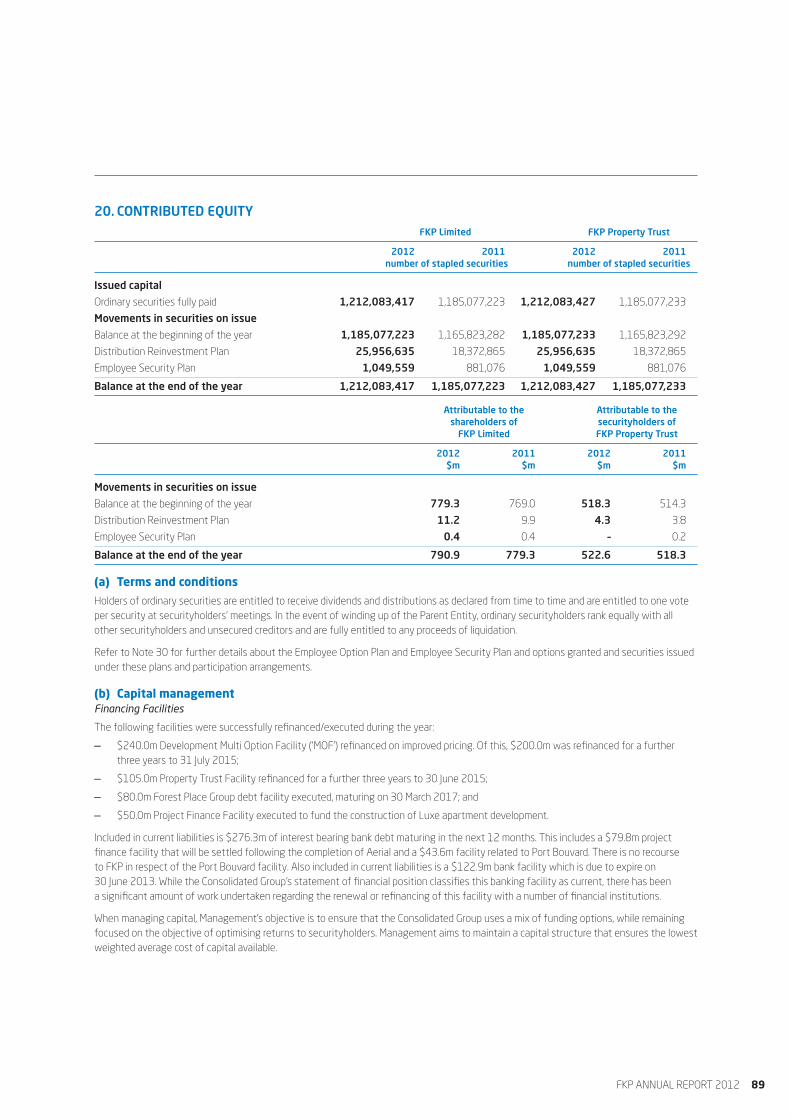
FKP ANNUAL REPORT 2012 89
20. CONTRIBUTED EQUITY FKP Limited FKP Property Trust
2012 2011 2012 2011 number of stapled securities number of stapled securities
Issued capital
Ordinary securities fully paid 1,212,083,417 1,185,077,223 1,212,083,427 1,185,077,233
Movements in securities on issue
Balance at the beginning of the year 1,185,077,223 1,165,823,282 1,185,077,233 1,165,823,292
Distribution Reinvestment Plan 25,956,635 18,372,865 25,956,635 18,372,865
Employee Security Plan 1,049,559 881,076 1,049,559 881,076
Balance at the end of the year 1,212,083,417 1,185,077,223 1,212,083,427 1,185,077,233
Attributable to the Attributable to the shareholders of securityholders of FKP Limited FKP Property Trust
2012 2011 2012 2011 $m $m $m $m
Movements in securities on issue
Balance at the beginning of the year 779.3 769.0 518.3 514.3
Distribution Reinvestment Plan 11.2 9.9 4.3 3.8
Employee Security Plan 0.4 0.4 – 0.2
Balance at the end of the year 790.9 779.3 522.6 518.3
(a) Terms and conditions
Holders of ordinary securities are entitled to receive dividends and distributions as declared from time to time and are entitled to one vote per security at securityholders’ meetings. In the event of winding up of the Parent Entity, ordinary securityholders rank equally with all other securityholders and unsecured creditors and are fully entitled to any proceeds of liquidation.
Refer to Note 30 for further details about the Employee Option Plan and Employee Security Plan and options granted and securities issued under these plans and participation arrangements.
(b) Capital managementFinancing Facilities
The following facilities were successfully refinanced/executed during the year:
— $240.0m Development Multi Option Facility (‘MOF’) refinanced on improved pricing. Of this, $200.0m was refinanced for a further three years to 31 July 2015;
— $105.0m Property Trust Facility refinanced for a further three years to 30 June 2015;
— $80.0m Forest Place Group debt facility executed, maturing on 30 March 2017; and
— $50.0m Project Finance Facility executed to fund the construction of Luxe apartment development.
Included in current liabilities is $276.3m of interest bearing bank debt maturing in the next 12 months. This includes a $79.8m project finance facility that will be settled following the completion of Aerial and a $43.6m facility related to Port Bouvard. There is no recourse to FKP in respect of the Port Bouvard facility. Also included in current liabilities is a $122.9m bank facility which is due to expire on 30 June 2013. While the Consolidated Group’s statement of financial position classifies this banking facility as current, there has been a significant amount of work undertaken regarding the renewal or refinancing of this facility with a number of financial institutions.
When managing capital, Management’s objective is to ensure that the Consolidated Group uses a mix of funding options, while remaining focused on the objective of optimising returns to securityholders. Management aims to maintain a capital structure that ensures the lowest weighted average cost of capital available.

90 FKP ANNUAL REPORT 2012
20. CONTRIBUTED EQUITY CONTINUED(b) Capital management continuedFinancing Facilities continued
Management may adjust the Consolidated Group’s capital structure to take advantage of favourable changes in the cost of capital. This could include changing the amount of dividends to be paid to securityholders, returning capital to securityholders or adjusting debt levels.
Underlying profit is determined by adjusting the statutory profit to reflect the Directors’ assessment of the result for the ongoing business activities of the Consolidated Group in accordance with AICD/Finsia principles. To determine the realised underlying profit, the retirement revaluation which is included in the underlying profit is excluded.
Primarily due to the delay in Aerial settlements the Board gearing has increased to 39% and distributions from underlying profit is 79%.
Under the development multi-option facility, the retirement syndicate facility and the convertible bonds, there is a requirement to maintain net tangible assets with a carrying value per the financial statements of at least $1,000.0m at all times.
The Consolidated Group is not subject to any other externally imposed capital requirements.
21. RESERVES AND RETAINED PROFITS/(LOSSES)
Attributable to the Attributable to the shareholders of securityholders of FKP Limited FKP Property Trust
2012 2011 2012 2011 $m $m $m $m
Reserves
Equity-settled employee benefits 13.9 13.2 – –
Foreign currency translation reserve (32.0) (36.0) (1.0) (1.4)
Syndicate options reserve (5.1) (6.1) – –
Fair value reserve (17.9) – – –
Total reserves (41.1) (28.9) (1.0) (1.4)
Movement in reserves
Equity-settled employee benefits
Balance at the beginning of the year 13.2 13.5 – –
Share-based payment 0.7 (0.3) – –
Balance at the end of the year 13.9 13.2 – –
Foreign currency reserve
Balance at the beginning of the year (36.0) (26.1) (1.4) 1.8
Translation of foreign operations 4.0 (9.9) 0.4 (3.2)
Balance at the end of the year (32.0) (36.0) (1.0) (1.4)
Syndicate options reserve
Balance at the beginning of the year (5.7) – – –
Fair value gain/(loss) on unexercised syndicate put options 0.6 (5.7) – –
Balance at the end of the year (5.1) (5.7) – –
Fair value reserve
Balance at the beginning of the year (0.4) – – –
Fair value loss on transactions with owners (17.5) (0.4) – –
Balance at the end of the year (17.9) (0.4) – –
Retained (losses)/profits
Balance at the beginning of the year 318.1 258.0 (106.5) (93.3)
Net (loss)/profit attributable to owners (352.9) 73.0 2.6 9.3
Dividends and distributions recognised during the year (13.2) (12.9) (20.5) (22.5)
Retained earnings at the end of the year (48.0) 318.1 (124.4) (106.5)
Notes to the Financial Statements continuedFOR THE YEAR ENDED 30 JUNE 2012

FKP ANNUAL REPORT 2012 91
Nature and purpose of reserves(i) Equity-settled employee benefits reserve
The equity-settled employee benefits reserve is used to recognise the grant date fair value of options issued to employees but not exercised and/or options which have lapsed, with a corresponding increase in employee expense in the statement of comprehensive income.
(ii) Foreign currency reserve
Exchange differences arising on translation of the foreign jointly controlled entities are recognised in other comprehensive income as described in Note 1(ee) and accumulated in a separate reserve within equity. The cumulative amount is reclassified to the statement of comprehensive income when the net investment is disposed of.
(iii) Syndicate options reserve
The syndicate option reserve includes a fair value reserve which represents the fair value adjustments on additional Clayfield and Cleveland syndicate units acquired during the year.
(iv) Fair value reserve
Transactions with non-controlling interests that do not result in a loss of control result in an adjustment between the carrying amounts of the controlling and non-controlling interests to reflect their relative interests in the subsidiary. Any difference between the amount of the adjustment to non-controlling interests and any consideration paid or received is recognised within the fair value reserve.
22. DIVIDENDS AND DISTRIBUTIONSDetails of dividends and distributions proposed or paid by the Consolidated Group are:
Total Franked Percentage Cents amount Date of tax rate franked per security $m payment % %
2012
Dividends/distributions recognised in the current year:
Interim 2012 distribution 1.40 16.8 30 March 2012 30 36
Final 2012 distribution 1.40 16.9 28 September 2012 30 43
2.80 33.7
2011
Dividends/distributions recognised in the prior year:
Interim 2011 distribution 1.40 16.4 31 March 2011 30 43
Final 2011 distribution 1.60 19.0 30 September 2011 30 31
3.00 35.4
Consolidated Consolidated Group Property Trust
2012 2011 2012 2011 $m $m $m $m
Dividend franking account
Balance of the 30% franking credits at year end 8.9 9.3 – –
The above available amounts are based on the balance of the dividend franking account at year end adjusted for:
— franking credits that will arise from the payment of the amount of the provision for income tax;
— franking debits that will arise from the payment of dividends recognised as a liability at the year-end;
— franking credits that will arise from the receipt of dividends recognised at the year-end; and
— franking credits that the Parent Entity may be prevented from distributing in subsequent years.

92 FKP ANNUAL REPORT 2012
23. NON-CONTROLLING INTERESTS Consolidated Consolidated Group Property Trust
2012 2011 2012 2011 $m $m $m $m
Non-controlling interests in controlled entities
Interests in retained profits at the beginning of the year 34.2 23.5 – –
Non-controlling interests acquired during the year1 (109.8) 3.6 – –
Interests in profit from ordinary activities after income tax (9.6) 7.8 – –
Less: dividends recognised during the year2 (0.2) (0.7) – –
Interests in retained profits at the end of the year (85.4) 34.2 – –
Interests in reserves at beginning of the year (0.9) – – –
Non-controlling interests acquired during the year1 0.5 (0.9) – –
Interests in reserves at the end of the year (0.4) (0.9) – –
Interests in share capital at the beginning of the year 19.2 13.5 – –
Non-controlling interests acquired during the year1 138.8 5.7 – –
Interests in share capital at the end of the year 158.0 19.2
Total non-controlling interests 72.2 52.5 – –
1. Effective 1 July 2010, the Cleveland and Clayfield Syndicate accounts were consolidated into the Consolidated Group. Effective 31 May 2012 the accounts of Port Bouvard
were consolidated into the Consolidated Group. Refer to Notes 11 and 38 for further details.
2. Dividends recognised during the year relate to dividends made by Forest Place Group Limited.
24. NOTES TO THE CASH FLOW STATEMENTS(a) Reconciliation to cash at the end of the year
For the purposes of the cash flow statements, cash includes cash on hand and in banks and investments in money market instruments, net of outstanding bank overdrafts. Cash at the end of the year as shown in the cash flow statements is reconciled to the related items in the balance sheet as follows:
Consolidated Consolidated Group Property Trust
2012 2011 2012 2011 $m $m $m $m
Cash and cash equivalents 18.2 14.5 4.0 2.5
Bank overdraft – – – –
Cash balance per the cash flow statements 18.2 14.5 4.0 2.5
Notes to the Financial Statements continuedFOR THE YEAR ENDED 30 JUNE 2012

FKP ANNUAL REPORT 2012 93
(b) Reconciliation of net cash flow from operating activities to profit after income tax
Consolidated Consolidated Group Property Trust
2012 2011 2012 2011 $m $m $m $m
Operating (loss)/profit after income tax (359.9) 90.1 2.6 9.3
Depreciation and amortisation 3.0 3.2 – –
Impairment of intangible assets 10.8 2.0 – –
Impairment of property, plant and equipment 6.3 – – –
Net loss on sale of property, plant and equipment and investment properties 6.9 0.6 6.9 0.6
Share of loss of equity-accounted investments 113.2 8.3 0.2 6.4
Distributions from equity-accounted investments 5.7 20.1 0.7 1.3
Interest receivable – – (22.8) (20.4)
Change in fair value of investment properties 367.2 (75.2) 22.1 12.6
Change in fair value of financial assets 41.3 (10.2) – –
Securities/options issued to employees 0.4 0.6 – –
Equity-settled share-based payments 0.7 (0.3) – –
Interest capitalised to investment properties (7.3) – (6.0) –
Amortisation of loan balances 14.7 13.6 – –
Fair value adjustment on consolidation of the Syndicates – (0.5) – –
Change in operating assets and liabilities net of effects of purchases and disposals of subsidiaries during the year
Decrease/(increase) in receivables (22.9) 28.5 1.1 12.9
Decrease/(increase) in inventories (63.4) (85.1) – –
Decrease/(increase) in other assets 1.4 11.6 (1.1) (1.0)
Decrease/(increase) in deferred tax assets (45.4) (15.2) – –
Increase/(decrease) in payables (2.8) (15.2) 1.9 (4.8)
Increase/(decrease) in unearned income and resident loans (23.9) 33.2 – (1.4)
Increase/(decrease) in deferred tax liabilities (87.2) 44.7 – –
Increase/(decrease) in provision for income tax 0.1 – – –
Increase/(decrease) in provisions (0.4) (0.4) – –
Net cash (used in)/provided by operating activities (41.5) 54.4 5.6 15.5
(c) Non-cash financing and investing activities
During the year the Consolidated Group reinvested $15.5m (2011: $13.7m) via a Distribution Reinvestment Plan. The above transaction has not been reflected in the cash flow statement.
(d) Restrictions on cash
Cash not available to the Consolidated Group for use includes capital replacement funds of $2.3m (2011: $2.5m). A statutory charge, imposed under the Retirement Villages Act 1999 (QLD), exists over all amounts held in capital replacement funds which restricts the use for which these funds can be applied.

94 FKP ANNUAL REPORT 2012
25. SEGMENT INFORMATIONOperating segments are identified on the basis of internal reports that are regularly reviewed by the chief decision maker in order to allocate resources to the segment and assess its performance.
(a) Reportable segments
The principal products and services delivered by the Consolidated Group, from which each reportable segment derives revenue are as follows:
Residential Communities Development, construction and supply of land and residential property for sale, ranging from small infill projects to master planned residential communities.
Retirement Retirement homes and independent living units provided along with the service of management for a majority of villages.
Commercial and Industrial Development, construction and management of income producing commercial, retail and industrial property.
Funds Management and Investments Delivery of a risk return profile to investors and management of income producing properties.
Inter-segment pricing is determined on an arm’s length basis.
The accounting policies used by the Consolidated Group in reporting segments internally are the same as those contained in Note 1 to the accounts and in the prior period.
(b) Segment revenues and results
The following is an analysis of the Consolidated Group’s revenue and results by reportable operating segment for the periods under review:
Funds Total Commercial Management Reportable Residential and and Operating Unallocated Consolidated Communities Retirement Industrial Investments Segments Items 3 Group $m $m $m $m $m $m $m
2012
Revenue
Revenue from outside the Consolidated Group1 102.6 78.3 29.4 3.1 213.4 0.4 213.8
Total segment revenue2 102.6 78.3 29.4 3.1 213.4 0.4 213.8
Result
Net segment result (45.3) (226.4) (19.5) (9.9) (301.1) (65.2) (366.3)
Share of net loss of equity-accounted investments (31.7) – (2.6) (78.9) (113.2) – (113.2)
Segment result (77.0) (226.4) (22.1) (88.8) (414.3) (65.2) (479.5)
Interest expense (12.9)
Net profit from ordinary activities before income tax (492.4)
Income tax benefit 132.5
Net profit from ordinary activities after income tax (359.9)
Depreciation and amortisation (0.2) (0.7) – – (0.9) (2.1) (3.0)
Change in fair value of resident loans – 86.7 – – 86.7 – 86.7
Change in fair value of investment properties – (346.0) (21.2) – (367.2) – (367.2)
Change in fair value of financial assets – – – – – (41.3) (41.3)
Inventory write-down to net realisable value (50.0) – (1.0) – (51.0) – (51.0)
Impairment of trade and other receivables (3.4) (1.8) (0.1) – (5.3) – (5.3)
Impairment of property, plant and equipment (6.3) – – – (6.3) – (6.3)
Impairment of intangible assets – (0.6) – (10.1) (10.7) (0.1) (10.8)
1. Segment revenue represents an aggregation of sale of goods and construction contract revenue, revenue from rendering of services and other revenue. Each of these represents
a separate line item on the face of the statement of comprehensive income.
2. Segment revenue is net of inter-segment revenue.
3. The following items are of a ‘corporate’ nature, which are not allocated to operating segments as they are not considered part of the core operations of any segment.
Notes to the Financial Statements continuedFOR THE YEAR ENDED 30 JUNE 2012

FKP ANNUAL REPORT 2012 95
Funds Total Commercial Management Reportable Residential and and Operating Unallocated Consolidated Communities Retirement Industrial Investments Segments Items 3 Group $m $m $m $m $m $m $m
2011
Revenue
Revenue from outside the Consolidated Group1 159.2 85.2 103.9 1.1 349.4 1.7 351.1
Total segment revenue2 159.2 85.2 103.9 1.1 349.4 1.7 351.1
Result
Net segment result 31.8 122.3 9.5 (0.7) 162.9 (10.4) 152.5
Share of net loss of equity-accounted investments 5.7 – (0.7) (13.3) (8.3) – (8.3)
Segment result 37.5 122.3 8.8 (14.0) 154.6 (10.4) 144.2
Interest expense (26.0)
Net profit from ordinary activities before income tax 118.2
Income tax expense (28.1)
Net profit from ordinary activities after income tax 90.1
Depreciation and amortisation (0.2) (0.4) (0.1) – (0.7) (2.5) (3.2)
Change in fair value of resident loans – (6.3) – – (6.3) – (6.3)
Change in fair value of investment properties – 87.8 (12.6) – 75.2 – 75.2
Change in fair value of financial assets – – – – – 10.2 10.2
Impairment of intangible assets – – (2.0) – (2.0) – (2.0)
Allowance for impairment on receivables 0.8 (0.1) 2.0 – 2.7 – 2.7
Inventory write-down to net realisable value – – (1.3) – (1.3) – (1.3)
1. Segment revenue represents an aggregation of sale of goods and construction contract revenue, revenue from rendering of services and other revenue. Each of these represents
a separate line item on the face of the statement of comprehensive income.
2. Segment revenue is net of inter-segment revenue.
3. The following items are of a ‘corporate’ nature, which are not allocated to operating segments as they are not considered part of the core operations of any segment.
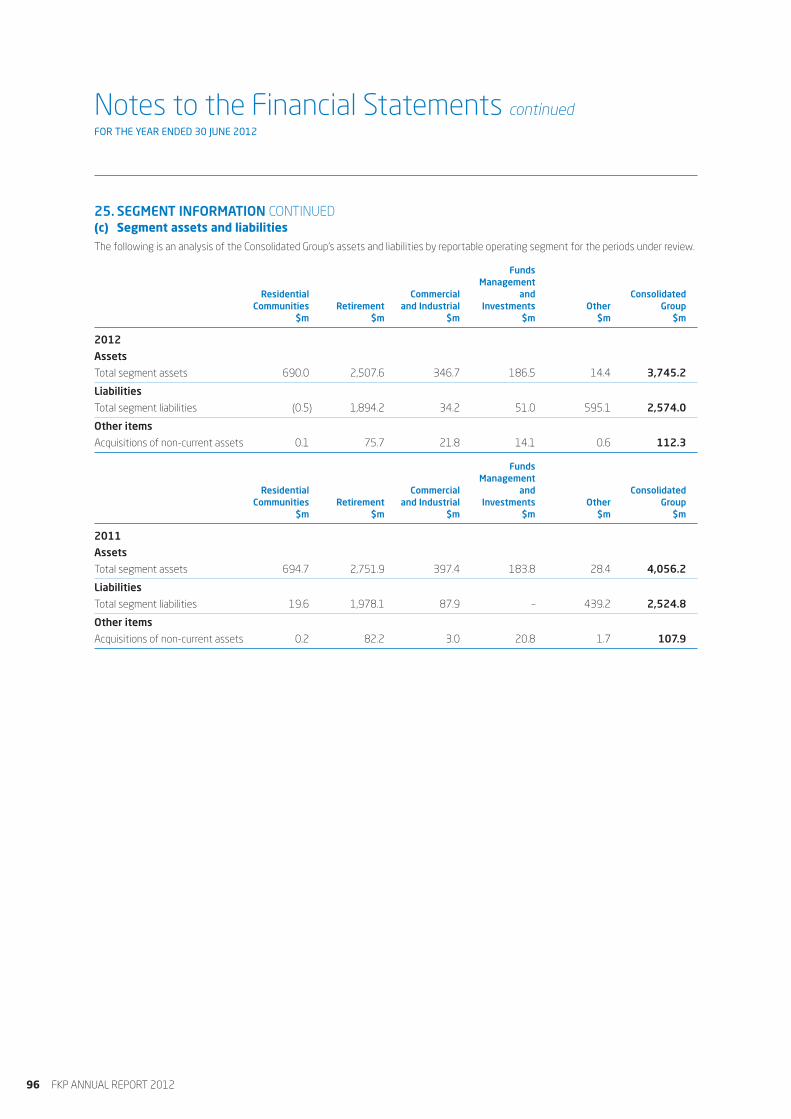
96 FKP ANNUAL REPORT 2012
25. SEGMENT INFORMATION CONTINUED(c) Segment assets and liabilities
The following is an analysis of the Consolidated Group’s assets and liabilities by reportable operating segment for the periods under review.
Funds Management Residential Commercial and Consolidated Communities Retirement and Industrial Investments Other Group $m $m $m $m $m $m
2012
Assets
Total segment assets 690.0 2,507.6 346.7 186.5 14.4 3,745.2
Liabilities
Total segment liabilities (0.5) 1,894.2 34.2 51.0 595.1 2,574.0
Other items
Acquisitions of non-current assets 0.1 75.7 21.8 14.1 0.6 112.3
Funds Management Residential Commercial and Consolidated Communities Retirement and Industrial Investments Other Group $m $m $m $m $m $m
2011
Assets
Total segment assets 694.7 2,751.9 397.4 183.8 28.4 4,056.2
Liabilities
Total segment liabilities 19.6 1,978.1 87.9 – 439.2 2,524.8
Other items
Acquisitions of non-current assets 0.2 82.2 3.0 20.8 1.7 107.9
Notes to the Financial Statements continuedFOR THE YEAR ENDED 30 JUNE 2012

FKP ANNUAL REPORT 2012 97
26. COMMITMENTSDetails of the Consolidated Group’s lease commitments as lessee are as follows:
Consolidated Consolidated Group Property Trust
2012 2011 2012 2011 $m $m $m $m
Non-cancellable operating lease expense commitments
Future operating lease commitments not recognised at balance date:
Within one year 4.4 4.2 – –
One year or later and no later than five years 2.8 6.8 – –
Commitments not recognised in the financial statements 7.2 11.0 – –
The above amounts payable arise from lease agreements for office and retail premises accommodation containing options to renew, which have not yet been exercised.
Consolidated Consolidated Group Property Trust
2012 2011 2012 2011 $m $m $m $m
Finance lease and hire purchase payment commitments
Finance lease and hire purchase payment commitments are payable:
Within one year 0.1 0.1 – –
One year or later and no later than five years – 0.2 – –
Total minimum lease and hire purchase payments 0.1 0.3 – –
The Consolidated Group leases motor vehicles and equipment under finance leases and hire purchase agreements expiring from one to five years. At the end of the lease or agreement the Consolidated Group has the option to purchase the asset at the nominated residual value. These lease liabilities have been provided for in the financial statements (refer to finance lease liabilities in Note 17).
Interest on finance leases is charged at prevailing market rates. The weighted average interest rate for all finance leases as at 30 June 2012 is 8.4% (2011: 8.4%).
27. CONTINGENT LIABILITIES(a) Bank guarantees
The Consolidated Group has various performance and other guarantees provided to third parties. Refer to Note 17.
28. FINANCE COSTS CAPITALISEDFinance costs have been capitalised during the year as part of the carrying amounts of the following assets:
Consolidated Consolidated Group Property Trust
2012 2011 2012 2011 $m $m $m $m
Inventories – land and development properties held for resale 61.1 52.7 – –
Investment properties under construction 7.3 1.6 6.0 –
68.4 54.3 6.0 –
Interest was capitalised at a weighted average rate of 9.0% (2011: 9.5%).

98 FKP ANNUAL REPORT 2012
29. KEY MANAGEMENT PERSONNEL DISCLOSURES(a) Directors
The names and positions held by each person holding a position of Director of the Consolidated Group during the 2011 and/or 2012 financial years were:
SH Lee Chairman (Non-Executive)P R Brown1 Managing Director and Chief Executive OfficerL R McKinnon Non-Executive DirectorJ E F Frayne Non-Executive DirectorG C Dyer2 Non-Executive DirectorM Jewell3 Executive DirectorW Chow4 Non-Executive Alternate Director (for SH Lee)P Parker5 Non-Executive Director
D C Crombie6 Deputy Chairman (Non-Executive)
1. Mr Brown announced his decision to retire as Managing Director and Chief Executive Officer of the Consolidated Group on 20 August 2012. Mr Brown will continue as Managing
Director and Chief Executive Officer until no later than February 2013.
2. Mr Dyer was a Non-Executive Director until his resignation on 30 July 2012.
3. Mr Jewell was appointed Executive Director on 20 July 2011 and retired from the Board of Directors effective 20 August 2012. Mr Jewell will continue on with the Consolidated
Group as Director of Development.
4. Mr Chow was appointed Alternate Director for Mr Lee on 25 November 2011.
5. Mr Parker was a Non-Executive Director until his resignation on 21 February 2012.
6. Mr Crombie was the Non-Executive Deputy Chairman from the beginning of the financial year ended 30 June 2011 until his resignation on 26 November 2010.
(b) Other Key Management Personnel
The following persons also held authority and responsibility for planning, directing and controlling the Consolidated Group during the year:
D A Hunt Chief Financial Officer
G E Grady Chief Operating Officer
(c) Aggregate of remuneration for Key Management Personnel
Consolidated Consolidated Group Property Trust
2012 2011 2012 2011 $ $ $ $
Short-term employee benefits 3,770,391 5,786,262 – –
Post-employment benefits 166,485 248,019 – –
Equity compensation 203,065 471,732 – –
Other compensation1 181,155 442,521 – –
Key management personnel compensation2 4,321,096 6,948,534 – –
Detailed remuneration disclosures are provided in the remuneration report.
1. Other compensation is comprised of termination benefits.
2. A restructure of the FKP Executive group took place in the year ended 30 June 2012 with the changes taking effect from 1 July 2011. The restructures resulted in all property
sector Executives now reporting directly through to the Chief Operating Officer and newly appointed Executive Director (Director of Development effective 20 August 2012).
Therefore, Ms Delfabbro, Mr Laboo, Mr Hall and Mr Tucker were no longer considered to be key management personnel (‘KMP’) for the purpose of this report. However, the total
of the remuneration received in 2011 has been disclosed to provide consistency with figures reported in the prior year.
Notes to the Financial Statements continuedFOR THE YEAR ENDED 30 JUNE 2012

FKP ANNUAL REPORT 2012 99
(d) Equity instrument disclosures relating to Key Management PersonnelEquity holdings and transactions
The movement during the reporting period in the number of securities of the Consolidated Group held directly, indirectly or beneficially, by key management personnel, including their personally-related entities and close family members, is as follows:
Balance at Received Balance at the beginning on exercise the end of the year Purchased 1 of options Sales Other 2 of the year
2012
Directors
SH Lee3 302,728,743 – – – 15,117,823 317,846,566
P R Brown 3,535,564 5,000,000 – – 85,770 8,621,334
M Jewell4 – – – – – –
L R McKinnon – – – – – –
J E F Frayne 54,788 – – – – 54,788
G C Dyer5 – – – – – –
P Parker6 44,097,684 – – (24,153,560) – 19,944,124
W Chow7 – – – – – –
Other key management personnel
D A Hunt 1,428 2,173 – – – 3,601
G E Grady 1,428 2,173 – – – 3,601
2011
Directors
SH Lee3 293,133,558 13,003 – – 9,582,182 302,728,743
D C Crombie 432,660 – – – 6,364 439,024
P R Brown 3,535,564 – – – – 3,535,564
P Parker 44,097,684 – – – – 44,097,684
L R McKinnon – – – – – –
J E F Frayne 54,788 – – – – 54,788
G C Dyer – – – – – –
Other key management personnel
D A Hunt – 1,428 – – – 1,428
G E Grady – 1,428 – – – 1,428
S E Stewart8 30,193 2,415 – – – 32,608
E L Delfabbro9 39,247 1,428 – – – 40,675
J M Laboo9 1,614 1,428 – – – 3,042
A M Hall9 4,287 1,428 – – – 5,715
M Tucker9 1,810 1,428 – – – 3,238
1. Includes securities issued under the Employee Share Plan. Refer to Note 30.
2. Includes securities issued under the Distribution Reinvestment Plan.
3. Mr Lee acquired a controlling interest in Mulpha International Bhd (‘MIB’) on 16 July 2008. MIB is the 100% beneficial owner of Mulpha Australia Limited, Mulpha Investments Pty
Ltd, Mulpha Strategic Limited, HDFI Nominees Pty Ltd and Rosetec Investments Limited (collectively the ‘Mulpha Group’). The Mulpha Group is a substantial securityholder in the
Consolidated Group.
4. Mr Jewell was appointed Executive Director effective 20 July 2011 and retired from the Board of Directors effective 20 August 2012. Mr Jewell will continue on with the
Consolidated Group as Director of Development.
5. Mr Dyer resigned as a Non-Executive Director on 30 July 2012.
6. Mr Parker was a Non-Executive Director until his resignation on 21 February 2012.
7. Mr Chow was appointed as Alternate Director for Mr Lee on 25 November 2011.
8. Ms Stewart was the General Counsel and Group Company Secretary from the beginning of the financial year ended 30 June 2011 until her resignation on 29 June 2011.
9. A restructure of the FKP Executive group took place in the year ended 30 June 2012 with the changes taking effect from 1 July 2011. The restructures resulted in all property
sector Executives now reporting directly through to the Chief Operating Officer and newly appointed Executive Director (Director of Development effective 20 August 2012).
Therefore, Ms Delfabbro, Mr Laboo, Mr Hall and Mr Tucker were no longer considered to be KMP for the purpose of this report. However, the total of the remuneration received in
2011 has been disclosed to provide consistency with figures reported in the prior year.

100 FKP ANNUAL REPORT 2012
Notes to the Financial Statements continuedFOR THE YEAR ENDED 30 JUNE 2012
29. KEY MANAGEMENT PERSONNEL DISCLOSURES CONTINUED(d) Equity instrument disclosures relating to Key Management Personnel continuedOptions holdings and transactions
The movement during the reporting period in the number of options over ordinary securities of the Consolidated Group held directly, indirectly or beneficially, by key management personnel, including their personally-related entities and close family members is as follows:
Employee Option Plan – Subject to Service Period Conditions (‘EOPS’)1
Balance Forfeited/ at the Granted lapsed Balance beginning during during at the end Key Management Personnel of the year the year the year of the year
2012
P R Brown – – – –
M Jewell2 – – – –
D A Hunt – – – –
G E Grady 2,250,000 – – 2,250,000
2011
P R Brown – – – –
D A Hunt – – – –
G E Grady 2,250,000 – – 2,250,000
S E Stewart3 1,098,178 – 1,098,178 –
E L Delfabbro4 1,874,602 – 150,000 1,724,602
J M Laboo4 1,848,178 – 150,000 1,698,178
A M Hall4 1,150,000 – 50,000 1,100,000
M Tucker4 1,048,178 – 100,000 948,178
Employee Option Plan – Subject to Performance Conditions (‘EOP’):
Balance Forfeited/ at the Granted lapsed Balance beginning during during at the end Key Management Personnel of the year the year the year of the year
2012
P R Brown – – – –
D A Hunt 3,000,000 – – 3,000,000
G E Grady – – – –
M Jewell2 – 3,000,000 – 3,000,000
2011
P R Brown – – – –
D A Hunt – 3,000,000 – 3,000,000
G E Grady – – – –
S E Stewart3 – – – –
E L Delfabbro4 – – – –
J M Laboo4 – – – –
A M Hall4 – – – –
M Tucker4 – – – –
1. EOPS are no longer issued to executives and staff.
2. Mr Jewell was appointed Executive Director effective 20 July 2011 and retired from the Board of Directors effective 20 August 2012. Mr Jewell will continue on with the
Consolidated Group as Director of Development.
3. Ms Stewart was the General Counsel and Group Company Secretary from the beginning of the financial year ended 30 June 2011 until her resignation on 29 June 2011.
4. A restructure of the FKP executive group took place in the year ended 30 June 2012 with the changes taking effect from 1 July 2011. The restructures resulted in all property
sector executives now reporting directly through to the Chief Operating Officer and newly appointed Executive Director (Director of Development effective 20 August 2012).
Therefore, Ms Delfabbro, Mr Laboo, Mr Hall and Mr Tucker were no longer considered to be KMP for the purpose of this report. However, the options holdings and transactions
in 2011 have been disclosed in this report to provide consistency with figures reported in the prior year.

FKP ANNUAL REPORT 2012 101
(e) Other transactions with Key Management Personnel
A related entity of Mr Parker, Philip Parker Pty Ltd as trustee for the Parker Family Trust trading as Storage Choice Albion, leases storage space to the Consolidated Group on a monthly basis. This has been done on normal commercial rates. During the year, an amount of $24,583 (2011: $27,386) has been paid to this related entity for the rental of this storage space.
30. SHARE-BASED PAYMENTS(a) Employee Security Plan (‘ESP’)
A scheme under which shares may be issued by FKP Limited to employees for no cash consideration was approved by a special resolution of Forrester Kurts Properties Limited made on 28 October 1999. The scheme was amended by a resolution of the Board made on 28 February 2001 and further amended by a special resolution of FKP Limited on 29 October 2004 in relation to the stapling of each of the shares in FKP Limited to each of the units in the Property Trust effective from 12 November 2004 and confirmed by a resolution passed at the 2007 AGM. The scheme provides all employees (upon completion of one year’s service) the opportunity to be rewarded for their service to the Consolidated Group by offering them $1,000 worth of FKP securities, at no cost to the employee. Employees may elect not to participate in the scheme.
The Consolidated Group issued 1,049,559 securities to employees pursuant to the ESP during the financial year ended 30 June 2012 (2011: 881,076). The total amount received from employees was nil (2011: nil). The expense recognised in the statement of comprehensive income during the year was $0.4m (2011: $0.6m).
While there are no stipulated performance hurdles which must be achieved by an employee to be offered securities, the Board has absolute discretion in determining the conditions for participation in the scheme. The scheme has been established as an important incentive to all employees to achieve the Consolidated Group’s strategic objectives and to more closely align their own interests with those of other securityholders by owning securities in the Consolidated Group. Employees are restricted from dealing with securities issued to them pursuant to the ESP for a period which expires on the earlier of three years from the date of issue or their termination of employment with the Consolidated Group. Non-Executive Directors are not eligible to participate in the ESP.
(b) Employee options plans
The Employee Option Plan was established with the approval of a special resolution of FKP Limited made on 28 October 1999, amended by a special resolution of FKP Limited made on 29 October 2004 in relation to the stapling of each of the shares in FKP Limited to each of the units in the Property Trust effective from 12 November 2004 and confirmed by a resolution passed at the 2007 AGM. In accordance with the provisions of the EOP, executives and key employees are invited to participate in the plan based on their ability to influence the future growth and success of the Consolidated Group.
Each employee security option converts into one ordinary security of the Consolidated Group on exercise. No amounts are paid or payable by the recipient on receipt of the option. The options carry neither rights to distributions nor voting rights. Options may be exercised at any time from the exercise date to the date of expiry.
The Consolidated Group provides long-term incentives in the form of equity-based remuneration to executives through the operation of the following plans:
— Employee Security Plan (‘ESP’)1;
— Employee Option Plan – subject to Service Period Conditions (‘EOPS’)2; and
— Employee Option Plan – subject to Performance Conditions (‘EOP’).
1. Refer to Note 30(a) above.
2. EOPS are no longer issued to executives and staff.

102 FKP ANNUAL REPORT 2012
Notes to the Financial Statements continuedFOR THE YEAR ENDED 30 JUNE 2012
30. SHARE-BASED PAYMENTS CONTINUED(b) Employee options plans continuedEOPS
The EOPS is a long-term incentive scheme, with the purpose being to retain key employees and align remuneration with the long-term performance of the Consolidated Group. Under the EOPS, executives may be issued with options over stapled securities of the Consolidated Group, which are exercisable on a one-for-one basis. There is no amount paid or payable to the Consolidated Group by the executives on receipt of a grant of options under the EOPS. Between vesting and expiry, participants have one year during which they may exercise their options by paying the exercise price for their options to the Consolidated Group.
Participants in the EOPS must remain employed with FKP for three years from grant in order for the options to vest. The exercise price, which functions as an intrinsic performance hurdle, is set by the Board and is typically equal to or greater than the Consolidated Group’s stapled security price at the date of grant.
There will be no further issues of options under the EOPS subject to Service Period Conditions only. There were no EOPS granted during the year.
EOP
The EOP is a long-term incentive scheme, with the purpose being to retain key employees and align remuneration with the long-term performance of the Consolidated Group. Under the EOP, executives may be issued with options over stapled securities of the Consolidated Group, which are exercisable on a one-for-one basis. There is no amount paid or payable to the Consolidated Group by the executives on receipt of a grant of options under the EOP. Between vesting and expiry, participants have one year during which they may exercise their options by paying the exercise price for their options to the Consolidated Group.
The vesting of options granted under the EOP is subject to performance hurdles including total shareholder return (‘TSR’)1 and underlying profit after tax (‘UPT’)2 targets, set by the Board. All future grants of options under the EOP will be subject to performance conditions.
1. TSR represents security price growth plus dividends notionally reinvested in securities, over the assessment period.
2. UPT reflects statutory profit (after tax) as adjusted to reflect the Directors’ assessment of the result for the ongoing business activities of the Consolidated Group, in accordance
with AICD/Finsia principles of recording underlying profit.
During the financial year, 4,000,000 options (2011: 3,000,000) were granted to employees as part of their remuneration. Details of unissued securities or interests under option as at year end:
Number Number of options of options remaining Fair value at Tranche Grant date Expiry date granted on issue Exercise price Exercise date grant date
(4) Staff Issue – November 20091 10/11/09 31/08/13 12,740,000 11,885,000 $0.85 1/09/12 $0.13
(5) Staff Issue – February 20112 22/02/11 31/08/14 3,000,000 3,000,000 $0.95 1/09/13 $0.09
(6) Staff Issue – October 20112 19/10/11 31/08/15 1,000,000 1,000,000 $0.95 1/09/14 $0.02
(7) Staff Issue – November 20112 25/11/11 31/08/14 3,000,000 3,000,000 $0.95 1/09/13 $0.01
1. Options granted as part of the employee’s total remuneration package. There are no market conditions relating to these options as these tranches were designed to act as
a retention mechanism for employees, taking into account the performance of the employee and the need for the Consolidated Group to retain key talent.
2. Options granted on 22 February 2011, 19 October 2011 and 25 November 2011 are subject to performance conditions over a two/three year performance period from
1 July 2010 to 30 June 2013, 1 September 2011 to 31 August 2014 and 1 July 2011 to 30 June 2013 respectively, as follows:
– Relative Total Shareholder Return (‘TSR’) hurdle to apply to 50% of options. In order for any of the TSR grant to vest, the Consolidated Group’s TSR must be at or above
the 50th percentile of a comparator group of companies (constituents of the S&P ASX200 A-REIT index). The proportion of the option grant that vests based on TSR
will be determined based on the Consolidated Group’s TSR relative to the comparator group as follows:
TSR of Consolidated Group relative to TSR of comparator group companies Proportion of option grant vesting based on TSR
Less than the 50th percentile 0%
50th percentile 50%
Between 50th percentile and 75th percentile Straight line vesting between 50% and 100%
75th percentile 100%
– Underlying profit after tax (‘UPT’) hurdle to apply to 50% of options. The UPT grant will vest 100% if aggregate UPT over the performance period exceeds the sum of
the UPT targets for the performance period. The UPT targets for each financial year will be determined by the Board annually. The target for FY12 is an increase on the
FY11 result, in line with communications to the market in August 2011.

FKP ANNUAL REPORT 2012 103
The fair value of services received in return for security options granted is based on the fair value of security options granted. Options were priced using a binomial options pricing model. Where relevant, the expected life used in the model has been adjusted based on Management’s best estimate for the effects of non-transferability, exercise restrictions (including the probability of meeting market conditions attached to the option), and behavioural considerations. The volatility used in the binominal options pricing model was determined by the historical volatility of the market price of securities and the mean reversion tendency of volatilities.
EOPS inputs into pricing model Tranche 3 1 Tranche 4 Tranche 5 Tranche 6 Tranche 7
Grant date security price $6.65 $0.74 $0.86 $0.50 $0.47
Exercise price $6.73 $0.85 $0.95 $0.95 $0.95
Expected volatility 27.0% 69.0% 2 22.0% 33.0% 33.0%
Option life 3.4yrs 3.8yrs 3.5yrs 3.9yrs 2.8yrs
Dividend yield 5.10% 1.30% 4.50% 5.00% 5.00%
Risk-free interest rate 6.33% 4.42% 5.20% 3.90% 3.12%
1. Following the completion of the Entitlement Offer announced on 25 June 2009, the exercise price of all options decreased by $0.27 in accordance with ASX Listing Rule 6.22.2.
The reduced exercise prices were effective from 1 September 2009. Tranche 3 expired during the year ended 30 June 2012 on 31 August 2011.
2. A binomial option pricing model was used to value Tranche 4. Volatility of 69% was calculated with data collected for a seven year historical period, ended November 2009.
This is inconsistent with historical measures as a result of the impacts of the Global Financial Crisis in years 2008 and 2009 which tainted the share price volatility.
No options have been granted or vested since the end of the financial year. The total expense/(credit) recognised in the statement of comprehensive income during the year was an expense of $0.7m (2011: credit of $0.3m resulting from forfeitures on options with non-market conditions attached). During the reporting period, no securities were issued on the exercise of options previously granted as remuneration.
The following table illustrates the number and movements in security options during the year:
EOPS – 2012
Weighted average exercise price Tranche 3 Tranche 4 ($)
Outstanding at the beginning of the year 2,067,509 12,420,000 1.65
Granted during the year – – –
Forfeited during the year – (535,000) 0.85
Expired during the year (2,067,509) – 6.73
Outstanding at the end of the year – 11,885,000 0.85
EOPS – 2011
Weighted average exercise price Tranche 1 Tranche 2 Tranche 3 Tranche 4 ($)
Outstanding at the beginning of the year 1,980,000 20,000 3,262,408 12,495,000 2.33
Granted during the year – – – – –
Forfeited during the year – – (1,194,899) (75,000) 6.13
Expired during the year (1,980,000) (20,000) – – 5.11
Outstanding at the end of the year – – 2,067,509 12,420,000 1.65

104 FKP ANNUAL REPORT 2012
30. SHARE-BASED PAYMENTS CONTINUED(b) Employee options plans continuedEOP – 2012
Weighted average exercise price Tranche 5 Tranche 6 Tranche 7 ($)
Outstanding at the beginning of the year 3,000,000 – – 0.95
Granted during the year – 1,000,000 3,000,000 0.95
Forfeited during the year – – – –
Expired during the year – – – –
Outstanding at the end of the year 3,000,000 1,000,000 3,000,000 0.95
EOP – 2011
Weighted average exercise price Tranche 5 ($)
Outstanding at the beginning of the year – –
Granted during the year 3,000,000 0.95
Forfeited during the year – –
Expired during the year – –
Outstanding at the end of the year 3,000,000 0.95
Weighted average remaining contractual life of options outstanding at 30 June 2012 is 1.6 years (2011: 2.1 years).
31. RELATED PARTY TRANSACTIONS(a) Parent Entity
FKP Limited is the Parent Entity within the Consolidated Group.
(b) Subsidiaries
Interest in subsidiaries is set out in Note 33.
(c) Key Management Personnel
Disclosures relating to key management personnel are set out in Note 29.
(d) Loans from the Property Trust to entities within the Consolidated Group
FKP Funds Management Limited, as the Responsible Entity for the Property Trust, has entered into a loan agreement with the Parent Entity to make available a $500.0m loan facility. Interest is payable quarterly at the rate of the prevailing 90 day bank bill swap reference rate plus a margin of 3.5%. Details of movements in the loan are as follows:
Consolidated Consolidated Group Property Trust
2012 2011 2012 2011 $000 $000 $000 $000
Balance at the beginning of the year – – 264,317 223,463
Loans advanced – – 114,981 39,156
Loan repayments made – – (53,055) (18,680)
Interest charged – – 22,757 20,378
Balance at the end of the year – – 349,000 264,317
Notes to the Financial Statements continuedFOR THE YEAR ENDED 30 JUNE 2012

FKP ANNUAL REPORT 2012 105
(e) Loans from equity-accounted investments
As at 30 June 2012, the Consolidated Group has a loan outstanding of $11.838m from the equity-accounted investment Mulpha FKP Pty Ltd. During the year, the Consolidated Group repaid $3.412m. No advances were made to the Consolidated Group. The interest rate is based on a bank base rate plus 60 basis points. Details of movements in the loan are as follows:
Consolidated Consolidated Group Property Trust
2012 2011 2012 2011 $000 $000 $000 $000
Balance at the beginning of the year 15,250 19,000 – –
Loan repayments made (3,412) (3,750) – –
Balance at the end of the year 11,838 15,250 – –
As at 30 June 2012, the Consolidated Group has a loan receivable from the equity-accounted investment Carrum Downs JV Pty Ltd of $1.369m ($0.039m after an allowance for impairment). During the year, the Carrum Downs JV Pty Ltd repaid $1.096m. Interest is payable quarterly at the rate of the prevailing 90 day bank bill swap reference rate plus a margin of 2.0%. Details of movements in the loan are as follows:
Consolidated Consolidated Group Property Trust
2012 2011 2012 2011 $000 $000 $000 $000
Balance at the beginning of the year 1,915 7,837 – –
Loans advanced 20 – – –
Loan repayments made (1,096) (7,780) – –
Interest charged 81 436 – –
(Impairment)/reversal of impairment (881) 1,422 – –
Balance at the end of the year 39 1,915 – –
As at 30 June 2012, the Consolidated Group has a loan receivable from the equity-accounted investment Big Hepher JV Pty Ltd of $8.474m ($2.853m after an allowance for impairment). During the year, no advances were made and no repayments were received by the Consolidated Group. Interest is payable at 7.75% per annum. Details of movements in the loan are as follows:
Consolidated Consolidated Group Property Trust
2012 2011 2012 2011 $000 $000 $000 $000
Balance at the beginning of the year 1,741 490 – –
Interest charged 631 645 – –
Reversal of impairment 481 606 – –
Balance at the end of the year 2,853 1,741 – –

106 FKP ANNUAL REPORT 2012
Notes to the Financial Statements continuedFOR THE YEAR ENDED 30 JUNE 2012
31. RELATED PARTY TRANSACTIONS CONTINUED(e) Loans from equity-accounted investments continued
As at 30 June 2012, the Consolidated Group has a loan receivable from the equity-accounted investment Formica Pty Ltd of $1.362m (no allowance for impairment). During the year, loan repayments of $0.734m were received by the Consolidated Group from Formica Pty Ltd. The interest rate applicable to the receivable is 7.75% per annum. The facility expires on project completion. Details of movements in the loan are as follows:
Consolidated Consolidated Group Property Trust
2012 2011 2012 2011 $000 $000 $000 $000
Balance at the beginning of the year 1,596 4,290 – –
Loans advanced 56 – – –
Loans repayments made (734) (2,658) – –
Interest charged 121 287 – –
Reversal of impairment/(impairment) 323 (323) – –
Balance at the end of the year 1,362 1,596 – –
As at 30 June 2012, the Consolidated Group has a loan receivable from the equity-accounted investment Stirling Lakes of $3.312m ($0.520m after an allowance of impairment). The loan to the Stirling Lakes joint venture accrues interest calculated on the difference between the joint venture partner loans. The rate of interest is based on a margin above the bank overdraft rate as specified in the joint venture agreement. The interest rate charged during the year ended 30 June 2012 was nil (2011: nil). The loan balance is expected to be repaid upon wind up of the joint venture.
(f) Other transactions with related parties
The following transactions occurred with related parties:
Consolidated Consolidated Group Property Trust
2012 2011 2012 2011 $000 $000 $000 $000
Rendering of services
Associates 5,158 7,381 – –
Other revenue
Interest received
Parent Entity – – – 20,378
Associates 833 1,368 – –
Management fees received
Associates 8,056 11,884 – –
Administration expenses
Management fees paid
Responsible Entity – – – 480
Finance costs
Interest paid
Associates 988 949 – –

FKP ANNUAL REPORT 2012 107
Reinvestment of PSA fees with Retirement Villages Group (‘RVG’)
In November 2008, the Parent Entity committed to reinvest $50.3m, in present value terms, of the fees payable to it under the Australian Property Services Agreement (‘PSA’) with RVG from 1 July 2008. The Parent Entity has until 31 March 2017 to complete this commitment. Under the commitment 99.1m partly paid RVG stapled securities were issued to the Parent Entity on 9 April 2008 at an issue price of $0.000001 each. On 30 June 2012, PSA fees for the period of $12.3m were paid by RVG to the Parent Entity and the proceeds applied to pay up 13,412,098 fully paid securities. On 30 June 2011, PSA fees for the period of $16.3m were paid by RVG to the Parent Entity and the proceeds applied to pay up 21,248,044 fully paid securities.
Syndicate put and call options
The Syndicate Deeds for the Forest Place Cleveland Syndicate and Forest Place Clayfield Syndicate contain put and call options under which each investor has the right to require the Consolidated Group to buy, and the Consolidated Group has the right to require each investor to sell, any share or shares upon specified terms. The put option in favour of each investor is exercisable by the investor at any time or times in respect of any shares held by it. The price payable by the Consolidated Group is a sum equal to the amount paid by the investor for the share or shares in question less any distributions previously made thereon plus interest calculated at 5.0% per year (calculated on a daily basis and compounded at the end of June and December in each year). The Consolidated Group is not obliged to complete and make payment for more than one share (taking all investors together) in any single calendar month for each syndicate.
The call options in favour of the Consolidated Group are only exercisable after the sale of new leases following completion of the development at a syndicate village. The option can only be exercised simultaneously in respect of all remaining shares and all remaining investors (but not the Consolidated Group itself) in each syndicate and the price payable by the Consolidated Group is calculated as 27.5% of the aggregate standard lease entry price paid by residents at the date of the option exercise less the aggregate price paid by residents (to secure capital growth in the value of their leases and/or pre-pay the deferred payments) in respect of leases current at the date of option exercise. The option price payable by the Consolidated Group will be adjusted for GST if applicable.
Cost re-charges to Mulpha FKP Pty Limited (‘MFKP’)
MFKP is a joint venture between FKP Limited and Mulpha Australia Pty Limited. The Consolidated Group incurs costs on behalf of Mulpha FKP. Principally, these costs relate to employees, some of whom are partially focused on MFKP activities and some of whom are fully focused on Mulpha FKP activities. The Consolidated Group recharges MFKP at cost on a monthly basis. In addition, the Consolidated Group incurs rental and administration costs on behalf of MFKP. These are also re-charged at cost on a monthly basis. The total re-charge in the year to 30 June 2012 was $2.3m in relation to salaries and $0.6m in respect of rental and administration costs (30 June 2011: $0.7m in relation to rental and administration costs).
32. AUDITOR’S REMUNERATION Consolidated Consolidated Group Property Trust
2012 2011 2012 2011 $ $ $ $
Ernst & Young
Audit and assurance services
Audit and review of the financial reports of the Consolidated Group 366,000 380,000 – –
Other assurance services1 283,000 160,000 – –
Tax compliance – 4,000 – –
Non-assurance services – 48,000 – –
Total auditor’s remuneration 649,000 592,000 – –
1. Other assurance services include audits of retirement villages. This amount paid/payable is recharged by the Consolidated Group to the respective Retirement Villages.

108 FKP ANNUAL REPORT 2012
Notes to the Financial Statements continuedFOR THE YEAR ENDED 30 JUNE 2012
33. CONTROLLED ENTITIES(a) Parent Entity
All of the following entities are incorporated/formed in Australia. The Parent Entity is FKP Limited. The Property Trust units are stapled to the shares of the Parent Entity.
Albion Flour Mill Pty Ltd FKP Core Plus Two Pty Ltd Forest Place Management Limited2
ARH Leisure Services Pty Ltd FKP Developments Pty Ltd Forest Place Pty Ltd2
Australian Retirement Homes (No. 2) Pty Ltd FKP Funds Management Limited Forest Place Unit Trust2
Australian Retirement Homes
(Sales and Marketing) Pty Ltd FKP Golden Key Pty Ltd FP Asset Holdings (No. 2) Pty Ltd2
Australian Retirement Homes Limited FKP Holdings Pty Ltd FP Asset Holdings Pty Ltd2
Aust-Wide Mini Storage Pty Ltd FKP Lifestyle (Australia) Pty Ltd FP Investments Pty Ltd
B/P Asset Pty Ltd FKP Lifestyle (Development) Pty Ltd Home Finance Pty Ltd
B/P Land Pty Ltd FKP Lifestyle (Real Estate) Pty Ltd Lindsay Gardens Management Pty Ltd
B/P Sub Land Pty Ltd FKP Lifestyle Pty Ltd Mountain View Strata Management Pty Ltd
Carmist Pty Ltd FKP Mackay Turf Farm No. 1 Pty Ltd North Shore Retirement Villages Pty Ltd
Cleveland Gardens Pty Ltd FKP Mackay Turf Farm No. 2 Pty Ltd North Shore Retirement Villages Trust
Data Plan Pty Ltd FKP Maitland Developments Pty Ltd Ntonio Pty Ltd
Data Plan Unit Trust FKP Maitland Properties Pty Ltd Peregian Springs Golf Holdings Limited3
Esplanade Unit Trust1 FKP Marina Pty Ltd Peregian Springs Shopping Centre Pty Ltd
Evo-Con Pty Ltd FKP Overseas Holdings Pty Ltd Port Bouvard Limited5
Evo-Con Victoria Pty Ltd FKP PIP Pty Ltd Ridgewood Estates Pty Ltd
Extra Care Services Pty Ltd FKP Queen Street Pty Ltd River Kat Pty Ltd
FKP Albion One Pty Ltd FKP Real Estate Pty Ltd Retirement Villages Group Management Holdings Pty Ltd4
FKP American Holdings Pty Ltd FKP Residential Developments Pty Ltd Retirement Villages Group Management Pty Ltd4
FKP Ann Street Pty Ltd FKP SJYC Pty Ltd Retirement Villages Group R.E. Ltd4
FKP Camberwell Pty Ltd FKP Unitholder Mackay Turf Farm Trust Skeyer Developments Pty Ltd
FKP Camberwell Holdings Pty Ltd Flower Roof Pty Ltd SPV Sydney Pty Ltd
FKP China Holdings No. 1 Pty Ltd Forest Place Clayfield Pty Ltd2 Starwisp Pty Ltd
FKP Commercial Developments Pty Ltd Forest Place Clayfield Syndicate Tasmanian Retirement Living Management Pty Ltd
FKP Communities Pty Ltd Forest Place Cleveland Syndicate The Domain Retirement Country Club Pty Ltd
FKP Constructions Pty Ltd Forest Place Group Limited2
Except where shown, the investments in Controlled Entities are held in ordinary securities and are wholly-owned.
1. No equity held in this entity but all the beneficial rights are attributable to the Consolidated Group.
2. Represents entities in the Forest Place Group owned 85.45% by the Parent Entity.
3. Owned 55% by the Parent Entity.
4. The Consolidated Group became the sole manager of Retirement Villages Group (‘RVG’) on 12 January 2012, following an agreement signed with Macquarie Capital Group Limited
on 22 December 2011. Refer to Note 38 for further details.
5. Effective 31 May 2012, Port Bouvard Limited was consolidated into the Consolidated Group. Refer to Note 38 for further details.
(b) Property Trust
All of the following entities are formed in Australia. The Head Entity within the Consolidated Property Trust is Property Trust, units in which are stapled to the shares of the Parent Entity, FKP Limited. The Property Trust owns 100% of the units in the following sub-trusts except where shown:
B/P Asset Trust FKP Commercial Property Trust No.2 FKP PIP (EA) Trust Peregian Springs Shopping Centre Trust
B/P Land Trust FKP Commercial Property Trust No.3 Lexington II Trust SPV Sydney Property Trust
B/P Sub Land Trust FKP Core Plus Two Access Trust1 PIP No. 3 Trust Vero Tower Trust
1. Owned 97.9% by the Property Trust.

FKP ANNUAL REPORT 2012 109
34. PARENT ENTITYInformation relating to FKP Limited and FKP Property Trust is as follows.
(a) Summary financial information
FKP Limited FKP Property Trust
2012 2011 2012 2011 $m $m $m $m
Current assets 17.1 37.6 34.3 260.6
Total assets 1,953.7 1,389.3 602.6 552.5
Current liabilities 1,037.8 502.4 26.6 65.5
Total liabilities 1,346.2 979.0 118.7 65.5
Issued capital 790.9 779.3 522.6 518.3
Retained losses (192.5) (377.4) (38.7) (31.3)
Reserves
Investment revaluation (4.9) (4.9) – –
Employee benefits 14.0 13.3 – –
Total shareholders’ equity 607.5 410.3 483.9 487.0
Profit of Parent Entity 198.1 2.1 13.1 18.7
Total comprehensive income of the Parent Entity 198.1 2.1 13.1 18.7
(b) Guarantees
FKP Limited has provided financial guarantees in respect of bank loans of subsidiaries amounting to $123.7m (2011: $118.6m) secured by registered mortgages over the freehold properties of the subsidiaries. In addition, the Parent Entity is designated as the co-borrower on a bank loan of $275.0m held by a subsidiary (2011: $275.0m). There are also cross guarantees given by the Parent Entity to subsidiaries listed in Note 37. No deficiencies of assets exist in any of these companies. No liability was recognised by the Parent Entity in relation to these guarantees, as the fair value is immaterial.
35. FINANCIAL RISK MANAGEMENT OBJECTIVESThe Consolidated Group’s principal financial instruments comprise receivables, payables, bank loans, resident loans, financial assets/liabilities at fair value through profit and loss, finance leases, cash and short-term deposits, syndicate put options and derivatives.
The Consolidated Group has in place a Treasury and Risk Management Policy which focuses on the following main financial risks: interest rate risk, foreign currency risk, liquidity risk and credit risk. The FKP Board (which includes the Managing Director and Chief Executive Officer (CEO)) has ultimate responsibility for the financial risk management process for the Consolidated Group. The Board reviews and approves the Consolidated Group’s Treasury and Risk Management Policy, the approach to the management of financial risks and where appropriate, variations from these policies. The Board also reviews compliance with the financial risk management policy at its monthly meetings as appropriate.
Day to day responsibility for the monitoring of financial risk exposure, market movements and the development of an appropriate response, rests with the Chief Financial Officer (CFO).
The Consolidated Group’s overall financial risk management focuses on the unpredictability of financial markets and seeks to minimise potentially adverse effects on the Consolidated Group’s financial performance. The Consolidated Group uses different methods to measure and mitigate the different types of risks to which it is exposed. These include monitoring levels of exposure to interest rate and foreign exchange risk and assessing market forecasts for interest rate and foreign exchange prices. Ageing analysis and monitoring of specific credit allowances are undertaken to manage credit risk.

110 FKP ANNUAL REPORT 2012
Notes to the Financial Statements continuedFOR THE YEAR ENDED 30 JUNE 2012
35. FINANCIAL RISK MANAGEMENT OBJECTIVES CONTINUED(a) Interest rate risk
Interest rate risk is the risk that the fair value of financial instruments or cash flows associated with instruments will fluctuate due to changes in market interest rates, resulting in an adverse impact on financial performance. The Consolidated Group’s exposure to market interest rates relates primarily to the Consolidated Group’s bank debt obligations. Borrowings issued at variable rates expose the Consolidated Group to cash flow interest rate risk while borrowings issued at fixed rates expose the Consolidated Group to fair value interest rate risk. The Consolidated Group manages such risk exposures by using interest rate swap and interest rate cap financial instruments, while maintaining a mix of fixed and variable debt. The level of debt is disclosed in Note 17.
The Consolidated Group’s policy is to manage its interest rate risk in relation to senior debt facilities (including project finance) in line with prescribed hedging parameters.
At balance date, the Consolidated Group had the following mix of financial assets and liabilities exposed to variable interest rate risk that are not designated in cash flow hedges:
Consolidated Consolidated Group Property Trust
2012 2011 2012 2011 $m $m $m $m
Financial assets
Cash assets 18.2 14.5 4.0 2.5
Receivables 7.3 11.9 349.0 263.0
25.5 26.4 353.0 265.5
Financial liabilities
Bank loans 844.0 669.9 105.0 98.2
Loan from associate 11.8 15.3 – –
855.8 685.2 105.0 98.2
Interest rate swap liabilities outlined in Note 36, with a fair value for the Consolidated Group of $40.7m (2011: $9.8m) and Consolidated Property Trust of $nil (2011: $nil) are exposed to fair value movements due to interest rate changes. The amount taken to profit and loss for the year for the Consolidated Group is a loss of $31.5m (2011 gain: $6.2m) and Consolidated Property Trust a gain/loss of $nil (2011: $nil). Interest rate cap financial assets outlined in Note 36, with a fair value for the Consolidated Group of $nil (2011: $0.6m) and Consolidated Property Trust of $nil (2011: $nil) are exposed to fair value movements due to interest rate changes.
In addition, the Consolidated Group manages its finance costs using a mix of fixed and variable rate debt. The Consolidated Group does not maintain a fixed minimum or maximum proportion of borrowings that should be at fixed rates as market conditions and pricing are subject to continuous change. Borrowings are carried at amortised cost and it is acknowledged that fair value exposure is a by-product of the Consolidated Group’s attempt to manage its cash flow volatility arising from interest rate changes. The Consolidated Group manages the fixed rate portfolio through entering into fixed rate loan agreements or derivative instruments (primarily interest rate swaps), in which the Consolidated Group agrees to exchange, at specified intervals, the difference between fixed and variable rate interest amounts calculated by reference to an agreed-upon notional principal amount. These swaps are used to hedge against interest rate fluctuations impacting underlying debt obligations of the Consolidated Group. At 30 June 2012, after taking into account the effect of interest rate swaps, approximately 73% (2011: 85%) of the Consolidated Group’s drawn debt is at a fixed rate of interest. Refer to Note 36 for further details about interest rate swaps.
The Consolidated Group constantly analyses its interest rate exposure. Within this analysis, consideration is given to potential renewals of existing positions, alternative financing, alternative hedging positions and the mix of fixed and variable interest rates.
Interest rates over the 12 month period were analysed and sensitivity determined to show the effect on profit and equity after tax if the interest rates at reporting date had been 75 basis points higher or lower, with all other variables held constant. This level of sensitivity was considered reasonable given the current level of both short-term and long-term Australian interest rates. The Consolidated Group uses interest rate swaps, including swaptions, in managing its overall interest rate exposure. The following sensitivity analysis is based on the interest rate risk exposures in existence at the balance sheet date.

FKP ANNUAL REPORT 2012 111
At 30 June 2012, if interest rates had moved, as illustrated in the table below, with all other variables held constant, post-tax profit and equity would have been affected as follows:
Post tax profit Equity higher/(lower) higher/(lower)
2012 2011 2012 2011 $m $m $m $m
Judgements of reasonably possible movements
Consolidated Group
+0.75% (75 basis points) (4.4) (3.5) (4.4) (3.5)
–0.75% (75 basis points) 4.4 3.5 4.4 3.5
Consolidated Property Trust
+0.75% (75 basis points) 1.3 0.9 1.3 0.9
–0.75% (75 basis points) (1.3) (0.9) (1.3) (0.9)
(b) Foreign currency risk
Foreign currency risk arises as a result of having assets denominated in a currency that is not the Consolidated Group’s functional currency (balance sheet risk) or from transactions or cash flows denominated in a foreign currency (cash flow risk).
Balance sheet risk can impact the Net Tangible Assets (NTA) whereas cash flow risk is more likely to impact potential equity distributions or other operational cash requirements such as the repayment of debt.
The Consolidated Group manages its direct exposure to foreign currency risk by limiting the level of commercial transactions and recognition of assets and liabilities that are denominated in a currency other than the Consolidated Group’s functional currency. The Consolidated Group’s investment in the senior living facilities in the United States exposes the Consolidated Group to foreign exchange risk. The Consolidated Group has no significant concentrations of foreign exchange risk.
(c) Credit risk
Credit risk is the risk of financial loss to the Consolidated Group if a customer or counterparty to a financial instrument fails to meet contractual obligations, with the maximum exposure being equal to the carrying amount of these instruments. Exposure at balance date is addressed in each applicable note to the Financial Statements. Credit risk arises from the financial assets of the Consolidated Group, which comprise cash and cash equivalents, trade and other receivables, available-for-sale financial assets, financial assets at fair value through profit and loss and derivative instruments.
It is the Consolidated Group’s policy that all customers who wish to trade on credit terms are subject to credit verification procedures including an assessment of their independent credit rating, financial position, past experience and industry reputation. Risk limits are set for each individual customer in accordance with parameters set by the Board. These risk limits are regularly monitored. For third parties with extended term debt, credit checks are gained and in some instances the receivable is secured by registered mortgage. Details of extended term trade receivables are outlined in Note 7.
In addition, receivable balances are monitored on an ongoing basis with the intention that the Consolidated Group’s exposure to bad debts is minimised.
The Consolidated Group’s cash management policy is to maintain cash in a highly liquid and low risk portfolio with investments made in high quality, short-term money market instruments to ensure the preservation of capital at all times.
The Consolidated Group is also exposed to credit risk by virtue of the contractual obligations arising from the interest rate swaps it has entered into. The Consolidated Group trades only with recognised, creditworthy third parties, as policy requires that counterparties hold a minimum credit rating with Standard & Poor’s of at least A– (long-term). While the concentration of credit risk rests mainly with two of the largest financial institutions, this risk is mitigated by the Standard & Poor’s AA rating awarded to those institutions, well above the standard required under the Consolidated Group’s policy.
The granting of financial guarantees also exposes the Consolidated Group to credit risk, being the maximum amount that would have to be paid if the guarantee is called on. As the amounts written into the guarantees are not significantly greater than the original liabilities, such risk is deemed to be immaterial.
The Consolidated Group manages concentrations of credit risk through ongoing recoverability evaluations and appropriate credit history checks.

112 FKP ANNUAL REPORT 2012
Notes to the Financial Statements continuedFOR THE YEAR ENDED 30 JUNE 2012
35. FINANCIAL RISK MANAGEMENT OBJECTIVES CONTINUED(d) Liquidity risk
Liquidity risk is the risk that the Consolidated Group will not be able to meet its financial obligations as they fall due.
The Consolidated Group’s objective is to achieve continuity of funding and flexibility, due to the dynamic nature of the underlying business, through the use of bank overdrafts, bank loans, put options, finance leases and committed available credit lines, in addition to other sources.
The Consolidated Group regularly reviews existing funding lines and assesses future requirements based upon known and forecast information provided by each of the business units. This assists flexibility by matching profiles of short-term investments with cash flow requirements and also assists in timing the negotiation of credit facilities. Cash forecasts are prepared for review by the CFO and for presentation to the CEO and FKP Board as appropriate. In order to ensure that FKP is able to meet short-term commitments (i.e. less than 12 months) and have sufficient time to plan and fund longer-term commitments, forward commitment tests must be satisfied unless exemptions are approved by the FKP Board.
At 30 June 2012, $276.3m of the Consolidated Group’s debt facilities will mature in less than one year (2011: $111.7m). The Consolidated Group manages liquidity risk through monitoring the maturity of its debt portfolio. The Consolidated Group will report and monitor the maturity and amortisation profile of all debt facilities on a regular basis and will present a draft refinancing plan for the approval of the FKP Board ahead of a debt facility maturing.
The current weighted average debt maturity is 2.22 years (2011: 2.24 years).
The table below reflects the contractual maturity of the Consolidated Group’s fixed and floating rate financial liabilities and derivatives. For derivative financial instruments, the market value is presented, whereas for the other obligations the undiscounted cash flows for the respective upcoming financial years are presented. Cash flows for financial liabilities without fixed amount or timing are based on the conditions existing at 30 June 2012.
The remaining contractual maturities of the financial liabilities are:
Consolidated Consolidated Group Property Trust
2012 2011 2012 2011 $m $m $m $m
6 months or less 1,479.9 1,434.6 20.2 20.0
6–12 months 187.7 135.1 12.9 88.5
1–2 years 370.4 335.4 – –
2–5 years 462.1 469.0 92.1 –
Over 5 years – 14.9 – –
2,500.1 2,389.0 125.2 108.5

FKP ANNUAL REPORT 2012 113
Maturity analysis of financial liabilities based on contractual maturities:
≤ 6 months 6–12 months 1–2 years 2–5 years 5 years Total $m $m $m $m $m $m
2012
Consolidated Group
Financial liabilities
Payables 56.2 – 14.3 – – 70.5
Resident loans1 1,275.5 – – – – 1,275.5
Bank loans2 117.3 168.5 328.4 297.9 – 912.1
Convertible bonds2 5.0 5.0 10.0 140.1 – 160.1
Other loans2 14.9 1.2 – – – 16.1
Finance leases 0.1 – – – – 0.1
Interest rate swaps 5.1 7.3 11.8 19.0 – 43.2
PSA derivative liability 4.8 4.9 4.3 – – 14.0
Syndicate put options 1.0 0.8 1.6 5.1 – 8.5
1,479.9 187.7 370.4 462.1 – 2,500.1
Consolidated Property Trust
Financial liabilities
Payables 20.2 – – – – 20.2
Bank loans2 – 12.9 – 92.1 – 105.0
20.2 12.9 – 92.1 – 125.2
2011
Consolidated Group
Financial liabilities
Payables 52.9 – 10.0 10.0 – 72.9
Resident loans1 1,314.2 – – – – 1,314.2
Bank loans2 41.8 126.5 309.3 294.7 12.1 784.4
Convertible bonds2 5.0 5.0 10.0 155.0 – 175.0
Other loans2 17.8 1.1 0.6 – – 19.5
Finance leases 0.1 – 0.2 – – 0.3
Interest rate swaps 1.0 1.7 3.7 4.7 – 11.1
Syndicate put options 1.8 0.8 1.6 4.6 2.8 11.6
1,434.6 135.1 335.4 469.0 14.9 2,389.0
Consolidated Property Trust
Financial liabilities
Payables 3.2 – – – – 3.2
Bank loans2 16.8 88.5 – – – 105.3
20.0 88.5 – – – 108.5
1. Resident Loans are classified as a current liability because the Consolidated Group does not have an unconditional right to defer settlement of resident loans for at least
12 months after the reporting period. In practice, the rate at which the Consolidated Group’s Retirements’ residents vacate their units, and hence the rate at which the resident
loans will fall due for repayment, can be estimated on the basis of statistical tables. The Consolidated Group’s best estimate is that of the total resident loans of $1,275.5m
(2011: $1,314.2m), only $120.0m (2011: $111.7m) is expected to be paid within the next 12 months.
2. Includes interest payable in future periods inclusive of line fees where applicable.

114 FKP ANNUAL REPORT 2012
Notes to the Financial Statements continuedFOR THE YEAR ENDED 30 JUNE 2012
35. FINANCIAL RISK MANAGEMENT OBJECTIVES CONTINUED(e) Fair value
The carrying amount of the Consolidated Group’s financial assets and financial liabilities approximate their fair value.
Fair value of the financial liabilities is calculated based on present value of future principal and interest cash flows, discounted at the market rate of interest at the reporting date. For interest bearing loans and borrowings, the market rate of interest is determined by reference to similar liabilities in the same industry and with a similar risk rating, and for finance leases, by reference to similar finance leases at reporting date. Resident loans are measured at the principal amount less any unearned income, plus the residents’ share of any increase in the market value of the underlying property at balance date.
Fair value hierarchy
The Consolidated Group uses various methods in estimating the fair value of a financial instrument where a valuation technique is used. The methods comprise:
Level 1 the fair value is calculated using quoted prices in active markets.
Level 2 the fair value is estimated using inputs other than quoted prices included in Level 1 that are observable for the asset or liability, either directly (as prices) or indirectly (derived from prices).
Level 3 the fair value is estimated using inputs for the asset or liability that are not based on observable market data.

FKP ANNUAL REPORT 2012 115
The fair value of the financial instruments as well as the methods used to estimate the fair value are summarised in the table below.
Valuation Valuation techniques – techniques – market non-market Quoted market observable observable price (Level 1) inputs (Level 2) inputs (Level 3) Total $m $m $m $m
2012
Consolidated Group
Financial assets
Rights to acquire syndicate shares – 2.5 – 2.5
– 2.5 – 2.5
Financial liabilities
Interest rate swap contracts – 40.7 – 40.7
Put option liability to acquire syndicate shares – 7.7 – 7.7
PSA derivative liability – 13.2 – 13.2
Resident loan obligations at fair value through profit and loss – 1,275.5 – 1,275.5
– 1,337.1 – 1,337.1
Consolidated Property Trust
Financial liabilities – – – –
2011
Consolidated Group
Financial assets
Interest rate cap – 0.6 – 0.6
Rights to acquire syndicate shares – 4.0 – 4.0
– 4.6 – 4.6
Financial liabilities
Interest rate swap contracts – 9.8 – 9.8
Put option liability to acquire syndicate shares – 9.7 – 9.7
Resident loan obligations at fair value through profit and loss – 1,314.2 – 1,314.2
– 1,333.7 – 1,333.7
Consolidated Property Trust
Financial liabilities – – – –
For resident loan obligations for which a value is not quoted in active markets, the Consolidated Group uses valuation techniques such as present value techniques to arrive at the fair value for these instruments. These valuation techniques use both observable and unobservable market inputs. The Consolidated Group considers that any inputs which are not observable market inputs used are not significant to the overall valuation of these items, and as such classifies these as Level 2 financial instruments.
The fair value of interest rate swaps is calculated as the present value of the estimated future cash flows. In the circumstances where a valuation technique for these instruments is based on significant unobservable inputs, such instruments are included in Level 3.

116 FKP ANNUAL REPORT 2012
Notes to the Financial Statements continuedFOR THE YEAR ENDED 30 JUNE 2012
36. DERIVATIVE FINANCIAL INSTRUMENTS Consolidated Consolidated Group Property Trust
2012 2011 2012 2011 $m $m $m $m
Financial asset
Interest rate cap – 0.6 – –
Financial liabilities
Interest rate swap contracts (current)1 12.2 2.2 – –
Interest rate swap contracts (non-current)1 28.5 7.6 – –
PSA derivative liability (current)2 9.3 – – –
PSA derivative liability (non-current)2 3.9 – – –
Conversion rights 1.2 4.6 – –
Total derivative financial liabilities 55.1 14.4 – –
1. Derivative financial instruments are used by the Consolidated Group in the normal course of business to hedge against adverse interest rate exposures.
2. Pursuant to the Australian Property Services Agreement (‘PSA’) with Retirement Villages Group (‘RVG’), executed in November 2008, the Consolidated Group committed to
reinvesting $50.3m in present value terms, of the fees payable to it under the agreement, to pay up fully paid RVG securities. The PSA derivative liability arises as a result of the
shortfall between the PSA fees reinvested and the Consolidated Group’s proportionate share of the underlying RVG fund. The liability of $13.2m is measured at fair value through
profit and loss and is recognised to capture the future cumulative shortfalls expected to arise. Refer to Note 31(f) for further details.
(a) Interest rate swaps
At 30 June 2012, the notional principal amounts and period of expiry of the interest rate swap contracts are as follows:
Consolidated Consolidated Group Property Trust
2012 2011 2012 2011 $m $m $m $m
0–1 years – 22.9 – –
1–2 years 90.0 – – –
2–3 years 25.0 50.0 – –
3–5 years 400.0 100.0 – –
Over 5 years – 300.0 – –
515.0 472.9 – –
The interest rate swaps require settlement of net interest receivable or payable each 30 days. The settlement dates coincide with the dates on which interest is payable on the underlying debt. These instruments have not been designated as hedges for accounting purposes, nevertheless Management believes the hedges are effective economically. The swaps are measured at fair value and all gains and losses attributable to the hedged risk are taken directly to the statement of comprehensive income. Refer to Note 1(y).
(b) Credit risk
Credit risk arises from the potential failure of counterparties to meet their obligations at maturity of contracts. This arises on derivative financial instruments with unrealised gains. Management minimises risk of default by entering into derivatives with a large institution with strong credit ratings. Maximum exposure to credit risk is the fair value of the derivative financial asset.

FKP ANNUAL REPORT 2012 117
37. DEED OF CROSS GUARANTEEFKP Limited and the wholly-owned subsidiaries identified below entered into a Deed of Cross Guarantee on 25 June 2008. The effect of the deed is that FKP Limited has guaranteed to pay any deficiency in the event of the winding up of any of the Group entities that are party to the Deed or if they do not meet their obligation under the terms of the liabilities subject to the guarantee. The Group entities that are party to the Deed have also given a similar guarantee in the event that FKP Limited is wound up or if it does not meet its obligations under the terms of the liabilities subject to the guarantee.
Albion Flour Mill Pty Ltd FKP Constructions Pty Ltd1 FKP SJYC Pty Ltd
ARH Leisure Services Pty Ltd FKP Core Plus Two Pty Ltd Flower Roof Pty Ltd
Australian Retirement Homes (No. 2) Pty Ltd FKP Developments Pty Ltd FP Investments Pty Ltd1
Australian Retirement Homes FKP Golden Key Pty Ltd Home Finance Pty Ltd
(Sales and Marketing) Pty Ltd FKP Holdings Pty Ltd1 Lindsay Gardens Management Pty Ltd
Australian Retirement Homes Limited1 FKP Lifestyle (Australia) Pty Ltd1 North Shore Retirement Villages Pty Ltd
Aust-Wide Mini Storage Pty Ltd FKP Lifestyle (Development) Pty Ltd Ntonio Pty Ltd
B/P Asset Pty Ltd FKP Lifestyle (Real Estate) Pty Ltd Peregian Springs Shopping Centre Pty Ltd
B/P Land Pty Ltd FKP Lifestyle Pty Ltd1 Ridgewood Estates Pty Ltd
B/P Sub Land Pty Ltd FKP Mackay Turf Farm No.2 Pty Ltd River Kat Pty Ltd
Carmist Pty Ltd FKP Maitland Developments Pty Ltd Skeyer Developments Pty Ltd
Cleveland Gardens Pty Ltd FKP Maitland Properties Pty Ltd SPV Sydney Pty Ltd
Data Plan Pty Ltd FKP Overseas Holdings Pty Ltd Starwisp Pty Ltd
Evo-Con Pty Ltd FKP PIP Pty Ltd Tasmanian Retirement Living Management Pty Ltd
Extra Care Services Pty Ltd FKP Queen Street Pty Ltd The Domain Retirement Country Club Pty Ltd
FKP American Holdings Pty Ltd FKP Real Estate Pty Ltd
FKP Ann Street Pty Ltd FKP Real Estate Pty Ltd
FKP Commercial Developments Pty Ltd FKP Residential Developments Pty Ltd1
FKP Communities Pty Ltd1
1. Pursuant to Class Order 98/1418, relief has been granted from the Corporations Act 2001 requirements for preparation, audit and lodgement of financial reports.

118 FKP ANNUAL REPORT 2012
Notes to the Financial Statements continuedFOR THE YEAR ENDED 30 JUNE 2012
37. DEED OF CROSS GUARANTEE CONTINUEDThe consolidated income statement and balance sheet of the entities that are parties to the Deed of Cross Guarantee are as follows:
Closed Group
2012 2011 $m $m
Consolidated income statement
Sale of goods and construction contract revenue 166.3 229.6
Revenue from rendering of services 49.0 54.3
Other revenues from ordinary activities 16.4 36.4
Revenue 231.7 320.3
Cost of sales (145.3) (169.2)
Gross profit 86.4 151.1
Change in fair value of investment properties (258.9) 46.7
Change in fair value of financial assets (41.3) 10.2
Change in fair value of resident loans 75.7 (6.6)
Employee expenses (35.5) (44.4)
Marketing expenses (9.0) (12.5)
Occupancy expenses (3.9) (3.8)
Administration expenses (16.5) (21.6)
Inventory write-down to net realisable value (50.5) (10.0)
Other income/(expenses) (159.5) 7.9
Finance costs (28.2) (35.8)
(Loss)/Profit from continuing operations before income tax (441.2) 81.2
Income tax expense 127.3 (14.1)
(Loss)/Profit from continuing operations after income tax (313.9) 67.1

FKP ANNUAL REPORT 2012 119
Closed Group
2012 2011 $m $m
Consolidated balance sheet
Current assets
Cash and cash equivalents 11.3 9.5
Trade and other receivables 48.8 846.6
Inventories 101.5 156.1
Other financial assets – 0.6
Other assets 7.1 7.0
Total current assets 168.7 1,019.8
Non-current assets
Trade and other receivables 88.6 9.0
Inventories 537.4 480.6
Investment properties 1,820.7 2,035.3
Equity accounted investments 174.1 325.5
Property, plant and equipment 19.1 20.1
Intangible assets 2.5 2.4
Other financial assets 194.4 184.5
30.4 –
Total non-current assets 2,867.2 3,057.4
TOTAL ASSETS 3,035.9 4,077.2
Current liabilities
Trade and other payables 67.5 803.5
Interest bearing loans and borrowings 510.9 45.2
Provisions 11.5 10.7
Other financial liabilities 21.5 2.2
Deferred revenue 70.5 64.3
Total current liabilities (excluding resident loans) 681.9 925.9
Resident loans 1,014.7 1,057.1
Total current liabilities 1,696.6 1,983.0
Non-current liabilities
Trade and other payables 10.0 19.2
Interest bearing loans and borrowings 548.6 892.8
Deferred tax liabilities – 95.9
Provisions 1.7 1.7
Other financial liabilities 33.7 12.2
Deferred revenue 0.1 0.6
Total non-current liabilities 594.1 1,022.4
TOTAL LIABILITIES 2,290.7 3,005.4
NET ASSETS 745.2 1,071.8
Equity
Contributed equity 779.2 779.2
Retained profits (154.0) 173.2
Reserves 120.0 119.4
TOTAL EQUITY 745.2 1,071.8

120 FKP ANNUAL REPORT 2012
Notes to the Financial Statements continuedFOR THE YEAR ENDED 30 JUNE 2012
38. BUSINESS COMBINATIONS AND DISPOSALSAcquisition of Retirement Villages Group Management Pty Limited/Retirement Villages Group RE Ltd
On 22 December 2011, the Consolidated Group and Macquarie reached an agreement to acquire Macquarie’s 50% interest in Retirement Villages Group Management Pty Limited (‘RVGM’) and Retirement Villages Group RE Ltd as responsible entity for Retirement Villages Trust (‘RVGRE’). This transaction was completed on 12 January 2012 (‘completion date’) following the successful satisfaction of the conditions precedent included in the Sale Agreement, giving the Consolidated Group sole control over RVGM and RVGRE.
RVG is a stapled group comprising of Retirement Villages Australia Ltd, Retirement Villages Trust and Retirement Villages New Zealand Investment Ltd, launched in October 2007 following a wholesale equity offering to institutional investors. Management of RVG is undertaken by RVGM and RVGRE as responsible entity for Retirement Villages Trust. These management vehicles were previously jointly owned by the Consolidated Group and Macquarie Capital Group (‘Macquarie’).
On completion date, a new entity controlled wholly by the Consolidated Group was created – RVGM Holdings Pty Limited (‘RVGMH’). RVGMH acquired Macquarie’s interest in RVGM and RVGRE.
$m
Purchase consideration (at fair value)1:
Cash paid 10.2
Deferred consideration 0.7
Previously held equity interest 7.6
18.5
Less: the net assets recognised on acquisition (at fair value):
Management rights 10.1
Investments in equity securities 6.8
Management fees receivable 1.3
Other assets 0.4
Other payables (0.1)
Net identifiable assets acquired 18.5
1. Consideration excludes acquisition-related costs of $1.3m. These are included in other expenses in profit or loss and in operating cash flows in the cash flow statement.
Consolidation of Port Bouvard Limited and its controlled entities
Historically, Port Bouvard (‘the Company’) has been treated as an associate and accounted for under the equity method. Effective 31 May 2012, the accounts of Port Bouvard were consolidated into the Consolidated Group.
In May 2012, the Company released an update to the market advising of the retirement of Lee Verios, Chairman and Director of the Company. The position of Chairman was still vacant at 30 June 2012, with the Consolidated Group holding two out of three Director seats on the Board. The power to cast the majority of votes at meetings of the Board of Directors gives the Consolidated Group control over the Company. The Board of Directors is responsible for approving and resolving on all key financial and operational decisions.

FKP ANNUAL REPORT 2012 121
On 31 May 2012 (‘acquisition date’), the Consolidated Group acquired control over the Company. The net assets recognised on acquisition were at their fair values as determined by the Directors of FKP Limited and FKP Funds Management Limited (‘Responsible Entity’), as Responsible Entity of FKP Property Trust, and had the following effect on the Consolidated Group’s assets and liabilities on acquisition date:
Recognised value on acquisition At Fair Value $m
Inventories 94.5
Other assets 1.8
Bank loans (43.2)
Trade and other payables (5.0)
Deferred tax liabilities (1.5)
Net identifiable assets 46.6
Less: previously held equity interest (13.7)
32.9
Less: non-controlling interests (32.9)
Gain/loss on acquisition –
The Consolidated Group remeasured its previously held equity interest in the Company at its acquisition date fair value, resulting in an impairment of $11.3m. This impairment charge was recognised in the Statement of Comprehensive Income for the year ended 30 June 2012 in the ‘share of equity accounted profits/loss’ line.
The Company’s intention is to appoint an independent Chairman as well as an additional independent Director, which if successful would bring the total number of Directors to five.
There were no disposals of businesses during the year ended 30 June 2012.
39. EVENTS AFTER BALANCE SHEET DATEThe Consolidated Group announced its intention to undertake a capital raise on 28 August 2012. The capital raise is designed to strengthen the Consolidated Group’s capital position, reduce leverage levels and improve liquidity. Refer to the Directors’ report for further details.
No other matters or circumstances have arisen since the end of the financial year and up until the date of this Report which significantly affect or may significantly affect the operations of the Consolidated Group, the results of those operations, or the state of affairs of the Consolidated Group in subsequent years.

122 FKP ANNUAL REPORT 2012
Directors’ Declaration
In the opinion of the Directors of FKP Limited and FKP Funds Management Limited as Responsible Entity for FKP Property Trust (collectively referred to as ‘the Directors’):
(a) the Financial Statements and Notes and the Remuneration Report in the Directors’ Report set out on pages 30 to 41, are in accordance with the Corporations Act 2001, including:
(i) giving a true and fair view of the Consolidated Property Trust’s and the Consolidated Group’s financial position as at 30 June 2012 and of their performance, for the financial year ended on that date; and
(ii) complying with Australian Accounting Standards (including the Australian Accounting Interpretations) and the Corporations Regulations 2001.
(b) the Financial Report also complies with International Financial Reporting Standards issued by the International Accounting Standards Board, as disclosed in Note 1(a); and
(c) there are reasonable grounds to believe that the Consolidated Property Trust and the Consolidated Group will be able to pay their debts as and when they become due and payable.
At the date of this declaration there are reasonable grounds to believe that FKP Limited and the Group entities named in Note 37 will be able to meet any obligations or liabilities to which they are or may have become subject to by virtue of the Deed of Cross Guarantee between FKP Limited and those Group entities pursuant to ASIC Class Order 98/1418 (as described in Note 37).
The Directors have been given the declarations by the Managing Director and Chief Executive Officer and the Chief Financial Officer for the financial year ended 30 June 2012 required by section 295A of the Corporations Act 2001.
Signed in accordance with a resolution of the Board of Directors:
P R Brown Managing Director and Chief Executive Officer FKP Property Group
Dated at Sydney, this 28th day of August 2012

FKP ANNUAL REPORT 2012 123
Independent Auditor’s Report
Independent auditor’s report to the securityholders of FKP Property GroupFKP Property Group comprises FKP Limited and the entities it controlled at the year’s end or from time to time during the financial year (‘FKP’ or ‘the Group’) and FKP Property Trust and the entities it controlled at the year’s end or from time to time during the financial year (‘Consolidated Property Trust’).
Report on the financial report
We have audited the accompanying financial report of FKP Property Group, which comprises the balance sheets as at 30 June 2012, the statements of comprehensive income, the statements of changes in equity and the cash flow statements for the year then ended, notes comprising a summary of significant accounting policies and other explanatory information, and the Directors’ Declaration of the Consolidated Group.
Directors’ responsibility for the financial report
The directors of FKP Limited and the directors of FKP Funds Management Limited as Responsible Entity for the FKP Property Trust (collectively referred to as ‘the Directors’) are responsible for the preparation of the financial report that gives a true and fair view in accordance with Australian Accounting Standards and the Corporations Act 2001 and for such internal controls as the Directors determine are necessary to enable the preparation of the financial report that is free from material misstatement, whether due to fraud or error. In Note 1(a), the Directors also state, in accordance with Accounting Standard AASB 101 Presentation of Financial Statements, that the financial statements comply with International Financial Reporting Standards.
Auditor’s responsibility
Our responsibility is to express an opinion on the financial report based on our audit. We conducted our audit in accordance with Australian Auditing Standards. Those standards require that we comply with relevant ethical requirements relating to audit engagements and plan and perform the audit to obtain reasonable assurance about whether the financial report is free from material misstatement.
An audit involves performing procedures to obtain audit evidence about the amounts and disclosures in the financial report. The procedures selected depend on the auditor’s judgement, including the assessment of the risks of material misstatement of the financial report, whether due to fraud or error. In making those risk assessments, the auditor considers internal controls relevant to the entity’s preparation and fair presentation of the financial report in order to design audit procedures that are appropriate in the circumstances, but not for the purpose of expressing an opinion on the effectiveness of the entity’s internal controls. An audit also includes evaluating the appropriateness of accounting policies used and the reasonableness of accounting estimates made by the Directors, as well as evaluating the overall presentation of the financial report.
We believe that the audit evidence we have obtained is sufficient and appropriate to provide a basis for our audit opinion.
Liability limited by a scheme approved under Professional Standards Legislation.

124 FKP ANNUAL REPORT 2012
Independent Auditor’s Report continued
Independence
In conducting our audit we have complied with the independence requirements of the Corporations Act 2001. We have given to the Directors of the company a written Auditor’s Independence Declaration, a copy of which is included in the Directors’ Report.
Opinion
In our opinion:
(a) the financial report of FKP Property Group is in accordance with the Corporations Act 2001, including:
(i) giving a true and fair view of the Consolidated Group and the Consolidated Property Trust’s financial position as at 30 June 2012 and their performance for the year ended on that date; and
(ii) complying with Australian Accounting Standards and the Corporations Regulations 2001; and
(b) the financial report also complies with International Financial Reporting Standards as disclosed in Note 1(a).
Report on the Remuneration Report
We have audited the Remuneration Report included in pages 30 to 41 of the Directors’ Report for the year ended 30 June 2012. The Directors of the company are responsible for the preparation and presentation of the Remuneration Report in accordance with section 300A of the Corporations Act 2001. Our responsibility is to express an opinion on the Remuneration Report, based on our audit conducted in accordance with Australian Auditing Standards.
Opinion
In our opinion, the Remuneration Report of FKP Property Group for the year ended 30 June 2012 complies with section 300A of the Corporations Act 2001.
Ernst & Young
Douglas Bain Partner
28 August 2012
Liability limited by a scheme approved under Professional Standards Legislation.

FKP ANNUAL REPORT 2012 125
The information set out below was prepared as at 3 October 2012 and applies equally to the FKP Property Trust and FKP Limited, as members are required to hold equal numbers of units in the Property Trust and shares in the Parent Entity under the terms of the joint quotation on the Australian Securities Exchange.
Percentage of Largest Twenty Securityholders Number of Securities Issued Securities
Citicorp Nominees Pty Limited <Citibank ESW RIL & Citic A/C> 454,162,982 20.18
Stockland Retirement Pty Limited 322,068,656 14.31
National Nominees Limited 279,749,573 12.43
J P Morgan Nominees Australia Limited 138,718,057 6.16
HSBC Custody Nominees (Australia) Limited 117,525,165 5.22
Citicorp Nominees Pty Limited 105,979,204 4.71
BNP Paribas Noms Pty Ltd<Master Custodian DRP> 70,160,426 3.12
Citicorp Nominees Pty Limited <Mulpha Inv & Citic A/C> 61,577,672 2.74
AMP Life Limited 53,541,636 2.38
HDFI Nominees Pty Ltd <Mulpha Investments P/L A/C> 52,780,862 2.34
Citicorp Nominees Pty Limited <Colonial First State Inv A/C> 48,555,175 2.16
HSBC Custody Noninees (Australia) Limited <NT-Comnwlth Super Corp> 22,781,700 1.01
HDFI Nominees Pty Ltd <Rosetec Investments Limited A/C> 21,764,964 0.97
Philip Parker Pty Ltd <Parker Family A/C> 21,361,051 0.95
BNP Paribas Noms Pty Ltd <SMP Accounts DRP> 18,813,117 0.84
JP Morgan Nominees Australia Limited <Cash Income A/C> 18,581,639 0.83
Mt Byron Pastoral Company Pty Ltd 16,677,572 0.74
Sun Hung Kai Investment Services Limited <Peter Ross Brown A/C> 16,011,049 0.71
HSBC Custody Nominees (Australia) Limited – GSCO ECA 15,026,690 0.67
Mt Byron Pastoral Company Pty Ltd <Super Fund A/C> 12,957,702 0.58
1,868,794,892 83.02
The total number of securities on issue as at 3 October 2012 is 2,251,016,386.
Substantial Securityholder Number of Securities
Mulpha Australia Ltd and its related bodies corporate 590,286,480
Stockland Retirement Pty Limited 322,068,656
IOOF Holdings Limited 280,868,241
AMP Limited 169,839,286
Distribution of Securityholders Number of Securities Number of Securityholders
Category
1 – 1,000 737,839 2,100
1,001 – 5,000 8,560,950 3,065
5,001 – 10,000 10,964,119 1,483
10,001 – 100,000 91,855,976 2,900
100,001 and over 2,138,897,502 573
2,251,016,386 10,121
There were 3,175 securityholders holding less than a marketable parcel at $0.2450 per security.
VOTING RIGHTS
On a show of hands every securityholder, present in person or by proxy or by attorney or by duly authorised representative, shall have one vote and on a poll, every securityholder so present shall have one vote for every security held by such securityholder.
SECURITIES EXCHANGE
FKP Limited and FKP Property Trust, are jointly quoted on the Australian Securities Exchange (ASX Code: FKP) with a home exchange in Brisbane.
Securityholders

126 FKP ANNUAL REPORT 2012
ON-MARKET BUY-BACK
There is no current on-market buy-back.
SECURITYHOLDERS’ ENQUIRIES
Securityholders with enquiries about their holding should contact the FKP Property Group Share Registrar as follows:
Computershare Investor Services Pty Limited 117 Victoria Street WEST END QLD 4101
Telephone (within Australia): 1300 658 814 Telephone (outside Australia): +61 3 9415 4316 Facsimile: +61 7 3237 2152 Internet: ww w.computershare.com.au
Enquiries of a general nature should be directed to the Company Secretary on +61 2 9270 6100 and institutional enquiries should be directed to the Investor Relations Manager on +61 2 9270 6100.
DISTRIBUTION/DIVIDEND
The final distribution of 1.4 cents per security was paid to securityholders on 28 September 2012. The record date for determining entitlement to the distribution was 29 June 2012.
REINVESTMENT PLAN
FKP Property Group operates a Distribution Reinvestment Plan (DRP) which allows securityholders to have their payments used to buy more stapled securities in the Group at a discount up to 10% as determined by the Board with no costs. The discount applicable for the September 2012 DRP is 2.5%. Any future changes to the DRP will be disclosed to the ASX and notified on the FKP website. Application forms can be downloaded from the Computershare Online Investor Service or sent to you by Computershare. On 24 September 2012 FKP Property Group announced that the DRP would be suspended for the 2012 Final Distribution and would remain suspended until the directors of FKP Property Group decide to reapply it to future distributions.
eTree
As an FKP Property Group securityholder, every year you are sent a number of securityholder communications via post. Register your email address via ww w.eTree.com.au/fkp to receive your securityholder communications electronically and FKP Property Group will donate $1 to Landcare Australia to support urgent reforestation projects.
ANNUAL REPORT
Securityholders have a choice as to whether or not they receive the annual report. If you do not wish to receive the annual report please advise the Share Registrar in writing. These securityholders will continue to receive all other securityholder information.
The annual report, together with all significant announcements made by the Group to the ASX, are available on the FKP website at ww w.fkp.com.au.
TO CONSOLIDATE SECURITY HOLDINGS
Securityholders who want to consolidate their separate security holdings into one account should write to the Share Registrar or their sponsoring broker, whichever is applicable.
TAX FILE NUMBERS (TFN)
Whilst not compulsory, most Australian resident securityholders prefer to quote their TFN to avoid having withholding tax deducted from dividends which are unfranked or from distributions paid by property trusts. Securityholders should advise in writing their TFN details to the Share Registrar or sponsoring broker, whichever is applicable.
Securityholder Information

FKP ANNUAL REPORT 2012 127
5 Year Financial Summary
Performance Summary 2012 2011 2010 2009 2008
Underlying Net Profit After Tax1 $m 94.7 121.0 108.6 76.8 150.2
Statutory Net Profit/(Loss) After Tax $m (350.3) 82.3 50.8 (319.4) 145.3
Paid Up Capital $m 1,313.5 1,297.6 1,283.3 965.4 827.8
Securityholders’ Funds $m 1,171.2 1,531.4 1,474.2 1,114.5 1,340.3
Total Assets $m 3,745.2 4,056.2 3,860.8 3,772.8 4,098.1
Total Debt $m 975.6 802.8 791.6 1,153.2 1,229.2
Market Capitalisation $m 460.6 829.6 792.7 183.2 1,300.3
Security Price at year end $ 0.38 0.70 0.68 0.52 4.90
Reported Earnings Per Security cents (29.2) 7.0 4.5 (70.3) 38.7
Underlying Earnings Per Security cents 7.9 10.3 9.7 17.3 40.0
Dividends/distributions Paid $m 33.7 35.4 17.5 12.3 83.7
Dividends/distributions Per Security – Ordinary cents 2.8 3.0 1.5 3.5 31.7
Net Tangible Assets Per Security cents 90.0 125.0 123.0 315.0 503.7
Franking2 % 39.5 36.6 – – 45.4
Gearing Ratio (Debt/Assets) % 39.1 28.9 28.5 41.8 30.0
1 Underlying profit for the Consolidated Group was adopted for the years ended 30 June 2010, 30 June 2011 and 30 June 2012 in accordance with AICD/Finsia principles of
recording underlying profit, and has not been audited. Underlying profit for the years ended 30 June 2008 and 30 June 2009 was not in accordance with AICD/Finsia principles
of recording underlying profit and has not been audited.
2 The franked percentage for the Group for the years ended 30 June 2008 to 30 June 2012 inclusive is a weighted average percentage including the FKP Property Trust distribution
which is unfranked. No franked dividends were paid during the years ended 30 June 2009 to 30 June 2010.

128 FKP ANNUAL REPORT 2012
CORPORATION/RESPONSIBLE ENTITYFKP Limited
ABN 28 010 729 950
FKP Funds Management Limited
ABN 17 089 800 082 AFSL 222273
Level 5, Crowe Horwath Centre 120 Edward Street Brisbane QLD 4000
GPO Box 2447 Brisbane QLD 4001 Telephone +61 7 3223 3888 Internet: ww w.fkp.com.au
BOARD OF DIRECTORS
Seng Huang Lee (Executive Chairman)Leonard McKinnon Jim Frayne Alan Zammit Walter McDonald Winson Chow (Alternate to Seng Huang Lee)
COMPANY SECRETARY
Lisa Godfrey1
CHIEF FINANCIAL OFFICER
David Hunt
AUDIT COMMITTEE
Leonard McKinnon (Chairman) Jim Frayne
REMUNERATION COMMITTEE
Leonard McKinnon (Chairman) Jim Frayne
1 Lisa Godfrey was appointed Company Secretary effective 25 October 2012.
AUDITOR
Ernst & Young
COMPLAINT RESOLUTION SERVICE (FINANCIAL SERVICES)
Financial Ombudsman Service Limited GPO Box 3 Melbourne VIC 3001 Telephone: 1300 780 808
CONTACTSNew South Wales
Level 5, 99 Macquarie Street Sydney NSW 2000 Telephone: +61 2 9270 6100
Queensland
Level 5, 120 Edward Street Brisbane QLD 4000 Telephone: +61 7 3223 3888
2 Balgownie Drive Peregian Springs QLD 4573 Telephone: +61 7 5471 5600
Victoria
Level 17, 31 Queen Street Melbourne VIC 3000 Telephone: +61 3 8613 1400
Directory
Disclaimer of Liability
Whilst every effort has been made to ensure the accuracy and completeness of the information presented in this Report, FKP Property Group does not represent or warrant that the information is, or will remain, accurate, complete or reliable. To the extent permitted by law, FKP Property Group excludes responsibility and liability for any loss arising in any way, including by way of negligence, from reliance on the information contained in this Report or otherwise in connection with it.
Please note: All figures are in Australian dollars unless otherwise indicated.

Des
igne
d an
d pr
oduc
ed b
y Sd
irect
Pty
Ltd
.
Monza Recycled is Certified Carbon Neutral by The Carbon Reduction Institute (CRI) in accordance with the global Greenhouse Protcol and ISO 14040 framework. Monza Recycled contains 55% recycled fibre and is FSC Mix Certified, which ensures that all virgin pulp is derived from responsible sources. Monza Recycled is manufactured by an ISO 14001 certified mill.

FKP
www.fkp.com.au
Level 5, 99 Macquarie Street, Sydney NSW 2000(02) 9270 6100
Level 5, 120 Edward Street, Brisbane QLD 4000(07) 3223 3888
Level 17, 31 Queen Street, Melbourne VIC 3000(03) 8613 1400
Cnr Peregian Springs Drive and Longwood DrivePeregian Beach QLD 4573