2012 ANNUAL GENERAL MEETING Lindsay Maxsted Chairman …€¦ · 2012 ANNUAL GENERAL MEETING...
17
Westpac Banking Corporation ABN 33 007 457 141 2012 ANNUAL GENERAL MEETING Lindsay Maxsted Chairman
Transcript of 2012 ANNUAL GENERAL MEETING Lindsay Maxsted Chairman …€¦ · 2012 ANNUAL GENERAL MEETING...

Westpac Banking Corporation ABN 33 007 457 141
2012 ANNUAL
GENERAL MEETING
Lindsay Maxsted
Chairman

Westpac Group 2012 Annual General Meeting | December 2012 2
6.2
8.4
2007 2012
A strong company
51
68
2007 2012
33
110
2007 2012
Customer deposits/loans (%) Common equity Basel II1 ratio (%) Liquid assets ($bn)
1 Based on APRA definitions of Basel II; in 2012, ratio is calculated under Basel 2.5.

Westpac Group 2012 Annual General Meeting | December 2012
Strong common equity ratio against global peers
3
6
7
8
9
10
11
12
13
14
15
16
Han
de
lsba
nke
n
Sw
ed
ba
nk
SE
B
DnB
NO
R
Nord
ea
Westp
ac
Dan
ske
Ba
nk
Sta
nd
ard
Cha
rt
AN
Z
CB
A
BB
VA
Inte
sa
Sa
np
ao
lo
Un
icre
dit
NA
B
Ra
iffe
ise
n
Mo
rga
n S
tan
ley
BK
IR
Ba
nk o
f A
me
rica
Sa
nta
nd
er
ING
BO
Q
Citig
rou
p
CIB
C
JP
Mo
rga
n
HS
BC
US
Ba
nco
rp
Wells
Farg
o
Ba
nco
Po
pu
lar
UB
I B
an
ca
Go
ldm
an
Sa
ch
s
Average 9.7% 10.6%
Global peer comparison of fully harmonised Basel III pro forma common equity ratios1 (%)
1 Source: Company data, Credit Suisse estimates (based on latest reporting data as at 26 October 2012).

Westpac Group 2012 Annual General Meeting | December 2012 4
1 For a detailed explanation of cash earnings and reconciliation to our reported results refer to pages 4-6 of the Group‟s 2012 Full Year Results announcement. 2 Figures for 2009 are presented on a „pro-forma‟ basis, that is as if the merger between Westpac and
St.George Bank Limited was completed on 1 October 2008. Cash earnings for 2009 has been restated to exclude the impact of St.George merger related fair value adjustments.
164
198 209
216
2009 2010 2011 2012
4.7
5.9
6.3 6.6
2009 2010 2011 2012
Cash earnings and cash earnings per share
Cash earnings per ordinary share (cents)1,2 Cash earnings ($bn)1,2

Westpac Group 2012 Annual General Meeting | December 2012
84 cent final dividend, 166 cents for year - up 6%
5
56 60
65
74 76
80 82
84
1H09 2H09 1H10 2H10 1H11 2H11 1H12 2H12
Dividends per ordinary share (cents per share)

Westpac Group 2012 Annual General Meeting | December 2012
Total shareholder return
6
11.6%
24.3%
29.5%
All Ordinaries Index S&P/ASX 300 Bank Index Westpac
Total Shareholder Return1 12 months ended 12 December 2012
1.Total shareholder return includes movements in share prices over the period and dividends paid.

Westpac Banking Corporation ABN 33 007 457 141
2012 ANNUAL
GENERAL MEETING
Gail Kelly
Chief Executive Officer

Westpac Group 2012 Annual General Meeting | December 2012 8
Snapshot of 2012
FY12
Change
FY11 – FY12
Cash earnings $6,598m 5%
Revenue1 $18,076m 6%
Core earnings1,2 $10,697m 7%
Cash EPS 215.9c 3%
Expense to income ratio1 40.8% (70bps)
Fully franked dividend 166c 6% 1 Cash earnings basis. 2 Core earnings is operating profit before income tax and impairment charges..

Westpac Group 2012 Annual General Meeting | December 2012 9
Westpac Institutional Bank
Westpac New Zealand
211 231
267 281
1H11 2H11 1H12 2H12
699 728 734 739
1H11 2H11 1H12 2H12
Westpac Retail & Business Banking
BT Financial Group
890 960 1,001
1,113
1H11 2H11 1H12 2H12
611 622
574
657
1H11 2H11 1H12 2H12
356 373
301 352
100
200
300
400
500
1H11 2H11 1H12 2H12
All divisions performing – cash earnings ($ million)
St.George Banking Group
Westpac Group 2012 Annual General Meeting | December 2012
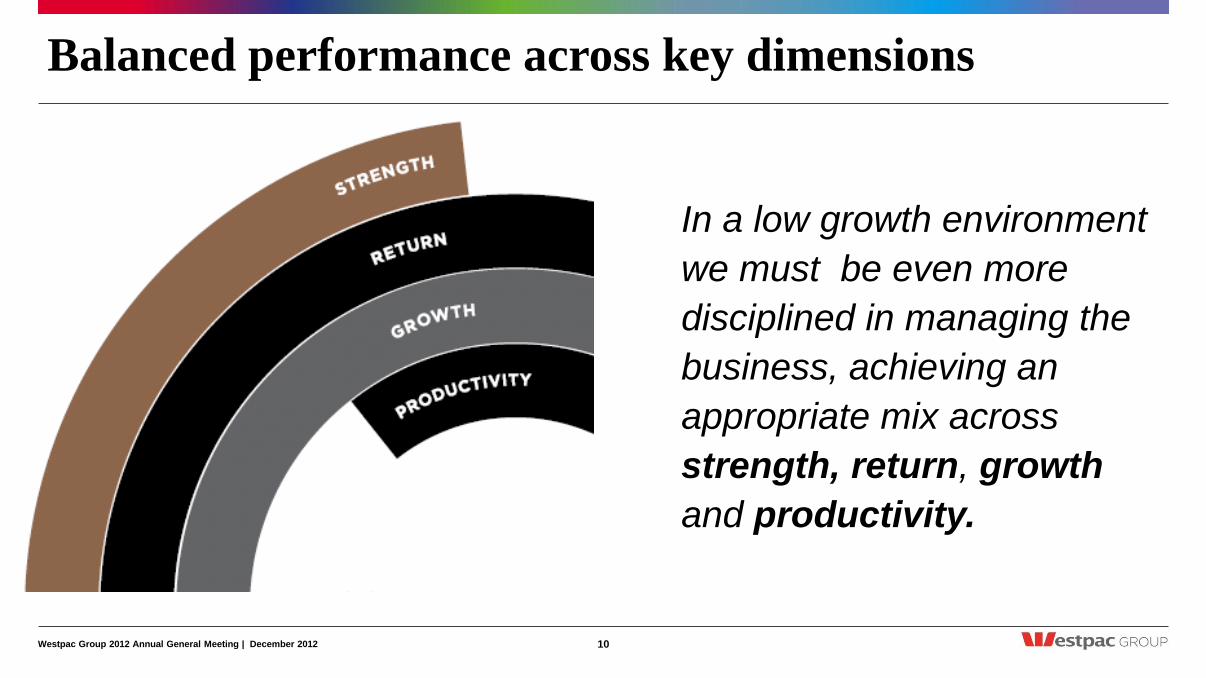
Balanced performance across key dimensions
10
In a low growth environment
we must be even more
disciplined in managing the
business, achieving an
appropriate mix across
strength, return, growth
and productivity.

Westpac Group 2012 Annual General Meeting | December 2012
Strength – higher capital, improved asset quality
11
7.1
7.4
8.2
Sep-10 Sep-11 Sep-12
1 Common equity ratio on a fully harmonised Basel III basis. All figures prior to Sep-12 are pro forma estimates. 2 TCE is Total Committed Exposures.
3.09 3.20
2.48
2.17
Sep-09 Sep-10 Sep-11 Sep-12
Common equity ratio (APRA Basel III)1 (%) Stressed assets to TCE2 (%)

Westpac Group 2012 Annual General Meeting | December 2012
280
310
348
FY10 FY11 FY12
18.4%
20.8%
15.0%
14.1%
18.4%
14.9%
WBC Group
WRBB
SGB
Peer 1
Peer 2
Peer 3
Growth – growing in targeted areas
12
Customer deposit ($bn) Wealth penetration1 (%)
2 Refer to slide 119 in Full Year 2012 Investor Discussion Pack, for the Wealth penetration metrics provider details.
Up 24%
Up 12%
FY10 FY11 FY12
Up 31%
Up 20%
Trade finance revenue

Westpac Group 2012 Annual General Meeting | December 2012
Return - disciplined approach
13
1.4
1.6
1.8
2.0
2.2
2.4
2.6
1H07 2H07 1H08 2H08 1H09 2H09 1H10 2H10 1H11 2H11 1H12 2H12
NIM
NIM excluding Treasury and Markets
2011 2012
Return2 on Average
assets (%) 1.15 1.14
Return2 on average
ordinary equity (%) 16.0 15.5
1 2007 does not include St.George. 2008 and 2009 are pro forma including St.George for the entire period with 1H09 ASX Profit Announcement providing details of pro forma adjustments.
2 Returns are calculated on a Cash earnings basis .
Net interest margin1 (%)

Westpac Group 2012 Annual General Meeting | December 2012
Productivity - one of world’s most efficient banks
14
20%
30%
40%
50%
60%
70%
80%
Deu
tsch
e B
an
k
UB
S A
G
Ba
nk o
f A
me
rica
Citic
orp
Ke
yC
orp
Su
ntr
ust B
an
ks In
c.
Ba
rcla
ys
Ro
ya
l B
an
k
JP
Mo
rga
n C
ha
se
Ba
nk o
f M
on
tre
al
PN
C B
an
k
BN
P P
arib
as
Fifth
Th
ird
Be
nd
igo
Ba
nk
TD
Ba
nk
HS
BC
Roya
l B
k o
f S
co
tla
nd
Ba
nk o
f E
ast A
sia
Wells
Fa
rgo
CIB
C
Llo
yd
s B
an
kin
g G
rou
p
Ba
nk o
f N
ova
Sco
tia
KB
Fin
an
cia
l G
rou
p
US
Ba
nco
rp
Sta
nd
ard
Ch
art
ere
d
Han
a F
ina
ncia
l G
rou
p
BB
VA
Ko
rea
Exch
an
ge
Ba
nk
Dev'm
en
t B
k o
f S
'po
re
Ba
nk o
f Q
ld
CB
A
AN
Z
Win
g H
an
g B
an
k
Unite
d O
ve
rsea
s B
k
NA
B
OC
BC
Chin
a M
erc
ha
nt B
an
k
Westp
ac
Bk o
f C
om
mu
nic
ation
Ind
us &
Co
m B
k C
hin
a
Chin
a C
on
str
uctio
n B
k
Han
g S
en
g B
an
k
1 Source: Company data, Credit Suisse estimates 2012 (based on latest reporting data as at 10 December 2012).. 2. Cash Earnings Basis.
Average 54.7%
40.8%
2
Global peer comparison of expense to income ratios1 (%)

Westpac Group 2012 Annual General Meeting | December 2012
Supported by a highly engaged workforce
15
81
80
81
84
2009 2010 2011 2012
Employee engagement (%)

Westpac Group 2012 Annual General Meeting | December 2012
Strategic priorities
16
A strong company
Reorient to higher growth/higher return
sectors and segments
Continue building deeper
customer relationships
Materially simplify products and processes
One team approach
1
2
3
4
5

Westpac Group 2012 Annual General Meeting | December 2012 17
Disclaimer
The material contained in this presentation is intended to be general background information on Westpac Banking Corporation and its activities.
The information is supplied in summary form and is therefore not necessarily complete. Also, it is not intended that it be relied upon as advice to investors or potential investors, who should
consider seeking independent professional advice depending upon their specific investment objectives, financial situation or particular needs.
The material contained in this presentation may include information derived from publicly available sources that have not been independently verified. No representation or warranty is made
as to the accuracy, completeness or reliability of the information.
This presentation contains statements that constitute “forward-looking statements” within the meaning of section 21E of the U.S. Securities Exchange Act of 1934. Forward-looking statements
are statements about matters that are not historical facts. The forward-looking statements include statements regarding our intent, belief or current expectations with respect to our business
and operations, market conditions and results of operations and financial condition, including, without limitation, indicative drivers, forecasted economic indicators and performance metric
outcomes.
We use words such as „may‟, „expect‟, 'indicative', „intend‟, „forecast‟, „likely‟, „estimate‟, „anticipate‟, „believe‟, or similar words to identify forward-looking statements. These statements reflect
our current views with respect to future events and are subject to certain risks, uncertainties and assumptions. These forward-looking statements reflect our current views with respect to future
events and have been made upon management‟s expectations and beliefs concerning future development and their potential affect upon us. There can be no assurance that future
developments will be in accordance with our expectations or that the effect of future developments on us will be those anticipated. Actual results may differ materially from those which we
expect, depending on the outcome of various factors. Factors that may impact on the forward-looking statements made include those described in the section entitled 'Risk and risk
management' in Westpac‟s 2012 Annual Report on Form 20-F filed with the U.S. Securities and Exchange Commission or in Westpac‟s 2012 Annual Report available at
www.westpac.com.au/investorcentre. When relying on forward-looking statements to make decisions with respect to us, investors and others should carefully consider such factors and other
uncertainties and events. We are under no obligation, and do not intend, to update any forward-looking statements contained in this presentation.