2011 Whirlpool 10K
83
UNITED STATES SECURITIES AND EXCHANGE COMMISSION WASHINGTON, D.C. 20549 FORM 10-K (Mark One) ANNUAL REPORT PURSUANT TO SECTION 13 OR 15(d) OF THE SECURITIES EXCHANGE ACT OF 1934 For the fiscal year ended December 31, 2011 OR TRANSITION REPORT PURSUANT TO SECTION 13 OR 15(d) OF THE SECURITIES EXCHANGE ACT OF 1934 For the transition period from _______ to _______ Commission file number 1-3932 WHIRLPOOL CORPORATION (Exact name of registrant as specified in its charter) Delaware (State of Incorporation) 2000 North M-63, Benton Harbor, Michigan (Address of principal executive offices) 38-1490038 (I.R.S. Employer Identification No.) 49022-2692 (Zip Code) Registrant’s telephone number, including area code (269) 923-5000 Securities registered pursuant to Section 12(b) of the Act: Title of each class Common stock, par value $1 per share Name of each exchange on which registered Chicago Stock Exchange and New York Stock Exchange Securities registered pursuant to Section 12(g) of the Act: NONE Indicate by check mark if the registrant is a well-known seasoned issuer, as defined in Rule 405 of the Securities Act. Indicate by check mark if the registrant is not required to file reports pursuant to Section 13 or Section 15(d) of the Exchange Act. Indicate by check mark whether the registrant (1) has filed all reports required to be filed by Section 13 or 15(d) of the Exchange Act during the preceding 12 months (or for such shorter period that the registrant was required to file such report), and (2) has been subject to such filing requirements for the past 90 days. Indicate by check mark whether the registrant has submitted electronically and posted on its corporate Web site, if any, every Interactive Data File required to be submitted and posted pursuant to Rule 405 of Regulation S-T (§ 232.405 of this chapter) during the preceding 12 months (or for such shorter period that the registrant was required to submit and post such files). Indicate by check mark if disclosure of delinquent filers pursuant to Item 405 of Regulation S-K (§229.405 of this chapter) is not contained herein, and will not be contained, to the best of the registrant’s knowledge, in definitive proxy or information statements incorporated by reference in Part III of this Form 10-K or any amendment to this Form 10-K. Indicate by check mark whether the registrant is a large accelerated filer, an accelerated filer, a non-accelerated filer, or a smaller reporting company. See the definitions of “large accelerated filer,” “accelerated filer,” and “smaller reporting company” in Rule 12b-2 of the Exchange Act. (Check one) Large accelerated filer Non-accelerated filer (Do not check if a smaller reporting company) Indicate by check mark whether the registrant is a shell company (as defined in Rule 12b-2 of the Exchange Act). Accelerated filer Smaller reporting company Yes No Yes No Yes No Yes No Yes No The aggregate market value of voting common stock of the registrant held by stockholders not including voting stock held by directors and executive officers of the registrant and certain employee plans of the registrant (the exclusion of such shares shall not be deemed an admission by the registrant that any such person is an affiliate of the registrant) at the close of business on June 30, 2011 (the last business day of the registrant’s most recently completed second fiscal quarter) was $6,018,623,824. On February 8, 2012, the registrant had 76,609,609 shares of common stock outstanding. DOCUMENTS INCORPORATED BY REFERENCE Portions of the following documents are incorporated herein by reference into the Part of the Form 10-K indicated: Document The registrant’s proxy statement for the 2012 annual meeting of stockholders (the “Proxy Statement”) Part of Form 10-K into which incorporated Part III
Transcript of 2011 Whirlpool 10K

UNITED STATES SECURITIES AND EXCHANGE COMMISSION WASHINGTON, D.C. 20549
FORM 10-K (Mark One)
ANNUAL REPORT PURSUANT TO SECTION 13 OR 15(d) OF THE SECURITIES EXCHANGE ACT OF 1934For the fiscal year ended December 31, 2011
OR
TRANSITION REPORT PURSUANT TO SECTION 13 OR 15(d) OF THE SECURITIES EXCHANGE ACT OF 1934
For the transition period from _______ to _______Commission file number 1-3932
WHIRLPOOL CORPORATION (Exact name of registrant as specified in its charter)
Delaware(State of Incorporation)
2000 North M-63, Benton Harbor, Michigan(Address of principal executive offices)
38-1490038(I.R.S. Employer Identification No.)
49022-2692(Zip Code)
Registrant’s telephone number, including area code (269) 923-5000Securities registered pursuant to Section 12(b) of the Act:
Title of each classCommon stock, par value $1 per share
Name of each exchange on which registeredChicago Stock Exchange and New York Stock Exchange
Securities registered pursuant to Section 12(g) of the Act: NONE
Indicate by check mark if the registrant is a well-known seasoned issuer, as defined in Rule 405 of the Securities Act. Indicate by check mark if the registrant is not required to file reports pursuant to Section 13 or Section 15(d) of the Exchange Act.Indicate by check mark whether the registrant (1) has filed all reports required to be filed by Section 13 or 15(d) of the Exchange Act duringthe preceding 12 months (or for such shorter period that the registrant was required to file such report), and (2) has been subject to suchfiling requirements for the past 90 days.Indicate by check mark whether the registrant has submitted electronically and posted on its corporate Web site, if any, every Interactive DataFile required to be submitted and posted pursuant to Rule 405 of Regulation S-T (§ 232.405 of this chapter) during the preceding 12 months(or for such shorter period that the registrant was required to submit and post such files).Indicate by check mark if disclosure of delinquent filers pursuant to Item 405 of Regulation S-K (§229.405 of this chapter) is not containedherein, and will not be contained, to the best of the registrant’s knowledge, in definitive proxy or information statements incorporated byreference in Part III of this Form 10-K or any amendment to this Form 10-K. Indicate by check mark whether the registrant is a large accelerated filer, an accelerated filer, a non-accelerated filer, or a smaller reportingcompany. See the definitions of “large accelerated filer,” “accelerated filer,” and “smaller reporting company” in Rule 12b-2 of the ExchangeAct.(Check one) Large accelerated filer Non-accelerated filer (Do not check if a smaller reporting company)Indicate by check mark whether the registrant is a shell company (as defined in Rule 12b-2 of the Exchange Act).
Accelerated filer Smaller reporting company
Yes NoYes No
Yes No
Yes No
Yes NoThe aggregate market value of voting common stock of the registrant held by stockholders not including voting stock held by directors and executive officers of the registrant and certain employee plans of the registrant (the exclusion of such shares shall not be deemed an admission by the registrant that any such person is an affiliate of the registrant) at the close of business on June 30, 2011 (the last business day of the registrant’s most recently completed second fiscal quarter) was $6,018,623,824.On February 8, 2012, the registrant had 76,609,609 shares of common stock outstanding.
DOCUMENTS INCORPORATED BY REFERENCEPortions of the following documents are incorporated herein by reference into the Part of the Form 10-K indicated:
DocumentThe registrant’s proxy statement for the 2012 annual meeting of stockholders (the “Proxy Statement”)
Part of Form 10-K into which incorporatedPart III

WHIRLPOOL CORPORATION
ANNUAL REPORT ON FORM 10-KFor the fiscal year ended December 31, 2011
TABLE OF CONTENTS
Item 1.Item 1A.Item 1B.Item 2.Item 3.Item 4.
Item 5.
Item 6.Item 7.Item 7A.Item 8.Item 9.Item 9A.Item 9B.
Item 10.Item 11.Item 12.
Item 13.Item 14.
Item 15.
PAGEPART I
PART II
PART III
PART IV
SIGNATURES
FINANCIAL SUPPLEMENT TO 2011 ANNUAL REPORT ON FORM 10-K AND 2012 PROXY STATEMENT
BusinessRisk FactorsUnresolved Staff CommentsPropertiesLegal ProceedingsMine Safety Disclosures
Market for Registrants's Common Equity, Related Stockholder Matters and Issuer Purchases of Equity SecuritiesSelected Financial DataManagement's Discussion and Analysis of Financial Condition and Results of OperationsQuantitative and Qualitative Disclosures about Market RiskFinancial Statements and Supplementary DataChanges in and Disagreements with Accountants on Accounting and Financial DisclosureControls and ProceduresOther Information
Directors, Executive Officers and Corporate GovernanceExecutive CompensationSecurity Ownership of Certain Beneficial Owners and Management and Related Stockholder MattersCertain Relationships and Related Transactions, and Director IndependencePrincipal Accounting Fees and Services
Exhibits, Financial Statement Schedules
36
10111111
12
12121212121213
131314
1414
14
15
F-1

3
PART IITEM 1. BUSINESS.
Whirlpool Corporation, the world’s leading manufacturer and marketer of major home appliances, was incorporated in 1955 under the laws of Delaware as the successor to a business that traces its origin to 1898. Whirlpool manufactures products in 12 countries under 13 principal brand names and markets products in nearly every country around the world. Whirlpool’s geographic segments consist of North America, Latin America, EMEA (Europe, Middle East and Africa) and Asia. As of December 31, 2011, Whirlpool had approximately 68,000 employees.
As used herein, and except where the context otherwise requires, “Whirlpool,” “we,” “us,” and “our” refer to Whirlpool Corporation and its consolidated subsidiaries.
Products and Markets
Whirlpool manufactures and markets a full line of major home appliances and related products. Our principal products are laundry appliances, refrigerators and freezers, cooking appliances, dishwashers, mixers and other portable household appliances. We also produce hermetic compressors for refrigeration systems.
The following table provides the total net sales for each class of products which accounted for 10% or more of our consolidated net sales over the last three years:
Millions of dollars
Laundry AppliancesRefrigerators and FreezersCooking AppliancesOther
Net Sales
2011
$ 5,6125,6203,1204,314
$18,666
30%30%17%23%
100%
2010
$ 5,4355,6163,0254,290
$18,366
30%31%16%23%
100%
2009
$ 5,3455,2002,8093,745
$17,099
31%30%17%22%
100%
In North America, Whirlpool markets and distributes major home appliances and portable appliances under a variety of brand names. In the United States, we market and distribute products primarily under the Whirlpool, Maytag, KitchenAid, Jenn-Air, Amana, Roper, Estate, Admiral and Gladiator brand names primarily to retailers, distributors and builders. In Canada, we market and distribute major home appliances primarily under the Inglis, Admiral, Whirlpool, Maytag, Jenn-Air, Amana, Roper, Estate and KitchenAid brand names. In Mexico, we market and distribute major home appliances primarily under the Whirlpool, Maytag, Acros, KitchenAid and Supermatic brand names. We sell some products to other manufacturers, distributors, and retailers for resale in North America under those manufacturers’ and retailers’ respective brand names.
In Latin America, we market and distribute our major home appliances primarily under the Consul, Brastemp, Whirlpool, KitchenAid, Maytag and Eslabón de Lujo brand names. We manage appliance sales and distribution in Brazil, Argentina, Chile and Peru through our Brazilian subsidiary, and in Bolivia, Paraguay and Uruguay through our distributors. We manage appliance sales and distribution in the Caribbean, Central American countries, Venezuela, Colombia, Guatemala and Ecuador through our Brazilian subsidiary and through distributors.
In EMEA, we market and distribute our major home appliances primarily under the Whirlpool, Bauknecht, Ignis, Maytag, Laden, Polar and Privileg brand names, and major and portable appliances under the KitchenAid brand name. In addition to our operations in Western Europe, we have sales subsidiaries in Russia, Ukraine, Hungary, Poland, the Czech Republic, Slovakia, Greece, Romania, Bulgaria, Latvia, Estonia, Lithuania, Croatia, Morocco and Turkey, with representative offices in Kazakhstan, Slovenia, Serbia and Montenegro. We market and distribute a full line of products under the Whirlpool, KIC and Ignis brand names in South Africa. Our European operations also market and distribute products under the Whirlpool, Bauknecht and Ignis brand names to distributors and dealers in Africa and the Middle East.
In Asia, we have organized the marketing and distribution of our major home appliances into five operating groups: (1) mainland China (2) Hong Kong and Taiwan; (3) India, which includes Bangladesh, Sri Lanka, Nepal and Pakistan; (4) Oceania, which includes Australia, New Zealand and Pacific Islands; and (5) Southeast Asia, which includes Thailand, Singapore, Malaysia, Indonesia, Vietnam, the Philippines, Korea and Japan. We market and distribute our products in Asia primarily under the Whirlpool, Maytag, KitchenAid, Amana and Jenn-Air brand names through a combination of direct sales to appliance retailers and chain stores and full-service distributors to a large network of retail stores.

4
Competition
Competition in the major home appliance industry is intense including competitors such as Electrolux, General Electric Kenmore, LG, Bosch Siemens, Samsung and Haier. Moreover, the United States customer base includes large, sophisticated trade customers who have many choices and demand competitive products, services and prices. Competition in our markets is based upon a wide variety of factors, including selling price, product features and design, performance, innovation, energy efficiency, quality, cost, distribution and financial incentives. These financial incentives include cooperative advertising, co-marketing funds, salesperson incentives, volume rebates, and terms. We believe that we can best compete in the current environment by focusing on research and development including introducing new innovative products, building strong brands, enhancing trade customer and consumer value with our product offerings, continuing to expand our global footprint, expanding trade distribution channels, increasing productivity, improving quality, lowering costs, and taking other efficiency-enhancing measures.
Raw Materials and Purchased Components
We are generally not dependent upon any one source for raw materials or purchased components essential to our business. In areas where a single supplier is used, alternative sources are generally available and can be developed within the normal manufacturing environment. Some unanticipated costs may be incurred in transitioning to a new supplier if a prior single supplier relationship was abruptly interrupted or terminated. Cost pressure has been experienced during 2011 in some areas, such as steel, resins and oil-based commodities. Supply constraints due to environment impacts such as hurricanes, tsunamis, and floods have required the qualification and use of alternate materials, some of which were at premium costs. We believe such raw materials and components will be available in adequate quantities to meet forecast production schedules.
Trademarks, Licenses and Patents
We consider the trademarks, licenses and patents we own in the aggregate to be a valuable asset. Whirlpool is the owner of a number of trademarks in the United States and foreign countries. The most important trademarks to North America are Whirlpool, Maytag, Jenn-Air, KitchenAid, Amana, and Acros. The most important trademarks to EMEA are Whirlpool, Bauknecht and Ignis. In Latin America, the most important trademarks are Consul, Brastemp, Whirlpool and KitchenAid. The most important trademark to Asia is Whirlpool. We receive royalties from licensing our trademarks to third parties to sell and service certain products bearing the Whirlpool, Maytag, KitchenAid, Jenn-Air, and Amana brand names. We continually apply for and obtain United States and foreign patents. The primary purpose in obtaining patents is to protect our designs and technologies.
Research and Development
Expenditures for research and development relating to new and innovative products and the improvement of existing products were approximately $578 million, $532 million and $500 million in 2011, 2010 and 2009, respectively.
Protection of the Environment
Our manufacturing facilities are subject to numerous laws and regulations designed to protect or enhance the environment, many of which require federal, state, or other governmental licenses and permits with regard to wastewater discharges, air emissions, and hazardous waste management. Our policy is to comply with all such laws and regulations. Where laws and regulations are less restrictive, we have established and are following our own standards consistent with our commitment to environmental responsibility.
We believe that we are in compliance, in all material respects, with presently applicable governmental provisions relating to environmental protection in the countries that we have manufacturing operations. Compliance with these environmental laws and regulations has not had a material effect on capital expenditures, earnings, or our competitive position during 2011 and are not expected to be material in 2012.
The entire major home appliance industry, including Whirlpool, must contend with the adoption of stricter governmental energy and environmental standards. These standards will be phased in over the next several years and include the general phase-out of ozone depleting chemicals used in refrigeration, energy standards rulemakings for selected major appliances, regulatory restrictions on the materials content specified for use in our products by some jurisdictions, and mandated recycling of our products at the end of their useful lives. Compliance with these various standards, as they become effective, will require some product redesign. However, we believe, based on our understanding of the current state of proposed regulations, that we will be able to develop, manufacture, and market products that comply with these regulations.
State and federal environmental protection agencies have notified us of our possible involvement in a number of “Superfund” sites in the United States. However, based upon our evaluation of the facts and circumstances relating to these sites along with the evaluation of our technical consultants, we do not presently anticipate any material adverse effect upon our earnings, financial condition, or competitive position arising out of the resolution of these matters or the resolution of any other known governmental proceeding regarding environmental protection matters.

5
Other Information
For information about the challenges and risks associated with our foreign operations, see “Risks Relating to Our Business” under Item 1A below.
For certain other financial information concerning our business segments and foreign and domestic operations, see Note 13 to the Consolidated Financial Statements.
For information on our global restructuring plans, and the impact of these plans on our operating segments, see Notes 10 and 13 to the Consolidated Financial Statements.
For information on product recalls, see Note 6 to the Consolidated Financial Statements.
Executive Officers of the Registrant
The following table sets forth the names and ages of our executive officers on February 8, 2012, the positions and offices they held on that date, and the year they first became executive officers:
Name
Jeff M. FettigMichael A. TodmanMarc R. BitzerBracken Darrell
Jose A. DrummondDavid T. SzczupakLarry M. VenturelliRoy W. Templin
Office
Director, Chairman of the Board and Chief Executive OfficerDirector and President, Whirlpool InternationalPresident, Whirlpool North AmericaPresident, Whirlpool EMEA and Executive Vice President of WhirlpoolCorporationExecutive Vice President and President, Whirlpool Latin AmericaExecutive Vice President, Global Product OrganizationExecutive Vice President and Chief Financial OfficerExecutive Vice President, Finance
First Becamean Executive
Officer
199420012006
20092008200820122004
Age
545447
4947565151
Each of the executive officers named above was elected by our Board of Directors to serve in the office indicated until the first meeting of the Board of Directors following the annual meeting of stockholders in 2012 and until his successor is chosen and qualified or until his earlier resignation or removal. Each of our executive officers has held the position set forth in the table above or has served Whirlpool in various executive or administrative capacities for at least the past five years, except for Mr. Szczupak and Mr. Darrell. Prior to joining Whirlpool in July 2008, Mr. Szczupak for the previous two years served as Chief Operating Officer of Dura Automotive Systems, Inc., and before joining Dura in 2006, worked for Ford Motor Company for 22 years in various leadership roles. Mr. Darrell, prior to joining Whirlpool in September 2008, for the previous six years held various executive positions with The Procter & Gamble Company, the most recent being President of Braun, a Procter & Gamble division.
Available Information
Financial results and investor information (including Whirlpool’s Form 10-K, 10-Q, and 8-K reports) are accessible at Whirlpool’s website: www.whirlpoolcorp.com — click on “Investors” and then click on “SEC Filings.” Copies of our Form 10-K, 10-Q, and 8-K reports and amendments, if any, are available free of charge through our website on the same day they are filed with, or furnished to, the Securities and Exchange Commission.

6
ITEM 1A. RISK FACTORS.
This report contains statements referring to Whirlpool that are not historical facts and are considered “forward-looking statements” within the meaning of the Private Securities Litigation Reform Act of 1995. These statements, which are intended to take advantage of the “safe harbor” provisions of the Private Securities Litigation Reform Act of 1995, are based on current projections about operations, industry conditions, financial condition and liquidity. Words that identify forward-looking statements include words such as “may,” “could,” “will,” “should,” “possible,” “plan,” “predict,” “forecast,” “potential,” “anticipate,” “estimate,” “expect,” “project,” “intend,” “believe,” “may impact,” “on track,” and words and terms of similar substance used in connection with any discussion of future operating or financial performance, a merger, or our businesses. In addition, any statements that refer to expectations, projections, or other characterizations of future events or circumstances, including any underlying assumptions, are forward-looking statements. Those statements are not guarantees and are subject to risks, uncertainties, and assumptions that are difficult to predict. Therefore, actual results could differ materially and adversely from these forward-looking statements. These risks and uncertainties include, but are not limited to, the following:
Risks Relating to Our Business
We face intense competition in the major home appliance industry and failure to successfully compete may negatively affect our business and financial performance. Each of our operating segments operates in a highly competitive business environment and faces intense competition from a growing number of competitors, many of which have strong consumer brand equity. Several of these competitors, such as Electrolux, LG, Samsung, Bosch Siemens, Panasonic and General Electric are large, well-established companies, many ranking among the Global Fortune 150, and have demonstrated a commitment to success in the global market. Moreover, the United States customer base includes large, sophisticated trade customers who have many choices and demand competitive products, services and prices. Competition in the global appliance market is based on a number of factors including selling price, product features and design, performance, innovation, energy efficiency, quality, cost, distribution, and financial incentives, such as cooperative advertising, co-marketing funds, sales person incentives, volume rebates and terms. In the past, our competitors, especially global competitors with low-cost sources of supply and/or highly protected home markets outside the United States, have aggressively priced their products and/or introduced new products to increase market share. If we are unable to successfully compete in this highly competitive environment, our business and financial performance could be negatively affected.
The loss of or substantial decline in sales to any of our key trade customers, which include Lowe's, Sears, Home Depot, Best Buy, Casas Bahia, Ikea, major buying groups, and builders, could adversely affect our financial performance. We sell to a sophisticated customer base of large trade customers that have significant leverage as buyers over their suppliers. Most of our products are not sold through long-term contracts, which facilitates the trade customers' ability to change volume among suppliers. As the trade customers continue to become larger, they may seek to use their position to improve their profitability by various means, including improved efficiency, lower pricing, and increased promotional programs. If we are unable to meet their demands requirements, our volume growth and financial results could be negatively affected. The loss of, or substantial decline in volume of, sales to Lowe's, Sears, Home Depot, Best Buy, Casas Bahia, Ikea, major buying groups or builders, or any other trade customers to which we sell a significant amount of products, could adversely affect our financial performance. Additionally, the loss of market share or financial difficulties, including bankruptcy, by these trade customers could have a material adverse effect on our liquidity, financial position and results of operations.
Changes in economic conditions could adversely affect demand for our products. A number of economic factors, including, but not limited to, gross domestic product, availability of consumer credit, interest rates, consumer sentiment and debt levels, retail trends, housing starts, sales of existing homes, the level of mortgage refinancing and defaults, and foreign currency exchange rates, generally affect demand for our products. Higher unemployment rates, higher fuel and other energy costs, and higher tax rates adversely affect demand. A decline in economic activity and conditions in the United States, Brazil, Europe and the other markets in which we operate has had an adverse affect on our financial condition and results of operations over the past few years, and future declines and adverse conditions could have a similar adverse affect.
We face inventory and other asset risk. We record a write-down for product and component inventories that have become obsolete or exceed anticipated demand or net realizable value. We also review our long-lived and intangible assets for impairment whenever events or changed circumstances indicate the carrying amount of an asset may not be recoverable. If we determine that impairment has occurred, we record a write-down to adjust carrying value to fair value. Although we believe our inventory and other asset related provisions are currently adequate, no assurance can be given that, given the unpredictable pace of product obsolescence and business conditions with trade customers and in general, we will not incur additional inventory or asset related charges. Such charges could materially adversely affect our financial condition and operating results.

7
Risks associated with our international operations may decrease our revenues and increase our costs. For the year ended December 31, 2011, we derived approximately 49% of our net sales from outside of North America (which includes Canada and Mexico), including 27% in Latin America, 17% in Europe and 5% in Asia. We expect that international sales will continue to account for a significant percentage of our net sales in the foreseeable future. Accordingly, we face numerous risks associated with conducting international operations, any of which could negatively affect our financial performance. These risks include the following:
• changes in foreign country regulatory requirements;• various import/export restrictions and the availability of required import/export licenses;• imposition of foreign tariffs and other trade barriers;• political, legal, and economic instability and uncertainty;• foreign currency exchange rate fluctuations;• changes in foreign country tax rules, regulations and other requirements, such as changes in tax rates and statutory and
judicial interpretations of tax laws;• inflation;• work stoppages and disruptions in the shipping of imported and exported products;• government price controls;• extended payment terms and the inability to collect accounts receivable; and• the inability to repatriate cash.
Additionally, as a U.S. corporation, we are subject to the Foreign Corrupt Practices Act, which may place us at a competitive disadvantage to foreign companies that are not subject to similar regulations. Additionally, any determination that we have violated the Foreign Corrupt Practices Act could have a material adverse effect on us.
Terrorist attacks, armed conflicts, natural disasters, and epidemics could affect our domestic and international sales, disrupt our supply chain, and impair our ability to produce and deliver our products. Such events could directly impact our physical facilities or those of our suppliers or customers, both in the United States and elsewhere.
The recent European debt crisis could have a material adverse effect on our European operations. The recent European debt crisis and related European financial restructuring efforts have contributed to instability in the global credit markets and may cause the value of the Euro to further deteriorate. If global economic and market conditions, or economic conditions in Europe, the United States or other key markets remain uncertain or deteriorate further, the value of the Euro could decline and the credit market may weaken. The general financial instability in the stressed European countries could have a contagion effect on the region and contribute to the general instability and uncertainty in the European Union. If this were to occur, it could adversely affect our European customers and suppliers and in turn may have a materially adverse effect on our European business and results of operations.
An inability to effectively execute and manage our business objectives could adversely affect our financial performance. The highly competitive nature of our industry requires that we effectively execute and manage our business including our global operating platform initiative. Our global operating platform initiative aims to reduce costs, expand margins, drive productivity and quality improvements, and accelerate our rate of innovation. Our inability to effectively control costs and drive productivity improvements could affect our profits. In addition, our inability to provide high-quality, innovative products could adversely affect our ability to maintain or increase our sales, which it could negatively affect our revenues and overall financial performance. Additionally, our success is dependent on anticipating changes in customer preferences and on successful new product and process development and product relaunches in response to such changes. Our future results and our ability to maintain or improve our competitive position will depend on our capacity to gauge the direction of our key markets and upon our ability to successfully and timely identify, develop, manufacture, market, and sell new or improved products in these changing markets.
Fluctuations and volatility in the cost of raw materials and purchased components could adversely affect our operating results. The primary materials used to produce and manufacture our products are steel, oil, plastic resins, and base metals, such as aluminum, copper, zinc, and nickel. On a global and regional basis, the sources and prices of those materials and components are susceptible to significant price fluctuations due to supply/demand trends, transportation costs, government regulations and tariffs, changes in currency exchange rates, price controls, the economic climate, and other unforeseen circumstances. Material cost inflation is expected to be approximately $300 million to $350 million in 2012, largely driven by increases in the cost of base metals, such as copper, aluminum, zinc and nickel, as well as component parts and steel. Continued significant increases in these and other costs in the future could have a material adverse effect on our operating results.
Unfavorable results of legal proceedings could materially adversely affect our business and financial condition and performance. We are subject to a variety of litigation and legal compliance risks, including litigation concerning products, intellectual property rights, taxes, environmental matters, commercial matters and compliance with competition laws and sales

8
and trading practices. Results of legal proceedings cannot be predicted with certainty. Regardless of merit, litigation may be both time-consuming and disruptive to our operations and cause significant expense and diversion of management attention. We estimate loss contingencies and establish reserves as required by generally accepted accounting principles based on our assessment of contingencies where liability is deemed probable and reasonably estimable in light of the facts and circumstances known to us at a particular point in time. Subsequent developments in legal proceedings, volatility in foreign currency exchange rates and other factors may affect our assessment and estimates of the loss contingency recorded and could result in an adverse effect on our results of operations in the period in which a liability would be recognized or cash flows for the period in which amounts would be paid. Actual results may significantly vary from our reserves.
Product liability or product recall costs could adversely affect our business and financial performance. We are subject to the risk of exposure to product liability and product recall claims if any of our products are alleged to have resulted in injury to persons or damage to property. In the event that any of our products prove to be defective, we may need to recall and/or redesign such products. In addition, any claim or product recall that results in significant adverse publicity, particularly if those claims or recalls cause customers to question the safety or reliability of our products, may negatively affect our business, financial condition, or results of operations. We do maintain product liability insurance, but this insurance may not be adequate to cover losses related to product liability claims brought against us. We may also be involved in certain class action and other litigation, for which no insurance is available. Product liability insurance could become more expensive and difficult to maintain and may not be available on commercially reasonable terms, if at all. In addition, we do not maintain any product recall insurance, so any product recall we are required to initiate could have a significant impact on our financial position, results of operations and/or cash flows.
We regularly engage in investigations of potential quality and safety issues as part of our ongoing effort to deliver quality products to our customers. We are currently investigating a limited number of potential quality and safety issues, and as necessary, we undertake to effect repair or replacement of appliances. Actual costs of these issues and any future issues depend upon several factors, including the number of consumers who respond to a particular recall, repair and administrative costs, whether the cost of any corrective action is borne initially by Whirlpool or the supplier, and, if initially borne by Whirlpool, whether we will be successful in recovering our costs from the supplier. The actual costs incurred as a result of these issues and any future issues could have a material adverse effect on our business, financial condition or results of operations.
We are subject to, and could be further subject to, governmental investigations or actions by other third parties. We are subject to various federal, foreign and state laws, including antitrust laws, violations of which can involve civil or criminal sanctions. Government regulators in various jurisdictions are currently investigating alleged pricing practices in the global compressor industry, including our Embraco compressor business headquartered in Brazil. In addition, we have been named as a defendant in related class action lawsuits in various jurisdictions, which seek damages in connection with the pricing of compressors, and additional lawsuits may be filed. The impact of these and other investigations and lawsuits could have a material adverse effect on our financial position, liquidity and results of operations.
Our intellectual property rights are valuable, and any inability to protect them could reduce the value of our products, services, and brands. We consider our intellectual property rights, including patents, trademarks, trade secrets, and licensing agreements, to be a significant and valuable aspect of our business. We attempt to protect our intellectual property rights through a combination of patent, trademark, copyright, and trade secret laws, as well as licensing agreements and third party nondisclosure and assignment agreements. Our failure to obtain or adequately protect our trademarks, products, new features of our products, or our processes may diminish our competitiveness.
We have applied for patent protection in the United States and other jurisdictions with respect to certain innovations and new products, product features, and processes. We cannot be assured that the U.S. Patent and Trademark Office or any other jurisdiction will approve any of our patent applications. Additionally, the patents we own could be challenged, invalidated, or others could design around our patents and the patents may not be of sufficient scope or strength to provide us with any meaningful protection or commercial advantage. Further, the laws of certain foreign countries in which we do business or contemplate doing business in the future do not recognize intellectual property rights or protect them to the same extent as United States law. As a result, these factors could weaken our competitive advantage with respect to our products, services, and brands in foreign jurisdictions, which could adversely affect our financial performance.
Moreover, while we do not believe that any of our products infringe on the valid intellectual property rights of third parties, others may assert intellectual property rights that cover some of our technology, brands, products, or services. Any litigation regarding patents or other intellectual property could be costly and time-consuming and could divert the attention of our management and key personnel from our business operations. Claims of intellectual property infringement might also require us to enter into costly license agreements. We also may be subject to significant damages or injunctions against development and sale of certain products.

9
The ability of suppliers to deliver parts, components and manufacturing equipment to our manufacturing facilities, including our ability to manufacture without disruption, could affect our global business performance. We use a wide range of materials and components in the global production of our products and use numerous suppliers to provide materials and components. Because we generally do not have guaranteed supply arrangements with our suppliers and some key parts may be available only from a single supplier or a limited group of suppliers, we are subject to supply and pricing risks. In addition, certain proprietary component parts used in some of our products are provided by single-source unaffiliated third-party suppliers. We would be unable to obtain these proprietary component parts for an indeterminate period of time if these single-source suppliers were to cease or interrupt production or otherwise fail to supply these components to us, which could adversely affect our product sales and operating results. Our operations and operations at suppliers’ facilities are subject to disruption for a variety of reasons, including, but not limited to, work stoppages, fire, earthquake, flooding, or other natural disasters. Such disruption could interrupt our ability to manufacture certain products. Any significant disruption could negatively impact our revenue and earnings performance.
Significant differences between actual results and estimates of the amount of future funding for our pension plans and postretirement health care benefit programs, and significant changes in funding assumptions or significant increases in funding obligations due to regulatory changes, could adversely affect our financial results. We have both funded and unfunded defined benefit pension plans that cover certain employees in North America, Europe, Asia and Brazil. We also have unfunded postretirement health care benefit plans for eligible retired employees. The Employee Retirement Income Security Act of 1974 (ERISA), the Pension Protection Act and the Internal Revenue Code govern the funding obligations for our U.S. pension plans, which are our principal pension plans. Our U.S. defined benefit plans were frozen as of December 31, 2006 for substantially all participants. For 2007 and beyond, Whirlpool employees may participate in an enhanced defined contribution plan.
As of December 31, 2011, our projected benefit obligations under our pension plans and postretirement health care benefit programs exceeded the fair value of plan assets by an aggregate of approximately $1,990 million ($1,502 million of which was attributable to pension plans and $488 million of which was attributable to postretirement health care benefits). Estimates for the amount and timing of the future funding obligations of these pension plans and postretirement health care benefit plans are based on various assumptions. These assumptions include discount rates, expected long-term rate of return on plan assets, and health care cost trend rates. These assumptions are subject to change based on changes in interest rates on high quality bonds, stock and bond market returns, and health care cost trend rates. Significant differences in results or significant changes in assumptions may materially affect our postretirement obligations and related future contributions and expenses.
We may be subject to information technology system failures, network disruptions and breaches in data security, which may materially adversely affect our operations, financial condition and operating results. We depend on information technology as an enabler to improve the effectiveness of our operations and to interface with our customers, as well as to maintain financial accuracy and efficiency. Information technology system failures could disrupt our operations by causing transaction errors, processing inefficiencies, delays or cancellation of customer orders, the loss of customers, impediments to the manufacture or shipment of products, other business disruptions, or the loss of or damage to intellectual property through security breach.
In addition, we have outsourced certain information technology support services and administrative functions, such as payroll processing and benefit plan administration, to third-party service providers and may outsource other functions in the future to achieve cost savings and efficiencies. If the service providers to which we outsource these functions do not perform effectively, we may not be able to achieve the expected cost savings and may have to incur additional costs to correct errors made by such service providers. Depending on the function involved, such errors may also lead to business disruption, processing inefficiencies or the loss of or damage to intellectual property through security breach, or harm employee morale.
Our information systems could also be penetrated by outside parties intent on extracting information, corrupting information or disrupting business processes. Such unauthorized access could disrupt our business and could result in the loss of assets.
A deterioration in labor relations could adversely impact our global business. As of December 31, 2011, we had approximately 68,000 employees. Of those employees, various labor unions with separate collective bargaining agreements represent approximately 59%. Our current collective bargaining agreements generally have three year terms. Due to the large number of collective bargaining agreements, we are periodically in negotiations with certain of the unions representing our employees. We may be subject to employee work stoppages that, if such events were to occur, may have a material adverse effect on our business, financial condition, or results of operations. Further, we cannot be assured that we will be able to renew collective bargaining agreements on the same or similar terms, or at all, which may also have a material adverse effect on our business, financial condition, or results of operations.
Our ability to attract, develop and retain executives and other qualified employees is crucial to our results of operations and future growth. We depend upon the continued services and performance of our key executives, senior management and skilled personnel, particularly our professionals with experience in our business and operations and the home appliance industry.

10
We cannot be sure that any of these individuals will continue to be employed by us. A lengthy period of time is required to hire and develop replacement personnel when skilled personnel depart Whirlpool. An inability to hire, develop and retain a sufficient number of qualified employees could materially hinder our business by, for example, delaying our ability to bring new products to market or impairing the success of our operations.
Changes in the legal and regulatory environment could limit our business activities, increase our operating costs, reduce demand for our products or result in litigation. The conduct of our businesses, and the production, distribution, sale, advertising, safety, transportation and use of many of our products, are subject to various laws and regulations administered by federal, state and local governmental agencies in the United States, as well as to foreign laws and regulations administered by government entities and agencies in markets in which we operate. These laws and regulations may change, sometimes dramatically, as a result of political, economic or social events. Changes in laws, regulations or governmental policy and the related interpretations may alter the environment in which we do business and, therefore, may impact our results or increase our costs or liabilities. In addition, we incur and will continue to incur capital and other expenditures to comply with various laws and regulations, especially relating to, protection of the environment, human health and safety and energy efficiency. These types of costs could adversely affect our financial performance. Additionally, we could be subjected to future liabilities, fines or penalties or the suspension of product production for failing to comply with various laws and regulations, including environmental regulations. Cleanup obligations that might arise at any of our manufacturing sites or the imposition of more stringent environmental laws in the future could adversely affect us.
Foreign currency fluctuations may affect our financial performance. We generate a significant portion of our revenue and incur a significant portion of our expenses in currencies other than the U.S. dollar. Changes in the exchange rates of functional currencies of those operations affect the U.S. dollar value of our revenue and earnings from our foreign operations. We use currency forwards and options to manage our foreign currency transaction exposures. We cannot completely eliminate our exposure to foreign currency fluctuations, which may adversely affect our financial performance. In addition, because our consolidated financial results are reported in dollars, if we generate sales or earnings in other currencies, the translation of those results into dollars can result in a significant increase or decrease in the amount of those sales or earnings. Finally, the amount of legal contingencies related to foreign operations may fluctuate significantly based upon changes in the exchange rates and usually cannot be managed with currency forwards, options or other arrangements. Such fluctuations in exchange rates can significantly increase or decrease the amount of any legal contingency related to our foreign operations and make it difficult to assess and manage the potential exposure.
ITEM 1B. UNRESOLVED STAFF COMMENTS.
None.

11
ITEM 2. PROPERTIES.
Our principal executive offices are located in Benton Harbor, Michigan. On December 31, 2011, our principal manufacturing operations were carried on at 35 locations in 12 countries worldwide. We occupied a total of approximately 67 million square feet devoted to manufacturing, service, sales and administrative offices, warehouse and distribution space. Over 36 million square feet of such space is occupied under lease. Whirlpool properties include facilities which are suitable and adequate for the manufacture and distribution of Whirlpool’s products. The company’s major production sites by operating segment are as follows:
North America:United States:
Mexico:
Latin America:Brazil:China:Italy:Slovakia:
Europe, Middle East and Africa:Germany:France:Italy:Poland:Slovakia:Sweden:South Africa:
Asia:China:India:
Fort Smith, Arkansas; Amana, Iowa; Tulsa, OklahomaGreenville, Clyde, Findlay, Marion and Ottawa, Ohio;Cleveland, TennesseeCelaya; Monterrey; Ramos Arizpe
Itaiopolis; Joinville; Manaus; Rio ClaroBeijingRiva di ChieriSpisska Nova Ves
Neunkirchen; SchorndorfAmiensTrento; Cassinetta; Siena; NaplesWroclawPopradNorrkopingIsithebe
ChangXing (Joint Venture); ShundeFaridabad; Pune; Pondicherry
ITEM 3. LEGAL PROCEEDINGS.
Information regarding legal proceedings can be found in Note 6 to the Consolidated Financial Statements and is incorporated herein by reference.
ITEM 4. MINE SAFETY DISCLOSURES.
Not applicable.

12
PART IIITEM 5.AND ISSUER PURCHASES OF EQUITY SECURITIES.
MARKET FOR REGISTRANT’S COMMON EQUITY, RELATED STOCKHOLDER MATTERS
Whirlpool’s common stock is traded on the New York Stock Exchange and the Chicago Stock Exchange. As of February 8, 2012, the number of holders of record of Whirlpool common stock was approximately 13,474.
Quarterly market and dividend information can be found in Note 14 to the Consolidated Financial Statements.
On April 23, 2008, our Board of Directors authorized a new share repurchase program of up to $500 million. Share repurchases are made from time to time on the open market as conditions warrant. There have been no repurchases since 2008. At December 31, 2011, there were $350 million remaining authorized under this program.
ITEM 6. SELECTED FINANCIAL DATA.
See “Five Year Selected Financial Data” in the Financial Supplement to this report.
ITEM 7.OF OPERATIONS.
MANAGEMENT’S DISCUSSION AND ANALYSIS OF FINANCIAL CONDITION AND RESULTS
See “Management’s Discussion and Analysis of Financial Condition and Results of Operations” in the Financial Supplement to this report.
ITEM 7A. QUANTITATIVE AND QUALITATIVE DISCLOSURES ABOUT MARKET RISK.
See “Market Risk” in “Management’s Discussion and Analysis of Financial Condition and Results of Operations” in the Financial Supplement to this report.
ITEM 8. FINANCIAL STATEMENTS AND SUPPLEMENTARY DATA.
Whirlpool’s Consolidated Financial Statements are included in the Financial Supplement to this report. Supplementary financial information regarding quarterly results of operations (unaudited) for 2011 and 2010 can be found in Note 14 to the Consolidated Financial Statements. For a list of financial statements and schedules filed as part of this report, see the Table of Contents to the Financial Supplement to this report on page F-1.
ITEM 9.FINANCIAL DISCLOSURE.
CHANGES IN AND DISAGREEMENTS WITH ACCOUNTANTS ON ACCOUNTING AND
None.
ITEM 9A. CONTROLS AND PROCEDURES.
Disclosure controls and procedures. Whirlpool maintains disclosure controls and procedures (as defined in Rule 13a-15(e) of the Securities Exchange Act of 1934) that are designed to provide reasonable assurance that information required to be disclosed in our filings under the Securities Exchange Act is recorded, processed, summarized, and reported within the periods specified in the rules and forms of the Securities and Exchange Commission and that such information is accumulated and communicated to Whirlpool’s management, including its Chief Executive Officer and Chief Financial Officer, as appropriate, to allow timely decisions regarding required disclosure.
Prior to filing this report, we completed an evaluation under the supervision and with the participation of Whirlpool management, including the Chief Executive Officer and Chief Financial Officer, of the effectiveness of the design and operation of our disclosure controls and procedures as of December 31, 2011. Based on this evaluation, the Chief Executive Officer and Chief Financial Officer concluded that our disclosure controls and procedures were effective at the reasonable assurance level as of December 31, 2011.
Management’s annual report on internal control over financial reporting. Pursuant to Section 404 of the Sarbanes-Oxley Act of 2002 and the rules and regulations adopted pursuant thereto, we included a report of management’s assessment of the effectiveness of its internal control over financial reporting as part of this report. Management’s report is included in the

13
Consolidated Financial Statements contained in the Financial Supplement to this report under the caption entitled “Management’s Report on Internal Control Over Financial Reporting” and is incorporated herein by reference.
Our internal control over financial reporting as of December 31, 2011 has been audited by Ernst & Young LLP, an independent registered public accounting firm, as stated in their report which is included in the Consolidated Financial Statements contained in the Financial Supplement to this report under the caption entitled “Report of Independent Registered Public Accounting Firm” and is incorporated herein by reference.
There were no changes in our internal control over financial reporting that occurred during the fourth quarter that have materially affected, or are reasonably likely to materially affect, our internal control over financial reporting.
ITEM 9B. OTHER INFORMATION.
There was no information required to be disclosed in a report on Form 8-K during the fourth quarter that was not previously reported.
PART IIIITEM 10. DIRECTORS, EXECUTIVE OFFICERS AND CORPORATE GOVERNANCE.
Information regarding our executive officers is included in ITEM 1 of PART I of this report.
Information regarding the background of the directors, matters related to the Audit Committee, and Section 16(a) compliance can be found under the captions “Directors and Nominees for Election as Directors,” “Board of Directors and Corporate Governance- Audit Committee,” and “Section 16(a) Beneficial Ownership Reporting Compliance” in the Proxy Statement, which is incorporated herein by reference.
There have been no material changes to the procedures through which stockholders may recommend nominees to our Board of Directors since February 28, 2011, which is the date of our last proxy statement.
We have adopted a code of ethics that applies to all of our employees, officers and directors, including our principal executive officer, principal financial officer and principal accounting officer. The text of our code of ethics is posted on our website: www.whirlpoolcorp.com—scroll over the “Responsibility” dropdown menu and click on “Code of Ethics.” Whirlpool intends to disclose future amendments to, or waivers from, certain provisions of the code of ethics for executive officers and directors on the website within four business days following the date of such amendment or waiver. Stockholders may request a free copy of the code of ethics from:
Joe LovechioInvestor Relations
Whirlpool Corporation2000 North M-63Mail Drop 2800
Benton Harbor, MI 49022-2692Telephone: (269) 923-3487
Whirlpool has also adopted Corporate Governance Guidelines and written charters for its Audit, Finance, Human Resources and Corporate Governance and Nominating Committees, all of which are posted on our website: www.whirlpoolcorp.com—scroll over the “Responsibility” dropdown menu and then over “Governance” and then click on “Board of Directors.” Stockholders may request a free copy of the charters and guidelines from the address or telephone number set forth above.
ITEM 11. EXECUTIVE COMPENSATION.
Information regarding compensation of our executive officers and directors can be found under the captions “Nonemployee Director Compensation,” “Compensation Discussion and Analysis,” “Executive Compensation Tables,” and “Human Resources Committee Interlocks and Insider Participation” in the Proxy Statement, which is incorporated herein by reference. See also the information under the caption “Human Resources Committee Report” in the Proxy Statement, which is incorporated herein by reference; however, such information is only “furnished” hereunder and not deemed “soliciting material” or “filed” with the Securities and Exchange Commission or subject to Regulation 14A or 14C or to the liabilities of Section 18 of the Securities Exchange Act of 1934.

14
ITEM 12.RELATED STOCKHOLDER MATTERS.
SECURITY OWNERSHIP OF CERTAIN BENEFICIAL OWNERS AND MANAGEMENT AND
Information regarding the security ownership of any person that we know to beneficially own more than 5% of Whirlpool stock and by each Whirlpool director, each Whirlpool named executive officer, and all directors and executive officers as a group, can be found under the captions “Security Ownership” and “Beneficial Ownership” in the Proxy Statement, which is incorporated herein by reference. Information relating to securities authorized under equity compensation plans can be found under the caption “Equity Compensation Plan Information” in the Proxy Statement, which is incorporated herein by reference.
ITEM 13.INDEPENDENCE.
CERTAIN RELATIONSHIPS AND RELATED TRANSACTIONS, AND DIRECTOR
Information regarding certain relationships and related transactions (if any) and the independence of Whirlpool’s directors, can be found under the captions “Related Person Transactions” and “Board of Directors and Corporate Governance—Director Independence” in the Proxy Statement, which is incorporated herein by reference.
ITEM 14. PRINCIPAL ACCOUNTING FEES AND SERVICES.
Information regarding our auditors and the Audit Committee’s pre-approval policies can be found under the caption “Matters Relating to Independent Registered Public Accounting Firm” in the Proxy Statement, which is incorporated herein by reference.
PART IVITEM 15. EXHIBITS, FINANCIAL STATEMENT SCHEDULES.
(a) The following documents are filed as a part of this report:
1. The financial statements and related notes, and reports of management and the independent registered public accounting firm, listed in the Table of Contents to the Financial Supplement to this report. Individual financial statements of the registrant’s affiliated foreign companies, accounted for by the equity method, have been omitted since no such company individually constitutes a significant subsidiary.
2. “Schedule II—Valuation and Qualifying Accounts” is contained in the Financial Supplement to this report. Certain schedules for which provisions are made in the applicable accounting regulations of the Securities and Exchange Commission are not required under the related instructions or are inapplicable, and therefore have been omitted.
(b) The exhibits listed in the “Exhibit Index” attached to this report.

15
SIGNATURES
Pursuant to the requirements of Section 13 or 15(d) of the Securities Exchange Act of 1934, the registrant has duly caused this report to be signed on its behalf by the undersigned, thereunto duly authorized.
WHIRLPOOL CORPORATION(Registrant)By:
/S/ Larry M. VenturelliLarry M. Venturelli
Executive Vice Presidentand Chief Financial Officer
February 22, 2012
Pursuant to the requirements of the Securities Exchange Act of 1934, this report has been signed below by the following persons on behalf of the registrant and in the capacities and on the date indicated.
Signature
/S/ JEFF M. FETTIGJeff M. Fettig
/S/ MICHAEL A. TODMANMichael A. Todman
/S/ LARRY M. VENTURELLILarry M. Venturelli
SAMUEL R. ALLEN*Samuel R. Allen
GARY T. DICAMILLO*Gary T. DiCamillo
KATHLEEN J. HEMPEL*Kathleen J. Hempel
MICHAEL F. JOHNSTON*Michael F. Johnston
WILLIAM T. KERR*William T. Kerr
JOHN D. LIU*John D. Liu
HARISH MANWANI*Harish Manwani
MILES L. MARSH*Miles L. Marsh
Title
Director, Chairman of the Board and ChiefExecutive Officer(Principal Executive Officer)
Director and President, WhirlpoolInternational
Executive Vice President and ChiefFinancial Officer(Principal Financial Officer and Principal Accounting Officer)
Director
Director
Director
Director
Director
Director
Director
Director
WILLIAM D. PEREZ*William D. Perez
MICHAEL D. WHITE*Michael D. White
Director
Director
*By:
/S/ KIRSTEN J. HEWITTKirsten J. Hewitt
Attorney-in-Fact
February 22, 2012

F-1
WHIRLPOOL CORPORATION
Financial Supplement to2011 Annual Report on Form 10-K
and 2012 Proxy Statement
TABLE OF CONTENTS
Five-Year Selected Financial Data
Management’s Discussion and Analysis of Financial Condition and Results of Operations
Consolidated Statements of Income
Consolidated Balance Sheets
Consolidated Statements of Cash Flows
Consolidated Statements of Changes in Stockholders’ Equity
Notes to the Consolidated Financial Statements
Report by Management on the Consolidated Financial Statements
Management’s Report on Internal Control Over Financial Reporting
Report of Independent Registered Public Accounting Firm
Report of Independent Registered Public Accounting Firm on Internal Control Over Financial Reporting
Schedule II—Valuation and Qualifying Accounts
F-2
F-3
F-19
F-20
F-21
F-22
F-23
F-49
F-50
F-51
F-52
F-53

F-2
FIVE-YEAR SELECTED FINANCIAL DATA
(Millions of dollars, except share and employee data)CONSOLIDATED OPERATIONSNet salesRestructuring costsDepreciation and amortization(1)
Operating profitEarnings (loss) from continuing operations before incometaxes and other itemsNet earnings from continuing operationsLoss from discontinued operations(2)
Net earnings available to WhirlpoolCapital expendituresDividendsCONSOLIDATED FINANCIAL POSITIONCurrent assetsCurrent liabilitiesAccounts receivable, inventories and accounts payable, netProperty, netTotal assetsLong-term debtTotal debtWhirlpool stockholders’ equityPER SHARE DATABasic net earnings from continuing operationsDiluted net earnings from continuing operationsDiluted net earningsDividendsBook value(3)
Closing Stock Price—NYSEKEY RATIOSOperating profit marginPre-tax margin(4)
Net margin(5)
Return on average Whirlpool stockholders’ equity(6)
Return on average total assets(7)
Current assets to current liabilitiesTotal debt as a percent of invested capital(8)
Price earnings ratio (9)
OTHER DATACommon shares outstanding (in thousands):Average number—on a diluted basisYear-end common shares outstandingYear-end number of stockholdersYear-end number of employeesFive-year annualized total return to stockholders(10)
2011 $ 18,666
136558792
(28)408—
390608148
$ 6,422
6,297947
3,10215,1812,1292,4914,181
$ 5.07
4.994.991.93
53.5047.45
4.2 %
(0.2)%2.1 %9.3 %2.5 %1.0
36.8 %9.5
78,14376,45113,52768,231
(8.1)%
2010 $ 18,366
74555
1,008
586650—
619593132
$ 7,315
6,1491,4103,134
15,5842,1952,5094,226
$ 8.12
7.977.971.72
54.4888.83
5.5%3.2%3.4%
15.7%4.0%1.2
36.7%11.2
77,62876,03014,08070,758
3.8%
2009 $ 17,099
126525688
293354—
328541128
$ 7,025
5,9411,3893,117
15,0942,5022,9033,664
$ 4.39
4.344.341.72
48.4880.66
4.0%1.7%1.9%9.8%2.3%1.2
43.6%18.6
75,58474,70414,93066,884
5.8%
2008 $ 18,907
149597549
246447—
418547128
$ 6,044
5,5631,8892,985
13,5322,0022,5973,006
$ 5.57
5.505.501.72
39.5441.35
2.9 %1.3 %2.2 %
10.7 %3.0 %1.1
46.0 %7.5
76,01973,53614,51569,612
(8.5)%
2007 $ 19,408
61593
1,063
804669
(7)640536134
$ 6,555
5,8932,0093,212
14,0091,6682,0933,911
$ 8.24
8.108.011.72
48.9681.63
5.5%4.1%3.3%
18.1%4.6%1.1
34.5%10.2
79,88075,83515,01173,682
11.8%
(1) Depreciation method changed prospectively from a straight-line method to a modified units of production method in 2009. (2) Our earnings from continuing operations exclude certain dispositions adjacent to the Maytag acquisition.(3) Total Whirlpool stockholders’ equity divided by average number of shares on a diluted basis.(4) Earnings (loss) from continuing operations before income taxes and other items, as a percent of net sales.(5) Net earnings available to Whirlpool, as a percent of net sales.(6) Net earnings available to Whirlpool, divided by average Whirlpool stockholders’ equity.(7) Net earnings available to Whirlpool, divided by average total assets.(8) Total debt divided by total debt and total stockholders’ equity.(9) Closing stock price divided by diluted net earnings available to Whirlpool.(10) Stock appreciation plus reinvested dividends, divided by share price at the beginning of the period.

F-3
MANAGEMENT'S DISCUSSION AND ANALYSIS OF FINANCIAL CONDITIONAND RESULTS OF OPERATIONS
This Management Discussion and Analysis should be read in connection with the Consolidated Financial Statements, Notes to the Consolidated Financial Statements and Selected Financial Data included in this Form 10-K. Certain references to particular information in the Notes to the Consolidated Financial Statements are made to assist readers.
ABOUT WHIRLPOOL
Whirlpool Corporation (“Whirlpool”) is the world’s leading manufacturer of major home appliances with revenues of approximately $19 billion and net earnings available to Whirlpool of $390 million in 2011. We are a leading producer of major home appliances in North America and Latin America and have a significant presence in markets throughout Europe and India. We have received worldwide recognition for accomplishments in a variety of business and social efforts, including leadership, diversity, innovative product design, business ethics, social responsibility and community involvement. We conduct our business through four reportable segments, which we define based on geography. Our reportable segments consist of North America, Latin America, EMEA and Asia. Our customer base includes large, sophisticated trade customers who have many choices and demand competitive products, services and prices. The charts below summarize the balance of net sales by reportable segment for 2011, 2010 and 2009, respectively:
We monitor country-specific economic factors such as gross domestic product, unemployment, consumer confidence, retail trends, housing starts and completions, sales of existing homes and mortgage interest rates as key indicators of industry demand. In addition to profitability, we also focus on country, brand, product and channel sales when assessing and forecasting financial results.
Our leading portfolio of brands includes: Whirlpool, Maytag, KitchenAid, Brastemp and Consul, each of which have annual revenues in excess of $1 billion. Our global branded consumer products strategy is to introduce innovative new products, increase brand customer loyalty, expand our presence in foreign markets, enhance our trade management platform, improve total cost and quality by expanding and leveraging our global operating platform and, where appropriate, make strategic acquisitions and investments.
As we grow revenues in our core products, our strategy is to extend our business by offering products and services that are dependent on and related to our core business and expand into adjacent products, such as Gladiator GarageWorks, through stand-alone businesses that leverage our core competencies and business infrastructure.
2011 OVERVIEW
Whirlpool and the home appliance industry as a whole continued to face significant macroeconomic challenges across much of the world in 2011, including recessionary demand levels in developed countries, a slowdown in emerging markets, high levels of inflation in material costs and volatility in foreign currencies. To be successful in this period of uncertain economic growth and consumer demand, we have taken aggressive actions to expand our operating margins and improve our earnings. These actions include implementation of our previously announced cost-based price increases, continued investment in new product innovation, execution of announced cost and capacity reductions, continued productivity improvements and legal actions taken to promote fair trade within the industry.
During 2011, we settled a long-standing collection dispute with Banco Safra S.A. and an antitrust investigation by the European Commission into the refrigeration compressor industry. While these settlements negatively impacted our 2011 results, they have removed significant uncertainty and financial risk by bringing closure to these items.

MANAGEMENT'S DISCUSSION AND ANALYSIS OF FINANCIAL CONDITION ANDRESULTS OF OPERATIONS - (CONTINUED)
F-4
Whirlpool’s ongoing focus on cost reductions, productivity improvements and investment in innovative new products continue to enable Whirlpool to adapt to changes in the macroeconomic environment and maintain our position as the global number one home appliance maker.
RESULTS OF OPERATIONS
The following table summarizes the consolidated results of operations:
Consolidated
Net salesGross marginSelling, general and administrativeRestructuring costsInterest and sundry income (expense)Interest expenseIncome tax benefitNet earnings available to WhirlpoolDiluted net earnings available to Whirlpool per share
December 31,
2011
$ 18,6662,5771,621
136(607)(213)(436)390
$ 4.99
Change
1.6 %(5.0)1.0nmnm
(5.4)nm
(37.0)(37.5)%
2010
$ 18,3662,7141,604
74(197)(225)(64)619
$ 7.97
Change
7.4%13.7
3.7nm
10.72.74.9
88.783.6%
2009
$ 17,0992,3861,544
126(176)(219)(61)328
$ 4.34 nm: not meaningful
Consolidated Net Sales
The following tables summarize units sold and consolidated net sales by region:
In thousands
Units SoldNorth AmericaLatin AmericaEMEAAsiaConsolidated
December 31,
2011
25,57511,83012,334
4,01453,753
Change
(2.0)%1.4
(0.1)0.5
(0.6)%
2010
26,09511,66112,351
3,99654,103
Change
5.9%16.14.7
22.48.8%
2009
24,63110,04711,7983,264
49,740
Millions of dollars
Consolidated Net SalesNorth AmericaLatin AmericaEMEAAsiaOther/eliminationsConsolidated
December 31,
2011
$ 9,5825,0623,305
881(164)
$ 18,666
Change
(2.1)%7.82.43.1—1.6 %
2010
$ 9,7844,6943,227
855(194)
$ 18,366
Change
2.0%26.7(3.3)30.6
—7.4%
2009
$ 9,5923,7053,338
654(190)
$17,099
Consolidated net sales increased 1.6% compared to 2010 primarily due to the favorable impact of foreign currency and higher BEFIEX credits recognized, partially offset by lower unit shipments. Excluding the impact of foreign currency, consolidated net sales decreased 0.4% compared to 2010. Consolidated net sales for 2010 increased 7.4% compared to 2009 primarily due to higher unit shipments, higher BEFIEX credits recognized and the favorable impact of foreign currency, partially offset by unfavorable product price/mix. Excluding the impact of foreign currency, consolidated net sales for 2010 increased 5.3% compared to 2009.
Significant regional trends were as follows:
• North America net sales decreased 2.1% compared to 2010 primarily due to a 2.0% decrease in units sold. Improvements in product price/mix were experienced during the second half of 2011 as we began to realize the effects of pricing actions taken earlier in the year. However, for the full year, net sales were slightly unfavorable to 2010 as a result of product price/mix. Foreign currency did not have a significant impact on North America net sales in 2011. North America net sales for 2010 increased 2.0% compared to 2009 primarily due to a 5.9% increase in

MANAGEMENT'S DISCUSSION AND ANALYSIS OF FINANCIAL CONDITION ANDRESULTS OF OPERATIONS - (CONTINUED)
F-5
units sold. The increase in units sold was driven by strong industry growth in the first half which slowed significantly in the second half primarily in the United States. In addition, net sales were negatively impacted by unfavorable product price/mix, including pricing actions during the second half of 2010 taken to match aggressive competitive pricing pressure, partially offset by the favorable impact of foreign currency. Excluding the impact of foreign currency, North America net sales increased 0.7% in 2010.
• Latin America net sales increased 7.8% compared to 2010 primarily due to the favorable impact of foreign currency, improved product price/mix, higher BEFIEX credits recognized and a 1.4% increase in units sold. Excluding the impact of foreign currency and higher BEFIEX credits, Latin America net sales increased 3.0% in 2011. Latin America net sales for 2010 increased 26.7% compared to 2009 primarily due to a 16.1% increase in units sold. The increase in units sold was driven by strong industry growth in the first half which moderated somewhat in the second half of the year. In addition, net sales increased due to the favorable impact of foreign currency and higher BEFIEX credits recognized, partially offset by unfavorable product price/mix. Excluding the impact of foreign currency and higher BEFIEX credits, Latin America net sales increased 13.7% in 2010.
In previous years, our Brazilian operations earned tax credits under the Brazilian government’s export incentive program (BEFIEX). These credits reduce Brazilian federal excise taxes on domestic sales, resulting in an increase in the operations’ recorded net sales. After a favorable court decision in 2005, upheld by a December 2011 appellate court decision, we were able to recognize approximately $266 million, $225 million, and $69 million of export credits during 2011, 2010 and 2009, respectively. Export credits recognized are not subject to income taxes. We recognize export credits as they are monetized; however, future actions by the Brazilian government could limit our ability to monetize these export credits. The Brazilian government announced an Impostos sobre Produtos ("IPI") sales tax holiday on appliances in December 2011, which expires on March 31, 2012. During this holiday, we expect to monetize reduced amounts of export credits because the export credits are monetized through the offset of IPI taxes due. As of December 31, 2011, approximately $238 million of future cash monetization remained, including $60 million of related court awarded fees, which will be payable in subsequent years. A Brazilian law change to the inflation index tables reduced available cash monetization by $62 million in 2011.
• EMEA net sales increased 2.4% compared to 2010, primarily due to the favorable impact of foreign currency, partially offset by unfavorable product price/mix. Excluding the impact of foreign currency, net sales decreased 3.1%. EMEA net sales for 2010 decreased 3.3% compared to 2009, primarily due to the unfavorable impact of foreign currency and unfavorable product price/mix driven by an increasingly competitive pricing environment, partially offset by a 4.7% increase in units sold due to higher industry demand which accelerated during the second half of 2010. Excluding the impact of foreign currency, net sales increased 0.7% in 2010.
• Asia net sales increased 3.1% compared to 2010 primarily due to improved product price/mix, the favorable impact of foreign currency and a 0.5% increase in units sold. Excluding the impact of foreign currency, Asia net sales increased 2.3%. Asia net sales for 2010 increased 30.6%, led by results in India and China, compared to 2009 primarily due to a 22.4% increase in units sold. Excluding the impact of foreign currency, Asia net sales increased 23.8% in 2010.
Gross Margin
The table below summarizes gross margin percentages by region:
Percentage of net sales
North AmericaLatin AmericaEMEAAsiaConsolidated
December 31,2011
11.320.010.116.513.8
%
%
Change
(0.5)(1.2)(3.0)(0.7)(1.0)
pts
pts
2010
11.821.213.117.214.8
%
%
Change
(1.1)4.01.6
(2.1)0.8
pts
pts
2009
12.917.211.519.314.0
%
%
The consolidated gross margin percentage decreased 1.0 points to 13.8% compared to 2010, primarily due to material cost increases, partially offset by productivity improvements and higher BEFIEX credits recognized. In addition, gross margin benefited from the net impacts of a supplier recovery payment received in 2011, charges related to a product recall in 2010 that did not recur in 2011, partially offset by lower curtailment gains in a postretirement healthcare plan during 2011.

MANAGEMENT'S DISCUSSION AND ANALYSIS OF FINANCIAL CONDITION ANDRESULTS OF OPERATIONS - (CONTINUED)
F-6
Significant regional trends were as follows:
• North America gross margin decreased compared to 2010 primarily due to significant increases in material costs, partially offset by continued productivity improvements and the favorable impact from product price/mix. Gross margin also reflects the favorable impact from $78 million in lower product recall charges and a $61 million supplier recovery payment received in 2011, partially offset by $50 million in higher LIFO adjustments and $27 million in lower postretirement curtailment gains. North America gross margin for 2010 decreased compared to 2009 primarily due to unfavorable product price/mix, higher material costs, $43 million in higher product recall charges, a $45 million variance in LIFO adjustments compared to 2009 and $18 million in lower postretirement curtailment gains. These items were partially offset by continued cost reductions, improved productivity and higher volumes.
• Latin America gross margin decreased compared to 2010 primarily due to higher material costs and the unfavorable impact of foreign currency, partially offset by cost reductions and $41 million in higher BEFIEX credits recognized. During 2010, Latin America gross margin increased compared to 2009 primarily due to $156 million higher BEFIEX credits recognized, cost reductions and improved productivity, partially offset by unfavorable product price/mix.
• EMEA gross margin decreased compared to 2010 primarily due to higher material costs and the unfavorable impact of product price/mix, partially offset by cost reductions and improved productivity. During 2010, EMEA gross margin increased compared to 2009 primarily due to cost reductions and improved productivity, partially offset by unfavorable product price/mix.
• Asia gross margin decreased compared to 2010 primarily due to higher material costs, partially offset by productivity improvements and cost reductions, improved product price/mix and the favorable impact of foreign currency. Asia gross margin during 2010 decreased compared to 2009 primarily due to higher material and oil-related costs and unfavorable product price/mix, partially offset by the favorable impact of foreign currency.
Selling, General and Administrative
The following table summarizes selling, general and administrative expenses as a percentage of sales by region:
Millions of dollars
North AmericaLatin AmericaEMEAAsiaCorporate/otherConsolidated
December 31,
2011
$ 658370333115145
$ 1,621
As a %of Net Sales
6.9%7.3
10.113.1
—8.7%
2010
$ 662329320114179
$ 1,604
As a %of Net Sales
6.8%7.09.9
13.3—8.7%
2009
$ 65327536297
157$ 1,544
As a %of Net Sales
6.8%7.4
10.814.8
—9.0%
Selling, general and administrative expenses remained flat compared to 2010, with unfavorable foreign currency and increased brand investments offset by lower employee incentive compensation. Selling, general and administrative expenses as a percent of consolidated net sales in 2010 decreased compared to 2009, primarily due to favorable leverage on increased net sales. Selling, general and administrative expenses in 2010 increased approximately $54 million compared to 2009 in Latin America, primarily due to the unfavorable impact of foreign currency and higher infrastructure spending to support higher sales volumes.
Research and Development Costs
Research and development costs increased $46 million or 8.6% compared to 2010 to $578 million or 3.1% of consolidated net sales. In 2010, research and development costs increased $32 million or 6.4% compared to 2009 to $532 million or 2.9% of consolidated net sales. The increases in 2011 and 2010 were primarily due to increased product innovation spending.
Restructuring
During the fourth quarter 2011, the Company committed to restructuring plans (the "2011 Plan") that will result in substantial cost and capacity reductions. Including previously announced restructuring initiatives, we expect to incur approximately $500 million of total costs beginning in the fourth quarter 2011 with completion expected by the end of 2013.
We expect to incur approximately $405 million of future cash expenditures related to the 2011 Plan. We incurred total

MANAGEMENT'S DISCUSSION AND ANALYSIS OF FINANCIAL CONDITION ANDRESULTS OF OPERATIONS - (CONTINUED)
F-7
restructuring charges of $136 million, $74 million and $126 million during the years ended December 31, 2011, 2010 and 2009, respectively. Additional information about restructuring activities can be found in Note 10 of the Notes to the Consolidated Financial Statements.
Interest and Sundry Income (Expense)
Interest and sundry expense increased $410 million compared to 2010 to $607 million, primarily driven by charges related to the settlement of the Brazilian collection dispute and Embraco antitrust matters of $528 million in 2011 compared to $146 million in 2010. In addition, 2011 reflects the unfavorable impact of foreign currency. During 2010, interest and sundry expense increased $22 million compared to 2009 to $197 million, primarily due to higher charges relating to the Embraco antitrust matters of approximately $40 million, partially offset by the favorable impacts of foreign currency and higher interest income.
For additional information about the Brazilian collection dispute and Embraco antitrust matters, see Note 6 of the Notes to the Consolidated Financial Statements.
Interest Expense
Interest expense decreased $12 million compared to 2010 to $213 million, primarily due to lower interest rates, partially offset by higher average monthly debt levels. During 2010, interest expense increased compared to 2009, as 2009 benefited from an $8 million reduction in accrued interest as a result of an operating tax settlement. In addition, 2010 included higher amortization of debt issuance costs, partially offset by a reduction in interest expense due to lower average debt levels and interest rates.
Income Taxes
The income tax benefit was $436 million, $64 million, and $61 million in 2011, 2010 and 2009, respectively. The increase in tax benefit in 2011 compared to 2010 and 2009 is primarily due to a reduction in pre-tax earnings, higher energy tax credits generated in the United States from the production of certain eligible energy efficient appliances and higher non-taxable BEFIEX credits recognized in Brazil. For additional information about our consolidated tax provision, see Note 11 of the Notes to the Consolidated Financial Statements.
The following table summarizes the difference between income tax expense at the United States statutory rate of 35% and the income tax benefit at effective worldwide tax rates for the respective periods:
Millions of dollars
Earnings (loss) before income taxes and other itemsUnited StatesForeign
Earnings (loss) before income taxes and other itemsIncome tax computed at United States statutory rate
U.S. government tax incentives, including Energy Tax CreditsForeign government tax incentives, including BEFIEXForeign tax rate differentialU.S. foreign tax creditsValuation allowancesDeductible interest on capitalState and local taxes, net of federal tax benefitMedicare Part D subsidyForeign withholding taxesNon-deductible government settlementsU.S. tax on foreign dividends and subpart F incomeSettlement of global tax auditsOther items, net
Income tax computed at effective worldwide tax rates
2011
$ (240)212(28)(10)
(379)(100)(13)(37)11—(4)—1030261020
$ (436)
2010
$ (256)842586205
(230)(103)(46)(28)(9)(7)(2)—123349566
$ (64)
2009
$ (110)403293103
(125)(44)(31)(19)10
(15)1
1215—1022—
$ (61)

MANAGEMENT'S DISCUSSION AND ANALYSIS OF FINANCIAL CONDITION ANDRESULTS OF OPERATIONS - (CONTINUED)
F-8
FORWARD-LOOKING PERSPECTIVE
We currently estimate earnings per diluted share, free cash flow and industry demand for 2012 to be within the following ranges:
Millions of dollars, except per share data
Estimated earnings per diluted share, for the year ending December 31, 2012
Free cash flow
Industry demand
Including:
Including:
North AmericaLatin AmericaEMEAAsia
BEFIEX ($60 to $80 million)Restructuring expense ($250 - $270 million)
Pension plan contributionsBrazilian Collection Dispute & Embraco Antitrust MattersRestructuring cash outlaysBEFIEX
Current Outlook$5.00
0.80(2.30)
$100
(250)(385)(279)
60
—%2%
(5%)2%
—
——
—
————
————
$5.50
1.00(2.50)
$150
(250)(385)(279)
80
3%5%
(2%)4%
The table below reconciles projected 2012 cash provided by operations determined in accordance with generally accepted accounting principles in the United States (GAAP) to free cash flow, a non-GAAP measure. Management believes that free cash flow provides stockholders with a relevant measure of liquidity and a useful basis for assessing Whirlpool’s ability to fund its activities and obligations. There are limitations to using non-GAAP financial measures, including the difficulty associated with comparing companies that use similarly named non-GAAP measures whose calculations may differ from our calculations. We define free cash flow as cash provided by continuing operations after capital expenditures and proceeds from the sale of assets/businesses.
These projections are based on many estimates and are inherently subject to change based on future decisions made by management and the Board of Directors of Whirlpool, and significant economic, competitive and other uncertainties and contingencies.
Millions of dollars
Cash provided by operating activitiesCapital expendituresProceeds from sale of assets/businessesFree cash flow
Current Outlook$ 600
(500)—
$ 100
————
$ 700(550)
—$ 150
FINANCIAL CONDITION AND LIQUIDITY
Our objective is to finance our business through operating cash flow and the appropriate mix of long-term and short-term debt. By diversifying the maturity structure, we avoid concentrations of debt, reducing liquidity risk. We have varying needs for short-term working capital financing as a result of the nature of our business. We regularly review our capital structure and liquidity priorities, which include funding the business through capital and engineering spending to support innovation and productivity initiatives, funding our pension plan and term debt liabilities, payment of legacy legal liabilities, return to shareholders and potential acquisitions in our core business and/or strategic adjacent business opportunities. These priorities are aligned with our goal to return our credit ratings to pre-recession levels.
We have continued to operate under uncertain and volatile global economic conditions for most of 2011, experiencing higher material costs, recessionary demand levels in developed markets and slowing growth in emerging markets. To succeed in this environment, we have announced aggressive actions to improve our overall operating performance and financial condition, including cost-based price increases across all markets and plans to reduce our cost structure and production capacity, primarily in North America and EMEA. Based on the actions taken and announced in 2011, we believe that operating cash flow, together

MANAGEMENT'S DISCUSSION AND ANALYSIS OF FINANCIAL CONDITION ANDRESULTS OF OPERATIONS - (CONTINUED)
F-9
with access to sufficient sources of liquidity, will be adequate to meet our ongoing requirements to fund our operations.
Our short term potential uses of liquidity include funding $350 million of term debt maturing in May 2012, $385 million related to the Brazillian collection dispute and Embraco antitrust matters, $279 million of restructuring activities and approximately $250 million in our United States and foreign pension plans. At December 31, 2011 and 2010 we had no borrowings outstanding under credit facilities. We were in compliance with financial covenant requirements at December 31, 2011 and 2010.
We monitor the credit ratings and market indicators of credit risk of our lending, depository, and derivative counterparty banks regularly. We diversify our deposits and investments in short term cash equivalents to limit the concentration of exposure by counterparty. The general financial instability in the stressed European countries could have a contagion effect on the region and contribute to the general instability and uncertainty in the European Union. At December 31, 2011, Belgium is the only European country that has cash and cash equivalents and third-party receivables exceeding 1% of our consolidated assets.
Sources and Uses of Cash
We met our cash needs for 2011 through cash flows from operations, cash and cash equivalents and financing arrangements. Our cash and equivalents were $1,109 million at December 31, 2011 compared to $1,368 million at December 31, 2010. The decrease in cash during 2011 is primarily due to a third quarter payment related to the settlement of the Brazilian collection dispute and contributions to our U.S. funded pension plans, offset by cash generated from operations.
Cash Flow Summary
Millions of dollars
Cash provided by (used in):Operating activitiesInvesting activitiesFinancing activitiesEffect of exchange rate changes on cash
Net increase (decrease) in cash and cash equivalents
2011
$ 530(596)(166)(27)
$ (259)
2010
$ 1,078(606)(495)
11$ (12)
2009
$ 1,550(499)14439
$ 1,234
Cash Flows from Operating Activities
The decrease in cash provided by operations during 2011 includes a $301 million payment related to the settlement of the Brazilian collection dispute, funding of our United States pension plans of $298 million and lower net earnings, partially offset by significant reductions in inventory. Cash provided by operating activities in 2010 decreased $472 million compared to 2009, primarily from required increases in inventory to support product availability and product transition, partially offset by higher net earnings and more favorable terms of collection of accounts receivable and of payment to suppliers. In addition, the significant slowing of sales growth in the second half of 2010 resulted in higher than normal inventory levels of approximately three days.
The timing of cash flows from operations varies significantly within a quarter primarily due to changes in production levels, sales patterns, promotional programs, funding requirements as well as receivable and payment terms. Dependent on timing of cash flows, the location of cash balances, as well as the liquidity requirements of each country, external sources of funding are used to support working capital requirements. Due to the variables discussed above, cash flow used in operations during the year was significantly in excess of our quarter-end balances.
During the first quarter of 2011, the European Parliament approved a directive that changes existing laws regarding supplier payment terms. The approved directive generally requires payment terms to be 30 days from the invoice date unless otherwise stated in the contract. An extension of up to 60 days is allowed if both parties agree to the terms. Countries within the European Union are required to adopt this directive within 2 years. We continue to monitor this situation as these changes, once adopted, could affect our cash flows to suppliers and from customers, since our payment terms to affected suppliers are generally longer than from affected customers.
We offer our suppliers access to third party payables processors. Independent of Whirlpool, the processors allow suppliers to sell their receivables to financial institutions at the discretion of only the supplier and the financial institution. We have no economic interest in the sale of these receivables and no direct financial relationship with the financial institutions concerning these services. All of our obligations, including amounts due, remain to our suppliers as stated in our supplier agreements. As of December 31, 2011 and 2010, approximately $952 million and $916 million, respectively, have been sold by suppliers to participating financial institutions.

MANAGEMENT'S DISCUSSION AND ANALYSIS OF FINANCIAL CONDITION ANDRESULTS OF OPERATIONS - (CONTINUED)
F-10
Cash Flows from Investing Activities
Cash used in investing activities of $596 million during 2011 was consistent with cash used in 2010 of $606 million. We continue to increase our capital spending to support new products and innovation. Cash used in investing activities in 2010 was $606 million, an increased outflow of $107 million compared to 2009. The increase in cash used in investing activities was primarily due to increased capital spending and lower proceeds from the sale of assets.
Cash Flows from Financing Activities
Cash used in financing activities during 2011 totaled $166 million compared to $495 million in 2010. The decrease in cash used during 2011 is primarily due to proceeds received from the $300 million bond offering in June 2011, which was used to repay $300 million of maturing debt. In 2010, $379 million of maturing debt was repaid from available cash. At December 31, 2011 and 2010, we had no commercial paper or credit facility borrowings outstanding.
Financing Arrangements
We have a $1.725 billion committed credit facility maturing on June 28, 2016 which includes a $200 million letter of credit sub-facility. Borrowings under the credit facility are available to us and designated subsidiaries for general corporate purposes, including commercial paper support. Subsidiary borrowings under this facility, if any, are guaranteed by Whirlpool Corporation. Interest under the credit facility accrues at a variable annual rate based on LIBOR plus a margin or the prime rate plus a margin. The margin is dependent on our credit rating at that time. The credit facility requires us to meet certain leverage and interest coverage requirements. We will incur a commitment fee based on Whirlpool's credit rating for any unused portion of the credit facility. At December 31, 2011 and 2010, we had no borrowings outstanding under this credit agreement and are in compliance with financial covenant requirements.
In December 2011 we obtained a committed credit facility in Brazil. The credit facility provides borrowings up to 700 million Brazilian reais (approximately $373 million as of December 31, 2011), with certain restrictions on the amount available for each draw. The credit facility contains no financial covenants. As of December 31, 2011 we had no borrowings outstanding under this credit agreement.
In 2011, we completed a debt offering comprised of $300 million aggregate principal amount of 4.85% notes due June 15, 2021. Proceeds from the issuance were used to repay $300 million in term debt that matured in June 2011. The notes contain customary covenants that limit our ability to incur certain liens or enter into certain sale and lease-back transactions. In addition, if we experience a specific kind of change of control, we are required to make an offer to purchase all of the notes at a purchase price of 101% of the principal amount thereof, plus accrued and unpaid interest.
For additional information about our financing arrangements, see Note 5 of the Notes to the Consolidated Financial Statements.
CONTRACTUAL OBLIGATIONS AND FORWARD-LOOKING CASH REQUIREMENTS
The following table summarizes our expected cash outflows resulting from financial contracts and commitments:
Millions of dollars
Long-term debt obligations(1)
Operating lease obligationsPurchase obligations(2)
United States pension plans(3)
Foreign pension plans(4)
Other postretirement benefits(5)
Legal settlements(6)
Total(7)
Payments due by period
Total
$ 2,949835798
1,23011
428457
$ 6,708
2012
$ 5101842751801158
385$ 1,603
2013 &2014
$ 1,316261272535—
10152
$ 2,537
2015 &2016
$ 791176120330—9220
$ 1,529
Thereafter
$ 332214131185—
177—
$ 1,039
(1) Interest payments related to long-term debt are included in the table above. For additional information about our financing arrangements, see Note 5 of the Notes to the Consolidated Financial Statements.
(2) Purchase obligations include our “take-or-pay” contracts with materials vendors and minimum payment obligations to other suppliers.(3) Represents the minimum contributions required by law estimated based on current interest rates, asset return assumptions, legislative requirements and
other actuarial assumptions at December 31, 2011. Management may elect to contribute amounts in addition to those required by law. See Note 12 of the Notes to the Consolidated Financial Statements for additional information.

MANAGEMENT'S DISCUSSION AND ANALYSIS OF FINANCIAL CONDITION ANDRESULTS OF OPERATIONS - (CONTINUED)
F-11
(4) Represents required contributions to our foreign funded pension plans only. See Note 12 of the Notes to the Consolidated Financial Statements for additional information.
(5) Represents our portion of expected benefit payments under our retiree healthcare plan.(6) For additional information regarding legal settlements, see Note 6 of the Notes to the Consolidated Financial Statements.(7) The table does not include short-term credit facility and commercial paper borrowings. For additional information about short-term borrowings, see
Note 5 of the Notes to the Consolidated Financial Statements.
OFF-BALANCE SHEET ARRANGEMENTS
We have guarantee arrangements in a Brazilian subsidiary. As a standard business practice in Brazil, the subsidiary guarantees customer lines of credit at commercial banks to support purchases following its normal credit policies. If a customer were to default on its line of credit with the bank, our subsidiary would be required to satisfy the obligation with the bank and the receivable would revert back to the subsidiary. As of December 31, 2011 and 2010, the guaranteed amounts totaled $467 million and $386 million, respectively. Our subsidiary insures against credit risk for these guarantees, under normal operating conditions, through policies purchased from high-quality underwriters.
We sell banker's acceptance drafts to financial institutions as a standard business practice in The People's Republic of China (PRC). These drafts have certain recourse provisions afforded to transferees explicitly and under PRC laws. If a transferee were to exercise its available recourse rights, our subsidiaries in the PRC would be required to satisfy the obligation with the transferee and the draft would revert back to the subsidiary. At December 31, 2011 and 2010 the outstanding drafts transferred and outstanding totaled $47 million and $18 million, respectively. Transferees have not exercised their recourse rights against our subsidiaries during 2011 or 2010.
CRITICAL ACCOUNTING POLICIES AND ESTIMATES
The preparation of financial statements in conformity with generally accepted accounting principles in the United States (GAAP) requires management to make certain estimates and assumptions. We periodically evaluate these estimates and assumptions, which are based on historical experience, changes in the business environment and other factors that management believes to be reasonable under the circumstances. Actual results may differ materially from these estimates. Pension and Other Postretirement Benefits
Accounting for pensions and other postretirement benefits involves estimating the costs of future benefits and attributing the cost over the employee’s expected period of employment. The determination of our obligation and expense for these costs requires the use of certain assumptions. Those assumptions include, the discount rate, expected long-term rate of return on plan assets and health care cost trend rates. These assumptions are subject to change based on interest rates on high quality bonds, stock and bond markets and medical cost inflation, respectively. Actual results that differ from our assumptions are accumulated and amortized over future periods and therefore, generally affect our recognized expense and accrued liability in such future periods. While we believe that our assumptions are appropriate given current economic conditions and actual experience, significant differences in results or significant changes in our assumptions may materially affect our pension and other postretirement benefit obligations and related future expense.
Our pension and other postretirement benefit obligations at December 31, 2011 and preliminary retirement benefit costs for 2012 were prepared using the assumptions that were determined at December 31, 2011. The following table summarizes the sensitivity of our December 31, 2011 retirement obligations and 2012 retirement benefit costs of our United States plans to changes in the key assumptions used to determine those results:
Million of dollars
United States Pension PlansDiscount rateExpected long-term rate of return on plan assetsOther Postretirement Benefit PlanDiscount rateExpected long-term rate of return on plan assetsHealth care cost trend rate
Percentage
Change
+/-.50%+/-.50%
+/-.50%+/-.50%+/-.50%
Estimated increase (decrease) in
2012 Expense
$ (1)/0(13)/13
2/(2)——
PBO/APBO*for 2011
$ (213)/225—
(11)/11—
5/(5)
* Projected benefit obligation (PBO) for pension plans and accumulated postretirement benefit obligation (APBO) for other postretirement benefit plan.

MANAGEMENT'S DISCUSSION AND ANALYSIS OF FINANCIAL CONDITION ANDRESULTS OF OPERATIONS - (CONTINUED)
F-12
These sensitivities may not be appropriate to use for other years’ financial results. Furthermore, the impact of assumption changes outside of the ranges shown above may not be approximated by using the above results. For additional information about our pension and other postretirement benefit obligations, see Note 12 of the Notes to the Consolidated Financial Statements.
Income Taxes
We estimate our income taxes in each of the taxing jurisdictions in which we operate. This involves estimating actual current tax expense together with assessing any temporary differences resulting from the different treatment of certain items, such as the timing for recognizing expenses, for tax and accounting purposes. These differences may result in deferred tax assets or liabilities, which are included in our Consolidated Balance Sheets. We are required to assess the likelihood that deferred tax assets, which include net operating loss carryforwards, foreign tax credits and deductible temporary differences, are expected to be realizable in future years. Realization of our net operating loss and foreign tax credit deferred tax assets is supported by specific tax planning strategies and where possible considers projections of future profitability. If recovery is not more likely than not, we provide a valuation allowance based on estimates of future taxable income in the various taxing jurisdictions, and the amount of deferred taxes that are ultimately realizable. If future taxable income is lower than expected or if tax planning strategies are not available as anticipated, we may record additional valuation allowances through income tax expense in the period such determination is made. Likewise, if we determine that we are able to realize our deferred tax assets in the future in excess of net recorded amounts, an adjustment to the deferred tax asset will increase income in the period such determination is made.
As of December 31, 2011 and 2010, we had total deferred tax assets of $2.8 billion and $2.3 billion, respectively, net of valuation allowances of $208 million and $193 million, respectively. Our income tax benefit or expense has fluctuated considerably over the last five years from a current year tax benefit of $(436) million to tax expense of $117 million and has been influenced primarily by energy tax credits, non-taxable BEFIEX credits, audit settlements and adjustments, tax planning strategies, enacted legislation, and dispersion of global income. Future changes in the effective tax rate will be subject to several factors, including expiration of the energy tax credit legislation at December 31, 2011, remaining BEFIEX credits, business profitability, tax planning strategies, and enacted tax laws.
In addition, we operate within multiple taxing jurisdictions and are subject to audit in these jurisdictions. These audits can involve complex issues, which may require an extended period of time to resolve. For additional information about income taxes, see Notes 1 and 11 of the Notes to the Consolidated Financial Statements.
BEFIEX Credits
In previous years, our Brazilian operations earned tax credits under the Brazilian government’s export incentive program (BEFIEX). These credits reduce Brazilian federal excise taxes on domestic sales, resulting in an increase in the operations’ recorded net sales. After a favorable court decision in 2005, upheld by a December 2011 appellate court decision, we were able to recognize approximately $266 million, $225 million, and $69 million of export credits during 2011, 2010 and 2009, respectively. Export credits recognized are not subject to income taxes. We recognize exports credits as they are monetized; however, future actions by the Brazilian government could limit our ability to monetize these export credits. As of December 31, 2011, approximately $238 million of future cash monetization remained, including $60 million of related court awarded fees, which will be payable in subsequent years. A Brazilian law change to the inflation index tables reduced available cash monetization by $62 million in 2011.
Product Recalls
The establishment of a liability for product recalls is periodically required and is impacted by several factors such as customer response rate, consumer options, field repair costs, inventory repair costs, extended warranty costs, communication structure and other miscellaneous costs such as legal, logistics and consulting. The customer response rate, which represents an estimate of the total number of units to be serviced as a percentage of the total number of units affected by the recall, is the most significant factor in estimating the total cost of each recall. To determine a response rate, we consider the population of the affected appliances based on evaluating the design issue or defective part in the appliance and the respective years in which it was included in manufacturing the appliance to determine the affected population. We also consider the type and age of the affected appliance to determine the affected population and apply historical response rates based on current and past experience factors to derive an estimated liability which is revised, as necessary, depending on our actual response rate. Differences between our assumptions and actual experience could have a material impact on our product recall reserves. For additional information about product recalls, see Note 6 of the Notes to the Consolidated Financial Statements.

MANAGEMENT'S DISCUSSION AND ANALYSIS OF FINANCIAL CONDITION ANDRESULTS OF OPERATIONS - (CONTINUED)
F-13
Warranty Obligations
The estimation of warranty obligations is determined in the same period that revenue from the sale of the related products is recognized. The warranty obligation is based on historical experience and represents our best estimate of expected costs at the time products are sold. Warranty accruals are adjusted for known or anticipated warranty claims as new information becomes available. New product launches require a greater use of judgment in developing estimates until historical experience becomes available. Future events and circumstances could materially change our estimates and require adjustments to the warranty obligations. For additional information about warranty obligations, see Note 6 of the Notes to the Consolidated Financial Statements. Goodwill and Intangibles
Certain business acquisitions have resulted in the recording of goodwill and trademark assets. Upon acquisition, the purchase price is first allocated to identifiable assets and liabilities, including trademark assets, based on estimated fair value, with any remaining purchase price recorded as goodwill. Most trademarks and goodwill are considered indefinite lived intangible assets and as such are not amortized. Our North America region and Embraco reporting segment in our Latin America region, have goodwill balances of $1,723 million and $4 million, respectively as of December 31, 2011. There have been no changes to our reporting units or allocations of goodwill by reporting units. We have trademark assets in our North America and Europe regions with $1,473 million and $53 million of recorded book value, respectively as of December 31, 2011. We test indefinite lived intangibles for impairment as of November 30 each year and more frequently if indicators of impairment exist.
Goodwill Valuations
Goodwill is evaluated using a two-step impairment test at the reporting unit level. The first step of the goodwill impairment test compares the book value of a reporting unit, including goodwill, with its fair value. If the book value of a reporting unit exceeds its fair value, we perform the second step of the impairment test. In the second step, we estimate an implied fair value of the reporting unit’s goodwill by allocating the fair value of the reporting unit to all of the assets and liabilities other than goodwill (including any unrecognized intangible assets). The difference between the total fair value of the reporting unit and the fair value of all the assets and liabilities other than goodwill is the implied fair value of that goodwill. The amount of impairment loss is equal to the excess of the book value of the goodwill over the implied fair value of that goodwill.
We estimate fair value using the best information available to us, including market information and discounted cash flow projections also referred to as the income approach. The income approach uses a reporting unit’s projection of estimated operating results and cash flows that is discounted using a weighted-average cost of capital that is determined based on current market conditions. The projection uses management’s best estimates of economic and market conditions over the projected period including growth rates in sales, costs and number of units, estimates of future expected changes in operating margins and cash expenditures. Other estimates and assumptions include terminal value growth rates, future estimates of capital expenditures and changes in future working capital requirements. We validate our estimates of fair value under the income approach by comparing the values to fair value estimates using a market approach. A market approach estimates fair value by applying cash flow multiples to the reporting unit’s operating performance. The multiples are derived from comparable publicly traded companies with similar operating and investment characteristics of the reporting units. Finally, we consider the implied control premium and conclude whether the implied control premium is reasonable based on other recent market transactions.
Based on the results of the step one impairment test performed as of November 30, 2011, no impairment of goodwill was determined to exist. The estimated fair value of our North America operating segment exceeded its carrying value by approximately 11%. Significant Assumptions in Evaluating Goodwill
Our methodology for evaluating goodwill for impairment has not changed since our impairment test performed as of November 30, 2010. We have updated our cash flow projections discussed above based on our current long range plan. Adverse changes in the operating environment for the home appliance industry, an increase in the discount rate or our inability to meet the operating margins at the forecasted rates may result in future impairment charges.
• Forecasted cash flows used in the discounted cash flow model are based on our long range plan for the next four years and include a 2% residual growth rate thereafter. The residual growth rate was based on the compound average growth rate for the United States T-7 appliance industry (T-7 refers to the following appliance categories: washers, dryers, refrigerators, freezers, dishwashers, ranges and compactors) over a 25 year period, and was also consistent with commercially available industry market value and volume forecasts. The undiscounted cash flows for the first four years used in the model declined from the projections used in 2010 as a result of a slowdown in industry demand and higher material and oil-related costs encountered during 2011. We have announced price increases to address the material and oil-related cost increases and are forecasting an improvement in our North America operating margins from approximately

MANAGEMENT'S DISCUSSION AND ANALYSIS OF FINANCIAL CONDITION ANDRESULTS OF OPERATIONS - (CONTINUED)
F-14
4% of net sales in 2011 to in excess of 8% of net sales within our long range planning period. We performed a sensitivity analysis on our estimated fair value using the income approach, noting that a reduction in our operating profit margin in the terminal year of 100 basis points would result in failure of the first step of the impairment test.
• The discount rate of 10.5% used in our discounted cash flow model, as of the November 30, 2011 assessment, was developed using the capital asset pricing model through which a weighted average cost of capital was derived. The discount rate was estimated using the risk free rate, market risk premium, and cost of debt prevalent as of the valuation date. The Beta and capital structure were estimated based on an analysis of comparable guideline companies. In addition, a risk premium was included to account for the risks inherent in the cash flows and to reconcile the fair value indicated by the discounted cash flow model to Whirlpool’s public market equity value at November 30, 2011. We performed sensitivity analysis on our estimated fair value using the income approach, noting that an increase in the discount rate of approximately 100 basis points would result in failure of the first step of the impairment test.
Intangible Valuations
The fair value of our trademarks are estimated and compared to the carrying value. We estimate the fair value of these intangible assets using the relief-from-royalty method, which requires assumptions related to projected revenues from our annual long-range plan; assumed royalty rates that could be payable if we did not own the trademarks; and a discount rate. We recognize an impairment loss when the estimated fair value of the indefinite-lived intangible asset is less than its carrying value.
Based on the results of our impairment test performed as of November 30, 2011, no impairment of trademarks was determined to exist. The fair values for all of our trademarks tested exceed their carrying values by more than 7% with the exception of one trademark which has a carrying value of $14 million. Significant Assumptions in Evaluating Trademarks
In assessing trademarks for impairment, significant assumptions used in our relief from royalty model as of November 30, 2011 included revenue growth rates, assumed royalty rates and the discount rate. During 2011, we have not performed any interim impairment tests as none of the triggering events contained in guidance within ASC 350 “Intangibles—Goodwill and Other” have occurred.
• Revenue growth rates relate to projected revenues from our annual long range plan and vary from brand to brand. Similar to our goodwill projections, adverse changes in the operating environment for the appliance industry or our inability to grow revenues at the forecasted rates may result in a future impairment charge. We performed sensitivity analysis on our estimated fair value noting that a 10% reduction of forecasted revenues would result in an impairment of approximately $10 million.
• In determining royalty rates for the valuation of our trademarks, we considered factors that affect the intrinsic royalty rates that would hypothetically be paid for the use of the trademark. The most significant factors in determining the intrinsic royalty rates include the overall role and importance of the trademarks in the particular industry, the profitability of the products utilizing the trademarks, and the position of the trademarked products in a given market segment. Based on this analysis, we determined royalty rates of 2-3% for our value brands, 4% for our mass market brands and 6% for our super premium brand. We performed sensitivity analysis on our estimated fair value noting that a reduction of the royalty rates used for the valuation of 100 basis points would result in an impairment of approximately $260 million.
• In developing discount rates for the valuation of our trademarks, we used the industry average weighted average cost of capital as the base adjusted for the higher relative level of risks associated with doing business in other countries, as applicable, as well as the higher relative levels of risks associated with intangible assets. Based on this analysis, we determined discount rates ranging from 9.5% to 11%. We performed sensitivity analysis on our estimated fair value noting that an increase in the discount rates used for the valuation of 100 basis points would result in an impairment of approximately $75 million.
Many of the factors used in assessing fair value are outside the control of management and it is reasonably likely that assumptions and estimates can change in future periods. These changes can result in future impairments.
For additional information about goodwill and intangible valuations, see Note 2 of the Notes to the Consolidated Financial Statements.

MANAGEMENT'S DISCUSSION AND ANALYSIS OF FINANCIAL CONDITION ANDRESULTS OF OPERATIONS - (CONTINUED)
F-15
ISSUED BUT NOT YET EFFECTIVE ACCOUNTING PRONOUNCEMENTS
In September 2011, the Financial Accounting Standards Board ("FASB") amended Accounting Standards Codification ("ASC") 350, "Intangibles-Goodwill and Other". Under the amendment, an entity may assess qualitative factors to determine whether it is more likely than not that the fair value of a reporting unit is less than its carrying amount, including goodwill. If determined to be necessary, the two-step impairment test shall be used to identify potential goodwill impairment and measure the amount of a goodwill impairment loss to be recognized, if any. The amendment is effective for annual and interim goodwill impairment tests performed for fiscal years beginning after December 15, 2011. We adopted the provisions of this amendment on January 1, 2012 which did not have a material impact on our consolidated financial statements.
In June 2011, the Financial Accounting Standards Board ("FASB") amended Accounting Standards Codification ("ASC") 220, “Presentation of Comprehensive Income.” This amendment will require companies to present the components of net income and other comprehensive income either as one continuous statement or as two consecutive statements. It eliminates the option to present components of other comprehensive income as part of the statement of changes in stockholders' equity. The amended guidance, which must be applied retroactively, is effective for interim and annual periods beginning after December 15, 2011, with earlier adoption permitted. In addition, in December 2011, the FASB issued an amendment to this accounting standard which defers the requirement to present components of reclassifications of other comprehensive income on the face of the income statement.We adopted the provisions of this amendment on January 1, 2012 which did not have a material impact on our consolidated financial statements.
In May 2011, the FASB amended ASC 820, "Fair Value Measurement." This amendment is intended to result in convergence between U.S. GAAP and International Financial Reporting Standards (“IFRS”) requirements for measurement of and disclosures about fair value. This guidance clarifies the application of existing fair value measurements and disclosures, and changes certain principles or requirements for fair value measurements and disclosures. The amendment is effective for interim and annual periods beginning after December 15, 2011. We adopted the provisions of this amendment on January 1, 2012 which did not have a material impact on our consolidated financial statements.
MARKET RISK
We have in place an enterprise risk management process that involves systematic risk identification and mitigation covering the categories of enterprise, strategic, financial, operation and compliance and reporting risk. The enterprise risk management process receives Board of Directors and Management oversight, drives risk mitigation decision-making and is fully integrated into our internal audit planning and execution cycle.
We are exposed to market risk from changes in foreign currency exchange rates, domestic and foreign interest rates, and commodity prices, which can affect our operating results and overall financial condition. We manage exposure to these risks through our operating and financing activities and, when deemed appropriate, through the use of derivatives. Derivatives are viewed as risk management tools and are not used for speculation or for trading purposes. Derivatives are generally contracted with a diversified group of investment grade counterparties to reduce exposure to nonperformance on such instruments.
We use foreign currency forward contracts, currency options and currency swaps to hedge the price risk associated with firmly committed and forecasted cross-border payments and receipts related to ongoing business and operational financing activities. Foreign currency contracts are sensitive to changes in foreign currency exchange rates. At December 31, 2011, a 10% favorable or unfavorable exchange rate movement in each currency in our portfolio of foreign currency contracts would have resulted in an incremental unrealized gain or loss of approximately $185 million. Consistent with the use of these contracts to neutralize the effect of exchange rate fluctuations, such unrealized losses or gains would be offset by corresponding gains or losses, respectively, in the re-measurement of the underlying exposures.
We enter into commodity swap contracts to hedge the price risk associated with firmly committed and forecasted commodities purchases, the prices of which are not fixed directly through supply contracts. As of December 31, 2011, a 10% favorable or unfavorable shift in commodity prices would have resulted in an incremental gain or loss of approximately $32 million, respectively, related to these contracts.
We occasionally enter into interest rate swaps to hedge interest rate risk associated with debt. As of December 31, 2011, a 10% favorable or unfavorable shift in treasury bond yields would have resulted in an incremental gain or loss of approximately $4 million, respectively, related to these contracts.

MANAGEMENT'S DISCUSSION AND ANALYSIS OF FINANCIAL CONDITION ANDRESULTS OF OPERATIONS - (CONTINUED)
F-16
OTHER MATTERS
Embraco Antitrust Matters
Beginning in February 2009, our compressor business headquartered in Brazil ("Embraco") was notified of investigations of the global compressor industry by government authorities in various jurisdictions. In 2011, Embraco sales represented approximately 8% of our global net sales.
Government authorities in Brazil, Europe, the United States, and other jurisdictions have entered into agreements with Embraco and concluded their investigations. In connection with these agreements, Embraco has acknowledged violations of antitrust law with respect to the sale of compressors at various times from 2004 through 2007 and agreed to pay fines or settlement payments. In connection with these agreements and other Embraco antitrust matters, we have incurred, in the aggregate, charges of approximately $315 million, including fines, defense costs and other expenses. These charges have been recorded within interest and sundry income (expense). At December 31, 2011, $189 million remains accrued, and installment payments of $172 million, plus interest, remain to be made to government authorities at various times through 2015.
Since the government investigations commenced in February 2009, Embraco has been named as a defendant in related antitrust lawsuits in various jurisdictions seeking damages in connection with the pricing of compressors from 1996 to 2009. Several other compressor manufacturers who are the subject of the government investigations have also been named as defendants in the litigation. United States federal lawsuits instituted on behalf of purported purchasers and containing class action allegations have been combined in one proceeding in the United States District Court for the Eastern District of Michigan. Lawsuits containing class action allegations are also pending in Canada. Additional lawsuits may be filed by purported purchasers.
We continue to work toward resolution of ongoing government investigations in other jurisdictions, to defend the related antitrust lawsuits and to take other actions to minimize our potential exposure. The final outcome and impact of these matters, and any related claims and investigations that may be brought in the future are subject to many variables, and cannot be predicted. We establish accruals only for those matters where we determine that a loss is probable and the amount of loss can be reasonably estimated. While it is currently not possible to reasonably estimate the aggregate amount of costs which we may incur in connection with these matters, such costs could have a material adverse effect on our financial position, liquidity, or results of operations.
Brazilian Collection Dispute
We reached an agreement on June 22, 2011 to settle all claims arising from our long-standing dispute in Brazil with Banco Safra S.A. Such settlement was subsequently approved by a Brazilian court on July 8, 2011. Pursuant to the settlement, our subsidiary agreed to pay Banco Safra S.A. 959 million Brazilian reais, in two installments, the first of 469 million reais (equivalent to $301 million) was made on July 14, 2011, and the second of 490 million reais (equivalent to $275 million) was made during January 2012. At December 31, 2011 the outstanding accrual related to the final installment translated to approximately $261 million. The settlement amount was funded from available cash.
Operating Tax Matter
In 2009, we entered into a settlement with the Brazilian tax authority to resolve a dispute regarding tax credits on the purchase of raw materials used in production ("IPI tax credits") and other disputed tax amounts. As a result of this settlement agreement, we recorded charges net of tax of $34 million in 2009. The settlement is in the process of being ratified by the Brazilian tax authority.
Other Litigation
We are currently defending against numerous class action lawsuits in various jurisdictions in the United States and Canada relating to certain of our front load washing machines. The complaints in these lawsuits generally allege violations of state consumer fraud acts, unjust enrichment, and breach of warranty. The complaints generally seek unspecified compensatory, consequential and punitive damages. We believe these suits are without merit and intend to vigorously defend them. At this point, the Company cannot reasonably estimate a possible range of loss, if any.
In addition, we are currently defending a number of other class action suits in federal and state courts related to the manufacturing and sale of our products and alleging claims which include breach of contract, breach of warranty, product defect, fraud, violation of federal and state consumer protection acts and negligence. We are also involved in various other legal actions arising in the normal course of business. We dispute the merits of these suits and actions, and intend to vigorously defend them. Management believes, based upon its current knowledge, after taking into consideration legal counsel's evaluation of such suits and actions discussed, and after taking into account current litigation reserves, that the outcome of these matters currently pending

MANAGEMENT'S DISCUSSION AND ANALYSIS OF FINANCIAL CONDITION ANDRESULTS OF OPERATIONS - (CONTINUED)
F-17
against Whirlpool should not have a material adverse effect, if any, on our Consolidated Financial Statements.
Antidumping Petitions
The U.S. Department of Commerce and the U.S. International Trade Commission have initiated investigations in response to our antidumping and countervailing duty petitions against bottom-mount refrigerators from South Korea and an antidumping petition against the same product from Mexico. The purpose of these petitions is to establish conditions of fair competition in the U.S. market that will support significant investment and innovation in the production of high-end refrigerators in the United States and the U.S. jobs created by that production. The Whirlpool products affected by this case are made in Amana, Iowa, where Whirlpool employs approximately 2,000 people. The U.S. International Trade Commission made a unanimous preliminary determination that imports from South Korea and Mexico caused material injury to the domestic industry. The U.S. Department of Commerce issued a preliminary determination that certain respondents violated U.S and international trade laws by dumping bottom-mount refrigerators in the United States. Based on the information submitted by the respondents, the U.S. Department of Commerce made a preliminary determination that no countervailable duties are being provided by the South Korean government, but subsequently modified the preliminary determination by finding certain countervailable duties against a particular respondent. Final decisions on these matters, following completion of the investigations, including audits of the respondents' books and records, are currently expected in the first half of 2012.
In December 2011, we submitted petitions requesting that the U.S. Department of Commerce and the U.S. International Trade Commission initiate antidumping and countervailing duty investigations against large residential washers from South Korea, and an antidumping investigation against the same products from Mexico. The purpose of these petitions is to establish conditions of fair competition in the U.S. market that will support significant investment and innovation in the production of large residential washers in the United States and the U.S. jobs created by that production. The Whirlpool products affected by this case are made in Clyde, Ohio, where Whirlpool employs approximately 3,500 people. The U.S. International Trade Commission made a preliminary determination that imports from South Korea and Mexico caused material injury to the domestic industry. Final decisions on these matters, following completion of the investigations, including audits of the respondents' books and records are currently expected in the first half of 2013.
FORWARD-LOOKING STATEMENTS
The Private Securities Litigation Reform Act of 1995 provides a safe harbor for forward-looking statements made by us or on our behalf. Certain statements contained in this annual report, including those within the forward-looking perspective section within this Management's Discussion and Analysis, and other written and oral statements made from time to time by us or on our behalf do not relate strictly to historical or current facts and may contain forward-looking statements that reflect our current views with respect to future events and financial performance. As such, they are considered “forward-looking statements” which provide current expectations or forecasts of future events. Such statements can be identified by the use of terminology such as “may,” “could,” “will,” “should,” “possible,” “plan,” “predict,” “forecast,” “potential,” “anticipate,” “estimate,” “expect,” “project,” “intend,” “believe,” “may impact,” “on track,” and similar words or expressions. Our forward-looking statements generally relate to our growth strategies, financial results, product development, and sales efforts. These forward-looking statements should be considered with the understanding that such statements involve a variety of risks and uncertainties, known and unknown, and may be affected by inaccurate assumptions. Consequently, no forward-looking statement can be guaranteed and actual results may vary materially.
This document contains forward-looking statements about Whirlpool Corporation and its consolidated subsidiaries (“Whirlpool”) that speak only as of this date. Whirlpool disclaims any obligation to update these statements. Forward-looking statements in this document may include, but are not limited to, statements regarding expected earnings per share, cash flow, productivity and material and oil-related prices. Many risks, contingencies and uncertainties could cause actual results to differ materially from Whirlpool's forward-looking statements. Among these factors are: (1) intense competition in the home appliance industry reflecting the impact of both new and established global competitors, including Asian and European manufacturers; (2) Whirlpool's ability to continue its relationship with significant trade customers and the ability of these trade customers to maintain or increase market share; (3) changes in economic conditions which affect demand for our products, including the strength of the building industry and the level of interest rates; (4) inventory and other asset risk; (5) global, political and/or economic uncertainty and disruptions, especially in Whirlpool's significant geographic regions, including uncertainty and disruptions arising from natural disasters or terrorist attacks; (6) impact of the European debt crisis; (7) the ability of Whirlpool to achieve its business plans, productivity improvements, cost control, price increases, leveraging of its global operating platform, and acceleration of the rate of innovation; (8) fluctuations in the cost of key materials (including steel, oil, plastic, resins, copper and aluminum) and components and the ability of Whirlpool to offset cost increases; (9) litigation and legal compliance risk and costs, especially costs which may be materially different from the amount we expect to incur or have accrued for; (10) product liability and product recall costs; (11) the effects and costs of governmental investigations or related actions by third parties; (12) Whirlpool's ability

MANAGEMENT'S DISCUSSION AND ANALYSIS OF FINANCIAL CONDITION ANDRESULTS OF OPERATIONS - (CONTINUED)
F-18
to obtain and protect intellectual property rights; (13) the ability of suppliers of critical parts, components and manufacturing equipment to deliver sufficient quantities to Whirlpool in a timely and cost-effective manner; (14) health care cost trends, regulatory changes and variations between results and estimates that could increase future funding obligations for pension and post retirement benefit plans; (15) information technology system failures and data security breaches; (16) the impact of labor relations; (17) our ability to attract, develop and retain executives and other qualified employees; (18) changes in the legal and regulatory environment including environmental and health and safety regulations; and (19) the ability of Whirlpool to manage foreign currency fluctuations.
We undertake no obligation to update any forward-looking statement, and investors are advised to review disclosures in our filings with the Securities and Exchange Commission. It is not possible to foresee or identify all factors that could cause actual results to differ from expected or historic results. Therefore, investors should not consider the foregoing factors to be an exhaustive statement of all risks, uncertainties, or factors that could potentially cause actual results to differ from forward-looking statements. Additional information concerning these and other factors can be found in “Risk Factors” in Item 1A of this report

F-19
WHIRLPOOL CORPORATIONCONSOLIDATED STATEMENTS OF INCOME
Year Ended December 31, (Millions of dollars, except per share data)
Net salesExpensesCost of products soldGross marginSelling, general and administrativeIntangible amortizationRestructuring costsOperating profitOther income (expense)Interest and sundry income (expense)Interest expense
Earnings (loss) before income taxesIncome tax benefitNet earnings
Less: Net earnings available to noncontrolling interestsNet earnings available to WhirlpoolPer share of common stockBasic net earnings available to WhirlpoolDiluted net earnings available to WhirlpoolDividendsWeighted-average shares outstanding (in millions)BasicDiluted
2011
$ 18,666
16,0892,5771,621
28136792
(607)(213)(28)
(436)40818
$ 390
$ 5.07$ 4.99$ 1.93
76.878.1
2010
$ 18,366
15,6522,7141,604
2874
1,008
(197)(225)586(64)65031
$ 619
$ 8.12$ 7.97$ 1.72
76.277.6
2009
$ 17,099
14,7132,3861,544
28126688
(176)(219)293(61)35426
$ 328
$ 4.39$ 4.34$ 1.72
74.675.6
The accompanying notes are an integral part of these Consolidated Financial Statements

F-20
WHIRLPOOL CORPORATIONCONSOLIDATED BALANCE SHEETS
At December 31, (Millions of dollars, except share data)
AssetsCurrent assets
Cash and equivalentsAccounts receivable, net of allowance of $61 and $66, respectivelyInventoriesDeferred income taxesPrepaid and other current assets
Total current assetsProperty, net of accumulated depreciation of $6,146 and $6,660, respectivelyGoodwillOther intangibles, net of accumulated amortization of $177 and $146, respectivelyDeferred income taxesOther noncurrent assetsTotal assetsLiabilities and stockholders’ equityCurrent liabilities
Accounts payableAccrued expensesAccrued advertising and promotionsEmployee compensationNotes payableCurrent maturities of long-term debtOther current liabilities
Total current liabilitiesNoncurrent liabilities
Long-term debtPension benefitsPostretirement benefitsOther noncurrent liabilities
Total noncurrent liabilitiesStockholders’ equity
Common stock, $1 par value, 250 million shares authorized, 106 million shares issued and76 million shares outstandingAdditional paid-in capitalRetained earningsAccumulated other comprehensive loss
Treasury stock, 30 million sharesTotal Whirlpool stockholders’ equity
Noncontrolling interestsTotal stockholders’ equity
Total liabilities and stockholders’ equity
2011
$ 1,1092,1052,354
248606
6,4223,1021,7271,7571,893
280$ 15,181
$ 3,512951429365
1361678
6,297
2,1291,487
430558
4,604
1062,2014,922
(1,226)(1,822)4,181
994,280
$ 15,181
2010
$ 1,3682,2782,792
204673
7,3153,1341,7311,7891,305
310$ 15,584
$ 3,660671426467
2312611
6,149
2,1951,519
610791
5,115
1062,1564,680(893)
(1,823)4,226
944,320
$ 15,584
The accompanying notes are an integral part of these Consolidated Financial Statements

F-21
WHIRLPOOL CORPORATIONCONSOLIDATED STATEMENTS OF CASH FLOWS
Year Ended December 31, (Millions of dollars)
Operating activitiesNet earningsAdjustments to reconcile net earnings to cash provided by operating activities:Depreciation and amortizationCurtailment gainIncrease (decrease) in LIFO inventory reserveBrazilian collection disputeChanges in assets and liabilities:
Accounts receivableInventoriesAccounts payableAccrued advertising and promotionsProduct recallTaxes deferred and payable, netAccrued pensionEmployee compensationOther
Cash provided by operating activitiesInvesting activitiesCapital expendituresProceeds from sale of assetsInvestment in related businessesProceeds from sale of brandAcquisition of brandOther
Cash used in investing activitiesFinancing activitiesRepayments of long-term debtCommon stock issuedDividends paidPurchase of noncontrolling interest sharesNet repayments from short-term borrowingsProceeds from borrowings of long-term debtOther
Cash (used in) provided by financing activitiesEffect of exchange rate changes on cash and equivalents(Decrease) increase in cash and equivalentsCash and equivalents at beginning of yearCash and equivalents at end of year
Supplemental disclosure of cash flow informationCash paid for interestCash paid for income taxes
2011
$ 408
558(35)54
144
(15)2832514
(15)(573)(280)(59)21
530
(608)23(7)——(4)
(596)
(313)14
(148)—(2)
300(17)
(166)(27)
(259)1,368
$ 1,109
$ 208$ 136
2010
$ 650
555(62)
463
187(595)341(47)13
(94)(16)(6)85
1,078
(593)17
(18)15
(27)—
(606)
(379)72
(132)(12)(20)
2(26)
(495)11
(12)1,380
$ 1,368
$ 218$ 31
2009
$ 354
525(92)(41)46
(286)57832621
(37)(112)(84)213139
1,550
(541)77
(35)———
(499)
(210)21
(128)—
(362)872(49)14439
1,234146
$ 1,380
$ 209$ 51
The accompanying notes are an integral part of these Consolidated Financial Statements

F-22
WHIRLPOOL CORPORATIONCONSOLIDATED STATEMENTS OF CHANGES IN STOCKHOLDERS’ EQUITY
Year ended December 31,(Millions of dollars)
Balances, December 31, 2008Comprehensive income
Net earningsOther comprehensive income
Comprehensive incomeStock issuedDividends declaredBalances, December 31, 2009Comprehensive income
Net earningsOther comprehensive income(loss)
Comprehensive incomePurchase of noncontrolling interest
Stock issuedDividends declaredBalances, December 31, 2010Comprehensive income
Net earningsOther comprehensive income(loss)
Comprehensive incomeStock issuedDividends declaredBalances, December 31, 2011
Total
$ 3,073
35440976367
(143)3,760
650
(22)628
(12)103
(159)4,320
408
(338)7046
(156)$ 4,280
Whirlpool Stockholders’ Equity
RetainedEarnings
$ 3,993
328—
—(128)
4,193
619
—
——
(132)4,680
390
—
—(148)
$ 4,922
Accumulated OtherComprehensiveIncome (Loss)
$ (1,259)
—391
——
(868)
—
(25)
———
(893)
—
(333)
——
$ (1,226)
Treasury Stock/Additional Paid-
in-Capital
$ 168
——
66—
234
—
—
(3)102—
333
—
—
46—
$ 379
CommonStock
$ 104
——
1—
105
—
—
—1
—106
—
—
——
$ 106
Non-
ControllingInterests
$ 67
2618
—(15)96
31
3
(9)—
(27)94
18
(5)
—(8)
$ 99
The accompanying notes are an integral part of these Consolidated Financial Statements

F-23
NOTES TO THE CONSOLIDATED FINANCIAL STATEMENTS
(1) SUMMARY OF PRINCIPAL ACCOUNTING POLICIES
General InformationWhirlpool Corporation, a Delaware corporation, is the world's leading manufacturer and marketer of major home appliances.
We manufacture appliances in 12 countries under 13 principal brand names in four geographic operating segments and market products in nearly every country around the world . Our Consolidated Financial Statements include all majority-owned subsidiaries. All intercompany transactions have been eliminated upon consolidation.
ReclassificationsWe reclassified certain prior period amounts in our Consolidated Financial Statements to be consistent with current period
presentation. The effect of these reclassifications is not material.
Use of Estimates
We are required to make estimates and assumptions that affect the amounts reported in the Consolidated Financial Statements and accompanying notes. Actual results could differ materially from those estimates.
Revenue Recognition
Sales are recorded when title passes to the customer as determined by the shipping terms. For the majority of our sales, title is transferred to the customer as soon as products are shipped. For a portion of our sales, title is transferred to the customer upon receipt of products at the customer’s location. Allowances for estimated returns are made on sales of certain products based on historical return rates for the products involved.
Accounts Receivable and Allowance for Doubtful Accounts
We carry accounts receivable at sales value less an allowance for doubtful accounts. We periodically evaluate accounts receivable and establish an allowance for doubtful accounts based on a combination of specific customer circumstances, credit conditions and the history of write-offs and collections. We evaluate items on an individual basis when determining accounts receivable write-offs. Our policy is to not charge interest on trade receivables after the invoice becomes past due. A receivable is considered past due if payment has not been received within agreed upon invoice terms.
Freight and Warehousing Costs
We classify freight and warehousing costs within cost of products sold in our Consolidated Statements of Income.
Cash and Equivalents
All highly liquid debt instruments purchased with an initial maturity of three months or less are considered cash equivalents.
Inventories
Inventories are stated at first-in, first-out (“FIFO”) cost, except United States production inventories, which are stated at last-in, first-out (“LIFO”) cost, and Latin America and Asia inventories, which are stated at average cost. Costs do not exceed net realizable values. See Note 4 for additional information about inventories.
Property
Property is stated at cost, net of accumulated depreciation. For production machinery and equipment, we record depreciation based on units produced, unless units produced drop below a minimum threshold at which point depreciation is recorded using the straight-line method. For nonproduction assets, we depreciate costs based on the straight-line method. Depreciation expense for property was $530 million, $527 million and $497 million in 2011, 2010 and 2009, respectively.
The following table summarizes our property as of December 31, 2011 and 2010:
Millions of dollars
LandBuildingsMachinery and equipmentAccumulated depreciationProperty, net
2011
$ 761,2087,964
(6,146)$ 3,102
2010
$ 741,2188,502
(6,660)$ 3,134
EstimatedUseful Life
n/a25 to 50 years3 to 25 years

NOTES TO THE CONSOLIDATED FINANCIAL STATEMENTS - (CONTINUED)
F-24
We classify gains and losses associated with asset dispositions in the same line item as the underlying depreciation of the disposed asset in the Consolidated Statements of Income. We retired approximately $600 million and $80 million of machinery and equipment no longer in use during 2011 and 2010. Net gains and losses recognized in cost of products sold were nominal for 2011, 2010 and 2009.
We record impairment losses on long-lived assets when events and circumstances indicate the assets may be impaired and the estimated future cash flows generated by those assets are less than their carrying amounts. There were no significant impairments recorded during 2011, 2010 and 2009.
Goodwill and Other Intangibles
Goodwill is evaluated using a two-step impairment test at the reporting unit level. The first step of the goodwill impairment test compares the book value of a reporting unit, including goodwill, with its fair value. If the book value of a reporting unit exceeds its fair value, we perform the second step of the impairment test. In the second step, we estimate an implied fair value of the reporting unit’s goodwill by allocating the fair value of the reporting unit to all of the assets and liabilities other than goodwill (including any unrecognized intangible assets). The difference between the total fair value of the reporting unit and the fair value of all the assets and liabilities other than goodwill is the implied fair value of that goodwill. The amount of impairment loss is equal to the excess of the book value of the goodwill over the implied fair value of that goodwill.
In assessing the fair value of trademarks, we utilize a relief from royalty method. If the carrying amount of a trademark exceeds its fair value, an impairment loss is recognized in an amount equal to the excess. Considerable judgment is necessary to estimate key assumptions involved in valuing our trademarks, including projected revenues, royalty rates and applicable discount rates.
Definite lived intangible assets are amortized over their estimated useful life ranging from 3 to 18 years. See Note 2 for additional information about goodwill and intangible assets.
Accounts Payable Outsourcing
We offer our suppliers access to third party payables processors. Independent of Whirlpool, the processors allow suppliers to sell their receivables to financial institutions at the sole discretion of both the supplier and the financial institution. We have no economic interest in the sale of these receivables and no direct financial relationship with the financial institutions concerning these services. All of our obligations, including amounts due, remain to our suppliers as stated in our supplier agreements. As of December 31, 2011 and 2010, approximately $952 million and $916 million, respectively, have been sold by suppliers to participating financial institutions.
Derivative Financial Instruments
We use derivative instruments designated as cash flow and fair value hedges to manage our exposure to the volatility in material costs, foreign currency and interest rates on certain debt instruments. Changes in the fair value of derivative assets or liabilities (i.e., gains or losses) are recognized depending upon the type of hedging relationship and whether a hedge has been designated. For those derivative instruments that qualify for hedge accounting, we designate the hedging instrument, based upon the exposure being hedged, as a cash flow hedge, fair value hedge, or a hedge of a net investment in a foreign operation. For a derivative instrument designated as a fair value hedge, the gain or loss on the derivative is recognized in earnings in the period of change in fair value together with the offsetting gain or loss on the hedged item. For a derivative instrument designated as a cash flow hedge, the effective portion of the derivative’s gain or loss is initially reported as a component of Other Comprehensive Income and is subsequently recognized in earnings when the hedged exposure affects earnings. For a derivative instrument designated as a hedge of a net investment in a foreign operation, the effective portion of the derivative’s gain or loss is reported in Other Comprehensive Income as part of the cumulative translation adjustment. Changes in fair value of derivative instruments that do not qualify for hedge accounting are recognized immediately in current net earnings. See Note 7 for additional information about hedges and derivative financial instruments.
Foreign Currency Translation
Foreign currency denominated assets and liabilities are translated into United States dollars at exchange rates existing at the respective balance sheet dates. Translation adjustments resulting from fluctuations in exchange rates are recorded as a separate component of Other Comprehensive Income (loss) within stockholders’ equity. The results of operations of foreign subsidiaries are translated at the average exchange rates during the respective periods. Gains and losses resulting from foreign currency transactions are included in net earnings.

NOTES TO THE CONSOLIDATED FINANCIAL STATEMENTS - (CONTINUED)
F-25
Research and Development Costs
Research and development costs are charged to expense as incurred and totaled $578 million, $532 million and $500 million in 2011, 2010 and 2009, respectively.
Advertising Costs
Advertising costs are charged to expense when the advertisement is first communicated and totaled $275 million, $235 million and $211 million in 2011, 2010 and 2009, respectively.
Income Taxes
We account for income taxes using the asset and liability method. Under this method, deferred tax assets and liabilities are recognized for the future tax consequences of temporary differences between the financial statement and tax bases of assets and liabilities using enacted rates. The effect of a change in tax rates on deferred tax assets is recognized in income in the period of enactment date.
We recognize, in other current and noncurrent liabilities, in the Consolidated Balance Sheet, effects of an uncertain income tax position when it is more likely than not, based on technical merits, that the position will be sustained upon examination. We accrue for other tax contingencies when it is probable that a liability to a taxing authority has been incurred and the amount of the contingency can be reasonably estimated.
Provision is made for taxes on undistributed earnings of foreign subsidiaries and related companies to the extent that such earnings are not deemed to be permanently invested. See Note 11 for additional information about income taxes.
Stock Based Compensation
We recognize stock based compensation expense based on the grant date fair value of the award over the period during which an employee is required to provide service in exchange for the award (generally the vesting period). The fair value of stock options is determined using the Black-Scholes option-pricing model, which incorporates assumptions regarding the risk-free interest rate, expected volatility, expected option life and dividend yield. Stock options are granted with an exercise price equal to the stock price on the date of grant. The fair value of restricted stock units and performance stock units is based on the closing market price of Whirlpool common stock on the grant date. See Note 9 for additional information about stock based compensation.
BEFIEX Credits
In previous years, our Brazilian operations earned tax credits under the Brazilian government’s export incentive program (BEFIEX). These credits reduce Brazilian federal excise taxes on domestic sales, resulting in an increase in the operations’ recorded net sales. After a favorable court decision in 2005, upheld by a December 2011 appellate court decision, we were able to recognize approximately $266 million, $225 million, and $69 million of export credits during 2011, 2010 and 2009, respectively. Export credits recognized are not subject to income taxes. We recognize export credits as they are monetized; however, future actions by the Brazilian government could limit our ability to monetize these export credits. As of December 31, 2011, approximately $238 million of future cash monetization remained, including $60 million of related court awarded fees, which will be payable in subsequent years. A Brazilian law change to the inflation index tables reduced available cash monetization by $62 million in 2011.
Product Warranty and Recall Reserves
Product warranty reserves are generally established in the same period that revenue from the sale of the related products is recognized. The amounts of those reserves are based on established terms and our best estimate of the amounts necessary to settle future and existing claims on products sold as of the balance sheet date.
Issued but Not Yet Effective Accounting Pronouncements
In September 2011, the Financial Accounting Standards Board ("FASB") amended Accounting Standards Codification ("ASC") 350, "Intangibles-Goodwill and Other". Under the amendment, an entity may assess qualitative factors to determine whether it is more likely than not that the fair value of a reporting unit is less than its carrying amount, including goodwill. If determined to be necessary, the two-step impairment test shall be used to identify potential goodwill impairment and measure the amount of a goodwill impairment loss to be recognized, if any. The amendment is effective for annual and interim goodwill impairment tests performed for fiscal years beginning after December 15, 2011. We adopted the provisions of this amendment on January 1, 2012 which did not have a material impact on our consolidated financial statements.

NOTES TO THE CONSOLIDATED FINANCIAL STATEMENTS - (CONTINUED)
F-26
In June 2011, the Financial Accounting Standards Board ("FASB") amended Accounting Standards Codification ("ASC") 220, “Presentation of Comprehensive Income.” This amendment will require companies to present the components of net income and other comprehensive income either as one continuous statement or as two consecutive statements. It eliminates the option to present components of other comprehensive income as part of the statement of changes in stockholders' equity. The amended guidance, which must be applied retroactively, is effective for interim and annual periods beginning after December 15, 2011, with earlier adoption permitted. In addition, in December 2011, the FASB issued an amendment to this accounting standard which defers the requirement to present components of reclassifications of other comprehensive income on the face of the income statement.We adopted the provisions of this amendment on January 1, 2012 which did not have a material impact on our consolidated financial statements.
In May 2011, the FASB amended ASC 820, "Fair Value Measurement." This amendment is intended to result in convergence between U.S. GAAP and International Financial Reporting Standards (“IFRS”) requirements for measurement of and disclosures about fair value. This guidance clarifies the application of existing fair value measurements and disclosures, and changes certain principles or requirements for fair value measurements and disclosures. The amendment is effective for interim and annual periods beginning after December 15, 2011. We adopted the provisions of this amendment on January 1, 2012 which did not have a material impact on our consolidated financial statements.
(2) GOODWILL AND OTHER INTANGIBLES
We evaluated our goodwill and indefinite lived trademarks for impairment as of November 30, 2011. Based on the results of our test, no impairment of goodwill or our trademarks was determined to exist.
Goodwill
The following table summarizes the net carrying amount of goodwill by operating segment:
Millions of dollars
December 31, 2009Revision of estimated Maytag operations exit costsForeign currency translation
December 31, 2010Revision of estimated Maytag operations exit costsForeign currency translation
December 31, 2011
NorthAmerica
$ 1,724(1)4
1,727(2)(2)
$ 1,723
LatinAmerica
$ 5—(1)4
——
$ 4
Total
$ 1,729(1)3
1,731(2)(2)
$ 1,727
Other Intangible Assets
The following table summarizes other intangible assets at December 31, 2011 and 2010:
Millions of dollars
Intangible assets with finite lives:Customer relationships 1
Patents and non-compete agreements 2
Total other intangible assets, finite livesTrademarks, indefinite lives
Total other intangible assets
2011Gross
CarryingAmount
$ 35355
$ 4081,526
$ 1,934
AccumulatedAmortization
$ (159)(18)
$ (177)—
$ (177)
Net
$ 19437
$ 2311,526
$ 1,757
2010Gross
CarryingAmount
$ 34159
$ 4001,535
$ 1,935
AccumulatedAmortization
$ (131)(15)
$ (146)—
$ (146)
Net
$ 21044
$ 2541,535
$ 1,7891 Customer relationships have an estimated useful life of 18 years
2 Patents and non-compete agreements have an estimated useful life of 3 to 10 years

NOTES TO THE CONSOLIDATED FINANCIAL STATEMENTS - (CONTINUED)
F-27
The following table summarizes our future estimated amortization expense by year:
Millions of dollars
20122013201420152016
$ 3331211816
(3) FAIR VALUE MEASUREMENTS
Fair value is measured based on an exit price, representing the amount that would be received to sell an asset or paid to transfer a liability in an orderly transaction between market participants. As such, fair value is a market-based measurement that should be determined based on assumptions that market participants would use in pricing an asset or liability. As a basis for considering such assumptions, a three-tiered fair value hierarchy is established, which prioritizes the inputs used in measuring fair value as follows: (Level 1) observable inputs such as quoted prices in active markets; (Level 2) inputs, other than the quoted prices in active markets that are observable, either directly or indirectly; and (Level 3) unobservable inputs in which there is little or no market data, which require the reporting entity to develop its own assumptions. We had no Level 3 assets or liabilities at December 31, 2011 and 2010.
Assets and liabilities measured at fair value using the market approach valuation technique. This technique uses prices and other relevant information generated by market transactions involving identical or comparable assets or liabilities.
Assets and liabilities measured at fair value on a recurring basis at December 31, 2011 and 2010 are as follows:
Millions of dollars
Money market funds (1)
Net derivative contractsAvailable for sale investments
Total Cost Basis2011
$ 340—
21
2010
$ 414—
27
Quoted Prices InActive Markets for
Identical Assets(Level 1)
2011
$ 340—
15
2010
$ 414—
25
Significant OtherObservable Inputs
(Level 2)2011
$ —(57)
—
2010
$ —125
—
Total Fair Value2011
$ 340(57)
15
2010
$ 414125
25(1) Money market funds are primarily comprised of United States government obligations.
(4) INVENTORIES
The following table summarizes our inventory at December 31, 2011 and 2010:
Millions of dollarsFinished productsWork in processRaw materials
Less: excess of FIFO cost over LIFO costTotal inventories
2011$ 2,016
41500
2,557(203)
$ 2,354
2010$ 2,314
37590
2,941(149)
$ 2,792
LIFO inventories represented 41% and 43% of total inventories at December 31, 2011 and 2010, respectively.

NOTES TO THE CONSOLIDATED FINANCIAL STATEMENTS - (CONTINUED)
F-28
(5) FINANCING ARRANGEMENTS
Debt
The following table summarizes our debt at December 31, 2011 and 2010:
Millions of dollars
Senior note—6.125%, maturing 2011Senior note—8.0%, maturing 2012Medium-term note—5.5%, maturing 2013Maytag medium-term note—6.5% maturing 2014Senior note—8.6%, maturing 2014Maytag medium-term note—5.0% maturing 2015Senior note—6.5%, maturing 2016Debentures—7.75%, maturing 2016Senior note—4.85%, maturing 2021Other (various maturing through 2019)
Less current maturitiesTotal long-term debt, net of current maturities
2011
$ —35050010150019524924430051
2,490361
$ 2,129
2010
$ 300350500101500193249244—70
2,507312
$ 2,195
The following table summarizes the contractual maturities of our debt, including current maturities, at December 31, 2011:
Millions of dollars
20122013201420152016ThereafterTotal long-term debt, including current maturities
$ 361511610204502302
$ 2,490
The fair value of long-term debt (including current maturities) at December 31, 2011 and 2010 was $2,670 million and $2,716 million, respectively, and was estimated using discounted cash flow analysis based on incremental borrowing rates for similar types of borrowing arrangements.
On June 7, 2011, we completed a debt offering of $300 million principal amount of 4.85% notes due June 15, 2021 (the “2021 Notes”). The proceeds from the 2021 Notes were used to repay $300 million of 6.125% notes that matured on June 15, 2011. The 2021 Notes contain covenants that limit our ability to incur certain liens or enter into certain sale and lease-back transactions. In addition, if we experience a specific kind of change of control, we are required to make an offer to purchase all of the 2021 Notes at a purchase price of 101% of the principal amount thereof, plus accrued and unpaid interest. The 2021 Notes are registered under the Securities Act of 1933, as amended, pursuant to our Registration Statement on Form S-3 (File No. 333-157392) filed with the Securities and Exchange Commission on February 19, 2009.
On June 28, 2011, we entered into an Amended and Restated Long-Term Credit Agreement (the “Facility”). The Facility amended, restated, and extended our previous credit facility, that was scheduled to mature on August 13, 2012. The total commitment increased from $1.35 billion to $1.725 billion and the maturity date was extended to June 28, 2016. The Facility includes a letter of credit sublimit of $200 million. Borrowings under the Facility are available to us and our designated subsidiaries for general corporate purposes, including commercial paper support. Subsidiary borrowings under the Facility, if any, are guaranteed by Whirlpool Corporation. Interest under the Facility accrues at a variable annual rate based on LIBOR plus a margin or the prime rate plus a margin. The margin is dependent on our credit rating at that time. At December 31, 2011, the margin was as follows: (1) 1.625% over LIBOR; (2) 0.625% over the prime rate; and (3) the unused commitment fee was 0.25%. At December 31, 2011 and 2010 we had no borrowings outstanding under either facilities. We were in compliance with financial covenant requirements at December 31, 2011 and 2010.

NOTES TO THE CONSOLIDATED FINANCIAL STATEMENTS - (CONTINUED)
F-29
The Facility requires us to meet certain financial tests. Whirlpool's maximum rolling twelve month Leverage Ratio (defined in the Facility) is limited to 3.25 to 1.0 for each fiscal quarter. The rolling twelve month Interest Coverage Ratio (defined in the Facility) is required to be greater than or equal to 3.0 to 1.0 for each fiscal quarter.
We paid lenders under the Facility an up-front fee of approximately $5 million, which combined with the unamortized deferred fees from the previous credit facility are being amortized over the remaining term of the Facility.
In December 2011 we obtained a committed credit facility in Brazil. The credit facility provides borrowings up to 700 million Brazilian reais (approximately $373 million as of December 31, 2011), with certain restrictions on the amount available for each draw. The credit facility contains no financial covenants. As of December 31, 2011 we had no borrowings outstanding under this credit agreement.
Notes Payable
Notes payable consist of short-term borrowings payable to banks and commercial paper used to fund working capital requirements. The fair value of our notes payable approximates the carrying amount due to the short maturity of these obligations. The weighted-average interest rate on notes payable was 3.51% and 2.50% for the years ended December 31, 2011 and 2010, respectively. We had no commercial paper outstanding at December 31, 2011 and 2010.
(6) COMMITMENTS AND CONTINGENCIES
Embraco Antitrust Matters
Beginning in February 2009, our compressor business headquartered in Brazil ("Embraco") was notified of investigations of the global compressor industry by government authorities in various jurisdictions. In 2011, Embraco sales represented approximately 8% of our global net sales .
Government authorities in Brazil, Europe, the United States, and other jurisdictions have entered into agreements with Embraco and concluded their investigations. In connection with these agreements, Embraco has acknowledged violations of antitrust law with respect to the sale of compressors at various times from 2004 through 2007 and agreed to pay fines or settlement payments. In connection with these agreements and other Embraco antitrust matters, we have incurred, in the aggregate, charges of approximately $315 million, including fines, defense costs and other expenses. These charges have been recorded within interest and sundry income (expense). At December 31, 2011, $189 million remains accrued, and installment payments of $172 million, plus interest, remain to be made to government authorities at various times through 2015.
Since the government investigations commenced in February 2009, Embraco has been named as a defendant in related antitrust lawsuits in various jurisdictions seeking damages in connection with the pricing of compressors from 1996 to 2009. Several other compressor manufacturers who are the subject of the government investigations have also been named as defendants in the litigation. United States federal lawsuits instituted on behalf of purported purchasers and containing class action allegations have been combined in one proceeding in the United States District Court for the Eastern District of Michigan. Lawsuits containing class action allegations are also pending in Canada. Additional lawsuits may be filed by purported purchasers.
We continue to work toward resolution of ongoing government investigations in other jurisdictions, to defend the related antitrust lawsuits and to take other actions to minimize our potential exposure. The final outcome and impact of these matters, and any related claims and investigations that may be brought in the future are subject to many variables, and cannot be predicted. We establish accruals only for those matters where we determine that a loss is probable and the amount of loss can be reasonably estimated. While it is currently not possible to reasonably estimate the aggregate amount of costs which we may incur in connection with these matters, such costs could have a material adverse effect on our financial position, liquidity, or results of operations.
Brazilian Collection Dispute
We reached an agreement on June 22, 2011 to settle all claims arising from our long-standing dispute in Brazil with Banco Safra S.A. Such settlement was subsequently approved by a Brazilian court on July 8, 2011. Pursuant to the settlement, our subsidiary agreed to pay Banco Safra S.A. 959 million Brazilian reais, in two installments, the first of 469 million reais (equivalent to $301 million) was made on July 14, 2011, and the second of 490 million reais (equivalent to $275 million) was made during January 2012. At December 31, 2011 the outstanding accrual related to the final installment translated to approximately $261 million. The settlement amount was funded from available cash.

NOTES TO THE CONSOLIDATED FINANCIAL STATEMENTS - (CONTINUED)
F-30
Operating Tax Matter
In 2009, we entered into a settlement with the Brazilian tax authority to resolve a dispute regarding tax credits on the purchase of raw materials used in production ("IPI tax credits") and other disputed tax amounts. As a result of this settlement agreement, we recorded charges net of tax of $34 million in 2009. The settlement is in the process of being ratified by the Brazilian tax authority.
Other Litigation
We are currently defending against numerous class action lawsuits in various jurisdictions in the United States and Canada relating to certain of our front load washing machines. The complaints in these lawsuits generally allege violations of state consumer fraud acts, unjust enrichment, and breach of warranty. The complaints generally seek unspecified compensatory, consequential and punitive damages. We believe these suits are without merit and intend to vigorously defend them. At this point, the Company cannot reasonably estimate a possible range of loss, if any.
In addition, we are currently defending a number of other class action suits in federal and state courts related to the manufacturing and sale of our products and alleging claims which include breach of contract, breach of warranty, product defect, fraud, violation of federal and state consumer protection acts and negligence. We are also involved in various other legal actions arising in the normal course of business. We dispute the merits of these suits and actions, and intend to vigorously defend them. Management believes, based upon its current knowledge, after taking into consideration legal counsel's evaluation of such suits and actions discussed, and after taking into account current litigation reserves, that the outcome of these matters currently pending against Whirlpool should not have a material adverse effect, if any, on our Consolidated Financial Statements.
Product Warranty and Recall Reserves
The following table summarizes the changes in product warranty and recall reserves for the periods ending December 31, 2011 and 2010:
Millions of dollarsBalance at January 1
Issuances/accruals during the periodSettlements made during the periodOther changes
Balance at December 31Current portionNon-current portionTotal
Product Warranty2011
$ 202344
(355)—
$ 191$ 157
34$ 191
2010$ 187
349(343)
9$ 202$ 159
43$ 202
Product Recall2011
$ 15—(6)(9)
$ —$ —
—$ —
2010$ 2
78(65)—
$ 15$ 15
—$ 15
Total2011
$ 217344
(361)(9)
$ 191$ 157
34$ 191
2010$ 189
427(408)
9$ 217$ 174
43$ 217
Product warranty and recall reserves are included within other current and other noncurrent liabilities in our Consolidated Balance Sheets.
During the first quarter in 2010 we accrued $75 million related to a recall of 1.8 million dishwashers sold in the United States and Canada between 2006 and 2010. The recall is due to an electrical failure in the dishwasher’s heating element. During 2011, we revised the total cost of this recall from $75 million to $66 million, as a result of lower than expected costs. These amounts were recorded in cost of products sold. There are no remaining amounts accrued.
In 2009, we announced a voluntary recall of refrigerators due to quality issues in a purchased component. We accrued $70 million, in the aggregate, as the estimated cost of the recall, all of which was charged to cost of products sold. There are no remaining amounts accrued. On October 24, 2011 we reached a settlement agreement in which the supplier agreed to reimburse $61 million of Whirlpool's recall costs which was recognized in cost of products sold.
We regularly engage in investigations of potential quality and safety issues as part of our ongoing effort to deliver quality products to customers. We are currently investigating a limited number of potential quality and safety issues. As necessary, we undertake to effect repair or replacement of appliances in the event that an investigation leads to the conclusion that such action is warranted.
Guarantees

NOTES TO THE CONSOLIDATED FINANCIAL STATEMENTS - (CONTINUED)
F-31
We have guarantee arrangements in a Brazilian subsidiary. As a standard business practice in Brazil, the subsidiary guarantees customer lines of credit at commercial banks to support purchases following its normal credit policies. If a customer were to default on its line of credit with the bank, our subsidiary would be required to satisfy the obligation with the bank and the receivable would revert back to the subsidiary. At December 31, 2011 and 2010, the guaranteed amounts totaled $467 million and $386 million, respectively. Our subsidiary insures against credit risk for these guarantees, under normal operating conditions, through policies purchased from high-quality underwriters.
We provide guarantees of indebtedness and lines of credit for various consolidated subsidiaries. The maximum amount of credit facilities available under these lines for consolidated subsidiaries totaled $1.2 billion at December 31, 2011 and 2010. Our total outstanding bank indebtedness under guarantees were nominal at December 31, 2011 and 2010, respectively.
On May 16, 2008, we guaranteed a $50 million five year revolving credit facility between certain financial institutions and a not-for-profit entity in connection with a community and economic development project (“Harbor Shores”). The fair value of the guarantee was nominal. The purpose of Harbor Shores is to stimulate employment and growth in the areas of Benton Harbor and St. Joseph, Michigan. In the event of default, we must satisfy the guarantee of the credit facility up to the amount borrowed at the date of default.
We sell banker's acceptance drafts to financial institutions as a standard business practice in The People's Republic of China (PRC). These drafts have certain recourse provisions afforded to transferees explicitly and under PRC laws. If a transferee were to exercise its available recourse rights, our subsidiaries in the PRC would be required to satisfy the obligation with the transferee and the draft would revert back to the subsidiary. At December 31, 2011 and 2010 the outstanding drafts transferred and outstanding totaled $47 million and $18 million, respectively. Transferees have not exercised their recourse rights against our subsidiaries during 2011 or 2010.
Operating Lease Commitments
At December 31, 2011, we had noncancelable operating lease commitments totaling $835 million. The annual future minimum lease payments are summarized by year in the table below:
Millions of dollars
20122013201420152016ThereafterTotal noncancelable operating lease commitments
$ 1841491129779
214$ 835
Rent expense was $218 million, $214 million and $208 million for 2011, 2010 and 2009, respectively.
Purchase Obligations
Our expected cash outflows resulting from purchase obligations are summarized by year in the table below:
Millions of dollars
20122013201420152016ThereafterTotal purchase obligations
$ 2751651076852
131$ 798

NOTES TO THE CONSOLIDATED FINANCIAL STATEMENTS - (CONTINUED)
F-32
(7) HEDGES AND DERIVATIVE FINANCIAL INSTRUMENTS
Derivative instruments are accounted for at fair value based on market rates. Derivatives where we elect hedge accounting are designated as either cash flow or fair value hedges. Derivatives that are not accounted for based on hedge accounting are marked to market through earnings. The accounting for changes in the fair value of a derivative depends on the intended use and designation of the derivative instrument. For a derivative instrument designated as a fair value hedge, the gain or loss on the derivative is recognized in earnings in the period of change in fair value together with the offsetting gain or loss on the hedged item. For a derivative instrument designated as a cash flow hedge, the effective portion of the derivative’s gain or loss is initially reported as a component of Other Comprehensive Income (“OCI”) and is subsequently recognized in earnings when the hedged exposure affects earnings. Hedging ineffectiveness and a net earnings impact occur when the change in the fair value of the hedge does not offset the change in the fair value of the hedged item. The ineffective portion of the gain or loss is recognized in earnings.
Using derivative instruments means assuming counterparty credit risk. Counterparty credit risk relates to the loss we could incur if a counterparty were to default on a derivative contract. We generally deal with investment grade counterparties and monitor the overall credit risk and exposure to individual counterparties. We do not anticipate nonperformance by any counterparties. The amount of counterparty credit exposure is limited to the unrealized gains, if any, on such derivative contracts. We do not require, nor do we post collateral or security on such contracts.
Hedging strategy
In the normal course of business, we manage risks relating to our ongoing business operations including those arising from changes in foreign exchange rates, interest rates and commodity prices. Fluctuations in these rates and prices can affect our operating results and financial condition. We use a variety of strategies, including the use of derivative instruments. We do not enter into derivative financial instruments for trading or speculative purposes.
Foreign currency exchange rate risk
We incur expenses associated with the procurement and production of products in a limited number of countries, while we sell in the local currencies of a large number of countries. Our primary foreign currency exchange exposures result from cross-currency sales of products. As a result, we enter into foreign exchange contracts to hedge certain firm commitments and forecasted transactions to acquire products and services that are denominated in foreign currencies.
We enter into certain undesignated non-functional currency asset and liability hedges that relate primarily to short-term payables, receivables, inventory and intercompany loans. These forecasted cross-currency cash flows relate primarily to foreign currency denominated expenditures and intercompany financing agreements, royalty agreements and dividends. When we hedge a foreign currency denominated payable or receivable with a derivative, the effect of changes in the foreign exchange rates are reflected currently in interest and sundry income (expense) for both the payable/receivable and the derivative. Therefore, as a result of the economic hedge, we do not elect hedge accounting.
Commodity price risk
We enter into forward contracts on various commodities to manage the price risk associated with forecasted purchases of materials used in our manufacturing process. The objective of these hedges is to reduce the variability of cash flows associated with the forecasted purchase of commodities.
Interest rate risk
We may enter into interest rate swap agreements to manage interest rate risk exposure. Our interest rate swap agreements, if any, effectively modify our exposure to interest rate risk, primarily through converting certain of our floating rate debt to a fixed rate basis, and certain fixed rate debt to a floating rate basis. These agreements involve either the receipt or payment of floating rate amounts in exchange for fixed rate interest payments or receipts, respectively, over the life of the agreements without an exchange of the underlying principal amounts. We also may utilize a cross-currency interest rate swap agreement to manage our exposure relating to certain intercompany debt denominated in one foreign currency that will be repaid in another foreign currency. At December 31, 2011 and 2010 there were no outstanding swap agreements.
We enter into treasury rate lock agreements to effectively modify our exposure to interest rate risk by locking-in interest rates on probable long-term debt issuances.

NOTES TO THE CONSOLIDATED FINANCIAL STATEMENTS - (CONTINUED)
F-33
The following tables summarize our outstanding derivative contracts and their effects on our Consolidated Balance Sheets at December 31, 2011 and 2010:
Millions of dollars
Derivatives accounted for as hedgesForeign exchange forwards/optionsCommodity swaps/optionsInterest rate derivativesTotal derivatives accounted for ashedgesDerivatives not accounted for ashedgesForeign exchange forwards/optionsCommodity swaps/optionsTotal derivatives not accounted foras hedgesTotal derivatives
CurrentNoncurrentTotal derivatives
Notional Amount2011
$ 862316250
$1,2613
2010
$ 909539
—
$ 99013
Fair Value of
Hedge Assets2011
$ 249
—
$ 33
$ 6—
6$ 39
$ 363
$ 39
2010
$ 13129
—
$ 142
$ 1111
22$ 164
$ 13529
$ 164
Hedge Liabilities2011
$ 19285
$ 52
$ 431
44$ 96
$ 915
$ 96
2010
$ 312
—
$ 33
$ 33
6$ 39
$ 39—
$ 39
Type ofHedge (1)
(CF/FV)(CF/FV)(CF)
N/AN/A
Maximum Term(Months)
2011
18366
311
2010
1524—
1012
(1) Derivatives accounted for as hedges are either considered cash flow (CF) or fair value (FV) hedges
The effects of derivative instruments on our Consolidated Statements of Income for the year ended December 31, 2011 and 2010 are as follows:
Cash Flow Hedges - Millions of dollars
Foreign exchange forwards/optionsCommodity swaps/optionsInterest rate derivatives
Gain (Loss)Recognized in OCI(Effective Portion)
2011
$ 3(60)(5)
$ (62)
2010
$ (34)104—
$ 70
Gain (Loss)Reclassified fromOCI into Income
(Effective Portion) (1)
2011
$ (16)96—
$ 80
2010
$ (32)79—
$ 47
(a)(b)(b)(a)
Gain (Loss)Recognized in Income(Ineffective Portion) (2)
2011
$ —2
—$ 2
2010
$ 21
—$ 3
Fair Value Hedges - Millions of dollars
Foreign exchange forwards/options
Gain (Loss) Recognizedon Derivatives (3)
2011
$ 8
2010
$ (12)
Gain (Loss) Recognizedon Related
Hedged Items (3)
2011
$ (8)
2010
$ 12
Hedged Item
Non-functionalcurrency assets and liabilities
Derivatives not Accounted for as Hedges - Millions of dollars
Foreign exchange forwards/optionsCommodity swaps
Gain (Loss) Recognized on Derivatives not
Accounted for as Hedges (4)
2011
$ (1)(1)
$ (2)
2010
$ 371
$ 38(1) Gains and losses reclassified from accumulated OCI and recognized in income are recorded in (a) interest and sundry income (expense) or (b) cost of
products sold.(2) Gains and losses recognized in income related to the ineffective portion of hedges are recorded in interest and sundry income (expense).(3) Gains and losses recognized in income are recorded in interest and sundry income (expense).(4) Mark to market gains and losses recognized in income are recorded in interest and sundry income (expense).

NOTES TO THE CONSOLIDATED FINANCIAL STATEMENTS - (CONTINUED)
F-34
The net amount of unrealized gain or loss on derivative instruments included in accumulated OCI related to contracts maturing and expected to be realized during the next twelve months is a gain of $10 million at December 31, 2011.
(8) STOCKHOLDERS’ EQUITY
Comprehensive Income
Comprehensive income primarily includes (1) our reported net earnings, (2) foreign currency translation, (3) changes in the effective portion of our open derivative contracts designated as cash flow hedges, (4) changes in our unrecognized pension and other postretirement benefits and (5) changes in fair value of our available for sale marketable securities.
The following table shows the components of accumulated other comprehensive income (loss) available to Whirlpool at December 31, 2009, 2010, and 2011, and the activity for the years then ended:
Millions of dollars
December 31, 2008Unrealized gainUnrealized actuarial loss and prior service credit (cost)Tax effectOther comprehensive income (loss), net of tax
Less: Other comprehensive income available tononcontrolling interests
Other comprehensive income (loss) available to WhirlpoolDecember 31, 2009
Unrealized gain (loss)Unrealized actuarial gain (loss) and prior service credit(cost)Tax effectOther comprehensive income (loss), net of tax
Less: Other comprehensive income available tononcontrolling interests
Other comprehensive income (loss) available to WhirlpoolDecember 31, 2010
Unrealized gain (loss)Unrealized actuarial gain (loss) and prior service credit(cost)Tax effectOther comprehensive income (loss), net of tax
Less: Other comprehensive income (loss) available tononcontrolling interests
Other comprehensive income (loss) available to WhirlpoolDecember 31, 2011
ForeignCurrency
$ (525)333—
(23)310
11299
$ (226)(59)
—36
(23)
3(26)
$ (252)(86)
—(36)
(122)
(2)(120)
$ (372)
DerivativeInstruments
$ (120)266—
(86)180
7173
$ 5323
—(7)16
—16
$ 69(147)
—47
(100)
(3)(97)
$ (28)
Pension andPostretirement
Liability
$ (621)—
(109)27
(82)
—(82)
$ (703)—
24(29)(5)
—(5)
$ (708)—
(177)65
(112)
—(112)
$ (820)
MarketableSecurities
$ 71
——1
—1
$ 8(10)
——
(10)
—(10)
$ (2)(4)
——(4)
—(4)
$ (6)
Total
$(1,259)600
(109)(82)409
18391
$ (868)(46)
24—
(22)
3(25)
$ (893)(237)
(177)76
(338)
(5)(333)
$(1,226)
Net Earnings per Share
Diluted net earnings per share of common stock include the dilutive effect of stock options and other share-based compensation plans. Basic and diluted net earnings per share of common stock were calculated as follows:
Millions of dollars and shares
Numerator for basic and diluted earnings per share – net earnings available to WhirlpoolDenominator for basic earnings per share – weighted-average sharesEffect of dilutive securities – stock-based compensationDenominator for diluted earnings per share – adjusted weighted-average sharesAnti-dilutive stock options/awards excluded from earnings per share
2011
$ 39076.81.3
78.12.1
2010
$ 61976.21.4
77.61.6
2009
$ 32874.61.0
75.63.0

NOTES TO THE CONSOLIDATED FINANCIAL STATEMENTS - (CONTINUED)
F-35
Noncontrolling Interests
During the fourth quarter of 2009, our Latin America region entered into a definitive agreement to purchase 1.8% of the outstanding noncontrolling interest in Brasmotor S.A. for $12 million. This transaction closed on January 15, 2010 and raised our ownership interest in Brasmotor S.A. to 95.6%.
Repurchase Program
On April 23, 2008, our Board of Directors authorized a share repurchase program of up to $500 million. Share repurchases are made from time to time on the open market as conditions warrant. There have been no repurchases since 2008. At December 31, 2011, there was $350 million remaining authorized under this program.
(9) STOCK OPTION AND INCENTIVE PLANS
We sponsor several share-based employee incentive plans. Share-based compensation expense for grants awarded under these plans was $37 million, $29 million and $27 million in 2011, 2010, and 2009, respectively. Related income tax benefits recognized in earnings were $13 million, $10 million and $10 million in 2011, 2010, and 2009, respectively.
At December 31, 2011, unrecognized compensation cost related to non-vested stock option and stock unit awards totaled $39 million. The cost of these non-vested awards is expected to be recognized over a weighted-average remaining vesting period of 34 months.
Share-Based Employee Incentive Plans
On April 20, 2010, our stockholders approved the 2010 Omnibus Stock and Incentive Plan (“2010 OSIP”). This plan was previously adopted by our Board of Directors on February 16, 2010 and provides for the issuance of stock options, performance stock units, performance shares, restricted stock and restricted stock units. No new awards may be granted under the 2010 OSIP after the tenth anniversary of the date that the stockholders approved the plan. However, the term and exercise of awards granted before then may extend beyond that date. At December 31, 2011, approximately 3.2 million shares remain available for issuance under the 2010 OSIP.
On April 17, 2007, our stockholders approved the 2007 Omnibus Stock and Incentive Plan (“2007 OSIP”). This plan was previously adopted by our Board of Directors on February 20, 2007 and provides for the issuance of stock options, performance stock units, performance shares, restricted stock and restricted stock units with terms of no more than 10 years. At December 31, 2010, no shares remain available for issuance under the 2007 OSIP.
Stock Options
Eligible employees may receive stock options as a portion of their total compensation. Such options generally become exercisable over a three-year period, expire 10 years from the date of grant and are subject to forfeiture upon termination of employment, other than by death, disability or retirement. We use the Black-Scholes option-pricing model to measure the fair value of stock options granted to employees. Granted options have exercise prices equal to the market price of Whirlpool common stock on the grant date. The principal assumptions used in valuing options include: (1) risk-free interest rate—an estimate based on the yield of United States zero coupon securities with a maturity equal to the expected life of the option; (2) expected volatility—an estimate based on the historical volatility of Whirlpool common stock for a period equal to the expected life of the option; and (3) expected option life—an estimate based on historical experience. Stock options are expensed on a straight-line basis, net of estimated forfeitures. Based on the results of the model, the weighted-average fair values of stock options granted for 2011, 2010, and 2009 were $24.74, $36.84 and $6.42, respectively, using the following assumptions:
Weighted Average Black-Scholes Assumptions
Risk-free interest rateExpected volatilityExpected dividend yieldExpected option life, in years
2011
2.3%36.5%2.0%
5
2010
3.3%40.3%1.8%
7
2009
1.9%37.5%5.5%
5

NOTES TO THE CONSOLIDATED FINANCIAL STATEMENTS - (CONTINUED)
F-36
Stock Option Activity
The following table summarizes stock option activity during 2011:
Thousands of shares, except per share data
Outstanding at January 1GrantedExercisedCanceled or expiredOutstanding at December 31Exercisable at December 31
Numberof Options
3,428625
(244)(346)
3,4632,484
Weighted-Average
Exercise Price$ 71.20
85.4646.63
120.64$ 70.63$ 73.10
The total intrinsic value of stock options exercised was $9 million, $40 million, and $9 million for 2011, 2010, and 2009, respectively. The related tax benefits were $3 million, $14 million and $3 million for 2011, 2010, and 2009, respectively. Cash received from the exercise of stock options was $14 million, $72 million, and $21 million for 2011, 2010, and 2009, respectively.
The table below summarizes additional information related to stock options outstanding at December 31, 2011:
Options in thousands / dollars in millions, except share data
Number of optionsWeighted-average exercise price per shareAggregate intrinsic valueWeighted-average remaining contractual term, in years
Outstanding Net ofExpected Forfeitures
3,389$ 70.30$ 16
6
OptionsExercisable
2,484$ 73.10$ 10
5
Stock Units
Eligible employees may receive restricted stock units or performance stock units as a portion of their total compensation.
Restricted stock units are typically granted to selected management employees on an annual basis and vest over three years. Periodically, restricted stock units may be granted to selected executives based on special recognition or retention circumstances and generally vest from three years to seven years. Some of these awards accrue dividend equivalents on outstanding units (in the form of additional stock units) based on dividends declared on Whirlpool common stock. These awards convert to unrestricted common stock at the conclusion of the vesting period.
Performance stock units are granted to executives on an annual basis. The final award may equal 0 – 200% of a target based on pre-established Whirlpool financial performance measures related to the current year. The awards vest two years following the end of the performance period and convert to unrestricted common stock at the conclusion of the vesting period. The total fair value of shares vested during 2011, 2010, and 2009 was $15 million, $17 million and $15 million, respectively.
We measure compensation cost for stock units based on the closing market price of Whirlpool common stock at the grant date. The weighted average grant date fair values of awards granted during 2011, 2010, and 2009 were $82.55, $87.17 and $26.51, respectively.
The following table summarizes stock unit activity during 2011:
Stock units in thousands, except per-share data
Non-vested, at January 1GrantedCanceledVested and transferred to unrestrictedNon-vested, at December 31
Number ofStock Units
1,486297(66)
(243)1,474
Weighted- AverageGrant Date Fair
Value
$ 60.6082.5570.0763.03
$ 64.32

NOTES TO THE CONSOLIDATED FINANCIAL STATEMENTS - (CONTINUED)
F-37
Nonemployee Director Equity Awards
Effective January 1, 2011, each nonemployee Director will receive an annual grant of Whirlpool common stock, with the number of shares to be issued to the director determined by dividing $110,000 by the closing price of Whirlpool common stock on the date of the annual meeting of our stockholders. Nonemployee Directors receive a one time grant of 1,000 shares of Whirlpool common stock made at the time they first join the Board.
Prior to 2011, each nonemployee Director received the following equity compensation (1) a one time grant of 1,000 shares of Whirlpool common stock made at the time a director first joins the Board; (2) an annual grant of stock options, with the number of options to be determined by dividing $50,000 by the fair value of the stock option granted, as calculated using the Black-Scholes valuation model; and (3) an annual grant of stock, with the number of shares to be issued to the director determined by dividing $50,000 by the closing price of Whirlpool common stock on the date of the annual meeting of our stockholders. The exercise price under each option granted is the closing price of Whirlpool common stock on the day of Whirlpool's annual meeting of stockholders.
(10) RESTRUCTURING CHARGES
During the fourth quarter 2011, the Company committed to restructuring plans (the "2011 Plan") to expand our operating margins and improve our earnings through substantial cost and capacity reductions, primarily within our North America and EMEA operating segments. Previous restructuring plans have been consolidated into the 2011 Plan beginning with the fourth quarter 2011. Including previously announced restructuring initiatives, we expect to incur approximately $500 million of total costs beginning in the fourth quarter 2011 with completion expected by the end of 2013.
The 2011 Plan includes the following actions:
• Overall workforce reduction of more than 5,000 positions, including approximately 1,200 salaried positions.• Closure of a refrigeration manufacturing facility in the United States in 2012.• Cease laundry production in a European manufacturing facility by 2013.• Ceased dishwasher production in a European manufacturing facility in January 2012.• Additional organizational efficiency actions in North America and EMEA.
We recognized $136 million in total restructuring costs during 2011, of which $78 million was associated with the 2011 Plan. The remaining $58 million of restructuring costs related to plans (the "Old Plans") that were completed during 2011 or have now been consolidated into the 2011 Plan.
The following tables summarize the changes to our restructuring liability for the Old Plans and the 2011 Plan for the year ended December 31, 2011.
"Old Plans"
Millions of dollars
Termination costsNon-employee exitTotal
12/31/2010
$ 3614
$ 50
Charge toEarnings
$ 3721
$ 58
Cash Paid
$ (51)(9)
$ (60)
Non-cashand Other
$ —(5)
$ (5)
Revisionof
Estimate
$ —(4)
$ (4)
Transferto "2011
Plan"
$ (22)(17)
$ (39)
12/31/2011
$ ——
$ —
"2011 Plan"
Millions of dollars
Termination costsNon-employee exitTotal
12/31/2010
$ ——
$ —
Transferfrom "Old
Plans"
$ 2217
$ 39
Charge toEarnings
$ 5622
$ 78
Cash Paid
$ (15)(10)
$ (25)
Non-cashand Other
$ (1)(13)
$ (14)
Revisionof
Estimate
$ ——
$ —
12/31/2011
$ 6216
$ 78
CumulativeCharges
$ 5622
$ 78
ExpectedTotal
Charges
$ 310190
$ 500

NOTES TO THE CONSOLIDATED FINANCIAL STATEMENTS - (CONTINUED)
F-38
The following table summarizes restructuring charges for the 2011 Plan, by operating segment, for the year ended December 31, 2011. For additional information about restructuring charges by operating segment, see Note 13 of the Notes to the Consolidated Financial Statements.
Millions of dollars
North AmericaLatin AmericaEMEAAsiaCorporate / OtherTotal
2011 Charges
$ 532
2111
$ 78
CumulativeCharges
$ 532
2111
$ 78
ExpectedTotal Charges
$ 34210
135103
$ 500
(11) INCOME TAXES
The income tax benefit amounted to $436 million, $64 million, and $61 million in 2011, 2010 and 2009, respectively. The following table summarizes the difference between income tax expense at the United States statutory rate of 35%and the income tax benefit at effective worldwide tax rates for 2011, 2010 and 2009:
Millions of dollars
Earnings (loss) before income taxesUnited StatesForeign
Earnings (loss) before income taxesIncome tax computed at United States statutory rate
U.S. government tax incentives, including Energy Tax CreditsForeign government tax incentives, including BEFIEXForeign tax rate differentialU.S. foreign tax creditsValuation allowancesDeductible interest on capitalState and local taxes, net of federal tax benefitMedicare Part D subsidyForeign withholding taxesNon-deductible government settlementsU.S. tax on foreign dividends and subpart F incomeSettlement of global tax auditsOther items, net
Income tax computed at effective worldwide tax rates
2011
$ (240)212(28)(10)
(379)(100)(13)(37)11—(4)—1030261020
$ (436)
2010
$ (256)842586205
(230)(103)(46)(28)(9)(7)(2)—123349566
$ (64)
2009
$ (110)403293103
(125)(44)(31)(19)10
(15)1
1215—1022—
$ (61)
Current and deferred tax (benefit) provisions
The following table summarizes our income tax (benefits) provisions for 2011, 2010 and 2009:
Millions of dollars
United StatesForeignState and local
Total income tax benefit
2011Current
$ (18)114
(1)$ 95
Deferred
$ (464)(64)(3)
$ (531)$ (436)
2010Current
$ (101)204
(5)$ 98
Deferred
$ (204)411
$ (162)$ (64)
2009Current
$ 11115
(4)$ 122
Deferred
$ (182)(4)3
$ (183)$ (61)
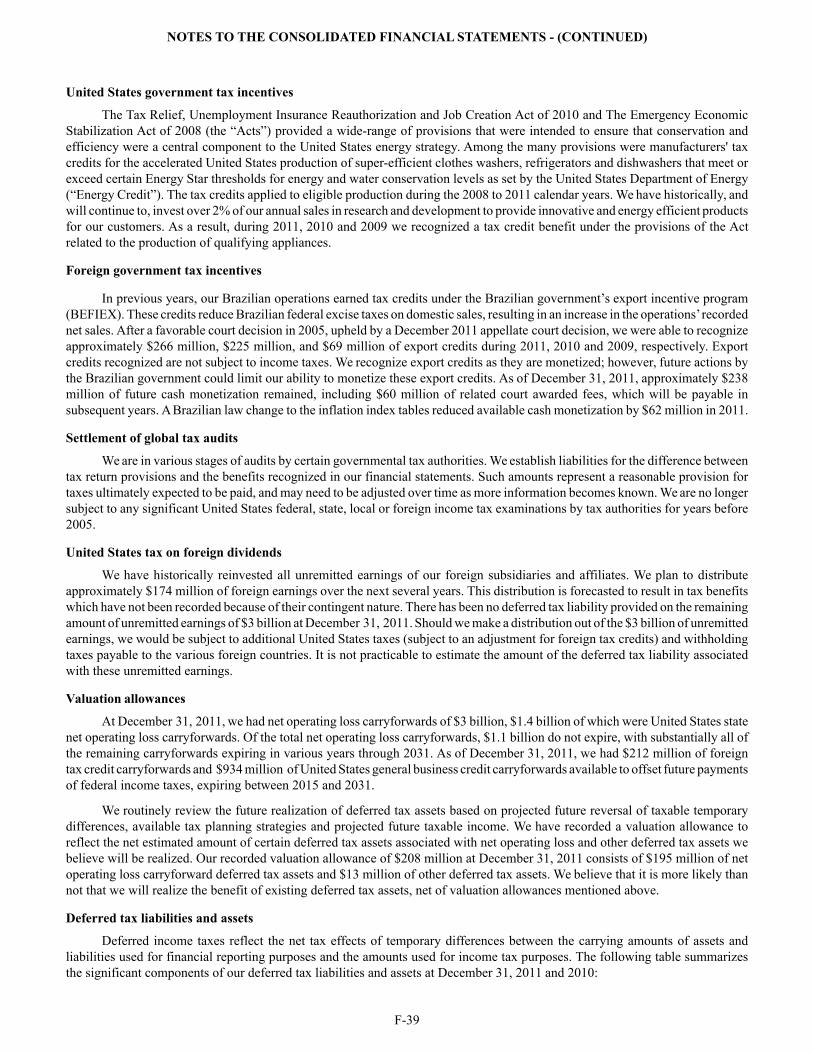
NOTES TO THE CONSOLIDATED FINANCIAL STATEMENTS - (CONTINUED)
F-39
United States government tax incentives
The Tax Relief, Unemployment Insurance Reauthorization and Job Creation Act of 2010 and The Emergency Economic Stabilization Act of 2008 (the “Acts”) provided a wide-range of provisions that were intended to ensure that conservation and efficiency were a central component to the United States energy strategy. Among the many provisions were manufacturers' tax credits for the accelerated United States production of super-efficient clothes washers, refrigerators and dishwashers that meet or exceed certain Energy Star thresholds for energy and water conservation levels as set by the United States Department of Energy (“Energy Credit”). The tax credits applied to eligible production during the 2008 to 2011 calendar years. We have historically, and will continue to, invest over 2% of our annual sales in research and development to provide innovative and energy efficient products for our customers. As a result, during 2011, 2010 and 2009 we recognized a tax credit benefit under the provisions of the Act related to the production of qualifying appliances.
Foreign government tax incentives
In previous years, our Brazilian operations earned tax credits under the Brazilian government’s export incentive program (BEFIEX). These credits reduce Brazilian federal excise taxes on domestic sales, resulting in an increase in the operations’ recorded net sales. After a favorable court decision in 2005, upheld by a December 2011 appellate court decision, we were able to recognize approximately $266 million, $225 million, and $69 million of export credits during 2011, 2010 and 2009, respectively. Export credits recognized are not subject to income taxes. We recognize export credits as they are monetized; however, future actions by the Brazilian government could limit our ability to monetize these export credits. As of December 31, 2011, approximately $238 million of future cash monetization remained, including $60 million of related court awarded fees, which will be payable in subsequent years. A Brazilian law change to the inflation index tables reduced available cash monetization by $62 million in 2011.
Settlement of global tax audits
We are in various stages of audits by certain governmental tax authorities. We establish liabilities for the difference between tax return provisions and the benefits recognized in our financial statements. Such amounts represent a reasonable provision for taxes ultimately expected to be paid, and may need to be adjusted over time as more information becomes known. We are no longer subject to any significant United States federal, state, local or foreign income tax examinations by tax authorities for years before 2005.
United States tax on foreign dividends
We have historically reinvested all unremitted earnings of our foreign subsidiaries and affiliates. We plan to distribute approximately $174 million of foreign earnings over the next several years. This distribution is forecasted to result in tax benefits which have not been recorded because of their contingent nature. There has been no deferred tax liability provided on the remaining amount of unremitted earnings of $3 billion at December 31, 2011. Should we make a distribution out of the $3 billion of unremitted earnings, we would be subject to additional United States taxes (subject to an adjustment for foreign tax credits) and withholding taxes payable to the various foreign countries. It is not practicable to estimate the amount of the deferred tax liability associated with these unremitted earnings.
Valuation allowances
At December 31, 2011, we had net operating loss carryforwards of $3 billion, $1.4 billion of which were United States state net operating loss carryforwards. Of the total net operating loss carryforwards, $1.1 billion do not expire, with substantially all of the remaining carryforwards expiring in various years through 2031. As of December 31, 2011, we had $212 million of foreign tax credit carryforwards and $934 million of United States general business credit carryforwards available to offset future payments of federal income taxes, expiring between 2015 and 2031.
We routinely review the future realization of deferred tax assets based on projected future reversal of taxable temporary differences, available tax planning strategies and projected future taxable income. We have recorded a valuation allowance to reflect the net estimated amount of certain deferred tax assets associated with net operating loss and other deferred tax assets we believe will be realized. Our recorded valuation allowance of $208 million at December 31, 2011 consists of $195 million of net operating loss carryforward deferred tax assets and $13 million of other deferred tax assets. We believe that it is more likely than not that we will realize the benefit of existing deferred tax assets, net of valuation allowances mentioned above.
Deferred tax liabilities and assets
Deferred income taxes reflect the net tax effects of temporary differences between the carrying amounts of assets and liabilities used for financial reporting purposes and the amounts used for income tax purposes. The following table summarizes the significant components of our deferred tax liabilities and assets at December 31, 2011 and 2010:

NOTES TO THE CONSOLIDATED FINANCIAL STATEMENTS - (CONTINUED)
F-40
Millions of dollars
Deferred tax liabilitiesIntangiblesProperty, netLIFO inventoryOther
Total deferred tax liabilitiesDeferred tax assetsU.S. general business credit carryforwards, including Energy Tax CreditsPensionsLoss carryforwardsPostretirement obligationsForeign tax credit carryforwardsResearch and development capitalizationEmployee payroll and benefitsAccrued expensesProduct warranty accrualReceivable and inventory allowancesOther
Total deferred tax assetsValuation allowances for deferred tax assetsDeferred tax assets, net of valuation allowances
Net deferred tax assets
2011
$ 52714930
178884
934468554190212200112946047
1663,037(208)
2,829$ 1,945
2010
$ 57710354
256990
555455351252175153139776848
2122,485(193)
2,292$ 1,302
Unrecognized tax benefits
The following table represents a reconciliation of the beginning and ending amount of unrecognized tax benefits that if recognized would impact the effective tax rate, excluding federal benefits of state and local tax positions, and interest and penalties:
Millions of dollars
Balance, January 1Additions for tax positions of the current yearAdditions for tax positions of prior yearsReductions for tax positions of prior yearsSettlements during the periodLapses of applicable statute of limitation
2011
$ 1909
10(24)(1)(6)
$ 178
2010
$ 1572
83(50)(1)(1)
$ 190
2009
$ 1194125
(16)(2)
(10)$ 157
Additions for tax positions of prior years in 2010 includes $43 million of unrecognized tax positions related to United States transfer pricing and Brazilian income tax on export profits.
Additions for tax positions in 2009 include $7 million of unrecognized tax benefits related to our 2009 settlement with the Brazilian competition commission. See Note 6 of the Notes to the Consolidated Financial Statements for additional information.
It is reasonably possible that certain unrecognized tax benefits of $43 million could be settled with various related jurisdictions during the next 12 months.
Charges related to interest and penalties for unrecognized tax benefits amounted to $17 million, $30 million, and $8 million in 2011, 2010, and 2009, respectively. We have accrued a total of $78 million and $66 million at December 31, 2011 and 2010, respectively.
(12) PENSION AND OTHER POSTRETIREMENT BENEFIT PLANS

NOTES TO THE CONSOLIDATED FINANCIAL STATEMENTS - (CONTINUED)
F-41
We have funded and unfunded defined benefit pension plans that cover certain employees in North America, Europe, Asia and Brazil. The United States plans are frozen for the majority of participants. The formula for United States salaried employees covered under the qualified defined benefit plan was based on years of service and final average salary, while the formula for United States hourly employees covered under the defined benefit plans was based on specific dollar amounts for each year of service. There were multiple formulas for employees covered under the qualified and nonqualified defined benefit plans sponsored by Maytag, including a cash balance formula. In addition, we sponsor an unfunded Supplemental Executive Retirement Plan. This plan is nonqualified and provides certain key employees defined pension benefits that supplement those provided by the company’s other retirement plans.
A defined contribution plan is being provided to all United States employees subsequent to the pension plan freezes and is not classified within the net periodic benefit cost. In January 2012, we began contributing the company match and automatic company contributions (up to 7% of employees’ eligible pay) in company stock. Our contributions during 2011, 2010 and 2009 were $68 million, $65 million and $40 million, respectively. Company matching contributions to our defined contribution plan were suspended from February 2009 to March 2010.
We provide postretirement health care benefits for eligible retired United States employees. Eligible retirees include those who were full-time employees with 10 years of service who attained age 55 while in service with us and those union retirees who met the eligibility requirements of their collective bargaining agreements. In general, the postretirement health care plans are contributory with participants’ contributions adjusted annually and generally include cost-sharing provisions that limit our exposure for recent and future retirees. The plans are unfunded. We reserve the right to modify the benefits in the future. We provide no significant postretirement medical benefits to non-United States employees.
Defined Benefit - Pensions and Postretirement Benefit Plans
Obligations and Funded Status at End of Year
Millions of dollars
Funded statusFair value of plan assetsBenefit obligationsFunded statusAmounts recognized in the statement of financial positionNoncurrent assetCurrent liabilityNoncurrent liabilityAmount recognizedAmounts recognized in accumulated other comprehensiveincome (pre-tax)Net actuarial loss (gain)Prior service (credit) costTransition (asset) obligationAmount recognized
United StatesPension Benefits2011
$ 2,5733,872
$ (1,299)
$ —(8)
(1,291)$ (1,299)
$ 1,510(23)—
$ 1,487
2010
$ 2,2883,605
$ (1,317)
$ —(7)
(1,310)$ (1,317)
$ 1,255(27)—
$ 1,228
Foreign PensionBenefits
2011
$ 170373
$ (203)
$ 5(12)
(196)$ (203)
$ 655
(1)$ 69
2010
$ 172389
$ (217)
$ 5(13)
(209)$ (217)
$ 685
(1)$ 72
Other PostretirementBenefits
2011
$ —488
$ (488)
$ —(58)
(430)$ (488)
$ (1)(296)
1$ (296)
2010
$ —671
$ (671)
$ —(61)
(610)$ (671)
$ 2(224)
1$ (221)

NOTES TO THE CONSOLIDATED FINANCIAL STATEMENTS - (CONTINUED)
F-42
Change in Benefit Obligation
Millions of dollars
Benefit obligation, beginning of yearService costInterest costPlan participants’ contributionsActuarial loss (gain)Benefits paid, net of federal subsidyPlan amendmentsNew plansSettlements / Curtailment loss (gain)Foreign currency exchange ratesBenefit obligation, end of yearAccumulated benefit obligation, end of year
United StatesPension Benefits
2011
$ 3,6052
192—
318(245)
————
$ 3,872$ 3,859
2010
$ 3,6373
200—57
(292)————
$ 3,605$ 3,594
Foreign Pension Benefits2011
$ 3897
202
—(31)———
(14)$ 373$ 353
2010
$ 3836
202
20(45)
210(2)(7)
$ 389$ 359
Other PostretirementBenefits
2011
$ 6718
3110(6)
(74)(148)
——(4)
$ 488$ —
2010
$ 7619
3817
(40)(73)(43)——2
$ 671$ —
During 2011, we modified retiree medical benefits for certain retirees, effective January 1, 2013, to be consistent with those benefits provided by the Whirlpool Corporation Group Benefit Plan. We accounted for these changes as a plan amendment, resulting in a reduction in the postretirement benefit obligation of $148 million with an offset to accumulated other comprehensive loss, net of tax. In response, a similar group of retirees has initiated legal proceedings against Whirlpool asserting the above benefits are vested. We believe the outcome of the legal proceedings against Whirlpool will not have a material adverse effect on our Consolidated Financial Statements.
Change in Plan Assets
Millions of dollars
Fair value of plan assets, beginning of yearActual return on plan assetsEmployer contributionPlan participants’ contributionsGross benefits paidSettlementsForeign currency exchange ratesFair value of plan assets, end of year
United StatesPension Benefits
2011
$ 2,288227303—
(245)——
$ 2,573
2010
$ 2,27326641—
(292)——
$ 2,288
Foreign Pension Benefits2011
$ 1725
252
(31)—(3)
$ 170
2010
$ 17910262
(45)(1)1
$ 172
Other PostretirementBenefits
2011
$ ——6410
(74)——
$ —
2010
$ ——5717
(74)——
$ —
Components of Net Periodic Benefit Cost
Millions of dollars
Service costInterest costExpected return on plan assetsAmortization:
Actuarial lossPrior service cost (credit)
Special termination benefitCurtailment loss (gain)Settlement loss (gain)Net periodic benefit cost
United StatesPension Benefits
2011
$ 2192
(194)
31(3)———
$ 28
2010
$ 3200
(190)
30(3)———
$ 40
2009
$ 11206
(198)
35—174
$ 66
Foreign PensionBenefits
2011
$ 720
(10)
41
——2
$ 24
2010
$ 620
(11)
21
——3
$ 21
2009
$ 620
(11)
31
——(1)
$ 18
Other PostretirementBenefits
2011
$ 831—
1(43)—
(35)—
$ (38)
2010
$ 938—
1(33)—
(62)—
$ (47)
2009
$ 1148—
1(32)—
(95)—
$ (67)
On October 27, 2011 we announced the closure of our manufacturing facilities in Fort Smith, Arkansas and on August 28, 2009, we announced the closure of our manufacturing facility in Evansville, Indiana. Both closures triggered a curtailment in our United States retiree healthcare plan, resulting in curtailment gains of $35 million and $62 million in 2011 and 2010, respectively.

NOTES TO THE CONSOLIDATED FINANCIAL STATEMENTS - (CONTINUED)
F-43
In addition, we recognized a curtailment loss of $7 million during 2009 in our pension plan for Evansville hourly employees. The curtailment gains and loss were recognized in our Consolidated Statement of Income as a component of cost of products sold with an offset to accumulated other comprehensive loss, net of tax.
On February 9, 2009, we announced the suspension of the annual credit to retiree health savings accounts “RHSA” for the majority of active participants. The result of the indefinite suspension was a one-time curtailment gain of $89 million included in net periodic cost with an offset to other comprehensive income, net of tax. During 2009 we recorded $80 million of this gain in our Consolidated Statement of Income as a component of cost of products sold and $9 million was recorded as a component of selling, general and administrative expenses.
Other Changes in Plan Assets and Benefit Obligations Recognized in Other Comprehensive Income (Pre-Tax) in 2011
Millions of dollars
Current year actuarial (gain) lossActuarial (loss) gain recognized during the yearCurrent year prior service cost (credit)Prior service credit (cost) recognized during the yearTotal recognized in other comprehensive income (pre-tax)Total recognized in net periodic benefit costs and othercomprehensive income (pre-tax)
United StatesPension Benefits
$ 285(31)—3
$ 257
$ 285
Foreign PensionBenefits
$ 4(6)—(1)
$ (3)
$ 21
Other PostretirementBenefits
$ (6)2
(148)75
$ (77)
$ (115)
Estimated Pre-Tax Amounts that will be amortized from Accumulated Other Comprehensive Income into Net Periodic Pension Cost in 2012
Millions of dollars
Actuarial lossPrior service (credit) costTotal
United StatesPension Benefits
$ 46(3)
$ 43
Foreign PensionBenefits
$ 31
$ 4
Other Postretirement Benefits
$ 1(46)
$ (45)
Assumptions
Weighted-average assumptions used to determine benefit obligation at end of year
Discount rateRate of compensation increase
United States PensionBenefits
2011
4.80%4.50%
2010
5.60%4.50%
Foreign Pension Benefits2011
5.00%3.50%
2010
5.20%3.50%
Other PostretirementBenefits
2011
4.80%—
2010
5.55%—
Weighted-average assumptions used to determine net periodic cost
Discount rateExpected long-term rate of return on planassetsRate of compensation increaseHealth care cost trend rate
Initial rateUltimate rateYear that ultimate rate will be reached
United States Pension Benefits
2011
5.60%
7.75%4.50%
———
2010
5.75%
7.75%4.50%
———
2009
6.05%
7.75%4.50%
———
Foreign PensionBenefits
2011
5.20%
5.40%3.50%
———
2010
5.40%
5.50%3.50%
———
2009
5.90%
5.90%3.50%
———
Other PostretirementBenefits
2011
5.60%
——
8.00%5.00%2015
2010
5.40%
——
8.00%5.00%2016
2009
5.80%
——
8.00%5.00%2017
Discount rate
For our United States pension and postretirement benefit plans, the discount rate for 2011 and 2010 was selected using a hypothetical portfolio of high quality bonds at December 31 that would provide the necessary cash flows to match our projected benefit payments. Prior to 2010, the discount rate was selected using a cash flow matching technique where projected benefit

NOTES TO THE CONSOLIDATED FINANCIAL STATEMENTS - (CONTINUED)
F-44
payments were matched to a yield curve based on high quality bond yields as of the measurement date. For our foreign pension and postretirement benefit plans, the discount rate was selected using high quality bond yields for the respective country or region covered by the plan.
Expected return on plan assets
In the United States, the expected rate of return on plan assets was determined by using the historical asset returns for publicly traded equity and fixed income securities tracked from 1927 through 2011 and the historical returns for private equity. The historical equity returns were adjusted downward to reflect future expectations. This adjustment was based on published academic research. The expected returns are weighted by the targeted asset allocations. The resulting weighted-average return was rounded to the nearest quarter of one percent.
For foreign pension plans, the expected rate of return on plan assets was determined by observing historical returns in the local fixed income and equity markets and computing the weighted average returns with the weights being the asset allocation of each plan.
Estimated impact of one percentage-point change in assumed health care cost trend rate
A one percentage point change in assumed health care cost trend rates would have the following effects on our health care plan:
Millions of dollars
Effect on total of service and interest costEffect on postretirement benefit obligations
One PercentagePoint Increase
$ 210
One PercentagePoint Decrease
$ (1)(9)
Cash Flows
Funding Policy
Our funding policy is to contribute to our United States pension plans amounts sufficient to meet the minimum funding requirement as defined by employee benefit and tax laws, plus additional amounts which we may determine to be appropriate. In certain countries other than the United States, the funding of pension plans is not common practice. Contributions to our United States pension plans may be made in the form of cash or company stock. We pay for retiree medical benefits as they are incurred.
Expected Employer Contributions to Funded Plans
Millions of dollars
2012
United StatesPension Benefits(1)
$ 220
Foreign PensionBenefits
$ 111
Contributions include $180 million of minimum contributions required by law.

NOTES TO THE CONSOLIDATED FINANCIAL STATEMENTS - (CONTINUED)
F-45
Expected Benefit Payments
Millions of dollars
201220132014201520162017-2021
United States Pension Benefits
$ 307266261258264
1,278
Foreign PensionBenefits
$ 2220242222
130
Other PostretirementBenefits
$ 5851504844
177
Plan Assets
Our overall investment strategy is to achieve an appropriate mix of investments for long-term growth and for near-term benefit payments with a wide diversification of asset types, fund strategies, and investment fund managers. The target allocation for plan assets is generally 50% equity and 50% fixed income, with exceptions for certain foreign pension plans. Of the target allocation for equity securities, approximately 50% is allocated to United States large-cap, 30% to international equity, 13% to United States mid and small-cap companies and 7% in venture capital). The target allocation for fixed income is allocated evenly with 75% to corporate bonds and 25% to United States treasury and other government securities. The fixed income securities duration is intended to match that of our United States pension liabilities.
As a basis for considering such assumptions, a three-tiered fair value hierarchy is established, which prioritizes the inputs used in measuring fair value as follows: (Level 1) observable inputs such as quoted prices in active markets; (Level 2) inputs, other than the quoted prices in active markets that are observable, either directly or indirectly; and (Level 3) unobservable inputs in which there is little or no market data, which require the reporting entity to develop its own assumptions. We manage the process and approve the results of a third party pricing service to value the majority of our securities and to determine the appropriate level in the fair value hierarchy. The fair values of our pension plan assets at December 31, 2011 and 2010, by asset category were as follows:
Millions of dollars
Cash and cash equivalentsGovernment and government agency securities(a)
U.S. securitiesInternational securities
Corporate bonds and notes (a)
U.S. companiesInternational companies
Equity securities (b)
U.S. companiesInternational companies
Mutual funds (c)
Common and collective funds (d)
U.S. equity securitiesInternational equity securitiesShort-term investment fund
Limited partnerships (e)
U.S. private equity investmentsDiversified fund of fundsEmerging growth
Real estate (f)
All other investments
December 31,
Quoted prices(Level 1)
2011
$ 1
——
——
1815790
———
—————
$ 329
2010
$ 6
——
——
21579
118
———
—————
$ 418
Other significantobservable inputs
(Level 2)2011
43250
692212
———
51724552
———1011
$ 2,221
2010
$ —
39417
387131
———
55531934
———9
22$ 1,868
Significantunobservable inputs
(Level 3)2011
$ —
——
——
———
———
1374214——
$ 193
2010
$ —
——
——
———
———
1164117——
$ 174
Total2011
$ 1
43250
692212
1815790
51724552
13742141011
$ 2,743
2010
$ 6
39417
387131
21579
118
55531934
11641179
22$ 2,460

NOTES TO THE CONSOLIDATED FINANCIAL STATEMENTS - (CONTINUED)
F-46
(a) Valued using pricing vendors who use proprietary models to estimate the price a dealer would pay to buy a security using significant observable inputs, such as interest rates, yield curves, and credit risk.
(b) Valued using the closing stock price on a national securities exchange, which reflects the last reported sales price on the last business day of the year.(c) Valued using the net asset value (NAV) of the fund, which is based on the fair value of underlying securities. The fund primarily invests in a diversified
portfolio of equity securities issued by non-U.S. companies.(d) Valued using the NAV of the fund, which is based on the fair value of underlying securities.(e) Valued at estimated fair value based on the proportionate share of the limited partnerships fair value, as determined by the general partner.(f) Valued using the NAV of the fund, which is based on the fair value of underlying securities.
Fair Value Measurements Using Significant Unobservable Inputs (Level 3)
Millions of dollars
Balance, December 31, 2010Realized gainsUnrealized gainsPurchasesSettlements
Balance, December 31, 2011
LimitedPartnerships
$ 174112021
(33)$ 193
Additional Information
The projected benefit obligation and fair value of plan assets for pension plans with a projected benefit obligation in excess of plan assets at December 31, 2011 and 2010 were as follows:
Millions of dollars
Projected benefit obligationFair value of plan assets
United StatesPension Benefits
2011
$ 3,8722,573
2010
$ 3,6052,288
Foreign Pension Benefits2011
$ 29789
2010
$ 27653
The projected benefit obligation, accumulated benefit obligation and fair value of plan assets for pension plans with an accumulated benefit obligation in excess of plan assets at December 31, 2011 and 2010 were as follows:
Millions of dollars
Projected benefit obligationAccumulated benefit obligationFair value of plan assets
United StatesPension Benefits
2011
$ 3,8723,8592,573
2010
$ 3,6053,5942,288
Foreign Pension Benefits2011
$ 25324148
2010
$ 25324445
(13) OPERATING SEGMENT INFORMATION
Operating segments are defined as components of an enterprise about which separate financial information is available that is evaluated on a regular basis by the chief operating decision maker, or decision making group, in deciding how to allocate resources to an individual segment and in assessing performance.
We identify such segments based upon geographical regions of operations because each operating segment manufactures home appliances and related components, but serves strategically different markets. The chief operating decision maker evaluates performance based upon each segment’s operating income, which is defined as income before interest and sundry income (expense), interest expense, income taxes, noncontrolling interests and restructuring costs. Total assets by segment are those assets directly associated with the respective operating activities. The “Other/Eliminations” column primarily includes corporate expenses, assets and eliminations, as well as all other restructuring expenses. Intersegment sales are eliminated within each region except compressor sales out of Latin America, which are included in Other/Eliminations.
Sales activity with Lowe’s, a North American major home appliance retailer, represented $1.6 billion, $1.7 billion and $1.5 billion of consolidated net sales in 2011, 2010 and 2009, respectively. Sales activity with Sears, a North American major home appliance retailer, represented $1.4 billion, $1.5 billion and $1.7 billion of consolidated net sales in 2011, 2010 and 2009, respectively.
We conduct business in two countries, the United States and Brazil, that individually comprised over 10% of consolidated net sales or long-lived assets within the last three years. The following table summarizes net sales and long-lived assets by geographic

NOTES TO THE CONSOLIDATED FINANCIAL STATEMENTS - (CONTINUED)
F-47
area:
Millions of dollars
2011:Sales to external customersLong-lived assets2010:Sales to external customersLong-lived assets2009:Sales to external customersLong-lived assets
United States
$ 8,0354,464
$ 8,2214,431
$ 8,1744,443
Brazil
$ 3,133405
$ 3,290459
$ 2,530437
All OtherCountries
$ 7,4981,717
$ 6,8551,764
$ 6,3951,762
Total
$ 18,6666,586
$ 18,3666,654
$ 17,0996,642
As described above, our chief operating decision maker reviews each operating segment’s performance based upon operating income which excludes restructuring costs. These restructuring costs are included in operating profit on a consolidated basis and included in the Other/Eliminations column in the tables below.
Millions of dollars
Net sales201120102009
Intersegment sales201120102009
Depreciation and amortization201120102009
Restructuring costs201120102009
Operating profit (loss)201120102009
Total assets201120102009
Capital expenditures201120102009
OPERATING SEGMENTS
NorthAmerica
$ 9,5829,7849,592
$ 216201142
$ 290297280
$ 924235
$ 398461560
$ 7,8948,1638,123
$ 316330276
LatinAmerica
$ 5,0624,6943,705
$ 187233237
$ 1019277
$ 325
$ 642668363
$ 3,6203,6182,887
$ 11210878
EMEA
$ 3,3053,2273,338
$ 167257339
$ 110107107
$ 392874
$ 110221
$ 2,8393,1443,216
$ 10398
116
Asia
$ 881855654
$ 217197169
$ 212018
$ 1—10
$ 303430
$ 797775690
$ 272213
Other/Eliminations
$ (164)(194)(190)
$ (787)(888)(887)
$ 363943
$ 122
$ (279)(257)(286)
$ 31(116)178
$ 503558
TotalWhirlpool
$ 18,66618,36617,099
$ ———
$ 558555525
$ 13674
126
$ 7921,008
688
$ 15,18115,58415,094
$ 608593541

NOTES TO THE CONSOLIDATED FINANCIAL STATEMENTS - (CONTINUED)
F-48
(14) QUARTERLY RESULTS OF OPERATIONS (UNAUDITED)
Millions of dollars, except per share data
Net salesCost of products soldNet earnings (loss)Net earnings (loss) available to Whirlpool
Per share of common stock: (1)
Basic net earnings (loss)Diluted net earnings (loss)Dividends
Market price range of common stock: (2)
HighLowClose
Three months endedDec. 31
2011
$ 4,9104,198
213205
2.662.620.50
$ 62.0045.2247.45
2010
$ 5,0414,375
178171
2.232.190.43
$ 91.2872.9588.83
Sept. 302011
$ 4,6254,052
181177
2.312.270.50
$ 82.9947.3549.91
2010
$ 4,5193,871
8379
1.041.020.43
$ 96.9071.0080.96
Jun. 302011
$ 4,7304,061(164)(161)
(2.10)(2.10)0.50
$ 92.0072.4881.32
2010
$ 4,5343,773
215205
2.692.640.43
$118.4486.8687.82
Mar. 312011
$ 4,4013,778
178169
2.212.170.43
$ 92.2879.1585.36
2010
$ 4,2723,633
174164
2.172.130.43
$ 91.1173.3087.25
1 The quarterly earnings per share amounts will not necessarily add to the earnings per share computed for the year due to the method used in calculating pershare data.
2Composite price as reported by the New York Stock Exchange.

F-49
Report by Management on the Consolidated Financial Statements
The management of Whirlpool Corporation has prepared the accompanying financial statements. The financial statements have been audited by Ernst & Young LLP, an independent registered public accounting firm, whose report, based upon their audits, expresses the opinion that these financial statements present fairly the consolidated financial position, statements of income and cash flows of Whirlpool and its subsidiaries in accordance with accounting principles generally accepted in the United States. Their audits are conducted in conformity with the auditing standards of the Public Company Accounting Oversight Board (United States).
The financial statements were prepared from the Company’s accounting records, books and accounts which, in reasonable detail, accurately and fairly reflect all material transactions. The Company maintains a system of internal controls designed to provide reasonable assurance that the Company’s books and records, and the Company’s assets are maintained and accounted for, in accordance with management’s authorizations. The Company’s accounting records, compliance with policies and internal controls are regularly reviewed by an internal audit staff.
The audit committee of the Board of Directors of the Company is composed of five independent directors who, in the opinion of the board, meet the relevant financial experience, literacy, and expertise requirements. The audit committee provides independent and objective oversight of the Company’s accounting functions and internal controls and monitors (1) the objectivity of the Company’s financial statements, (2) the Company’s compliance with legal and regulatory requirements, (3) the independent registered public accounting firm’s qualifications and independence, and (4) the performance of the Company’s internal audit function and independent registered public accounting firm. In performing these functions, the committee has the responsibility to review and discuss the annual audited financial statements and quarterly financial statements and related reports with management and the independent registered public accounting firm, including the Company’s disclosures under “Management’s Discussion and Analysis of Financial Condition and Results of Operations,” to monitor the adequacy of financial disclosure. The committee also has the responsibility to retain and terminate the Company’s independent registered public accounting firm and exercise the committee’s sole authority to review and approve all audit engagement fees and terms and pre-approve the nature, extent, and cost of all non-audit services provided by the independent registered public accounting firm.
/s/ LARRY M. VENTURELLI
Larry M. VenturelliExecutive Vice President and Chief Financial OfficerFebruary 22, 2012

F-50
Management’s Report on Internal Control Over Financial Reporting
The management of Whirlpool Corporation is responsible for establishing and maintaining adequate internal control over financial reporting as defined in Rules 13a – 15(f) and 15d – 15(f) under the Securities Exchange Act of 1934. Whirlpool’s internal control system is designed to provide reasonable assurance to Whirlpool’s management and board of directors regarding the reliability of financial reporting and the preparation and fair presentation of published financial statements.
All internal control systems, no matter how well designed, have inherent limitations. Therefore, even those systems determined to be effective can provide only reasonable assurance with respect to financial statement preparation and presentation.
The management of Whirlpool assessed the effectiveness of Whirlpool’s internal control over financial reporting as of December 31, 2011. In making this assessment, it used the criteria set forth by the Committee of Sponsoring Organizations of the Treadway Commission (COSO) in Internal Control—Integrated Framework. Based on our assessment and those criteria, management believes that Whirlpool maintained effective internal control over financial reporting as of December 31, 2011.
Whirlpool’s independent registered public accounting firm has issued an audit report on its assessment of Whirlpool’s internal control over financial reporting. This report appears on page F-52.
/s/ JEFF M. FETTIG
Jeff M. FettigChairman of the Board andChief Executive OfficerFebruary 22, 2012
/s/ LARRY M. VENTURELLI
Larry M. VenturelliExecutive Vice President andChief Financial OfficerFebruary 22, 2012

F-51
Report of Independent Registered Public Accounting Firm
The Stockholders and Board of DirectorsWhirlpool Corporation
We have audited the accompanying consolidated balance sheets of Whirlpool Corporation as of December 31, 2011 and 2010, and the related consolidated statements of income, changes in stockholders’ equity and cash flows for each of the three years in the period ended December 31, 2011. Our audits also included the financial statement schedule listed in the index at Item 15(a). These financial statements and schedule are the responsibility of the Company’s management. Our responsibility is to express an opinion on these financial statements and schedule based on our audits.
We conducted our audits in accordance with the standards of the Public Company Accounting Oversight Board (United States). Those standards require that we plan and perform the audit to obtain reasonable assurance about whether the financial statements are free of material misstatement. An audit includes examining, on a test basis, evidence supporting the amounts and disclosures in the financial statements. An audit also includes assessing the accounting principles used and significant estimates made by management, as well as evaluating the overall financial statement presentation. We believe that our audits provide a reasonable basis for our opinion.
In our opinion, the financial statements referred to above present fairly, in all material respects, the consolidated financial position of Whirlpool Corporation at December 31, 2011 and 2010, and the consolidated results of its operations and its cash flows for each of the three years in the period ended December 31, 2011, in conformity with U.S. generally accepted accounting principles. Also in our opinion, the related financial statement schedule, when considered in relation to the basic financial statements taken as a whole, presents fairly, in all material respects, the information set forth therein.
We also have audited, in accordance with the standards of the Public Company Accounting Oversight Board (United States), Whirlpool Corporation’s internal control over financial reporting as of December 31, 2011, based on criteria established in Internal Control—Integrated Framework issued by the Committee of Sponsoring Organizations of the Treadway Commission and our report dated February 22, 2012 expressed an unqualified opinion thereon.
/s/ ERNST & YOUNG LLP
Chicago, IllinoisFebruary 22, 2012

F-52
Report of Independent Registered Public Accounting Firm
The Stockholders and Board of DirectorsWhirlpool Corporation
We have audited Whirlpool Corporation’s internal control over financial reporting as of December 31, 2011, based on criteria established in Internal Control—Integrated Framework issued by the Committee of Sponsoring Organizations of the Treadway Commission (the COSO criteria). Whirlpool Corporation’s management is responsible for maintaining effective internal control over financial reporting, and for its assessment of the effectiveness of internal control over financial reporting included in the accompanying Management’s Report on Internal Control Over Financial Reporting. Our responsibility is to express an opinion on the company’s internal control over financial reporting based on our audit.
We conducted our audit in accordance with the standards of the Public Company Accounting Oversight Board (United States). Those standards require that we plan and perform the audit to obtain reasonable assurance about whether effective internal control over financial reporting was maintained in all material respects. Our audit included obtaining an understanding of internal control over financial reporting, assessing the risk that a material weakness exists, testing and evaluating the design and operating effectiveness of internal control based on the assessed risk, and performing such other procedures as we considered necessary in the circumstances. We believe that our audit provides a reasonable basis for our opinion.
A company’s internal control over financial reporting is a process designed to provide reasonable assurance regarding the reliability of financial reporting and the preparation of financial statements for external purposes in accordance with generally accepted accounting principles. A company’s internal control over financial reporting includes those policies and procedures that (1) pertain to the maintenance of records that, in reasonable detail, accurately and fairly reflect the transactions and dispositions of the assets of the company; (2) provide reasonable assurance that transactions are recorded as necessary to permit preparation of financial statements in accordance with generally accepted accounting principles, and that receipts and expenditures of the company are being made only in accordance with authorizations of management and directors of the company; and (3) provide reasonable assurance regarding prevention or timely detection of unauthorized acquisition, use or disposition of the company’s assets that could have a material effect on the financial statements.
Because of its inherent limitations, internal control over financial reporting may not prevent or detect misstatements. Also, projections of any evaluation of effectiveness to future periods are subject to the risk that controls may become inadequate because of changes in conditions, or that the degree of compliance with the policies or procedures may deteriorate.
In our opinion, Whirlpool Corporation maintained, in all material respects, effective internal control over financial reporting as of December 31, 2011, based on the COSO criteria.
We also have audited, in accordance with the standards of the Public Company Accounting Oversight Board (United States), the consolidated balance sheets of Whirlpool Corporation as of December 31, 2011 and 2010, and the related consolidated statements of income, changes in stockholders’ equity, and cash flows for each of the three years in the period ended December 31, 2011, and our report dated February 22, 2012 expressed an unqualified opinion thereon.
/s/ ERNST & YOUNG LLP
Chicago, IllinoisFebruary 22, 2012

F-53
SCHEDULE II—VALUATION AND QUALIFYING ACCOUNTSWHIRLPOOL CORPORATION AND SUBSIDIARIES
Years Ended December 31, 2011, 2010 and 2009 (millions of dollars)
COL. A
Description
Year Ended December 31, 2011:Allowance for doubtful accounts— accounts receivableYear Ended December 31, 2010:Allowance for doubtful accounts— accounts receivableYear Ended December 31, 2009:Allowance for doubtful accounts— accounts receivable
COL. B
Balance at Beginningof Period
$ 66
76
66
COL. C
ADDITIONS(1)
Charged to Costsand Expenses
$ 17
17
28
(2)Charged to OtherAccounts / Other
$ —
—
—
COL. D
Deductions—Describe (A)
$ (22)
(27)
(18)
COL. E
Balance at Endof Period
$ 61
66
76
Note A—The amounts represent accounts charged off, less recoveries of $0 in 2009 through 2011, translation adjustments and transfers.

[THIS PAGE INTENTIONALLY LEFT BLANK]

E-1
ANNUAL REPORT ON FORM 10-KITEMS 15(a)(3) and 15(c)
EXHIBIT INDEXYEAR ENDED DECEMBER 31, 2011
The following exhibits are submitted herewith or incorporated herein by reference in response to Items 15(a)(3) and 15(c). Each exhibit that is considered a management contract or compensatory plan or arrangement required to be filed pursuant to Item 15(a)(3) of Form 10-K is identified by a “(Z).”
Number and Description of Exhibit
3(i)
3(ii)
4(i)
4(ii)
4(iii)
4(iv)
4(v)
4(vi)
4(vii)
4(viii)
4(ix)
10(i)(a)
10(i)(b)
Restated Certificate of Incorporation of Whirlpool Corporation (amended and restated as of April 22, 2009).[Incorporated by reference from Exhibit 3.1 to the Company’s Form 8-K filed on April 23, 2009]
By-Laws of Whirlpool Corporation (amended and restated as of April 21, 2009). [Incorporated by reference fromExhibit 3.2 to the Company’s Form 8-K filed on April 23, 2009]
The registrant hereby agrees to furnish to the Securities and Exchange Commission, upon request, a copy ofinstruments defining the rights of holders of each issue of long-term debt of the registrant and its subsidiaries.
Indenture dated as of April 15, 1990 between Whirlpool Corporation and Citibank, N.A. [Incorporated byreference from Exhibit 4(a) to the Company's Registration Statement on Form S-3 filed on May 6, 1991]
Indenture dated as of March 20, 2000 between Whirlpool Corporation and U.S. Bank, National Association (assuccessor to Citibank, N.A.) [Incorporated by reference from Exhibit 4(a) to the Company’s RegistrationStatement on Form S-3 filed on March 21, 2000]
Indenture dated as of June 15, 1987 between Maytag Corporation and The First National Bank of Chicago.[Incorporated by reference from Maytag Corporation’s Quarterly Report on Form 10-Q for the quarter endedJune 30, 1987]
First Supplemental Indenture dated as of September 1, 1989 between Maytag Corporation and The First NationalBank of Chicago. [Incorporated by reference from Exhibit 4.3 to Maytag Corporation’s Form 8-K datedSeptember 28, 1989]
Ninth Supplemental Indenture dated as of October 30, 2001 between Maytag Corporation and Bank One,National Association. [Incorporated by reference from Exhibit 4.1 to Maytag Corporation’s Form 8-K filed onOctober 31, 2001]
Tenth Supplemental Indenture dated as of December 30, 2010, between Maytag Corporation, WhirlpoolCorporation and The Bank of New York Mellon Trust Company, N.A. [Incorporated by reference from Exhibit 4(vi) to the Company's Annual Report on Form 10-K for the fiscal year ended December 31, 2010]
Form of 8% Notes due 2012 and Form of 8.6% Notes due 2014, issued under the Indenture dated as of March 20, 2000 between Whirlpool Corporation and U.S. Bank, National Association (as successor to Citibank, N.A.). [Incorporated by reference from Annex A and Annex B, respectively, to the Certificate of Designated Officers, Exhibit 4.1 to the Company's Form 8-K filed on May 5, 2009]
Form of 4.850% Notes due 2021 issued under the Indenture dated as of March 20, 2000 between Whirlpool Corporation and U.S. Bank, National Association (as successor to Citibank, N.A.) [Incorporated by reference from Annex A to the Certificate of Designated Officers, Exhibit 4.1 to the Company's Form 8-K filed on June 7, 2011]
Amended and Restated Long-Term Credit Agreement dated as of June 28, 2011 among Whirlpool Corporation,Whirlpool Europe B.V., Whirlpool Finance B.V., Whirlpool Canada Holding Co., Certain Financial Institutionsand JPMorgan Chase Bank, N.A., as Administrative Agent and Fronting Agent and The Royal Bank of ScotlandPLC, as Syndication Agent, BNP Paribas and Citibank, N.A., as Documentation Agents, J.P. Morgan SecuritiesLLC and RBS Securities Inc., as Joint Lead Arrangers and Joint Bookrunners. [Incorporated by reference fromExhibit 10.1 to the Company's Form 8-K filed on July 1, 2011]
Terms Agreement dated February 25, 2008 among Whirlpool, Banc of America Securities LLC and Greenwich Capital Markets, Inc. [Incorporated by reference from Exhibit 1.2 to the Company's Form 8-K filed on February 27, 2008]

E-2
Number and Description of Exhibit
10(iii)(a)
10(iii)(b)
10(iii)(c)
10(iii)(d)
10(iii)(e)
10(iii)(f)
10(iii)(g)
10(iii)(h)
10(iii)(i)
10(iii)(j)
10(iii)(k)
10(iii)(l)
10(iii)(m)
Whirlpool Corporation Nonemployee Director Stock Ownership Plan (amended as of February 16, 1999,effective April 20, 1999). (Z) [Incorporated by reference from Exhibit A to the Company’s Proxy Statement forthe 1999 annual meeting of stockholders]
Whirlpool Corporation Charitable Award Contribution and Additional Life Insurance Plan for Directors (effectiveApril 20, 1993). (Z) [Incorporated by reference from Exhibit 10(iii)(p) to the Company’s Annual Report on Form10-K for the fiscal year ended December 31, 1994]
Whirlpool Corporation Deferred Compensation Plan for Directors (as amended effective January 1, 1992 andApril 20, 1993). (Z) [Incorporated by reference from Exhibit 10(iii)(f) to the Company’s Annual Report on Form10-K for the fiscal year ended December 31, 1993]
Whirlpool Corporation Deferred Compensation Plan II for Non-Employee Directors (as amended and restated,effective January 1, 2009). (Z) [Incorporated by reference from Exhibit 10(iii)(e) to the Company’s AnnualReport on Form 10-K for the fiscal year ended December 31, 2008]
Whirlpool Corporation Nonemployee Director Equity Plan (effective January 1, 2005). (Z) [Incorporated byreference from Exhibit 99.1 to the Company’s Form 8-K filed on April 21, 2005]
Amendment of the Whirlpool Corporation Nonemployee Director Equity Plan (effective January 1, 2008). (Z)[Incorporated by reference to Exhibit 10(iii)(a) to the Company’s Quarterly Report on Form 10-Q filed on April24, 2008]
Nonemployee Director Stock Option Form of Agreement. (Z) [Incorporated by reference from Exhibit 10(iii)(b)to the Company’s Quarterly Report on Form 10-Q filed on April 24, 2008]
Nonemployee Director Stock Option Form of Agreement (Z) [Incorporated by reference from Exhibit 10.2 to theCompany’s Form 8-K filed on April 26, 2010]
Whirlpool Corporation 1996 Omnibus Stock and Incentive Plan (as amended, effective February 16, 1999). (Z)[Incorporated by reference from Exhibit 10(iii)(r) to the Company’s Annual Report on Form 10-K for the fiscalyear ended December 31, 1999]
Whirlpool Corporation 1998 Omnibus Stock and Incentive Plan (as amended, effective February 16, 1999). (Z)[Incorporated by reference from Exhibit 10(iii)(s) to the Company’s Annual Report on Form 10-K for the fiscalyear ended December 31, 1999]
Whirlpool Corporation 2000 Omnibus Stock and Incentive Plan (effective January 1, 2000). (Z) [Incorporated byreference from Exhibit A to the Company’s Proxy Statement for the 2000 annual meeting of stockholders]
Whirlpool Corporation 2002 Omnibus Stock and Incentive Plan (effective January 1, 2002). (Z) [Incorporated byreference from Exhibit A to the Company’s Proxy Statement for the 2002 annual meeting of stockholders]
Whirlpool Corporation 2007 Omnibus Stock and Incentive Plan (effective January 1, 2007). (Z) [Incorporated byreference from Annex A to the Company’s Proxy Statement for the 2007 annual meeting of stockholders]
10(iii)(n)
10(iii)(o)
10(iii)(p)
Number and Description of Exhibit
Omnibus Equity Plans 409A Amendment (effective December 19, 2008). (Z) [Incorporated by reference fromExhibit 10(iii)(n) to the Company’s Annual Report on Form 10-K for the fiscal year ended December 31,2008]
Whirlpool Corporation 2010 Omnibus Stock and Incentive Plan (Z) [Incorporated by reference from Exhibit10.1 to the Company’s Form 8-K filed on April 26, 2010]
Form of Agreement for the Whirlpool Corporation Career Stock Grant Program (pursuant to one or more ofWhirlpool’s Omnibus Stock and Incentive Plans). (Z) [Incorporated by reference from Exhibit 10(iii)(q) to theCompany’s Annual Report on Form 10-K for the fiscal year ended December 31, 1995]

E-3
10(iii)(q)
10(iii)(r)
10(iii)(s)
10(iii)(t)
10(iii)(u)
10(iii)(v)
10(iii)(w)
10(iii)(x)
10(iii)(y)
10(iii)(z)
10(iii)(aa)
10(iii)(bb)
10(iii)(cc)
10(iii)(dd)
10(iii)(ee)
Number and Description of Exhibit
Form of Amendment to Whirlpool Corporation Career Stock Grant Agreement. (Z) [Incorporated by referencefrom Exhibit 10(iii)(p) to the Company’s Annual Report on Form 10-K for the fiscal year ended December 31,2008]
Form of Stock Option Grant Document for the Whirlpool Corporation Stock Option Program (pursuant to oneor more of Whirlpool’s Omnibus Stock and Incentive Plans)(Rev. 02/17/04). (Z) [Incorporated by referencefrom Exhibit 10(i) to the Company’s Form 8-K filed on January 25, 2005]
Administrative Guidelines for the Whirlpool Corporation Special Retention Program (pursuant to one or moreof Whirlpool’s Omnibus Stock and Incentive Plans). (Z) [Incorporated by reference from Exhibit 10(iii)(w) tothe Company’s Annual Report on Form 10-K for the fiscal year ended December 31, 2001]
Addendum to Whirlpool Corporation Special Retention Program Features (effective January 1, 2005). (Z)[Incorporated by reference from Exhibit 10(iii)(s) to the Company’s Annual Report on Form 10-K for the fiscalyear ended December 31, 2008]
Form of Whirlpool Corporation Strategic Excellence Program Grant Document (pursuant to one or more ofWhirlpool’s Omnibus Stock and Incentive Plans)(Rev. 02/17/04). (Z) [Incorporated by reference from Exhibit10(ii) to the Company’s Form 8-K filed on January 25, 2005]
Form of Restricted Stock Unit Agreement (pursuant to one or more of Whirlpool’s Omnibus Stock andIncentive Plans) (Z) [Incorporated by reference from Exhibit 10.1 to the Company’s Form 8-K filed on June21, 2010]
Whirlpool Corporation 2010 Omnibus Stock and Incentive Plan Restricted Stock Unit Award (Z) [Incorporatedby reference from Exhibit 10(iii)(a) to the Company's Form 10-Q for the quarter ended March 31, 2011]
Whirlpool Corporation 2010 Omnibus Stock and Incentive Plan Strategic Excellence Program PerformanceUnit Award (Z) [Incorporated by reference from Exhibit 10(iii)(b) to the Company's Form 10-Q for the quarterended March 31, 2011]
Whirlpool Corporation 2010 Omnibus Stock and Incentive Plan Strategic Excellence Program Stock OptionGrant (Z) [Incorporated by reference from Exhibit 10(iii)(c) to the Company's Form 10-Q for the quarter endedMarch 31, 2011]
Whirlpool Corporation 2010 Omnibus Stock and Incentive Plan Strategic Excellence Program Restricted StockUnit Award (Z) [Incorporated by reference from Exhibit 10(iii)(d) to the Company's Form 10-Q for the quarterended March 31, 2011]
Form of Compensation and Benefits Assurance Agreements (Z) [Incorporated by reference from Exhibit 10.1to the Company’s Form 8-K filed on August 23, 2010]
Whirlpool Corporation Performance Excellence Plan. (Z) [Incorporated by reference from Exhibit 10.1 to theCompany’s Form 8-K filed on April 23, 2009]
Whirlpool Corporation Executive Deferred Savings Plan (as amended effective January 1, 1992). (Z)[Incorporated by reference from Exhibit 10(iii)(n) to the Company’s Annual Report on Form 10-K for thefiscal year ended December 31, 1993]
Whirlpool Corporation Executive Deferred Savings Plan II (as amended and restated, effective January 1,2009), including Supplement A, Whirlpool Executive Restoration Plan (as amended and restated, effectiveJanuary 1, 2009). (Z) [Incorporated by reference from Exhibit 10(iii)(y) to the Company’s Annual Report onForm 10-K for the fiscal year ended December 31, 2008]
Amendment to the Whirlpool Corporation Executive Deferred Savings Plan II (dated December 21, 2009). (Z)[Incorporated by reference from Exhibit 10(iii)(x) to the Company’s Annual Report on Form 10-K for thefiscal year ended December 31, 2009]

E-4
10(iii)(ff)
10(iii)(gg)
10(iii)(hh)
Whirlpool Corporation Executive Officer Bonus Plan (effective January 1, 1994). (Z) [Incorporated byreference from Exhibit 10(iii)(o) to the Company’s Annual Report on Form 10-K for the fiscal year endedDecember 31, 1994]
Amendment to Whirlpool Corporation Executive Officer Bonus Plan (effective January 1, 2009). (Z)[Incorporated by reference from Exhibit 10(iii)(aa) to the Company’s Annual Report on Form 10-K for thefiscal year ended December 31, 2008]
Whirlpool Retirement Benefits Restoration Plan (as amended and restated effective January 1, 2009). (Z)[Incorporated by reference from Exhibit 10(iii)(dd) to the Company’s Annual Report on Form 10-K for thefiscal year ended December 31, 2008]
10(iii)(ii)
10(iii)(jj)
10(iii)(kk)
12
21
23
24
31(a)
31(b)
32
101.INS
101.SCH
101.CAL
101.LAB
101.PRE
101.DEF
Whirlpool Supplemental Executive Retirement Plan (as amended and restated, effective January 1, 2009). (Z)[Incorporated by reference from Exhibit 10(iii)(ee) to the Company’s Annual Report on Form 10-K for thefiscal year ended December 31, 2008]
Whirlpool Corporation Form of Indemnity Agreement. (Z) [Incorporated by reference from Exhibit 10.1 to theCompany’s Form 8-K filed on February 23, 2006]
Employment Agreement with Jose A. Drummond dated October 1, 2008. (Z) [Incorporated by reference from Exhibit 10(iii)(gg) to the Company's Annual Report on Form 10-K for the fiscal year ended December 31, 2010]
Ratio of Earnings to Fixed Charges
List of Subsidiaries
Consent of Independent Registered Public Accounting Firm
Power of Attorney
Certification of Chief Executive Officer, Pursuant to Section 302 of the Sarbanes-Oxley Act of 2002
Certification of Chief Financial Officer, Pursuant to Section 302 of the Sarbanes-Oxley Act of 2002
Certifications Pursuant to 18 U.S.C. Section 1350, as Adopted Pursuant to Section 906 of the Sarbanes-OxleyAct of 2002
XBRL Instance Document
XBRL Taxonomy Extension Schema Document
XBRL Taxonomy Extension Calculation Linkbase Document
XBRL Taxonomy Extension Label Linkbase Document
XBRL Taxonomy Extension Presentation Linkbase Document
XBRL Taxonomy Extension Definition Linkbase Document

EXHIBIT 12- RATIO OF EARNINGS TO FIXED CHARGES
WHIRLPOOL CORPORATION AND SUBSIDIARIES
EarningsEarnings before income taxesFixed charges
Fixed chargesPortion of rents representative of the interest factorInterest on indebtednessAmortization of debt financing fees
Ratio of earnings to fixed charges
Year Ended December 31,
2011
$ (28)277
$ 249
$ 55213
9$ 277
0.9
2010
$ 586293
$ 879
$ 5422514
$ 2933.0
2009
$ 293280
$ 573
$ 52219
9$ 280
2.0
2008
$ 246256
$ 502
$ 51203
2$ 256
2.0
2007
$ 804250
$ 1,054
$ 46203
1$ 250
4.2

Exhibit 21
WHIRLPOOL CORPORATION List of Subsidiaries
Subsidiary and Name Under Which It Does Business
1900 Holdings CorporationA & E Factory Service, LLCAlno AGBUD Comércio de Eletrodomésticos Ltda.BWI Products Italia s.r.l.BWI Products LimitedBauknecht AGBauknecht Hausgeräte GmbHBauknecht LimitedBeijing Embraco Snowflake Compressor Company LimitedBill Page Orchestra, Inc.Brasmotor S.A.Comercial Acros Whirlpool, S.A. de C.V.Consumer Appliances Service LimitedConsórcio Nacional Brastemp Ltda.Ealing Compania de Gestiones y Participaciones S.A.Elera Delaware, Inc.Elera Holdings CorporationElica S.p.A.Embraco Europe S.r.l.Embraco Eurosales S.r.l.Embraco Luxembourg S.à r.l.Embraco Mexico Servicios, S. de R.L. de C.V.Embraco Mexico S. de R.L. de C.V.Embraco North America, Inc.Embraco Slovakia S.r.o.Everest Campus, LLC.Great Teco Whirlpool Co., Ltd.Guangdong Whirlpool Electrical Appliances Co., Ltd.Hisense - Whirlpool (Zhejiang) Electric Appliances Co., Ltd.Hoover Comercial - LimitadaIRE Beteiligungs GmbHIndustrias Acros Whirlpool, S.A. de C.V.KitchenAid Delaware, Inc.KitchenAid Europa, Inc.KitchenAid Europa, Inc. (Brussels Branch)KitchenAid Promotions, LLCKitchenAid, Inc.LAWSA S.A.Latin America Sales and Service CompanyMLOG Armazém Geral Ltda.MacroSonix Corp.Maytag (Australia) Pty LtdMaytag Comercial, S. de R.L. de C.V.
Jurisdiction in Which Organized
DelawareDelawareGermanyBrazilItalyEnglandSwitzerlandGermanyEnglandChinaCaliforniaBrazilMexicoHong KongBrazilUruguayDelawareDelawareItalyItalyItalyLuxembourgMexicoMexicoDelawareSlovak RepublicMichiganTaiwanChinaChinaBrazilGermanyMexicoDelawareDelawareBelgiumMichiganOhioArgentinaDelawareBrazilVirginiaAustraliaMexico
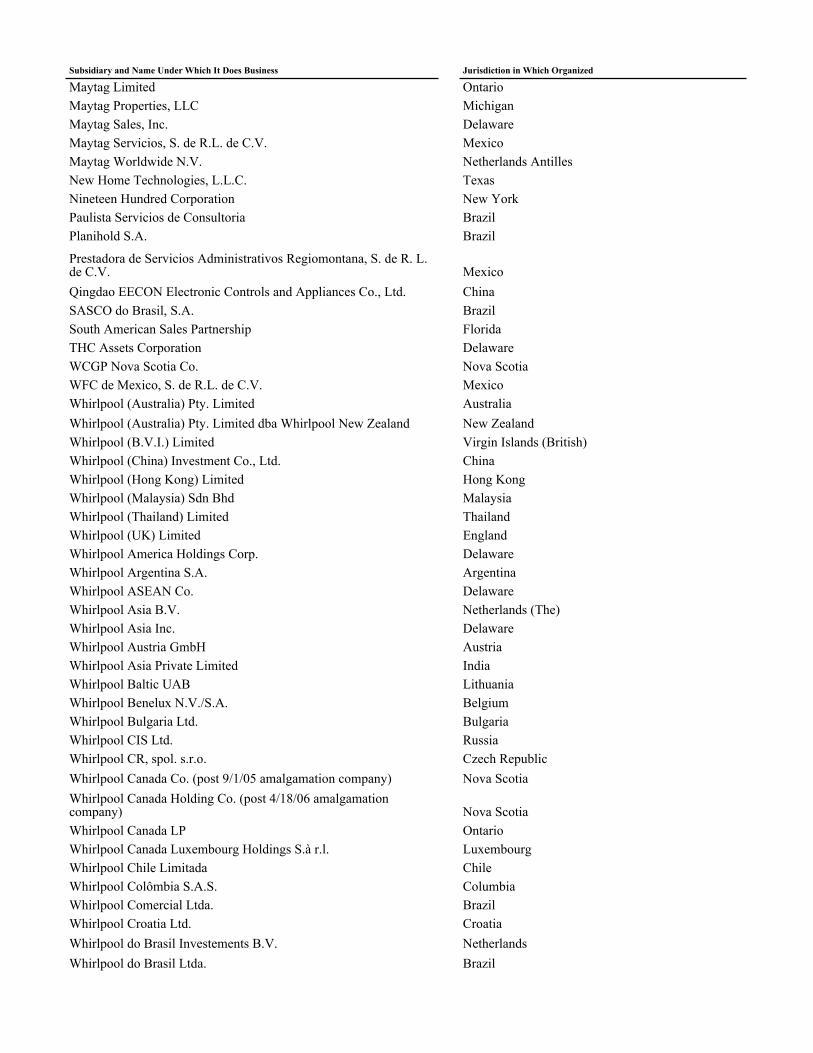
Subsidiary and Name Under Which It Does Business Jurisdiction in Which Organized
Maytag LimitedMaytag Properties, LLCMaytag Sales, Inc.Maytag Servicios, S. de R.L. de C.V.Maytag Worldwide N.V.New Home Technologies, L.L.C.Nineteen Hundred CorporationPaulista Servicios de ConsultoriaPlanihold S.A.
Prestadora de Servicios Administrativos Regiomontana, S. de R. L.de C.V.Qingdao EECON Electronic Controls and Appliances Co., Ltd.SASCO do Brasil, S.A.South American Sales PartnershipTHC Assets CorporationWCGP Nova Scotia Co.WFC de Mexico, S. de R.L. de C.V.Whirlpool (Australia) Pty. LimitedWhirlpool (Australia) Pty. Limited dba Whirlpool New ZealandWhirlpool (B.V.I.) LimitedWhirlpool (China) Investment Co., Ltd.Whirlpool (Hong Kong) LimitedWhirlpool (Malaysia) Sdn BhdWhirlpool (Thailand) LimitedWhirlpool (UK) LimitedWhirlpool America Holdings Corp.Whirlpool Argentina S.A.Whirlpool ASEAN Co.Whirlpool Asia B.V.Whirlpool Asia Inc.Whirlpool Austria GmbHWhirlpool Asia Private LimitedWhirlpool Baltic UABWhirlpool Benelux N.V./S.A.Whirlpool Bulgaria Ltd.Whirlpool CIS Ltd.Whirlpool CR, spol. s.r.o.Whirlpool Canada Co. (post 9/1/05 amalgamation company)Whirlpool Canada Holding Co. (post 4/18/06 amalgamationcompany)Whirlpool Canada LPWhirlpool Canada Luxembourg Holdings S.à r.l.Whirlpool Chile LimitadaWhirlpool Colômbia S.A.S.Whirlpool Comercial Ltda.Whirlpool Croatia Ltd.Whirlpool do Brasil Investements B.V.Whirlpool do Brasil Ltda.
OntarioMichiganDelawareMexicoNetherlands AntillesTexasNew YorkBrazilBrazil
MexicoChinaBrazilFloridaDelawareNova ScotiaMexicoAustraliaNew ZealandVirgin Islands (British)ChinaHong KongMalaysiaThailandEnglandDelawareArgentinaDelawareNetherlands (The)DelawareAustriaIndiaLithuaniaBelgiumBulgariaRussiaCzech RepublicNova Scotia
Nova ScotiaOntarioLuxembourgChileColumbiaBrazilCroatiaNetherlandsBrazil

Subsidiary and Name Under Which It Does Business Jurisdiction in Which Organized
Whirlpool Ecuador S.A.Whirlpool Eesti OUWhirlpool El Salvador, S.A. de C.V.Whirlpool Eletrodomésticos AM S.A.Whirlpool Enterprises, LLCWhirlpool Eurofinance B.V.Whirlpool Europe B.V.Whirlpool Europe Coordination CenterWhirlpool Europe Holdings B.V.Whirlpool Europe Holdings LimitedWhirlpool Europe S.r.l.Whirlpool Europe Srl (Kazakhstan Representative Office)Whirlpool Europe Srl (Russian Representative Office)Whirlpool Europe Srl (Ukraine Representative Office)Whirlpool Finance B.V.Whirlpool Finance Overseas Ltd.Whirlpool Financial CorporationWhirlpool Financial Corporation InternationalWhirlpool Floor Care Corp.Whirlpool France SASWhirlpool Greater China Inc.Whirlpool Greater China Inc. (Hong Kong Branch)Whirlpool Guatemala, S.A.Whirlpool Hellas SAWhirlpool Holdings CorporationWhirlpool Home Appliance (Shanghai) Co., Ltd.Whirlpool Home Appliances Limited Liability CompanyWhirlpool Hungarian Trading Limited Liability CompanyWhirlpool Iberia, Sucursal en Espana de Whirlpool Europe s.r.l.(Spanish Branch)Whirlpool India Holdings LimitedWhirlpool India Holdings Limited (India Branch)Whirlpool of India LimitedWhirlpool Insurance Company, Ltd.Whirlpool Insurance Company, Ltd. (Vermont Branch)Whirlpool Internacional S. de R.L. de C.V.Whirlpool International GmbHWhirlpool International Holdings S.à r.l.Whirlpool International Manufacturing S.à r.l.Whirlpool Ireland (Branch of Whirlpool (UK) Limited)Whirlpool Ireland LimitedWhirlpool Japan Inc.Whirlpool Latin America B.V.Whirlpool Latin America CorporationWhirlpool Latvia S.I.A.Whirlpool Ltd BelgradeWhirlpool Luxembourg Holdings S.à r.l.Whirlpool Luxembourg S.à r.l.Whirlpool Luxembourg Ventures S.à r.l.
EcuadorEstoniaEl SalvadorBrazilDelawareNetherlands (The)Netherlands (The)BelgiumNetherlands (The)DelawareItalyKazakhstanRussiaUkraineNetherlands (The)BermudaDelawareDelawareDelawareFranceDelawareHong KongGuatemalaGreeceDelawareChinaTurkeyHungary
SpainDelawareIndiaIndiaBermudaVermontMexicoSwitzerlandLuxembourgLuxembourgIrelandIrelandDelawareNetherlands (The)DelawareLatviaSerbiaLuxembourgLuxembourgLuxembourg

Subsidiary and Name Under Which It Does Business Jurisdiction in Which Organized
Whirlpool Management Services SaglWhirlpool Maroc S.a.r.l.Whirlpool Mauritius LimitedWhirlpool Mexico, S.A. de C.V.Whirlpool Microwave Products Development LimitedWhirlpool NAAG Holdings CorporationWhirlpool NAR Holdings, LLCWhirlpool Nederland B.V.Whirlpool Nordic A/SWhirlpool Nordic ABWhirlpool Nordic AB (Sweden's Denmark Branch)Whirlpool Nordic OYWhirlpool Norge ASWhirlpool Oceania Inc.Whirlpool Overseas Holdings, LLCWhirlpool Overseas Hong Kong LimitedWhirlpool Overseas Manufacturing S.ár.l.Whirlpool Peru S.R.L.Whirlpool Polska S.A.Whirlpool Polska S.A. (Warsaw Branch)Whirlpool Portugal Electrodomesticos, Lda.Whirlpool Product Development (Shenzhen) Company LimitedWhirlpool Properties, Inc.Whirlpool Puntana S.A.Whirlpool Realty CorporationWhirlpool Romania s.r.l.Whirlpool S.A.Whirlpool S.A. Sociedad de Ahorro para Fines DeterminadosWhirlpool SSC LimitedWhirlpool Slovakia spol. s.r.o.Whirlpool South Africa (Proprietary) LimitedWhirlpool Southeast Asia PteWhirlpool Southeast Asia Pte (Hong Kong Branch)Whirlpool Sweden ABWhirlpool Taiwan Co., Ltd.Whirlpool Technologies, LLCWhirlpool UK Pension Scheme Trustee LimitedWhirlpool Ukraine LLC
SwitzerlandMoroccoMauritiusMexicoHong KongDelawareDelawareNetherlands (The)DenmarkSwedenDenmarkFinlandNorwayDelawareDelawareHong KongLuxembourgPeruPolandPolandPortugalChinaMichiganArgentinaDelawareRomaniaBrazilArgentinaIrelandSlovak RepublicSouth AfricaSingaporeHong KongSwedenTaiwanMichiganEnglandUkraine

Exhibit 23
CONSENT OF INDEPENDENT REGISTERED PUBLIC ACCOUNTING FIRM
We consent to the incorporation by reference in the following Registration Statements:
Registration Statements of Whirlpool Corporation
33-3403733-40249333-02827333-66211333-77167
333-42322333-90602333-125260333-128686333-131627
333-143372333-150942333-157392333-166484
Registration Statements of Maytag Corporation
333-62980
Registration Statements of Whirlpool Corporationpertaining to the Whirlpool 401(k) Retirement Plan
33-26680 33-53196
Registration Statements of Whirlpool Corporationpertaining to the Maytag Corporation Salary Savings Plan, Maytag Corporation DeferredCompensation Plan and Maytag Corporation Deferred Compensation Plan II
333-132875
Registration Statements of Maytag Corporationpertaining to the Maytag Corporation Deferred Compensation Plans
333-102002 333-101995 333-121368
of our reports dated February 22, 2012, with respect to the consolidated financial statements and schedule of Whirlpool Corporation and the effectiveness of internal control over financial reporting of Whirlpool Corporation, included in this Annual Report (Form 10-K) for the year ended December 31, 2011.
/s/ ERNST & YOUNG LLP
Chicago, Illinois February 22, 2012

Exhibit 24
POWER OF ATTORNEY
KNOW ALL MEN BY THESE PRESENTS, that each of the undersigned, being a director or officer, or both, of WHIRLPOOL CORPORATION, a Delaware corporation (hereinafter called the “Corporation”), does hereby constitute and appoint JEFF M. FETTIG and KIRSTEN J. HEWITT, with full power to each of them to act alone, as the true and lawful attorneys and agents of the undersigned, with full power of substitution and resubstitution to each of said attorneys, to execute, file or deliver any and all instruments and to do all acts and things which said attorneys and agents, or any of them, deem advisable to enable the Corporation to comply with the Securities Act of 1933, as amended, the Securities Exchange Act of 1934, as amended, and any requirements of the Securities and Exchange Commission in respect thereof, in connection with the filing under said Securities Exchange Act of the Corporation's Annual Report on Form 10-K for the year ended December 31, 2011, including specifically, but without limitation of the general authority hereby granted, the power and authority to sign his or her name as a director or officer, or both, of the Corporation, as indicated below opposite his or her signature, to the Annual Report on Form 10-K, or any amendment, post-effective amendment, or papers supplemental thereto to be filed in respect of said Annual Report on Form 10-K; and each of the undersigned does hereby fully ratify and confirm all that said attorneys and agents, or any of them, or the substitute of any of them, shall do or cause to be done by virtue hereof.
IN WITNESS WHEREOF, each of the undersigned has subscribed these presents, as of the 21st day of February, 2012.
Signature
/S/ JEFF M. FETTIGJeff M. Fettig
/S/ MICHAEL A. TODMANMichael A. Todman
/S/ LARRY M. VENTURELLILarry M. Venturelli
/S/ SAMUEL R. ALLENSamuel R. Allen
/S/ GARY T. DICAMILLOGary T. DiCamillo
/S/ KATHLEEN J. HEMPELKathleen J. Hempel
/S/ MICHAEL F. JOHNSTONMichael F. Johnston
/S/ WILLIAM T. KERRWilliam T. Kerr
/S/ JOHN D. LIUJohn D. Liu
/S/ HARISH MANWANIHarish Manwani
/S/ MILES L. MARSHMiles L. Marsh
Title
Director, Chairman of the Board and ChiefExecutive Officer(Principal Executive Officer)
Director and President, WhirlpoolInternational
Executive Vice President and ChiefFinancial Officer(Principal Financial Officer and Principal Accounting Officer)
Director
Director
Director
Director
Director
Director
Director
Director
/S/ WILLIAM D. PEREZWilliam D. Perez
/S/ MICHAEL D. WHITEMichael D. White
Director
Director

Exhibit 31(a)
CERTIFICATION PURSUANT TO SECTION 302 OF THE SARBANES-OXLEY ACT OF 2002
I, Jeff M. Fettig, certify that:
1. I have reviewed this annual report on Form 10-K of Whirlpool Corporation;
2. Based on my knowledge, this report does not contain any untrue statement of a material fact or omit to state a material fact necessary to make the statements made, in light of the circumstance under which such statements were made, not misleading with respect to the period covered by this report;
3. Based on my knowledge, the financial statements, and other financial information included in this report, fairly represent in all material respects the financial condition, results of operations and cash flows of the registrant, as of, and for, the periods presented in this report;
4. The registrant’s other certifying officer and I are responsible for establishing and maintaining disclosure controls and procedures (as defined in Exchange Act Rules 13a-15(e) and 15d-15(e)) and internal control over financial reporting (as defined in Exchange Act Rule 13a-15(f) and 15d-15(f)) for the registrant and have:
(a) Designed such disclosure controls and procedures, or caused such disclosure controls and procedures to be designed under our supervision, to ensure that material information relating to the registrant, including its consolidated subsidiaries, is made known to us by others within those entities, particularly during the period in which this report is being prepared;
(b) Designed such internal control over financial reporting, or caused such internal control over financial reporting to be designed under our supervision, to provide reasonable assurance regarding the reliability of financial reporting and the preparation of financial statements for external purposes in accordance with generally accepted accounting principles;
(c) Evaluated the effectiveness of the registrant’s disclosure controls and procedures and presented in this report our conclusions about the effectiveness of the disclosure controls and procedures, as of the end of the period covered by this report based on such evaluation; and
(d) Disclosed in this report any change in the registrant’s internal control over financial reporting that occurred during the registrant’s most recent fiscal quarter (the registrant’s fourth fiscal quarter in the case of an annual report) that has materially affected, or is reasonably likely to materially affect, the registrant’s internal control over financial reporting; and
5. The registrant’s other certifying officer and I have disclosed, based on our most recent evaluation of internal control over financial reporting, to the registrant’s auditors and the audit committee of the registrant’s board of directors (or persons performing the equivalent functions):
(a) All significant deficiencies and material weaknesses in the design or operation of internal control over financial reporting which are reasonably likely to adversely affect the registrant’s ability to record, process, summarize and report financial information; and
(b) Any fraud, whether or not material, that involves management or other employees who have a significant role in the registrant’s internal control over financial reporting.
Date:
/s/ JEFF M. FETTIGName:
Title:
February 22, 2012
Jeff M. FettigChairman of the Board and Chief Executive Officer

Exhibit 31(b)
CERTIFICATION PURSUANT TO SECTION 302 OF THE SARBANES-OXLEY ACT OF 2002
I, Larry M. Venturelli, certify that:
1. I have reviewed this annual report on Form 10-K of Whirlpool Corporation;
2. Based on my knowledge, this report does not contain any untrue statement of a material fact or omit to state a material fact necessary to make the statements made, in light of the circumstance under which such statements were made, not misleading with respect to the period covered by this report;
3. Based on my knowledge, the financial statements, and other financial information included in this report, fairly represent in all material respects the financial condition, results of operations and cash flows of the registrant, as of, and for, the periods presented in this report;
4. The registrant’s other certifying officer and I are responsible for establishing and maintaining disclosure controls and procedures (as defined in Exchange Act Rules 13a-15(e) and 15d-15(e)) and internal control over financial reporting (as defined in Exchange Act Rule 13a-15(f) and 15d-15(f)) for the registrant and have:
(a) Designed such disclosure controls and procedures, or caused such disclosure controls and procedures to be designed under our supervision, to ensure that material information relating to the registrant, including its consolidated subsidiaries, is made known to us by others within those entities, particularly during the period in which this report is being prepared;
(b) Designed such internal control over financial reporting, or caused such internal control over financial reporting to be designed under our supervision, to provide reasonable assurance regarding the reliability of financial reporting and the preparation of financial statements for external purposes in accordance with generally accepted accounting principles;
(c) Evaluated the effectiveness of the registrant’s disclosure controls and procedures and presented in this report our conclusions about the effectiveness of the disclosure controls and procedures, as of the end of the period covered by this report based on such evaluation; and
(d) Disclosed in this report any change in the registrant’s internal control over financial reporting that occurred during the registrant’s most recent fiscal quarter (the registrant’s fourth fiscal quarter in the case of an annual report) that has materially affected, or is reasonably likely to materially affect, the registrant’s internal control over financial reporting; and
5. The registrant’s other certifying officer and I have disclosed, based on our most recent evaluation of internal control over financial reporting, to the registrant’s auditors and the audit committee of the registrant’s board of directors (or persons performing the equivalent functions):
(a) All significant deficiencies and material weaknesses in the design or operation of internal control over financial reporting which are reasonably likely to adversely affect the registrant’s ability to record, process, summarize and report financial information; and
(b) Any fraud, whether or not material, that involves management or other employees who have a significant role in the registrant’s internal control over financial reporting.
Date:
/s/ LARRY M. VENTURELLIName:
Title:
February 22, 2012
Larry M. VenturelliExecutive Vice President and Chief Financial Officer

Exhibit 32
Certifications Pursuant to 18 U.S.C. Section 1350, as Adopted Pursuant to Section 906 of the Sarbanes-Oxley Act of 2002
In connection with the Annual Report on Form 10-K of Whirlpool Corporation (the “Company”) for the year ended December 31, 2011 as filed with the Securities and Exchange Commission on the date hereof (the “Report”), Jeff M. Fettig, as Chief Executive Officer of Whirlpool, and Larry M. Venturelli, as Chief Financial Officer of Whirlpool, each hereby certifies, pursuant to 18 U.S.C. Section 1350, as adopted pursuant to Section 906 of the Sarbanes-Oxley Act of 2002, that, to his knowledge:
1. The Report fully complies with the requirements of Section 13(a) or 15(d) of the Securities Exchange Act of 1934; and
2. The information contained in the Report fairly represents, in all material respects, the financial condition and results of operations of Whirlpool.
/s/ JEFF M. FETTIGName:
Title:
Date:
/s/ LARRY M. VENTURELLIName:
Title:
Date:
Jeff M. FettigChairman of the Board andChief Executive OfficerFebruary 22, 2012
Larry M. VenturelliExecutive Vice President andChief Financial OfficerFebruary 22, 2012


![ZYBO - Digilent Documentation [Reference.Digilentinc] Z7 B.2 out of 14 2017 MIPI, General I/O 10K R60 10K R62 10K R64 10K R67 GND VCC3V3 SW3 SW2 SW1 SW0 10K R57 10K R71 10K R72 GND](https://static.fdocuments.us/doc/165x107/5abecaa37f8b9a3a428d6851/zybo-digilent-documentation-z7-b2-out-of-14-2017-mipi-general-io-10k-r60.jpg)