2011 Thermal Guidelines for Data Processing Environments – … · 2018-01-12 · ASHRAE TC 9.9...
45
© 2011 American Society of Heating, Refrigerating and Air-Conditioning Engineers, Inc. All rights reserved. 1 ASHRAE TC 9.9 2011 Thermal Guidelines for Data Processing Environments – Expanded Data Center Classes and Usage Guidance Whitepaper prepared by ASHRAE Technical Committee (TC) 9.9 Mission Critical Facilities, Technology Spaces, and Electronic Equipment © 2011, American Society of Heating, Refrigerating and Air-Conditioning Engineers, Inc. All rights reserved. This publication may not be reproduced in whole or in part; may not be distributed in paper or digital form; and may not be posted in any form on the Internet without ASHRAE’s expressed written permission. Inquires for use should be directed to [email protected].
Transcript of 2011 Thermal Guidelines for Data Processing Environments – … · 2018-01-12 · ASHRAE TC 9.9...
© 2011 American Society of Heating, Refrigerating and Air-Conditioning Engineers, Inc. All rights reserved.
1
ASHRAE TC 9.9
2011 Thermal Guidelines for Data Processing Environments
– Expanded Data Center Classes and Usage Guidance
Whitepaper prepared by ASHRAE Technical Committee (TC) 9.9 Mission Critical Facilities, Technology Spaces, and Electronic Equipment
© 2011, American Society of Heating, Refrigerating and Air-Conditioning Engineers, Inc. All rights reserved. This publication may not be reproduced in whole or in part; may not be distributed in paper or digital form; and may not be posted in any form on the Internet without ASHRAE’s expressed written permission. Inquires for use should be directed to [email protected].
© 2011 American Society of Heating, Refrigerating and Air-Conditioning Engineers, Inc. All rights reserved.
2
ASHRAE TC 9.9
2011 Thermal Guidelines for Data Processing Environments – Expanded Data Center Classes and Usage Guidance
Whitepaper prepared by ASHRAE Technical Committee (TC) 9.9 Mission Critical Facilities, Technology Spaces, and Electronic Equipment
This ASHRAE white paper on data center environmental guidelines was developed by members of the TC 9.9 committee representing the IT equipment manufacturers and submitted to the voting members of TC 9.9 for review and approval. In this document the term ‘server’ is used to generically describe any IT equipment (ITE) such as servers, storage, network products, etc. used in data-center-like applications.
Executive Summary ASHRAE TC 9.9 created the first edition of the ‘Thermal Guidelines for Data Processing Environments’ in 2004. Prior to that the environmental parameters necessary to operate data centers were anecdotal or specific to each IT manufacturer. In the second edition of the Thermal Guidelines in 2008 ASHRAE TC 9.9 expanded the environmental range for data centers so that an increasing number of locations throughout the world were able to operate with more hours of economizer usage. At the time of the first Thermal Guidelines the most important goal was to create a common set of environmental guidelines that IT equipment would be designed to meet. Although computing efficiency was important, performance and availability took precedence when creating the guidelines and temperature and humidity limits were set accordingly. Progressing through the first decade of the 21st century, increased emphasis has been placed on computing efficiency. Power usage effectiveness (PUE) has become the new metric to measure data center efficiency which creates a measurable way to see the effect of data center design and operation on data center efficiency. To improve PUE air- and water-side economization have become more commonplace with a drive to use them year-round. To enable improved PUE capability TC 9.9 has created additional environmental classes along with guidance on the usage of the existing and new classes. Expanding the capability of IT equipment to meet wider environmental requirements can change reliability, power consumption and performance capabilities of the IT equipment and guidelines are provided herein on how these aspects are affected. From the second edition (2008) of the thermal guidelines the purpose of the recommended envelope was to give guidance to data center operators on maintaining high reliability and also operating their data centers in the most energy efficient manner. This envelope was created for general use across all types of businesses and conditions. However, different environmental envelopes may be more appropriate for different business values and climate conditions. Therefore, to allow for the potential to operate in a different envelope that might provide even greater energy savings, this whitepaper provides general guidance on server metrics that will assist data center operators in creating a different operating envelope that matches their business values. Each of these metrics is described herein, with more details to be provided in the upcoming third
© 2011 American Society of Heating, Refrigerating and Air-Conditioning Engineers, Inc. All rights reserved.
3
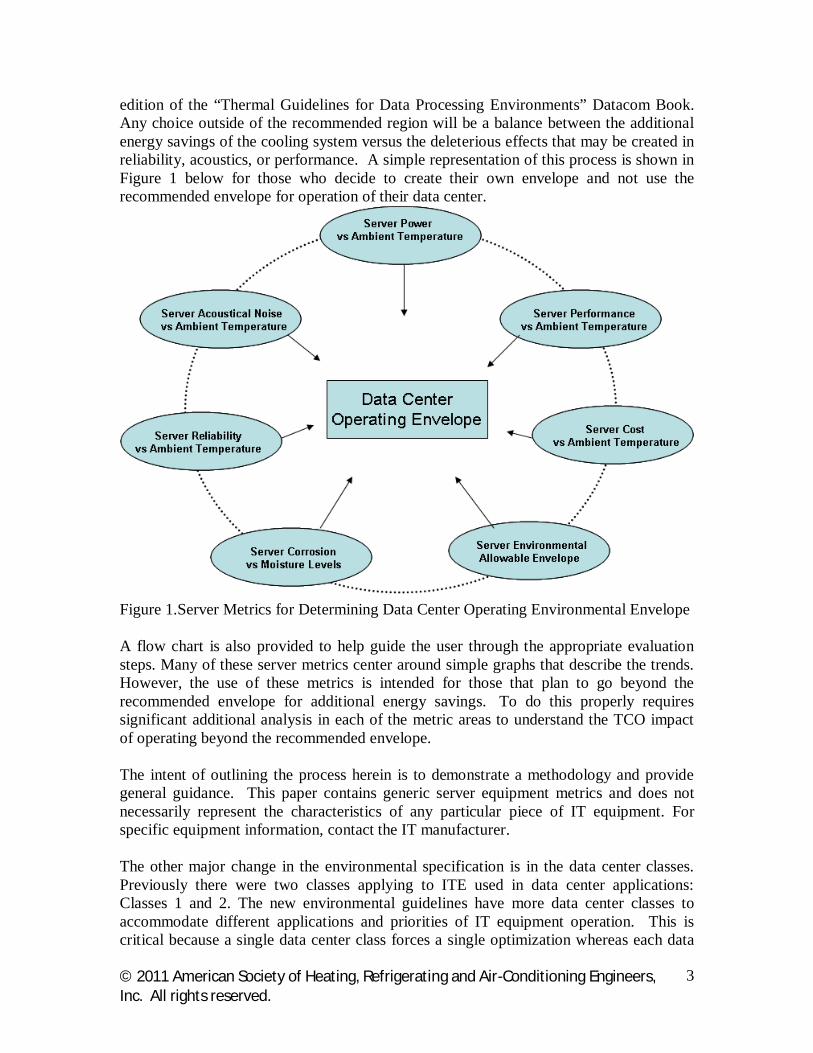
edition of the “Thermal Guidelines for Data Processing Environments” Datacom Book. Any choice outside of the recommended region will be a balance between the additional energy savings of the cooling system versus the deleterious effects that may be created in reliability, acoustics, or performance. A simple representation of this process is shown in Figure 1 below for those who decide to create their own envelope and not use the recommended envelope for operation of their data center. Figure 1.Server Metrics for Determining Data Center Operating Environmental Envelope A flow chart is also provided to help guide the user through the appropriate evaluation steps. Many of these metrics center around simple graphs that describe the trends. However, the use of these metrics is intended for those that plan to go beyond the recommended envelope for additional energy savings. The use of these metrics will require significant additional analysis to understand the TCO impact of operating beyond the recommended envelope. The other major change in the environmental specification is in the data center classes. Previously there were two classes applying to ITE used in data center applications: Classes 1 and 2. The new environmental guidelines have more data center classes to accommodate different applications and priorities of IT equipment operation. This is critical because a single data center class forces a single optimization whereas each data center needs to be optimized based on the operator’s own optimization criteria (e.g. fulltime economizer use versus maximum reliability). Figure 1.Server Metrics for Determining Data Center Operating Environmental Envelope A flow chart is also provided to help guide the user through the appropriate evaluation steps. Many of these server metrics center around simple graphs that describe the trends. However, the use of these metrics is intended for those that plan to go beyond the recommended envelope for additional energy savings. To do this properly requires significant additional analysis in each of the metric areas to understand the TCO impact of operating beyond the recommended envelope. The intent of outlining the process herein is to demonstrate a methodology and provide general guidance. This paper contains generic server equipment metrics and does not necessarily represent the characteristics of any particular piece of IT equipment. For specific equipment information, contact the IT manufacturer. The other major change in the environmental specification is in the data center classes. Previously there were two classes applying to ITE used in data center applications: Classes 1 and 2. The new environmental guidelines have more data center classes to accommodate different applications and priorities of IT equipment operation. This is critical because a single data center class forces a single optimization whereas each data
© 2011 American Society of Heating, Refrigerating and Air-Conditioning Engineers, Inc. All rights reserved.
4
center needs to be optimized based on the operator’s own criteria (e.g. fulltime economizer use versus maximum reliability). Introduction The first initiative of TC 9.9 was to publish the book, “Thermal Guidelines for Data Processing Environments”.
Prior to the formation of TC 9.9, each commercial IT manufacturer published its own independent temperature specification. Typical data centers were operated in a temperature range of 20 to 21°C with a common notion of ‘cold is better’.
Most data centers deployed IT equipment from multiple vendors resulting in the ambient temperature defaulting to the IT equipment having the most stringent temperature requirement plus a safety factor.
TC 9.9 obtained informal consensus from the major commercial IT equipment manufacturers for both “recommended” and “allowable” temperature and humidity ranges and for four environmental classes, two of which were applied to data centers.
Another critical accomplishment of TC 9.9 was to establish IT equipment air inlets as the common measurement point for temperature and humidity compliance; requirements in any other location within the data center were optional.
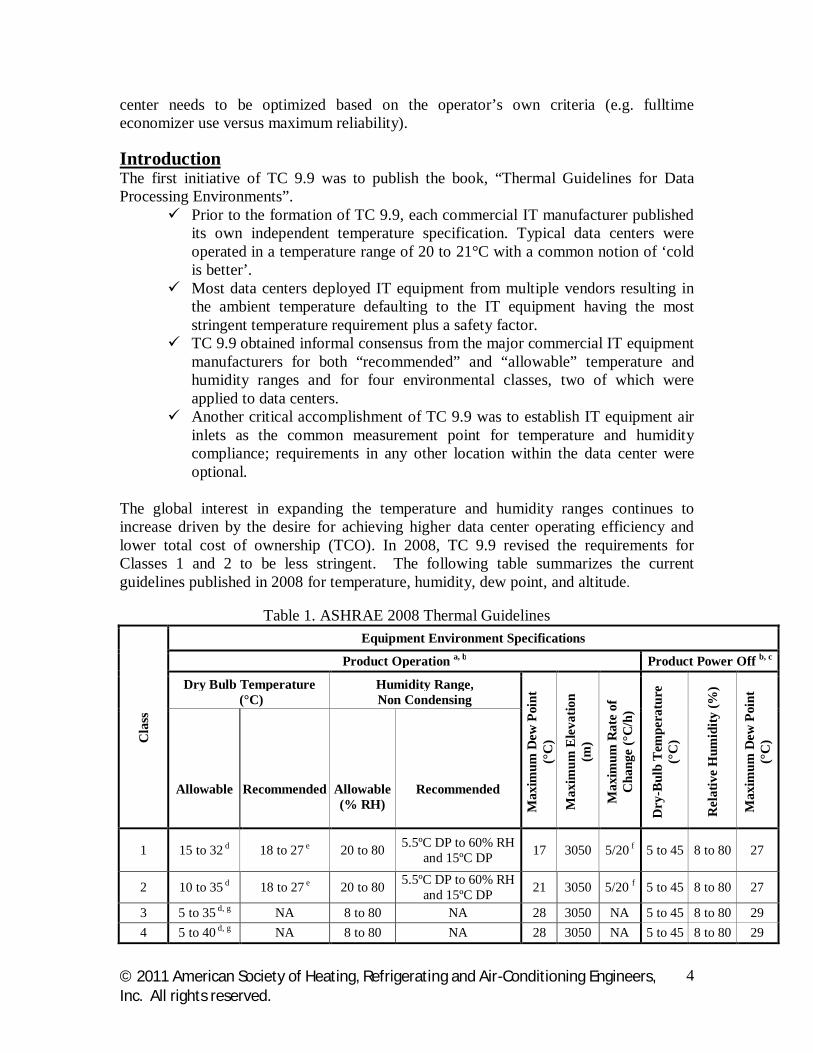
The global interest in expanding the temperature and humidity ranges continues to increase driven by the desire for achieving higher data center operating efficiency and lower total cost of ownership (TCO). In 2008, TC 9.9 revised the requirements for Classes 1 and 2 to be less stringent. The following table summarizes the current guidelines published in 2008 for temperature, humidity, dew point, and altitude.
Table 1. ASHRAE 2008 Thermal Guidelines
Cla
ss
Equipment Environment Specifications
Product Operation a, b Product Power Off b, c
Dry Bulb Temperature (°C)
Humidity Range, Non Condensing
Max
imum
Dew
Poi
nt
(°C
)
Max
imum
Ele
vatio
n (m
)
Max
imum
Rat
e of
C
hang
e (°
C/h
)
Dry
-Bul
b Te
mpe
ratu
re
(°C
)
Rel
ativ
e H
umid
ity (%
)
Max
imum
Dew
Poi
nt
(°C
)
Allowable
Recommended
Allowable (% RH)
Recommended
1 15 to 32 d 18 to 27 e 20 to 80 5.5ºC DP to 60% RH and 15ºC DP 17 3050 5/20 f 5 to 45 8 to 80 27
2 10 to 35 d 18 to 27 e 20 to 80 5.5ºC DP to 60% RH and 15ºC DP 21 3050 5/20 f 5 to 45 8 to 80 27
3 5 to 35 d, g NA 8 to 80 NA 28 3050 NA 5 to 45 8 to 80 29 4 5 to 40 d, g NA 8 to 80 NA 28 3050 NA 5 to 45 8 to 80 29
© 2011 American Society of Heating, Refrigerating and Air-Conditioning Engineers, Inc. All rights reserved.
5
a. Product equipment is powered on. b. Tape products require a stable and more restrictive environment (similar to Class 1). Typical
requirements: minimum temperature is 15°C, maximum temperature is 32°C, minimum relative humidity is 20%, maximum relative humidity is 80%, maximum dew point is 22°C, rate of change of temperature is less than 5°C/h, rate of change of humidity is less than 5% RH per hour, and no condensation.
c. Product equipment is removed from original shipping container and installed but not in use, e.g., during repair maintenance, or upgrade.
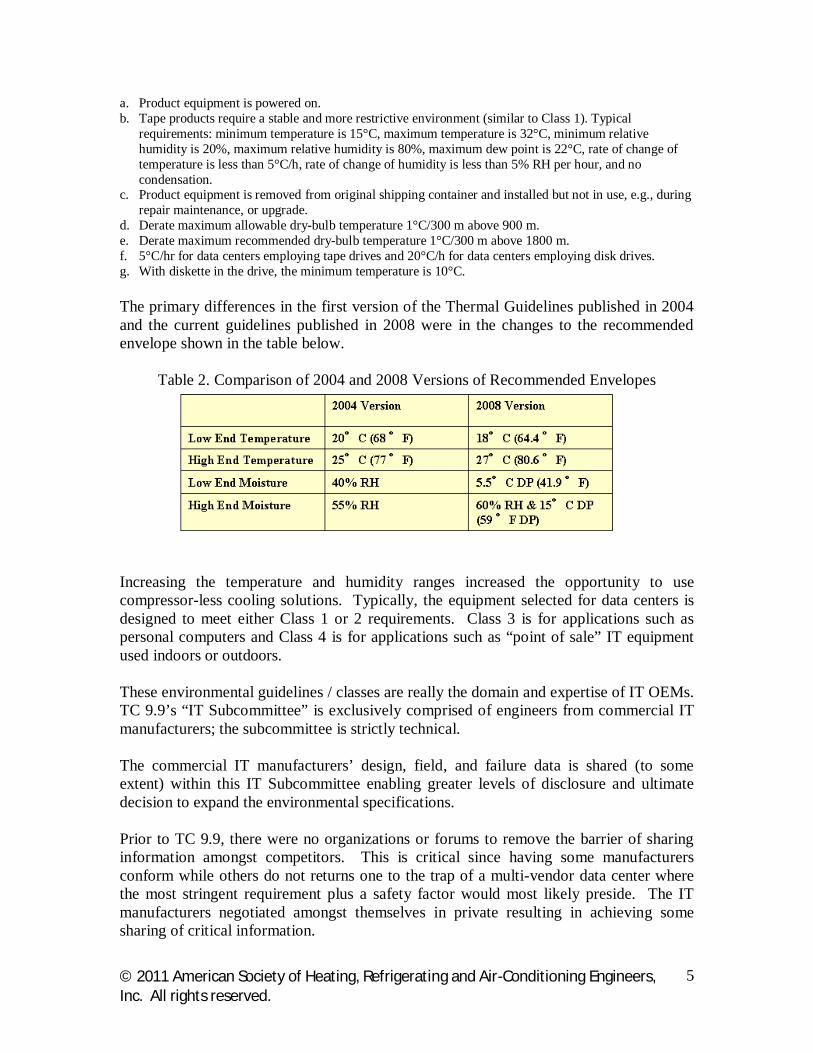
d. Derate maximum allowable dry-bulb temperature 1°C/300 m above 900 m. e. Derate maximum recommended dry-bulb temperature 1°C/300 m above 1800 m. f. 5°C/hr for data centers employing tape drives and 20°C/h for data centers employing disk drives. g. With diskette in the drive, the minimum temperature is 10°C. The primary differences in the first version of the Thermal Guidelines published in 2004 and the current guidelines published in 2008 were in the changes to the recommended envelope shown in the table below.
Table 2. Comparison of 2004 and 2008 Versions of Recommended Envelopes
Increasing the temperature and humidity ranges increased the opportunity to use compressor-less cooling solutions. Typically, the equipment selected for data centers is designed to meet either Class 1 or 2 requirements. Class 3 is for applications such as personal computers and Class 4 is for applications such as “point of sale” IT equipment used indoors or outdoors. These environmental guidelines / classes are really the domain and expertise of IT OEMs. TC 9.9’s “IT Subcommittee” is exclusively comprised of engineers from commercial IT manufacturers; the subcommittee is strictly technical. The commercial IT manufacturers’ design, field, and failure data is shared (to some extent) within this IT Subcommittee enabling greater levels of disclosure and ultimate decision to expand the environmental specifications. Prior to TC 9.9, there were no organizations or forums to remove the barrier of sharing information amongst competitors. This is critical since having some manufacturers conform while others do not returns one to the trap of a multi-vendor data center where the most stringent requirement plus a safety factor would most likely preside. The IT manufacturers negotiated amongst themselves in private resulting in achieving some sharing of critical information.
© 2011 American Society of Heating, Refrigerating and Air-Conditioning Engineers, Inc. All rights reserved.
6
From an end user perspective, it is also important that options are provided for multi-vendor facilities such as:
Option 1 – use IT equipment optimized for a combination of attributes including energy efficiency and capital cost with the dominant attribute being RELIABILITY Option 2 – use IT equipment optimized for a combination of attributes including some level of reliability with the dominant attribute being ENERGY and compressor-less cooling
The industry needs both types of equipment but also needs to avoid having Option 2 inadvertently increase the acquisition cost of Option 1 by increasing purchasing costs through mandatory requirements NOT desired or used by all end users. Expanding the temperature and humidity ranges can increase the physical size of the IT equipment (e.g. more heat transfer area required), increase IT equipment air flow, etc. This can impact embedded energy cost, power consumption and finally the IT equipment purchase cost. TC 9.9 has demonstrated the ability to unify the commercial IT manufacturers and improve the overall performance including energy efficiency for the industry. The TC 9.9 IT Subcommittee worked diligently to expand the Environmental Classes to include two new data center classes. By adding these new classes and NOT mandating all servers conform to something such as 40°C, the increased server packaging cost for energy optimization becomes an option rather than a mandate. Developing these new classes exclusively amongst the commercial IT manufacturers should produce better results since the sharing of some critical data amongst them has proven in the past to achieve broader environmental specifications than what otherwise would have been achieved. The next version of the book, “Thermal Guidelines for Data Processing Environments, - Third Edition”, will include expansion of the environmental classes as described in this whitepaper. The naming conventions have been updated to better delineate the types of IT equipment. The old and new classes are now specified differently.
© 2011 American Society of Heating, Refrigerating and Air-Conditioning Engineers, Inc. All rights reserved.
7
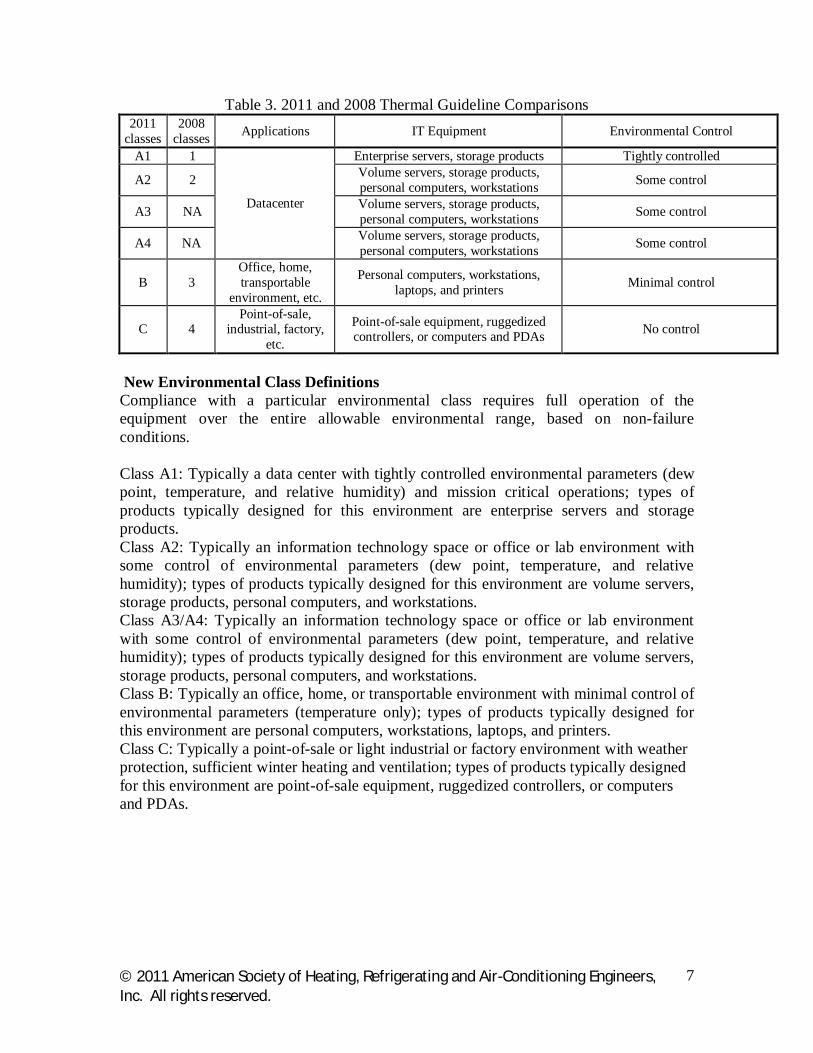
Table 3. 2011 and 2008 Thermal Guideline Comparisons 2011
classes 2008
classes Applications IT Equipment Environmental Control
A1 1
Datacenter
Enterprise servers, storage products Tightly controlled
A2 2 Volume servers, storage products, personal computers, workstations Some control
A3 NA Volume servers, storage products, personal computers, workstations Some control
A4 NA Volume servers, storage products, personal computers, workstations Some control
B 3 Office, home, transportable
environment, etc.
Personal computers, workstations, laptops, and printers Minimal control
C 4 Point-of-sale,
industrial, factory, etc.
Point-of-sale equipment, ruggedized controllers, or computers and PDAs No control
New Environmental Class Definitions Compliance with a particular environmental class requires full operation of the equipment over the entire allowable environmental range, based on non-failure conditions. Class A1: Typically a data center with tightly controlled environmental parameters (dew point, temperature, and relative humidity) and mission critical operations; types of products typically designed for this environment are enterprise servers and storage products. Class A2: Typically an information technology space or office or lab environment with some control of environmental parameters (dew point, temperature, and relative humidity); types of products typically designed for this environment are volume servers, storage products, personal computers, and workstations. Class A3/A4: Typically an information technology space or office or lab environment with some control of environmental parameters (dew point, temperature, and relative humidity); types of products typically designed for this environment are volume servers, storage products, personal computers, and workstations. Class B: Typically an office, home, or transportable environment with minimal control of environmental parameters (temperature only); types of products typically designed for this environment are personal computers, workstations, laptops, and printers. Class C: Typically a point-of-sale or light industrial or factory environment with weather protection, sufficient winter heating and ventilation; types of products typically designed for this environment are point-of-sale equipment, ruggedized controllers, or computers and PDAs.
© 2011 American Society of Heating, Refrigerating and Air-Conditioning Engineers, Inc. All rights reserved.
8
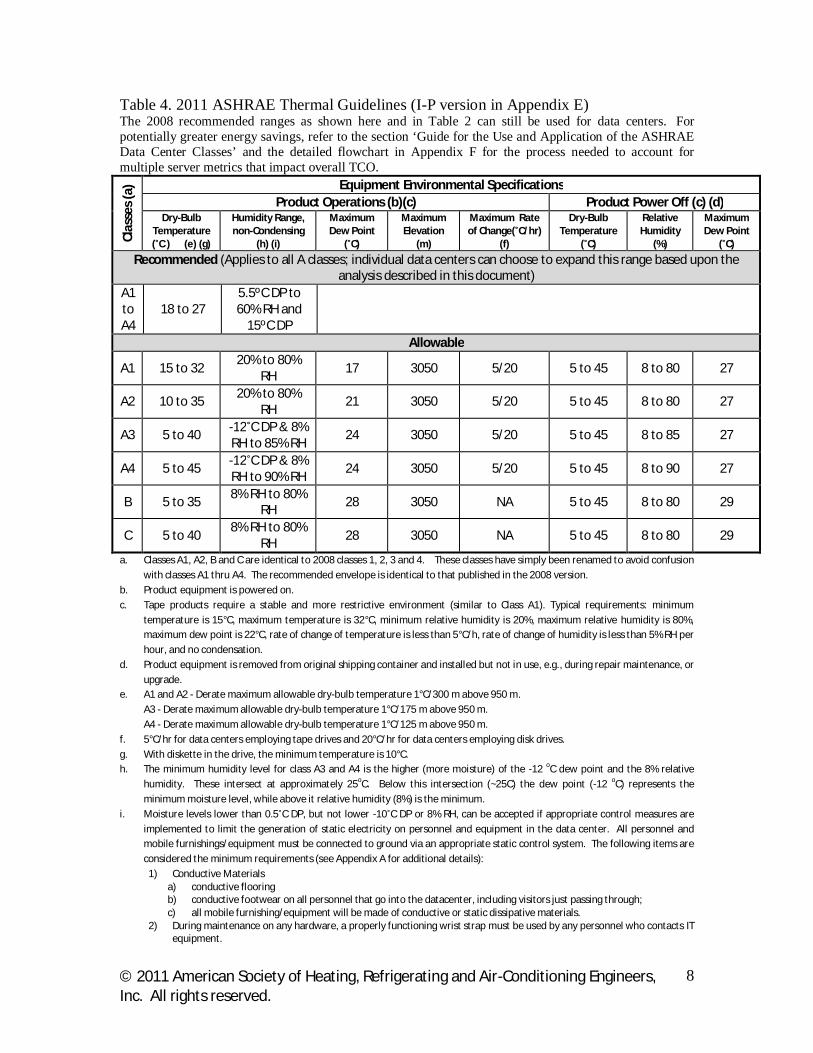
Table 4. 2011 ASHRAE Thermal Guidelines (I-P version in Appendix E) The 2008 recommended ranges as shown here and in Table 2 can still be used for data centers. For potentially greater energy savings, refer to the section ‘Guide for the Use and Application of the ASHRAE Data Center Classes’ and the detailed flowchart in Appendix F for the process needed to account for multiple server metrics that impact overall TCO.
Clas
ses
(a) Equipment Environmental Specifications
Product Operations (b)(c) Product Power Off (c) (d) Dry-Bulb
Temperature (˚C ) (e) (g)
Humidity Range, non-Condensing
(h) (i)
Maximum Dew Point
(˚C)
Maximum Elevation
(m)
Maximum Rate of Change(˚C/hr)
(f)
Dry-Bulb Temperature
(˚C)
Relative Humidity
(%)
Maximum Dew Point
(˚C)
Recommended (Applies to all A classes; individual data centers can choose to expand this range based upon the analysis described in this document)
A1 to A4
18 to 27 5.5ºC DP to 60% RH and
15ºC DP
Allowable
A1 15 to 32 20% to 80%
RH 17 3050 5/20 5 to 45 8 to 80 27
A2 10 to 35 20% to 80%
RH 21 3050 5/20 5 to 45 8 to 80 27
A3 5 to 40 -12˚C DP & 8% RH to 85% RH
24 3050 5/20 5 to 45 8 to 85 27
A4 5 to 45 -12˚C DP & 8% RH to 90% RH
24 3050 5/20 5 to 45 8 to 90 27
B 5 to 35 8% RH to 80%
RH 28 3050 NA 5 to 45 8 to 80 29
C 5 to 40 8% RH to 80%
RH 28 3050 NA 5 to 45 8 to 80 29
a. Classes A1, A2, B and C are identical to 2008 classes 1, 2, 3 and 4. These classes have simply been renamed to avoid confusion with classes A1 thru A4. The recommended envelope is identical to that published in the 2008 version.
b. Product equipment is powered on. c. Tape products require a stable and more restrictive environment (similar to Class A1). Typical requirements: minimum
temperature is 15°C, maximum temperature is 32°C, minimum relative humidity is 20%, maximum relative humidity is 80%, maximum dew point is 22°C, rate of change of temperature is less than 5°C/h, rate of change of humidity is less than 5% RH per hour, and no condensation.
d. Product equipment is removed from original shipping container and installed but not in use, e.g., during repair maintenance, or upgrade.
e. A1 and A2 - Derate maximum allowable dry-bulb temperature 1°C/300 m above 950 m. A3 - Derate maximum allowable dry-bulb temperature 1°C/175 m above 950 m. A4 - Derate maximum allowable dry-bulb temperature 1°C/125 m above 950 m. f. 5°C/hr for data centers employing tape drives and 20°C/hr for data centers employing disk drives. g. With diskette in the drive, the minimum temperature is 10°C. h. The minimum humidity level for class A3 and A4 is the higher (more moisture) of the -12 oC dew point and the 8% relative
humidity. These intersect at approximately 25oC. Below this intersection (~25C) the dew point (-12 oC) represents the minimum moisture level, while above it relative humidity (8%) is the minimum.
i. Moisture levels lower than 0.5˚C DP, but not lower -10˚C DP or 8% RH, can be accepted if appropriate control measures are implemented to limit the generation of static electricity on personnel and equipment in the data center. All personnel and mobile furnishings/equipment must be connected to ground via an appropriate static control system. The following items are considered the minimum requirements (see Appendix A for additional details):
1) Conductive Materials a) conductive flooring b) conductive footwear on all personnel that go into the datacenter, including visitors just passing through; c) all mobile furnishing/equipment will be made of conductive or static dissipative materials.
2) During maintenance on any hardware, a properly functioning wrist strap must be used by any personnel who contacts IT equipment.
© 2011 American Society of Heating, Refrigerating and Air-Conditioning Engineers, Inc. All rights reserved.
9
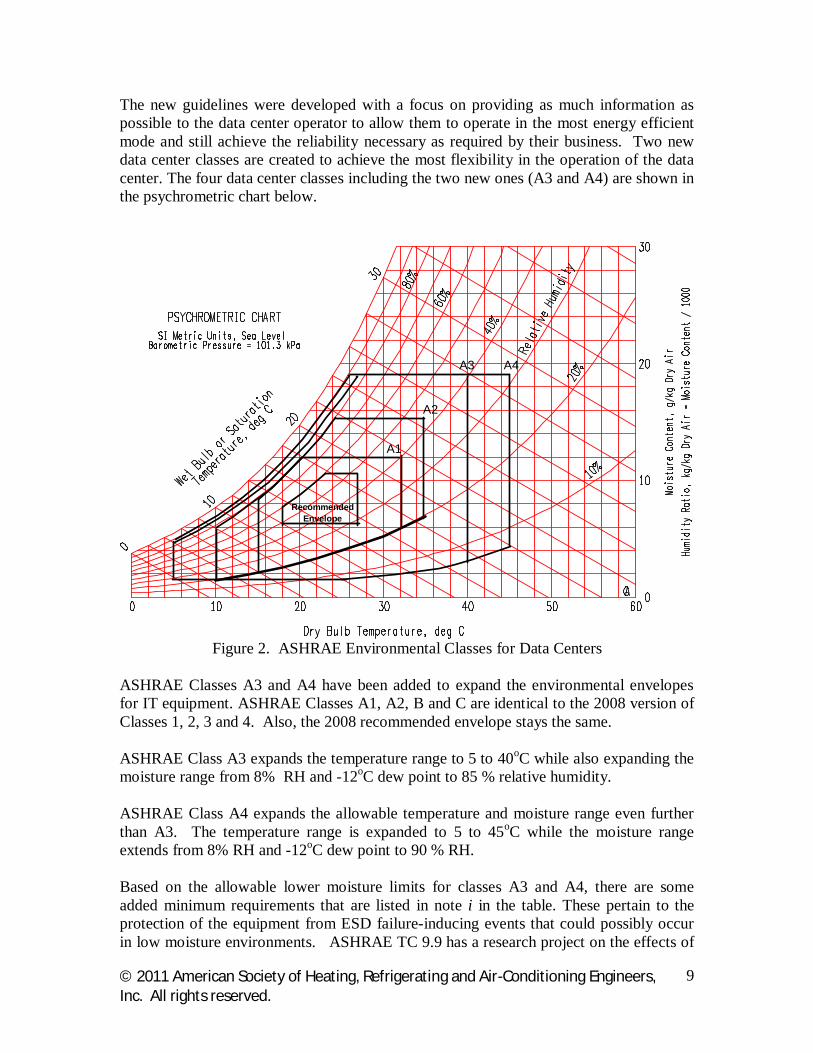
The new guidelines were developed with a focus on providing as much information as possible to the data center operator to allow them to operate in the most energy efficient mode and still achieve the reliability necessary as required by their business. Two new data center classes are created to achieve the most flexibility in the operation of the data center. The four data center classes including the two new ones (A3 and A4) are shown in the psychrometric chart below.
A1
A2
A3 A4
RecommendedEnvelope
Figure 2. ASHRAE Environmental Classes for Data Centers
ASHRAE Classes A3 and A4 have been added to expand the environmental envelopes for IT equipment. ASHRAE Classes A1, A2, B and C are identical to the 2008 version of Classes 1, 2, 3 and 4. Also, the 2008 recommended envelope stays the same. ASHRAE Class A3 expands the temperature range to 5 to 40oC while also expanding the moisture range from 8% RH and -12oC dew point to 85 % relative humidity. ASHRAE Class A4 expands the allowable temperature and moisture range even further than A3. The temperature range is expanded to 5 to 45oC while the moisture range extends from 8% RH and -12oC dew point to 90 % RH. Based on the allowable lower moisture limits for classes A3 and A4, there are some added minimum requirements that are listed in note i in the table. These pertain to the protection of the equipment from ESD failure-inducing events that could possibly occur in low moisture environments. ASHRAE TC 9.9 has a research project on the effects of
© 2011 American Society of Heating, Refrigerating and Air-Conditioning Engineers, Inc. All rights reserved.
10
low moisture environments on IT equipment. The research is intended to quantify the relationship between moisture content of the air and the severity of the impact of ESD events on functioning IT equipment. This project is scheduled over approximately the next two years and it may provide information that could relax some of these requirements as outlined in note i of the table and could allow a further relaxation of the lower limits on humidity. As shown in the above paragraphs and table, the maximum allowable limits have been relaxed to allow for greater flexibility in the design and operational states of a data center. One area that needed careful consideration was the application of the altitude derating. By simply providing the same derating curve as defined for Classes A1 and A2, the new A3 and A4 classes would have driven undesirable increases in server energy to support the higher altitudes upon users at all altitudes. In an effort to provide for both a relaxed operating environment, as well as a total focus on the best solution with the lowest TCO for the client, modification to this derating was applied. The new derating curves for Classes A3 and A4 maintain significant relaxation, while mitigating extra expense incurred both during acquisition of the IT equipment, but also under operation due to increased power consumption. See Appendix D for the derating curves. One may ask why the recommended envelope is now highlighted as a separate row in Table 4. There have been some misconceptions regarding the use of the recommended envelope. When it was first created, it was intended that within this envelope the most reliable, acceptable and reasonable power-efficient operation could be achieved. Data from the manufacturers were used to create the recommended envelope. It was never intended that the recommended envelope would be the absolute limits of inlet air temperature and humidity for IT equipment. As stated in the Thermal Guidelines book the recommended envelope defined the limits under which IT equipment would operate the most reliably while still achieving reasonably energy-efficient data center operation. However, as stated in the Thermal Guidelines book, in order to utilize economizers as much as possible to save energy during certain times of the year the inlet server conditions may fall outside the recommended envelope but still within the allowable envelope. The Thermal Guidelines book also states that it is acceptable to operate outside the recommended envelope for short periods of time without affecting the overall reliability and operation of the IT equipment. However, some still felt the recommended envelope was mandatory, even though that was never the intent. The impact of two key factors (reliability and power vs ambient temperature) that drove the previous inclusion of the recommended envelope is now provided as well as several other server metrics to aid in defining an envelope that more closely matches each user’s business and technical needs. The relationships between these factors and inlet temperature will now be provided thereby allowing data center operators to decide how they can optimally operate within the allowable envelopes.
© 2011 American Society of Heating, Refrigerating and Air-Conditioning Engineers, Inc. All rights reserved.
11
Guide for the Use and Application of the ASHRAE Data Center Classes The addition of further data center classes significantly complicates the decision process for the data center owner/operator when trying to optimize efficiency, reduce total cost of ownership, address reliability issues, and increase performance. The table below attempts to capture many of the characteristics involved in the decision making process. The data center optimization is a complex multi-variate problem and requires a detailed engineering evaluation for any significant changes to be successful. Only following collection of the appropriate data and understanding the interactions within the data center should the evaluation of an alternative operating envelope be considered. Each parameter’s current and planned status could lead to a different endpoint for the data center optimization path. The worst case scenario would be for an end-user to assume that ITE capable of operating in class A3 or A4 would solve existing data center thermal management, power density or cooling problems due to their improved environmental capability. While the new IT equipment may operate in these classes, the data center problems will certainly be compounded thereby impacting data center energy use, cost, and reliability. The rigorous use of the tools and guidance in this whitepaper should preclude that. The following table summarizes the key characteristics and potential options to be considered when evaluating the optimal operating range for each data center.
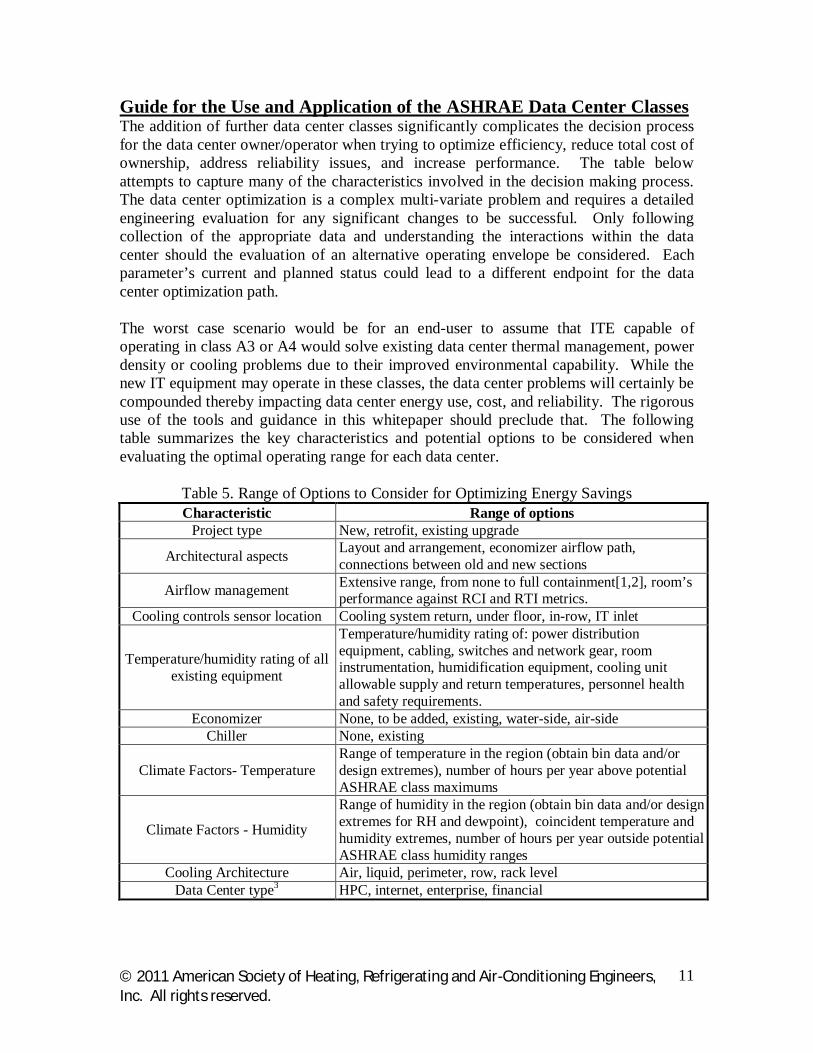
Table 5. Range of Options to Consider for Optimizing Energy Savings Characteristic Range of options
Project type New, retrofit, existing upgrade
Architectural aspects Layout and arrangement, economizer airflow path, connections between old and new sections
Airflow management Extensive range, from none to full containment[1,2], room’s performance against RCI and RTI metrics.
Cooling controls sensor location Cooling system return, under floor, in-row, IT inlet
Temperature/humidity rating of all existing equipment
Temperature/humidity rating of: power distribution equipment, cabling, switches and network gear, room instrumentation, humidification equipment, cooling unit allowable supply and return temperatures, personnel health and safety requirements.
Economizer None, to be added, existing, water-side, air-side Chiller None, existing
Climate Factors- Temperature Range of temperature in the region (obtain bin data and/or design extremes), number of hours per year above potential ASHRAE class maximums
Climate Factors - Humidity
Range of humidity in the region (obtain bin data and/or design extremes for RH and dewpoint), coincident temperature and humidity extremes, number of hours per year outside potential ASHRAE class humidity ranges
Cooling Architecture Air, liquid, perimeter, row, rack level Data Center type3 HPC, internet, enterprise, financial
© 2011 American Society of Heating, Refrigerating and Air-Conditioning Engineers, Inc. All rights reserved.
12
1) Some CRAC/CRAH units have limited return temperatures, as low as 30°C 2) With good airflow management, server temperature rise can be on the order of 20°C, with an inlet of temperature of 40°C the hot aisle could be 60°C 3) Data center type affects reliability/availability requirements
By understanding the characteristics described above along with the data center capability one can then follow the general steps necessary in setting the operating temperature and humidity range of the data center: Optimization Process: 1) Consider the state of best practices for the data center, implementation of most of these is a prerequisite before moving to a higher server inlet temperature operation, this includes airflow management as well as cooling system controls strategy 2) Determine maximum allowable ASHRAE class environment from 2011 ASHRAE Classes based on review of all IT equipment environmental specifications 3) Use the recommended operating envelope (See Table 4) or, if more energy savings is desired, use the following information to determine the operating envelope: a) Climate data for locale (only when utilizing economizers) b) Server Power Trend vs Ambient Temperature – see section A c) Acoustical Noise Levels in the Data Center vs Ambient Temperature – see section B d) Server Reliability Trend vs Ambient Temperature – see section C e) Server Reliability vs Moisture, Contamination and Other Temperature Effects – see section D f) Server Performance Trend vs Ambient Temperature – see section E g) Server Cost Trend vs Ambient Temperature – see section F The steps above provide a simplified view of the flowchart in Appendix F. The use of Appendix F is highly encouraged as a starting point for the evaluation of the options. The flowchart provides guidance to the data center operator on how to position their data center for operating in a specific environmental envelope. Possible endpoints range from optimization of TCO within the recommended envelope as specified in Table 4 to a chiller-less data center using any of the data center classes, but more importantly describes how to achieve even greater energy savings through the use of a TCO analysis utilizing the servers metrics provided in the next sections. Server Metrics to Guide Use of New Guidelines The development of the recommended envelopes for the 2004 and 2008 versions were based on the IT manufacturers’ knowledge of both the reliability and equipment power consumption trends of servers as a function of inlet air temperature. In order to use a different envelope providing greater flexibility in data center operation, some knowledge of these two factors must be provided. The next sections provide trend data for IT equipment for both power and reliability over a wide range of ambient temperatures. In addition, some aspects of server performance, acoustics, corrosion and cost vs. ambient temperature and humidity will also be discussed.
© 2011 American Society of Heating, Refrigerating and Air-Conditioning Engineers, Inc. All rights reserved.
13
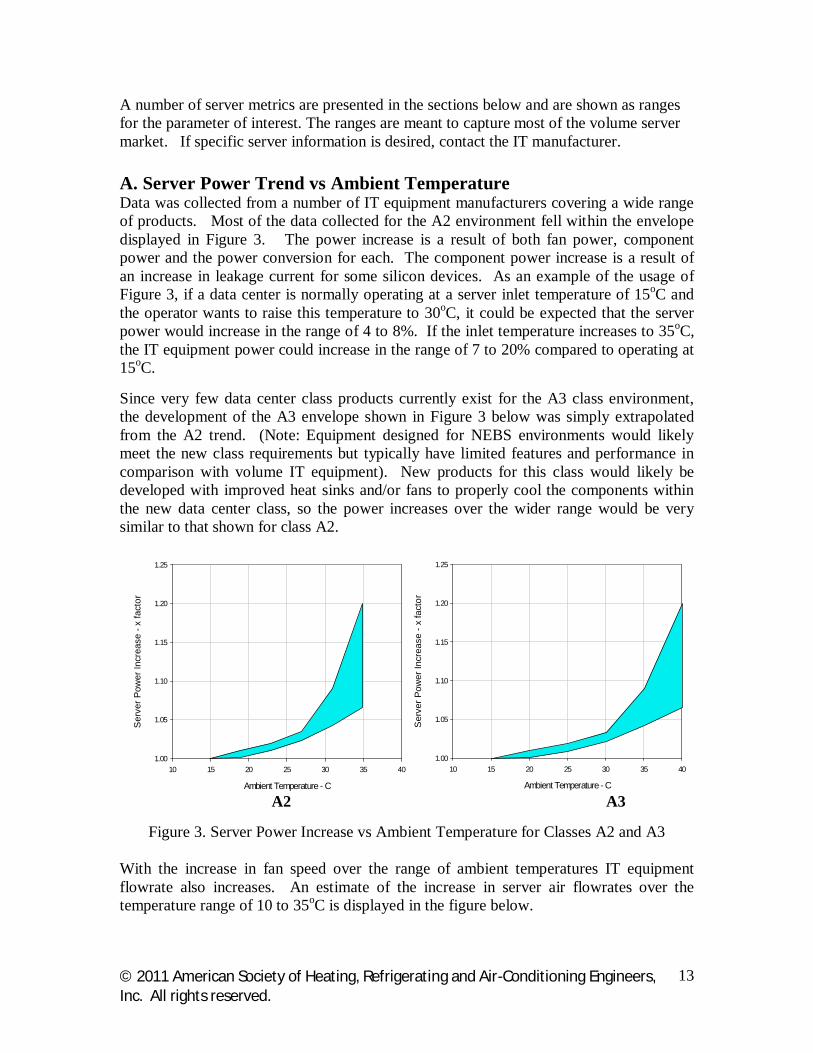
A number of server metrics are presented in the sections below and are shown as ranges for the parameter of interest. The ranges are meant to capture most of the volume server market. If specific server information is desired, contact the IT manufacturer. A. Server Power Trend vs Ambient Temperature Data was collected from a number of IT equipment manufacturers covering a wide range of products. Most of the data collected for the A2 environment fell within the envelope displayed in Figure 3. The power increase is a result of both fan power, component power and the power conversion for each. The component power increase is a result of an increase in leakage current for some silicon devices. As an example of the usage of Figure 3, if a data center is normally operating at a server inlet temperature of 15oC and the operator wants to raise this temperature to 30oC, it could be expected that the server power would increase in the range of 4 to 8%. If the inlet temperature increases to 35oC, the IT equipment power could increase in the range of 7 to 20% compared to operating at 15oC. Since very few data center class products currently exist for the A3 class environment, the development of the A3 envelope shown in Figure 3 below was simply extrapolated from the A2 trend. (Note: Equipment designed for NEBS environments would likely meet the new class requirements but typically have limited features and performance in comparison with volume IT equipment). New products for this class would likely be developed with improved heat sinks and/or fans to properly cool the components within the new data center class, so the power increases over the wider range would be very similar to that shown for class A2.
Ambient Temperature - C
10 15 20 25 30 35 40
Ser
ver P
ower
Incr
ease
- x
fact
or
1.00
1.05
1.10
1.15
1.20
1.25
Ambient Temperature - C
10 15 20 25 30 35 40
Ser
ver P
ower
Incr
ease
- x
fact
or
1.00
1.05
1.10
1.15
1.20
1.25
A2 A3
Figure 3. Server Power Increase vs Ambient Temperature for Classes A2 and A3
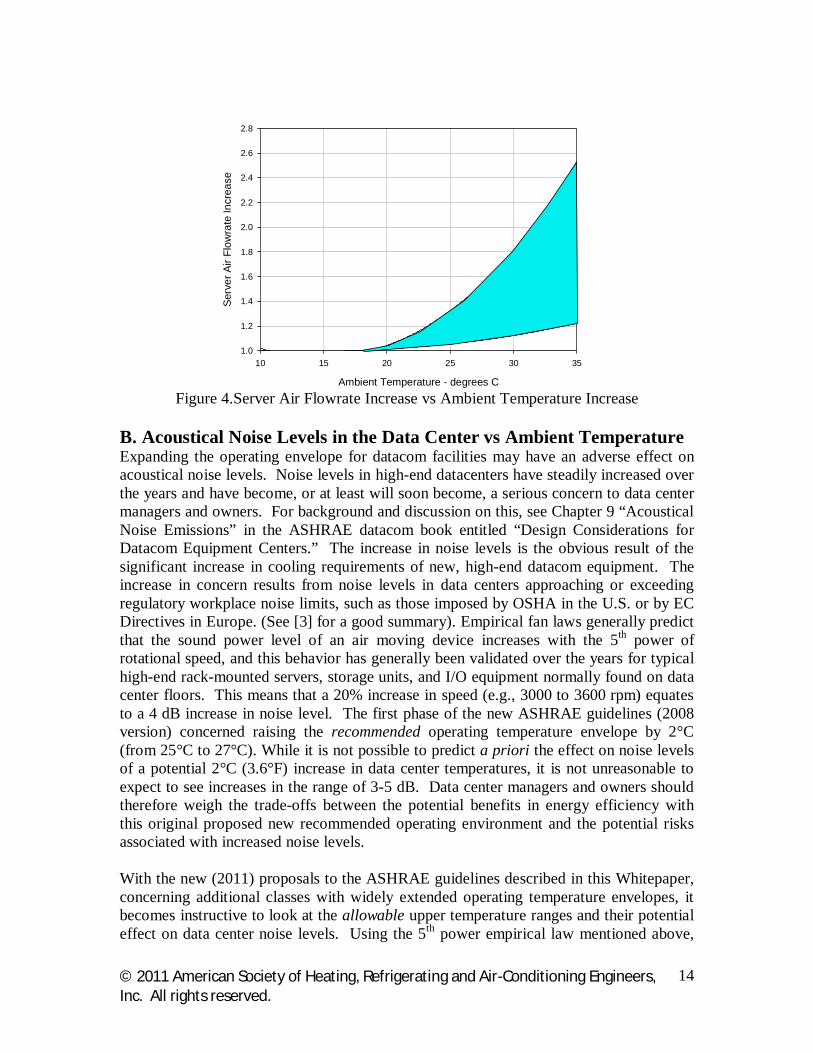
With the increase in fan speed over the range of ambient temperatures IT equipment flowrate also increases. An estimate of the increase in server air flowrates over the temperature range of 10 to 35oC is displayed in the figure below.
© 2011 American Society of Heating, Refrigerating and Air-Conditioning Engineers, Inc. All rights reserved.
14
Ambient Temperature - degrees C
10 15 20 25 30 35
Serv
er A
ir Fl
owra
te In
crea
se
1.0
1.2
1.4
1.6
1.8
2.0
2.2
2.4
2.6
2.8
Figure 4.Server Air Flowrate Increase vs Ambient Temperature Increase
B. Acoustical Noise Levels in the Data Center vs Ambient Temperature Expanding the operating envelope for datacom facilities may have an adverse effect on acoustical noise levels. Noise levels in high-end datacenters have steadily increased over the years and have become, or at least will soon become, a serious concern to data center managers and owners. For background and discussion on this, see Chapter 9 “Acoustical Noise Emissions” in the ASHRAE datacom book entitled “Design Considerations for Datacom Equipment Centers.” The increase in noise levels is the obvious result of the significant increase in cooling requirements of new, high-end datacom equipment. The increase in concern results from noise levels in data centers approaching or exceeding regulatory workplace noise limits, such as those imposed by OSHA in the U.S. or by EC Directives in Europe. (See [3] for a good summary). Empirical fan laws generally predict that the sound power level of an air moving device increases with the 5th power of rotational speed, and this behavior has generally been validated over the years for typical high-end rack-mounted servers, storage units, and I/O equipment normally found on data center floors. This means that a 20% increase in speed (e.g., 3000 to 3600 rpm) equates to a 4 dB increase in noise level. The first phase of the new ASHRAE guidelines (2008 version) concerned raising the recommended operating temperature envelope by 2°C (from 25°C to 27°C). While it is not possible to predict a priori the effect on noise levels of a potential 2°C (3.6°F) increase in data center temperatures, it is not unreasonable to expect to see increases in the range of 3-5 dB. Data center managers and owners should therefore weigh the trade-offs between the potential benefits in energy efficiency with this original proposed new recommended operating environment and the potential risks associated with increased noise levels. With the new (2011) proposals to the ASHRAE guidelines described in this Whitepaper, concerning additional classes with widely extended operating temperature envelopes, it becomes instructive to look at the allowable upper temperature ranges and their potential effect on data center noise levels. Using the 5th power empirical law mentioned above,
© 2011 American Society of Heating, Refrigerating and Air-Conditioning Engineers, Inc. All rights reserved.
15
coupled with current practices for ramping-up air moving device speeds based on ambient temperature, the following A-weighted sound power level increases were predicted for typical air-cooled high-end server racks (containing typical mixes of power assemblies, CEC cages or drawers, I/O drawers, and modular water cooling units).
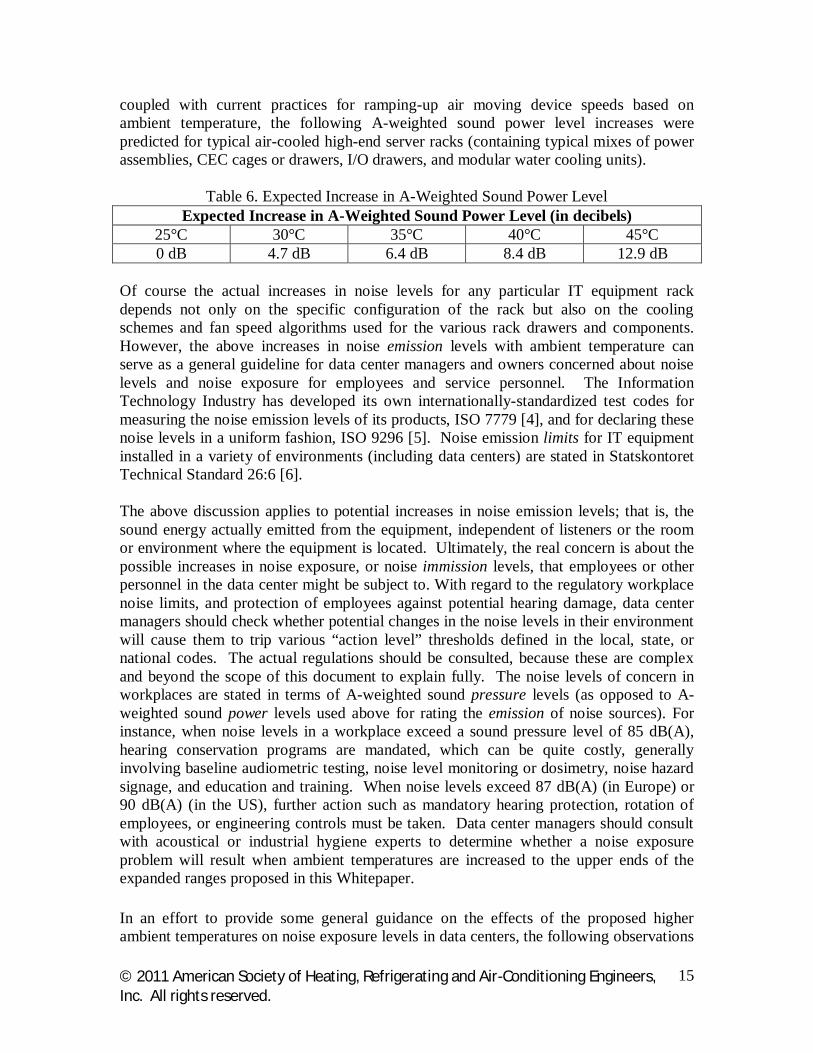
Table 6. Expected Increase in A-Weighted Sound Power Level Expected Increase in A-Weighted Sound Power Level (in decibels)
25°C 30°C 35°C 40°C 45°C 0 dB 4.7 dB 6.4 dB 8.4 dB 12.9 dB
Of course the actual increases in noise levels for any particular IT equipment rack depends not only on the specific configuration of the rack but also on the cooling schemes and fan speed algorithms used for the various rack drawers and components. However, the above increases in noise emission levels with ambient temperature can serve as a general guideline for data center managers and owners concerned about noise levels and noise exposure for employees and service personnel. The Information Technology Industry has developed its own internationally-standardized test codes for measuring the noise emission levels of its products, ISO 7779 [4], and for declaring these noise levels in a uniform fashion, ISO 9296 [5]. Noise emission limits for IT equipment installed in a variety of environments (including data centers) are stated in Statskontoret Technical Standard 26:6 [6]. The above discussion applies to potential increases in noise emission levels; that is, the sound energy actually emitted from the equipment, independent of listeners or the room or environment where the equipment is located. Ultimately, the real concern is about the possible increases in noise exposure, or noise immission levels, that employees or other personnel in the data center might be subject to. With regard to the regulatory workplace noise limits, and protection of employees against potential hearing damage, data center managers should check whether potential changes in the noise levels in their environment will cause them to trip various “action level” thresholds defined in the local, state, or national codes. The actual regulations should be consulted, because these are complex and beyond the scope of this document to explain fully. The noise levels of concern in workplaces are stated in terms of A-weighted sound pressure levels (as opposed to A-weighted sound power levels used above for rating the emission of noise sources). For instance, when noise levels in a workplace exceed a sound pressure level of 85 dB(A), hearing conservation programs are mandated, which can be quite costly, generally involving baseline audiometric testing, noise level monitoring or dosimetry, noise hazard signage, and education and training. When noise levels exceed 87 dB(A) (in Europe) or 90 dB(A) (in the US), further action such as mandatory hearing protection, rotation of employees, or engineering controls must be taken. Data center managers should consult with acoustical or industrial hygiene experts to determine whether a noise exposure problem will result when ambient temperatures are increased to the upper ends of the expanded ranges proposed in this Whitepaper.
In an effort to provide some general guidance on the effects of the proposed higher ambient temperatures on noise exposure levels in data centers, the following observations
© 2011 American Society of Heating, Refrigerating and Air-Conditioning Engineers, Inc. All rights reserved.
16
can be made (but again, the caution is made to seek professional help in actual situations since regulatory and legal requirements are at issue). Modeling and predictions of typical IT equipment racks, with typical front-rear directivity, in typical data centers have shown that the sound pressure level in the center of a typical aisle between two rows of continuous racks will reach the regulatory trip level of 85 dB(A) when each of the individual racks in the rows has a measured (as opposed to a statistical upper limit) sound power levels of roughly 8.4 B (84 dB sound power level). If it is assumed that this is the starting condition for a 25°C ambient data center temperature—and many typical high-end server racks today are at or above this 8.4-B level—the sound pressure level in the center of the aisle would be expected to increase to 89.7 dB(A) at 30°C ambient, to 91.4 dB(A) at 35°C ambient, to 93.4 dB(A) at 35°C ambient, and to 97.9 dB(A) at 45°C ambient, using the predicted increases to sound power level above. Needless to say, these levels are extremely high. They are not only above the regulatory trip levels for mandated action (or fines, in the absence of action), but they clearly pose a risk of hearing damage unless controls are instituted to avoid exposure by data center personnel.
C. Server Reliability Trend vs Ambient Temperature Before embarking on the path of extensive use of data center economizers or wider environmental operating limits, it is important to understand the reliability (failure rate) impact of those changes. The hardware failure rate within a given data center will be determined by the local climate, the type of economization being implemented, and the temperature and humidity range over which economization is being carried out. Most economized facilities have a means of mixing hot exhaust air with incoming cold air so the minimum data center temperature is usually tempered to something in the range of 15 to 20oC. All of the IT equipment (servers, storage, networking, power, etc.) in a data center using an economizer must be rated to operate over the planned data center class of temperature and humidity range. To understand the impact of temperature on hardware failure rates one can model different economization scenarios. First, consider the ways economization can be implemented and how this would impact the data center temperature. For purposes of this discussion, consider three broad categories of economized facilities:
1) Economization over a narrow temperature range with little or no change to the data center temperature. This is the primary control methodology, where the data center is properly configured controlling the air temperature at or near the IT inlet to the data center operators chosen temperature. The economizer modulates to bring in more or less cool air (air-side) or adjust the cool water flow or temperature (water-side) to meet this required temperature. If the external conditions or internal load change such that the economizer can no longer handle the task on its own, the chiller will ramp up providing additional cooling capacity thereby keeping the space at the desired temperature. This is the most benign implementation of economizing so the temperature of the data center is essentially the same as if the data center was not economized. If there is little or no temperature change then there should be little or no failure rate impact of
© 2011 American Society of Heating, Refrigerating and Air-Conditioning Engineers, Inc. All rights reserved.
17
temperature on the data center hardware from temperature. This economization scenario probably represents the vast majority of economized data centers.
2) Expanded temperature range economization where there may be a net increase in
the data center temperature some of the time. Some data centers may choose to take advantage of more hours of economization by raising their data center temperature limits and widening the temperature range over which they will operate their facility.
3) A chiller-less data center facility where the data center temperature is higher and
varies with the outdoor air temperature and local climate. Some data centers in cool climates may want to reduce their data center construction capital costs by building a chiller-less facility. In chiller-less data center facilities, the temperature in the data center will vary over a much wider range that is determined, at least in part, by the temperature of the outdoor air and the local climate. These facilities may use supplemental cooling methods that are not chiller-based such as evaporative cooling.
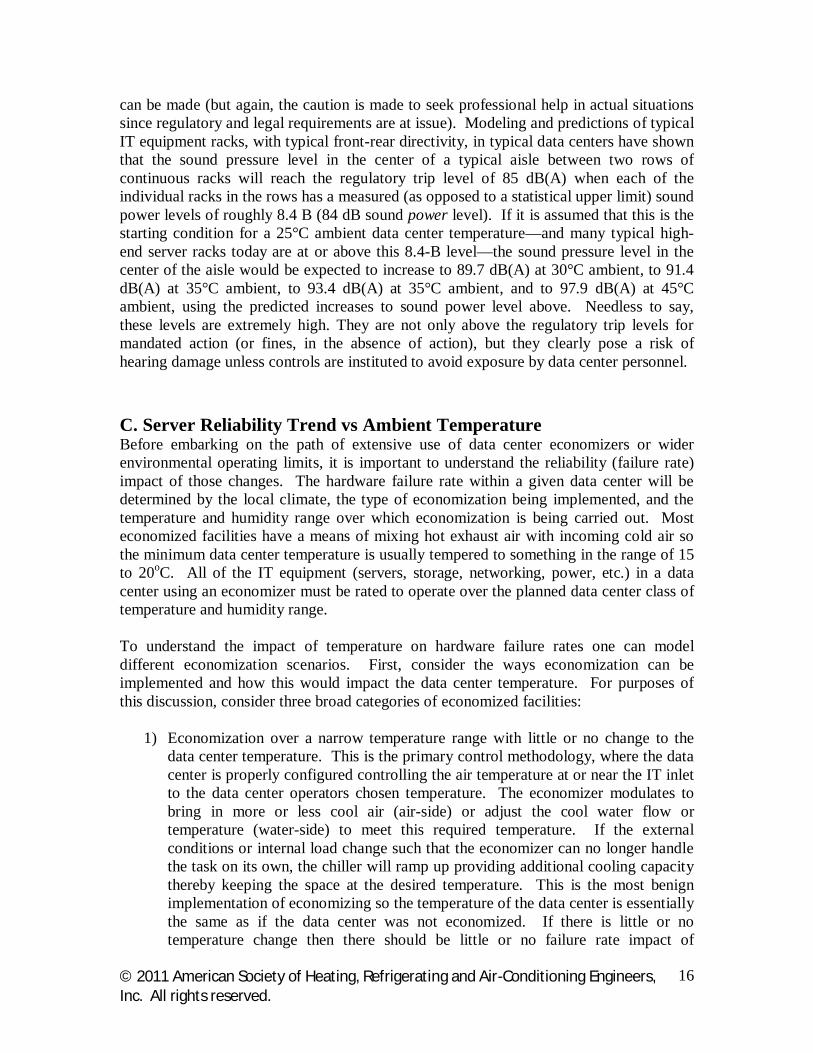
In the following section the impact of expanded temperature and chiller-less economization on hardware failure rates is analyzed. The discussion that follows is not meant to imply a specific data center environmental control algorithm. The method and approach was chosen to facilitate analysis of the data in a simple manner that illustrates key findings. To understand the impact of the use of a chiller-less economized data center implementation on hardware failure rates, consider the city of Chicago as an example. When the time-at-temperature climate data for Chicago is plotted as a histogram as shown in Figure 5, one can see the vast majority of the hours in a year are spent at cool and cold temperature (below 20oC) and, while Chicago does get hot in the summer, those hot periods do not last long and comprise only a very small percentage of the hours in a given year.
© 2011 American Society of Heating, Refrigerating and Air-Conditioning Engineers, Inc. All rights reserved.
18
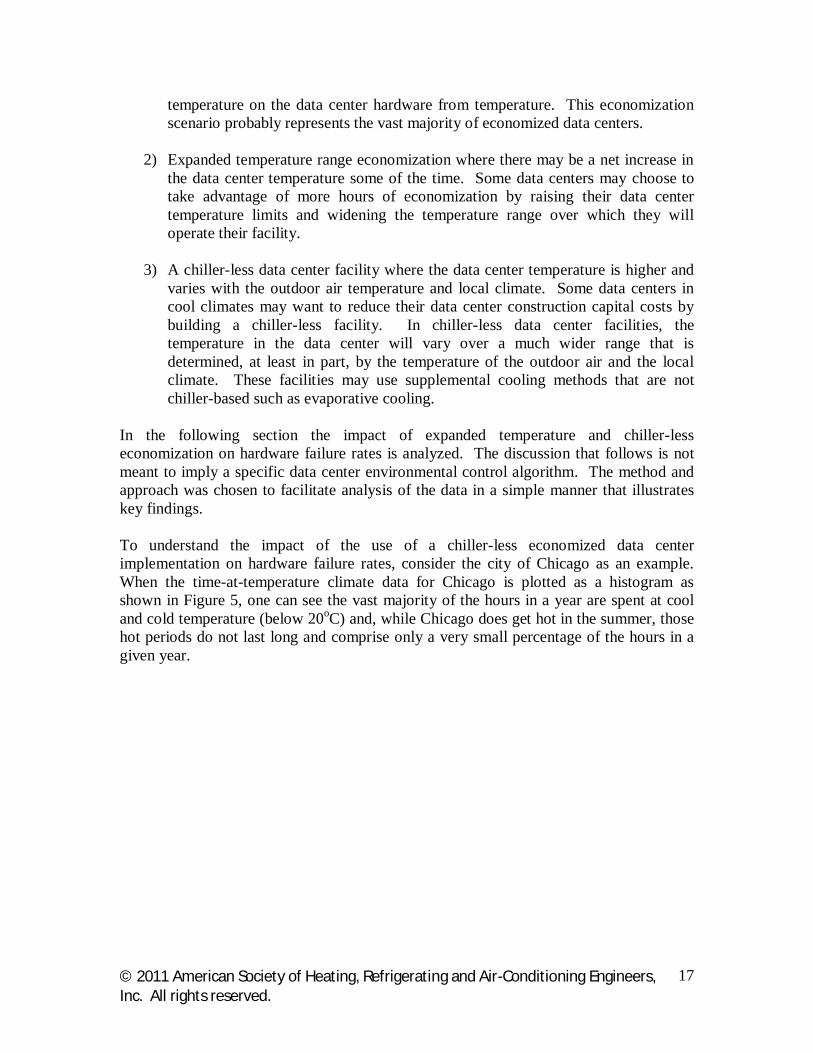
Figure 5. Histogram of dry bulb temperatures for the city of Chicago for the year 2010. With an air-side economizer the data center fans will do some work on the incoming air and will raise its temperature by about 1.5oC going from outside the data center to the inlet of the IT equipment. Also, most data centers with economizers have a means of air mixing to maintain a minimum data center temperature in the range of 15 to 20oC, even in the winter. Applying these assumptions to the Chicago climate data, the histogram transforms into the one shown in Figure 6.
Figure 6. 2010 dry bulb temperatures for Chicago with economization assumptions applied. Assumptions include reuse of server exhaust heat to maintain a minimum 15 to 20oC temperature and a 1.5oC temperature rise from outdoor air to server inlet.
0
200
400
600
800
1000
1200
1400
1600
-20
to -1
5
-15
to -1
0
-10
to -5
-5 to
0
0 to
5
5 to
10
10 to
15
15 to
20C
20 to
25C
25 to
30C
30 to
35C
Hou
rs D
urin
g Ye
ar 2
010
Dry Bulb Temperature ( C)
0
1000
2000
3000
4000
5000
6000
7000
15 to
20C
20 to
25C
25 to
30C
30 to
35C
Hou
rs D
urin
g Ye
ar 2
010
Dry Bulb Temperature ( C)
© 2011 American Society of Heating, Refrigerating and Air-Conditioning Engineers, Inc. All rights reserved.
19
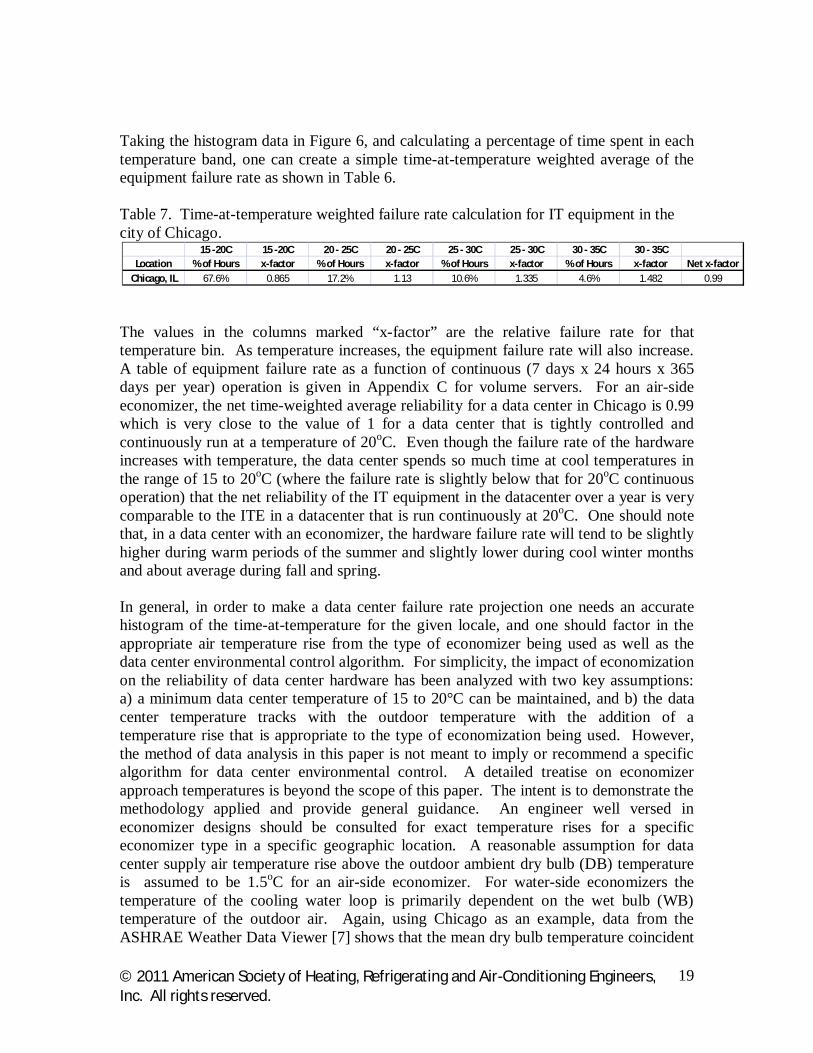
Taking the histogram data in Figure 6, and calculating a percentage of time spent in each temperature band, one can create a simple time-at-temperature weighted average of the equipment failure rate as shown in Table 6. Table 7. Time-at-temperature weighted failure rate calculation for IT equipment in the city of Chicago.
The values in the columns marked “x-factor” are the relative failure rate for that temperature bin. As temperature increases, the equipment failure rate will also increase. A table of equipment failure rate as a function of continuous (7 days x 24 hours x 365 days per year) operation is given in Appendix C for volume servers. For an air-side economizer, the net time-weighted average reliability for a data center in Chicago is 0.99 which is very close to the value of 1 for a data center that is tightly controlled and continuously run at a temperature of 20oC. Even though the failure rate of the hardware increases with temperature, the data center spends so much time at cool temperatures in the range of 15 to 20oC (where the failure rate is slightly below that for 20oC continuous operation) that the net reliability of the IT equipment in the datacenter over a year is very comparable to the ITE in a datacenter that is run continuously at 20oC. One should note that, in a data center with an economizer, the hardware failure rate will tend to be slightly higher during warm periods of the summer and slightly lower during cool winter months and about average during fall and spring. In general, in order to make a data center failure rate projection one needs an accurate histogram of the time-at-temperature for the given locale, and one should factor in the appropriate air temperature rise from the type of economizer being used as well as the data center environmental control algorithm. For simplicity, the impact of economization on the reliability of data center hardware has been analyzed with two key assumptions: a) a minimum data center temperature of 15 to 20°C can be maintained, and b) the data center temperature tracks with the outdoor temperature with the addition of a temperature rise that is appropriate to the type of economization being used. However, the method of data analysis in this paper is not meant to imply or recommend a specific algorithm for data center environmental control. A detailed treatise on economizer approach temperatures is beyond the scope of this paper. The intent is to demonstrate the methodology applied and provide general guidance. An engineer well versed in economizer designs should be consulted for exact temperature rises for a specific economizer type in a specific geographic location. A reasonable assumption for data center supply air temperature rise above the outdoor ambient dry bulb (DB) temperature is assumed to be 1.5oC for an air-side economizer. For water-side economizers the temperature of the cooling water loop is primarily dependent on the wet bulb (WB) temperature of the outdoor air. Again, using Chicago as an example, data from the ASHRAE Weather Data Viewer [7] shows that the mean dry bulb temperature coincident
15 -20C 15 -20C 20 - 25C 20 - 25C 25 - 30C 25 - 30C 30 - 35C 30 - 35CLocation % of Hours x-factor % of Hours x-factor % of Hours x-factor % of Hours x-factor Net x-factor
Chicago, IL 67.6% 0.865 17.2% 1.13 10.6% 1.335 4.6% 1.482 0.99
© 2011 American Society of Heating, Refrigerating and Air-Conditioning Engineers, Inc. All rights reserved.
20
with wet bulb temperature shows roughly a 5oC rise. (e.g. When the WB is 20oC the mean DB temperature coincident with the 20oC WB is 25oC DB.). If one assumes that the tower and heat exchangers have a reasonably close approach temperature, then on the average day in Chicago the water-side economizer should also be able to provide data center supply air 1.5oC above the outdoor dry bulb. For water-side economization with a dry-cooler type tower (closed loop, no evaporation) a 12oC air temperature rise of the data center air above the outdoor ambient air temperature is assumed. It is worth reiterating that the following data sets were based upon the above assumptions and that different geographies (with different WB/DB combinations) will have different temperature rise based on the specifics of the economizer in place. That stated, the differences between the 1.5oC rise and the 12oC rise for the same cities indicate that if they are a degree or two off that the result will be well within the error bars. Time-at-temperature weighted average failure rate projections are shown below in Figures 7, 8, 9 and 10 for selected US and world-wide cities for different economizer scenarios. The calculations for those graphs, including the percentage of hours spent within each temperature range for each city, and the reliability data as a function of temperature can be found in Appendix C. It is important to be clear what the relative failure rate values mean. We have normalized the results to a data center run continuously at 20°C; this has the relative failure rate of 1.0. For those cities with values below 1.0, the implication is that the economizer still functions and the data center is cooled below 20°C (to 15°C) for those hours each year. In addition the relative failure rate shows the expected increase in the number of failed servers, not the percentage of total servers failing; e.g. if a data center that experiences 4 failures per 1000 servers incorporates warmer temperatures and the relative failure rate is 1.2, then the expected failure rate would be 5 failures per 1000 servers. To provide a further frame of reference on data center hardware failures references [4,5] showed blade hardware server failures were in the range of 2.5 to 3.8% over twelve months in two different data centers with supply temperatures of approximately 20oC. In a similar data center that included an air-side economizer with temperatures occasionally ranging to 35oC (at an elevation around 1600m) the failure rate was 4.5%. These values are provided solely to provide some guidance with an example of failure rates. Failure in that study was defined as anytime a server required hardware attention. No attempt to categorize the failure mechanisms was made.
© 2011 American Society of Heating, Refrigerating and Air-Conditioning Engineers, Inc. All rights reserved.
21
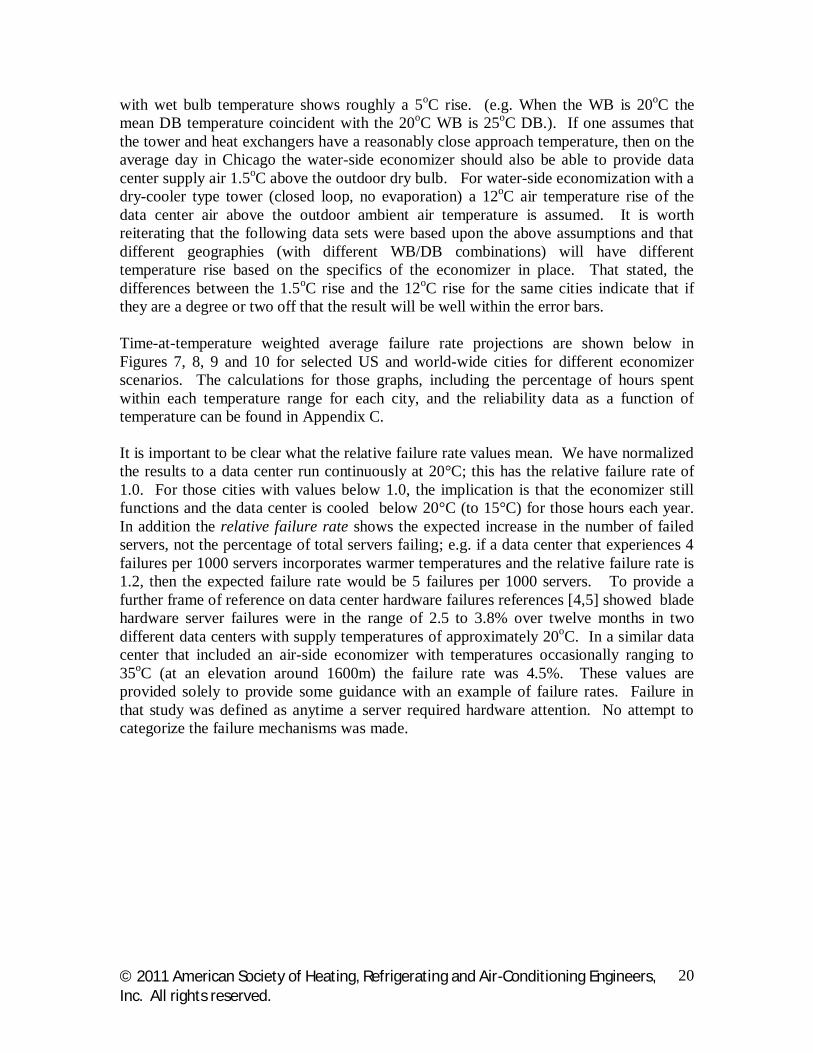
Figure 7. Failure rate projections for air side economizer and water-side economizer for selected US cities. Note that it is assumed that both forms of economizer will result in data center supply air 1.5oC above the outdoor dry bulb.
Figure 8. Failure rate projections for water side economizer with a dry-cooler type tower for selected US cities. Note that it is assumed that the economizer will result in data center supply air 12oC above the outdoor dry bulb.
0.0
0.2
0.4
0.6
0.8
1.0
1.2
1.4
1.6
1.8
Rel
ativ
e Fa
ilure
Rat
e
Air-Side and Water-Side Economization
Class A2
Class A3
Class A4
30C – 7 x 24 x 365 operation
35C – 7 x 24 x 365 operation
0.0
0.2
0.4
0.6
0.8
1.0
1.2
1.4
1.6
1.8
Rel
ativ
e Fa
ilure
Rat
e
Water-Side (Dry-Cooler Type Tower) Economization
Class A2
Class A3
Class A4
30C – 7 x 24 x 365 operation
35C – 7 x 24 x 365 operation
© 2011 American Society of Heating, Refrigerating and Air-Conditioning Engineers, Inc. All rights reserved.
22
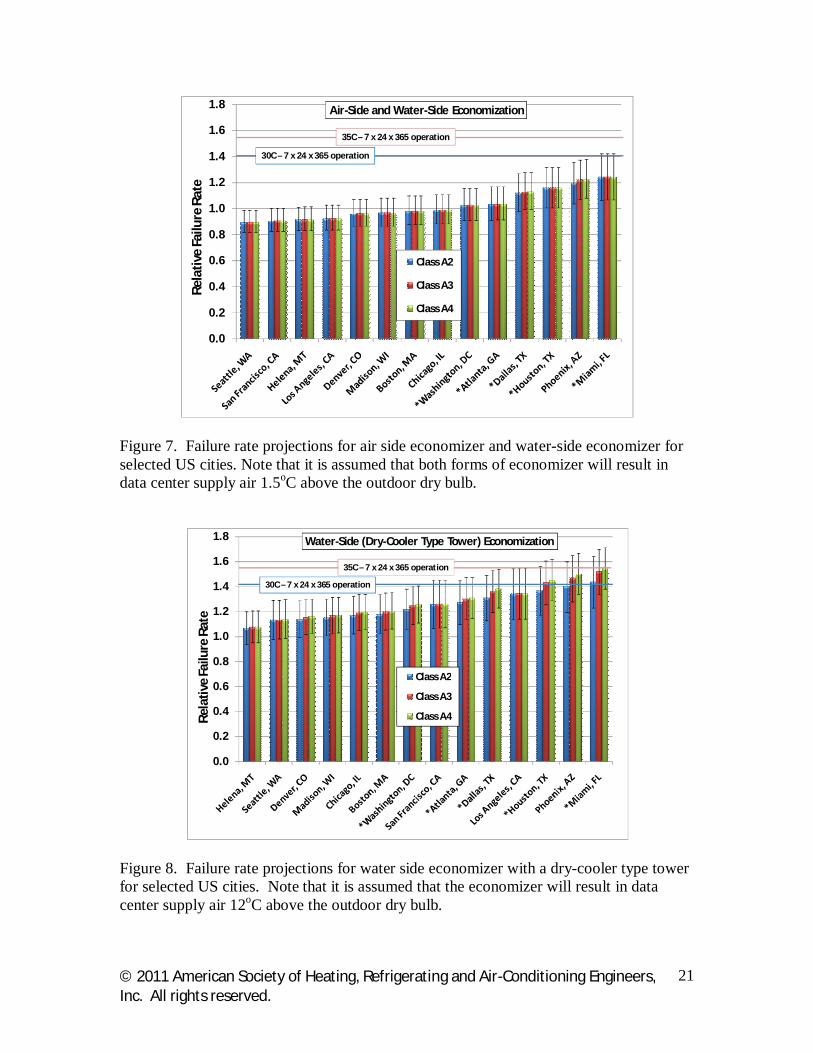
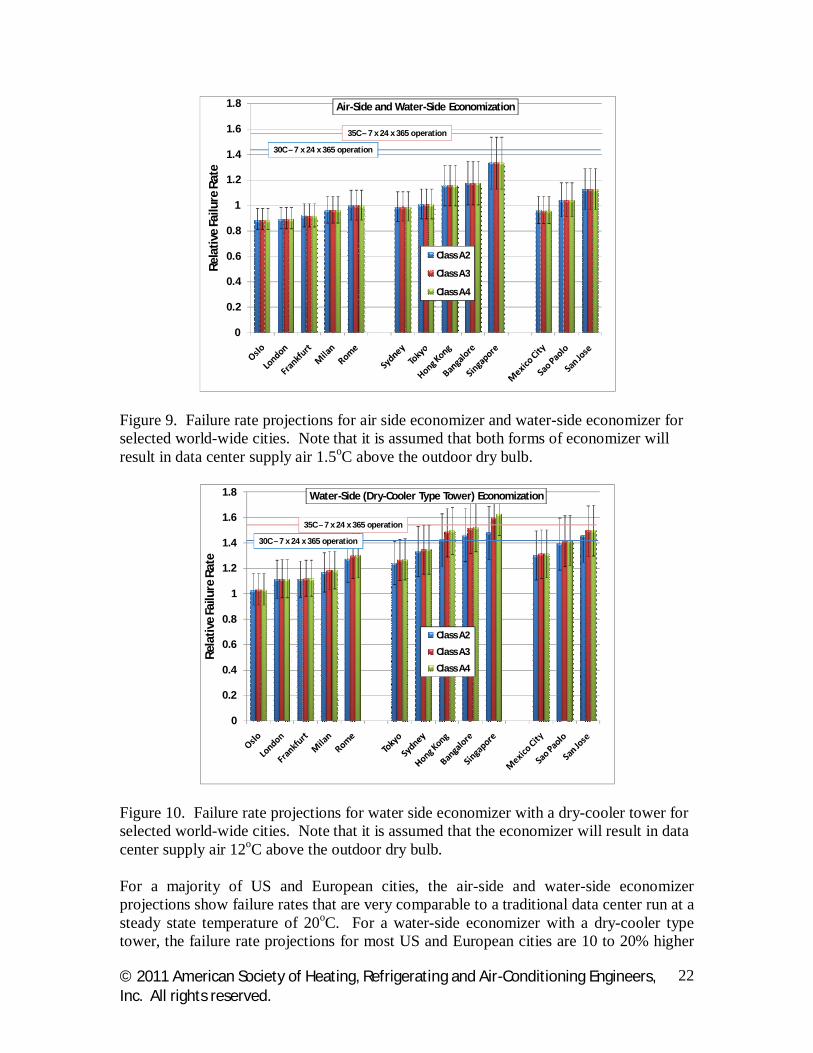
Figure 9. Failure rate projections for air side economizer and water-side economizer for selected world-wide cities. Note that it is assumed that both forms of economizer will result in data center supply air 1.5oC above the outdoor dry bulb.
Figure 10. Failure rate projections for water side economizer with a dry-cooler tower for selected world-wide cities. Note that it is assumed that the economizer will result in data center supply air 12oC above the outdoor dry bulb. For a majority of US and European cities, the air-side and water-side economizer projections show failure rates that are very comparable to a traditional data center run at a steady state temperature of 20oC. For a water-side economizer with a dry-cooler type tower, the failure rate projections for most US and European cities are 10 to 20% higher
0
0.2
0.4
0.6
0.8
1
1.2
1.4
1.6
1.8
Rel
ativ
e Fa
ilure
Rat
e
Air-Side and Water-Side Economization
Class A2
Class A3
Class A4
30C – 7 x 24 x 365 operation
35C – 7 x 24 x 365 operation
0
0.2
0.4
0.6
0.8
1
1.2
1.4
1.6
1.8
Rel
ativ
e Fa
ilure
Rat
e
Water-Side (Dry-Cooler Type Tower) Economization
Class A2
Class A3
Class A4
30C – 7 x 24 x 365 operation
35C – 7 x 24 x 365 operation
© 2011 American Society of Heating, Refrigerating and Air-Conditioning Engineers, Inc. All rights reserved.
23
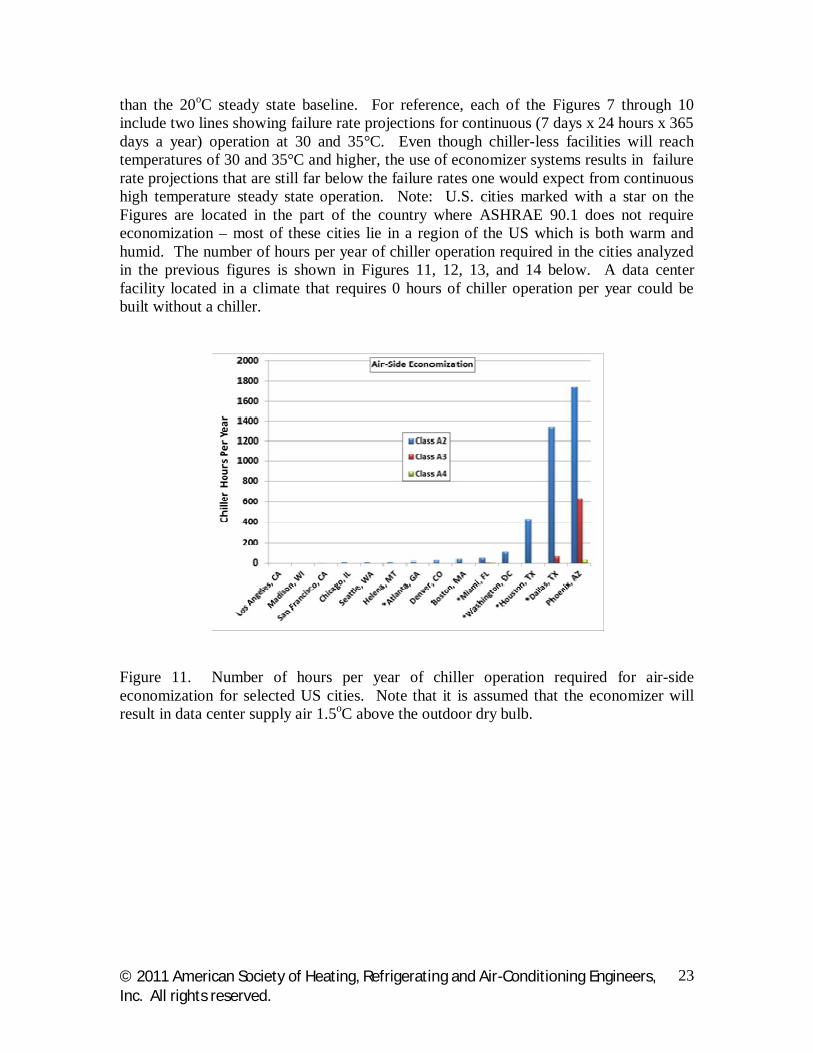
than the 20oC steady state baseline. For reference, each of the Figures 7 through 10 include two lines showing failure rate projections for continuous (7 days x 24 hours x 365 days a year) operation at 30 and 35°C. Even though chiller-less facilities will reach temperatures of 30 and 35°C and higher, the use of economizer systems results in failure rate projections that are still far below the failure rates one would expect from continuous high temperature steady state operation. Note: U.S. cities marked with a star on the Figures are located in the part of the country where ASHRAE 90.1 does not require economization – most of these cities lie in a region of the US which is both warm and humid. The number of hours per year of chiller operation required in the cities analyzed in the previous figures is shown in Figures 11, 12, 13, and 14 below. A data center facility located in a climate that requires 0 hours of chiller operation per year could be built without a chiller.
Figure 11. Number of hours per year of chiller operation required for air-side economization for selected US cities. Note that it is assumed that the economizer will result in data center supply air 1.5oC above the outdoor dry bulb.
© 2011 American Society of Heating, Refrigerating and Air-Conditioning Engineers, Inc. All rights reserved.
24
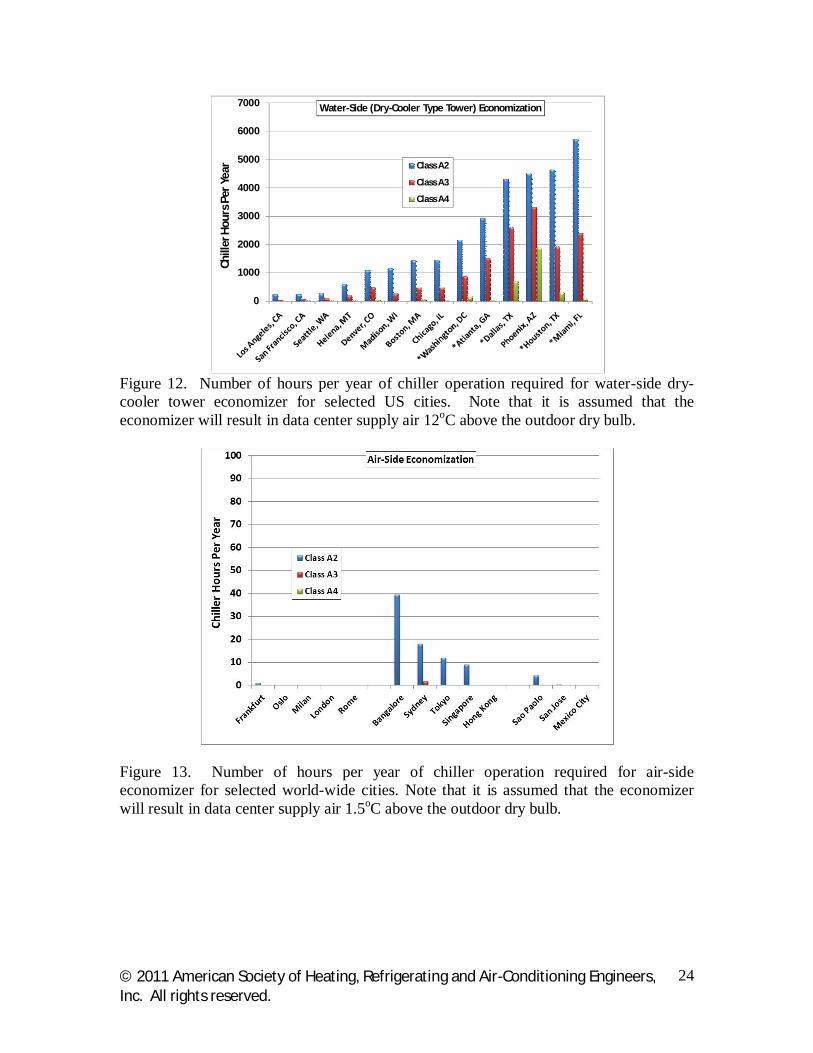
Figure 12. Number of hours per year of chiller operation required for water-side dry-cooler tower economizer for selected US cities. Note that it is assumed that the economizer will result in data center supply air 12oC above the outdoor dry bulb.
Figure 13. Number of hours per year of chiller operation required for air-side economizer for selected world-wide cities. Note that it is assumed that the economizer will result in data center supply air 1.5oC above the outdoor dry bulb.
0
1000
2000
3000
4000
5000
6000
7000
Chill
er H
ours
Per
Yea
r
Water-Side (Dry-Cooler Type Tower) Economization
Class A2
Class A3
Class A4
© 2011 American Society of Heating, Refrigerating and Air-Conditioning Engineers, Inc. All rights reserved.
25
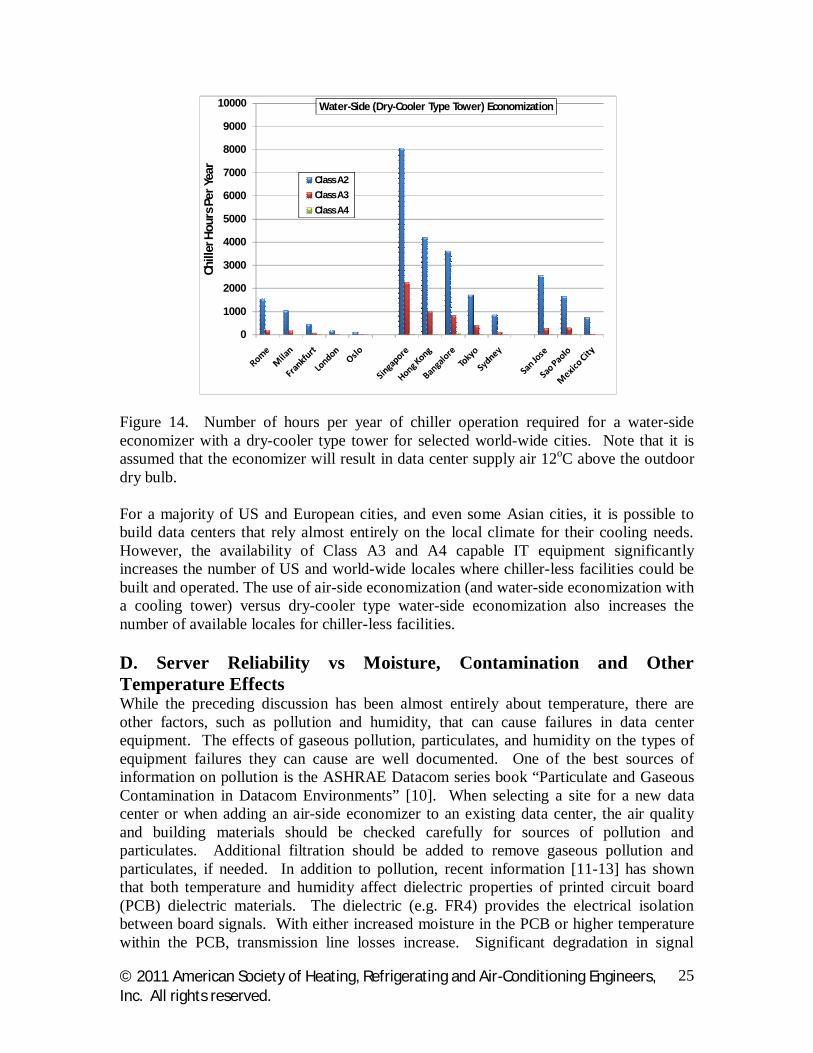
Figure 14. Number of hours per year of chiller operation required for a water-side economizer with a dry-cooler type tower for selected world-wide cities. Note that it is assumed that the economizer will result in data center supply air 12oC above the outdoor dry bulb. For a majority of US and European cities, and even some Asian cities, it is possible to build data centers that rely almost entirely on the local climate for their cooling needs. However, the availability of Class A3 and A4 capable IT equipment significantly increases the number of US and world-wide locales where chiller-less facilities could be built and operated. The use of air-side economization (and water-side economization with a cooling tower) versus dry-cooler type water-side economization also increases the number of available locales for chiller-less facilities. D. Server Reliability vs Moisture, Contamination and Other Temperature Effects While the preceding discussion has been almost entirely about temperature, there are other factors, such as pollution and humidity, that can cause failures in data center equipment. The effects of gaseous pollution, particulates, and humidity on the types of equipment failures they can cause are well documented. One of the best sources of information on pollution is the ASHRAE Datacom series book “Particulate and Gaseous Contamination in Datacom Environments” [10]. When selecting a site for a new data center or when adding an air-side economizer to an existing data center, the air quality and building materials should be checked carefully for sources of pollution and particulates. Additional filtration should be added to remove gaseous pollution and particulates, if needed. In addition to pollution, recent information [11-13] has shown that both temperature and humidity affect dielectric properties of printed circuit board (PCB) dielectric materials. The dielectric (e.g. FR4) provides the electrical isolation between board signals. With either increased moisture in the PCB or higher temperature within the PCB, transmission line losses increase. Significant degradation in signal
0
1000
2000
3000
4000
5000
6000
7000
8000
9000
10000
Chill
er H
ours
Per
Yea
r
Water-Side (Dry-Cooler Type Tower) Economization
Class A2
Class A3
Class A4
© 2011 American Society of Heating, Refrigerating and Air-Conditioning Engineers, Inc. All rights reserved.
26
integrity performance can occur as the board temperature and contained moisture increase. Contained moisture changes relatively slowly, on the order of hours and days, based on the absorption rate of the moisture into the board. Outer board layers are affected first and longer-term moisture exposure will affect these layers first. Temperature changes on the order of minutes and can quickly affect performance. As more high speed signals are routed in the PCB, both temperature and humidity will become even greater concerns for ITE manufacturers. The cost of PCB material may increase significantly and may increase the cost of class A3 and A4 rated IT equipment. The alternative for the ITE manufacturer is to use lower speed bus options which will lower performance. Excessive exposure to high humidity can induce performance degradations or failures at various circuitry levels. At the PCB level, Conductive Anodic Filament (CAF) grows along the delaminated fiber/epoxy interfaces where moisture facilitates the formation of a conductive path [14,15]. At the substrate level, moisture can cause the surface dendrite growth between pads of opposite bias due to the electrochemical migration. This is a growing concern due to continuing C4 pitch refinement. At the silicon level, moisture can induce degradation or loss of the adhesive strength in the dielectric layers while additional stress can result from hygroscopic swelling in package materials. The combination of these two effects often cause de-lamination near the die corner region where thermal-mechanical stress is inherently high and more accessible for moisture. It is worth noting that temperature plays an important role in the moisture effects. On the one hand, higher temperature increases the diffusivity coefficients and accelerates the electrochemical reaction. On the other hand the locally higher temperature due to the self-heating also reduces the local relative humidity drying out the circuit components enhancing their reliability. In addition to the above diffusion driven mechanism, another obvious issue with high humidity is condensation. This can result from sudden ambient temperature drop or the presence of a lower temperature source for water-cooled or refrigeration-cooled systems. Condensation can cause failures in electrical and mechanical devices through electrical shorting and corrosion. Other examples of failure mode exacerbated by high relative humidity include hygroscopic dust failures (HDF) [16], tape media errors and excessive wear [17], and corrosion. These failures are found in environments that exceed 60% RH for extended periods of time. As a rule, the typical mission-critical data center must give the utmost consideration of the trade-offs before they opt to operate with relative humidity that exceeds 60% for the following reasons: It is well known that moisture and pollutants are necessary for metals to corrode.
Moisture alone is not sufficient in causing atmospheric corrosion. Pollution aggravates corrosion in the following ways: o Corrosion products such as oxides may form and protect the metal and slow down
the corrosion rate. In the presence of gaseous pollutants like SO2 and H2S and
© 2011 American Society of Heating, Refrigerating and Air-Conditioning Engineers, Inc. All rights reserved.
27
ionic pollutants like chlorides, the corrosion-product films are less protective, allowing corrosion to proceed somewhat linearly. When the relative humidity in the data center is greater than the deliquescent relative humidity of the corrosion products, such as copper sulfate, cupric chloride, and the like, the corrosion-product films get wet, dramatically increasing the rate of corrosion. Cupric chloride, a common corrosion product on copper, has a deliquescence relative humidity of about 65%. A data center with relative humidity greater than 65% would result in the cupric chloride absorbing moisture, getting wet and aggravating copper corrosion rate.
o Dust is ubiquitous. Even with our best filtration efforts, fine dust will be present in a datacenter and will settle on electronic hardware. Fortunately, most dust has particles with high deliquescent relative humidity, which is the relative humidity at which the dust absorbs enough water to become wet and promote corrosion and/or ion migration. When the deliquescent relative humidity of dust is greater than the relative humidity in the data center, the dust stays dry and does not contribute to corrosion or ion migration. However on the rare occurrence when the dust has deliquescent relative humidity lower than the relative humidity in the datacenter, the dust will absorb moisture, get wet and promote corrosion and/or ion migration, degrading hardware reliability. A 1993 study by Comizzoli et. al. [16] showed that leakage current due to dust, from various locations worldwide, settled on printed circuit boards, increased exponentially with relative humidity. This study leads us to the conclusion that keeping the relative humidity in a data center below about 60% will keep the leakage current from settled fine dust in the acceptable sub-angstrom range.
Gaseous contamination concentrations that lead to silver and/or copper corrosion rates greater that about 300 angstroms/month have been known to cause the two most common recent failure modes of copper creep corrosion on circuit boards and the corrosion of silver metallization in miniature surface mounted components. As already explained, relative humidity greatly increases the corrosion rate, when it is greater than the deliquescence relative humidity of the corrosion products formed on metal surfaces by gaseous attack. In summary, if protection of mission-critical data center hardware is paramount, it can best be protected from corrosion by keeping the relative humidity less than 60% and by limiting the particulate and gaseous contamination concentration to levels at which the copper and/or silver corrosion rates are less than 300 angstrom/month. Given these reliability concerns, datacenter operators need to pay close attention to the overall datacenter humidity and local condensation concerns especially when running economizer on hot/humid summer days. When operating in polluted geographies, data center operators must also consider particulate and gaseous contamination because the contaminates can influence the acceptable temperature and humidity limits within which data centers must operate to keep corrosion-related hardware failures rates at acceptable levels. Dehumidification, filtration and gas-phase filtration may become necessary in polluted geographies with high humidity.
© 2011 American Society of Heating, Refrigerating and Air-Conditioning Engineers, Inc. All rights reserved.
28
E. Server Performance Trend vs Ambient Temperature The capability for supporting an environment depends upon the thermal design and management implementation of the IT equipment. Each component within the IT equipment has thermal limits that must be met based upon the intended usage. Components such as processors have features that enable maximizing performance within power and thermal constraints based on a thermal design power (TDP). That TDP is provided to guide the IT thermal design engineer during the design phase so that the cooling is sufficiently sized. If the IT equipment is not designed to meet the full capability implied by the TDP performance can be impacted. With some components, power consumption and performance reductions are handled gracefully with somewhat predictable results. Processors can move to various states with different power consumption based on the real-time cooling capability (as determined by monitoring thermal sensor data) of the system in its environment. Other components have little or no power management capability. Many components have no direct thermal sensor coverage and no mechanisms for power management to stay within their thermal limits. If environmental specifications are not met, component functional temperature limits can be exceeded resulting in loss of data integrity. A system designed for one class but used in another class can continue to operate depending upon the workload. When the workload pushes the boundaries of the thermal design, performance degradation can occur. Performance degradation is driven by power management features. These features are used for protection and will typically not engage in a well-designed system and/or in allowable operating environmental ranges. The exception occurs when a system is configured in an energy-saving mode where power management features are engaged to enable adequate but not peak performance. A configuration setting such as this may be acceptable for some customers and applications, but is generally not the default configuration which will, in most cases, support full operation. To enable the greatest latitude in use of all the classes, and with the new guidance on recommended ranges ‘full performance operation’ has now been replaced with ‘full operation’. IT equipment is designed with little to no margin at the extreme upper limit of the allowable range. The recommended range enabled a buffer for excursions to the allowable limits. That buffer may now be removed and, consequently, power and thermal management features may engage within the allowable range to prevent thermal excursions outside the capability of the IT equipment under extreme load conditions. IT equipment is designed based upon the probability of an event occurring such as the combination of extreme workloads simultaneously with room temperature excursions. Because of the low probability of simultaneous worst case events occurring, IT manufacturers will skew their power and thermal management systems to ensure that full operation is guaranteed. The IT purchaser must consult with the manufacturer of the equipment to understand the performance capability at extreme upper limits of the allowable thermal envelopes.
© 2011 American Society of Heating, Refrigerating and Air-Conditioning Engineers, Inc. All rights reserved.
29
F. Server Cost Trend vs Ambient Temperature With IT equipment designed to class A3 or A4 the IT manufacturer has a number of ways to support the wider environmental requirements. The tradeoffs include cooling solution capability, component selection based on temperature ratings, and performance capability. With some components such as processors an increased temperature capability will come at either a significant cost increase or a reduced performance capability. The silicon must be tested to the temperature spec and if that spec is higher then the capability to produce a high performance part is reduced and thereby the cost of that part increases. Higher-temperature-rated parts may or may not be available for all components. As previously mentioned improved PCB materials are available but could increase cost significantly over lower performing materials. To improve cooling performance improved heat sinks may be an option employed. Improved heat sinks have limited capability for improving performance and will normally be used in conjunction with increased airflow from higher performance air moving devices. The effect of increased air mover speeds is evident in the previous power vs. temperature guidance provided. One must be aware that the need for higher air mover speeds will only occur when the system inlet temperature moves towards the high range of the thermal envelope. Typical speeds will still remain relatively low under more normal room temperatures. Assuming that performance was maintained through cooling improvements, the cost of a server could increase by 1 to 2% when designing to a 40°C, class A3, vs. 35°C, class A2. Further improving the cooling capability while maintaining the same performance in a 45°C, A4 class could increase cost of a volume server over a class A2 server by 5 to 10%. Many server designs may require improved, non-cooling components to achieve class A3 or class A4 operation because the cooling system may be incapable of improvement within the volume constraints of the server. In those cases costs could increase beyond the stated ranges into the 10 to 15% range. Summary Classes A3 and A4 have been added primarily for facilities wishing to avoid the capital expense of compressor-based cooling. The new classes may offer some additional hours of economization above and beyond classes A1 and A2, but there is no guarantee that operation at the extremes of A1/A2 actually results in a minimal energy condition. Fan power, both in the IT equipment and the facility, may push the total energy to a higher level than experienced when chilling the air. One of the important reasons for the initial recommended envelope was that its upper bound was typical of minimized IT fan energy. This whitepaper does point out that failures are expected to rise with higher temperature. However, the guidance given should help users understand the magnitude of the change as applied to their particular climate. The reasons for the original recommended envelope have not gone away. Operation at wider extremes will have energy and/or reliability impacts. This time-averaged approach to reliability suggests, however, that the impact can be reduced by reducing the
© 2011 American Society of Heating, Refrigerating and Air-Conditioning Engineers, Inc. All rights reserved.
30
datacenter’s nominal set point. A compressor-less data center could actually have better reliability than its tightly controlled counterpart. References
1) Herrlin, M. K., Airflow and Cooling Performance of Data Centers: Two Performance Metrics, ASHRAE Transactions, Vol 114, Part 2. 2008
2) Herrlin, M. K., Rack Cooling Effectiveness in Data Centers and Telecom Central Offices: The Rack Cooling Index (RCI), ASHRAE Transactions, Vol 111, Part 2. 2005
3) "NIOSH Publication No. 96-110: Preventing Occupational Hearing Loss - A Practical Guide, June, 1996 (available at http://www.cdc.gov/niosh/docs/96-110.)
4) ISO 7779, "Acoustics – Measurement of airborne noise emitted by information technology and telecommunications equipment," third edition, 2010 August 15.
5) ISO 9296, "Acoustics – Declared noise emission values of computer and business equipment," 1988 April 15
6) "Acoustical Noise Emission of Information Technology Equipment," Swedish Statskontoret's Technical Standard 26:6, 2004 July 01. (available at http://www.statskontoret.se/upload/2619/TN26-6.pdf.)
7) ASHRAE Weather Data Viewer , Version 4, ASHRAE,2009 8) Patterson, M.K., Atwood, D, and Miner, J.G., “Evaluation of Air-side Economizer
use in a Compute-Intensive Data Center, Interpack’09, July 19-23, 2009, San Francisco, California.
9) “Reducing Data Center Cost with an Air Economizer” Intel Brief, August, 2008. 10) “Particulate and Gaseous Contamination in Datacom Environments”, American
Society of Heating Refrigeration and Air Conditioning Engineers, 2009, 94 pp. 11) Paul Hamilton , Gary Brist, Guy Barnes Jr. & Jason Schrader, "Humidity-dependent
loss in PCB substrates ", Intel Corporation 2007 12) Bhanu Sood, "Effects of Moisture Content on Permittivity and Loss Tangent of
PCB Materials" Center for Advanced Life Cycle Engineering (CALCE), University of Maryland, College Park, MD 20742 USA
13) "Thermal Effects on PCB Laminate Material Dielectric Constant and Dissipation Factor", Scott Hinaga, Cisco Systems, Inc. San Jose, CA 95134 Marina Y. Koledintseva, James L. Drewniak, Amendra Koul, Fan Zhou; EMC Laboratory, Missouri University of Science & Technology, Rolla, MO 65401
14) “Conductive Anodic Filament Failure: A Materials Perspective”,Laura J. Turbini and W. Jud Ready, School of Materials Science & Engineering, Georgia Institute of Technology, Atlanta, GA 30332-0245, http://130.207.195.147/Portals/2/12.pdf
15) “Conductive Anodic Filament (CAF) Formation: A Potential Reliability Problem for Fine-Line Circuits”, Laura J. Turbini, W. Jud Ready & Brian A. Smith, The Reliability Lab School of Materials Science & Engineering, Georgia Institute of Technology, http://smaplab.ri.uah.edu/Smaptest/Conferences/lce/turbini.pdf
16) “Corrosion of electronic materials and devices by submicron atmospheric Particles” , Comizzoli R. B., Frankenthal R. P., Lobnig R. E., Peins G. A., Psato-Kelty L. A., Siconolfi D. J and Sinclair J. D., Bell Laboratories, The Electrochemical Society Interface, Feb 1993.
17) “Magnetic Tape Storage and Handling:A Guide for Libraries and Archives” ,Dr. John W.C. Van Bogart, National Media Laboratory, June 1995,
© 2011 American Society of Heating, Refrigerating and Air-Conditioning Engineers, Inc. All rights reserved.
31
http://www.clir.org/pubs/reports/pub54/5premature_degrade.html 18) ASHRAE Datacom Book Series, ASHRAE, 2011 19) European Union Code of Conduct for Data Centers Best Practices, 2010
Appendices Appendix A- Static Control Measures Appendix B- Extremes of Temperature vs. Population for US and Europe Appendix C- IT Equipment Reliability Data Appendix D- Altitude Derating Curves for Classes A1 – A4 Appendix E- 2011 Thermal Guidelines (English Units) Appendix F- Detailed Flowchart for the Use and Application of the ASHRAE Data Center Classes
© 2011 American Society of Heating, Refrigerating and Air-Conditioning Engineers, Inc. All rights reserved.
32
Appendix A. Static Control Measures This section is intended to supplement the summary information included in the table of 2011 Thermal Guidelines, note i, discussing the need for minimum humidity levels and basic ESD protection protocols in the data center. ESD Background Electrostatic discharge (ESD) can cause damage to silicon devices. Shrinking device feature size means less energy is required in an ESD event to cause device damage. Additionally, increased device operating speed has limited the effectiveness of on-chip ESD protection structures, therefore, there is a significant risk to unprotected IT components from ESD. In general, on-line operational hardware is protected from ESD. However, when the machine is taken offline it is no longer protected and susceptible to ESD damage. Most equipment has been designed to withstand an ESD event of 8000 volts while operational and grounded properly. Human perception of ESD is somewhat less than this; you can (order of magnitude estimates) see it at 8000 volts, hear it at 6000 volts, and feel it at 3000 volts. Unprotected semiconductor devices can be damaged at around 250 volts. The next several generations of components will see this drop to around 125 volts. Significant risk to the hardware exists even when there is no perceptible ESD present. In fact damage can occur at ten times below the perceptible limit. At these very low levels an extensive ESD protocol is required. ESD can be generated by the personnel in the room or the room hardware itself. Two sections of high-level guidance are presented below. The data center operator is encouraged to further review the references and implement an effective ESD program at their site. Personnel and Operational Issues Electrostatic charge control must be considered when handling or coming into contact with electrostatic sensitive components such as motherboards, CPU’s, etc… The goal s is to minimize electrostatic voltage potentials between all items within the area deemed to be electrostatic discharge (ESD) sensitive. This is accomplished by proper material selections such as anti-static and static dissipative materials, and by properly grounding items and personnel. Operations for controlling the buildup and discharge of static electricity should adhere to the following guidelines.
Proper grounding is a very important aspect of electrostatic charge control. Personnel can be grounded either through a wrist strap that is in turn referenced to a known building or chassis ground, or through the use of ESD footwear such as ESD shoes or heel straps. The latter method requires that there be an electro-conductive or static dissipative floor to allow a charge path from the human to building ground.
Areas/workstations where IT equipment will be handled and maintained should have surfaces which are static dissipative and are grounded to a known building ground source.
© 2011 American Society of Heating, Refrigerating and Air-Conditioning Engineers, Inc. All rights reserved.
33
Personnel working in and around open IT equipment should use smocks with static dissipative properties. The smock is used to contain electrostatic fields that emanate from the clothing of the personnel.
Ensure all data center personnel have had ESD awareness training. Eliminate non-essential insulators from work areas. Ensure work surfaces are grounded and static dissipative. Use ESD shielded bags or containers for all components in non ESD controlled
areas. Use ESD gloves and finger cots for work in ESD sensitive areas. Use static dissipative tools at workstations, including static dissipative vacuum
wands, suction cups, and tweezers. Flooring Issues Conductive flooring for controlling the buildup and discharge of static electricity should adhere to the following guidelines.
Provide a conductive path from the metallic floor structure to building earth/ground.
Ground the floor metallic support structure (stringer, pedestals, etc.) to building steel at several places within the room. The number of ground points is based on the size of the room. The larger the room, the more ground points are required.
Ensure the maximum resistance for the flooring system is 2 x 10¹⁰ Ω, measured between the floor surface and the building ground (or an applicable ground reference). Flooring material with a lower resistance will further decrease static buildup and discharge. For safety, the floor covering and flooring system should provide a resistance of no less than 150k Ω when measured between any two points on the floor space 1 m (3 ft) apart.
Maintain antistatic floor coverings (including carpet and tile) according to the individual supplier's recommendations. Carpeted floor coverings must meet electrical conductivity requirements. Use only antistatic materials with low-propensity ratings.
Use only ESD-resistant furniture with conductive casters or wheels. Measuring floor resistance A test instrument similar to an AEMC-1000 megohmmeter is required for measuring floor conductivity. Figure A-1 shows the typical test setup to measure floor conductivity.
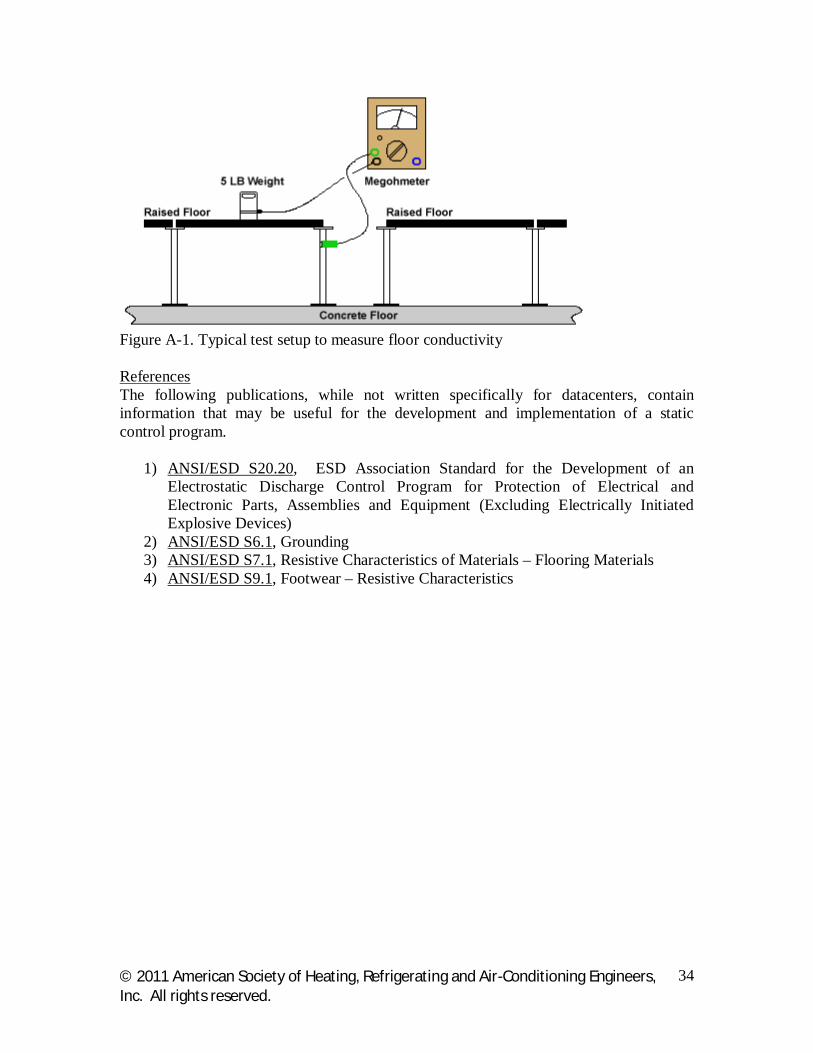
© 2011 American Society of Heating, Refrigerating and Air-Conditioning Engineers, Inc. All rights reserved.
34
Figure A-1. Typical test setup to measure floor conductivity References The following publications, while not written specifically for datacenters, contain information that may be useful for the development and implementation of a static control program.
1) ANSI/ESD S20.20, ESD Association Standard for the Development of an Electrostatic Discharge Control Program for Protection of Electrical and Electronic Parts, Assemblies and Equipment (Excluding Electrically Initiated Explosive Devices)
2) ANSI/ESD S6.1, Grounding 3) ANSI/ESD S7.1, Resistive Characteristics of Materials – Flooring Materials 4) ANSI/ESD S9.1, Footwear – Resistive Characteristics
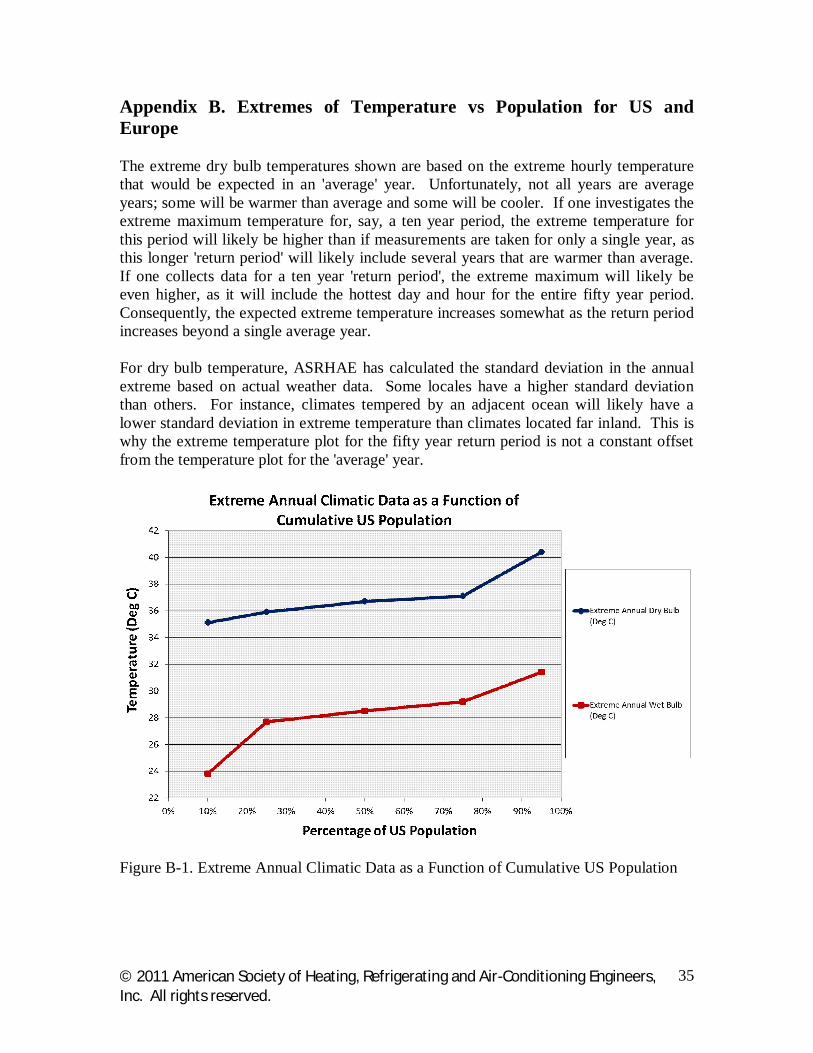
© 2011 American Society of Heating, Refrigerating and Air-Conditioning Engineers, Inc. All rights reserved.
35
Appendix B. Extremes of Temperature vs Population for US and Europe The extreme dry bulb temperatures shown are based on the extreme hourly temperature that would be expected in an 'average' year. Unfortunately, not all years are average years; some will be warmer than average and some will be cooler. If one investigates the extreme maximum temperature for, say, a ten year period, the extreme temperature for this period will likely be higher than if measurements are taken for only a single year, as this longer 'return period' will likely include several years that are warmer than average. If one collects data for a ten year 'return period', the extreme maximum will likely be even higher, as it will include the hottest day and hour for the entire fifty year period. Consequently, the expected extreme temperature increases somewhat as the return period increases beyond a single average year. For dry bulb temperature, ASRHAE has calculated the standard deviation in the annual extreme based on actual weather data. Some locales have a higher standard deviation than others. For instance, climates tempered by an adjacent ocean will likely have a lower standard deviation in extreme temperature than climates located far inland. This is why the extreme temperature plot for the fifty year return period is not a constant offset from the temperature plot for the 'average' year.
Figure B-1. Extreme Annual Climatic Data as a Function of Cumulative US Population
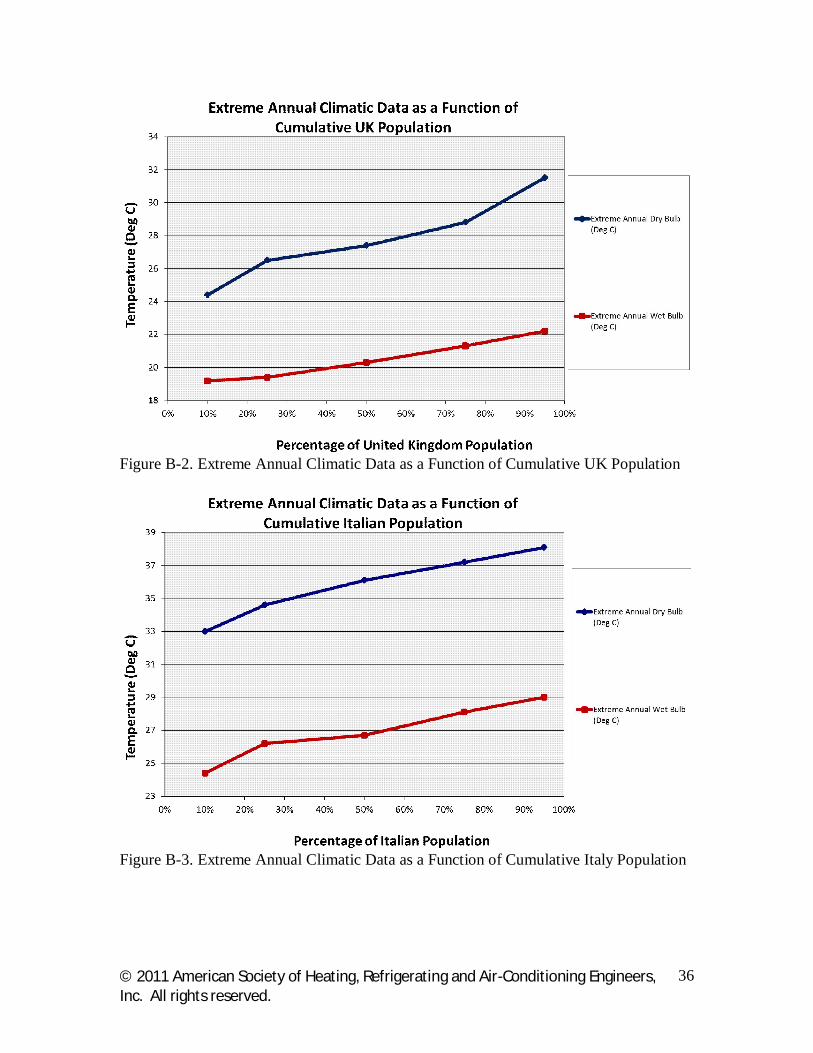
© 2011 American Society of Heating, Refrigerating and Air-Conditioning Engineers, Inc. All rights reserved.
36
Figure B-2. Extreme Annual Climatic Data as a Function of Cumulative UK Population
Figure B-3. Extreme Annual Climatic Data as a Function of Cumulative Italy Population
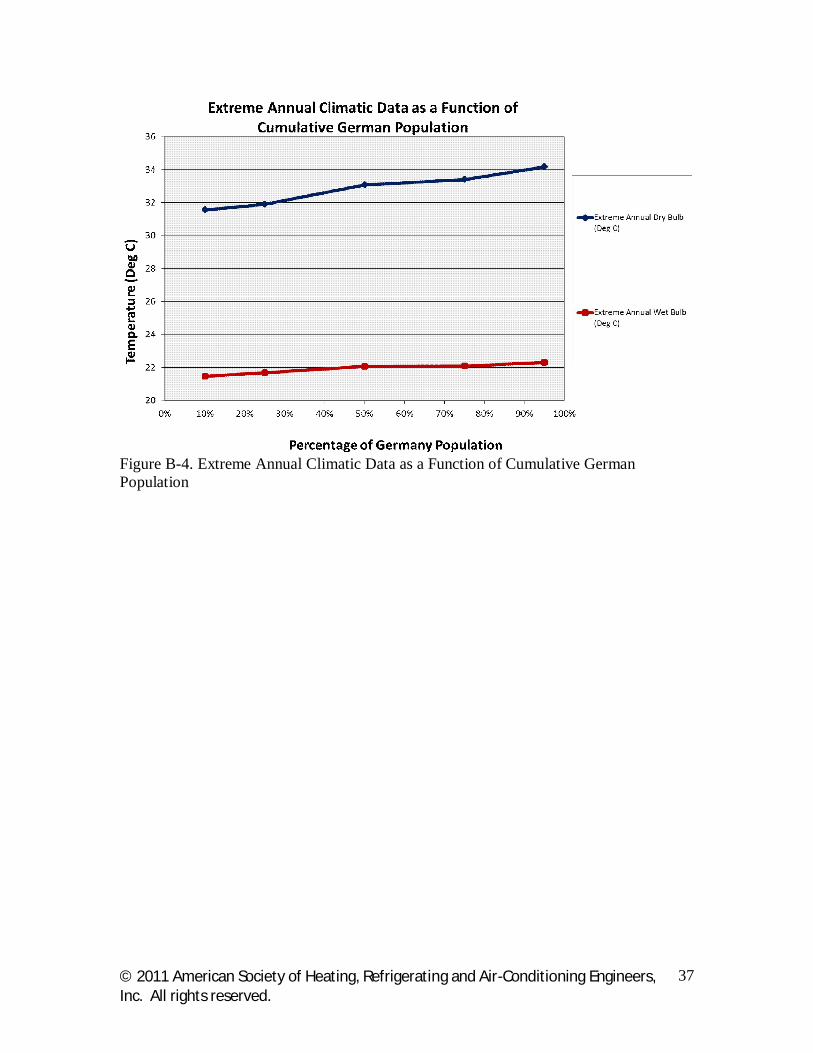
© 2011 American Society of Heating, Refrigerating and Air-Conditioning Engineers, Inc. All rights reserved.
37
Figure B-4. Extreme Annual Climatic Data as a Function of Cumulative German Population
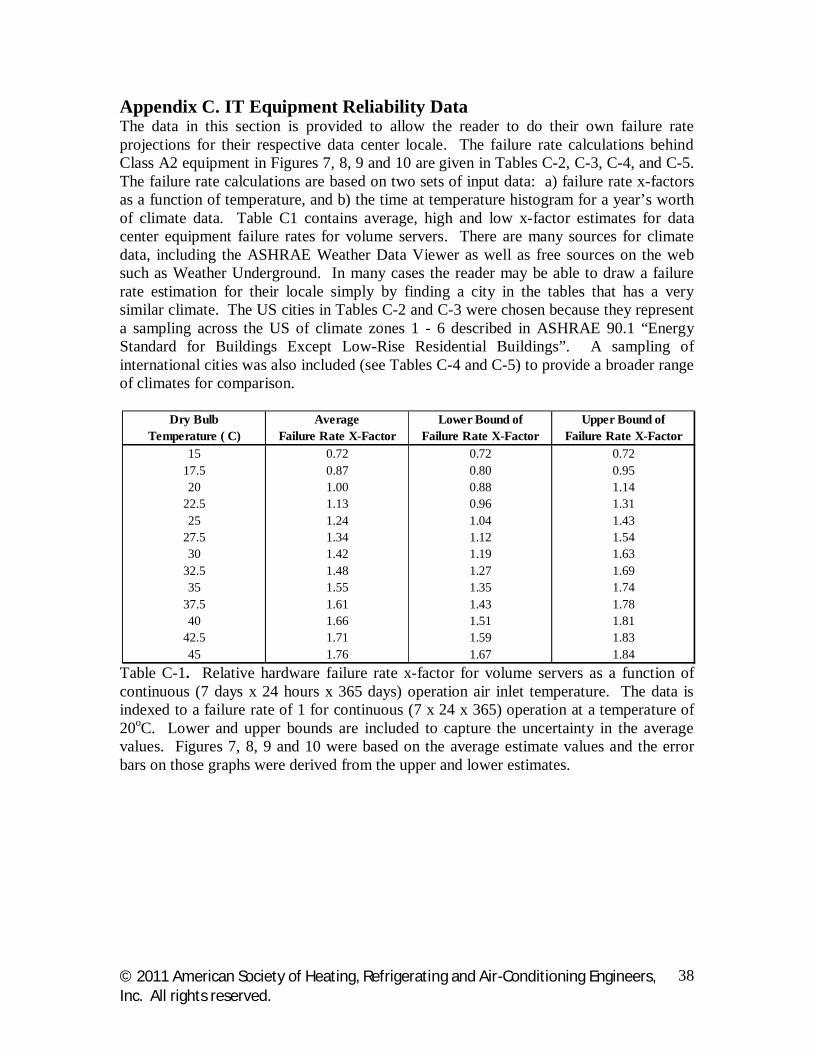
© 2011 American Society of Heating, Refrigerating and Air-Conditioning Engineers, Inc. All rights reserved.
38
Appendix C. IT Equipment Reliability Data The data in this section is provided to allow the reader to do their own failure rate projections for their respective data center locale. The failure rate calculations behind Class A2 equipment in Figures 7, 8, 9 and 10 are given in Tables C-2, C-3, C-4, and C-5. The failure rate calculations are based on two sets of input data: a) failure rate x-factors as a function of temperature, and b) the time at temperature histogram for a year’s worth of climate data. Table C1 contains average, high and low x-factor estimates for data center equipment failure rates for volume servers. There are many sources for climate data, including the ASHRAE Weather Data Viewer as well as free sources on the web such as Weather Underground. In many cases the reader may be able to draw a failure rate estimation for their locale simply by finding a city in the tables that has a very similar climate. The US cities in Tables C-2 and C-3 were chosen because they represent a sampling across the US of climate zones 1 - 6 described in ASHRAE 90.1 “Energy Standard for Buildings Except Low-Rise Residential Buildings”. A sampling of international cities was also included (see Tables C-4 and C-5) to provide a broader range of climates for comparison.
Table C-1. Relative hardware failure rate x-factor for volume servers as a function of continuous (7 days x 24 hours x 365 days) operation air inlet temperature. The data is indexed to a failure rate of 1 for continuous (7 x 24 x 365) operation at a temperature of 20oC. Lower and upper bounds are included to capture the uncertainty in the average values. Figures 7, 8, 9 and 10 were based on the average estimate values and the error bars on those graphs were derived from the upper and lower estimates.
Dry Bulb Average Lower Bound of Upper Bound ofTemperature ( C) Failure Rate X-Factor Failure Rate X-Factor Failure Rate X-Factor
15 0.72 0.72 0.7217.5 0.87 0.80 0.9520 1.00 0.88 1.14
22.5 1.13 0.96 1.3125 1.24 1.04 1.43
27.5 1.34 1.12 1.5430 1.42 1.19 1.63
32.5 1.48 1.27 1.6935 1.55 1.35 1.74
37.5 1.61 1.43 1.7840 1.66 1.51 1.81
42.5 1.71 1.59 1.8345 1.76 1.67 1.84
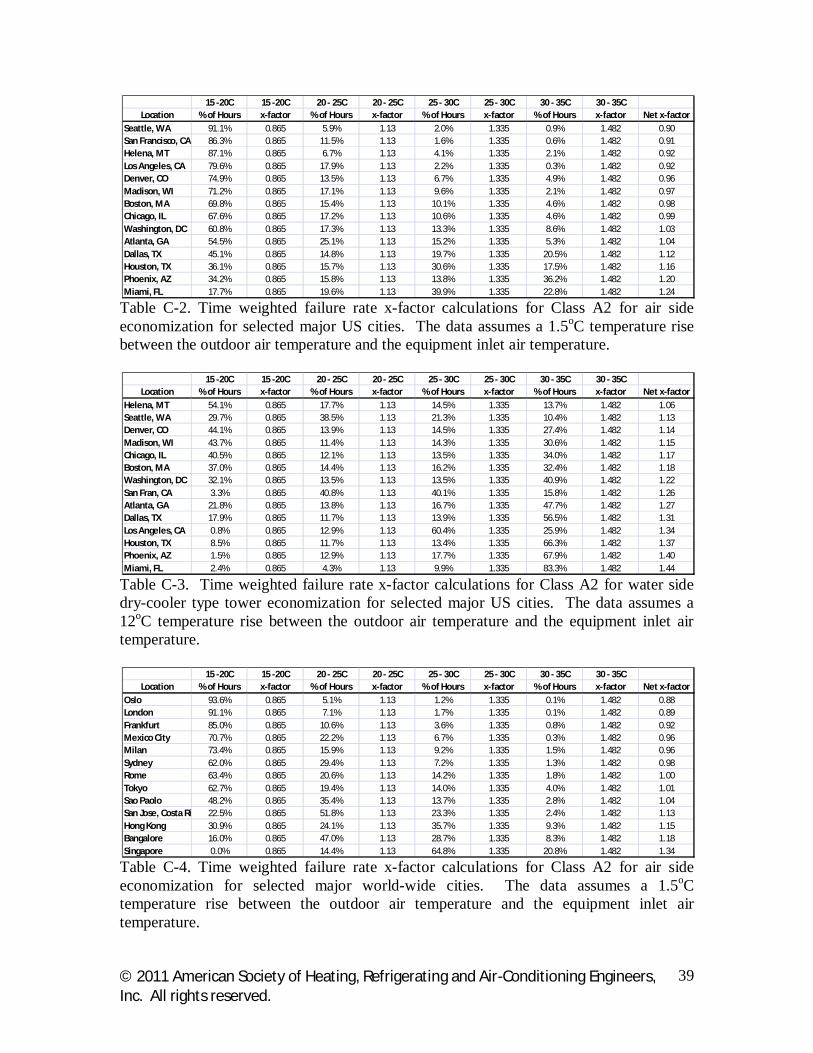
© 2011 American Society of Heating, Refrigerating and Air-Conditioning Engineers, Inc. All rights reserved.
39
Table C-2. Time weighted failure rate x-factor calculations for Class A2 for air side economization for selected major US cities. The data assumes a 1.5oC temperature rise between the outdoor air temperature and the equipment inlet air temperature.
Table C-3. Time weighted failure rate x-factor calculations for Class A2 for water side dry-cooler type tower economization for selected major US cities. The data assumes a 12oC temperature rise between the outdoor air temperature and the equipment inlet air temperature.
Table C-4. Time weighted failure rate x-factor calculations for Class A2 for air side economization for selected major world-wide cities. The data assumes a 1.5oC temperature rise between the outdoor air temperature and the equipment inlet air temperature.
15 -20C 15 -20C 20 - 25C 20 - 25C 25 - 30C 25 - 30C 30 - 35C 30 - 35CLocation % of Hours x-factor % of Hours x-factor % of Hours x-factor % of Hours x-factor Net x-factor
Seattle, WA 91.1% 0.865 5.9% 1.13 2.0% 1.335 0.9% 1.482 0.90San Francisco, CA 86.3% 0.865 11.5% 1.13 1.6% 1.335 0.6% 1.482 0.91Helena, MT 87.1% 0.865 6.7% 1.13 4.1% 1.335 2.1% 1.482 0.92Los Angeles, CA 79.6% 0.865 17.9% 1.13 2.2% 1.335 0.3% 1.482 0.92Denver, CO 74.9% 0.865 13.5% 1.13 6.7% 1.335 4.9% 1.482 0.96Madison, WI 71.2% 0.865 17.1% 1.13 9.6% 1.335 2.1% 1.482 0.97Boston, MA 69.8% 0.865 15.4% 1.13 10.1% 1.335 4.6% 1.482 0.98Chicago, IL 67.6% 0.865 17.2% 1.13 10.6% 1.335 4.6% 1.482 0.99Washington, DC 60.8% 0.865 17.3% 1.13 13.3% 1.335 8.6% 1.482 1.03Atlanta, GA 54.5% 0.865 25.1% 1.13 15.2% 1.335 5.3% 1.482 1.04Dallas, TX 45.1% 0.865 14.8% 1.13 19.7% 1.335 20.5% 1.482 1.12Houston, TX 36.1% 0.865 15.7% 1.13 30.6% 1.335 17.5% 1.482 1.16Phoenix, AZ 34.2% 0.865 15.8% 1.13 13.8% 1.335 36.2% 1.482 1.20Miami, FL 17.7% 0.865 19.6% 1.13 39.9% 1.335 22.8% 1.482 1.24
15 -20C 15 -20C 20 - 25C 20 - 25C 25 - 30C 25 - 30C 30 - 35C 30 - 35CLocation % of Hours x-factor % of Hours x-factor % of Hours x-factor % of Hours x-factor Net x-factor
Helena, MT 54.1% 0.865 17.7% 1.13 14.5% 1.335 13.7% 1.482 1.06Seattle, WA 29.7% 0.865 38.5% 1.13 21.3% 1.335 10.4% 1.482 1.13Denver, CO 44.1% 0.865 13.9% 1.13 14.5% 1.335 27.4% 1.482 1.14Madison, WI 43.7% 0.865 11.4% 1.13 14.3% 1.335 30.6% 1.482 1.15Chicago, IL 40.5% 0.865 12.1% 1.13 13.5% 1.335 34.0% 1.482 1.17Boston, MA 37.0% 0.865 14.4% 1.13 16.2% 1.335 32.4% 1.482 1.18Washington, DC 32.1% 0.865 13.5% 1.13 13.5% 1.335 40.9% 1.482 1.22San Fran, CA 3.3% 0.865 40.8% 1.13 40.1% 1.335 15.8% 1.482 1.26Atlanta, GA 21.8% 0.865 13.8% 1.13 16.7% 1.335 47.7% 1.482 1.27Dallas, TX 17.9% 0.865 11.7% 1.13 13.9% 1.335 56.5% 1.482 1.31Los Angeles, CA 0.8% 0.865 12.9% 1.13 60.4% 1.335 25.9% 1.482 1.34Houston, TX 8.5% 0.865 11.7% 1.13 13.4% 1.335 66.3% 1.482 1.37Phoenix, AZ 1.5% 0.865 12.9% 1.13 17.7% 1.335 67.9% 1.482 1.40Miami, FL 2.4% 0.865 4.3% 1.13 9.9% 1.335 83.3% 1.482 1.44
15 -20C 15 -20C 20 - 25C 20 - 25C 25 - 30C 25 - 30C 30 - 35C 30 - 35CLocation % of Hours x-factor % of Hours x-factor % of Hours x-factor % of Hours x-factor Net x-factor
Oslo 93.6% 0.865 5.1% 1.13 1.2% 1.335 0.1% 1.482 0.88London 91.1% 0.865 7.1% 1.13 1.7% 1.335 0.1% 1.482 0.89Frankfurt 85.0% 0.865 10.6% 1.13 3.6% 1.335 0.8% 1.482 0.92Mexico City 70.7% 0.865 22.2% 1.13 6.7% 1.335 0.3% 1.482 0.96Milan 73.4% 0.865 15.9% 1.13 9.2% 1.335 1.5% 1.482 0.96Sydney 62.0% 0.865 29.4% 1.13 7.2% 1.335 1.3% 1.482 0.98Rome 63.4% 0.865 20.6% 1.13 14.2% 1.335 1.8% 1.482 1.00Tokyo 62.7% 0.865 19.4% 1.13 14.0% 1.335 4.0% 1.482 1.01Sao Paolo 48.2% 0.865 35.4% 1.13 13.7% 1.335 2.8% 1.482 1.04San Jose, Costa Rica 22.5% 0.865 51.8% 1.13 23.3% 1.335 2.4% 1.482 1.13Hong Kong 30.9% 0.865 24.1% 1.13 35.7% 1.335 9.3% 1.482 1.15Bangalore 16.0% 0.865 47.0% 1.13 28.7% 1.335 8.3% 1.482 1.18Singapore 0.0% 0.865 14.4% 1.13 64.8% 1.335 20.8% 1.482 1.34
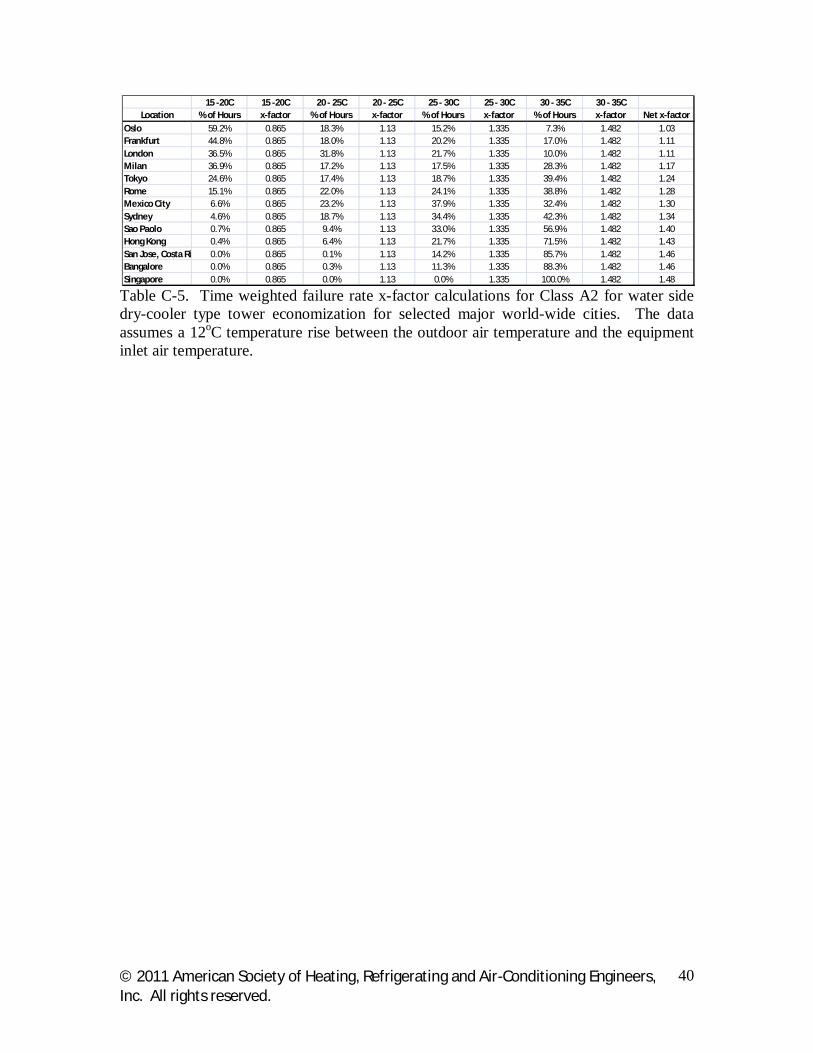
© 2011 American Society of Heating, Refrigerating and Air-Conditioning Engineers, Inc. All rights reserved.
40
Table C-5. Time weighted failure rate x-factor calculations for Class A2 for water side dry-cooler type tower economization for selected major world-wide cities. The data assumes a 12oC temperature rise between the outdoor air temperature and the equipment inlet air temperature.
15 -20C 15 -20C 20 - 25C 20 - 25C 25 - 30C 25 - 30C 30 - 35C 30 - 35CLocation % of Hours x-factor % of Hours x-factor % of Hours x-factor % of Hours x-factor Net x-factor
Oslo 59.2% 0.865 18.3% 1.13 15.2% 1.335 7.3% 1.482 1.03Frankfurt 44.8% 0.865 18.0% 1.13 20.2% 1.335 17.0% 1.482 1.11London 36.5% 0.865 31.8% 1.13 21.7% 1.335 10.0% 1.482 1.11Milan 36.9% 0.865 17.2% 1.13 17.5% 1.335 28.3% 1.482 1.17Tokyo 24.6% 0.865 17.4% 1.13 18.7% 1.335 39.4% 1.482 1.24Rome 15.1% 0.865 22.0% 1.13 24.1% 1.335 38.8% 1.482 1.28Mexico City 6.6% 0.865 23.2% 1.13 37.9% 1.335 32.4% 1.482 1.30Sydney 4.6% 0.865 18.7% 1.13 34.4% 1.335 42.3% 1.482 1.34Sao Paolo 0.7% 0.865 9.4% 1.13 33.0% 1.335 56.9% 1.482 1.40Hong Kong 0.4% 0.865 6.4% 1.13 21.7% 1.335 71.5% 1.482 1.43San Jose, Costa Rica 0.0% 0.865 0.1% 1.13 14.2% 1.335 85.7% 1.482 1.46Bangalore 0.0% 0.865 0.3% 1.13 11.3% 1.335 88.3% 1.482 1.46Singapore 0.0% 0.865 0.0% 1.13 0.0% 1.335 100.0% 1.482 1.48
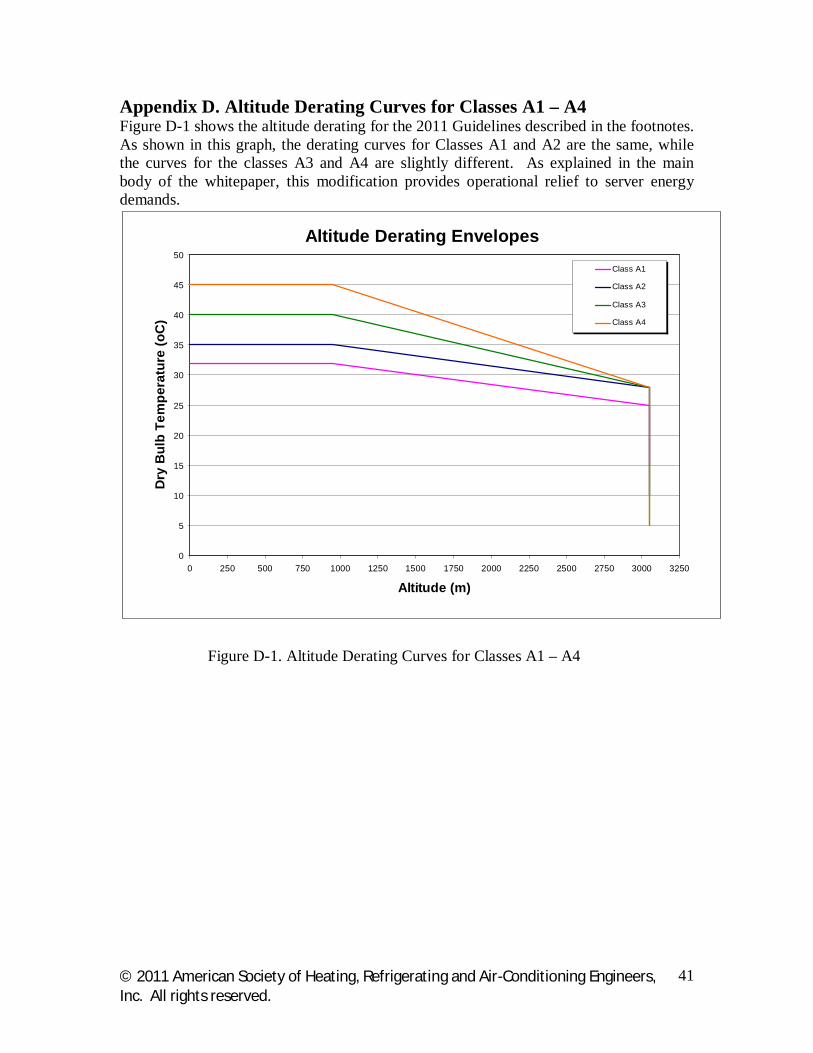
© 2011 American Society of Heating, Refrigerating and Air-Conditioning Engineers, Inc. All rights reserved.
41
Appendix D. Altitude Derating Curves for Classes A1 – A4 Figure D-1 shows the altitude derating for the 2011 Guidelines described in the footnotes. As shown in this graph, the derating curves for Classes A1 and A2 are the same, while the curves for the classes A3 and A4 are slightly different. As explained in the main body of the whitepaper, this modification provides operational relief to server energy demands.
Figure D-1. Altitude Derating Curves for Classes A1 – A4
Altitude Derating Envelopes
0
5
10
15
20
25
30
35
40
45
50
0 250 500 750 1000 1250 1500 1750 2000 2250 2500 2750 3000 3250
Altitude (m)
Dry
Bul
b Te
mpe
ratu
re (o
C)
Class A1
Class A2
Class A3
Class A4
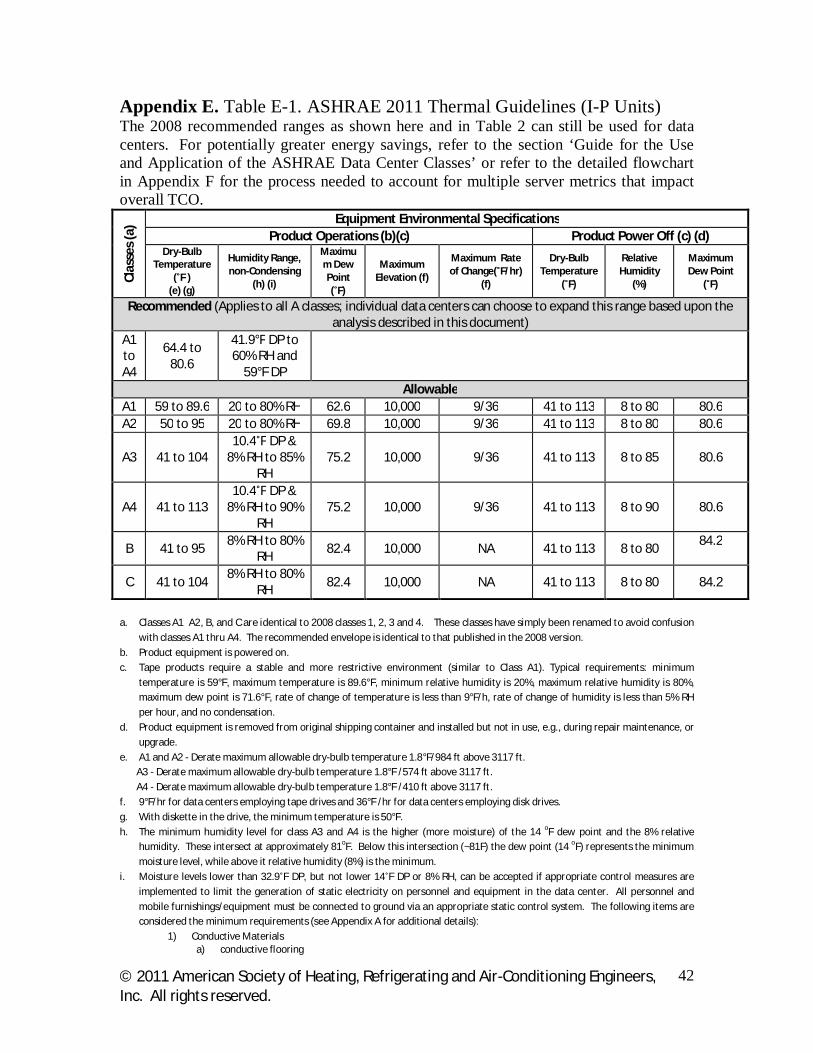
© 2011 American Society of Heating, Refrigerating and Air-Conditioning Engineers, Inc. All rights reserved.
42
Appendix E. Table E-1. ASHRAE 2011 Thermal Guidelines (I-P Units) The 2008 recommended ranges as shown here and in Table 2 can still be used for data centers. For potentially greater energy savings, refer to the section ‘Guide for the Use and Application of the ASHRAE Data Center Classes’ or refer to the detailed flowchart in Appendix F for the process needed to account for multiple server metrics that impact overall TCO.
Clas
ses
(a) Equipment Environmental Specifications
Product Operations (b)(c) Product Power Off (c) (d) Dry-Bulb
Temperature (˚F )
(e) (g)
Humidity Range, non-Condensing
(h) (i)
Maximum Dew Point (˚F)
Maximum Elevation (f)
Maximum Rate of Change(˚F/hr)
(f)
Dry-Bulb Temperature
(˚F)
Relative Humidity
(%)
Maximum Dew Point
(˚F)
Recommended (Applies to all A classes; individual data centers can choose to expand this range based upon the analysis described in this document)
A1 to A4
64.4 to 80.6
41.9°F DP to 60% RH and
59°F DP
Allowable A1 59 to 89.6 20 to 80% RH 62.6 10,000 9/36 41 to 113 8 to 80 80.6 A2 50 to 95 20 to 80% RH 69.8 10,000 9/36 41 to 113 8 to 80 80.6
A3 41 to 104 10.4˚F DP &
8% RH to 85% RH
75.2 10,000 9/36 41 to 113 8 to 85 80.6
A4 41 to 113 10.4˚F DP &
8% RH to 90% RH
75.2 10,000 9/36 41 to 113 8 to 90 80.6
B 41 to 95 8% RH to 80%
RH 82.4 10,000 NA 41 to 113 8 to 80 84.2
C 41 to 104 8% RH to 80%
RH 82.4 10,000 NA 41 to 113 8 to 80 84.2
a. Classes A1 A2, B, and C are identical to 2008 classes 1, 2, 3 and 4. These classes have simply been renamed to avoid confusion with classes A1 thru A4. The recommended envelope is identical to that published in the 2008 version.
b. Product equipment is powered on. c. Tape products require a stable and more restrictive environment (similar to Class A1). Typical requirements: minimum
temperature is 59°F, maximum temperature is 89.6°F, minimum relative humidity is 20%, maximum relative humidity is 80%, maximum dew point is 71.6°F, rate of change of temperature is less than 9°F/h, rate of change of humidity is less than 5% RH per hour, and no condensation.
d. Product equipment is removed from original shipping container and installed but not in use, e.g., during repair maintenance, or upgrade.
e. A1 and A2 - Derate maximum allowable dry-bulb temperature 1.8°F/984 ft above 3117 ft. A3 - Derate maximum allowable dry-bulb temperature 1.8°F /574 ft above 3117 ft. A4 - Derate maximum allowable dry-bulb temperature 1.8°F /410 ft above 3117 ft. f. 9°F/hr for data centers employing tape drives and 36°F /hr for data centers employing disk drives. g. With diskette in the drive, the minimum temperature is 50°F. h. The minimum humidity level for class A3 and A4 is the higher (more moisture) of the 14 oF dew point and the 8% relative
humidity. These intersect at approximately 81oF. Below this intersection (~81F) the dew point (14 oF) represents the minimum moisture level, while above it relative humidity (8%) is the minimum.
i. Moisture levels lower than 32.9˚F DP, but not lower 14˚F DP or 8% RH, can be accepted if appropriate control measures are implemented to limit the generation of static electricity on personnel and equipment in the data center. All personnel and mobile furnishings/equipment must be connected to ground via an appropriate static control system. The following items are considered the minimum requirements (see Appendix A for additional details):
1) Conductive Materials a) conductive flooring
© 2011 American Society of Heating, Refrigerating and Air-Conditioning Engineers, Inc. All rights reserved.
43
b) conductive footwear on all personnel that go into the datacenter, including visitors just passing through; c) all mobile furnishing/equipment will be made of conductive or static dissipative materials.
2) During maintenance on any hardware, a properly functioning wrist strap must be used by any personnel who contacts IT equipment.
Appendix F. Detailed Flowchart for the Use and Application of the ASHRAE Data Center Classes The following flowchart provides guidance to the data center operator on how to position his data center for operating in specific environmental envelope. It does permit the continued use of the recommended envelope as specified in the 2008 version of the ASHRAE envelopes (see table 2), but more importantly describes how to achieve even greater energy savings through the use of a TCO analysis utilizing the servers metrics provided in the previous sections.
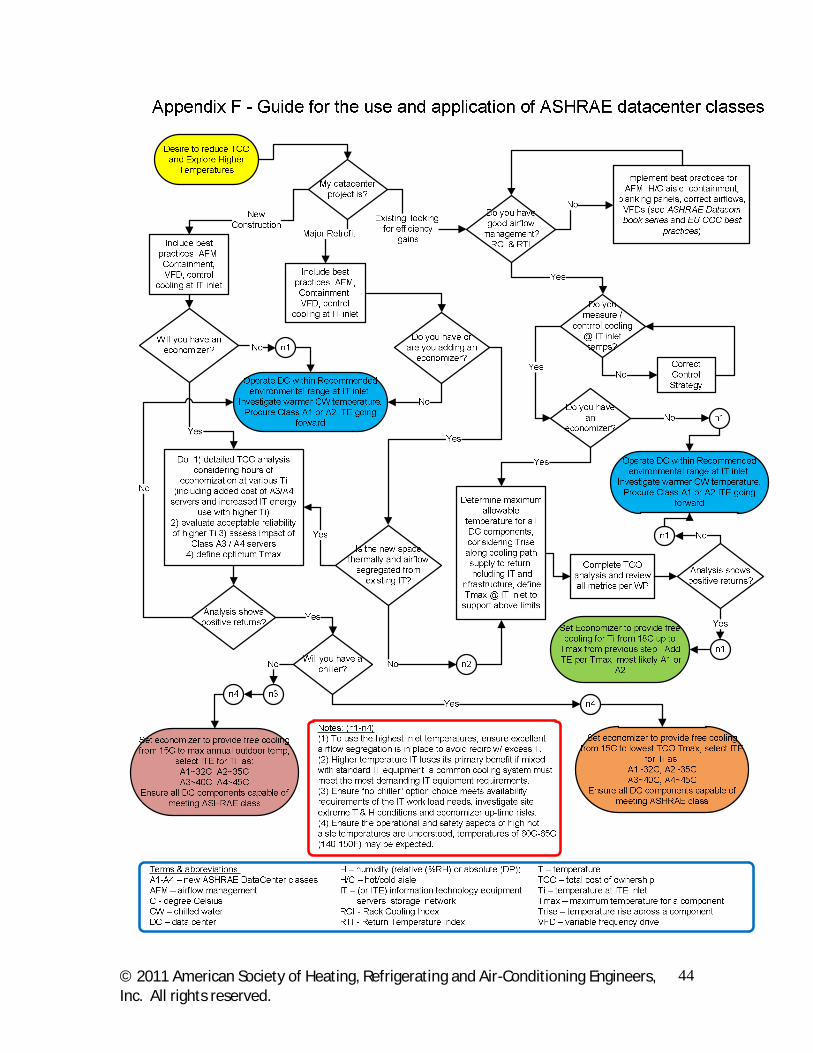
© 2011 American Society of Heating, Refrigerating and Air-Conditioning Engineers, Inc. All rights reserved.
44
© 2011 American Society of Heating, Refrigerating and Air-Conditioning Engineers, Inc. All rights reserved.
45
© 2011, American Society of Heating, Refrigerating and Air-Conditioning Engineers, Inc. All rights reserved. This publication may not be reproduced in whole or in part; may not be distributed in paper or digital form; and may not be posted in any form on the Internet without ASHRAE’s expressed written permission. Inquires for use should be directed to [email protected].