2011 results presentation - Pearson€¦ · 2011 results presentation ... global readership **US...
56
2011 results presentation Monday 27 February 2012
-
Upload
phungkhanh -
Category
Documents
-
view
219 -
download
1
Transcript of 2011 results presentation - Pearson€¦ · 2011 results presentation ... global readership **US...

2011 results presentationMonday 27 February 2012
Forward-looking statements
Except for the historical information contained herein, the matters discussed in this presentation include forward-looking statements. In particular, all statements that express forecasts, expectations and projections with respect to future matters, including trends in results of operations, margins, growth rates, overall market trends, the impact of interest or exchange rates, the availability of financing, anticipated costs savings and synergies and the execution of Pearson's strategy, are forward looking statements. By their nature, forward-looking statements involve risks and uncertainties because they relate to events and depend on circumstances that will occur in future.
There are a number of factors which could cause actual results and developments to differ materially from those expressed or implied by these forward-looking statements, including a number of factors outside Pearson's control. These include international, national and local conditions, as well as competition. They also include other risks detailed from time to time in the company's publicly-filed documents.
Any forward-looking statements speak only as of the date they are made, and Pearson gives no undertaking to update forward-looking statements to reflect any changes in its expectations with regard thereto or any changes to events, conditions or circumstances on which any such statement is based.
2

2011 results presentationMonday 27 February 2012
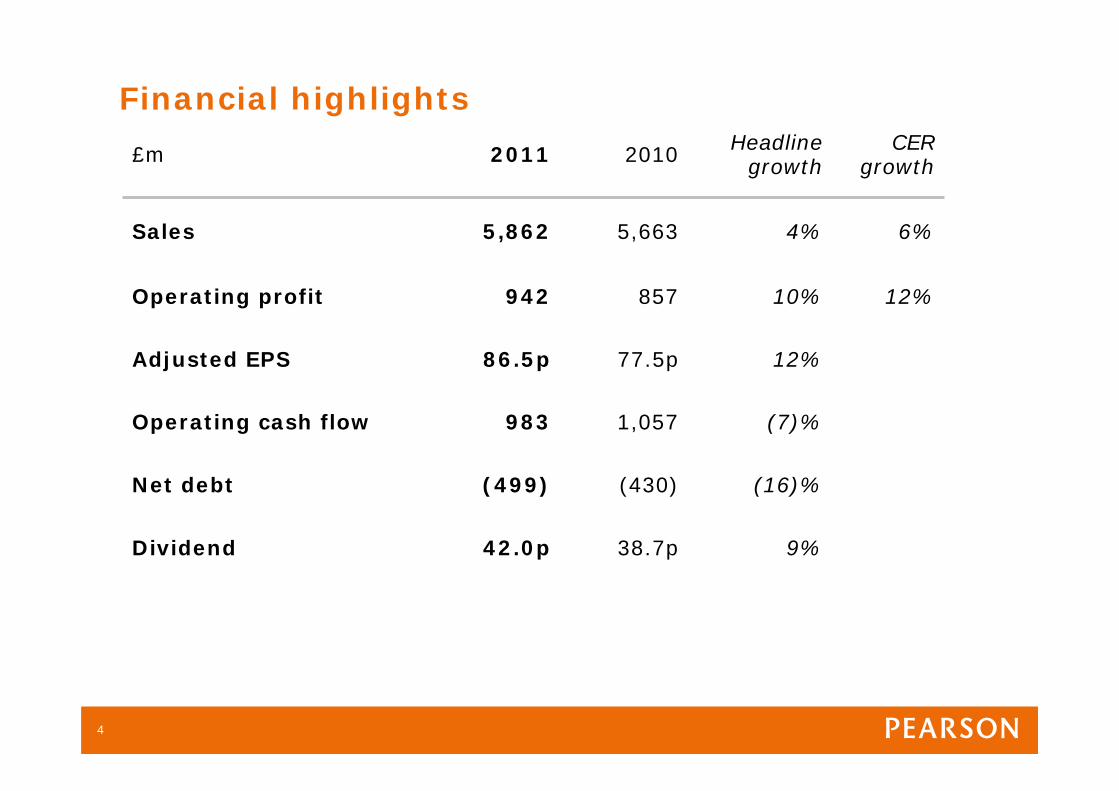
Financial highlights
£m 2011 2010 Headline growth
CER growth
Sales 5,862 5,663 4% 6%
Operating profit 942 857 10% 12%
Adjusted EPS 86.5p 77.5p 12%
Operating cash flow 983 1,057 (7)%
Net debt (499) (430) (16)%
Dividend 42.0p 38.7p 9%
4
Financial review
5
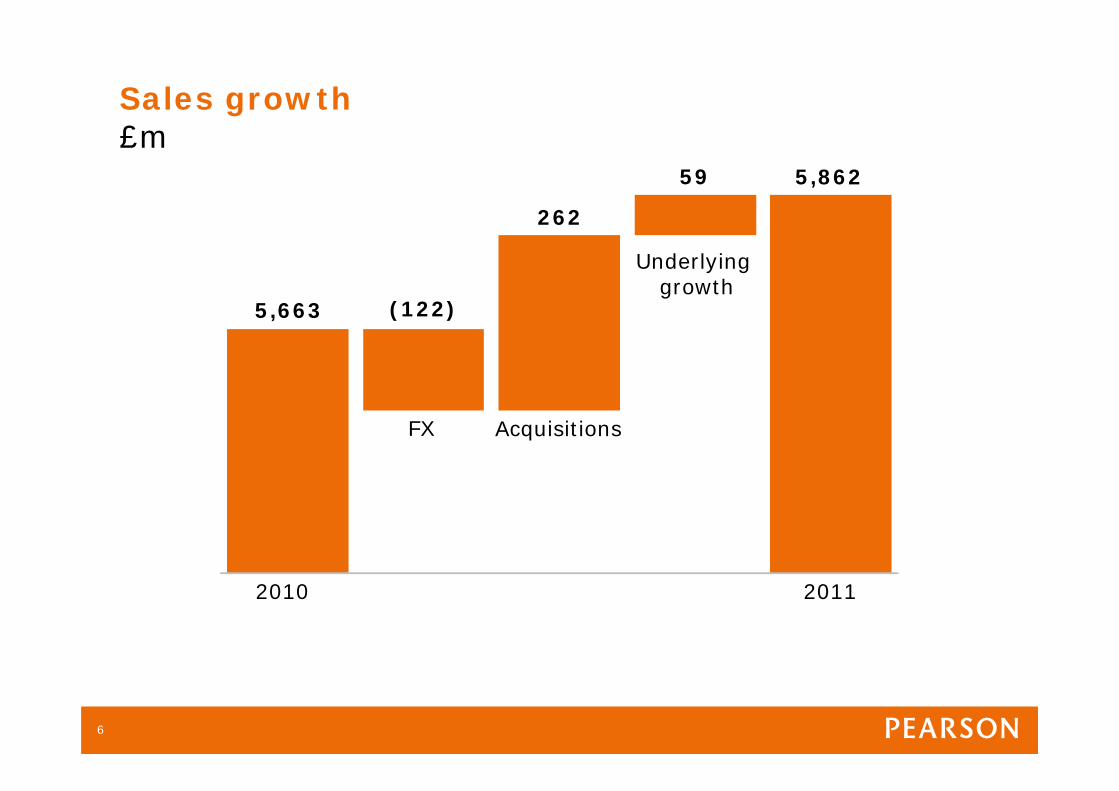
Sales growth£m
5,663
262
FX
5,862
Acquisitions
59
Underlying growth
(122)
20112010
6
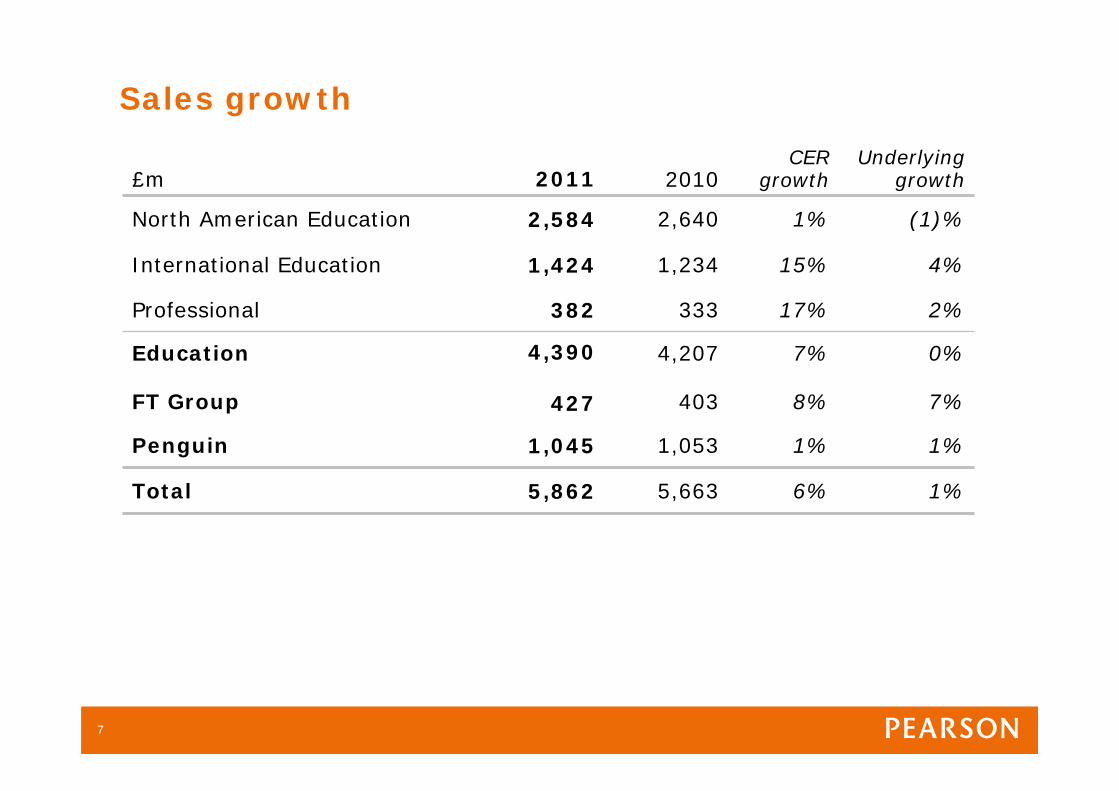
Sales growth
£m 2011 2010CER
growthUnderlying
growth
North American Education 2,584 2,640 1% (1)%
International Education 1,424 1,234 15% 4%
Professional 382 333 17% 2%
Education
FT Group
4,390
427
4,207
403
7%
8%
0%
7%
Penguin 1,045 1,053 1% 1%
Total 5,862 5,663 6% 1%
7
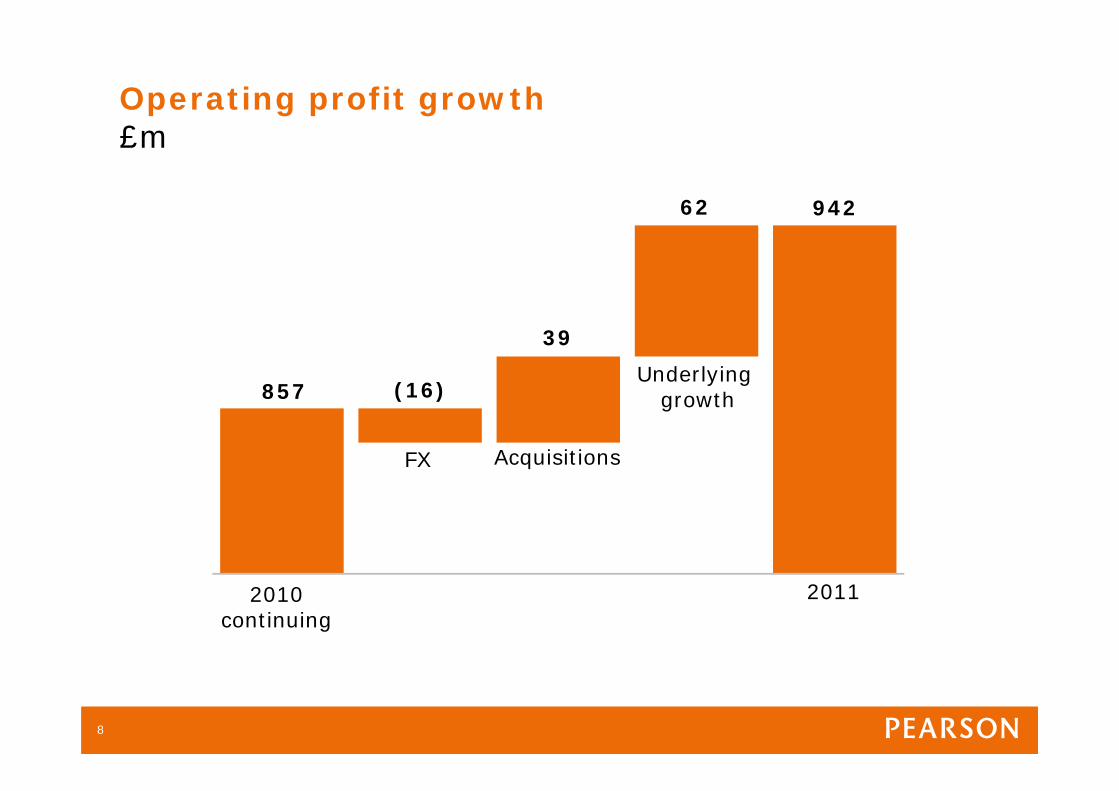
Operating profit growth£m
857
39
FX
942
(16)
62
2010continuing
2011
Acquisitions
Underlying growth
8
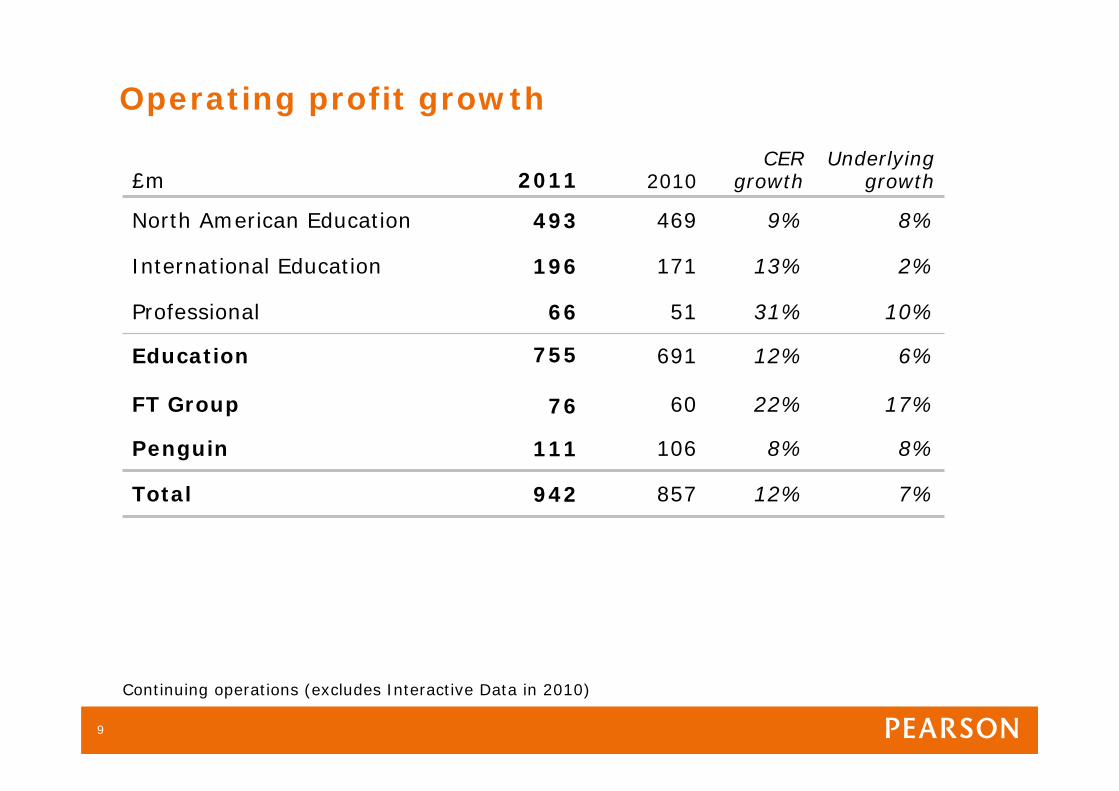
Operating profit growth
£m 2011 2010CER
growthUnderlying
growth
North American Education 493 469 9% 8%
International Education 196 171 13% 2%
Professional 66 51 31% 10%
Education
FT Group
755
76
691
60
12%
22%
6%
17%
Penguin 111 106 8% 8%
Total 942 857 12% 7%
Continuing operations (excludes Interactive Data in 2010)
9
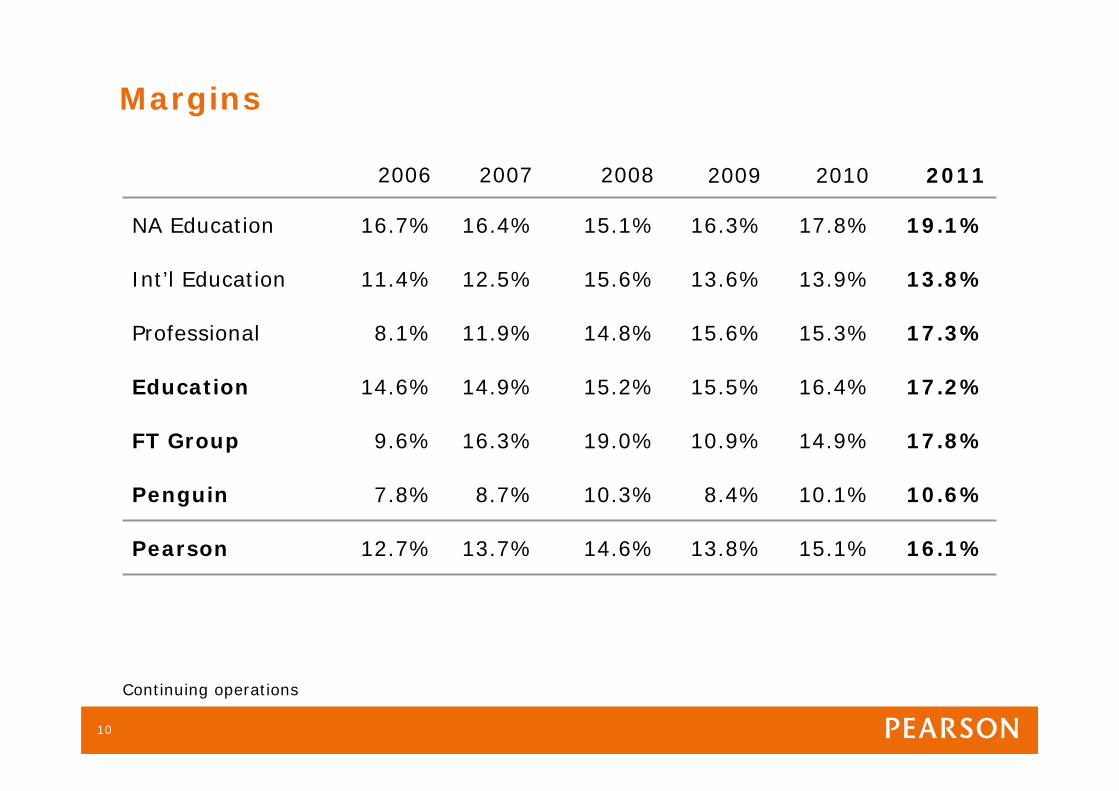
Margins
Continuing operations
2006 2007 2008 2009 2010 2011
NA Education 16.7% 16.4% 15.1% 16.3% 17.8% 19.1%
Int’l Education 11.4% 12.5% 15.6% 13.6% 13.9% 13.8%
Professional 8.1% 11.9% 14.8% 15.6% 15.3% 17.3%
Education 14.6% 14.9% 15.2% 15.5% 16.4% 17.2%
FT Group 9.6% 16.3% 19.0% 10.9% 14.9% 17.8%
Penguin 7.8% 8.7% 10.3% 8.4% 10.1% 10.6%
Pearson 12.7% 13.7% 14.6% 13.8% 15.1% 16.1%
10
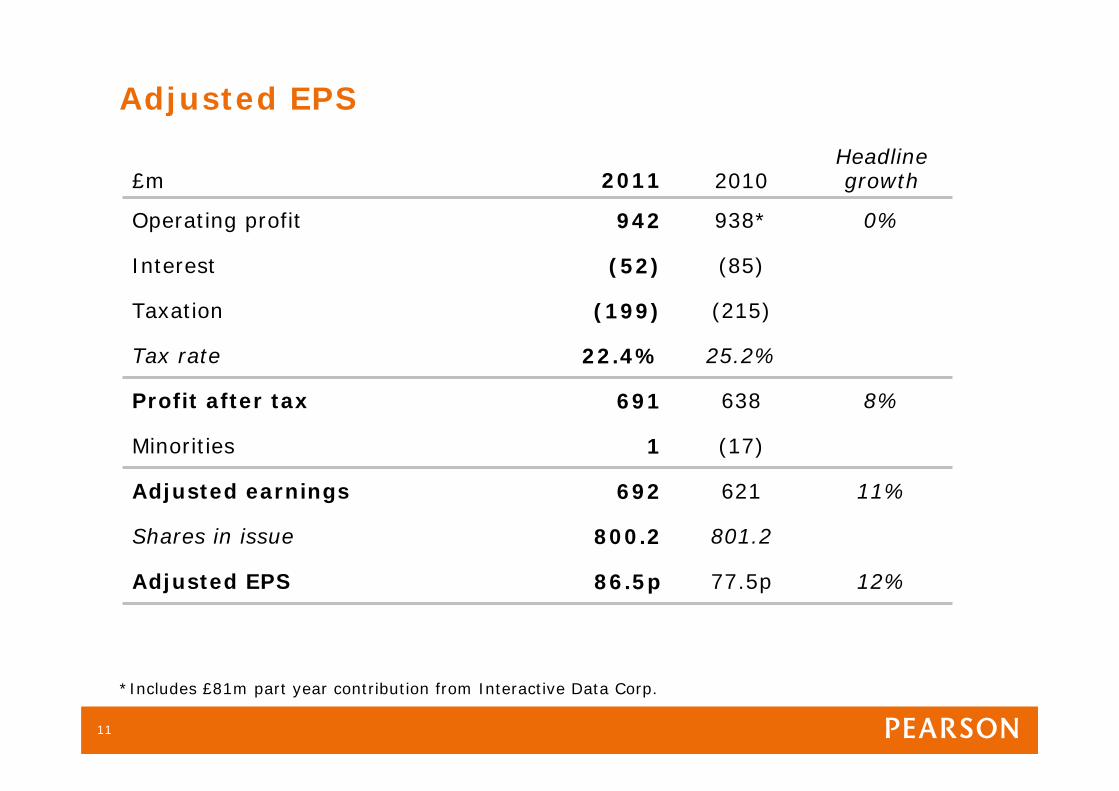
Adjusted EPS
£m 2011 2010Headline growth
Operating profit 942 938* 0%
Interest (52) (85)
Taxation (199) (215)
Tax rate 22.4% 25.2%
Profit after tax 691 638 8%
Minorities 1 (17)
Adjusted earnings 692 621 11%
Shares in issue 800.2 801.2
Adjusted EPS 86.5p 77.5p 12%
*Includes £81m part year contribution from Interactive Data Corp.
11
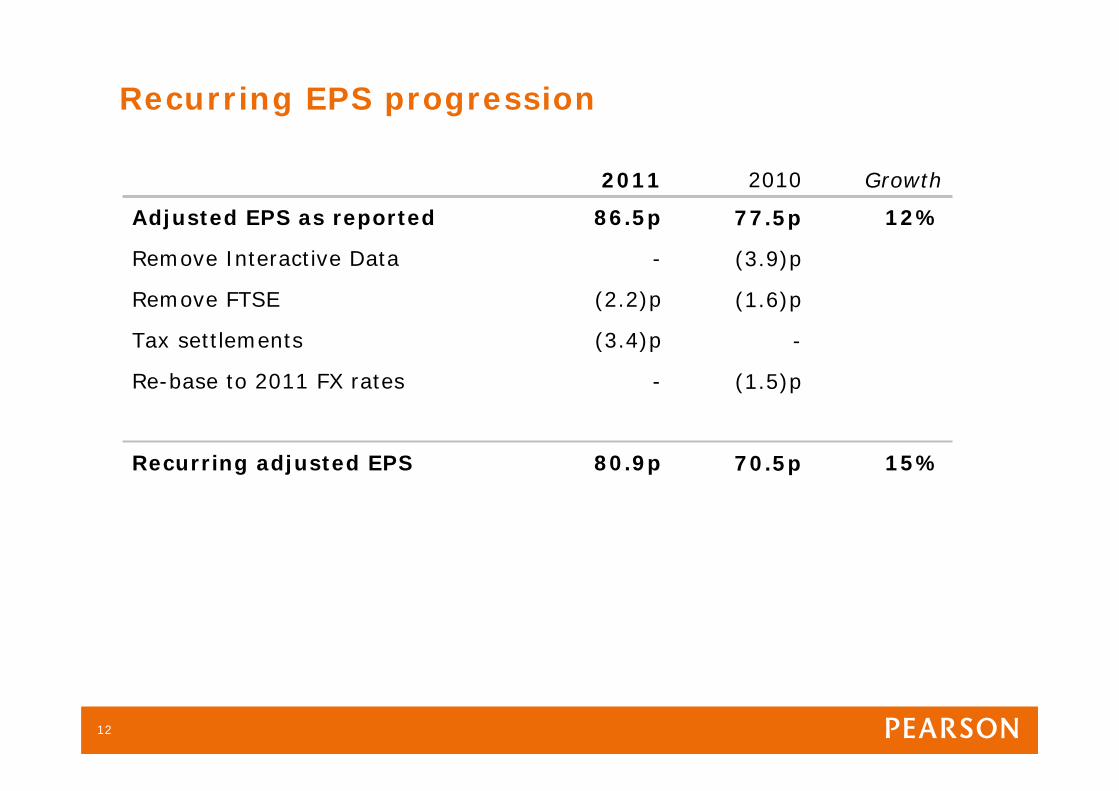
Recurring EPS progression
2011 2010 Growth
Adjusted EPS as reported 86.5p 77.5p 12%
Remove Interactive Data - (3.9)p
Remove FTSE (2.2)p (1.6)p
Tax settlements (3.4)p -
Re-base to 2011 FX rates - (1.5)p
Recurring adjusted EPS 80.9p 70.5p 15%
12
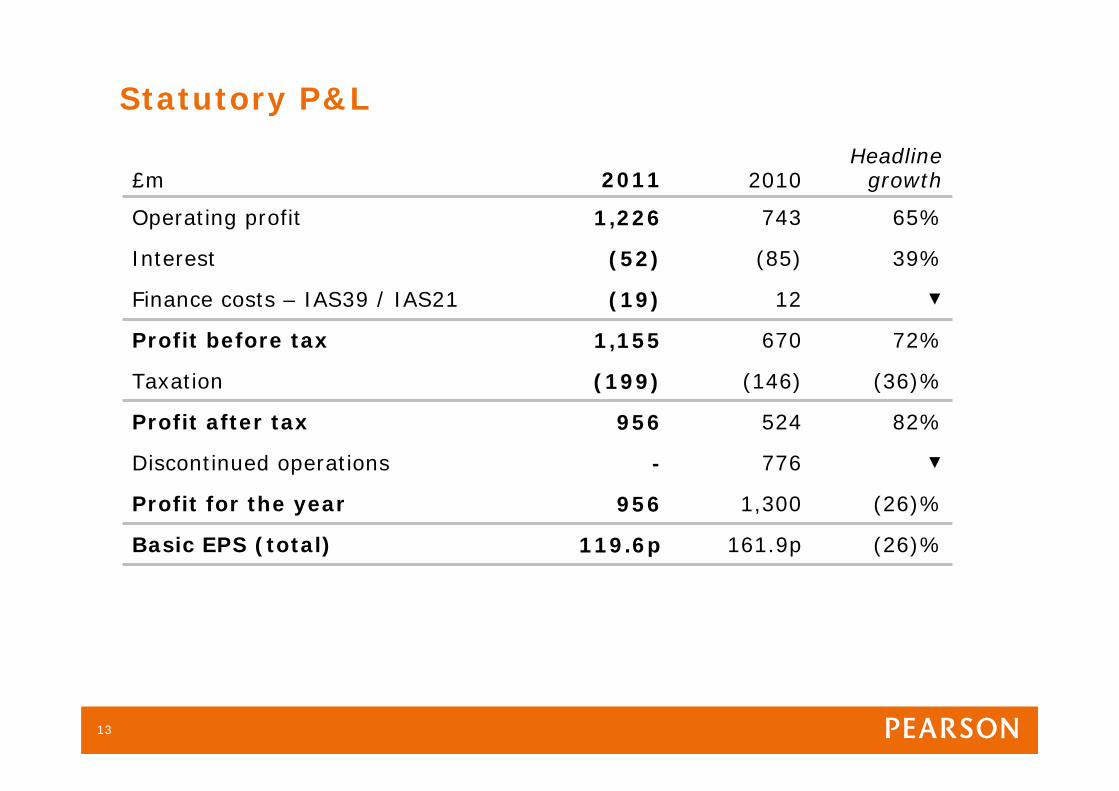
Statutory P&L
£m 2011 2010Headline
growth
Operating profit 1,226 743 65%
Interest (52) (85) 39%
Finance costs – IAS39 / IAS21 (19) 12 ▼
Profit before tax 1,155 670 72%
Taxation (199) (146) (36)%
Profit after tax 956 524 82%
Discontinued operations - 776 ▼
Profit for the year 956 1,300 (26)%
Basic EPS (total) 119.6p 161.9p (26)%
13

Operating cash flow
2010 includes Interactive Data
£m 2011 2010 var
Operating profit 942 938 4
Working capital 39 149 (110)
Net capital expenditure (140) (135) (5)
Depreciation 118 133 (15)
Dividends from associates and JVs 30 23 7
Exchange and other movements (6) (51) 45
Operating cash flow 983 1,057 (74)
Cash conversion % 104% 113%
14

Free cash flow
£m 2011 2010 var
Operating cash flow 983 1,057 (74)
Tax paid (151) (85) (66)
Cash tax % 16% 9%
Net interest paid (60) (68) 8
Free cash flow 772 904 (132)
Free cash flow / share 96.5p 112.8p
15

Balance sheet
£m 2011 2010 var
Goodwill / intangible assets 6,342 5,467 875
Tangible fixed assets 383 366 17
Pre-publication 650 647 3
Deferred revenue (678) (559) (119)
Traditional working capital 682 645 37
Other net liabilities (280) (128) (152)
Net trading assets 7,099 6,438 661
Shareholders’ funds 5,943 5,538 405
Deferred tax 334 195 139
Pensions 141 148 (7)
Other provisions 163 60 103
Minorities 19 67 (48)
Net debt 499 430 69
Capital employed 7,099 6,438 661
Year end $/£ 1.55 1.57
16
0
2
4
6
8
10
12
14
16
18
20
2001 2002 2003 2004 2005 2006 2007 2008 2009 2010 2011
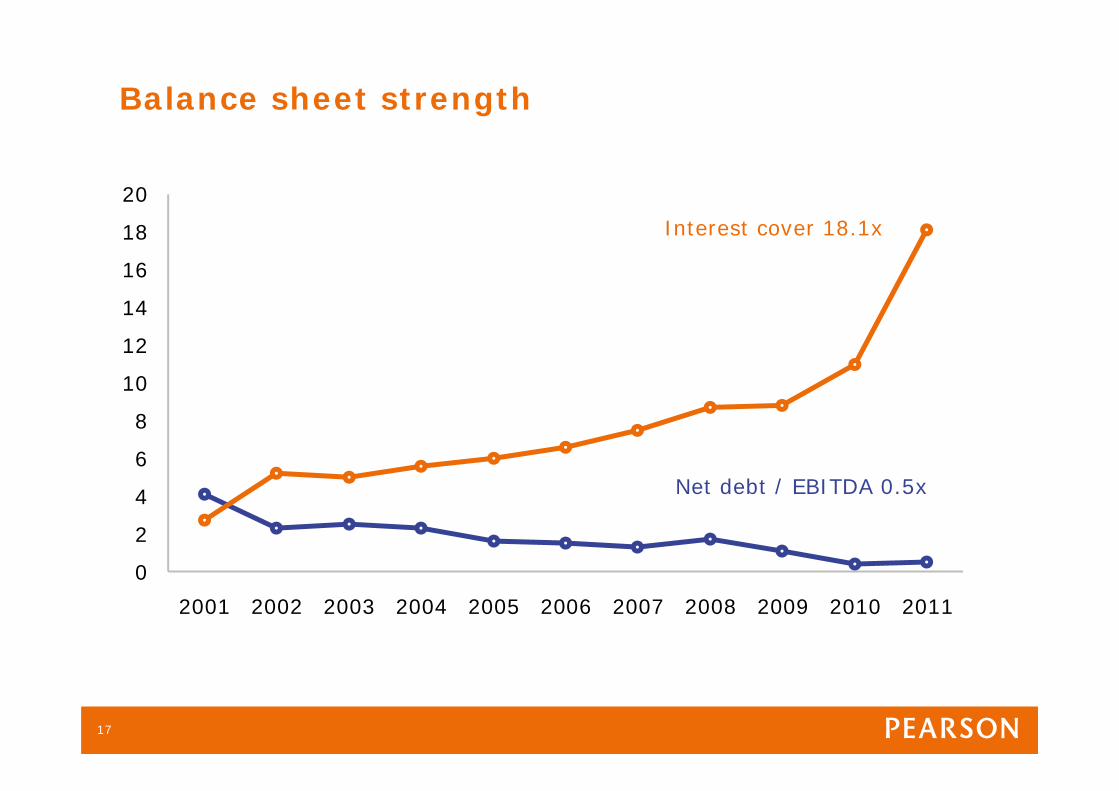
Balance sheet strength
Interest cover 18.1x
Net debt / EBITDA 0.5x
17
2006 2007 2008 2009 2010 2011
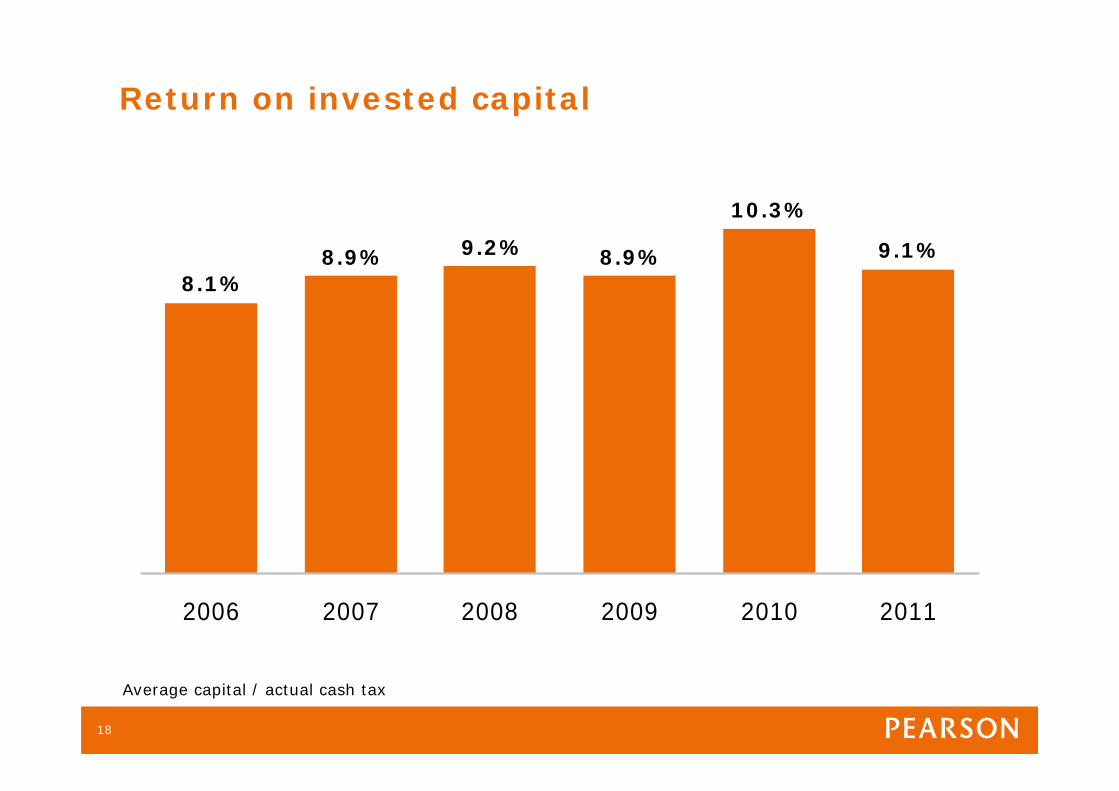
Return on invested capital
8.1%8.9% 9.2% 8.9%
Average capital / actual cash tax
10.3%
9.1%
18
2006 2007 2008 2009 2010 2011
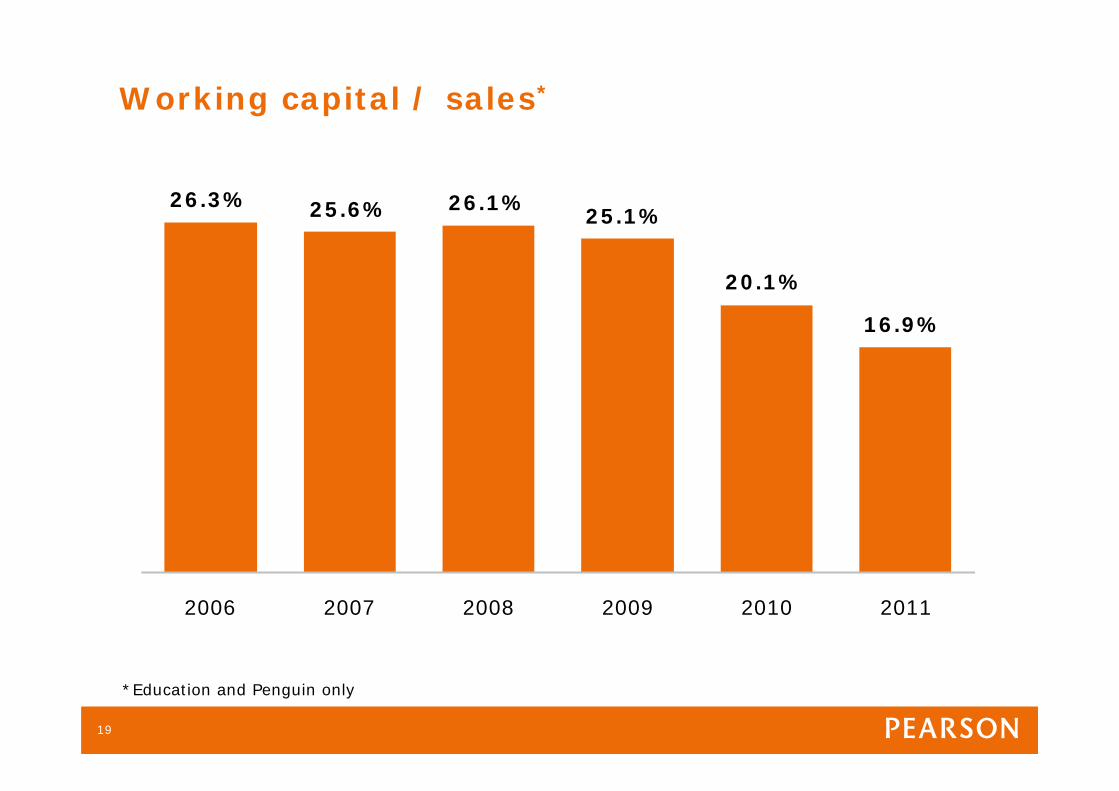
Working capital / sales*
16.9%
26.3% 25.6% 26.1%25.1%
20.1%
*Education and Penguin only
19
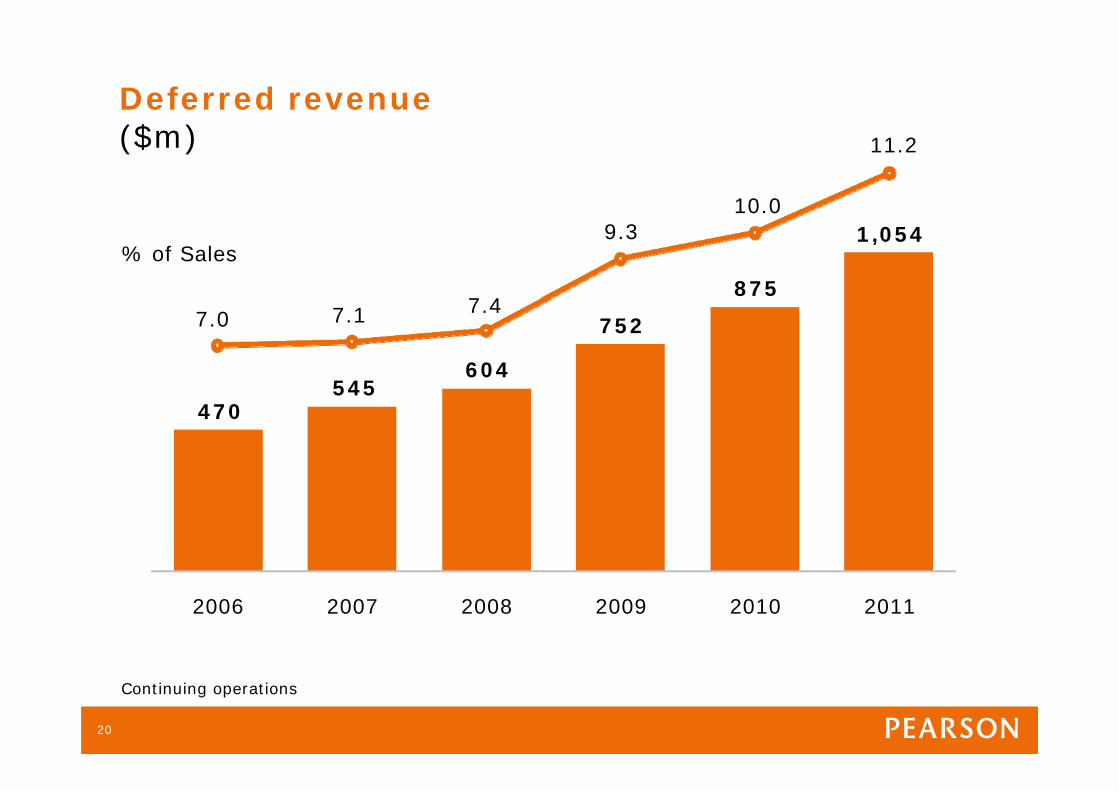
Deferred revenue($m)
Continuing operations
% of Sales
2006 2007 2008 2009 2010 2011
470545
604
752
8757.0 7.1 7.4
9.310.0
1,054
11.2
20

2006 2007 2008 2009 2010 2011
Operating cash flow
£684m£796m
£913m
5-year CAGR: 11%
Cash conversion %
FCF per share (p)
£1,057m£983m
108 104 106 113 104
51.1 79.2 90.5 112.8 96.5
£575m
97
54.2
21
Uses of cash
Organic investment
Bolt-on acquisitions
Dividends
22

2012 outlook
Continuing tough markets and industry change
Sales and profit growth
Strong cash conversion
Investment in organic growth
Integration and restructuring
Acquisitions in target areas
23

Strategy
24

25
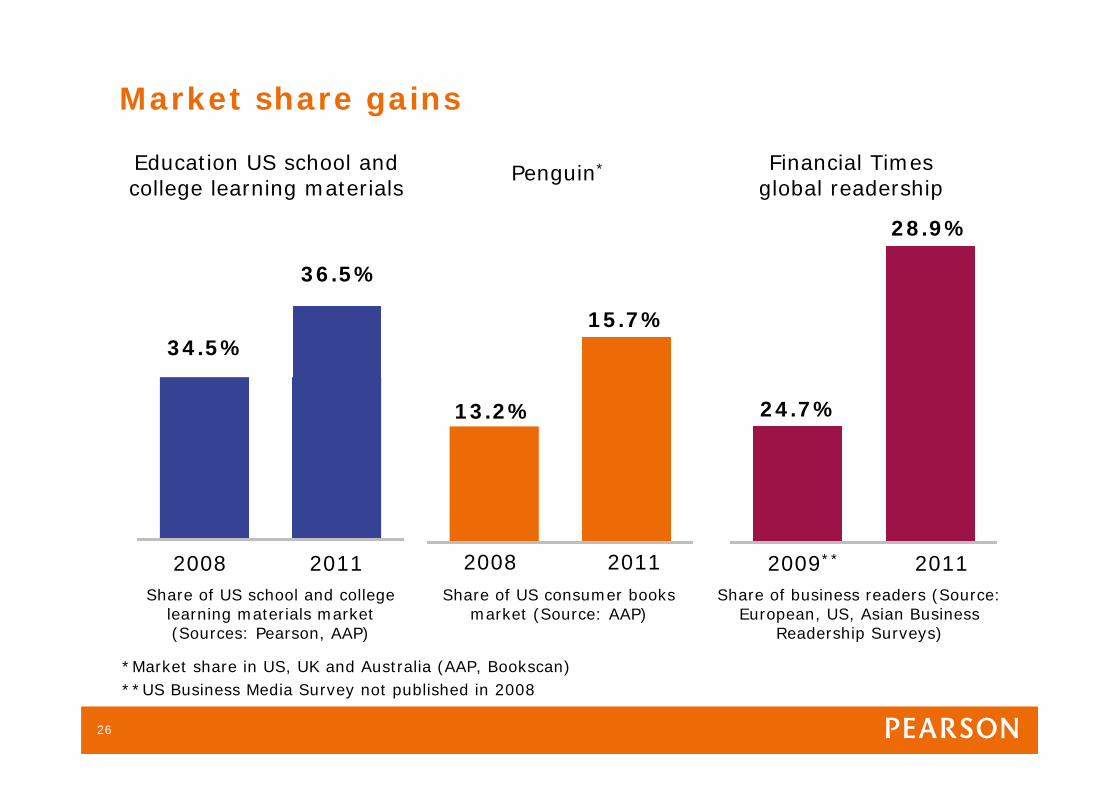
Market share gains
36.5%
34.5%
13.2%
15.7%
24.7%
28.9%
2008 2011 2008 2011 2009** 2011
Education US school and college learning materials
Penguin* Financial Timesglobal readership
**US Business Media Survey not published in 2008
Share of US school and college learning materials market (Sources: Pearson, AAP)
Share of US consumer books market (Source: AAP)
Share of business readers (Source: European, US, Asian Business
Readership Surveys)
*Market share in US, UK and Australia (AAP, Bookscan)
26
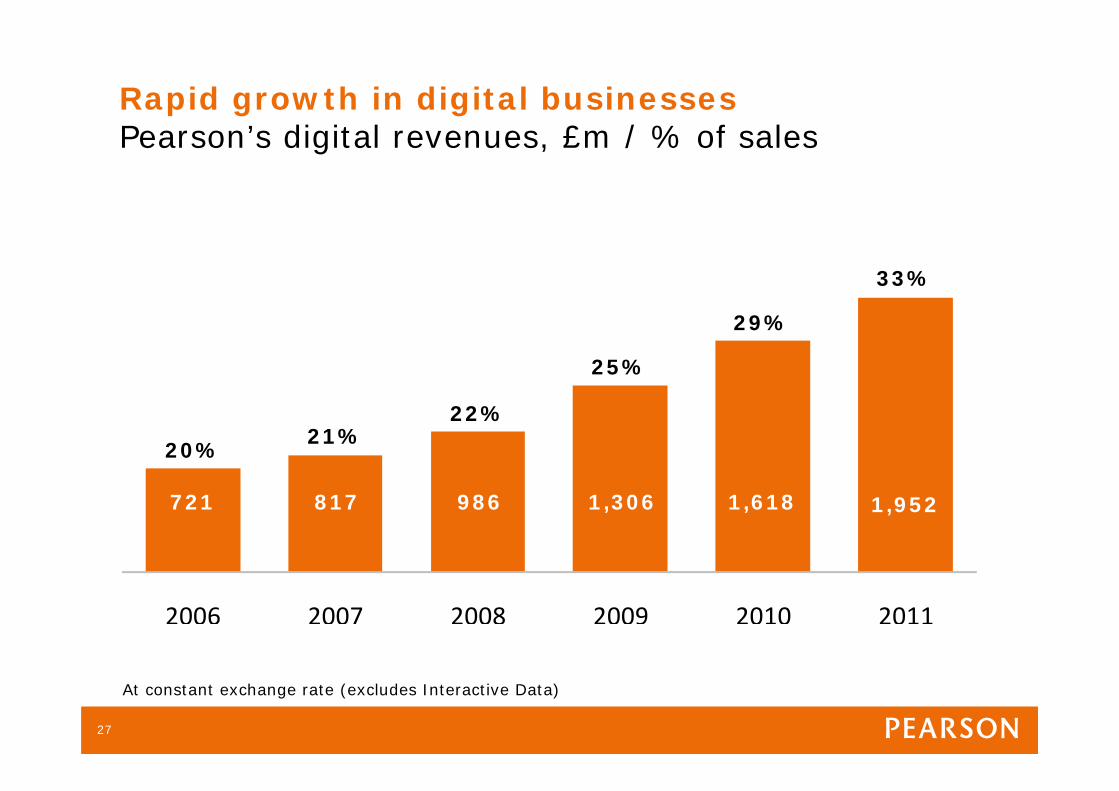
2006 2007 2008 2009 2010 2011
Rapid growth in digital businessesPearson’s digital revenues, £m / % of sales
721 817 986
20%21%
22%
25%
1,306
At constant exchange rate (excludes Interactive Data)
1,618
29%
1,952
33%
27
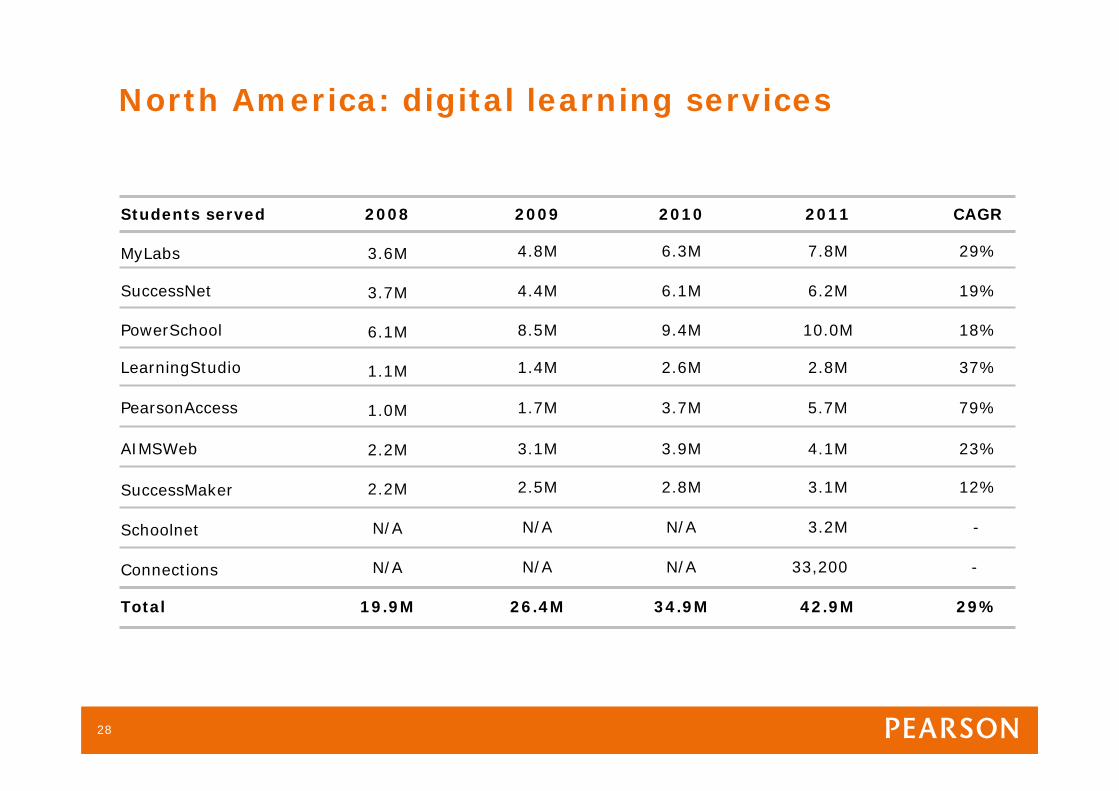
North America: digital learning services
MyLabs
SuccessNet
PowerSchool
2009 2010 CAGR
3.6M
3.7M
6.1M
2008
4.8M
4.4M
8.5M
LearningStudio
PearsonAccess
1.1M
1.0M
1.4M
1.7M
AIMSWeb
SuccessMaker
2.2M
2.2M
3.1M
2.5M
Total 19.9M 26.4M
6.3M
6.1M
9.4M
2.6M
3.7M
3.9M
2.8M
34.9M
29%
19%
18%
37%
79%
23%
12%
29%
Students served 2011
7.8M
6.2M
10.0M
2.8M
5.7M
4.1M
3.1M
42.9M
Schoolnet N/A N/A N/A -3.2M
Connections N/A N/A N/A -33,200
28
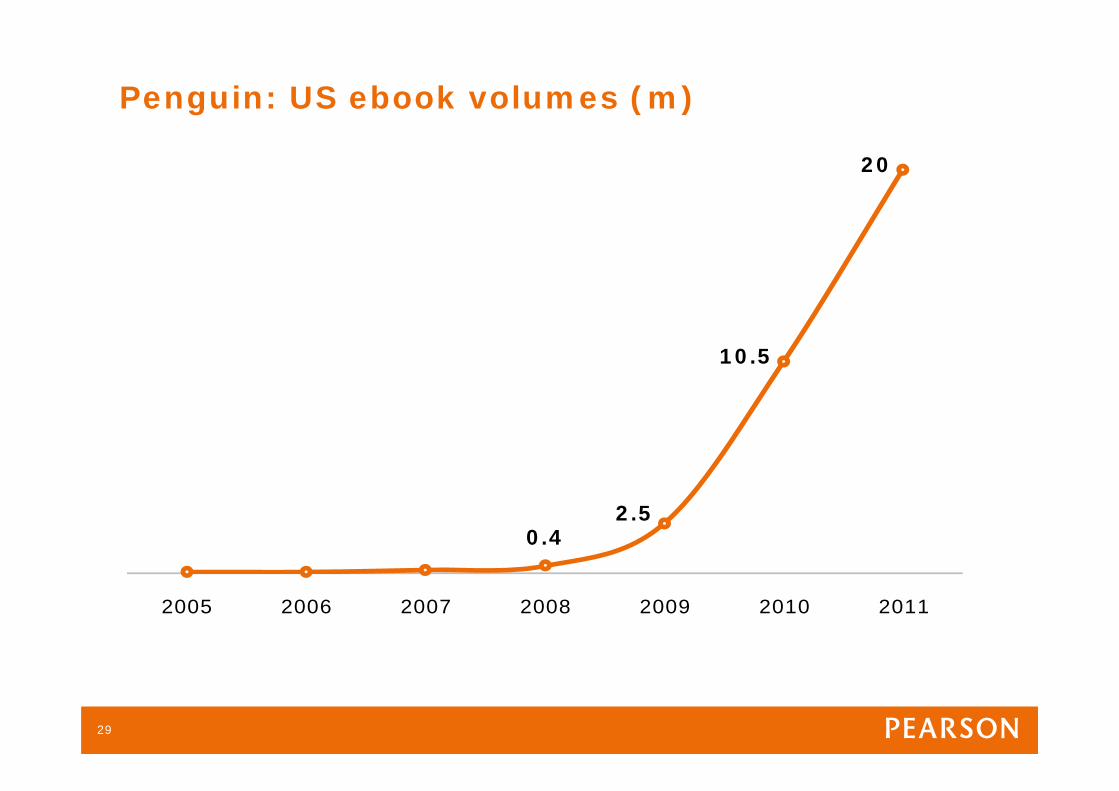
Penguin: US ebook volumes (m)
2005 2006 2007 2008 2009 2010 2011
0.42.5
10.5
20
29
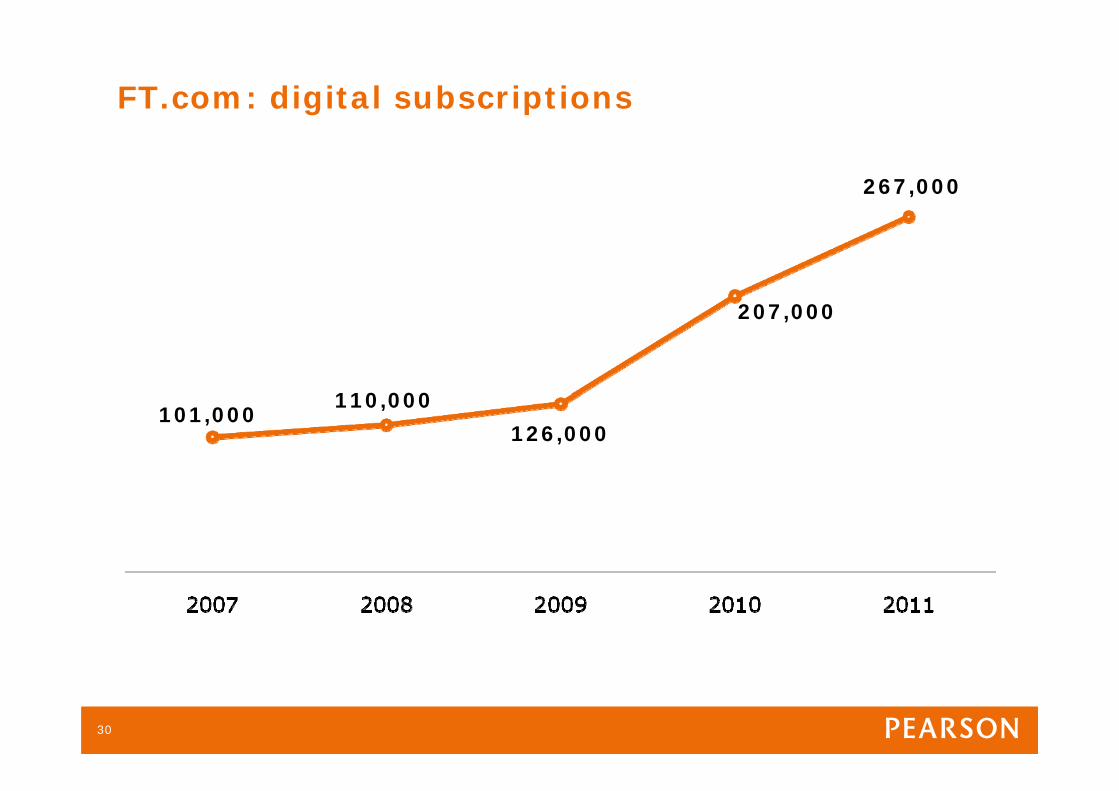
FT.com: digital subscriptions
101,000110,000
126,000
207,000
267,000
30
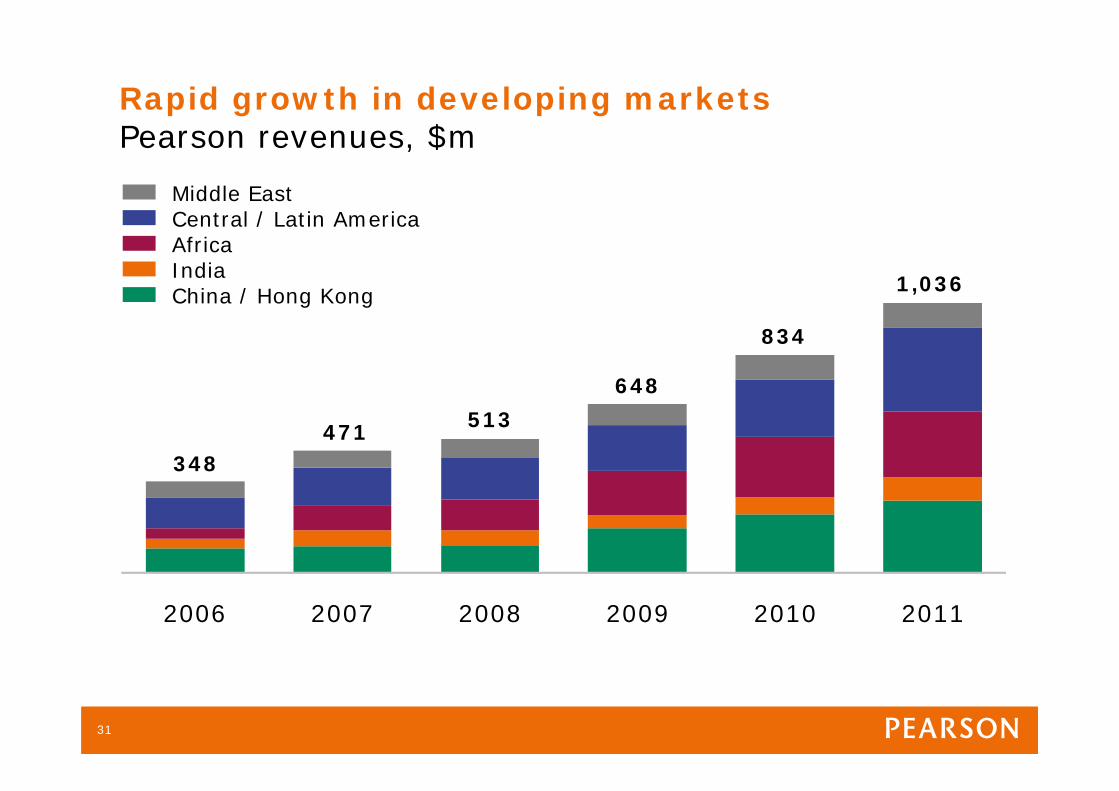
2006 2007 2008 2009 2010 2011
Rapid growth in developing marketsPearson revenues, $m
Middle EastCentral / Latin AmericaAfricaIndiaChina / Hong Kong
834
348471 513
648
1,036
31
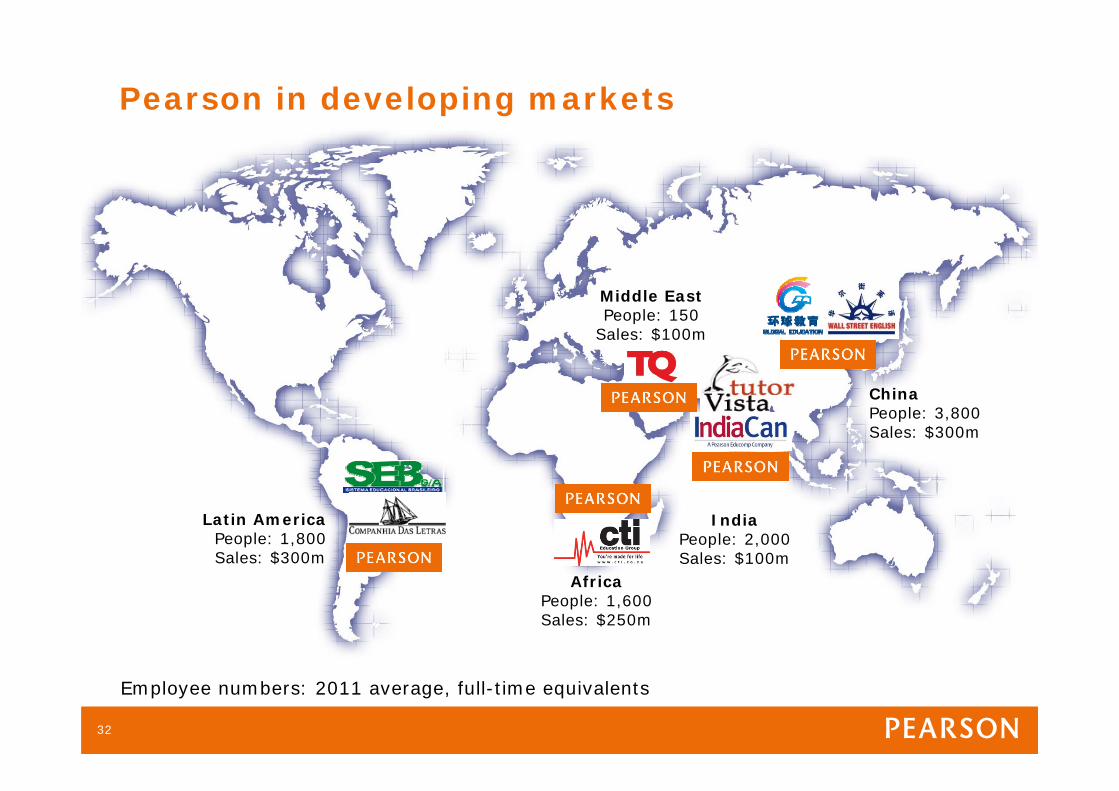
Pearson in developing markets
Latin America People: 1,800 Sales: $300m
AfricaPeople: 1,600 Sales: $250m
IndiaPeople: 2,000 Sales: $100m
ChinaPeople: 3,800 Sales: $300m
Middle East People: 150
Sales: $100m
Employee numbers: 2011 average, full-time equivalents
32
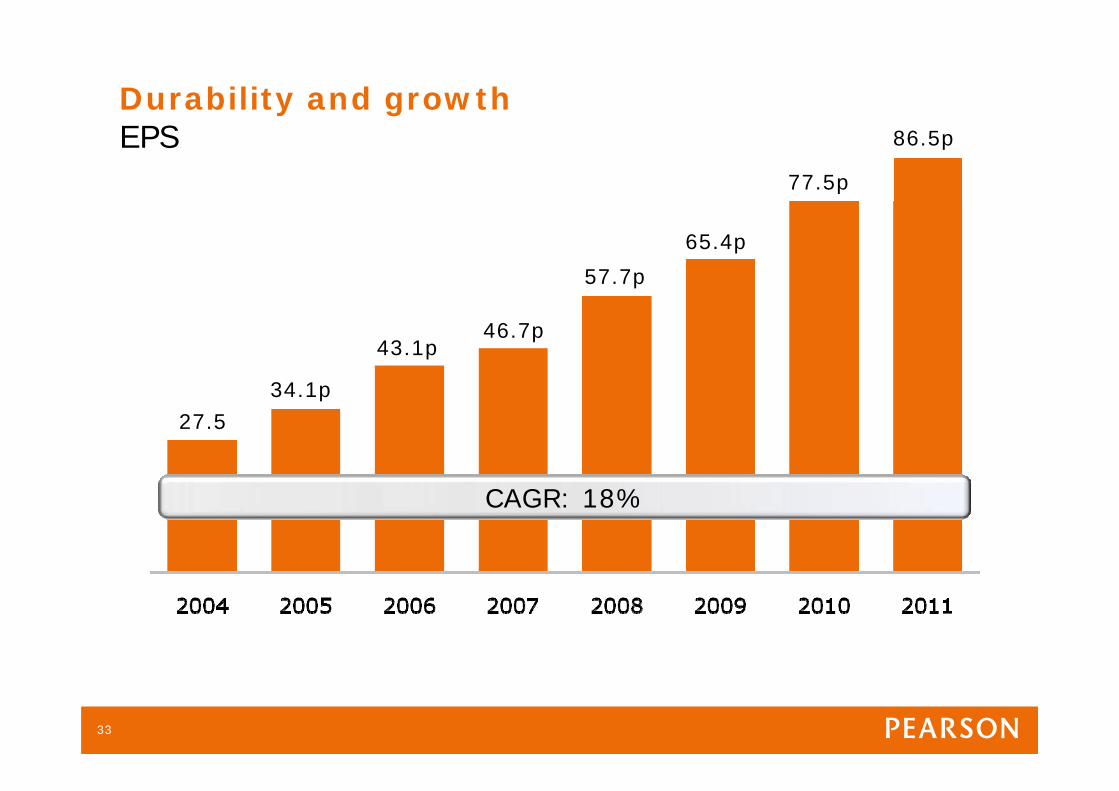
Durability and growthEPS
65.4p
57.7p
46.7p43.1p
34.1p
86.5p
77.5p
27.5
CAGR: 18%
33
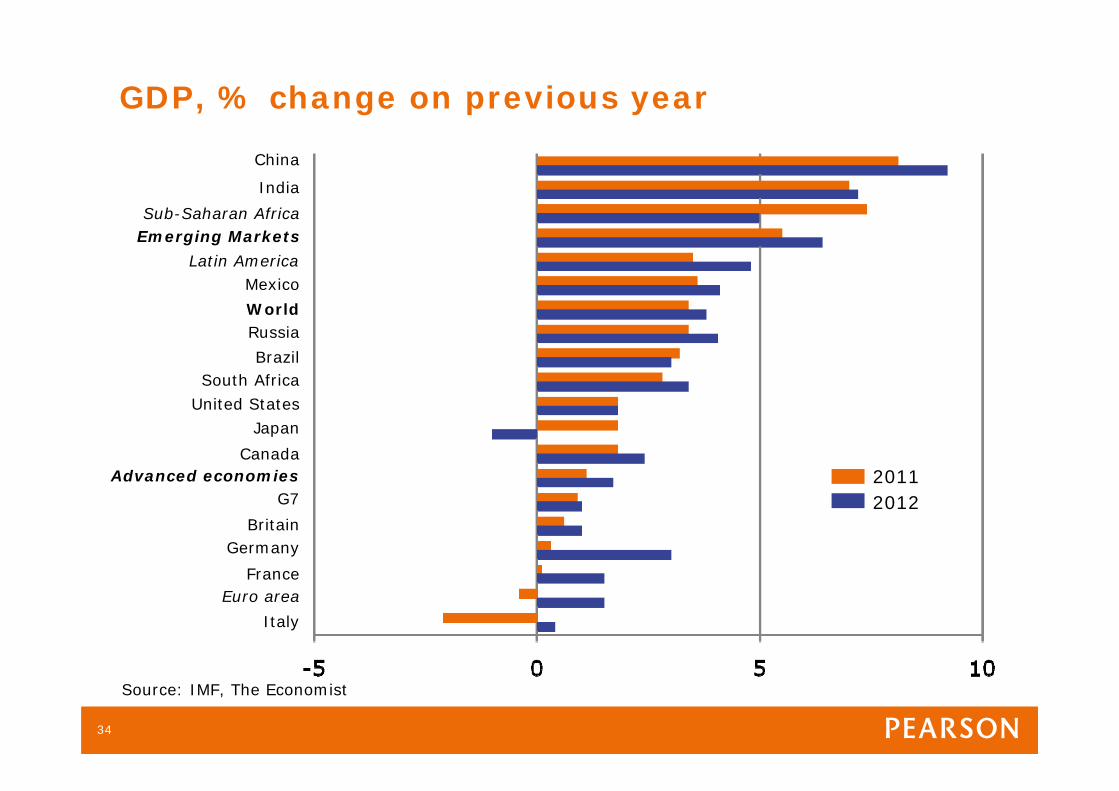
GDP, % change on previous year
20112012
China
India
Sub-Saharan AfricaEmerging Markets
Latin AmericaMexico
WorldRussia
BrazilSouth Africa
United StatesJapan
CanadaAdvanced economies
G7
BritainGermany
FranceEuro area
Italy
Source: IMF, The Economist
34

35

36

37
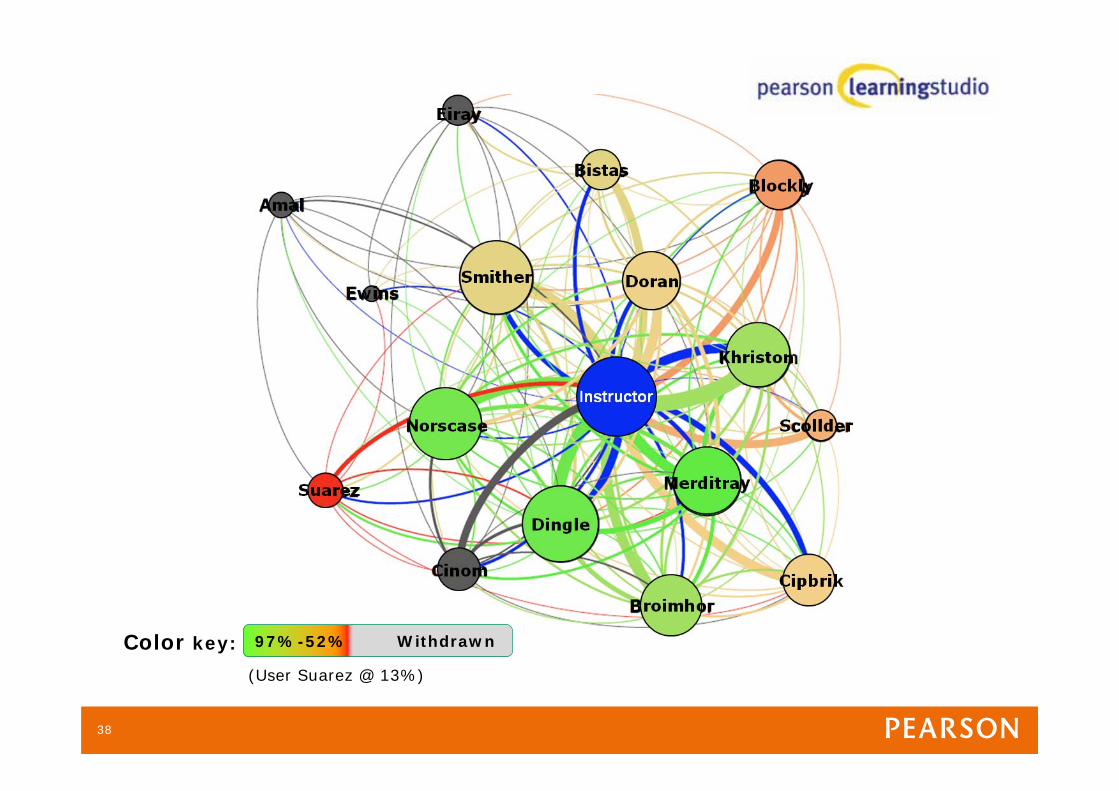
Color key: 97%-52% Withdrawn
(User Suarez @ 13%)
38
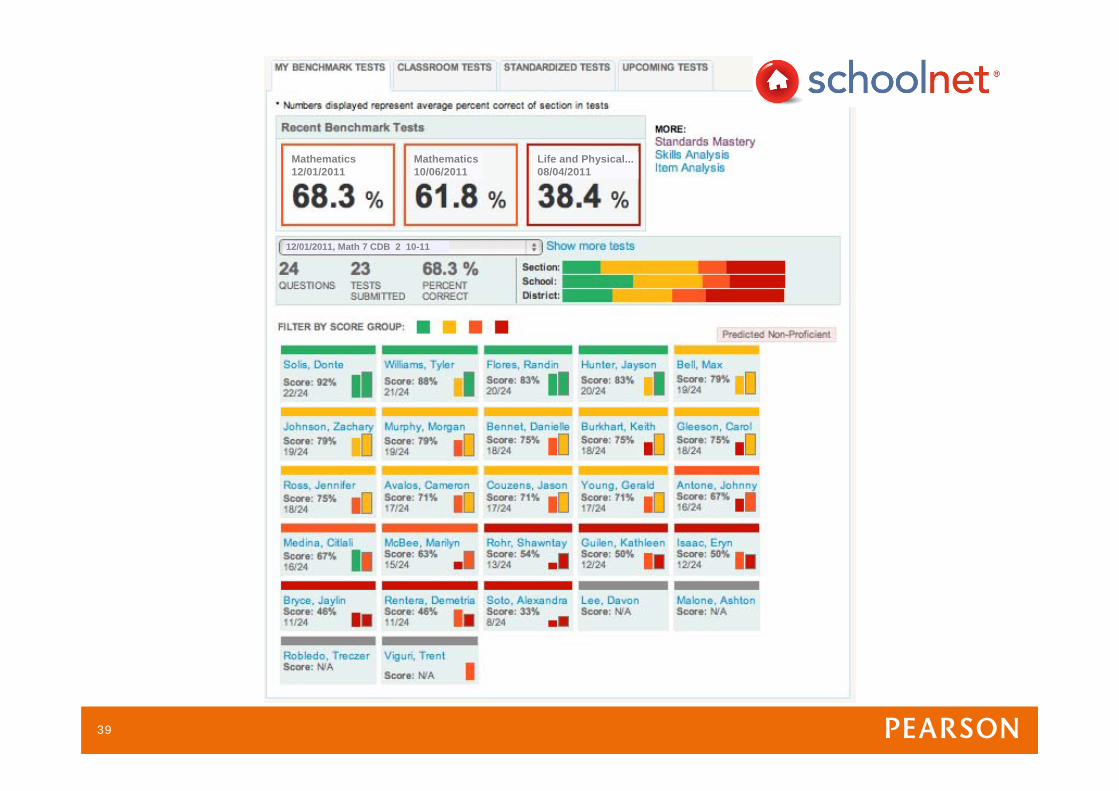
Mathematics12/01/2011
Mathematics10/06/2011
Life and Physical...08/04/2011
12/01/2011, Math 7 CDB 2 10-11
39
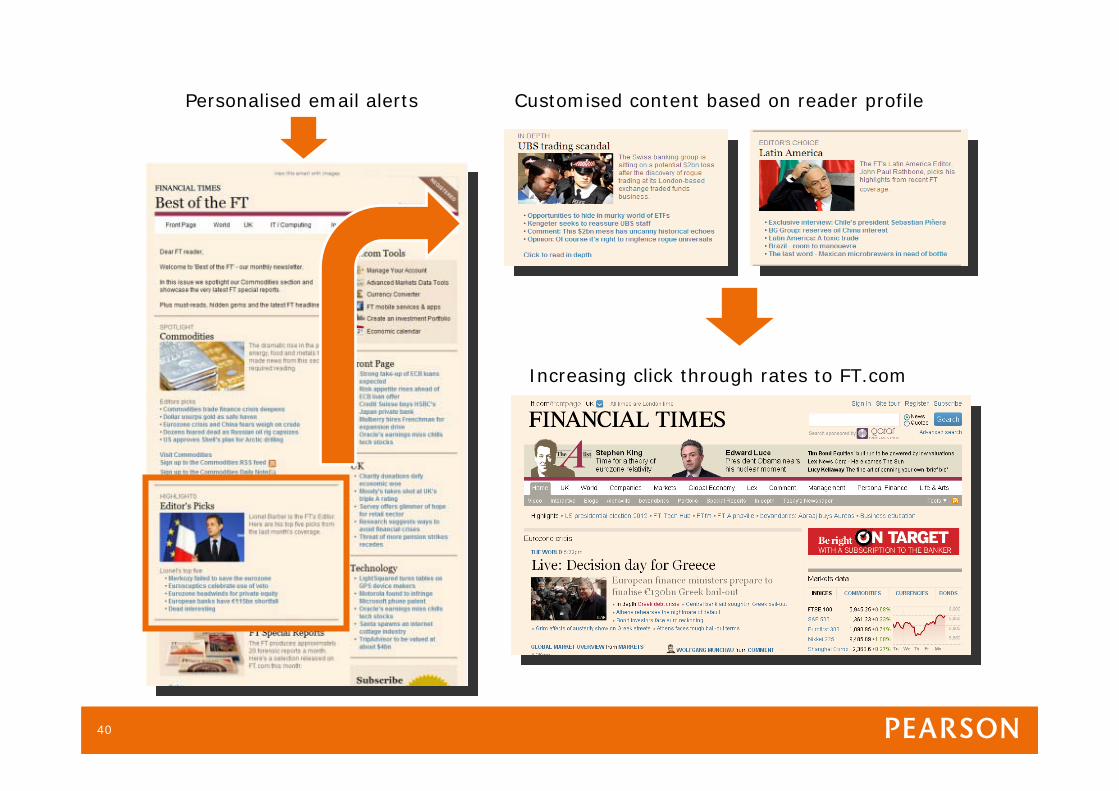
Customised content based on reader profilePersonalised email alerts
Increasing click through rates to FT.com
40
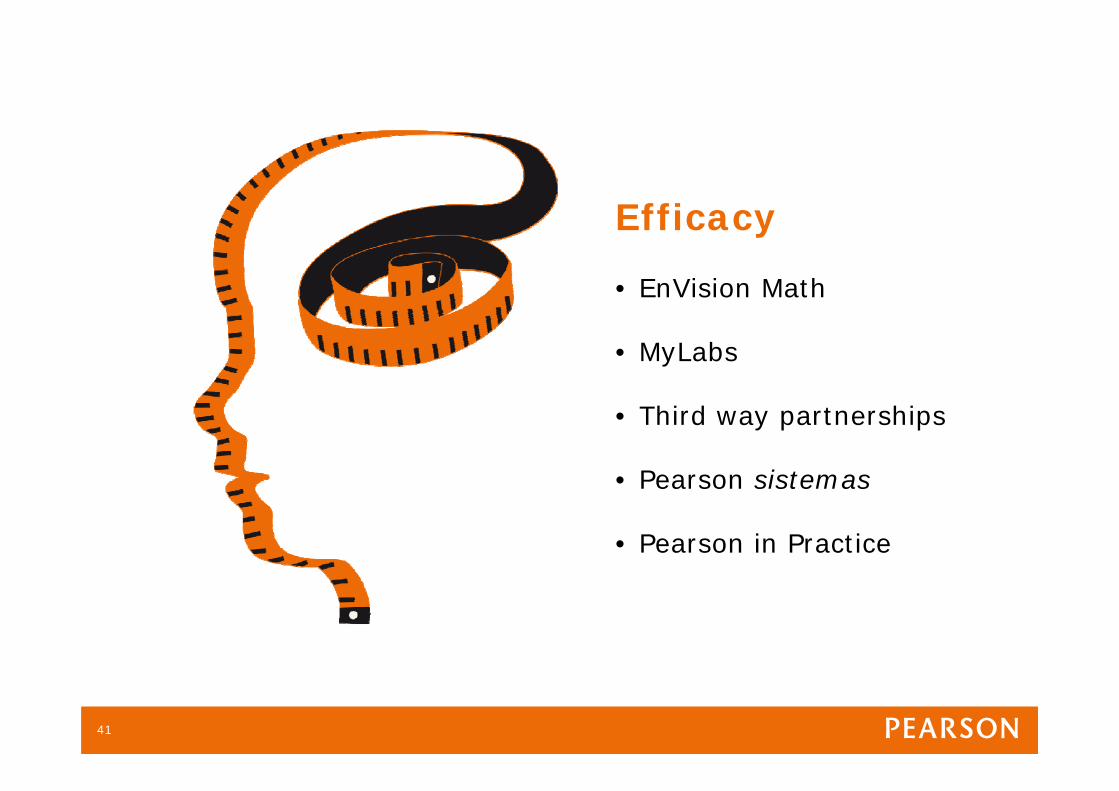
Efficacy
• EnVision Math
• MyLabs
• Third way partnerships
• Pearson sistemas
• Pearson in Practice
41

Infrastructure
42
What next?
Screens, mostly mobile
Results, rather than products
Education for the poorest, as much as richest
Education for work, inside and outside businesses
Formal and informal learning, making education lifelong
Not just a player, but the leader in emerging markets
43

Appendices
45
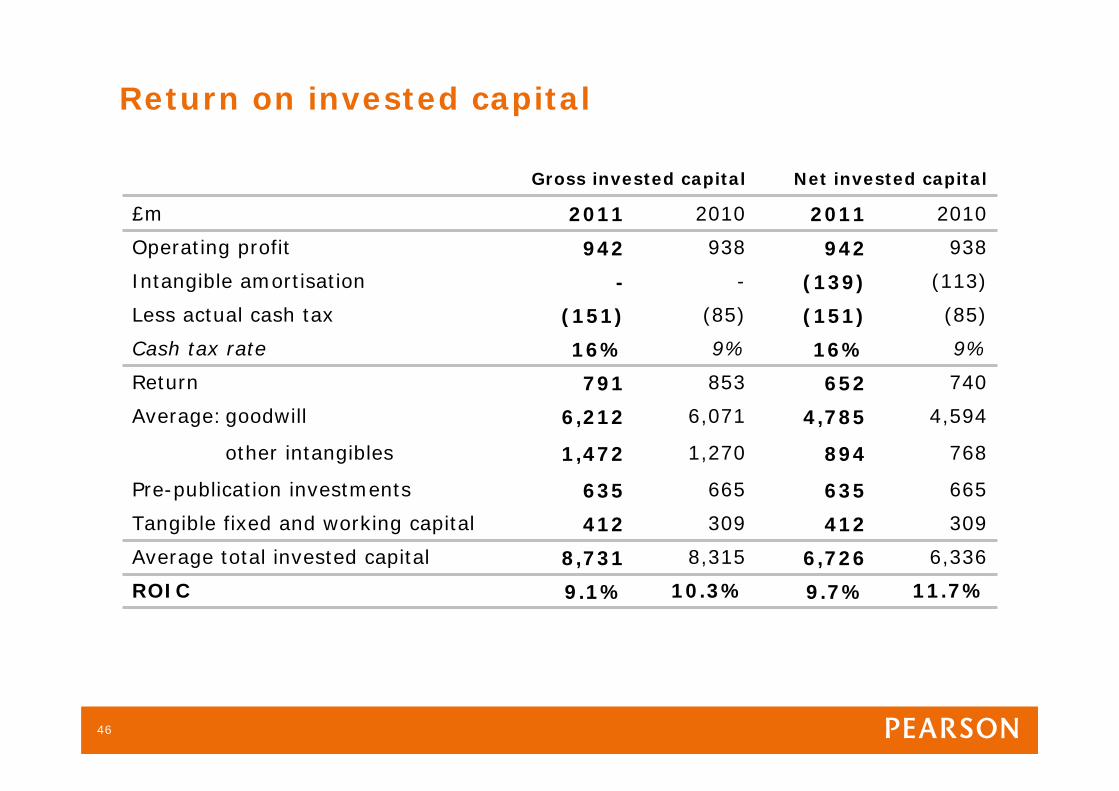
Return on invested capital
Gross invested capital Net invested capital
£m 2011 2010 2011 2010
Operating profit 942 938 942 938
Intangible amortisation - - (139) (113)
Less actual cash tax (151) (85) (151) (85)
Cash tax rate 16% 9% 16% 9%
Return 791 853 652 740
Average:goodwill 6,212 6,071 4,785 4,594
other intangibles 1,472 1,270 894 768
Pre-publication investments 635 665 635 665
Tangible fixed and working capital 412 309 412 309
Average total invested capital 8,731 8,315 6,726 6,336
ROIC 9.1% 10.3% 9.7% 11.7%
46
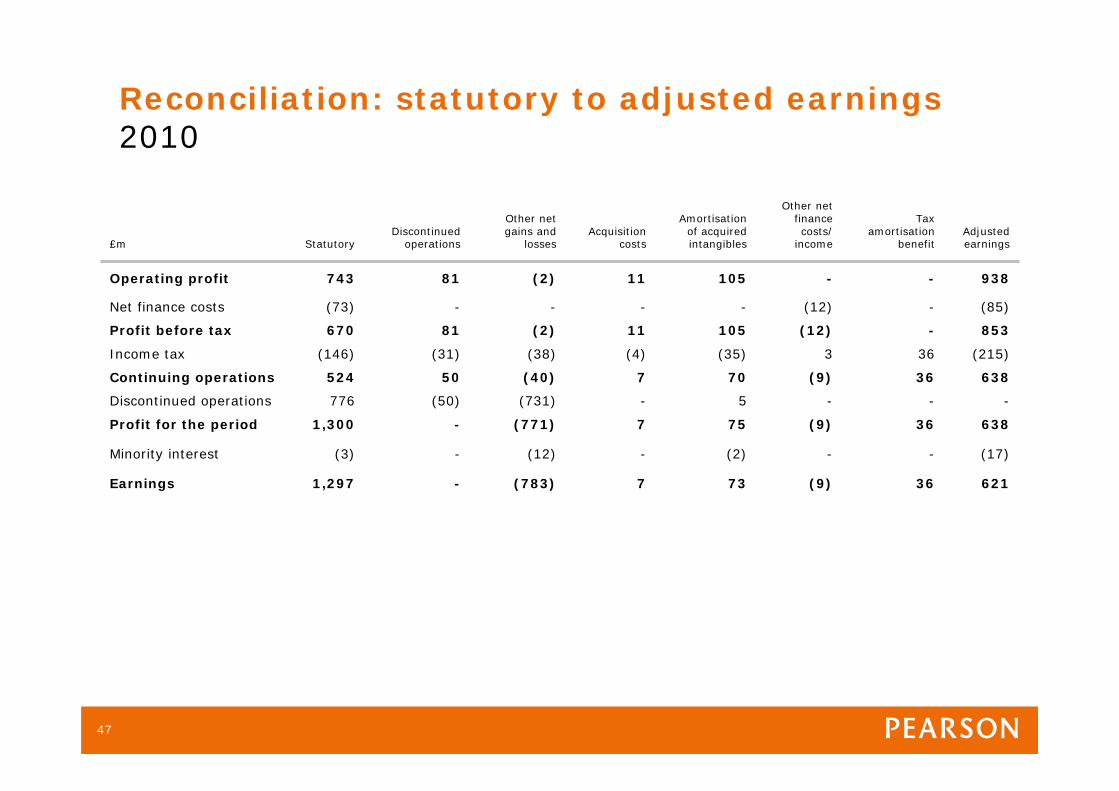
Reconciliation: statutory to adjusted earnings2010
£m StatutoryDiscontinued
operations
Other net gains and
lossesAcquisition
costs
Amortisation of acquired intangibles
Other net finance costs/
income
Tax amortisation
benefitAdjusted earnings
Operating profit 743 81 (2) 11 105 - - 938
Net finance costs (73) - - - - (12) - (85)
Profit before tax 670 81 (2) 11 105 (12) - 853
Income tax (146) (31) (38) (4) (35) 3 36 (215)
Continuing operations 524 50 (40) 7 70 (9) 36 638
Discontinued operations 776 (50) (731) - 5 - - -
Profit for the period 1,300 - (771) 7 75 (9) 36 638
Minority interest (3) - (12) - (2) - - (17)
Earnings 1,297 - (783) 7 73 (9) 36 621
47
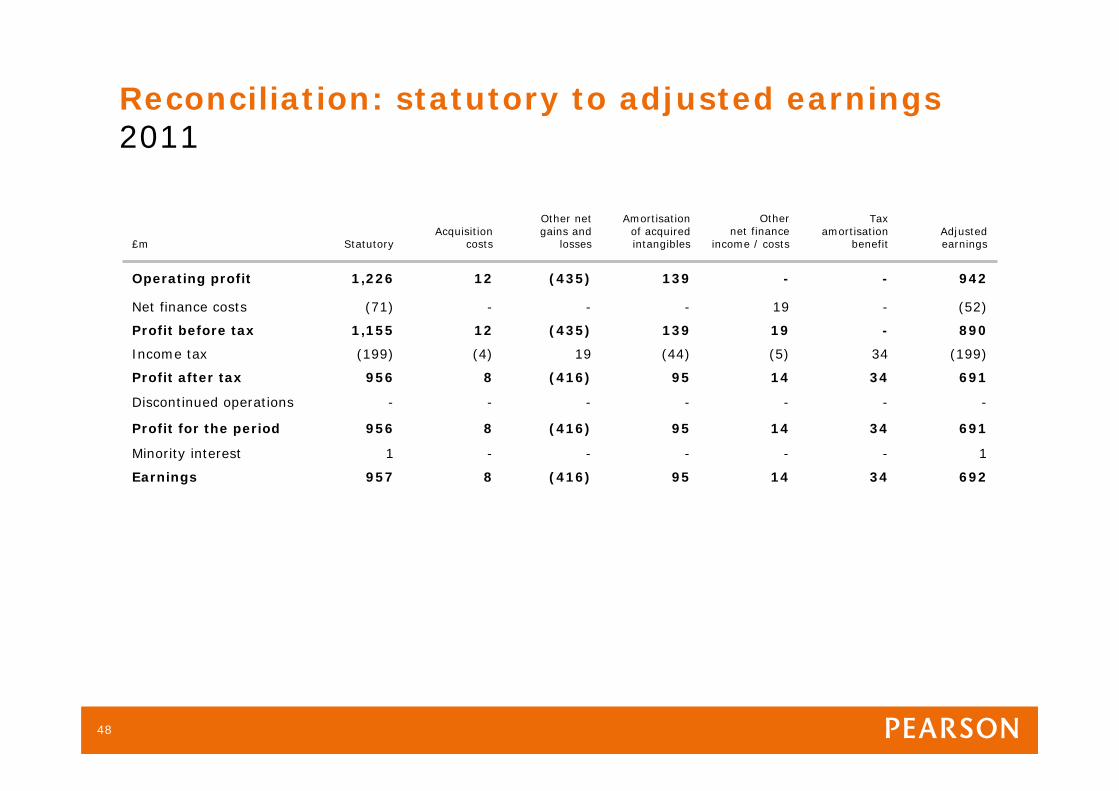
Reconciliation: statutory to adjusted earnings2011
£m StatutoryAcquisition
costs
Other net gains and
losses
Amortisation of acquired intangibles
Other net finance
income / costs
Tax amortisation
benefitAdjusted earnings
Operating profit 1,226 12 (435) 139 - - 942
Net finance costs (71) - - - 19 - (52)
Profit before tax 1,155 12 (435) 139 19 - 890
Income tax (199) (4) 19 (44) (5) 34 (199)
Profit after tax 956 8 (416) 95 14 34 691
Discontinued operations - - - - - - -
Profit for the period 956 8 (416) 95 14 34 691
Minority interest 1 - - - - - 1
Earnings 957 8 (416) 95 14 34 692
48
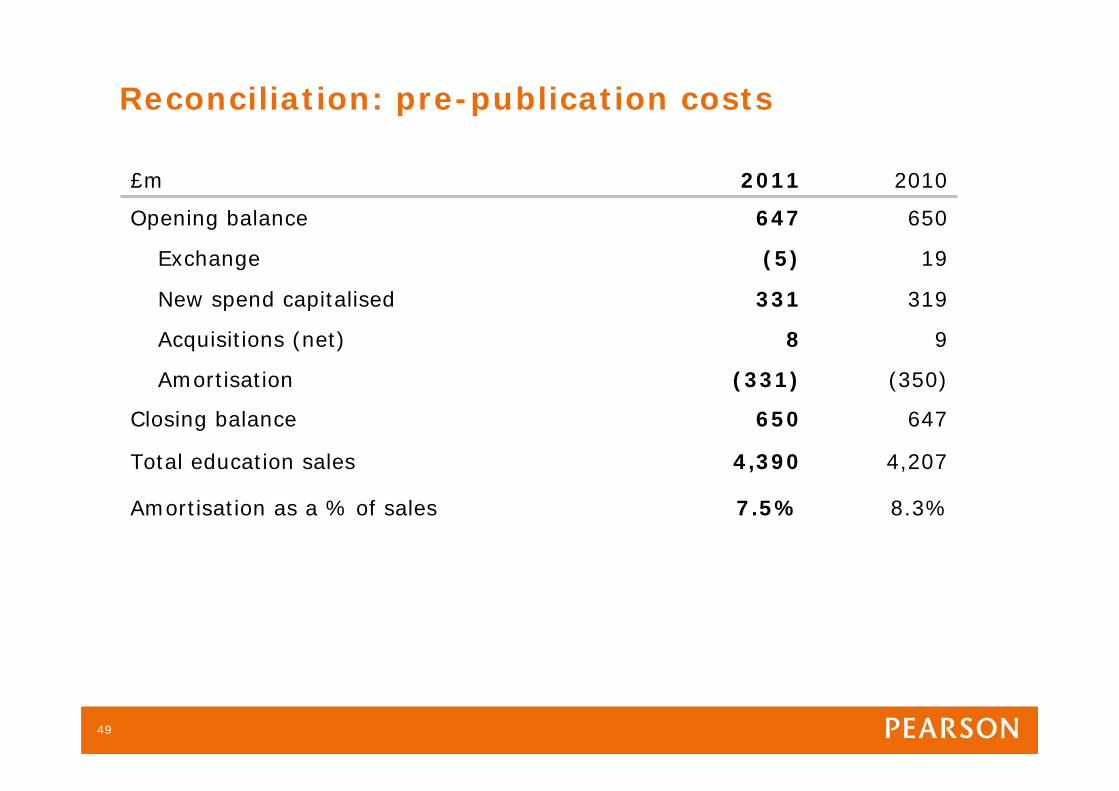
Reconciliation: pre-publication costs
£m 2011 2010
Opening balance 647 650
Exchange (5) 19
New spend capitalised 331 319
Acquisitions (net) 8 9
Amortisation (331) (350)
Closing balance 650 647
Total education sales 4,390 4,207
Amortisation as a % of sales 7.5% 8.3%
49
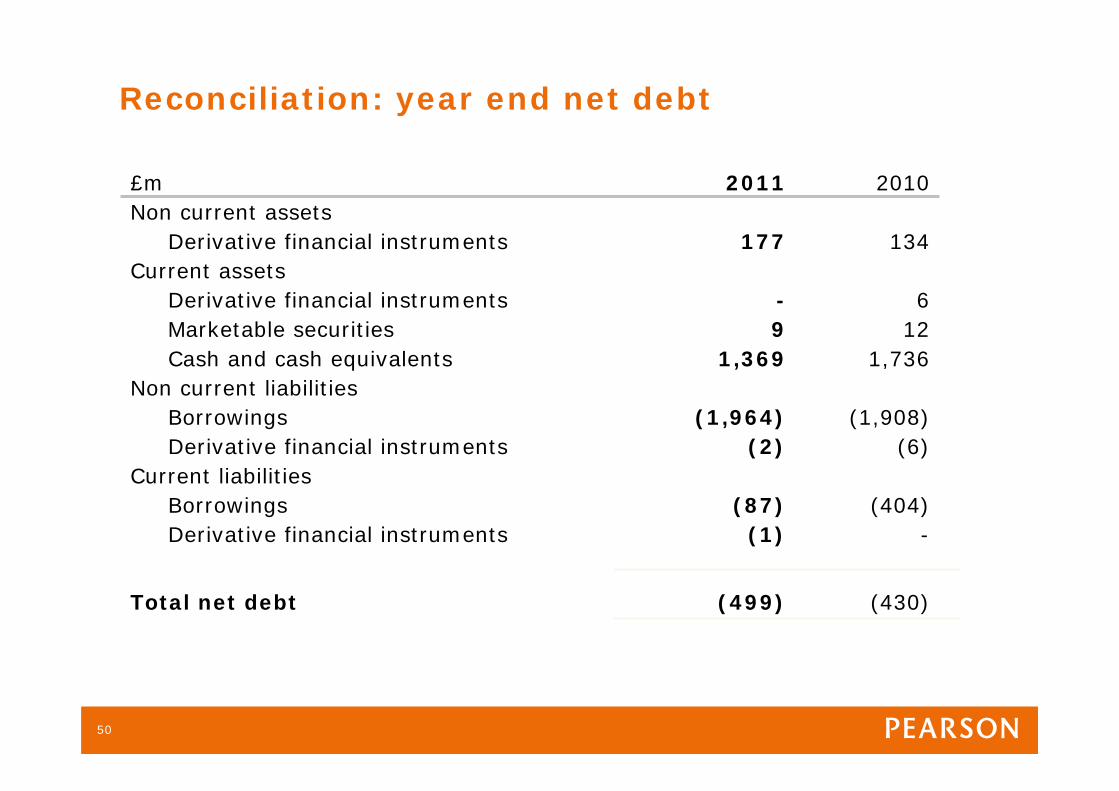
Reconciliation: year end net debt
£m 2011 2010Non current assets
Derivative financial instruments 177 134Current assets
Derivative financial instruments - 6Marketable securities 9 12Cash and cash equivalents 1,369 1,736
Non current liabilitiesBorrowings (1,964) (1,908)Derivative financial instruments (2) (6)
Current liabilitiesBorrowings (87) (404)Derivative financial instruments (1) -
Total net debt (499) (430)
50
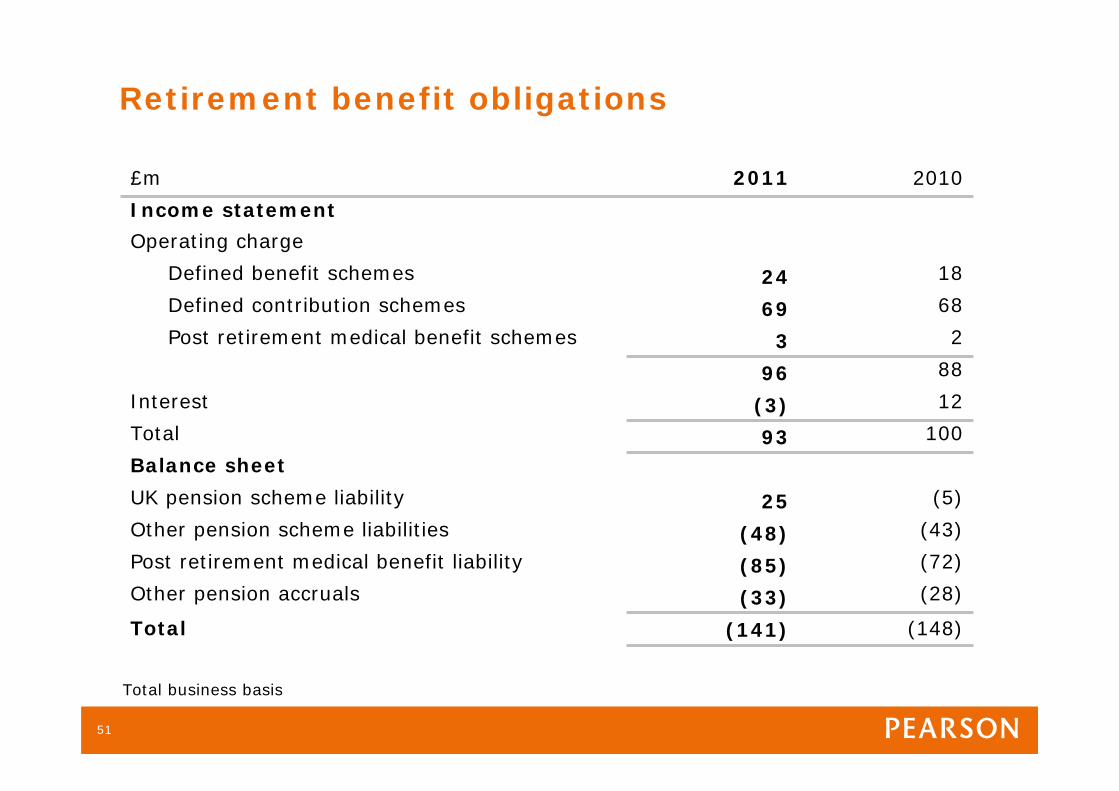
Retirement benefit obligations
£m 2011 2010
Income statement
Operating charge
Defined benefit schemes 24 18
Defined contribution schemes 69 68
Post retirement medical benefit schemes 3 2
96 88
Interest (3) 12
Total 93 100
Balance sheet
UK pension scheme liability 25 (5)
Other pension scheme liabilities (48) (43)
Post retirement medical benefit liability (85) (72)
Other pension accruals (33) (28)
Total (141) (148)
Total business basis
51
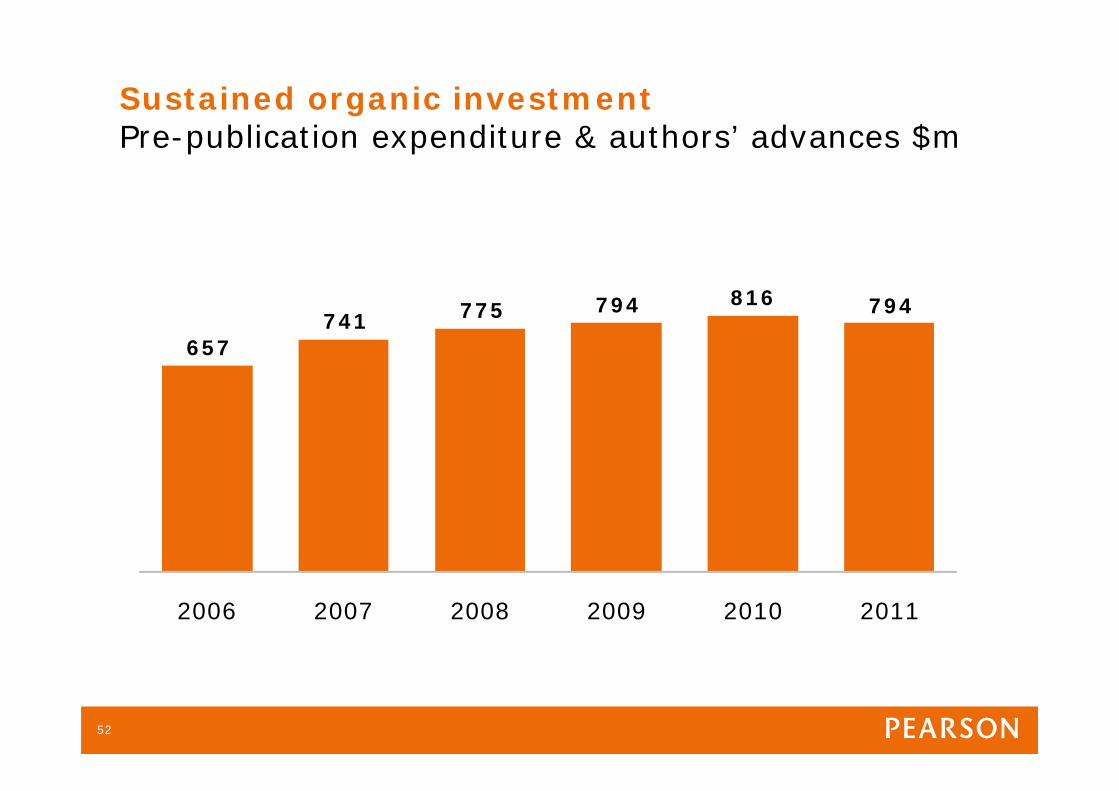
Sustained organic investmentPre-publication expenditure & authors’ advances $m
2006 2007 2008 2009 2010 2011
657741 775 794 816 794
52
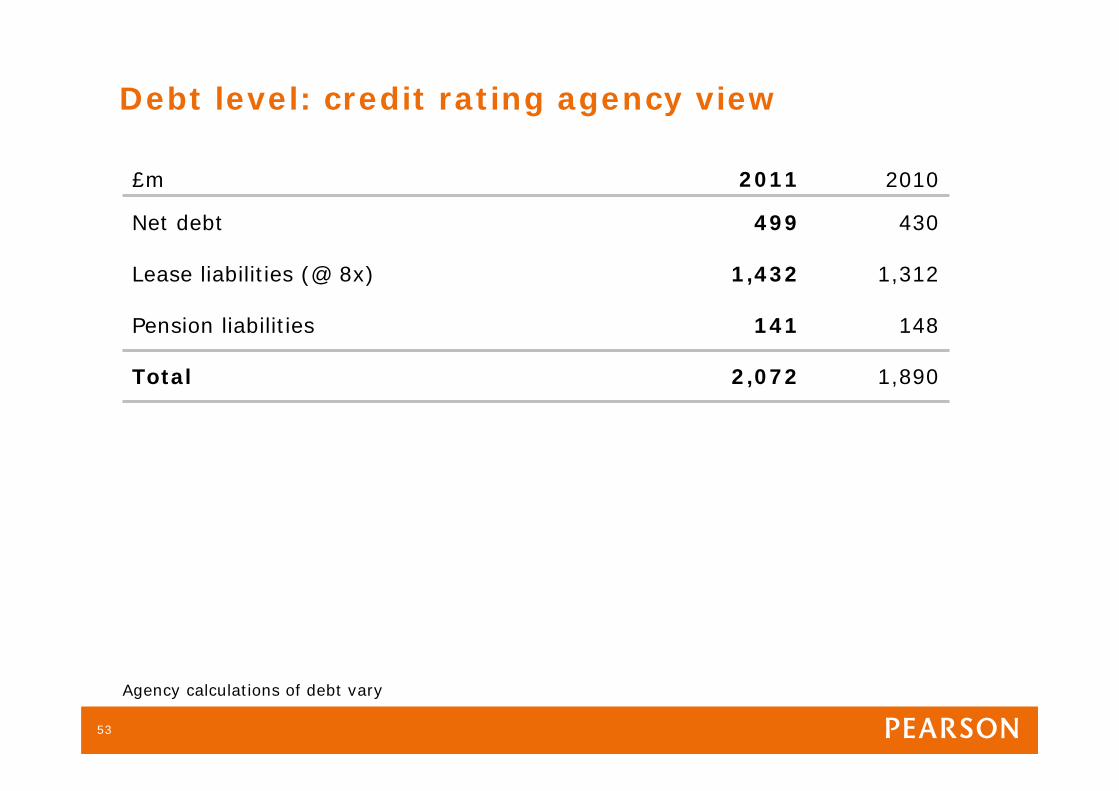
Agency calculations of debt vary
£m 2011 2010
Net debt 499 430
Lease liabilities (@ 8x) 1,432 1,312
Pension liabilities 141 148
Total 2,072 1,890
Debt level: credit rating agency view
53

Share gains in new school adoptions2011 estimates
SubjectTotal
opportunityMarket share (where we compete)
Position
Reading/Lit/Lang arts $185m 30% #1
Maths $125m 55% #1
Science/Health $195m 32% #2
Social Studies $25m 35% #1
Other $10m 36% #2
Total competed for $540m 37% #1
Total – all adoptions $650m 29% #2
54


Learn more atwww.pearson.com