2011 Report Card for New Hampshire's Infrastructure
48
-
Upload
vuongkhanh -
Category
Documents
-
view
214 -
download
0
Transcript of 2011 Report Card for New Hampshire's Infrastructure
Report Card
FOR NEW HAMPSHIRE’S
Infrastructure
Issued June 15, 2011
EXECUTIVE SUMMARY One does not have to look far to see that New Hampshire’s infrastructure directly affects your life – the roads you drive, the airlines and rail you travel, the water you drink, the lights you turn on in your home or office, a clean environment, or the schools your children attend. Civil engineers are responsible for planning, designing, constructing, and maintaining our infrastructure networks. They have the task of assuring that we live our lives with few if any inconveniences. Founded in 1852, the American Society of Civil Engineers (ASCE) is a professional organization that is comprised of over 140,000 civil engineers and is recognized as the stewards of our nation’s infrastructure. ASCE last updated the national “Report Card for America’s Infrastructure” in January of 2009. The report reviewed and evaluated the condition of many infrastructure categories including aviation, bridges, dams, drinking water, energy, hazardous waste, mass transit and rail, navigable waters, roads, schools, solid waste, and wastewater. The New Hampshire Section of ASCE has undertaken the task of updating a similar report for New Hampshire’s infrastructure. The 2011 ASCE-NH Infrastructure Report Card is an update of our January 2006 report. The purpose of the report is to research and evaluate the state’s infrastructure and ultimately educate the public for the need to invest in our infrastructure. The following Report Card and Issue Briefs for each category were prepared by practicing New Hampshire professional engineers using existing public documents and discussions with responsible public officials. Each category was evaluated on the basis of condition and performance, capacity versus need, and funding versus need. The grade was influenced if future funding was known to be increasing or decreasing. The grades indicate the state is performing better than the nation, with many grades staying about the same with modest declines over the past five years. The Issue Briefs and the Report Card conclude that more needs to be done to ensure New Hampshire’s infrastructure can support future demand. There are steps everyone can take to help improve our infrastructure, as outlined in the ASCE Renewing America’s Infrastructure: A Citizens Guide:
Be Informed: Learn about your community’s infrastructure needs. Get to know your legislative representatives and discuss your concerns with them. Demand Continuous Maintenance: If roads, bridges, or other infrastructure facilities are not kept in sound condition, they cannot support the level of service they are designed to handle. Regular maintenance prolongs life and minimizes the need for costly repairs. Think Long Term: Renewing the state’s infrastructure is an ambitious goal and cannot be accomplished overnight. Furthermore, the facilities built today must last for decades to come. Comprehensive planning and long-term funding are keys to sound decision making.
The infrastructure is a public asset and we must do our best to keep it from becoming a liability. Through taxes and user fees, we all share in the cost of capital investments and maintenance, and we therefore should treat infrastructure as an investment and demand the best returns. The New Hampshire Section of ASCE hopes you will use this information to encourage and support the repair and improvement of New Hampshire’s infrastructure.
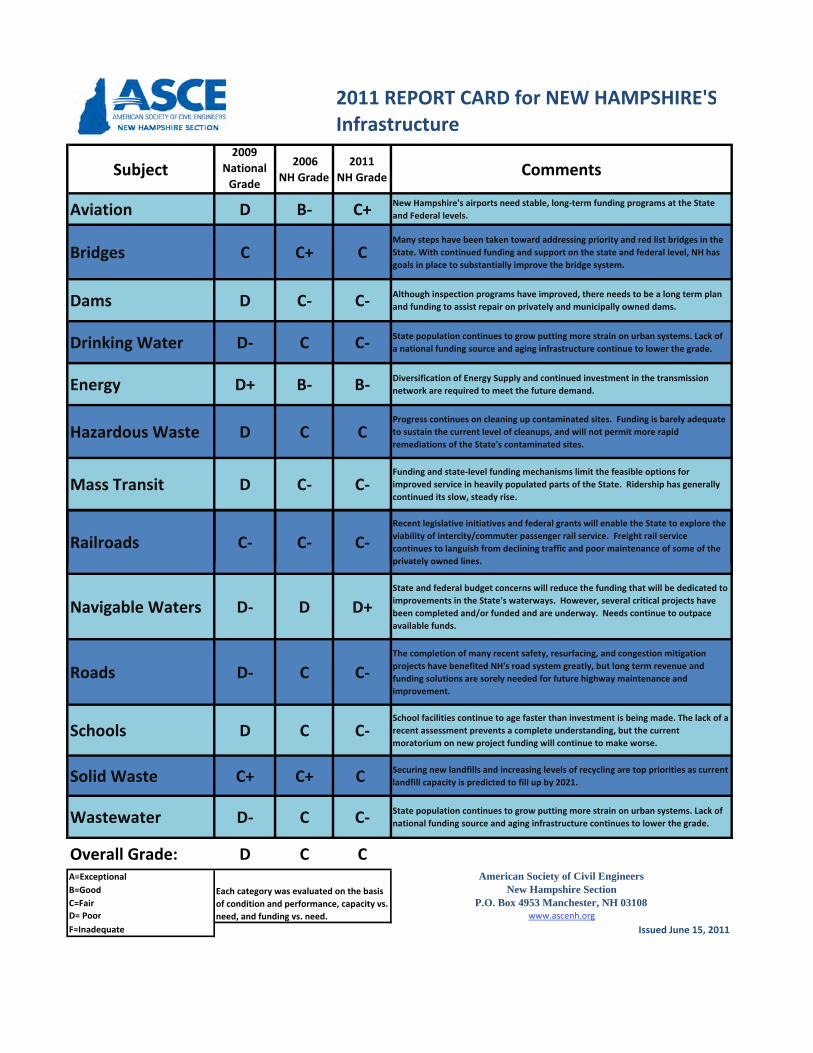
2011 REPORT CARD for NEW HAMPSHIRE'SInfrastructure
Subject2009
National Grade
2006 NH Grade
2011 NH Grade Comments
Aviation D B‐ C+ New Hampshire's airports need stable, long‐term funding programs at the State and Federal levels.
Bridges C C+ CMany steps have been taken toward addressing priority and red list bridges in the State. With continued funding and support on the state and federal level, NH has goals in place to substantially improve the bridge system.
Dams D C‐ C‐ Although inspection programs have improved, there needs to be a long term plan and funding to assist repair on privately and municipally owned dams.
Drinking Water D‐ C C‐ State population continues to grow putting more strain on urban systems. Lack of a national funding source and aging infrastructure continue to lower the grade.
Energy D+ B‐ B‐ Diversification of Energy Supply and continued investment in the transmission network are required to meet the future demand.
Hazardous Waste D C CProgress continues on cleaning up contaminated sites. Funding is barely adequate to sustain the current level of cleanups, and will not permit more rapid remediations of the State's contaminated sites.
Mass Transit D C‐ C‐Funding and state‐level funding mechanisms limit the feasible options for improved service in heavily populated parts of the State. Ridership has generally continued its slow, steady rise.
Railroads C‐ C‐ C‐Recent legislative initiatives and federal grants will enable the State to explore the viability of intercity/commuter passenger rail service. Freight rail service continues to languish from declining traffic and poor maintenance of some of the privately owned lines.privately owned lines.
Navigable Waters D‐ D D+State and federal budget concerns will reduce the funding that will be dedicated to improvements in the State's waterways. However, several critical projects have been completed and/or funded and are underway. Needs continue to outpace available funds.
Roads D‐ C C‐The completion of many recent safety, resurfacing, and congestion mitigation projects have benefited NH's road system greatly, but long term revenue and funding solutions are sorely needed for future highway maintenance and improvement.
Schools D C C‐School facilities continue to age faster than investment is being made. The lack of a recent assessment prevents a complete understanding, but the current moratorium on new project funding will continue to make worse.
Solid Waste C+ C+ C Securing new landfills and increasing levels of recycling are top priorities as current landfill capacity is predicted to fill up by 2021.
Wastewater D‐ C C‐ State population continues to grow putting more strain on urban systems. Lack of national funding source and aging infrastructure continues to lower the grade.
Overall Grade: D C CA=Exceptional American Society of Civil EngineersB=Good New Hampshire SectionC=Fair P.O. Box 4953 Manchester, NH 03108D= Poor www.ascenh.orgF=Inadequate Issued June 15, 2011
Each category was evaluated on the basis of condition and performance, capacity vs. need, and funding vs. need.
Report Card
FOR NEW HAMPSHIRE’S
Infrastructure
American Society of Civil Engineers New Hampshire Sect ion
P.O. Box 4953 Manchester, New Hampshire 03108
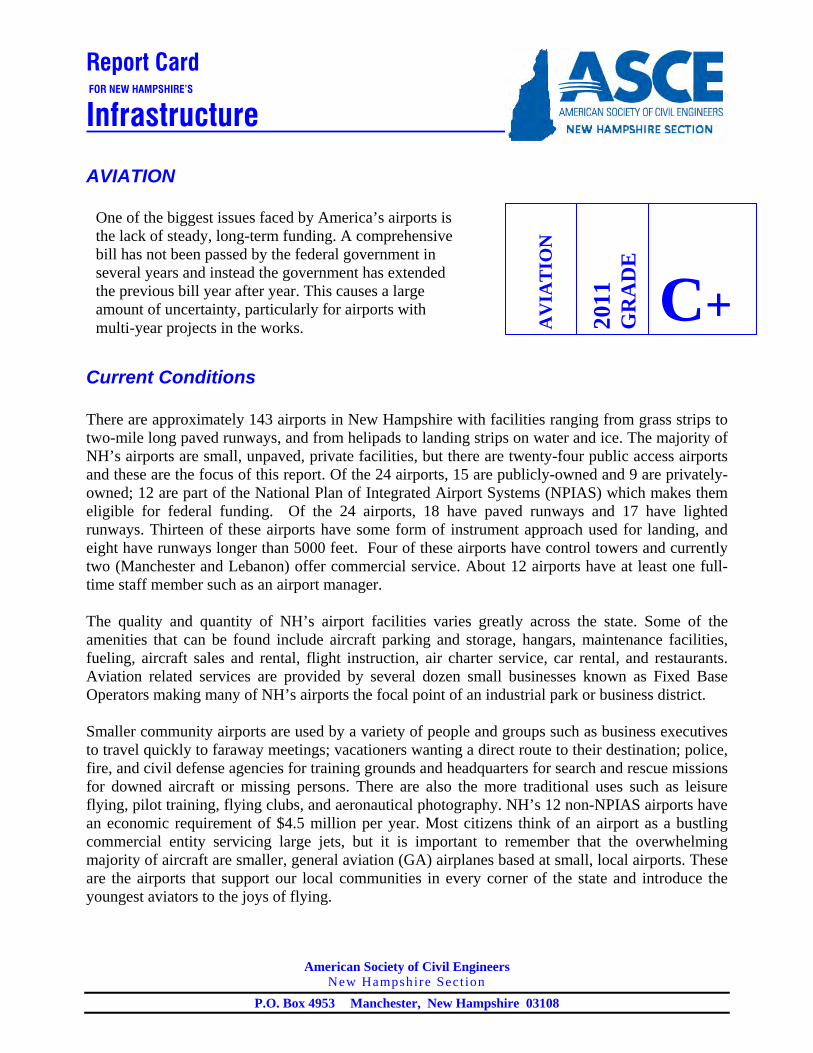
AVIATION
Current Conditions There are approximately 143 airports in New Hampshire with facilities ranging from grass strips to two-mile long paved runways, and from helipads to landing strips on water and ice. The majority of NH’s airports are small, unpaved, private facilities, but there are twenty-four public access airports and these are the focus of this report. Of the 24 airports, 15 are publicly-owned and 9 are privately-owned; 12 are part of the National Plan of Integrated Airport Systems (NPIAS) which makes them eligible for federal funding. Of the 24 airports, 18 have paved runways and 17 have lighted runways. Thirteen of these airports have some form of instrument approach used for landing, and eight have runways longer than 5000 feet. Four of these airports have control towers and currently two (Manchester and Lebanon) offer commercial service. About 12 airports have at least one full-time staff member such as an airport manager. The quality and quantity of NH’s airport facilities varies greatly across the state. Some of the amenities that can be found include aircraft parking and storage, hangars, maintenance facilities, fueling, aircraft sales and rental, flight instruction, air charter service, car rental, and restaurants. Aviation related services are provided by several dozen small businesses known as Fixed Base Operators making many of NH’s airports the focal point of an industrial park or business district. Smaller community airports are used by a variety of people and groups such as business executives to travel quickly to faraway meetings; vacationers wanting a direct route to their destination; police, fire, and civil defense agencies for training grounds and headquarters for search and rescue missions for downed aircraft or missing persons. There are also the more traditional uses such as leisure flying, pilot training, flying clubs, and aeronautical photography. NH’s 12 non-NPIAS airports have an economic requirement of $4.5 million per year. Most citizens think of an airport as a bustling commercial entity servicing large jets, but it is important to remember that the overwhelming majority of aircraft are smaller, general aviation (GA) airplanes based at small, local airports. These are the airports that support our local communities in every corner of the state and introduce the youngest aviators to the joys of flying.
C+2011
G
RA
DE
AV
IAT
ION
One of the biggest issues faced by America’s airports is the lack of steady, long-term funding. A comprehensive bill has not been passed by the federal government in several years and instead the government has extended the previous bill year after year. This causes a large amount of uncertainty, particularly for airports with multi-year projects in the works.
AIRPORTS – PAGE 2 of 4
Issued June 15, 2011
Airport maintenance and expansion is funded by a variety of federal, state and local programs. The Federal Aviation Administration’s (FAA) Airport Improvement Program (AIP) contributes approximately $15,000,000/year through three different grants to the NPIAS airports in NH. The AIP provides entitlement grants to commercial airports based primarily on passenger enplanements and to general aviation (no commercial service) airports of up to $150,000/year per airport. New Hampshire also receives about $1,100,000 in an apportionment block grant which is administered by NHDOT’s Bureau of Aeronautics. Discretionary grants account for a large portion of funding and are awarded by the FAA to airports for specific projects such as Boire Field’s two year, $15M runway relocation project in Nashua. Manchester Airport is supported by the Passenger Facilities Charge (PFC) of $4.50 from every airline ticket sold towards FAA funded projects. However, this prevents Manchester from receiving a portion of the entitlements provided to the region. By doing this, Manchester generates more money towards FAA funded projects than they would have received from entitlements. This also benefits the region as it returns entitlement dollars back to the AIP to fund grants for the general aviation airports. Currently the FAA is trying to increase the PFC from $4.50, which it has been at since the program’s inception, to $7. This is currently being reviewed by Congress as they deliberate to reauthorize the Airport Improvement Program. The FAA also funds a program which assists Airports and Airlines in supporting commercial service by funding a percentage of the seats on a commercial service flight to an airport that otherwise could not support commercial flights. This program is known as the essential air service program and plays a key role in keeping commercial service at Lebanon Airport. Congress is considering eliminating this program under the new AIP which could threaten commercial air service at Lebanon. The 12 public airports that are not eligible for federal funding often have a difficult time meeting their maintenance and operating needs. The most reliable funding sources for these airports are aircraft registration fees. In the past, a nominal amount of money (less than $100,000 in total) was provided to these airports through state grants. However, these grants have decreased steadily over the past 20 years and today there are no state grants available at all. To survive without help from some kind of state or federal grant, each airport must find a way to make ends meet. Frequently this is accomplished by charging fees for the various services and events sponsored by the airport, and many of these smaller airports are run by volunteers who donate their own time and money to keep the airport running for others.
Manchester-Boston Regional Airport Manchester Boston Regional Airport (MHT) is NH’s largest commercial airport. After surviving the 1980s with bare-bones commercial service, the airport has undergone tremendous growth over the past two decades to become the nation’s 66th busiest airport with nearly 3 million total passengers in 2010. The cargo operations of UPS and Federal Express have also grown rapidly to where MHT’s cargo volume is the 3rd largest in New England. The airport has undergone several hundred million dollars worth of improvements and renovations during this time. The Airport Access Road is expected to be opened to traffic in late 2011 and will provide even easier access to the airport via the F E Everett Turnpike. This, in turn, is expected to spur the development of nearby undeveloped land. MHT is an economic engine of southern NH providing approximately 3600 direct and indirect jobs and $1.2 billion in economic impact to the state of NH. The airport frequently competes for passengers with Boston’s Logan Airport, therefore it is critical that services and conveniences continue to expand to meet the needs of New England’s flying public.

AIRPORTS – PAGE 3 of 4
Issued June 15, 2011
Investment Needs Currently one of the biggest issues faced by America’s airports is the lack of steady, long-term funding. A comprehensive bill has not been passed by the federal government in several years and instead the government continues to extend the previous bill year after year. This causes a large amount of uncertainty, particularly for airports with multi-year projects in the works. The current Airport Improvement Program (AIP) has been extended for a 16th time to temporarily fund the AIP until it is reauthorized. These extensions, which have ranged from three to six months prevent the FAA from authorizing grants on a continual basis and force the prioritization of funding within the region based upon the amount of grant money authorized during the temporary extension. Thus, airports are unable to implement several projects over the long term and in some cases, must phase-in projects in order to complete them. Currently, airports in NH can only plan three months ahead due to the uncertainty in funding. The FAA has mandated that all commercial service airports must have their runway safety areas under compliance by 2015. Due to this requirement, projects that would bring runway safety areas into compliance were prioritized and will tie up a large portion of discretionary funds for the FAA New England Region from 2012 to 2015. This reduces the amount of discretionary funds available to other airports, especially the General Aviation (GA) airports. The NH Legislature recently denied the establishment of a dedicated state aeronautical fund (House Bill 1506) for the 12 airports not eligible for state funding. Revenue for the fund was to be generated strictly by aviation activities, and the bill would have ensured that funds collected from aviation activities would have been used for aviation funding only. Currently 75% of aircraft registration fees and 100% of aircraft fuel taxes are redirected into the state general fund. Many states already have similar bills in place. Passage of a bill similar to HB 1506 would help to fund badly needed repairs and safety requirements necessary at our smaller airports. Within the past few years, NHDOT has instituted an 80/20 matching fund policy where the state will fund 80% of repairs and improvements so long as the airport is able to fund 20% of the cost. This is much more beneficial than the 50/50 program of the past, however the sharp reduction of state grants has compromised the benefits of this program. In addition, due to the State’s hiring freeze, the Bureau of Aeronautics remains understaffed which results in administrative delays. Also, a long-sought-after instrument landing system (ILS) is currently not available anywhere in northern NH and an ILS equipped airport is sorely needed to provide a safe haven for an airplane needing to make an emergency landing in harsh weather. In addition, it could help spur the tourist activity so vital to the northern part of the state.
Recommendations Supported by ASCE • The passage by the NH Legislature of a bill similar to House Bill 1506 is critical to the
funding of our smaller, non-federally funded airports. • Provide an Instrument Landing System at one of our North Country airports. • Support the growth of our commercial service airports (Manchester, Pease and Lebanon) by
providing the resources necessary for that growth. • A comprehensive, long-term funding program needs to be created and approved by the
federal government in order to provide a smooth-running funding apparatus. • Maintain the Essential Air Service Program as part of the new long term funding program. • Increase the Passenger Facilities Charge as part of the new long term funding program.

AIRPORTS – PAGE 4 of 4
Issued June 15, 2011
Sources • A Plan For the Development of Airports in New Hampshire, 2003, Division of Aeronautics,
NHDOT. • Economic Analysis and Report Supporting a Dedicated Aviation Trust Fund for Non-
Federally Funded New Hampshire Airports, September 2010, Aircraft Owners and Pilots Association.
• Information provided by Division of Aeronautics, NHDOT, November 2010. • Information provided by Manchester Boston Regional Airport, December 2010.
Report Card
FOR NEW HAMPSHIRE’S
Infrastructure
American Society of Civil Engineers New Hampshire Sect ion
P.O. Box 4953 Manchester, New Hampshire 03108
Roads and Bridges
Current Conditions Roads President Eisenhower once said, “Our unity as a nation is sustained by free communication of thought and by easy transportation of people and goods.” On the State and National level the importance of a safe and efficient road system to the health of the economy and the well being of the people as a whole is as evident today as it ever has been. For the past several years as highway finances have tightened and costs have climbed, the key focus of NH’s road projects has turned to safety and a renewed emphasis has been given to spending the available resources most effectively. Federal and State funding for road and bridge projects is a complex subject with many variables. For the purpose of this report card, federal funding has been approximately $140 million in recent years. Most federal projects require a 20% match by the State to leverage the federal dollars. More funding may be available depending on whether this match is done using a hard match, normally monies from the State highway fund, utilize either a soft match, normally the amount the State pays its employees in salary and benefits, or use turnpike toll credits which recognizes the State’s investment in the turnpike system. Federal funds are generally directed to highway and bridge preservation programs, used to address red-list bridges, used for debt service repayment on the I-93 widening project, targeted to specifically designated federal programs, and a limited amount of non-discretionary programs. Pavement condition and performance is an important aspect of New Hampshire’s road system not only for user safety, but also for efficiency. Poorly maintained roads can increase travel time and decrease the load carrying capacity of the road. This fact is important for New Hampshire since 63% of goods shipped in New Hampshire are carried by trucks, and commercial trucking is expected to increase by 31% in the next 10 years. The longer that road surfaces are allowed to
RO
AD
S
2011
G
RA
DE
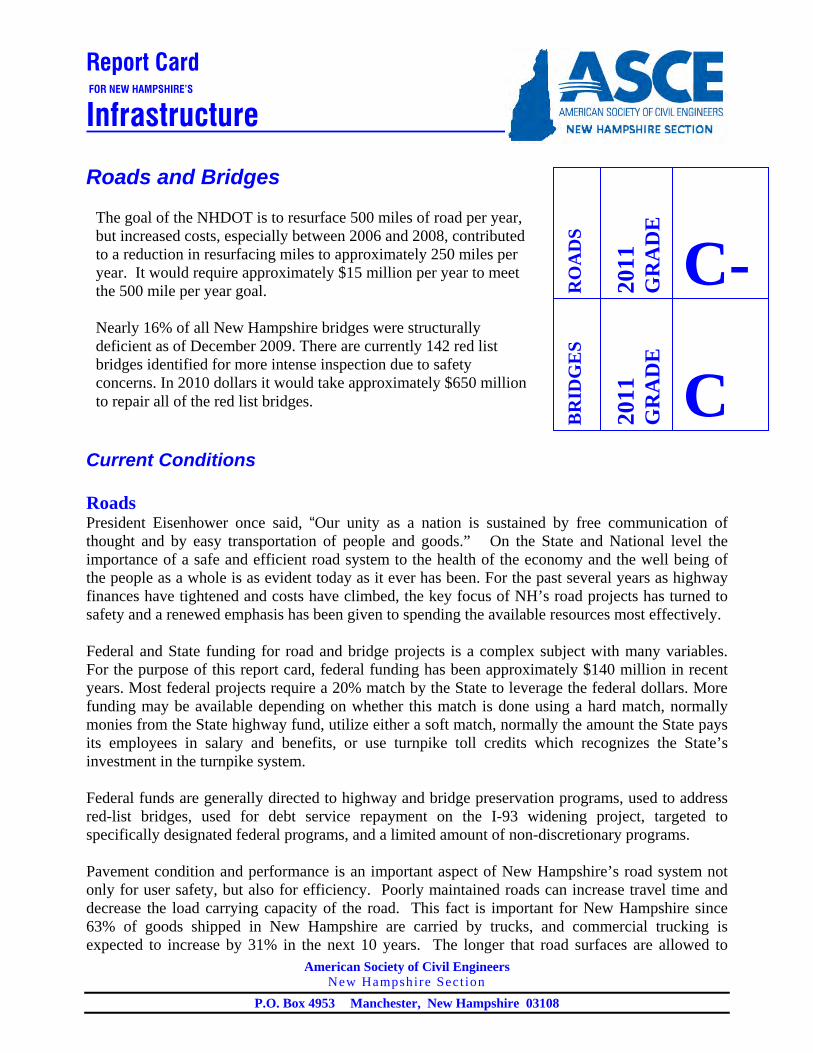
C-The goal of the NHDOT is to resurface 500 miles of road per year, but increased costs, especially between 2006 and 2008, contributed to a reduction in resurfacing miles to approximately 250 miles per year. It would require approximately $15 million per year to meet the 500 mile per year goal. Nearly 16% of all New Hampshire bridges were structurally deficient as of December 2009. There are currently 142 red list bridges identified for more intense inspection due to safety concerns. In 2010 dollars it would take approximately $650 million to repair all of the red list bridges.
BR
IDG
ES
2011
G
RA
DE
C
ROADS AND BRIDGES – PAGE 2 of 5
Issued June 15, 2011
deteriorate, the more expensive they are to rehabilitate. The maintenance needs for New Hampshire’s road surfaces are monitored by the NHDOT’s Pavement Management System (PMS). In 2008, out of 4,559 total miles of State-maintained Highways, 1,532 miles or 33% required major work, 1,902 miles or 41% required minor work and the remainder required no work or were unrated. The goal of the NHDOT is to resurface 500 miles of road per year, but increased costs, especially between 2006 and 2008, contributed to a reduction in resurfacing miles to approximately 250 miles per year. In 2009, the American Recovery and Reinvestment Act (ARRA) program funds allowed a one-time increase in resurfacing mileage from 250 to 750 miles. Also in reaction to the price increases that were seen in 2006 and 2008, the State Legislature has increased the Betterment Program funding and raised the budget for resurfacing from $12 million per year to $18million per year which includes $1 million per year for each of the six maintenance districts for much needed resurfacing of secondary roads. The consistent maintenance of New Hampshire’s road surfaces is the key to maintaining a cost effective pavement surface program, and this usually means resurfacing frequently used roads at least every 8 to 10 years. New technologies such as thicker overlays, paving fabrics and reinforcements, micro-surfacing treatments, and chip seals are currently being investigated and incorporated into the program. The NHDOT has also implemented crack sealing as part of the resurfacing program, and studies show that crack sealing can extend the surface life of pavement by 2 years. Mobility and Congestion is another important factor to consider when examining the performance of a road system. Over the past five years New Hampshire’s roads have seen an average increase in traffic of about 1.5% per year. The State measures congestion based on recorded traffic volumes and the capacity of the given roadway. The capacity of a road is dependent upon factors such as alignment, lane and shoulder width, access points, and others. In 2008 of the 4,559 miles of state highways 305 miles or 6% were considered heavily congested, 1,235 miles or 27% were moderately congested, 1,189 miles or 26% were not congested and 1,830 miles or 40% were not rated. Several major highway projects are underway that will help alleviate traffic congestion, including the Salem-Manchester I-93 widening, the Rochester and Newington-Dover Spaulding Turnpike Improvements, and the Conway Bypass, but all rely at least partially on federal funds to ensure their completion. Also the implementation of “EZ Pass Only” lanes on the State turnpikes and the new open road tolling system on I-95 in Hampton have significantly reduced traffic backups at toll facilities. The new open road toll has eliminated all traffic congestion at the Hampton Toll Booth since its opening in May 2010, and studies are underway to implement open road tolling in Hooksett and Bedford. Also the NHDOT is leading an effort in New England to incorporate Intelligent Transportation System (ITS) technologies into the highway system to enable quick traffic and weather updates to motorists. Current projects are underway that will use ITS devices to provide real time information to motorists along I-95 and I-93. SAFETEA-LU and the federally established Highway Safety Improvement Program (HSIP) have funded the State with $5.5 million per year in efforts to apply the latest safety technology and research to the State’s roads and implement modest but effective safety improvements. The HSIP has also helped provide special funding for the High Risk Rural Road Program (HRRRP) that identifies the two communities in each planning region that report the highest crash rates and implements comprehensive signing upgrades. In 2009, three of the communities highlighted by the HRRRP were the focus of road project planning and the planning committee intends to add 10 more in the next two years. Over the past three years, 21 HSIP projects were advertised by the State including such projects as intersection improvements, shoulder and centerline rumble strips, median barriers, and other highway safety improvements. The State also increased the number of sobriety
ROADS AND BRIDGES – PAGE 3 of 5
Issued June 15, 2011
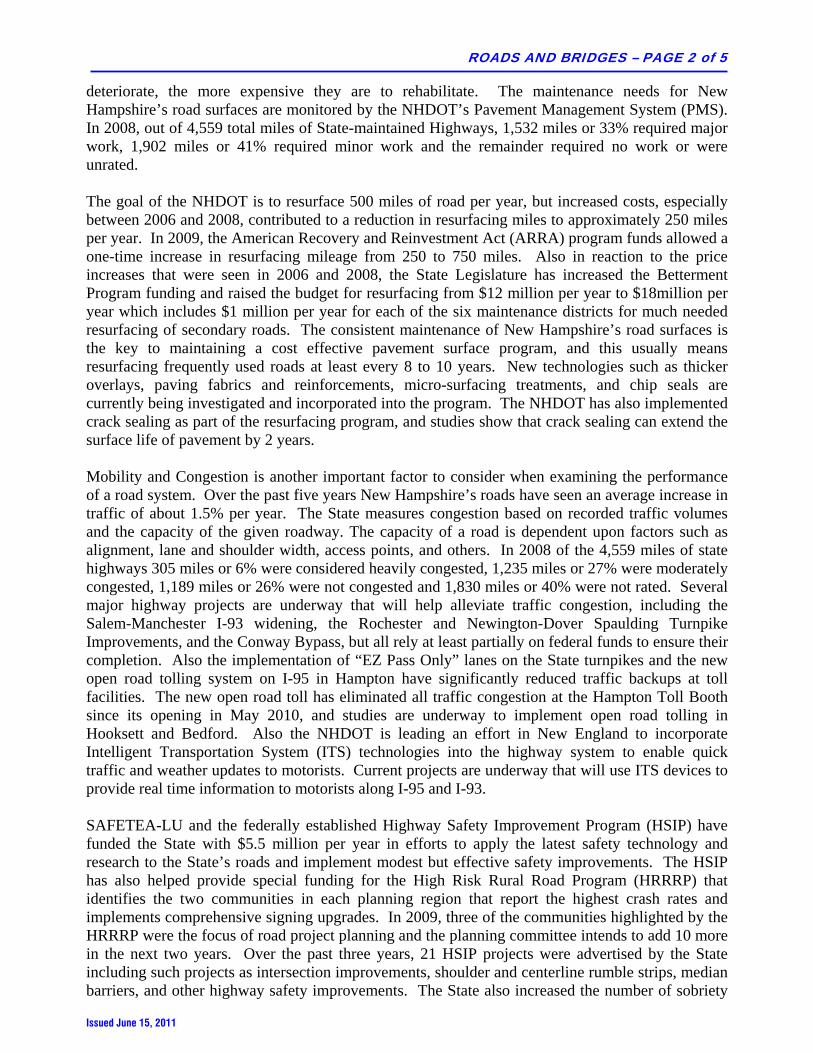
checkpoints and improved crash data in order to pinpoint areas of the State that require greater attention to safety. As a result of safety efforts, New Hampshire’s roads have seen a decrease from 166 fatalities in 2005 to 109 in 2009 despite an ever-increasing number of travelers every year. In 2010, the Strategic Highway Safety Plan (SHSP) Committee has reestablished a goal to continue these efforts to reduce serious motorist injuries and fatalities in New Hampshire by 50% in 20 years. Bridges Bridges provide the vital connections that link our highway system, and yet statistically New Hampshire’s bridge conditions are among the worst in the country. Nearly 16% of all New Hampshire bridges were structurally deficient as of December 2009. The number of bridges in New Hampshire has grown from 3,734 to 3,795 statewide since the 2006 State Infrastructure Report Card. The bridges in the State include 2,129 State bridges and 1,666 municipal bridges. Each new bridge is built to a design service life of 75 years due to new and better technology and design standards. Advancements in the strength of bridge building materials, namely steel and concrete, have also played a large role in the building of stronger and more durable bridges. All State and municipal bridges in New Hampshire are inspected at least bi-annually, with more frequent inspections given to those bridges determined to be deficient. Inspections designate the condition of bridges as acceptable, structurally deficient, functionally obsolete, or Red List. The following table denotes the conditions of New Hampshire’s State and municipal bridges as of April 2010.
Bridge Condition State Bridges Non State Bridges
Totals
Red List (Non-Historic) 130 340 470 Red List (Historic) 12 26 38 Structurally Deficient and/or Functionally Obsolete (non-Red List)
215
219
434
Good Condition 1,772 1,081 2,853 Totals 2,129 1,666 3,795
Red List Bridges require more frequent inspections due to structural deficiencies or functional obsolescence. Over the past 15 years the State has been successful in eliminating bridges from the Red List, but the rate at which State Red List bridges are reduced is countered by the rate at which bridges are added to the Red List. During that same time period of 15 years, approximately 18 state bridges were removed annually from the Red List due to rehabilitation efforts while approximately 16 bridges were added each year to the Red List. Recently, the average length of time that a bridge typically remains on the Red List has increased to eight years where previously the average time was about five years. On the other hand, efforts to rehabilitate and remove municipal bridges from the Red List have yielded better overall results. Over the past 15 years the average number of municipal bridges removed from the Red List per year has been about 26, whereas approximately 17 have been added each year. Currently New Hampshire has committed to replace or rehabilitate approximately 64 of the 142 State Red List bridges over the next ten years, along with an additional 17 Priority Bridges for a total of 81. The State also plans to address 33 Red List bridges through maintenance efforts in their on-going plan. The State-Aid Bridge program, which provides $6.8M per year with a 20% municipal match, will also be in place through 2018 in order to continue the rehabilitation efforts of
ROADS AND BRIDGES – PAGE 4 of 5
Issued June 15, 2011
New Hampshire’s deficient municipal bridges. In October 2010 the Memorial Bridge which links Kittery, Maine and Portsmouth via US Route 1 was the recipient of the sixth largest federal TIGER II grant of $20 Million to replace the iconic lift bridge. The Memorial Bridge is at the end of its service life and currently merits a federal sufficiency rating of 6 out of 100. Because of the bridge’s condition, a three-ton weight limit has been imposed, excluding all truck traffic. The Memorial Bridge project was chosen as one of only 33 successful applicants from nearly 1,000 applications for the new TIGER II grant funding. Projects such as this, and the continuing efforts to replace and rehabilitate Red List bridges every year, demonstrates New Hampshire’s commitment to ensuring that the bridge and highway system of the State will safely and effectively serve the needs of travelers now and into the future.
Investment Needs While New Hampshire has seen considerable improvement to the State’s Road and Bridge system since the last Report Card, it is clear that significant funding commitments are needed for New Hampshire to sustain an sufficient surface infrastructure system. As SAFETEA-LU reached its expiration date on September 30, 2009, it is evident that federal funding support will once again be at the forefront of New Hampshire’s needs to advance the highway and bridge system to the condition that it envisions for the future. In the latest update of the State Ten Year Plan, $800 million worth of needed repairs were identified, but only $45 million of new projects were added to the plan. Twenty-three major congestion relief projects ($5M and over) that are currently under development will not be able to reach completion before 2020 without significant federal and state funding; this includes the completion of I-93 improvements currently underway as well as other I-93 improvement needs that have not yet begun. In the next two years NHDOT will face a shortfall of Transportation funding of $119M if the funding is not sustained and will result in serious operation and maintenance cutbacks. Also, if action is not taken to increase sustainable revenue sources it is estimated that the state will see a $1.2 Billion deficit in the Highway Fund. The main sources of State funding are the gas tax and vehicle registration fees. Toll revenues provide funding to the Turnpike system, but these revenues must also be used to pay off debt service on bonds, which limits the use of those funds for transportation projects. New Hampshire’s gas tax has remained at $0.18 per gallon since 1991 while overall gas prices have skyrocketed. Since gas taxes are levied based upon gallons of fuel purchased, high gas prices do not increase revenue to the highway fund. In 2010 the tax represents approximately 5% of the price of gas, which is by far the lowest rate in the Northeast and one of the lowest in the country. A low gas tax rate coupled with increasing fuel efficiency has taken a toll on the revenues that the State receives from gas purchases. New Hampshire needs to raise the gas tax to reflect a reasonable percentage of the price per gallon paid, and also look into an alternative “mileage tax” that would, through the use of wireless gas pump computers and GPS technology, replace the gas tax by taxing commuters at the pumps based on the miles of New Hampshire roads traveled rather than the gallons of gas purchased. Aside from the gas tax, vehicle registration fees were temporarily raised in 2009 with the surcharge targeted to funding the Betterment program; however, the surcharge will expire in June 2011 and account for a $40 million annual reduction in revenue if legislation is not passed to extend it. Federal funding provides 22% of revenues used annually by the NHDOT to pay for highway and bridge construction, repairs, and maintenance. ARRA funds have helped to pay for a number of
ROADS AND BRIDGES – PAGE 5 of 5
Issued June 15, 2011
road resurfacing and highway construction projects in the short term by providing approximately $129M in stimulus funding for highway and bridge improvements, but without a sustained commitment of federal funds, as was the goal of SAFETEA-LU, New Hampshire will quickly see the State’s surface transportation system fall behind the goals set out in the Ten Year Plan.
Recommendations Supported by ASCE
• Increase the Gas Tax to levels that reflect a more appropriate percentage of the price per gallon.
• Keep the vehicle registration fee surcharge intact. • Investigate road tolls on the new Manchester Airport Access Road. • Pass a comprehensive, multi-year reauthorization of SAFETEA-LU with appropriate
funding levels. • Incorporation of “open-road tolling” at the Hooksett and Bedford toll plazas. • Seek increased funding for pavement resurfacing as was provided by ARRA. • Increase Federal and State funding for the completion of important ongoing and planned
congestion relief projects. • Study alternative methods of mileage based taxation that assesses tax according to the
vehicle’s use of the highway system. • Encourage the use of the Design-Build project delivery method on highway and bridge
projects. • Ensure that highway funding and revenues are used for highway and bridge projects and not
diverted into programs that don’t relate to the highway infrastructure. • Encourage municipalities to establish capital reserve funds to help pay for State cost sharing
on municipal road and bridge projects.
Sources
• Transportation, Department Of. Highway Fund Information Pertinent to Commission’s Final Report. Tech. Print
• Transportation Department Of. Ten Year Transportation Improvement Plan, 2011 – 2020. Rep. Print. • TRIP, of Washington DC. Moving New Hampshire Forward: The Condition and Funding of New
Hampshire’s Roads, Bridges, & Transit Systems. June, 2010, www.tripnet.org • A Safer Road To Tomorrow. Use Caution: Rough Roads Ahead For New Hampshire, May, 2008
www.Saferoadsnh.com • A Safer Road To Tomorrow. Transportation: Funding New Hampshire’s Needs. www.saferoadsnh.com • Discussions with NHDOT Personnel, February, 2011
Report Card
FOR NEW HAMPSHIRE’S
Infrastructure
American Society of Civil Engineers New Hampshire Sect ion
P.O. Box 4953 Manchester, New Hampshire 03108
DAMS
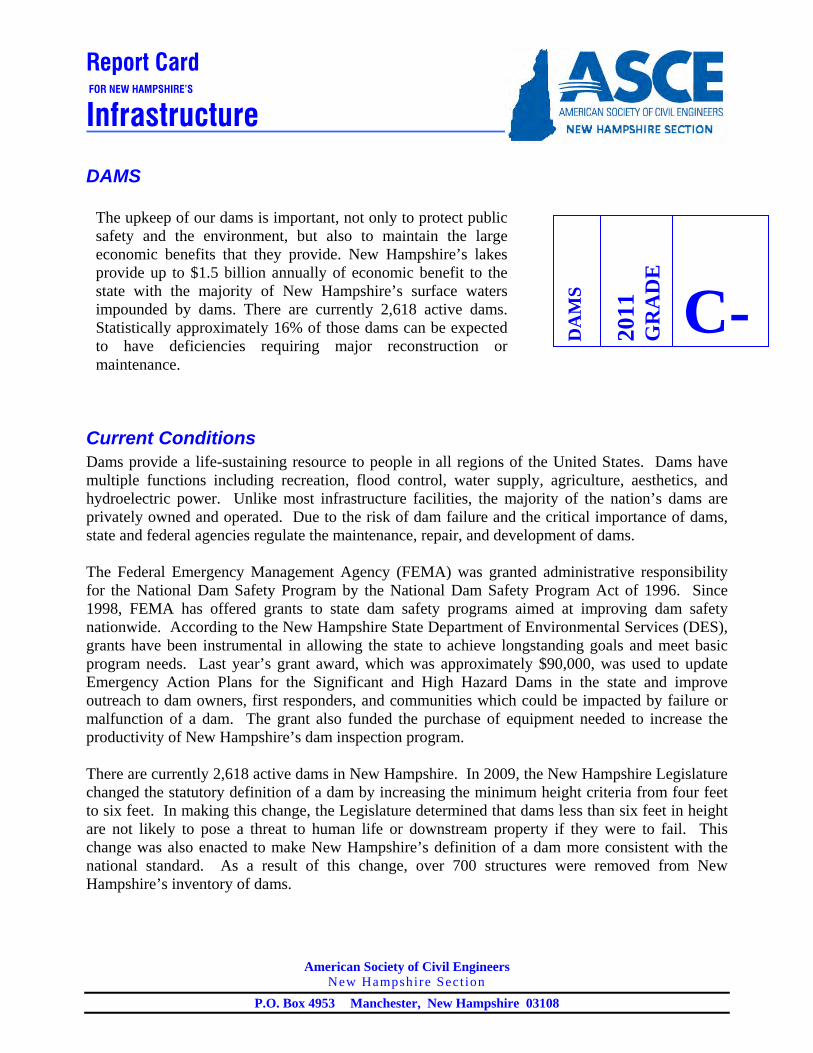
Current Conditions Dams provide a life-sustaining resource to people in all regions of the United States. Dams have multiple functions including recreation, flood control, water supply, agriculture, aesthetics, and hydroelectric power. Unlike most infrastructure facilities, the majority of the nation’s dams are privately owned and operated. Due to the risk of dam failure and the critical importance of dams, state and federal agencies regulate the maintenance, repair, and development of dams. The Federal Emergency Management Agency (FEMA) was granted administrative responsibility for the National Dam Safety Program by the National Dam Safety Program Act of 1996. Since 1998, FEMA has offered grants to state dam safety programs aimed at improving dam safety nationwide. According to the New Hampshire State Department of Environmental Services (DES), grants have been instrumental in allowing the state to achieve longstanding goals and meet basic program needs. Last year’s grant award, which was approximately $90,000, was used to update Emergency Action Plans for the Significant and High Hazard Dams in the state and improve outreach to dam owners, first responders, and communities which could be impacted by failure or malfunction of a dam. The grant also funded the purchase of equipment needed to increase the productivity of New Hampshire’s dam inspection program. There are currently 2,618 active dams in New Hampshire. In 2009, the New Hampshire Legislature changed the statutory definition of a dam by increasing the minimum height criteria from four feet to six feet. In making this change, the Legislature determined that dams less than six feet in height are not likely to pose a threat to human life or downstream property if they were to fail. This change was also enacted to make New Hampshire’s definition of a dam more consistent with the national standard. As a result of this change, over 700 structures were removed from New Hampshire’s inventory of dams.
DA
MS
2011
G
RA
DE
C-
The upkeep of our dams is important, not only to protect public safety and the environment, but also to maintain the large economic benefits that they provide. New Hampshire’s lakes provide up to $1.5 billion annually of economic benefit to the state with the majority of New Hampshire’s surface waters impounded by dams. There are currently 2,618 active dams. Statistically approximately 16% of those dams can be expected to have deficiencies requiring major reconstruction or maintenance.
DAMS – PAGE 2 of 4
Issued June 15, 2011
Of the 2,618 dams in New Hampshire, 841 of these dams are classified as hazardous dams. This classification is based solely on the extent of damage that would be imposed on developed areas downstream and within the potentially inundated area, and is not related to the condition of the dam. Of these 841 hazardous dams, 141 are classified as High Hazard Dams because their failure would inundate houses or other occupied structures downstream and likely cause loss of life. One hundred and sixty dams are classified as Significant Hazard Dams because their failure would cause major property damage downstream, and 540 are classified as Low Hazard Dams because their failure would cause minor property damage downstream, such as damage to a town or city road. The remaining 1,777 active dams are classified as Non-Hazardous Dams. Under State law, all Significant and High Hazard Dams in New Hampshire are required to have an Emergency Action Plan, which identifies the areas downstream that would be inundated if the dam were to fail, and consists of a notification plan and a response plan. Emergency Action Plans are in place for nearly all of the 301 Significant and High Hazard Dams in the State. The only exceptions are dams that have recently been reclassified due to new development downstream, and the Plans for these dams are currently being prepared. Based on an examination of the inundation maps included in these plans, DES has determined that there are more than 26,000 homes, 560 state road crossings and more than 2,500 town road crossings that would be destroyed or damaged if these hazardous dams were to fail.
Even the loss of any of the Low Hazard Dams, which do not have significant property at risk downstream, could cause significant economic losses due to the loss of recreational opportunities and the devaluation of waterfront property associated with the dam. According to the New Hampshire Lake Association’s Report on the Economic Value of New Hampshire’s Surface Waters, New Hampshire’s lakes provide up to $1.5 billion annually of economic benefit to the state, and waterfront property owners pay nearly a quarter billion dollars annually in property taxes. Since the majority of New Hampshire’s surface waters are impounded by dams, the upkeep of these dams is important, not only to protect public safety and the environment, but also to maintain the large economic benefits that they provide. Governmental Organizations or utilities own about one-quarter of the dams in the State. Utilities own 11, various municipalities own 355, the federal government owns 34, and the State of New Hampshire, through its various state agencies, owns 274. However, the majority of the dams are owned by private organizations or individuals. Operation, maintenance, and rehabilitation of dams can range in cost from the low thousands to millions of dollars, and owners are responsible for these expenses. Many owners, especially the private dam owners who do not have a source of revenue associated with their dams, cannot afford these costs. There are currently no state-sponsored programs to provide dam owners with financial assistance, so the work is funded partially through dam registration and permitting fees and partially through the State’s general fund. DES’s inspection schedule requires that DES inspect 329 dams per year. If deficiencies are found during the inspection, DES sends a Letter of Deficiency (LOD) to the dam owner identifying the deficiencies and specifying the work that must be done to correct the deficiencies and the schedule for completing the corrective measures. The deficiencies are typically related to overdue maintenance and upkeep issues rather than imminent threats to downstream lives or property. In those cases where the deficiencies do pose an imminent threat, DES orders that the impoundments be drained. Between January 1, 2008 and December 31, 2010, DES issued 298 LODs. The breakdown, by calendar year and hazard classification, is presented below.

DAMS – PAGE 3 of 4
Issued June 15, 2011
LODs by Hazard Classification Calendar Year Low Significant High Total 2008 15 10 27 52 2009 62 22 44 128 2010 55 31 32 118
DES has approved between 17 and 23 new/reconstruction/existing applications per year for each of the years of 2008 through 2010, primarily for the reconstruction of existing dams to correct identified deficiencies. In addition to its responsibility for regulating the safety of the 2,618 dams in the State, the DES Dam Bureau is responsible for performing all the repairs and reconstruction required on all the 274 state-owned dams, with design engineering, permitting, and construction oversight conducted by staff engineers. In addition, DES dam operators perform daily operations and maintenance on the 113 dams owned by DES, as well as the 105 dams owned by the New Hampshire Fish and Game Department. With an average expected design life of 50 years, DES must perform five to six major reconstruction projects per year to keep up with the work required on the inventory of 274 state-owned dams.
Investment Needs State-Owned Dams Currently, 43 of the 274 state-owned dams (approximately 16%) have been identified as having deficiencies that require major reconstruction or repair. The total cost of these repairs, using state forces for the design and reconstruction, is estimated to be approximately $15 million. The cost for the operation, maintenance, repair, and reconstruction of state-owned dams is funded from the State Dam Maintenance Fund established under RSA 482:55. The source of revenue for the fund is from rent payments that DES receives from leasing eleven of its dams to private hydropower developers. Beginning in 2002, PSNH initiated actions to renegotiate their above-market power purchase agreements with DES pursuant to RSA 374-F. This is the Electric Utility Restructuring legislation that directs utilities to take all reasonable measures to mitigate stranded costs, including the renegotiation of power purchase contracts. As part of that initiative, PSNH bought-out or bought-down the above-market power purchase agreements of seven of the lessees of the state-owned dams, resulting in a significant loss of revenue from these leases. In addition, in 2003 the lease for the state-owned Pontook Dam was acquired by the Brascan Corporation, which sells the power it generates at the facility to its energy marketing subsidiary at generally below-market rates. The combination of these events resulted in a 50% to 70% drop in revenue to the State Dam Maintenance Fund.
In the eight years since revenues to the State Dam Maintenance Fund were reduced, the fund has been operating at a deficit of several hundred thousand dollars per year. In Fiscal Years 2005 and 2007, the legislature provided Capital Appropriations to fund major reconstruction projects at state-owned dams. However, despite several legislative attempts, no alternative funding source has been identified to fund the operation, maintenance, and repairs of state-owned dams. At the end of the current fiscal year, reserve funds will be exhausted, requiring that an additional revenue source be identified to fund the obligations of the fund. These obligations include paying for the operation, maintenance, repair and reconstruction of the 274 state-owned dams, as well as the repayment of the bonds issued to establish the fund.
DAMS – PAGE 4 of 4
Issued June 15, 2011
Municipally-Owned Dams There are a total of 355 municipally-owned dams in New Hampshire. Assuming that this inventory is in similar condition to the inventory of state-owned dams, then approximately 16% or approximately 57 dams could be expected to be in need of significant reconstruction or repair. Assuming a per project cost estimate of $500,000 per project, the total estimate if the investment needs for municipally-owned dams is $28.5 million. Privately-Owned Dams There are a total of 1,964 privately-owned dams in New Hampshire. Assuming that this inventory is in similar condition to the inventory of state-owned dams, then approximately 16% or approximately 314 dams could be expected to be in need of significant reconstruction or repair. Assuming a per project cost estimate of $500,000 per project, the total estimate if the investment needs for privately-owned dams is $157 million.
Recommendations Supported by ASCE Because the State of New Hampshire owns less than 10% of the entire dam inventory, only limited resources are available for meeting the capital needs of municipal and privately-owned dams. Private and municipal dam owners may have difficulty completing the capital repairs and improvements required by the state. ASCE supports the following specific recommendations:
• Enhance the inspection system to include numerical data that relates to the functionality and risk of dam failure.
• Increase staff and budget levels to accommodate current inspection needs and the projected growth.
• Develop a long-range capital program that addresses the need to repair, reconstruct, upgrade, and operate the aging population of state-owned dams.
• Investigate, appropriate funding, and implement the use of revolving loan funds and grants to better service the capital improvement needs of the growing population of deficient privately and municipally owned dams.
Sources • "Dam Safety A National Concern". Association of State Dam Safety Officials. • New Hampshire State Department of Environmental Services. • Association of State Dam Safety Officials Database.
Report Card
FOR NEW HAMPSHIRE’S
Infrastructure
American Society of Civil Engineers New Hampshire Sect ion
P.O. Box 4953 Manchester, New Hampshire 03108
DRINKING WATER
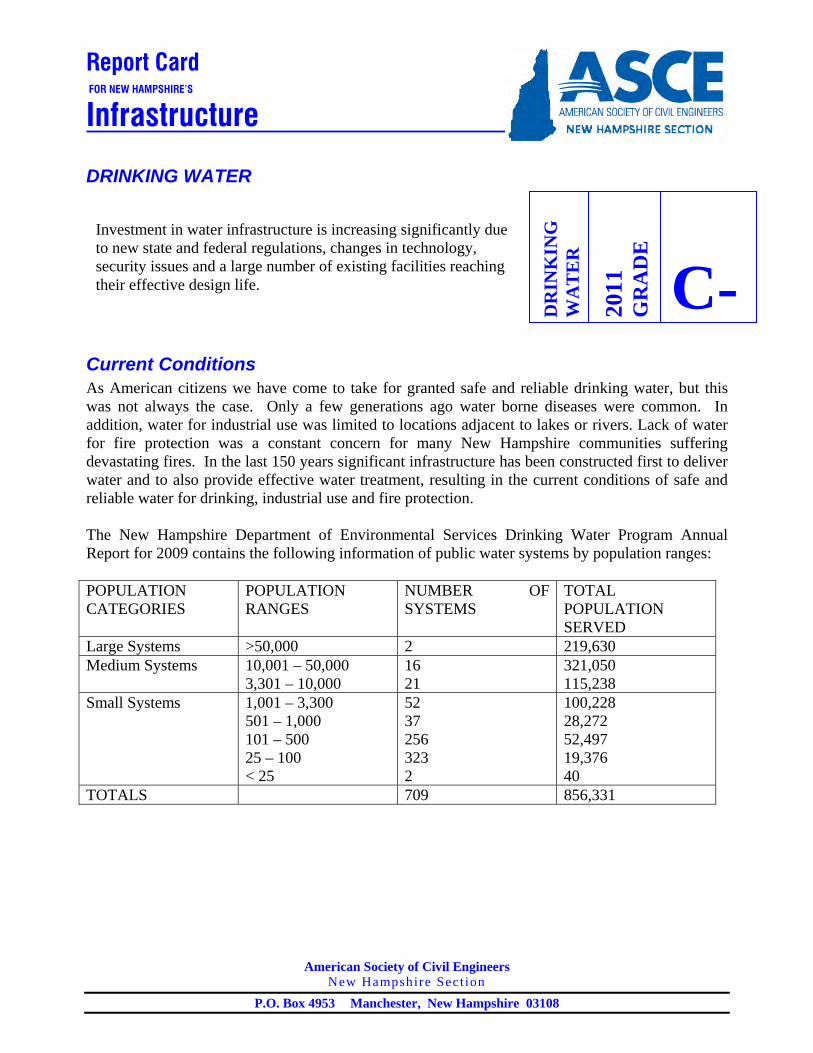
Current Conditions As American citizens we have come to take for granted safe and reliable drinking water, but this was not always the case. Only a few generations ago water borne diseases were common. In addition, water for industrial use was limited to locations adjacent to lakes or rivers. Lack of water for fire protection was a constant concern for many New Hampshire communities suffering devastating fires. In the last 150 years significant infrastructure has been constructed first to deliver water and to also provide effective water treatment, resulting in the current conditions of safe and reliable water for drinking, industrial use and fire protection. The New Hampshire Department of Environmental Services Drinking Water Program Annual Report for 2009 contains the following information of public water systems by population ranges: POPULATION CATEGORIES
POPULATION RANGES
NUMBER OF SYSTEMS
TOTAL POPULATION SERVED
Large Systems >50,000 2 219,630 Medium Systems
10,001 – 50,000 3,301 – 10,000
16 21
321,050 115,238
Small Systems 1,001 – 3,300 501 – 1,000 101 – 500 25 – 100 < 25
52 37 256 323 2
100,228 28,272 52,497 19,376 40
TOTALS 709 856,331
DR
INK
ING
W
AT
ER
2011
G
RA
DE
C-Investment in water infrastructure is increasing significantly due to new state and federal regulations, changes in technology, security issues and a large number of existing facilities reaching their effective design life.
DRINKING WATER– PAGE 2 of 3
Issued June 15, 2011
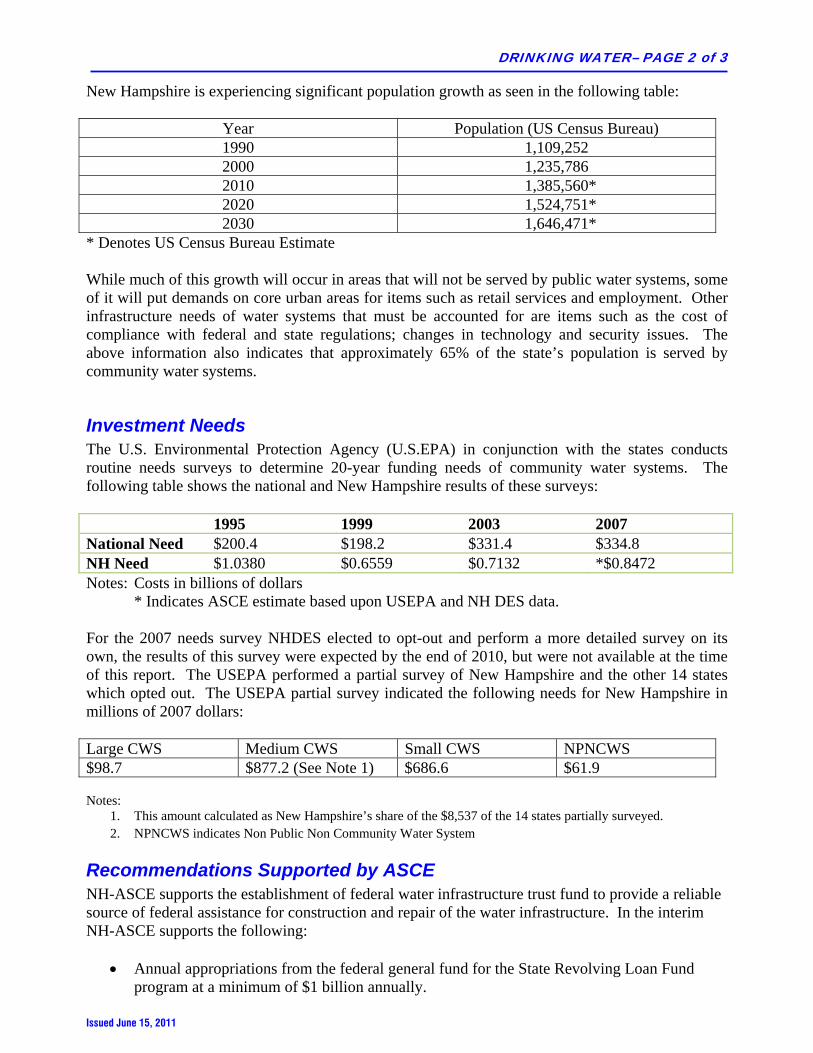
New Hampshire is experiencing significant population growth as seen in the following table:
Year Population (US Census Bureau) 1990 1,109,252 2000 1,235,786 2010 1,385,560* 2020 1,524,751* 2030 1,646,471*
* Denotes US Census Bureau Estimate While much of this growth will occur in areas that will not be served by public water systems, some of it will put demands on core urban areas for items such as retail services and employment. Other infrastructure needs of water systems that must be accounted for are items such as the cost of compliance with federal and state regulations; changes in technology and security issues. The above information also indicates that approximately 65% of the state’s population is served by community water systems.
Investment Needs The U.S. Environmental Protection Agency (U.S.EPA) in conjunction with the states conducts routine needs surveys to determine 20-year funding needs of community water systems. The following table shows the national and New Hampshire results of these surveys: YEAR 1995 1999 2003 2007 National Need $200.4 $198.2 $331.4 $334.8 NH Need $1.0380 $0.6559 $0.7132 *$0.8472 Notes: Costs in billions of dollars * Indicates ASCE estimate based upon USEPA and NH DES data. For the 2007 needs survey NHDES elected to opt-out and perform a more detailed survey on its own, the results of this survey were expected by the end of 2010, but were not available at the time of this report. The USEPA performed a partial survey of New Hampshire and the other 14 states which opted out. The USEPA partial survey indicated the following needs for New Hampshire in millions of 2007 dollars: Large CWS Medium CWS Small CWS NPNCWS $98.7 $877.2 (See Note 1) $686.6 $61.9 Notes:
1. This amount calculated as New Hampshire’s share of the $8,537 of the 14 states partially surveyed. 2. NPNCWS indicates Non Public Non Community Water System
Recommendations Supported by ASCE NH-ASCE supports the establishment of federal water infrastructure trust fund to provide a reliable source of federal assistance for construction and repair of the water infrastructure. In the interim NH-ASCE supports the following:
• Annual appropriations from the federal general fund for the State Revolving Loan Fund program at a minimum of $1 billion annually.

DRINKING WATER– PAGE 3 of 3
Issued June 15, 2011
• Establishing a federal capital budget to create a mechanism to help reduce the constant conflict between short-term and long-term needs. The current federal budget process does not differentiate between expenditures for current consumption and long-term investments. A capital budget system would help increase public awareness of the problems and needs facing this country’s physical infrastructure, and would help Congress focus on programs devoted to long-term growth and productivity.
• Funding research in improved water reuse and purification technology to reduce capital. Operations and maintenance costs for producing safe drinking water.
Sources • U.S. EPA Drinking Water Infrastructure Needs Survey and Assessment, Third Report to
Congress, June 2005. • NH DES, Drinking Water Program Annual Report for 2009 • Drinking Water Needs Survey and Assessment, Fourth Report to Congress, 2007

Report Card
FOR NEW HAMPSHIRE’S
Infrastructure
American Society of Civil Engineers New Hampshire Sect ion
P.O. Box 4953 Manchester, New Hampshire 03108
ENERGY GENERATION AND TRANSMISSION
Current Conditions Unlike most infrastructure facilities, energy generation and transmission is a regional infrastructure. Various geographic areas throughout North America are grouped into networks managed by Independent System Operators (ISO). The ISO’s are responsible for the efficient generation and distribution of all available resources. New Hampshire is a member of the New England network, known as ISO-NE. The energy generation and transmission facilities in New Hampshire include a wide variety of power producing facilities and over 20,000 miles of utility lines.
There are two key components to the production of electricity: energy capacity, and energy generation. The capacity of a facility indicates the potential generating capability while the actual power produced by that facility is the generation. There are over 20 generating plants utilizing many different energy sources including nuclear, coal, hydroelectric, wind, and natural gas. Also important for NH is the summer peak capacity. A summary of New Hampshire’s power supply system is described in the following table.
Energy Generation for New Hampshire 2008 Summer Capacity 2008 Total Capacity
Primary Energy Source
Megawatts (MW)
% of Total Capacity
Megawatts (Thousand MWH)
% of Total Capacity
Nuclear 1245 29.8% 9350 40.9% Coal 528 12.6% 3451 15.1% Natural Gas 1205 28.9% 7073 30.9% Hydroelectric 500 12.0% 1633 7.1% Other Renewables 193 4.6% 1175 5.1% Other 0 0.0% 58 0.3% Petroleum* 503 12.0% 136 0.6% Total 4174 100% 22877 100%
* This category was split into petroleum and dual fired in the 2006 report card.
EN
ER
GY
2011
G
RA
DE
B-
All indications are that the energy generation for New Hampshire, as part of ISO-NE, will be adequate to supply the projected demands through at least 2014. One area of concern is with the state’s reliance on a single energy source; Seabrook Station Nuclear Power Plant. This plant accounts for 30% of the generating capacity of the state but has produced over 40% of the total generated energy.

ENERGY – PAGE 2 of 3
Issued June 15, 2011
The energy generation capacity in New Hampshire is quite diversified. The current capacity is approximately 20% above the peak demand of 25,100 MW. A new wind farm has been added since the 2006 report card and several wind farm and non-renewable projects in the state are in the early development stages. The need for “green credits” by large energy producers could spur development of alternative energy sources. The Northeast Power Coordinating Council (NPCC) projects a peak summer load of 30,730 MW in the summer of 2014 for the ISO-NE area. With an estimated generating capacity of 32,600 MW in 2014, the region appears to have an adequate supply of electricity to meet future demands. The North American Electrical Reliability Council (NERC) requires a 15% reserve between need and capacity. This reserve is projected to be met for the New England region, assuming that nothing changes to the permitting status of two nuclear power plants that will need to be relicensed in the next two years. The growth of renewable wind resources provide capacity increases, but provide a lower degree of reliability. Current projections assume that no facilities will be retired in the near future. This is good news for NH since the retirement of resources within the ISO-NE network could potentially result in thermal, voltage performance, and stability concerns without capacity improvements within the region. The transmission of energy is an integral part of the energy providing process since efforts to generate energy can easily go to waste if the energy is lost during transmission. A modern, reliable grid network is vital to support the nation’s economy and sustain the common necessities of everyday life. Moving forward into the future we continue to become more accustomed to technology and electronics being the cornerstone of life at home, business, and leisure. At no time in recent history has this been more evident than in August of 2003, when a failed grid caused a massive blackout affecting the Midwest and Northeast United States and adjacent portions of Canada. A series of power plants and transmission lines went offline because of instability in the transmission system in three states. The blackout affected as many as 50 million customers in the United States and Canada. Vital services such as air and ground transportation systems, drinking water systems and sewage processing plants stopped operating, manufacturing was disrupted, and some emergency communications systems stopped functioning. The lost productivity and revenue have been estimated in the billions of dollars. It is important that the proper steps are taken to provide an energy grid that will ensure that a blackout of this magnitude will never happen in NH and the surrounding region.
Investment Needs All indications are that the energy generation for New Hampshire, as part of ISO-NE, will be adequate to supply the projected demands through at least 2014. However, it is also important that the existing system receive regular inspection, maintenance, and upgrades in order to extend the life of the existing facilities. One area of concern is the state’s reliance on a single energy source; Seabrook Station Nuclear Power Plant. This plant accounts for 30% of the generating capacity of the state but has produced over 40% of the total generated energy. Since the 2006 Report Card, there has been significant progress at increasing the number of natural gas plants which has resulted in a 25% reduction in nuclear power generation. Diversification of the state’s energy supply will help to ensure a balanced energy future. Frequently in the headlines is the Northern Pass Project which proposes construction of an energy transmission line connecting to Hydro Quebec hydroelectric power station. However, even with such initiatives, there seems to be no clear statewide policy on the development of energy transmission infrastructure for the interconnection of the ISO-NE system and future sustainable energy projects.

ENERGY – PAGE 3 of 3
Issued June 15, 2011
The NERC reports that the transmission system within ISO-NE will require $1.5 to $3.0 billion in investment over the next 10 years with an additional $1.0 to $2.0 billion of transmission investments in renewable transmission projects. Investment in the regional transmission network will help to reinforce the system and create stronger links between generation and demand centers. Continual upgrades and maintenance of the transmission lines is necessary to provide uninterrupted electrical service. Over 200 upgrades within the New England system have been identified as needed to reinforce system reliability and create stronger links between generation and demand. Future investment challenges include meeting future peak summer demands (the summer peak is growing faster than the overall system demand), meeting new environmental requirements (including air quality), greenhouse gas initiatives, industry renewable portfolio standards, diversifying the energy supply, and balancing reliability and costs.
Recommendations Supported by ASCE • Provide a clear statewide Energy policy including potential sources of energy generation,
goals for make up of the future generation sources and the transmission systems required to efficiently transfer the energy to the locations of demand.
• Provide for continued maintenance of existing facilities. • Ensure projects currently planned are constructed to provide for future demand. • Invest in the research of alternative energy sources to diversify the energy generation
sources within the State. • Encourage construction and/or retrofitting of power-generation sources to diversify the
state’s energy mix. • Preparation of contingency plans to anticipate future retirement of key energy generators
within the ISO-NE system including the Vermont Yankee and Seabrook New Hampshire nuclear plants.
Sources • Energy Information Administration, State Electricity Profiles - NH, 2008. • North American Reliability Council, 2010 Long Term Reliability Assessment, September
2010.
Report Card
FOR NEW HAMPSHIRE’S
Infrastructure
American Society of Civil Engineers New Hampshire Sect ion
P.O. Box 4953 Manchester, New Hampshire 03108
HAZARDOUS WASTE
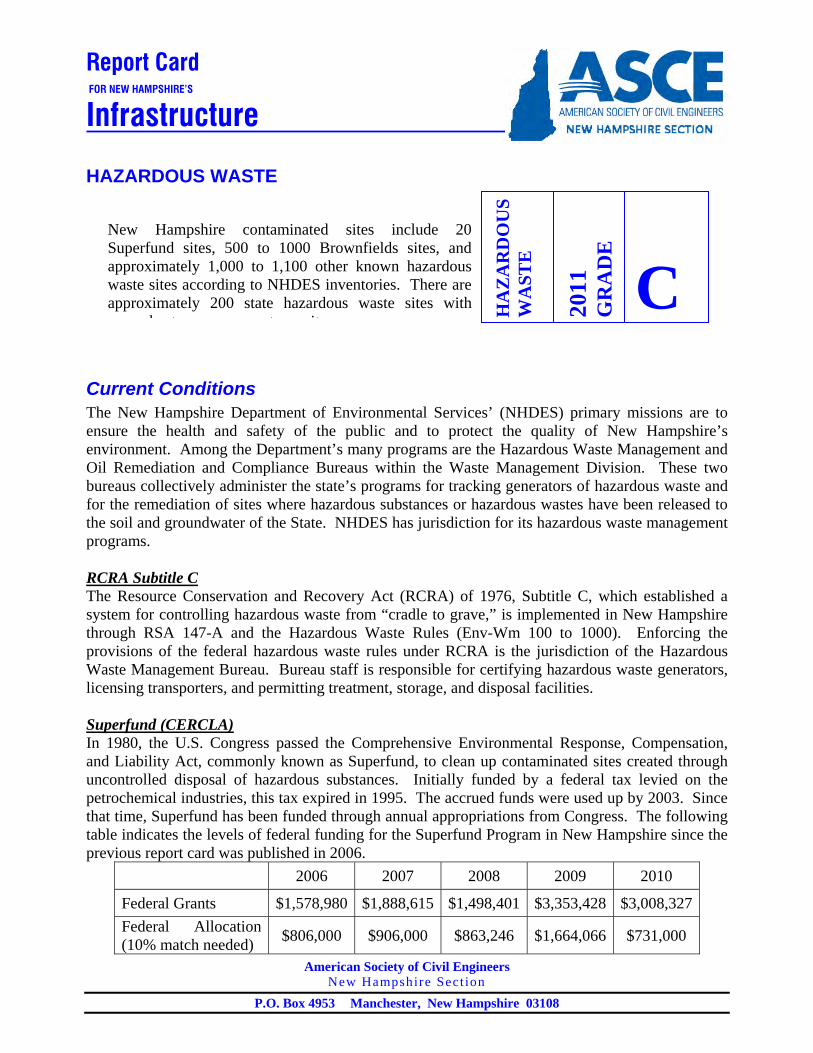
Current Conditions The New Hampshire Department of Environmental Services’ (NHDES) primary missions are to ensure the health and safety of the public and to protect the quality of New Hampshire’s environment. Among the Department’s many programs are the Hazardous Waste Management and Oil Remediation and Compliance Bureaus within the Waste Management Division. These two bureaus collectively administer the state’s programs for tracking generators of hazardous waste and for the remediation of sites where hazardous substances or hazardous wastes have been released to the soil and groundwater of the State. NHDES has jurisdiction for its hazardous waste management programs. RCRA Subtitle C The Resource Conservation and Recovery Act (RCRA) of 1976, Subtitle C, which established a system for controlling hazardous waste from “cradle to grave,” is implemented in New Hampshire through RSA 147-A and the Hazardous Waste Rules (Env-Wm 100 to 1000). Enforcing the provisions of the federal hazardous waste rules under RCRA is the jurisdiction of the Hazardous Waste Management Bureau. Bureau staff is responsible for certifying hazardous waste generators, licensing transporters, and permitting treatment, storage, and disposal facilities. Superfund (CERCLA) In 1980, the U.S. Congress passed the Comprehensive Environmental Response, Compensation, and Liability Act, commonly known as Superfund, to clean up contaminated sites created through uncontrolled disposal of hazardous substances. Initially funded by a federal tax levied on the petrochemical industries, this tax expired in 1995. The accrued funds were used up by 2003. Since that time, Superfund has been funded through annual appropriations from Congress. The following table indicates the levels of federal funding for the Superfund Program in New Hampshire since the previous report card was published in 2006.
2006 2007 2008 2009 2010
Federal Grants $1,578,980 $1,888,615 $1,498,401 $3,353,428 $3,008,327Federal Allocation (10% match needed) $806,000 $906,000 $863,246 $1,664,066 $731,000
HA
ZA
RD
OU
S W
AST
E
2011
G
RA
DE
CNew Hampshire contaminated sites include 20 Superfund sites, 500 to 1000 Brownfields sites, and approximately 1,000 to 1,100 other known hazardous waste sites according to NHDES inventories. There are approximately 200 state hazardous waste sites with
d t t it
HAZARDOUS WASTE – PAGE 2 of 4
Issued June 15, 2011
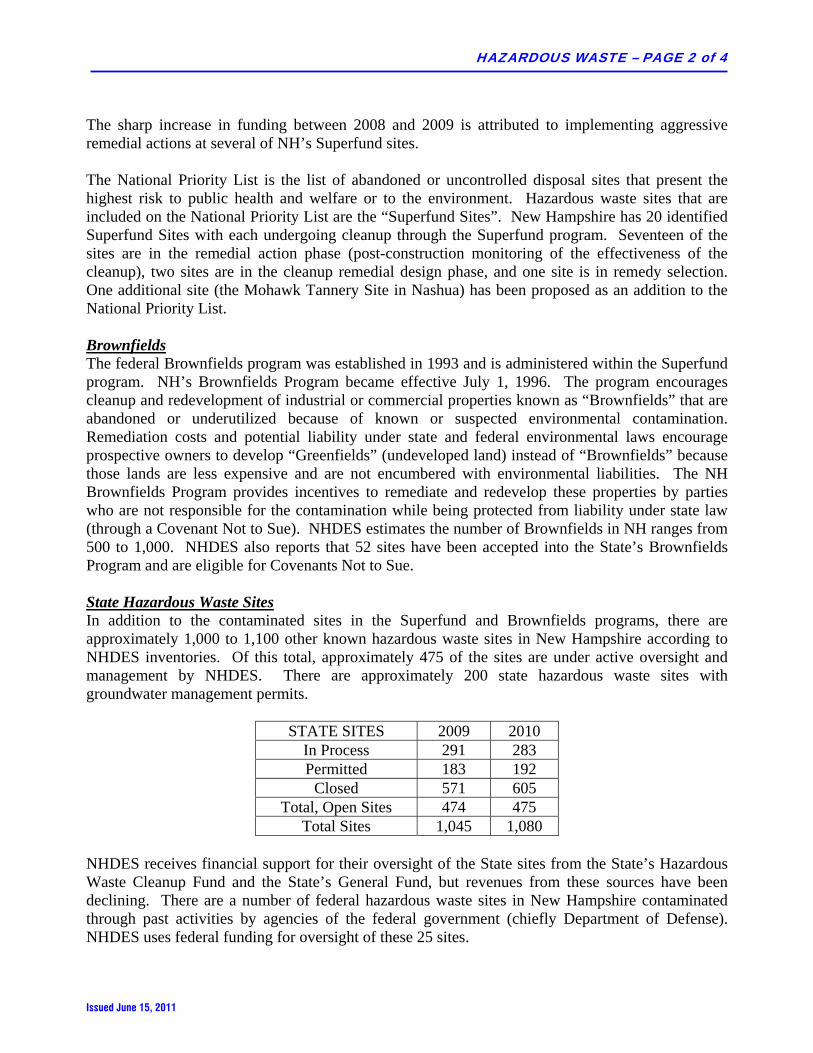
The sharp increase in funding between 2008 and 2009 is attributed to implementing aggressive remedial actions at several of NH’s Superfund sites. The National Priority List is the list of abandoned or uncontrolled disposal sites that present the highest risk to public health and welfare or to the environment. Hazardous waste sites that are included on the National Priority List are the “Superfund Sites”. New Hampshire has 20 identified Superfund Sites with each undergoing cleanup through the Superfund program. Seventeen of the sites are in the remedial action phase (post-construction monitoring of the effectiveness of the cleanup), two sites are in the cleanup remedial design phase, and one site is in remedy selection. One additional site (the Mohawk Tannery Site in Nashua) has been proposed as an addition to the National Priority List. Brownfields The federal Brownfields program was established in 1993 and is administered within the Superfund program. NH’s Brownfields Program became effective July 1, 1996. The program encourages cleanup and redevelopment of industrial or commercial properties known as “Brownfields” that are abandoned or underutilized because of known or suspected environmental contamination. Remediation costs and potential liability under state and federal environmental laws encourage prospective owners to develop “Greenfields” (undeveloped land) instead of “Brownfields” because those lands are less expensive and are not encumbered with environmental liabilities. The NH Brownfields Program provides incentives to remediate and redevelop these properties by parties who are not responsible for the contamination while being protected from liability under state law (through a Covenant Not to Sue). NHDES estimates the number of Brownfields in NH ranges from 500 to 1,000. NHDES also reports that 52 sites have been accepted into the State’s Brownfields Program and are eligible for Covenants Not to Sue. State Hazardous Waste Sites In addition to the contaminated sites in the Superfund and Brownfields programs, there are approximately 1,000 to 1,100 other known hazardous waste sites in New Hampshire according to NHDES inventories. Of this total, approximately 475 of the sites are under active oversight and management by NHDES. There are approximately 200 state hazardous waste sites with groundwater management permits.
STATE SITES 2009 2010 In Process 291 283 Permitted 183 192
Closed 571 605 Total, Open Sites 474 475
Total Sites 1,045 1,080 NHDES receives financial support for their oversight of the State sites from the State’s Hazardous Waste Cleanup Fund and the State’s General Fund, but revenues from these sources have been declining. There are a number of federal hazardous waste sites in New Hampshire contaminated through past activities by agencies of the federal government (chiefly Department of Defense). NHDES uses federal funding for oversight of these 25 sites.
HAZARDOUS WASTE – PAGE 3 of 4
Issued June 15, 2011
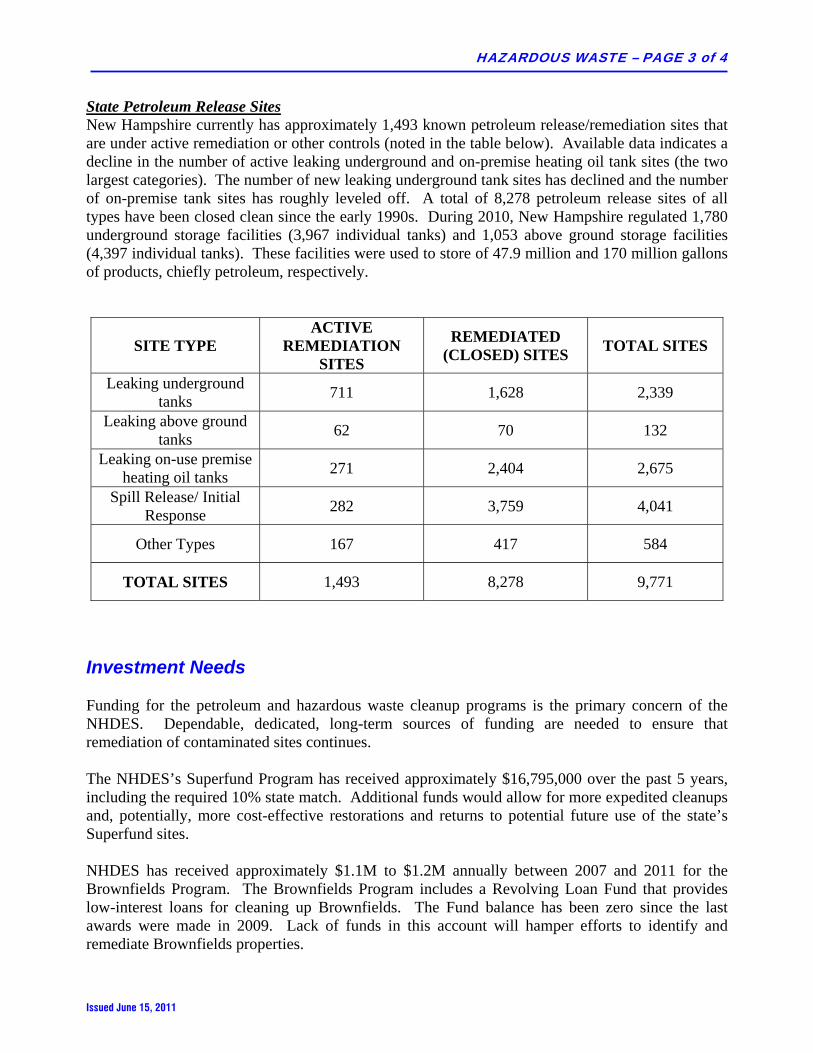
State Petroleum Release Sites New Hampshire currently has approximately 1,493 known petroleum release/remediation sites that are under active remediation or other controls (noted in the table below). Available data indicates a decline in the number of active leaking underground and on-premise heating oil tank sites (the two largest categories). The number of new leaking underground tank sites has declined and the number of on-premise tank sites has roughly leveled off. A total of 8,278 petroleum release sites of all types have been closed clean since the early 1990s. During 2010, New Hampshire regulated 1,780 underground storage facilities (3,967 individual tanks) and 1,053 above ground storage facilities (4,397 individual tanks). These facilities were used to store of 47.9 million and 170 million gallons of products, chiefly petroleum, respectively.
SITE TYPE ACTIVE
REMEDIATION SITES
REMEDIATED (CLOSED) SITES TOTAL SITES
Leaking underground tanks 711 1,628 2,339
Leaking above ground tanks 62 70 132
Leaking on-use premise heating oil tanks 271 2,404 2,675
Spill Release/ Initial Response 282 3,759 4,041
Other Types 167 417 584
TOTAL SITES 1,493 8,278 9,771
Investment Needs Funding for the petroleum and hazardous waste cleanup programs is the primary concern of the NHDES. Dependable, dedicated, long-term sources of funding are needed to ensure that remediation of contaminated sites continues. The NHDES’s Superfund Program has received approximately $16,795,000 over the past 5 years, including the required 10% state match. Additional funds would allow for more expedited cleanups and, potentially, more cost-effective restorations and returns to potential future use of the state’s Superfund sites. NHDES has received approximately $1.1M to $1.2M annually between 2007 and 2011 for the Brownfields Program. The Brownfields Program includes a Revolving Loan Fund that provides low-interest loans for cleaning up Brownfields. The Fund balance has been zero since the last awards were made in 2009. Lack of funds in this account will hamper efforts to identify and remediate Brownfields properties.
HAZARDOUS WASTE – PAGE 4 of 4
Issued June 15, 2011
In addition to the overall Brownfields program funding, NHDES has received grants of $3.3M in 2009 and $2.4M in 2010 that will be used for community-wide assessments of potential Brownfields properties and for specific, known Brownfields sites. Funding for petroleum release sites is received from the petroleum cleanup funds (petroleum products imported into New Hampshire are taxed at $0.015 per gallon to provide money for clean ups). The Oil Fund Disbursement Board administers this funding for petroleum site cleanups. Funding from the Board was $17,887,495 in 2008 and $14,638,537 in 2009. These totals were supplemented, in 2010, by $1.2 million from the federal LUST (Leaking Underground Storage Tank) Fund. State general funds are not used in this program.
Recommendations Supported by ASCE State Sites Program Recommendations
• Prevent legislative initiatives that would allow diversion of funds from New Hampshire’s Petroleum Reimbursement Funds to other State programs.
• Increase the New Hampshire petroleum import fee to raise revenue for the petroleum reimbursement funds.
Brownfields Program Recommendations
• Continue to fund federal and state programs that support remediation and redevelopment of Brownfields.
Superfund Program Recommendations
• Focus resources to enable responders to determine the real threat to human health and the environment and to implement remedial actions that will achieve the greatest reduction in risk.
• Provide consistent cleanup criteria that take into account future uses of sites. • Create another federal funding mechanism to renew the Superfund and remove the cost of
cleanups from the federal general fund. • Additional research support and coordination are needed to provide assistance at sites where the
contaminant releases continue to pose long-term threats and remediation difficulties.
Sources • ASCE Policy Statement 305 – Superfund Reauthorization (2008). • ASCE Policy Statement 485 – Revitalization of Brownfields (2010). • US EPA New England Superfund Annual Report 2002. • Statistics, Observations, and Comments provided by the NH Department of Environmental
Services website, December 2010 and January 2011. • Oil Fund Disbursement Board 2008 Annual Report. • NHDES 2009 Annual Report.
Report Card
FOR NEW HAMPSHIRE’S
Infrastructure
American Society of Civil Engineers New Hampshire Sect ion
P.O. Box 4953 Manchester, New Hampshire 03108
MASS TRANSIT
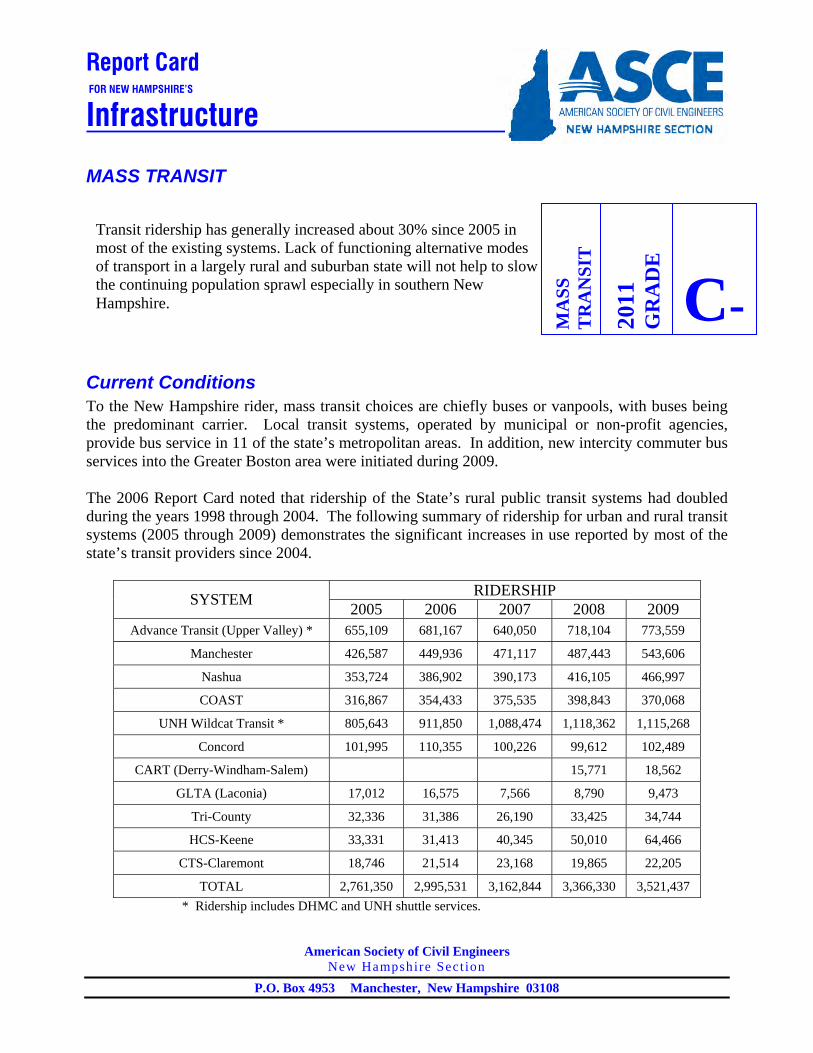
Current Conditions To the New Hampshire rider, mass transit choices are chiefly buses or vanpools, with buses being the predominant carrier. Local transit systems, operated by municipal or non-profit agencies, provide bus service in 11 of the state’s metropolitan areas. In addition, new intercity commuter bus services into the Greater Boston area were initiated during 2009. The 2006 Report Card noted that ridership of the State’s rural public transit systems had doubled during the years 1998 through 2004. The following summary of ridership for urban and rural transit systems (2005 through 2009) demonstrates the significant increases in use reported by most of the state’s transit providers since 2004.
RIDERSHIP SYSTEM 2005 2006 2007 2008 2009 Advance Transit (Upper Valley) * 655,109 681,167 640,050 718,104 773,559
Manchester 426,587 449,936 471,117 487,443 543,606
Nashua 353,724 386,902 390,173 416,105 466,997
COAST 316,867 354,433 375,535 398,843 370,068
UNH Wildcat Transit * 805,643 911,850 1,088,474 1,118,362 1,115,268
Concord 101,995 110,355 100,226 99,612 102,489
CART (Derry-Windham-Salem) 15,771 18,562
GLTA (Laconia) 17,012 16,575 7,566 8,790 9,473
Tri-County 32,336 31,386 26,190 33,425 34,744
HCS-Keene 33,331 31,413 40,345 50,010 64,466
CTS-Claremont 18,746 21,514 23,168 19,865 22,205
TOTAL 2,761,350 2,995,531 3,162,844 3,366,330 3,521,437 * Ridership includes DHMC and UNH shuttle services.
MA
SS
TR
AN
SIT
2011
G
RA
DE
C-
Transit ridership has generally increased about 30% since 2005 in most of the existing systems. Lack of functioning alternative modes of transport in a largely rural and suburban state will not help to slow the continuing population sprawl especially in southern New Hampshire.
MASS TRANSIT – PAGE 2 of 3
Issued June 15, 2011
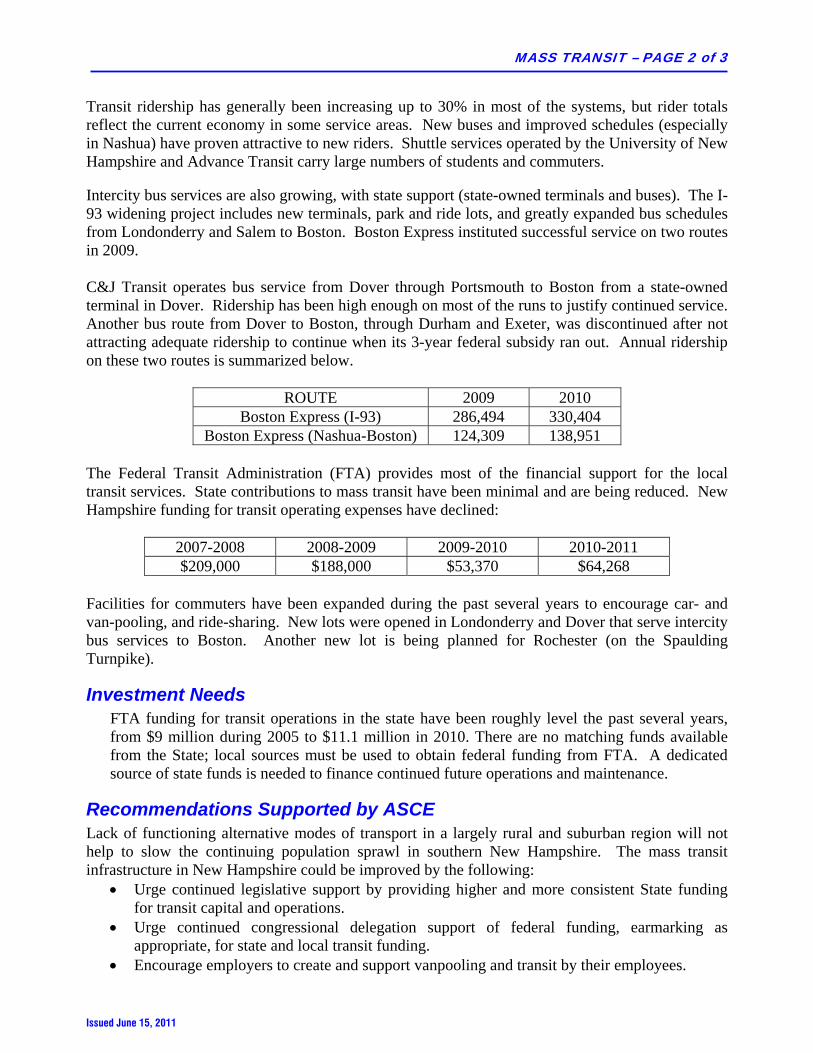
Transit ridership has generally been increasing up to 30% in most of the systems, but rider totals reflect the current economy in some service areas. New buses and improved schedules (especially in Nashua) have proven attractive to new riders. Shuttle services operated by the University of New Hampshire and Advance Transit carry large numbers of students and commuters. Intercity bus services are also growing, with state support (state-owned terminals and buses). The I-93 widening project includes new terminals, park and ride lots, and greatly expanded bus schedules from Londonderry and Salem to Boston. Boston Express instituted successful service on two routes in 2009. C&J Transit operates bus service from Dover through Portsmouth to Boston from a state-owned terminal in Dover. Ridership has been high enough on most of the runs to justify continued service. Another bus route from Dover to Boston, through Durham and Exeter, was discontinued after not attracting adequate ridership to continue when its 3-year federal subsidy ran out. Annual ridership on these two routes is summarized below.
ROUTE 2009 2010 Boston Express (I-93) 286,494 330,404
Boston Express (Nashua-Boston) 124,309 138,951 The Federal Transit Administration (FTA) provides most of the financial support for the local transit services. State contributions to mass transit have been minimal and are being reduced. New Hampshire funding for transit operating expenses have declined:
2007-2008 2008-2009 2009-2010 2010-2011 $209,000 $188,000 $53,370 $64,268
Facilities for commuters have been expanded during the past several years to encourage car- and van-pooling, and ride-sharing. New lots were opened in Londonderry and Dover that serve intercity bus services to Boston. Another new lot is being planned for Rochester (on the Spaulding Turnpike).
Investment Needs FTA funding for transit operations in the state have been roughly level the past several years, from $9 million during 2005 to $11.1 million in 2010. There are no matching funds available from the State; local sources must be used to obtain federal funding from FTA. A dedicated source of state funds is needed to finance continued future operations and maintenance.
Recommendations Supported by ASCE Lack of functioning alternative modes of transport in a largely rural and suburban region will not help to slow the continuing population sprawl in southern New Hampshire. The mass transit infrastructure in New Hampshire could be improved by the following:
• Urge continued legislative support by providing higher and more consistent State funding for transit capital and operations.
• Urge continued congressional delegation support of federal funding, earmarking as appropriate, for state and local transit funding.
• Encourage employers to create and support vanpooling and transit by their employees.
MASS TRANSIT – PAGE 3 of 3
Issued June 15, 2011
• Continued encouragement of the construction and operation of additional park and ride lots as identified by the DOT Statewide Intermodal Planning Study.
• Develop sources of non-federal funding for transit needs (lack of state matching funds limits the ability to acquire some federal funds).
• Encourage the establishment of public-private transit operations along new routes in order to gauge their long-term feasibility.
Sources • Ten-Year Transportation Improvement Plan (2011-2020), NHDOT. • Statistics, observations, and comments provided by the NHDOT Bureau of Rail and Transit,
January 2011.
Report Card
FOR NEW HAMPSHIRE’S
Infrastructure
American Society of Civil Engineers New Hampshire Sect ion
P.O. Box 4953 Manchester, New Hampshire 03108
RAILROADS
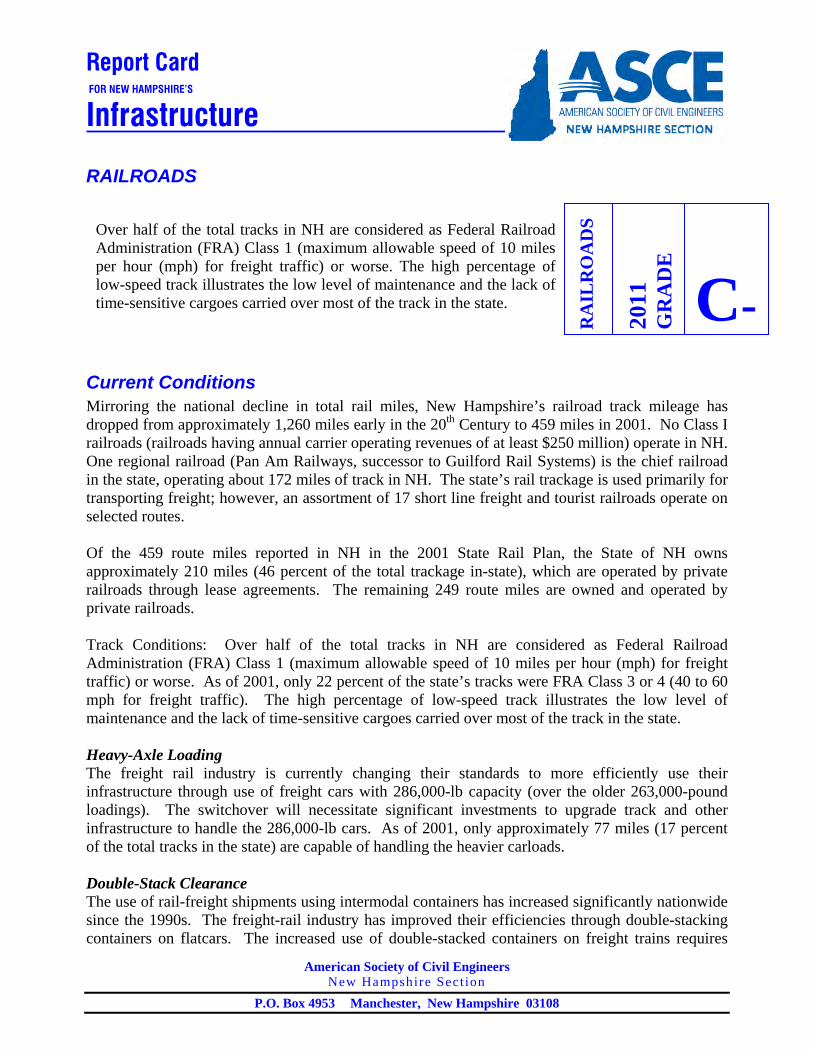
Current Conditions Mirroring the national decline in total rail miles, New Hampshire’s railroad track mileage has dropped from approximately 1,260 miles early in the 20th Century to 459 miles in 2001. No Class I railroads (railroads having annual carrier operating revenues of at least $250 million) operate in NH. One regional railroad (Pan Am Railways, successor to Guilford Rail Systems) is the chief railroad in the state, operating about 172 miles of track in NH. The state’s rail trackage is used primarily for transporting freight; however, an assortment of 17 short line freight and tourist railroads operate on selected routes. Of the 459 route miles reported in NH in the 2001 State Rail Plan, the State of NH owns approximately 210 miles (46 percent of the total trackage in-state), which are operated by private railroads through lease agreements. The remaining 249 route miles are owned and operated by private railroads. Track Conditions: Over half of the total tracks in NH are considered as Federal Railroad Administration (FRA) Class 1 (maximum allowable speed of 10 miles per hour (mph) for freight traffic) or worse. As of 2001, only 22 percent of the state’s tracks were FRA Class 3 or 4 (40 to 60 mph for freight traffic). The high percentage of low-speed track illustrates the low level of maintenance and the lack of time-sensitive cargoes carried over most of the track in the state. Heavy-Axle Loading The freight rail industry is currently changing their standards to more efficiently use their infrastructure through use of freight cars with 286,000-lb capacity (over the older 263,000-pound loadings). The switchover will necessitate significant investments to upgrade track and other infrastructure to handle the 286,000-lb cars. As of 2001, only approximately 77 miles (17 percent of the total tracks in the state) are capable of handling the heavier carloads. Double-Stack Clearance The use of rail-freight shipments using intermodal containers has increased significantly nationwide since the 1990s. The freight-rail industry has improved their efficiencies through double-stacking containers on flatcars. The increased use of double-stacked containers on freight trains requires
RA
ILR
OA
DS
2011
G
RA
DE
C-
Over half of the total tracks in NH are considered as Federal Railroad Administration (FRA) Class 1 (maximum allowable speed of 10 miles per hour (mph) for freight traffic) or worse. The high percentage of low-speed track illustrates the low level of maintenance and the lack of time-sensitive cargoes carried over most of the track in the state.

RAILROADS – PAGE 2 of 4
Issued June 15, 2011
higher clearances than earlier railroad standards. Most of NH’s tracks have obstructions, chiefly bridges, precluding double-stacked containers. As of 2001, approximately 52 miles (11 percent) of NH’s tracks have adequate clearance for double-stacked containers. Freight Movements There are nine active freight railroads operating in NH. Together, the railroads transported approximately 275,000 tons of goods out of the state during 2008, chiefly pulp and paper products, stone and gravel and scrap metal. NH is a net importer of rail freight: 1,229,000 tons of freight terminated at facilities in the state in 2008. Primary imports by rail into NH in 2008 were coal and petroleum, lumber and wood products, cement and chemicals. Most freight carried on NH’s tracks, however, is bridge traffic passing through southern NH (approximately 5,100,000 tons in 2008). Freight movements have declined substantially during the past several years. Some shippers have filed complaints regarding the consistency, level, and quality of service provided by some of the state’s carriers. Disputes between railroad owners/operators have halted or curtailed service on existing branch lines. These disputes have been drawn out in the Legislature, the Federal Surface Transportation Board, DOT, and the Courts. Passenger Travel There are currently two intercity passenger rail routes that pass through NH, The Vermonter, and The Downeaster. Amtrak currently operates one daily train, the “Vermonter”, between St. Albans, Vermont and New York City. The train travels through NH on the New England Central line between Cornish and North Walpole with a stop in Claremont. The Downeaster began service in December 2001, running between Boston and Portland, Maine. Since that time, over three million passengers have ridden this train, far exceeding expectations. The route continues to receive accolades as one of Amtrak’s premier routes and top performing runs. A fifth daily round trip was added after a passing siding was constructed near Dover. This new siding allows the additional scheduled passenger run to pass freight trains that simultaneously use this heavily trafficked freight line. In addition to the existing service, an active rail corridor is being considered for intercity passenger and/or commuter rail. The “NH Capitol Corridor” would re-establish passenger rail service between Concord and the existing commuter rail line that connects Lowell with Boston, Massachusetts. The initial phase of this service would connect the existing service at Lowell with Manchester, NH. The later phase would complete the connection to Concord. Interest in reviving and restoring commuter rail service continues to grow, and a number of significant developments have occurred that will spur additional interest and investment in passenger rail service in NH:
1. The NH Rail Transit Authority (NHRTA) was established in 2008 in order to develop and provide commuter rail and related public rail transportation services in NH. This agency will obtain funding and control future passenger rail service. NHRTA has received no state funding, however, but continues its duties with assistance from the DOT.
2. A law was adopted that requires NHRTA to maintain liability insurance for passenger rail service and limits the State’s liability to $75 million.
3. The State Rail Plan, last produced in 2001, is being updated, with an anticipated completion late in 2011.
4. A major highway capacity improvement project for I-93 is currently under way. One abandoned rail line parallels I-93, and is a second candidate for passenger rail service. The
RAILROADS – PAGE 3 of 4
Issued June 15, 2011
I-93 widening is being designed without encroaching on this corridor (which would prevent re-establishing rail service).
5. NHRTA received a planning grant of $2.24 million, under High Speed Intercity Passenger Rail II from Federal Rail Administration, to be used for preparing a “Service Development Plan” and environmental documents for the NH Capitol Corridor.
6. NHRTA received a grant from Federal Transit Administration ($1.9 million) under a 2009 allocation that will be combined with the NH Capitol Corridor grant to complete the planning and permitting documents needed to set the stage for the final design and engineering.
7. NH has supported the request by the other northeast states for an $18.8 million study (by Amtrak) of improvements needed in the Northeast Corridor.
Investment Needs Freight Operations With some exceptions, the state’s rail infrastructure has suffered from deferred maintenance. NH has a Special Railroad Fund dedicated to maintenance and repair of state-owned lines (approximately $600,000 annually). The state established a revolving loan fund for improvements on privately owned lines ($4 million has been loaned out through 2010). Outside of these funds there is little other state funding available for improvements to the freight-rail system. Passenger Operations Efforts to improve and revitalize the State’s rail network are currently focused on reducing air pollution emissions and highway congestion through development of commuter rail to convey commuters to and from the Greater Boston area. Continued population growth in southern NH has increased the congestion on the local highway system: traffic on Interstate I-93 routinely exceeds the design volumes; daily commuter traffic on the Everett Turnpike continues to grow. Intercity and commuter rail between Lowell, Massachusetts; Manchester; and Concord is being explored as the first means to alleviate the traffic congestion and air pollution that planners expect will bedevil southern NH into the future. Incorporating commuter rail into a mix of transportation modes in NH will continue to be a challenge. Legislative initiatives have laid the groundwork for return of passenger rail service. Recent federal grants will be used to complete the initial alternatives analysis, environmental permit documents, and planning. Proceeding into the design and implementation stages will require additional sources of funding.
Recommendations Supported by ASCE A healthy rail network still remains an important component of the state’s infrastructure. The railroad infrastructure in NH could be improved by the following:
• Develop the New Hampshire Capitol Corridor intercity and commuter rail system. • Develop a program of dedicated funding to allow use of state funds for maintaining and
upgrading the state’s freight-rail infrastructure. • Encourage the upgrade of the state’s route lines over/under bridges to accommodate
286,000-lb freight cars and double-stack container intermodal traffic. • Cooperate with surrounding New England states to resolve regional rail issues. • Develop policies to promote increased and improved intermodal freight transportation
(consistent with ASCE Policy Statement 149).
RAILROADS – PAGE 4 of 4
Issued June 15, 2011
• Urge continued congressional support of federal funding, earmarking as appropriate, for state and local rail and transit funding.
Sources • Ten-Year Transportation Improvement Plan (2011-2020), NHDOT. • “NH State Rail Plan”, April, 2001, NHDOT Bureau of Rail and Transit. • American Association of Railroads 2008 data. • Northern New England Passenger Rail Authority website (December 2010). • Statistics, observations, and comments provided by the NHDOT Bureau of Rail and Transit,
January 2011.

Report Card
FOR NEW HAMPSHIRE’S
Infrastructure
American Society of Civil Engineers New Hampshire Sect ion
P.O. Box 4953 Manchester, New Hampshire 03108
NAVIGABLE WATERS
Current Conditions Ports, harbors, and their waterways are critical components of the national infrastructure and are vital to the Nation’s economy. Likewise, the navigable waterway system of New Hampshire is a crucial element of New Hampshire’s economy. The navigable waterway system of New Hampshire provides an efficient means for importing and exporting foreign and domestic goods to the state and serves the state’s commercial fishing and recreational boating industries. The U.S. Army Corps of Engineers (USACE) defines navigable waters as those that are subject to the ebb and flow of the tide, and/or are presently used, or have been used in the past, or may be susceptible to use in interstate or foreign commerce. The importance of navigable waters to the New Hampshire economy can be gauged by the following statistics:
• The 2009 New Hampshire Gross Domestic Product (GDP) was approximately $54.5 Billion. • The cargo passing through the Port of New Hampshire had a total value of $1.02 Billion
(almost 2% of the State’s GDP) in 2005 (latest available data). • Cargo passing through the Port: 3,832,513 tons (ranked 78 of 150 major U.S. ports). • Domestic tonnage: 513,112 tons (ranked 129 of 150). • Foreign imports: 3,069,638 tons (ranked 53 of 150). • Approximately 13% of cargoes originated domestically.
Since 2001, the Pease Development Authority’s Division of Ports and Harbors (DPH) has held the responsibility for planning, maintenance, and development of New Hampshire’s ports, harbors, and navigable tidal rivers. New Hampshire’s navigable waterway system consists of one primary port, three smaller harbors, and several miles of interconnecting rivers and channels. Eight of these waterways are maintained by USACE, others are the responsibility of the State of New Hampshire. PORTS AND HARBORS
• The Port of New Hampshire, at Portsmouth, is the largest port facility in the State. The primary cargoes passing through the Port consist of road salt, coal, petroleum fuels, gypsum, and scrap iron and steel. The Port has a variety of public and private piers, wharves, and docks situated along the Piscataqua River.
NA
VIG
AB
LE
W
AT
ER
S
2011
G
RA
DE
D+
The navigable waterway system of New Hampshire is a crucial element of New Hampshire’s economy. The navigable waterway system of New Hampshire provides an efficient means for importing and exporting foreign and domestic goods to the state and serves the state’s commercial fishing and recreational boating industries.
NAVIGABLE WATERS – PAGE 2 of 5
Issued June 15, 2011
• Hampton-Seabrook Harbor is accessed through a common entrance channel shared by the towns of Hampton and Seabrook. The maintenance of Hampton-Seabrook Harbor is the responsibility of New Hampshire (the USACE federal channel currently ends at the Route 1A Bridge over the channel entrance). The Harbor facilities consist of a state-owned commercial fishing pier and public boat launch in Hampton and a public pier and launch ramp in Seabrook. These facilities support a small commercial fishing fleet, a charter fleet, and many recreation boaters.
• Little Harbor is an undeveloped natural harbor with several private marinas. There are no
state or federal facilities.
• The Rye Harbor Marine Facility consists of a man-made harbor used by recreational boaters, charter boats, and a small commercial fishing fleet. The Facility has a state-owned, commercial fishing pier. A 2003 conditions survey at Rye Harbor identified severe deterioration to the commercial fish pier. The pier was replaced and construction was completed during 2009 at a cost of $1.5M.
NAVIGATION CHANNELS In addition to the ports and harbors, eight navigation channels are maintained by USACE as “federal channels” to allow use of these navigable waters for commerce and recreation.
• Hampton Harbor (access to Hampton-Seabrook Harbor). • Little Harbor (access around Great Island (New Castle), the Portsmouth Back Channels, and
Sagamore Creek). • Rye Harbor (access to Rye Harbor). • Portsmouth Harbor/Piscataqua River (access to private shippers along the shore in
Portsmouth and Newington, and access to Great Bay). This federal project includes three turning basins within the channel.
• Bellamy River (access to Dover Point). • Cocheco River (access to the Dover waterfront). • Lamprey River (access to Newmarket). • Squamscott River (access to the Exeter waterfront).
Investment Needs The greatest needs of the navigable waters system appear to be regular maintenance dredging; miscellaneous repairs to piers, wharfs, docks, and jetties; and a long-range capital maintenance and improvement plan. The security concerns of ports and harbors will continue to be an important investment. The existing port facilities have the potential for greatly improving New Hampshire’s economy because effective strategic and capital planning programs have already been instituted.
Channel Improvements - Dredging Maintenance dredging to maintain depth clearance within the State’s navigable waters is an ongoing need. Dredging projects within the eight federal channels is the jurisdiction of USACE while all other channels are the responsibility of the State. USACE has estimated that approximately 2.8 million cubic yards of sediment will require dredging from New Hampshire’s navigable waters
NAVIGABLE WATERS – PAGE 3 of 5
Issued June 15, 2011
between 1994 and 2044. Some of NH’s waterways in greatest need of maintenance dredging are as follows: Simplex Shoals The highest priority for channel dredging is an area within the main shipping channel of the Piscataqua River referred to as Simplex Shoals. This area requires maintenance dredging every five to seven years and is currently long overdue. USACE already has $950,000 for dredging projects in this area, but will need another already requested appropriation of $500,000 to initiate and complete the construction. Hampton-Seabrook Harbor DPH dredged this harbor in 1998 and 2005. USACE sponsored a Section 227 Shoreline Stabilization Demonstration Project at a final cost of $3.1 million that was completed in 2005, and has reportedly performed as designed. This project filled a breach between two channels within the estuary, restored tidal flats, and halted bank erosion and shoaling in the Seabrook anchorage. Currently the Hampton-Seabrook Harbor needs to be dredged to its permitted depths, and DPH has requested $2.5 Million for this State dredging project. USACE is considering a request from DPH that would incorporate the inner harbor channels and anchorages into the federal Hampton Harbor navigation project. This transfer would shift responsibility for the entire harbor to USACE (relieving New Hampshire of the responsibility for frequent maintenance dredging). USACE is assessing the feasibility of DPH’s request, and approval may be contingent on DPH completing the dredging. Piscataqua River Turning Basin Improvement Project DPH and USACE have proposed extending the current Upper Turning Basin from 800 feet wide to over 1,000 feet wide in order to accommodate longer vessels that call on the Port. DPH estimates that the design and construction of this project would cost a total of $14.3 Million (65% federal - 35% state cost sharing). The feasibility study (total cost $750,000) and its disposal options are currently under review. New Hampshire has requested $300,000 in federal funding in fiscal year 2011 that would be used for the design of the turning basin. Sagamore Creek Sagamore Creek and the Back Channel (the waterway between the Piscataqua River and Little Harbor) were last dredged in 1969. These waterways connect Little Harbor and the Piscataqua River to provide safe passage for fishing vessels during severe seas at the entrance of the Piscataqua River. The shoaling in Sagamore Creek and the Back Channel has been so extensive that most of the commercial fishing fleet has been forced to relocate to deeper anchorages. USACE has proposed the dredging project, and estimates that $150,000 will be needed for permitting and environmental studies, plans and specifications. Funds have not yet been appropriated. Cocheco River Dredging A multi-phase dredging project to reestablish the channel dimensions commenced in 2005. The final, Phase III, project commenced in October 2010, with the awarding of a $2.9 Million construction contract. Dredge spoils from this project are being sent to an upland disposal facility constructed by the City of Dover.
NAVIGABLE WATERS – PAGE 4 of 5
Issued June 15, 2011
DREDGE SPOILS DISPOSAL New Hampshire currently does not have suitable onshore or offshore disposal sites for dredge spoils from DPH facilities and the federal channels. The long-term offshore disposal site off Cape Arundel, Maine was closed in 2010 without a new offshore site approved. USACE completed a Phase I reconnaissance report in 2005 that identified 100 potential sites for upland disposal of dredge spoils in New Hampshire. The State needs a long-range dredge management plan that can be used to construct and control the disposal alternatives for dredge spoils. DPH has proposed such a plan, named the “Regional Sediment Management Plan”, which would identify possible upland disposal sites and potential offshore disposal sites. The estimated costs for these studies, taken together, are $900,000 with joint funding by USACE, New Hampshire, and Maine. FACILITIES The following DPH’s facilities are in need of upgrades or replacement.
• Market Street Marine Terminal: A Master Plan for use of this facility was completed in 2000. The study indicated that the Terminal was underutilized at that time. DPH reported the facility has an inefficient layout for accommodating multiple bulk landings and the pier requires upgrading to accommodate larger vessels. DPH is planning to update the Master Plan. DPH has requested funding in fiscal year 2011-2012 for: Resurfacing the north half of the deck surface of the main wharf (total project cost $2.5
Million), and Extending the main wharf an additional 125 feet (total project cost $12 Million).
• Hampton Harbor Marine Facility: DPH has requested $1.5 Million to replace the facility.
Recommendations Supported by ASCE
• Create a database of port and harbor facilities. • Institute a facility preventive maintenance and inspection program. • Develop a long-range capital maintenance, repair, and improvements program. • Fund the Regional Sediment Management Plan that will provide options for disposal of
dredge spoils. • Develop a security plan for the Port of New Hampshire. • Update the Master Plan for the Market Street Marine Terminal. • Funding should be allocated for the necessary facility improvements; these will be critical to
the port’s ability to manage future cargo types and tonnages. • Congressional initiatives (such as House Bill HR. 4844 and Senate Bill S.3213), currently
proposed in Congress, which would mandate using the federal Harbor Maintenance Trust Fund for its intended purpose of funding only USACE navigation projects.
Sources • 2009 Port Industry Statistics, American Association of Port Authorities, www.aapa-
ports.org. • Market Street Marine Terminal, Master Plan 2000. Vanasse Hangen Brustlin, Inc. March
2000 • New Hampshire Dredged Material Management Study. USACE, July 1993, pp 16-23.
NAVIGABLE WATERS – PAGE 5 of 5
Issued June 15, 2011
• New Hampshire Comprehensive Upland Dredge Material Disposal Study (Phase I). USACE, September 2005.
• Dredging and Dredge Material Management in New Hampshire. NH Department of Environmental Services, NH Coastal Program presentation to Great Bay Siltation Commission, December 2008.
• Tonnage for Principal Ports in 2009, USACE, {www.ndc.iwr.usace.army.mil//data/datappor.htm}.
• U.S. Department of Commerce, Bureau of Economic Analysis (NH gross domestic product values) {www.bea.gov}.
• Update Report for New Hampshire. USACE, New England Division. November 30, 2010. • 2010 Annual Dredge Report, Pease Development Authority, Division of Ports & Harbors. • NH Dredge Management Task Force Meeting Minutes (2001). • Discussions with DPH and Coastal Program staff, February 2011.
Report Card
FOR NEW HAMPSHIRE’S
Infrastructure
American Society of Civil Engineers New Hampshire Sect ion
P.O. Box 4953 Manchester, New Hampshire 03108
SCHOOLS
Current Conditions Education, specifically funding, has been a controversial topic of discussion in New Hampshire for many years. Directly related to this issue is the school infrastructure network – buildings. After decades of steady growth, the State has seen a decline in student enrollment in the last ten years. There are over 201,000 students enrolled in the 487 public school buildings throughout New Hampshire. Most of these buildings were constructed over 40 years ago with one out of every three constructed before 1950. A large number of modular classrooms are still in use across the state. The State Fire marshal’s office has over 100 units registered, but there are minimal requirements for registration of used units if they are resold to other school districts. There is a universally recognized correlation between superior facilities and the quality of education received. This is demonstrated by the fact that school facilities are taken into account in the high school accreditation by the New England Association of Schools and Colleges. Often in cases when a school is denied accreditation the facility is at least part of the reason, and sometimes the only reason, for the lack of accreditation. Schools that are able to provide a safe and comfortable environment are more conducive to learning than unsafe, crowded facilities. The development and utilization of new technologies require continually upgrade by school systems. In response to legislative requirements, a qualitative evaluation of New Hampshire’s school infrastructure system was conducted in 2000, but has not been repeated since. Several national studies and reports have also been conducted in the evaluation of the conditions of school systems, but again have not been repeated in recent years. Although these studies are somewhat dated, it provides a general indication of the system needs. The following are several key findings:
• Overall adequacy of space was reported deficient in 42% of New Hampshire schools. • Adequate space for special education was reported deficient in 46% of the schools. • At least one unsatisfactory environmental condition (heating, ventilation, etc.) was
reported in 78% of all schools. • Separation of pedestrians and vehicle traffic was reported deficient in 59% of schools. • In 59% of the buildings, there is at least one inadequate building feature (roof, floor,
windows, doors, plumbing, heating, etc.).
SCH
OO
LS
2011
G
RA
DE
C-The last quantitative evaluation of the New Hampshire public school infrastructure took place more than a decade ago. State funding for a comprehensive study is needed to formulate an effective capital program of rehabilitation, reconstruction, and maintenance.
SCHOOLS – PAGE 2 of 3
Issued June 15, 2011
• 39% of the buildings need extensive repair or replacement. The State total school building aid has climbed to about $45 million per year, but only about $2-3 Million each year had been going to new projects. Currently there is a one year moratorium on new projects, with the current budget containing a provision to extend the moratorium two more years. In a typical year there is approximately $150 million in school construction in the State. Most of these projects are funded through the sale of municipal bonds with most schools taking advantage of the Municipal Bond Bank.
The only federal school building program is a tax credit bond program for renovations only but this does not amount to significant investment within the State.
Investment Needs There needs to be a comprehensive study of the existing school infrastructure and the needs of the system including replacement, rehabilitation, and modernization/upgrades. Replacing or upgrading inadequate facilities in order to reach satisfactory conditions is a significant undertaking. Not only is the current infrastructure in need of repair (roofs, plumbing, ventilation, etc), upgrades to meet the continued growth of technology are needed. The state has also enacted space standards for support areas and science labs. These additional requirements add to the cost of school renovations and constructions. The State of New Hampshire has a School Building Aid program that can be utilized by all eligible districts. The program will contribute 30 to 60% of the total construction cost of new buildings or repairs. Funding since the 2006 report card has increased from $38 to $50 million. The funds will be paid over the length of the bond (or a minimum of 5 years for other funding mechanism) obtained by the district. The current moratorium on funding new projects and the pending legislation for an additional two year moratorium shows that available money can be spent financing the current projects while allowing needs to further build up. The following are important facts regarding funding:
• There are two formulas utilized for determining the amount of School Building Aid. The
basic formula is based upon the number of towns that send students to a school. An alternative formula is based on median family income and equalized property valuation per pupil. Total aid can provide up to 60% of the cost of construction.
• The size and cost of school buildings eligible for funding are limited. • An additional 3% incentive for the construction of a "High Performance School" is offered
to promote energy efficiency. • Renovations undertaken to improve energy efficiency or air quality are now eligible for
School Building Aid. School districts must have a written maintenance plan and must provide an analysis of a project's impact on the maintenance program and an assurance that maintenance will be addressed in order to get School Building Aid.
Recommendations Supported by ASCE The demand on the public school system will increase as New Hampshire continues to grow and as existing facilities continue to age. Two-thirds of schools will reach at least 40 years of age within the next decade. A concerted effort must be made by the State to ensure that funding and support is
SCHOOLS – PAGE 3 of 3
Issued June 15, 2011
made available to communities for an adequate school system. Given that New Hampshire’s children are the state’s most precious resources, education needs to be a top funding priority of the state. ASCE supports the following specific recommendations:
• Encourage continued support and funding of School Building Aid program. • Continue to promote and encourage energy efficiency and sustainable design for school
renovation and construction projects. • Provide State funding to conduct a comprehensive, quantitative evaluation of the public
school systems at regular intervals. This will allow for establishment of a baseline for funding required. It will also allow for continual evaluation of schools and assessment of their needs.
• Encourage school districts to adopt and implement a comprehensive construction and maintenance program to allow for proper planning and capital reserve funding.
Sources • U.S. General Accounting Office, SCHOOL FACILITIES: Profiles of School Condition by
State, March 2000. • National Education Association, Modernizing Our Schools: What Will It Cost?, April 2000. • New Hampshire State Board of Education, Response Respecting Laws of 1998, Chapter
267:3, September 2000. • New Hampshire State Board of Education, Miscellaneous discussions and information
provided, December 2005. • New Hampshire State Board of Education, Miscellaneous discussions and information
provided, December 2011. • New Hampshire of School Approval & Facility Management, Miscellaneous discussions
and information provided, May 2011.
Report Card
FOR NEW HAMPSHIRE’S
Infrastructure
American Society of Civil Engineers New Hampshire Sect ion
P.O. Box 4953 Manchester, New Hampshire 03108
SOLID WASTE
Current Conditions Most New Hampshire citizens do not pause to consider what happens to solid waste (trash) once it’s picked up or dropped off at the town dump. Yet, the proper planning and management of solid waste disposal is essential to the smooth operation of a clean, modern society. The solid waste generated in New Hampshire can be categorized into three general sources. Residential sources typically include waste brought to a transfer station by residents. Commercial/Industrial sources include businesses, multi-family housing and commercial waste pickup services that pick up trash curbside. Construction & Demolition (C&D) sources include waste generated by construction contractors. The total tonnage of waste generated in 2007 was 1.70 million tons or 5.4 lb/person/day. Residential waste accounted for 37%, commercial/industrial accounted for 42%, and C&D waste accounted for 21%. C&D has decreased in recent years due to the decrease in construction as a result of the current economic recession. The EPA lists the make-up of our solid waste and the major components as: 34% paper, 13% yard trimmings, 12% food scraps, 12% plastics and 8% metal. The disposition of New Hampshire’s residential and commercial waste can be broken down as follows: 45% was placed in a landfill, 31% was recycled, 17% incinerated and 2% was composted. C&D waste gets tallied as 41% landfill, 47% recycled and 12% exported out of state.
Solid Waste Disposal For decades solid waste has been buried in landfills. Since the late 1980s landfills have been required to be lined to prevent seepage into the soil and water table. Currently, the majority of New Hampshire’s solid waste is trucked and disposed of in three large landfills in Berlin, Bethlehem, and Rochester. Smaller landfills exist in Nashua, Lebanon, Conway, and Franklin. Today, many communities have transfer stations that were established when old unlined landfills were closed. Transfer stations handle resident-delivered solid waste, and curbside collected materials in packers. Some communities that are served by curbside pick-up and are close to disposal or recycling facilities may direct haul without transfer stations. There are also several commercially operated transfer stations in New Hampshire.
SOL
ID
WA
STE
2011
G
RA
DE
CAs of 2010 the New Hampshire recycling rate was approximately 30%, despite the fact that 99% of residents have access to recycling programs. Recycling rates vary considerably between communities depending on the systems and practices used for delivery of waste and recyclables to facilities, and the proportion of commercial waste to residential waste.

SOLID WASTE – PAGE 2 of 3
Issued June 15, 2011
There are two waste-to-energy incinerators in Concord and Claremont that accept waste from nearby towns in local cooperatives. Many smaller, unlined landfills throughout the state have been closed over the past decade and the handful remaining will be closed shortly. Also, several small municipal incinerators have been closed over the past few years because they could not meet stringent new emissions regulations.
Recycling In 1990 the New Hampshire Legislature set a goal for the diversion (recycling) rate at 40% by the year 2000. As of 2010 the diversion rate was approximately 30%, and this is despite the fact that 99% of NH residents have access to recycling. Recycling rates vary considerably between communities depending on the systems and practices used for delivery of waste and recyclables to facilities, and the proportion of commercial waste to residential waste. Currently 46 New Hampshire towns have Pay As You Throw (PAYT) programs where trash must be disposed of in town-specific bags purchased at local retailers, but recyclables are picked up free of charge. The system has proven quite effective in increasing recycling rates, thereby decreasing solid waste disposal costs for the town. Manufacturers are constantly finding new ways to utilize recycled materials, and consequently, the price of many recyclable materials are at an all-time high. Plastic, metal, and glass are nearly 100% recyclable and paper is approximately 70% recyclable. This is noteworthy because paper represents the largest portion of our solid waste and New Hampshire’s paper recycling rate is only 37%, compared to 53% nationally. Some of the new, innovative items being produced from recycled materials include new packaging, clothing, and carpeting from plastics and processed glass aggregate, which is a finely crushed glass material used in construction. Composting is another form of recycling. Since many municipalities will not accept yard waste, many citizens already compost it. On the other hand, food waste is rarely composted even though much of it is compostable. These two items account for a quarter of solid waste in New Hampshire, therefore composting would be a simple way to reduce our solid waste.
Investment Needs Under the New Hampshire State Solid Waste Management Act, RSA 149-M:3, in 1990 the New Hampshire Legislature recommended the following preferences for waste management:
1. Source Reduction 2. Recycling & Reuse 3. Composting 4. Waste-to-Energy 5. Incineration without energy production 6. Landfilling
In order to encourage source reduction, recycling & reuse and composting, local and statewide public education programs need to be continued and expanded. It is up to the citizens and the government of New Hampshire to decide the level of importance to be placed on our solid waste management. There will always be a need for solid waste landfills that meet environmental standards for the portion of solid waste that is not recycled and for the residue and by-products of waste-to-energy and recycling facilities.

SOLID WASTE – PAGE 3 of 3
Issued June 15, 2011
Since landfills are central in any waste management program, New Hampshire will need to ensure that adequate landfill capacity is available. Currently, sufficient assured state-wide capacity is permitted for approximately 10 years at commercial landfills and for a greater period at some public landfills with limited service areas. The quality of existing solid waste infrastructure, which includes landfills and other disposal facilities, recycling facilities, and transfer stations in New Hampshire is generally satisfactory. Assured capacity in the future, however, is limited. Now is the time to secure and permit new landfills.
Recommendations Supported by ASCE • Secure new landfills for state-wide access as current landfills are predicted to reach their
permitted capacities within the next decade. • Set up statewide public education programs to encourage recycling. Expand single stream
recycling to make it easier for the public to recycle. • Establish state funding programs to provide assistance to communities to construct landfills
and to provide more complete recycling programs. • Establish state funded programs to help encourage the planning and establishment of larger,
multi-community waste disposal and recycling centers.
Sources • Statistics, Observations, and comments provided by the NH Department of Environmental
Services.

Report Card
FOR NEW HAMPSHIRE’S
Infrastructure
American Society of Civil Engineers New Hampshire Sect ion
P.O. Box 4953 Manchester, New Hampshire 03108
WASTEWATER
Current Conditions New Hampshire has constructed extensive infrastructure to collect and treat wastewater. Much of this infrastructure was constructed under the Clean Water Act (CWA) Construction Grant Program beginning in 1972 and ending in the mid 1980s. This program paid up to 95% in a combination of Federal and State grants for a community’s wastewater construction. This program was replaced by the State Aid Grant (SAG) and State Revolving Fund (SRF) low interest loan. The SAG reimbursed communities up to 30% of the eligible project cost. Unfortunately the SAG program has been suspended due to state budget issues. Grants from the U.S. Department of Agriculture-Rural Development Agency and the U.S. Department of Housing and Urban Development are still available to communities meeting specific program requirements. The majority of the facilities constructed under the original CWA Construction Grants program are nearing or in many cases passed their design life. Communities attempting to upgrade these facilities now have limited options for funding.
Investment Needs The U.S. Environmental Protection Agency is charged by Congress to conduct regular Clean Watersheds Needs Surveys (CWNS). The most recent survey was completed in 2008. The CWNS breaks the needs into eleven major categories and several additional subcategories. Five of the major categories are relevant here; other sections such as NPS Sanitary Landfills will be covered elsewhere. The five relevant major categories together with their subcategories are: I Secondary treatment is the minimum standard of wastewater treatment required under the
CWA. II Advanced treatment is required for certain treatment plants to mitigate identified water
quality impacts to their receiving waters. III –A Infiltration/Inflow Correction is required to upgrade collection systems subject to inflow of
groundwater and certain sources of rainwater.
WA
STE
WA
TE
R
2011
G
RA
DE
C-As wastewater treatment facilities near or surpass their normal design life, investment needs grow exponentially. Between the years 2004 and 2008, monetary needs grew by more than $600 million as facilities constructed under the Clean Water Act construction grant program exceeded their design life.
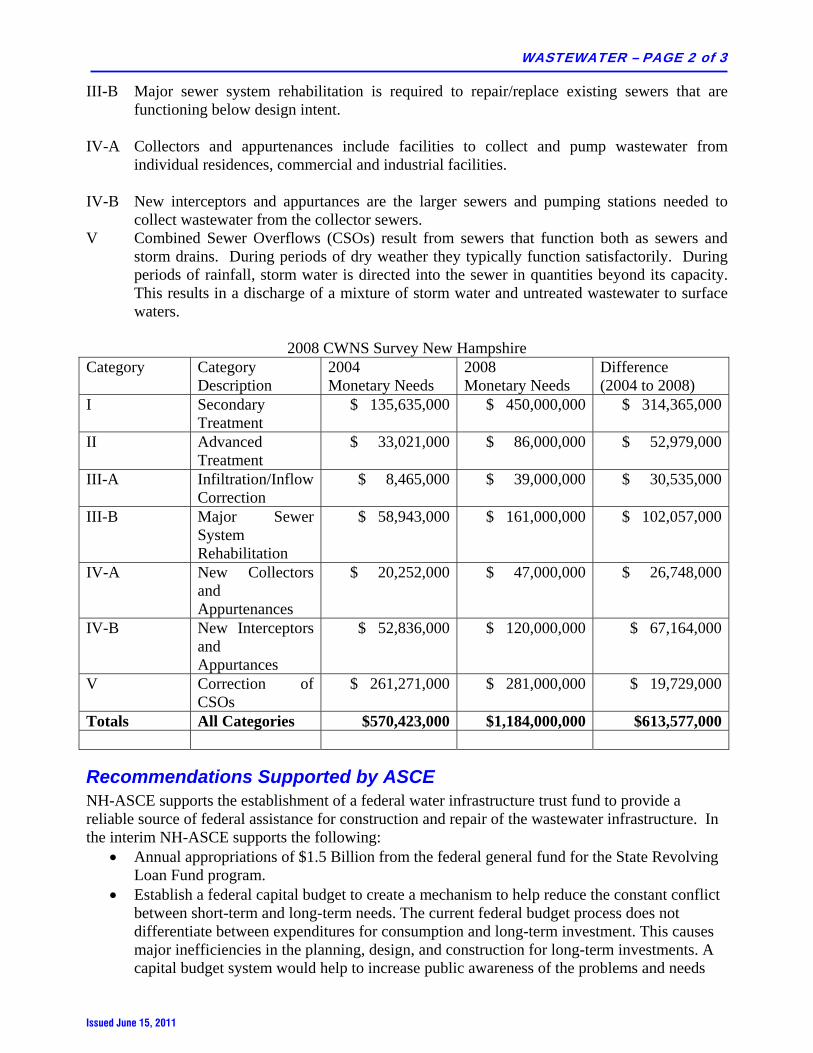
WASTEWATER – PAGE 2 of 3
Issued June 15, 2011
III-B Major sewer system rehabilitation is required to repair/replace existing sewers that are functioning below design intent.
IV-A Collectors and appurtenances include facilities to collect and pump wastewater from
individual residences, commercial and industrial facilities. IV-B New interceptors and appurtances are the larger sewers and pumping stations needed to
collect wastewater from the collector sewers. V Combined Sewer Overflows (CSOs) result from sewers that function both as sewers and
storm drains. During periods of dry weather they typically function satisfactorily. During periods of rainfall, storm water is directed into the sewer in quantities beyond its capacity. This results in a discharge of a mixture of storm water and untreated wastewater to surface waters.
2008 CWNS Survey New Hampshire
Category Category Description
2004 Monetary Needs
2008 Monetary Needs
Difference (2004 to 2008)
I Secondary Treatment
$ 135,635,000 $ 450,000,000 $ 314,365,000
II Advanced Treatment
$ 33,021,000 $ 86,000,000 $ 52,979,000
III-A Infiltration/Inflow Correction
$ 8,465,000 $ 39,000,000 $ 30,535,000
III-B Major Sewer System Rehabilitation
$ 58,943,000 $ 161,000,000 $ 102,057,000
IV-A New Collectors and Appurtenances
$ 20,252,000 $ 47,000,000 $ 26,748,000
IV-B New Interceptors and Appurtances
$ 52,836,000 $ 120,000,000 $ 67,164,000
V Correction of CSOs
$ 261,271,000 $ 281,000,000 $ 19,729,000
Totals All Categories $570,423,000 $1,184,000,000 $613,577,000
Recommendations Supported by ASCE NH-ASCE supports the establishment of a federal water infrastructure trust fund to provide a reliable source of federal assistance for construction and repair of the wastewater infrastructure. In the interim NH-ASCE supports the following:
• Annual appropriations of $1.5 Billion from the federal general fund for the State Revolving Loan Fund program.
• Establish a federal capital budget to create a mechanism to help reduce the constant conflict between short-term and long-term needs. The current federal budget process does not differentiate between expenditures for consumption and long-term investment. This causes major inefficiencies in the planning, design, and construction for long-term investments. A capital budget system would help to increase public awareness of the problems and needs
WASTEWATER – PAGE 3 of 3
Issued June 15, 2011
facing our country’s physical infrastructure, and would help Congress focus on programs devoted to long-term growth and productivity.
• Funding research in wastewater treatment technology to reduce capital expenditures, as well as operation and maintenance costs.
Sources • Clean Watersheds Needs Survey (CWNS) 2004 Report to Congress • Clean Watersheds Needs Survey (CWNS) 2008 Report to Congress • Communication from NH DES staff
Report Card
FOR NEW HAMPSHIRE’S
Infrastructure NEW HAMPSHIRE SECTION
Issued June 15, 2011
AUTHORS Darren M. Benoit, P.E., M.ASCE: Mr. Benoit is the Chairman of the Government Relations Committee for the New Hampshire Section of the American Society of Civil Engineers (ASCE-NH) and Chairman of the 2011 Report Card Committee. He is a registered New Hampshire professional engineer with 18 years of experience and holds a BSCE and MPA from the University of New Hampshire. James T. Spaulding, P.E., M.ASCE: Mr. Spaulding is a former President of ASCE-NH. He is a registered New Hampshire professional engineer with over 30 years of experience and holds a BSCE from Northeastern University. Kenneth W. Milender, P.G., P.E., M.ASCE: Mr. Milender is a registered New Hampshire Professional Geologist and Professional Engineer, holding an MSCE (geotechnical) from the University of New Hampshire, an M.S. in engineering geology from the University of Wisconsin, and a B.S. in geology from Tufts University. Michael H. MacDonald, P.E. is a member of ASCE. He is a registered New Hampshire professional engineer with over 5 years of experience and holds a BSCE from the University of New Hampshire. Jason Ayotte, P.E. is the immediate Past President of ASCE-NH. He is a registered New Hampshire professional engineer with 11 years of experience and holds a BSCE from the University of New Hampshire. Peter Kohalmi, P.E. is a member of ASCE-NH. He is a registered New Hampshire professional engineer with 15 years of experience and holds a BSCE from the University of Massachusetts-Lowell. Drew Brassard, E.I.T, is a member of ASCE. Mr. Brassard is a registered New Hampshire engineer in training with 3 years of experience. He holds a BSCE from the University of New Hampshire. Phillipp Kendall II, P.E., M.ASCE: Mr. Kendall is a registered New Hampshire professional engineer with 20 years of experience and holds a BSCE from the University of New Hampshire.