2011 Next Generation Manufacturing Study
32
Next Generation Manufacturing NGM 2011 Next Generation Manufacturing Study prepared by The Manufacturing Performance Institute 2011 Next Generation Manufacturing Study National Executive Summary
Transcript of 2011 Next Generation Manufacturing Study

Next Generation ManufacturingNGM
2011 Next Generation Manufacturing Study
prepared by The Manufacturing Performance Institute
2011 Next Generation Manufacturing Study
National Executive Summary


© 2011 The MPI Group 1 Next Generation Manufacturing Study
Introduction
The 2011 Next Generation Manufacturing (NGM) Study was developed to identify performances and practices in place among U.S. manufacturers, to
determine how much progress U.S. manufacturers have made in implementing Next Generation strategies, and to measure manufacturers’ progress toward achieving world-class status in the 21st century.
The NGM Study was conducted by the Manufacturing Performance Institute (MPI) with the American Small Manufacturers Coalition (ASMC), an association of manufacturing extension centers that work to improve the innovation and productivity of America’s manufacturing community. One ASMC program of primary focus is the National Institute of Standards and Technology (NIST) Manufacturing Extension Partnership (MEP) program. MPI, ASMC, and MEPs across the country promoted the NGM Study.
The Next Generation Manufacturing Study National Executive Summary presents analysis and findings from the 2011 NGM Study, focusing primarily on awareness, best practices, and achievements related to six key Next Generation strategies. World-class capabilities in these six forward-looking strategies will drive manufacturing growth and profitability into the 21st century:
• Customer-focused innovation: Develop, make, and market new products and services that meet customers’ needs at a pace faster than the competition.
• Engaged people/human-capital acquisition, develop-ment, and retention: Secure a competitive performance advantage by having superior systems in place to recruit, hire, develop, and retain talent.
• Superior processes/improvement focus: Record annual productivity and quality gains that exceed the competition through a companywide commitment to continuous improvement.
• Supply-chain management and collaboration: Develop and manage supply chains and partnerships that provide flexibility, response time, and delivery performance that exceed the competition.
• Sustainability: Design and implement waste and energy-use reductions at a level that provides superior cost performance and recognizable customer value.
• Global engagement: Secure business advantages by having people, partnerships, and systems in place capable of engaging global markets and talents better than the competition.
The NGM Study results offer a “scorecard” for U.S. manufacturers by which to measure progress in defining strategies within their organizations, implementing best practices to support those strategies, and then achieving performance improvements that can move them into the next generation. A key step in any manufacturing improvement initiative is to benchmark and compare performances; the NGM Study provides these benchmarks.
It’s encouraging that some U.S. manufacturers have already adopted some or most of the NGM strategies. But many other manufacturers still face an “execution gap” between their good intentions (understanding the importance of NGM strategies) and their ability to implement those strategies. Worse off still are the group of manufacturers that haven’t yet recognized the critical importance of the NGM strategies.
Manufacturers need be proactive in implementing NGM strategies, but they needn’t go it alone. A wide array of organizations — public, nonprofit, and private — are already helping thousands of manufacturers to implement NGM strategies to remain competitive into the next genera-tion — and beyond.

Next Generation Manufacturing Study 2 © 2011 The MPI Group
Introduction . . . . . . . . . . . . . . . . . . . . . . . . . . . . . . . . . . . . . . . . . . . . . . . . . . . . . . . . . . . . . . . . . . 1
Table of Contents . . . . . . . . . . . . . . . . . . . . . . . . . . . . . . . . . . . . . . . . . . . . . . . . . . . . . . . . . . . . . . 2
Reading the Tables in This Summary . . . . . . . . . . . . . . . . . . . . . . . . . . . . . . . . . . . . . . . . . . . . . . . . 3
NGM Study Highlights . . . . . . . . . . . . . . . . . . . . . . . . . . . . . . . . . . . . . . . . . . . . . . . . . . . . . . . . . . . 4
Profile of NGM Study Companies . . . . . . . . . . . . . . . . . . . . . . . . . . . . . . . . . . . . . . . . . . . . . . . . . . . 6
Profitability, Leadership, and Investments . . . . . . . . . . . . . . . . . . . . . . . . . . . . . . . . . . . . . . . . . . . . 7
Customer-Focused Innovation . . . . . . . . . . . . . . . . . . . . . . . . . . . . . . . . . . . . . . . . . . . . . . . . . . . . . 8
Engaged People/Human-Capital Acquisition, Development, and Retention . . . . . . . . . . . . . . . . . . . 11
Superior Processes/Improvement Focus . . . . . . . . . . . . . . . . . . . . . . . . . . . . . . . . . . . . . . . . . . . . 14
Supply-Chain Management and Collaboration . . . . . . . . . . . . . . . . . . . . . . . . . . . . . . . . . . . . . . . . 17
Sustainability . . . . . . . . . . . . . . . . . . . . . . . . . . . . . . . . . . . . . . . . . . . . . . . . . . . . . . . . . . . . . . . . 20
Global Engagement . . . . . . . . . . . . . . . . . . . . . . . . . . . . . . . . . . . . . . . . . . . . . . . . . . . . . . . . . . . . 23
Going Forward . . . . . . . . . . . . . . . . . . . . . . . . . . . . . . . . . . . . . . . . . . . . . . . . . . . . . . . . . . . . . . . 26
Methodology . . . . . . . . . . . . . . . . . . . . . . . . . . . . . . . . . . . . . . . . . . . . . . . . . . . . . . . . . . . . . . . . . 27
Table of Contents

© 2011 The MPI Group 3 Next Generation Manufacturing Study
Reading Tables in This Summary
Tables in this summary present overall findings from the NGM Studies in 2011 and 2009 (charts show findings for new questions asked in the 2011 NGM Study). Data is intended to be read down the columns (columns sum to 100% with minor exceptions due to rounding): For example for the table below, in 2011: 31.5% of manufacturers invested less than 1% of sales in new-product development/R&D; 46.4% invested 1-5%; 14.2% invested 6-10%; and 7.9% invested more than 10%.
FigureWhat percentage of sales is invested into new-product development/R&D? 2009 2011<1% 23.1% 31.5%1–5% 44.7% 46.4%6–10% 17.6% 14.2%>10% 14.6% 7.9%

The Next Generation Manufacturing (NGM) Study provides a path for U.S. manufacturers to achieve success in the next generation, offering:
• Strategies that can help them capture competitive advantages,
• Best practices to support execution of those strategies, and
• Performance goals against which to measure their progress.
Following the NGM path — or ignoring it — will likely be the difference between success and failure for individual manufacturers and U.S. manufacturing in general.
Most manufacturers recognize the importance of NGM strategies…
Most manufacturers recognize the importance of NGM strategies (rated 4 or 5 on a scale of 1-5 where 5 equals highly important) to their business success. Manufacturers across the country identify superior process improvement (86% of manufacturers rated it “highly important” or important) and customer-focused innovation (85%) as the most important NGM strategies to their firms’ success over the next five years. The perceived importance of sustainability increased by 24 percentage points since the 2009 NGM Study (Figure 1). The perceived importance of supply-chain management and global engagement also increased. But many firms still ignore NGM strategies or pay little attention.
But manufacturers face an “execution gap”
Many manufacturers are progressing toward world-class status with individual NGM strategies (rated 4 or 5 on a scale of 1-5 where 5 equals world-class), but there is a large execution gap — the difference between the number of firms that recognize the importance of a particular NGM strategy and the number of firms near or at world-class status in that strategy. For example, 72% of manufacturers believe supply-chain management is important or highly important, but only 29% of manufacturers are near or at world-class status in supply-chain management (Figure 2). The execution gap represents a substantial barrier to long-term success for U.S. manufacturing.
Figure 1Rate the importance to your organization’s success over the next five years:(rated 4 or 5 on a scale of 1–5 where 5= highly important)
2009 2011 %-point changeProcess improvement 86.3% 86.5% +0.2Customer-focused innovation 84.6% 84.0% -0.6Human-capital management 76.7% 77.7% +1.0Supply-chain management 68.2% 72.2% +4.0Sustainability 35.1% 59.2% +24.1Global engagement 46.3% 50.4% +4.1
Figure 2Rate your organization’s progress toward world-class: (rated 4 or 5 on a scale of 1–5 where 5= world-class)
2009 2011 %-point changeCustomer-focused innovation 45.5% 43.2% -2.3Process improvement 43.8% 42.7% -1.1Human-capital management 30.5% 30.4% -0.1Supply-chain management 27.6% 29.4% +1.8Sustainability 20.1% 27.5% +7.4Global engagement 24.6% 25.3% +0.7
NGM Study Highlights
Next Generation Manufacturing Study 4 © 2011 The MPI Group
Many manufacturers lack key success factors
Many U.S. manufacturers lack key success factors — talented people, business systems and equipment, company-specific strategy — and face competitive disadvantage. For example:
• “Sufficient leadership and talent” is in place to drive world-class process improvement at 61% of U.S. manu-facturers (the highest percentage among any of the six strategies) — yet many firms report “insufficient talent” and/or lack development programs to grow leadership and talent.
• 82% of manufacturers have business systems and equip-ment to support “current requirements” for customer-focused innovation (the highest percentage among any of the six strategies) — but only a small percentage of manufacturers describe their tools as “state-of-the-art,” capable of providing long-term support for this or other NGM strategies.
• 32% of manufacturers have no strategy for global engagement, 25% have no strategy for sustainability, and 15% have no strategy for human-capital management.

© 2011 The MPI Group 5 Next Generation Manufacturing Study
Small manufacturers face additional challenges
Smaller manufacturers face additional challenges, especially in an era of global manufacturing competition. They often lack the expertise and resources available to larger and more established firms. For example: • 25% of small manufacturers (less than $10 million in
revenues) are near or at world-class supply-chain man-agement vs. 41% of large manufacturers ($100 million or more revenues).
• 10% of small manufacturers have both sufficient talent and skills-development programs to drive world-class human-capital management vs. 33% of large manufacturers.
• 41% of small manufacturers have business systems and equipment able to support current requirements for global engagement vs. 65% of large manufacturers.
A generation of U.S. manufacturing leaders is about to retire
Transformation to a Next Generation Manufacturing model requires leadership consistency in the face of unrelenting competition — yet a majority of U.S. manufacturing firms anticipate a possible change in leadership within the next five years:
• 30% anticipate a planned succession, and
• 29% report a succession is possible.
The percentage of manufacturers reporting a succession or possible succession rose by approximately 5 percentage points since 2009. Among manufacturers with older ex-ecutives, the likelihood of succession is even higher. As ag-ing baby boomers reach retirement age, a next generation of leadership must take their place. U.S. manufacturers should be identifying and developing tomorrow’s leaders today; their actions — or lack thereof — will determine the fates of thousands of U.S. manufacturers.
U.S. manufacturers are looking for help beyond their own walls
Manufacturers — whether small or large — routinely seek external support from outside organizations. And a majority of manufacturers report their organizations have been positively impacted by industry associations; state manufacturing associations (including Manufacturing Extension Partnerships); and consulting firms.
A majority of manufacturers have sought support services (as needed or on an ongoing basis) for:
• Regulatory/compliance issues (67% of manufacturers),
• Operations improvements (64%),
• Workforce skills development (64%),
• Strategic planning (52%),
• Innovation/R&D (52%), and
• Business development (52%).
Sustainability is more important to U.S. manufacturers than it was even two years ago
Manufacturers are far more likely in 2011 to cite sustainability as important to their organizations’ success than they were in 2009: 59% rated it important or highly important in 2011 vs. 35% in 2009. Not surprisingly, the percentage of manufacturers progressing toward world-class sustainability grew as well: 28% of manufacturers reported they were near or at world-class sustainability in 2011 vs. 20% in 2009. Customers are demanding social responsibility, and U.S. firms are beginning to listen. Yet overall sustainability performance results have not improved substantially since 2009. When will green initiatives achieve critical mass among U.S. manufacturers?

Strategy and Practices
The majority of manufacturers participating in the 2011 NGM Study (87%) were privately held companies (Figure 3); 79% of these organizations were
identified as a “company” (Figure 4). Among the largest manufacturers ($100 or more in revenues), 49% were privately held companies and 51% were public companies.
All product-category manufacturers — as identified by three-digit North American Industrial Classification System (NAICS) codes — were represented within the NGM Study sample; industries with the highest percentage of respon-dents were fabricated metal product manufacturing (18%) and machinery manufacturing (16%) (Figure 5).
The NGM Study manufacturers report annual revenues of $12 million (median) and approximately $196.5 million (average), and full-time employees of 60 (median) and 595 (average). These firms have been in operation for 36 years (median) and 44 years (average) (Figures 6-8).
Note: The profile of 2011 NGM Study participants is comparable to 2009 study participants, with no dramatic differences in the profile of the study samples. The similarity of the two samples allows for meaningful year-to-year comparisons throughout this summary.
Figure 7How many full-time employees (and equivalents)? 2009 2011Median 55 60Average 445 59575th Percentile 140 15025th Percentile 21 25
Figure 8
How many years has your organization been in operation? 2009 2011Median 32 36Average 41 4475th Percentile 55 5825th Percentile 19 22
Figure 6What are your approximate annual revenues? 2009 2011Median $10,000,000 $12,000,000Average $159,603,620 $196,493,09175th Percentile $30,000,000 $40,000,00025th Percentile $3,000,000 $4,000,000
Figure 4Which of the following describes your organization? 2009 2011Company 79.8% 78.8%Division/Unit of a larger company 20.2% 21.2%
Profile of NGM Study Companies
Next Generation Manufacturing Study 6 © 2011 The MPI Group
Public
Private
Is your company public or privately held?
2011
87.1%
12.9%
Figure 3
Figure 5Product Category 2009 2011Fabricated Metal Product Mfg. 16.2% 18.0%Machinery Mfg. 16.2% 16.3%Computer and Electronic Product Mfg. 10.0% 11.0%Chemical Mfg. 7.3% 6.9%Transportation Equipment Mfg. 6.5% 6.7%Miscellaneous Mfg. 4.3% 5.8%Plastics and Rubber Products Mfg. 6.6% 5.0%Primary Metal Mfg. 8.3% 5.0%Electrical Equipment, Appliance, and Component Mfg. 2.8% 3.9%Food Mfg. 3.9% 3.9%Furniture and Related Product Mfg. 2.6% 2.9%Paper Mfg. 2.5% 2.4%Nonmetallic Mineral Product Mfg. 2.3% 2.2%Printing and Related Support Activities 2.4% 1.7%Wood Product Mfg. 2.8% 1.3%Textile Mills 1.1% 1.3%Apparel Mfg. 0.9% 1.0%Beverage and Tobacco Product Mfg. 0.3% 0.7%Textile Product Mills 0.7% 0.5%Petroleum and Coal Products Mfg. 0.5% 0.4%Leather and Allied Product Mfg. 0.6% 0.4%Other 1.3% 2.8%

© 2011 The MPI Group 7 Next Generation Manufacturing Study
Four out of five U.S. manufacturers (83%) were profitable in their most recent fiscal year (Figure 9). Profitability was more likely among organizations
with higher revenues:
• Less than $10 million: 75% of companies were profitable.
• $10 million to $99 million: 87% of companies were profitable.
• $100 million or more: 93% of companies were profitable.
More than two-thirds of manufacturers (70%) are led by chief executives over 50 years of age; 27% of manufacturers are led by an executive over 60 years of age. Baby-boomer CEOs and owners are now reaching retirement age (Figure 10).
Aging leadership among manufacturers correlates with planned successions. Overall, 60% of firms anticipate (yes) or see as possible (maybe) a planned leadership succession in the next five years, an increase of more than 5 percentage points from 2009 (Figure 11). Not surprisingly, in organizations where the chief executive is more than 60 years old, 55% of firms anticipate a succession, with 31% reporting that a succession is possible.
A large majority of manufacturers spend less than 5% of sales (three-year average) on capital equipment or information technologies (IT):
• 67% of manufacturers spend less than 5% of sales on capital equipment (Figure 12).
• 91% of manufacturers spend less than 5% on IT (Figure 13).
Figure 10What is the age of your organization’s chief executive?
2009 2011< 30 0.4% 0.4%31–40 5.7% 4.0%41–50 29.8% 25.5%51–60 40.7% 43.1%>60 23.5% 27.0%
Figure 11Do you anticipate a planned succession of leadership in the next five years?
2009 2011Yes 24.9% 30.1%Maybe 29.3% 29.2%No 45.9% 40.7%
Profitability, Leadership, and Investments
Yes
No
Was your company profitable for the most recent fiscal year?
2011
16.9%
83.2%
Figure 9
<1%
1–5%
6–10%
>10%
What is your organization’s investment in capital equipmentas a percentage of sales (three-year average)?
10.8%
56.2%
21.9%
11.1%
2011 <1%
1–5%
6–10%
>10%
What is your organization’s investment in information technologies (hardware and software) as a percentageof sales (three-year average)?
37.1%
53.4%
6.8%
2.7%
2011
Figure 12
Figure 13

Innovation Strategy and Practices
Four out of five manufacturers (84%) recognize the importance of customer-focused innovation (Figure 14).1 Approximately 43% of manufactur-
ers report that they are near or at world-class customer-focused innovation,2 and 5% report no progress toward world-class status (Figure 15).
Three elements necessary for achieving world-class customer-focused innovation are strategy, talent and talent-development programs, and capable business systems and equipment:
• Strategy: Most manufacturers have a company-specific strategy to guide innovation (72%), and 24% define that company-specific strategy as having full functional involvement and buy-in. Approximately 21% have a generic strategy with little or no functional involvement or buy-in, while 7% of firms have no strategy, (Figure 16).
• Talent and development programs: One-quarter of manufacturers (24%) have both talent and development programs to drive customer-focused innovation into the next generation. Two-thirds of manufacturers (64%) report sufficient talent, and 43% have talent-development programs in place. And 17% of firms have neither talent nor development programs (Figure 17).
• Business systems and equipment: Approximately 18% of manufacturers report that their business systems and equipment are state-of-the-art and can support customer-focused innovation long-term. Another 64% report that systems and equipment meet current requirements. One in five manufacturers (18%) have either inadequate systems and equipment or none at all (Figure 18).
Figure 14Rate the importance of customer-focused innovation to your organization’s success over the next five years: 2009 20111=Not important 1.8% 1.2%2 3.6% 4.0%3 10.0% 10.7%4 26.4% 27.0%5=Highly important 58.2% 57.0%
Figure 15Rate your organization’s progress toward world-class customer-focused innovation: 2009 20111=No progress 4.7% 5.4%2 14.9% 16.9%3 34.8% 34.5%4 33.3% 30.9%5=World-class 12.2% 12.3%
Customer-Focused Innovation
Develop, make, and market new products and services that meet customers’ needs at a pace faster than the competition.
Next Generation Manufacturing Study 8 © 2011 The MPI Group
No strategy
Generic strategy with little or nofunctional involvement and buy-in
Company-specific strategy with somefunctional involvement and buy-in
Company-specific strategy with fullfunctional involvement and buy-in
What best describes your customer-focused innovation strategy?
7.4%
2011
20.9%
47.6%
24.2%
Insufficient talent andno development program
Sufficient talent butno development program
Insufficient talent but a developmentprogram in place
Sufficient talent and a developmentprogram in place
Does your organization have the skilled innovation leadershipand talent (e.g., product engineers) and talent-developmentprogram to drive world-class customer-focused innovationinto the next generation?
16.9%
2011
40.0%
19.5%
23.6%
None
Inadequate for current requirements
Adequate but limited tocurrent requirements
State-of-the-art and able to provide long-term support
What best describes the quality of your business systems andequipment to support world-class customer-focused innovation?
2.7%
2011
15.1%
64.4%
17.8%
Figure 16
Figure 17
Figure 18
1 Rated 4 or 5 on a scale of 1–5, where 5 equals “highly important.”2 Rated 4 or 5 on a scale of 1–5, where 5 equals “world-class.”

Approximately 22% of manufacturers invest more than 5% of sales into new-product development/R&D — a drop of 10 percentage points from 2009. This raises concerns about U.S. manufacturers’ ability to meet customer demands for new products faster (Figure 19).
Approximately 29% of manufacturers report regular monitoring and reviews in place to measure return from customer-focused innovation.3 One in five manufacturers (20%) have no measurement systems or reviews, and 36% have only ad hoc monitoring of basic measures and ad hoc reviews (Figure 20).
Innovation Results
The decline in R&D investment may be affecting new-product output. For example, 60% of 2011 manufacturers report that 5% or more of sales are derived from products introduced in the past three years, a drop of 10 percentage points from 2009 (Figure 21).
Most manufacturers commercialize a fraction of their R&D work (based on expenses); in fact, 70% commercialize less than one-quarter of R&D expenses (Figure 23), and 66% achieve game-changing market breakthroughs for less than 5% of their R&D expenses (Figure 24).
Figure 19What percentage of sales is invested into new-product development/R&D? 2009 2011<1% 23.1% 31.5%1–5% 44.7% 46.4%6–10% 17.6% 14.2%>10% 14.6% 7.9%
Figure 20What best describes your measurement system for reviewing return from customer-focused innovation? 2009 2011No measurement system per se or reviews 27.6% 20.2%Ad hoc monitoring of basic measures and ad hoc reviews 31.1% 36.2%Company-specific metrics monitored regularly by operations staff 10.7% 14.4%Regular monitoring and review of company- specific metrics by CEO and senior staff 19.2% 18.5%Regular monitoring and review of company- specific metrics by CEO and senior staff and transparency and clarity throughout the organization 11.4% 10.7%
Figure 21Approximately what percentage of annual sales are derived from products introduced in the past three years (count only new SKUs, not a product iteration or line extension)? 2009 2011<5% 30.4% 40.0%5–25% 45.0% 43.4%26–50% 16.0% 11.5%>50% 8.6% 5.1%
Figure 22How many new products as a percentage of total SKUs are launched annually (count only new SKUs, not a product iteration or line extension)? 2009 2011<5% 57.7% 57.8%5–10% 26.5% 26.6%11–20% 9.6% 10.6%>20% 6.1% 5.1%
© 2011 The MPI Group 9 Next Generation Manufacturing Study
<25%25–50%
51–75%>75%
What percentage of R&D (by expense) is commercialized?
2011
17.6%
6.3%6.0%
70.1%
<5%5–10%
11–25%>25%
What percentage of R&D (by expense) results in“game-changing” market breakthroughs?
2011
20.5%
7.4%5.8%
66.3%
Figure 23
Figure 24
3 “Regular monitoring and review of company-specific metrics by CEO and senior staff” or “Regular monitoring and review of company-specific metrics by CEO and senior staff and transparency and clarity throughout the organization.”

World-Class Innovation
Manufacturers near or at world-class customer-focused innovation are more likely to consider it highly important (72% vs. 46% of manufacturers
furthest from world-class status) and more likely to have a strategy with full functional involvement and buy-in (44% vs. just 9% of manufacturers furthest from world-class status). Manufacturers near or at world-class status also are more likely to have:
• Sufficient talent and development programs to drive world-class innovation,
• State-of-the-art business systems and equipment,
• Higher investments in innovation, and
• Advanced methods to measure return from customer-focused innovation (Figure 25).
Many manufacturers near or at world-class customer- focused innovation emphasize collaboration and commu-nication to address customer requirements. Best practices cited by manufacturers near or at world-class status in customer-focused innovation include:
• “Active study of customer requirements and field experiences.”
• “Business-focused R&D, willingness to spend skunk-works money, no fear of failure.”
Figure 25
World-class strategy and practices Furthest from world-class Near or at world-class customer-focused innovation customer-focused innovation
Rate customer-focused innovation as “highly important” 45.6% 72.0%Company-specific customer-focused innovation strategy
with full functional involvement and buy-in 8.9% 44.2%Sufficient talent and a development program in place to drive
world-class customer-focused innovation into the next generation 11.4% 39.8%Business systems and equipment able to provide long-term support 12.1% 25.4%More than 5% of sales invested into new-product development/R&D 18.0% 27.6%Regular monitoring and review of company-specific metrics to
measure return from customer-focused innovation 14.8% 48.4%
Figure 26
World-class outcomes Furthest from world-class Near or at world-class customer-focused innovation customer-focused innovation
More than 5% of products as a percentage of total SKUs are launched annually 34.5% 52.8%More than 5% of sales derived from products introduced in the past three years 54.2% 68.0%25% or more of R&D (by expense) is commercialized 25.0% 36.5%5% or more of R&D (by expense) results in game-changing
market breakthroughs 23.7% 47.2%
Next Generation Manufacturing Study 10 © 2011 The MPI Group
• “Close-coupling of design and manufacturing engineers with production personnel and supply-chain experts.”
• “Customer problem-solving with fully integrated services
— from development through distribution to customer
— under one roof.”
• “Dedicated innovation team, routine innovation training, skilled staff [with] unique technical or process skills, market researcher on staff, measurements on innovation spend and project tracking, corporate tag line ‘passion for innovation.’”
• “Flat organizational structure allowing ease of communi-cation between sales and customer service and technical staff to create solutions for customer requests.”
• “Organizational culture and structure is positioned for effective responsiveness to customer-driven innovation.”
Most important, the strategies and practices of manufactur-ers near or at world-class customer-focused innovation drive better results. For example, 68% of manufacturers near or at world-class status derive more than 5% of sales from products introduced in the past three years vs. just 44% of manufacturers furthest from world-class status (Figure 26).

© 2011 The MPI Group 11 Next Generation Manufacturing Study
Human-Capital Strategy and Practices
Approximately 78% of manufacturers recognize the importance of human-capital acquisition, develop-ment, and retention (Figure 27).4 Yet only 30% of
manufacturers report that they are near or at world-class human-capital management,5 and 9% report no progress toward world-class status (Figure 28).
Three elements necessary for world-class human-capital management are strategy, talent and talent-development programs, and capable business systems and equipment:
• Strategy: Half of manufacturers have a company-specific strategy for human-capital management (56%), but only 13% define that company-specific strategy as having full functional involvement and buy-in. Approximately 29% have a generic strategy with little or no functional involve-ment or buy-in, while 15% of firms have no strategy (Figure 29).
• Talent and development programs: Only 19% of firms have both talent and development programs in place to drive human-capital management into the next genera-tion. A majority (57%) of firms report sufficient talent, and 29% have talent-development programs. And 33% of firms have neither talent nor development programs. (Figure 30).
• Business systems and equipment: Just 9% of manufac-turers report that their business systems and equipment are state-of-the-art and can support human-capital management long-term. Another 58% report that systems and equipment meet current requirements. One-third of manufacturers (33%) have either inadequate systems and equipment or none at all (Figure 31).
Figure 27Rate the importance of human-capital acquisition, development, and retention to your organization’s success over the next five years: 2009 20111=Not important 2.5% 2.0%2 6.1% 5.4%3 14.6% 15.0%4 30.8% 29.0%5=Highly important 45.9% 48.7%
Figure 28Rate your organization’s progress toward world-class human-capital acquisition, development, and retention: 2009 20111=No progress 9.4% 8.9%2 22.5% 23.4%3 37.6% 37.3%4 24.4% 26.5%5=World-class 6.1% 3.9%
Engaged People/Human-Capital Acquisition, Development, and Retention
Secure a competitive performance advantage by having superior systems in place to recruit, hire, develop, and retain talent.
No strategy
Generic strategy with little or nofunctional involvement and buy-in
Company-specific strategy with somefunctional involvement and buy-in
Company-specific strategy with fullfunctional involvement and buy-in
What best describes your human-capital management strategy?
15.1%
2011
28.6%
43.8%
12.5%
Insufficient talent andno development program
Sufficient talent butno development program
Insufficient talent but a developmentprogram in place
Sufficient talent and a developmentprogram in place
Does your organization have the skilled innovation leadershipand talent (e.g., product engineers) and talent-developmentprogram to drive world-class human-capital management into the next generation?
32.8%
2011
38.5%
10.3%
18.5%
Figure 29
Figure 30
4 Rated 4 or 5 on a scale of 1–5, where 5 equals “highly important.”5 Rated 4 or 5 on a scale of 1–5, where 5 equals “world-class.”
None
Inadequate for current requirements
Adequate but limited tocurrent requirements
State-of-the-art and able to provide long-term support
What best describes the quality of your business systems and equipment to support world-class HR?
12.4%
2011
20.9%
57.6%
9.2%
Figure 31

Next Generation Manufacturing Study 12 © 2011 The MPI Group
Almost half of manufacturers (47%) report that a majority of their workers are capable of excelling in high-performance work teams (Figure 32). Some 42% percent of manufac-turers report that they have established skill standards and aligned training to those standards for a majority of workforce positions (Figure 33). Surprisingly, however, 29% of firms still train each employee 8 hours or fewer annually (Figure 34).
Only 20% of manufacturers report regular monitoring and reviews to measure return from human-capital management. One in four manufacturers (27%) have no measurement systems or reviews, and 35% have ad hoc monitoring and ad hoc reviews (Figure 35).
Human-Capital Results
Approximately 28% of manufacturers report value-added per employee ([sales – cost of materials] ÷ number of employees) of more than $125,000, comparable to NGM Study findings in 2009 (Figure 36). One-third of manufacturers (32%) report labor turnover of 1% or less, an improvement of nearly 4 percentage points from 2009 (Figure 37).
Figure 36What is your value-added per employee ([sales – cost of materials] ÷ number of employees)? 2009 2011< $75,000 34.9% 39.6%$75,000–$125,000 37.1% 32.4%$125,001–$175,000 17.2% 17.6%> $175,000 10.8% 10.3%
Figure 37What is your organization’s annual labor turnover rate (number of voluntary and involuntary separations ÷ typical staffing level)? 2009 20110% 8.2% 6.7%0.1–1% 21.1% 25.1%1.1–5% 32.6% 35.2%5.1–10% 24.5% 24.2%>10% 13.6% 8.8%
Figure 34How many formal training hours are devoted annually to each employee? 2009 20118 or fewer 29.6% 29.3%9–20 41.1% 38.8%21–40 18.8% 21.7%>40 10.5% 10.2%
Figure 35What best describes your measurement system for reviewing return from human-capital acquisition, development, and retention? 2009 2011No measurement system per se or reviews 29.1% 27.2%Ad hoc monitoring of basic measures and
ad hoc reviews 33.7% 35.3%Company-specific metrics monitored
regularly by operations staff 13.5% 18.0%Regular monitoring and review of company-
specific metrics by CEO and senior staff 17.2% 12.8%Regular monitoring and review of company-
specific metrics by CEO and senior staff and transparency and clarity throughout the organization 6.5% 6.7%
<25%76–90%
51–75%
>90%
What percentage of employees have the technical skills,problem-solving skills, and work ethic to excel in high-performance work teams?
2011
25.8%
14.6%
6.4%
22.0%
25–50%31.3%
No established skill standards
Skill standards and trainingalignment for a few positions
Skill standards and training alignmentfor majority of positions
Skill standards and training alignment for all positions
To what degree has your organization established skillstandards and aligned training with employee mastery of these skill standards?
16.9%
2011
40.7%
34.7%
7.7%
Figure 32
Figure 33

© 2011 The MPI Group 13 Next Generation Manufacturing Study
World-Class Human Capital
Manufacturers near or at world-class human-capital management are more likely to consider it highly important (68% vs. 41% of manufacturers
furthest from world-class status) and more likely to have a company-specific human-capital strategy with full functional involvement and buy-in (28% vs. just 6% of manufacturers furthest from world-class status). Manufacturers near or at world-class status also are more likely to have:
• Sufficient talent and development programs to drive world-class human-capital management,
• State-of-the-art business systems and equipment,
• Employees equipped to excel in high-performance teams, and
• Advanced methods to measure return from human-capital management (Figure 38).
Many manufacturers near or at world-class human-capital management accurately assess employees’ skill levels, identify skills necessary for organizational success, and then focus training on closing gaps between the two.
Figure 38
World-class strategy and practices Furthest from world-class Near or at world-class human-capital management human-capital management
Rate human-capital management as “highly important” 40.7% 67.5%Company-specific human-capital management strategy
with full functional involvement and buy-in 5.9% 28.0%Sufficient talent and a development program in place to drive
world-class customer-focused innovation into the next generation 9.6% 38.9%Business systems and equipment able to provide long-term support 5.2% 18.7%Majority of employees with capabilities to excel in
high-performance work teams 37.1% 69.9%Training each employee more than 20 hours annually 25.7% 46.3%Skills standards and training alignment for at least a majority of the positions 32.8% 64.2%Regular monitoring and review of company-specific metrics to
measure return from human-capital management 11.6% 38.2%
Figure 39
World-class outcomes Furthest from world-class Near or at world-class human-capital management human-capital management
Value-added per employee of more than $125,000 24.8% 35.5%Annual labor turnover of 5% or less 65.5% 70.1%
Best-practices for human-capital management cited by those near or at world-class status include:
• “Annually review employee goals for work and self and provide training as needed.”
• “Employees are hired at all levels of expertise and provided opportunities to increase their value with advance training programs at all levels with recognition and opportunities to advance.”
• “Performance reviews and written plans for skill development.”
• “Provide people [the] opportunities to grow, and promote from within. Give them the resources and training to do their job, and get out of their way.”
• “Thorough understanding of job description and skills required, [and] keeping staff current in training and well-apprised of company strategic plan for growth.”
The strategies and practices of manufacturers near or at world-class human-capital management drive better results. For example, manufacturers near or at world-class status have higher value-added per employee and lower annual labor turnover (Figure 39).

Process Improvement Strategy and Practices
Approximately 87% of manufacturers recognize the importance of process improvement (Figure 40).7 Approximately 43% of manufacturers report that they
are near or at world-class process improvement; 8 5% of firms report no progress toward world-class status (Figure 41).
Three elements necessary for world-class process improvement are strategy, talent and talent-development programs, and capable business systems and equipment:
• Strategy: Three-fourths of manufacturers (73%) have a company-specific strategy for process improvement, and 26% define that company-specific strategy as having full functional involvement and buy-in. Approximately 21% have a generic strategy with little or no functional involvement or buy-in, and 6% of firms have no strategy (Figure 42).
• Talent and development programs: One-quarter of firms (25%) have both talent and development programs in place to drive continuous operations improvement into the next generation. A majority (61%) of firms report sufficient talent, and 44% have talent-development programs. And 20% of firms have neither talent nor development programs (Figure 43).
• Business systems and equipment: Approximately 14% of manufacturers report that their business systems and equipment are state-of-the-art and can support continuous operations improvement long-term. Another 63% report that systems and equipment meet current requirements. One-quarter of manufacturers (24%) have either inadequate systems and equipment or none at all (Figure 44).
Figure 40Rate the importance of process improvement to your organization’s success over the next five years: 2009 20111=Not important 0.8% 0.4%2 2.8% 4.2%3 10.1% 8.9%4 26.5% 29.8%5=Highly important 59.8% 56.7%
Figure 41Rate your organization’s progress toward world-class processes and process improvement: 2009 20111=No progress 3.3% 4.6%2 16.3% 17.2%3 36.6% 35.5%4 33.2% 35.7%5=World-class 10.6% 7.0%
Superior Processes/Improvement Focus
Record annual productivity and quality gains that exceed the competition through a companywide commitment to continuous improvement.
Next Generation Manufacturing Study 14 © 2011 The MPI Group
No strategy
Generic strategy with little or nofunctional involvement and buy-in
Company-specific strategy with somefunctional involvement and buy-in
Company-specific strategy with fullfunctional involvement and buy-in
What best describes your continuous-improvement (CI) strategy?
5.9%
2011
20.8%
47.2%
26.0%
None
Inadequate for current requirements
Adequate but limited tocurrent requirements
State-of-the-art and able to provide long-term support
What best describes the quality of your business systems andequipment to support continuous operations improvement?
4.9%
2011
18.9%
62.7%
13.5%
Insufficient talent andno development program
Sufficient talent butno development program
Insufficient talent but a developmentprogram in place
Sufficient talent and a developmentprogram in place
Does your organization have the skilled innovation leadershipand talent (e.g., CI experts, black belts, lean experts) and talent-development program to drive world-class human-capital management into the next generation?
20.3%
2011
36.1%
18.7%
24.9%
Figure 42
Figure 44
Figure 43
7 Rated 4 or 5 on a scale of 1–5, where 5 equals “highly important.”8 Rated 4 or 5 on a scale of 1–5, where 5 equals “world-class.”

Approximately 45% of manufacturers report that a majority of their workforces are fully engaged in their organization’s specific improvement methodologies, but one-third (34%) have less than a quarter of the workforce fully engaged (Figure 45).
Approximately 35% of manufacturers report regular moni-toring and reviews in place to measure return from process improvement.9 About 29% have ad hoc monitoring and ad hoc reviews, and 15% have no measurement systems or reviews (Figure 46).
Process Improvement Results
Four out of five manufacturers (83%) describe their cus-tomers’ satisfaction as favorable.10 Only 2% of firms indicate customers are threatening to pull business (Figure 47).
Half of manufacturers (52%) report that 96% or more of deliveries reach customers in perfect order (on time, high quality, to all customer specifications). But many firms struggle, as 24% of manufacturers report that 90% or less of deliveries are perfect (Figure 48).
A key objective for process improvement is to boost produc-tivity. Over the past three years, half of manufacturers (54%) have improved productivity (e.g., value-add) by more than 25%, a slightly lower percentage than in 2009 (Figure 49).
© 2011 The MPI Group 15 Next Generation Manufacturing Study
Figure 45What percentage of your workforce has been fully engaged in your organization’s specific improvement methodologies? 2009 2011<25% 33.3% 34.1%25–50% 22.8% 21.2%51–75% 19.4% 18.6%76–99% 15.1% 17.0%100% 9.5% 9.0%
Figure 46What best describes your measurement system for reviewing return from process improvement? 2009 2011No measurement system per se or reviews 16.8% 14.5%Ad hoc monitoring of basic measures and
ad hoc reviews 29.3% 29.3%Company-specific metrics monitored
regularly by operations staff 19.8% 21.4%Regular monitoring and review of company-
specific metrics by CEO and senior staff 21.5% 21.4%Regular monitoring and review of company-
specific metrics by CEO and senior staff and transparency and clarity throughout the organization 12.7% 13.3%
Figure 47Describe your customers’ satisfaction with your overall performance: 2009 2011Threatens to pull business because 1.8% 1.9%
we don’t match the competitionIndifferent to buying our product or
competitors 4.7% 5.4%Preference for our products by virtue
of price, quality, and delivery performance 45.7% 44.0%Strong loyalty to our products due to
ongoing trust in our organization’s people and capabilities 47.7% 48.8%
Figure 48What percentage of deliveries reach customers in perfect order (on time, high quality, to all customer specifications)? 2009 2011<80% 6.6% 5.5%80–90% 14.7% 18.2%91–95% 21.1% 24.2%96–98% 28.8% 25.2%>98% 28.8% 27.0%
Figure 49By what percentage has productivity (i.e., value add) improved over the past three years? 2009 2011<25% 43.3% 46.2%26–50% 34.2% 33.7%51–75% 14.7% 11.6%76–99% 5.7% 6.5% >100% 2.0% 2.0%9 “Regular monitoring and review of company-specific metrics by CEO and senior staff” or “Regular monitoring and review of company-specific metrics by CEO and senior staff and
transparency and clarity throughout the organization.”10 “Preference for our products by virtue of price, quality, and delivery performance” or “Strong loyalty to our products due to ongoing trust in our organization’s people and capabilities.”

Next Generation Manufacturing Study 16 © 2011 The MPI Group
World-Class Process Improvement
Manufacturers near or at world-class process improvement are more likely to consider it highly important (70% vs. 47% of manufacturers
furthest from world-class status) and more likely to have a company-specific process-improvement strategy with full functional involvement and buy-in (50% vs. 8% of manufac-turers furthest from world-class status). Manufacturers near or at world-class status also are more likely to have:
• Sufficient talent and development programs to drive continuous operations improvement,
• State-of-the-art business systems and equipment,
• A majority of the workforce engaged with improvement methodologies, and
• Advanced methods to measure return from process improvement (Figure 50).
Many manufacturers near or at world-class process improvement have adopted lean operations tools, systems, and principles. Best-practices for process improvement cited by those near or at world-class status include:
• “Be willing to experiment — failure is OK. Try-again mentality.”
Figure 50
World-class strategy and practices Furthest from world-class Near or at world-class process improvement process improvement
Rate process improvement as “highly important” 47.2% 69.5%Company-specific human-capital management strategy
with full functional involvement and buy-in 7.8% 50.1%Sufficient talent and a development program in place to drive
operations improvement into the next generation 9.3% 45.7%Business systems and equipment able to provide long-term support 5.6% 23.8%Majority of workforce fully engaged in organization’s
specific improvement methodologies 27.3% 68.3%Regular monitoring and review of company-specific metrics to
measure return from process improvement 18.0% 56.7%
Figure 51
World-class outcomes Furthest from world-class Near or at world-class process improvement process improvement
96% or more of deliveries are perfect (on time, high quality, to all customer specifications) 43.4% 64.3%
Customers have strong loyalty to products due to ongoing trust in organization’s people and capabilities 43.1% 56.2%
Productivity improved by 25% or more over past three years 45.0% 66.1%
• “Business-system development meetings every two weeks to develop and improve business and process systems.”
• “CIP [continuous improvement process] meetings weekly in every area, standups daily, VSM [value-stream mapping] all areas, policy deployment two layers in.”
• “Continuous improvement using lean and ISO quality systems.”
• “Design new (and modify existing) processes to deliver value (as defined by the customer) without waste (seven types), allowing problems to come to the surface quickly.”
• “Employee input through a variety of formal and informal formats (i.e., brainstorming session, FMEAs [failure mode and effect analysis], kaizen events).”
• “Hoshin kanri/policy/strategy deployment to ensure that operational and office improvements are in harmony with (and support) key corporate initiatives.”
• “Lean approach to all processes and problem solving with planned kaizen events that are followed with measured results.”
The strategies and practices of manufacturers near or at world-class process improvement drive better results. For example, manufacturers near or at world-class status are more likely to have perfect deliveries and to develop loyal customer bases (Figure 51).
© 2011 The MPI Group 17 Next Generation Manufacturing Study
Supply-Chain Strategy and Practices
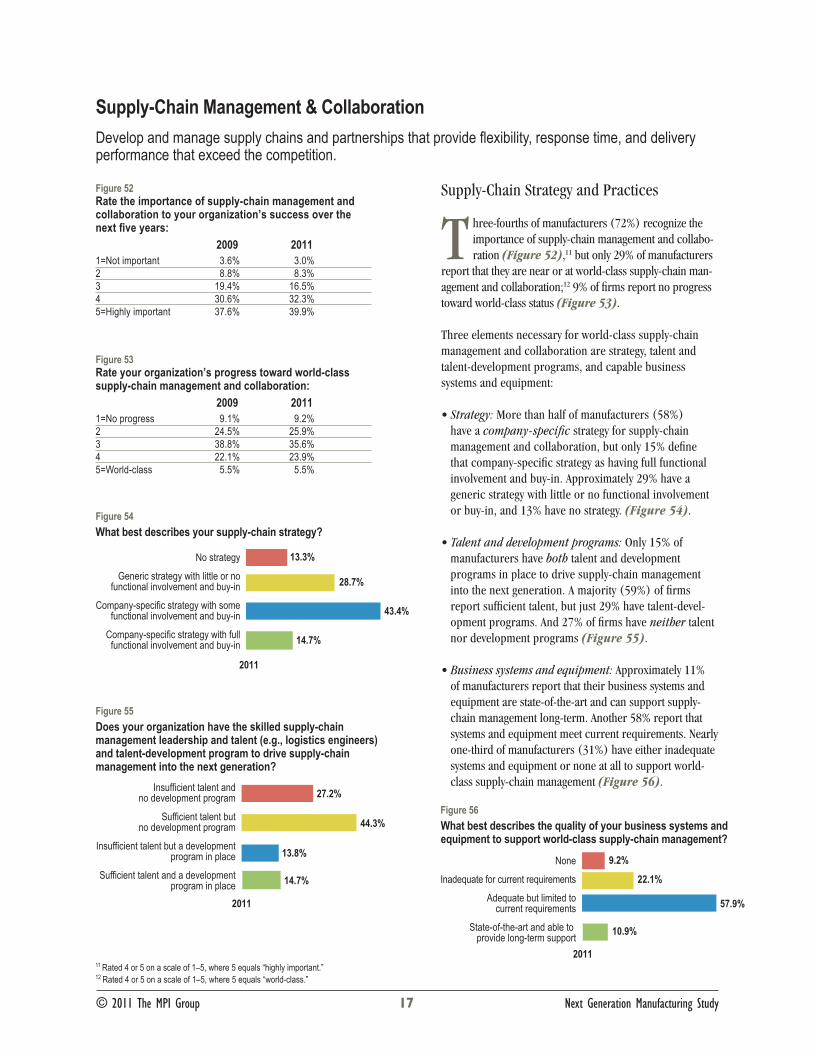
Three-fourths of manufacturers (72%) recognize the importance of supply-chain management and collabo-ration (Figure 52),11 but only 29% of manufacturers
report that they are near or at world-class supply-chain man-agement and collaboration;12 9% of firms report no progress toward world-class status (Figure 53).
Three elements necessary for world-class supply-chain management and collaboration are strategy, talent and talent-development programs, and capable business systems and equipment:
• Strategy: More than half of manufacturers (58%) have a company-specific strategy for supply-chain management and collaboration, but only 15% define that company-specific strategy as having full functional involvement and buy-in. Approximately 29% have a generic strategy with little or no functional involvement or buy-in, and 13% have no strategy. (Figure 54).
• Talent and development programs: Only 15% of manufacturers have both talent and development programs in place to drive supply-chain management into the next generation. A majority (59%) of firms report sufficient talent, but just 29% have talent-devel-opment programs. And 27% of firms have neither talent nor development programs (Figure 55).
• Business systems and equipment: Approximately 11% of manufacturers report that their business systems and equipment are state-of-the-art and can support supply-chain management long-term. Another 58% report that systems and equipment meet current requirements. Nearly one-third of manufacturers (31%) have either inadequate systems and equipment or none at all to support world-class supply-chain management (Figure 56).
Figure 52Rate the importance of supply-chain management and collaboration to your organization’s success over the next five years: 2009 20111=Not important 3.6% 3.0%2 8.8% 8.3%3 19.4% 16.5%4 30.6% 32.3%5=Highly important 37.6% 39.9%
Figure 53Rate your organization’s progress toward world-class supply-chain management and collaboration: 2009 20111=No progress 9.1% 9.2%2 24.5% 25.9%3 38.8% 35.6%4 22.1% 23.9%5=World-class 5.5% 5.5%
Supply-Chain Management & Collaboration
Develop and manage supply chains and partnerships that provide flexibility, response time, and delivery performance that exceed the competition.
No strategy
Generic strategy with little or nofunctional involvement and buy-in
Company-specific strategy with somefunctional involvement and buy-in
Company-specific strategy with fullfunctional involvement and buy-in
What best describes your supply-chain strategy?
13.3%
2011
28.7%
43.4%
14.7%
None
Inadequate for current requirements
Adequate but limited tocurrent requirements
State-of-the-art and able to provide long-term support
What best describes the quality of your business systems and equipment to support world-class supply-chain management?
9.2%
2011
22.1%
57.9%
10.9%
Insufficient talent andno development program
Sufficient talent butno development program
Insufficient talent but a developmentprogram in place
Sufficient talent and a developmentprogram in place
Does your organization have the skilled supply-chain management leadership and talent (e.g., logistics engineers) and talent-development program to drive supply-chain management into the next generation?
27.2%
2011
44.3%
13.8%
14.7%
Figure 54
Figure 56
Figure 55
11 Rated 4 or 5 on a scale of 1–5, where 5 equals “highly important.”12 Rated 4 or 5 on a scale of 1–5, where 5 equals “world-class.”

Next Generation Manufacturing Study 18 © 2011 The MPI Group
One-quarter of manufacturers (27%) spend more than 25% of staff time and resources expediting, firefighting, resolving conflicts with customers and suppliers, etc., rather than strategic procurement and supply-chain planning and partnering. One-quarter of firms (23%) spend less than 5% of their time expediting, firefighting, and resolving conflicts. (Figure 57).
Only 25% of manufacturers report regular monitoring and reviews in place to measure return from supply-chain management.13 One-third (31%) have ad hoc monitoring and ad hoc reviews, and 22% have no measurement systems or reviews (Figure 58).
Supply-Chain Results
Half of firms (53%) indicate their supply chain is able to respond to unexpected customer demand for existing products without delivery delays or excessive inventory (Figure 59). The total value of inventory throughout the supply chain has been reduced 10% or more by half of manufacturers (51%) (Figure 60).
Only 20% of manufacturers indicate that strategic suppliers and customers represent a competitive advantage to their supply chain, and just 4% say these supply-chain partners participate fully in strategic planning and identifying and responding to new markets (Figure 61).
Figure 61How is your supply chain a competitive advantage in terms of flexibility and speed to the marketplace? 2009 2011Suppliers regularly measured on cost, quality,
and delivery performance 34.9% 38.6%Suppliers regularly measured on cost, quality,
and delivery performance as well as total acquisition cost 11.8% 11.0%
Suppliers regularly measured on cost, quality, and delivery performance as well as total acquisition cost and “soft” qualities (e.g., trust, flexibility) 30.7% 30.0%
Strategic suppliers and customers are active participants in our operations, continuous improvement, and product development efforts 17.2% 16.6%
Strategic suppliers and customers are active participants in our operations, continuous improvement, and product development efforts and participate fully in strategic planning and identifying and responding to new markets 5.5% 3.8%
Figure 58What best describes your measurement system for reviewing return from supply-chain management and collaboration? 2009 2011No measurement system per se or reviews 26.2% 21.5%Ad hoc monitoring of basic measures and
ad hoc reviews 30.9% 31.1%Company-specific metrics monitored
regularly by operations staff 18.5% 22.9%Regular monitoring and review of company-
specific metrics by CEO and senior staff 17.5% 15.6%Regular monitoring and review of company-
specific metrics by CEO and senior staff and transparency and clarity throughout the organization 6.9% 8.9%
Figure 59What best describes your end-to-end supply chain’s ability to respond to unexpected customer demand for existing products? 2009 2011Major delays communicating demand signal
throughout chain and most suppliers struggle to efficiently meet demand — standard delivery times dramatically exceeded and/or excessive inventory 4.4% 6.8%
Minor delays in communicating demand signal throughout chain and some suppliers struggle to efficiently meet demand — standard delivery time exceeded and/or too much inventory 33.0% 40.0%
Efficient communication of demand signal throughout chain with most suppliers efficiently satisfying demand — standard delivery times nearly met and right-sized inventories 50.1% 44.0%
Real-time communication of demand signal and entire supply chain flexible to demand spikes — standard delivery times consistently met and just-in-time inventories 12.6% 9.2
Figure 60By approximately what percentage has total value of inventory throughout the supply chain for your primary product (furthest supplier to end customer) been reduced over the last three years? 2009 2011<10% 52.8% 49.4%10–25% 33.0% 35.0%26–50% 10.9% 12.0%>50% 3.3% 3.6%
<5%
5–25%
25–50%
>50%
What percentage of staff time and resources is spentexpediting, firefighting, resolving conflicts with customers and suppliers, etc., rather than strategic procurement and supply-chain planning and partnering?
2011
50.3%
19.4%
7.1%
23.3%
Figure 57
13 “Regular monitoring and review of company-specific metrics by CEO and senior staff” or “Regular monitoring and review of company-specific metrics by CEO and senior staff and transparency and clarity throughout the organization.”

© 2011 The MPI Group 19 Next Generation Manufacturing Study
World-Class Supply-Chain Management
Manufacturers near or at world-class supply-chain management are more likely to consider it highly important (61% vs. 31% of manufacturers
furthest from world-class status) and more likely to have a company-specific supply-chain management strategy with full functional involvement and buy-in (38% vs. 5% of manufacturers furthest from world-class status).
Manufacturers near or at world-class status also are more likely to have:
• Sufficient talent and development programs for world-class supply-chain management,
• State-of-the-art business systems and equipment,
• Strategic supply-chain procurement and partnering (instead of expediting, firefighting, resolving conflicts, etc.), and
• Advanced methods to measure return from supply-chain management and collaboration (Figure 62).
Many manufacturers near or at world-class supply-chain management have close, partnering relationships with customers and suppliers. Best-practices cited by those near or at world-class status include:
Figure 62
World-class strategy and practices Furthest from world-class Near or at world-class supply-chain management supply-chain management
Rate supply-chain management and collaboration as “highly important” 31.2% 60.6%Company-specific supply-chain strategy with
full functional involvement and buy-in 4.7% 38.0%Sufficient talent and a development program in place to drive
world-class supply-chain management into the next generation 4.8% 37.3%Business systems and equipment able to provide long-term support 6.2% 21.6%Spend less than 25% of staff time and resources expediting, firefighting,
and resolving conflicts with customers and suppliers 70.4% 80.4%Regular monitoring and review of company-specific metrics to measure
return from supply-chain management and collaboration 13.7% 50.2%
Figure 63
World-class outcomes Furthest from world-class Near or at world-class supply-chain management supply-chain management
Able to respond to unexpected customer demand for existing products without delivery delays or excessive inventory 42.7% 77.1%
Total value of inventory throughout the supply chain has been reduced by 10% or more 47.4% 58.5%
Strategic suppliers and customers are competitive advantage 12.2% 39.4%
• “Close personal and professional relationships, long histories with most of our key vendors.”
• “Constant communication of forecast and strategy.”
• “Continuous communication with suppliers and active collaboration as growth and distribution increases.”
• “Ensure sufficient lead-time estimations, including potential issues before they occur to eliminate the need to scramble to solve an issue. Preemptive planning is always in the forefront.”
• “Joint development between our company and supplier — constant verbal and written communication.”
• “Maintaining strong relationships with suppliers and dealers.”
• “Supplier scorecard, tracking poor performers with corrective actions.”
• “We work extremely closely with our key suppliers and meet with them on a regular basis to discuss issues and provide feedback.”
The strategies and practices of manufacturers near or at world-class supply-chain management drive better results. For example, 77% of firms near or at world-class status are able to respond to unexpected customer demand for existing products without delivery delays or excessive inventory, vs. 43% of manufacturers furthest from world-class status (Figure 63).
Sustainability Strategies and Practices
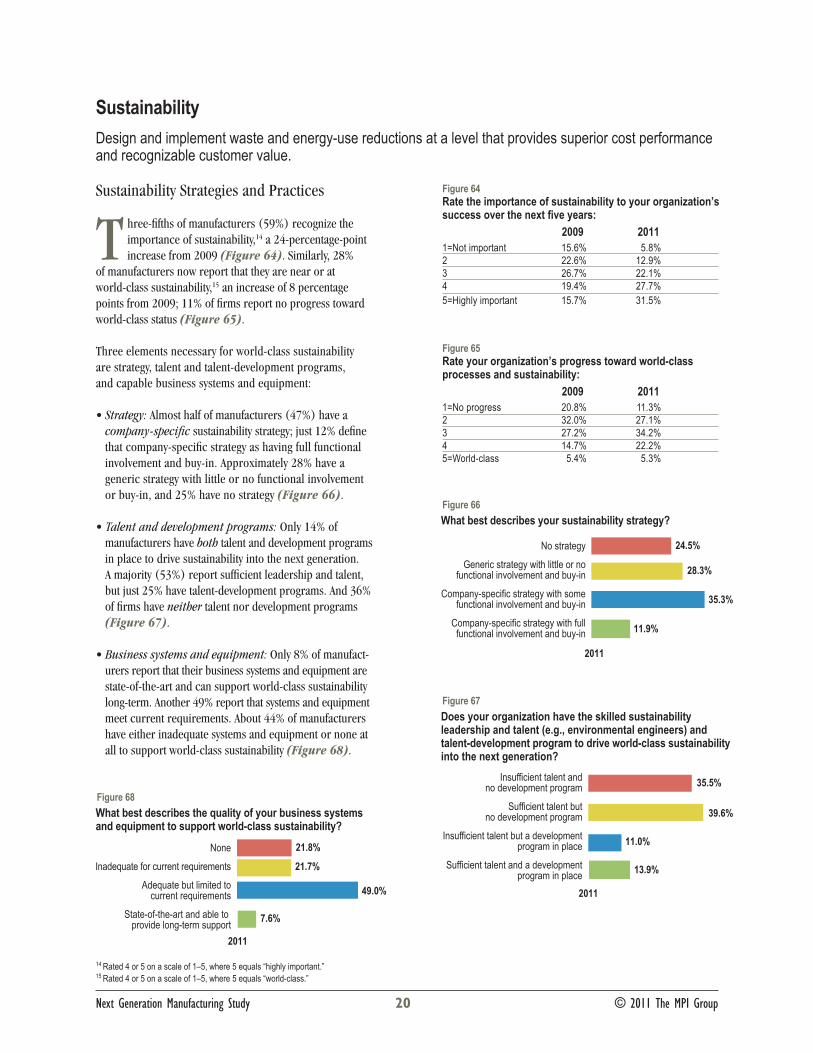
Three-fifths of manufacturers (59%) recognize the importance of sustainability,14 a 24-percentage-point increase from 2009 (Figure 64). Similarly, 28%
of manufacturers now report that they are near or at world-class sustainability,15 an increase of 8 percentage points from 2009; 11% of firms report no progress toward world-class status (Figure 65).
Three elements necessary for world-class sustainability are strategy, talent and talent-development programs, and capable business systems and equipment:
• Strategy: Almost half of manufacturers (47%) have a company-specific sustainability strategy; just 12% define that company-specific strategy as having full functional involvement and buy-in. Approximately 28% have a generic strategy with little or no functional involvement or buy-in, and 25% have no strategy (Figure 66).
• Talent and development programs: Only 14% of manufacturers have both talent and development programs in place to drive sustainability into the next generation. A majority (53%) report sufficient leadership and talent, but just 25% have talent-development programs. And 36% of firms have neither talent nor development programs (Figure 67).
• Business systems and equipment: Only 8% of manufact-urers report that their business systems and equipment are state-of-the-art and can support world-class sustainability long-term. Another 49% report that systems and equipment meet current requirements. About 44% of manufacturers have either inadequate systems and equipment or none at all to support world-class sustainability (Figure 68).
Figure 64Rate the importance of sustainability to your organization’s success over the next five years: 2009 20111=Not important 15.6% 5.8%2 22.6% 12.9%3 26.7% 22.1%4 19.4% 27.7%5=Highly important 15.7% 31.5%
Figure 65Rate your organization’s progress toward world-class processes and sustainability: 2009 20111=No progress 20.8% 11.3%2 32.0% 27.1%3 27.2% 34.2%4 14.7% 22.2%5=World-class 5.4% 5.3%
Sustainability
Design and implement waste and energy-use reductions at a level that provides superior cost performance and recognizable customer value.
Next Generation Manufacturing Study 20 © 2011 The MPI Group
No strategy
Generic strategy with little or nofunctional involvement and buy-in
Company-specific strategy with somefunctional involvement and buy-in
Company-specific strategy with fullfunctional involvement and buy-in
What best describes your sustainability strategy?
24.5%
2011
28.3%
35.3%
11.9%
None
Inadequate for current requirements
Adequate but limited tocurrent requirements
State-of-the-art and able to provide long-term support
What best describes the quality of your business systems and equipment to support world-class sustainability?
21.8%
2011
21.7%
49.0%
7.6%
Insufficient talent andno development program
Sufficient talent butno development program
Insufficient talent but a developmentprogram in place
Sufficient talent and a developmentprogram in place
Does your organization have the skilled sustainability leadership and talent (e.g., environmental engineers) and talent-development program to drive world-class sustainability into the next generation?
35.5%
2011
39.6%
11.0%
13.9%
Figure 66
Figure 68
Figure 67
14 Rated 4 or 5 on a scale of 1–5, where 5 equals “highly important.”15 Rated 4 or 5 on a scale of 1–5, where 5 equals “world-class.”

Only 17% of manufacturers report regular monitoring and reviews in place to measure return from sustainability efforts,16 yet this represents a 4-percentage-point increase from 2009. One in three manufacturers (30%) have ad hoc monitoring and ad hoc reviews, and 37% have no measure-ment systems or reviews (a 16-percentage-point improve-ment vs. 2009) (Figure 69).
Sustainability Results
Despite increased awareness among manufacturers about sustainability, there has been little change in sustainability results since 2009:
• Energy reduction: Just 1% of manufacturers have reduced energy by more than 25%. Four out of five manufacturers (81%) report annual energy reductions (per unit of product output) of less than 10% (Figure 70).
• Recycled materials: Just 5% of manufacturers have re-duced the use of non-recycled material by more than 25%. Three out of four manufacturers (76%) report annual reductions in the usage of non-recycled material (per unit of product output) of less than 10% (Figure 71).
• Recyclable/reusable products: Just 21% of manu-facturers report that 90% or more of their products are completely recyclable/reusable. Three out of five manufacturers (61%) report that less than half of their products (by sales volumes) are completely recyclable/reusable (Figure 72).
Figure 69What best describes your measurement system for reviewing return from sustainability efforts? 2009 2011No measurement system per se or reviews 53.4% 37.0%Ad hoc monitoring of basic measures and
ad hoc reviews 25.0% 30.3%Company-specific metrics monitored
regularly by operations staff 8.4% 15.5%Regular monitoring and review of company-
specific metrics by CEO and senior staff 8.8% 11.7%Regular monitoring and review of company-
specific metrics by CEO and senior staff and transparency and clarity throughout the organization 4.5% 5.6%
Figure 70What is your annual reduction in energy per unit of product output? 2009 2011<10% 83.4% 81.2%10–25% 14.0% 17.4%26–50% 2.1% 1.3%>50% 0.5% 0.1%
Figure 71What is your annual reduction in usage of non-recycled material per unit of product output? 2009 2011<10% 77.6% 76.3%10–25% 16.6% 18.3%26–50% 3.3% 3.8%>50% 2.6% 1.5%
Figure 72What percentage of your products (by sales volume) are completely recyclable/reusable? 2009 2011<50% 59.9% 60.9%51–75% 8.7% 10.0%76–89% 9.5% 8.1%90–99% 13.8% 12.2%100% 8.2% 8.8%
© 2011 The MPI Group 21 Next Generation Manufacturing Study
16 “Regular monitoring and review of company-specific metrics by CEO and senior staff” or “Regular monitoring and review of company-specific metrics by CEO and senior staff and transparency and clarity throughout the organization.”

Next Generation Manufacturing Study 22 © 2011 The MPI Group
World-Class Sustainability
Manufacturers near or at world-class sustainability management are more likely to consider it highly important (61% vs. 20% of manufacturers
furthest from world-class status) and more likely to have a company-specific sustainability strategy with full functional involvement and buy-in (35% vs. 3% of manufacturers furthest from world-class status).
Manufacturers near or at world-class status also are more likely to have:
• Sufficient talent and development programs to drive world-class sustainability,
• State-of-the-art business systems and equipment,
• Advanced methods to measure return from sustainability efforts (Figure 73).
Manufacturers near or at world-class sustainability rely on a variety of approaches. Best practices ranged from use of government and outside organizations to companywide social awareness and action:
• “Accountability through routine and accurate audits including feedback to employees.”
• “Currently ISO 14001 guides our company objectives and targets.”
Figure 73
World-class strategy and practices Furthest from world-class Near or at world-class sustainability sustainability
Rate sustainability as “highly important” 20.4% 60.6%Company-specific sustainability strategy with full functional
involvement and buy-in 3.1% 35.0%Sufficient talent and a development program in place to drive
world-class sustainability into the next generation 5.3% 36.4%Business systems and equipment able to provide long-term support 2.9% 19.6%Regular monitoring and review of company-specific metrics to measure
return from sustainability efforts 6.8% 44.9%
Figure 74
World-class outcomes Furthest from world-class Near or at world-class sustainability sustainability
Reduced annual energy consumption (per unit of product output) by 10% or more 12.6% 35.1%
Reduced annual use of non-recycled materials (per unit of product output) by 10% or more 16.7% 42.1%
Half or more of products (by sales volume) are completely recyclable/reusable 33.6% 54.0%
• “DOE [Department of Energy] Save Energy Now Program.”
• “Involve the entire organization and continue to educate about sustainability.”
• “Major raw materials are sourced from sustainable, certifiable U.S. sources.”
• “Multifaceted approach using a variety of site and man-agement personnel.”
• “Our company has a CSR [corporate social responsibility] and sustainability policy and team in place — retrofitted factory lighting [and] compressors, implemented full scrap recycling, and paper/plastic recycling.”
• “Source locally where possible, use sustainable materi-als, encourage recycling, utilize sustainable agricultural practices, and encourage suppliers to do the same.”
• “We have eliminated the use of fossil fuels for heating, and we have eliminated all landfill waste. In addition, we are an FSC [Forest Stewardship Council] certified plant, and utilize green raw materials wherever possible.”
The strategies and practices of manufacturers near or at world-class sustainability drive better results, with substantial performance advantages over manufacturers furthest from world-class status. For example, 42% of firms near or at world-class sustainability have reduced annual use of non-recycled materials (per unit of product output) by 10% or more, vs. just 17% of manufacturers furthest from world-class status (Figure 74).

© 2011 The MPI Group 23 Next Generation Manufacturing Study
Global Engagement Strategies and Practices
Half of manufacturers (50%) recognize the impor-tance of global engagement,17 a 4-percentage-point increase from 2009 (Figure 75). Approximately
25% of manufacturers report they are near or at being a world-class global player;18 22% of firms report no progress toward world-class status (Figure 76).
Three elements necessary for world-class global engage-ment are strategy, talent and talent-development programs, and capable business systems and equipment:
• Strategy: Approximately 45% of manufacturers have a company-specific global strategy, and 15% define that company-specific strategy as having full functional involvement and buy-in. Approximately 23% have a generic strategy with little or no functional involvement or buy-in, and 32% have no strategy (Figure 77).
• Talent and development programs: Only 15% of manufacturers have both talent and development pro-grams in place to drive global engagement into the next generation. Some 42% of firms report sufficient overseas leadership and talent, and 25% have overseas talent-development programs. Almost half (48%) of manufac-turers have neither talent nor development programs (Figure 78).
• Business systems and equipment: Only 8% of manufac-turers report that their business systems and equipment are state-of-the-art and can support world-class global engagement long-term. Another 44% report that systems and equipment meet current requirements. Nearly half of manufacturers (47%) have either inadequate systems and equipment or none at all to support world-class global engagement (Figure 79).
Figure 75Rate the importance of global engagement to your organi-zation’s success over the next five years: 2009 20111=Not important 18.1% 11.8%2 18.1% 17.5%3 17.5% 20.3%4 18.6% 19.1%5=Highly important 27.7% 31.3%
Figure 76Rate your organization’s progress toward becoming a world-class global player: 2009 20111=No progress 25.8% 22.6%2 28.0% 25.8%3 21.5% 26.4%4 18.1% 19.3%5=World-class 6.5% 6.0%
Global Engagement
Secure business advantages by having people, partnerships, and systems in place capable of engaging global markets and talents better than the competition.
No strategy
Generic strategy with little or nofunctional involvement and buy-in
Company-specific strategy with somefunctional involvement and buy-in
Company-specific strategy with fullfunctional involvement and buy-in
What best describes your global strategy?
32.3%
2011
22.9%
29.5%
15.2%
None
Inadequate for current requirements
Adequate but limited tocurrent requirements
State-of-the-art and able to provide long-term support
What best describes the quality of your business systems and equipment to support world-class global engagement?
29.6%
2011
17.8%
44.3%
8.3%
Insufficient talent andno development program
Sufficient talent butno development program
Insufficient talent but a developmentprogram in place
Sufficient talent and a developmentprogram in place
Does your organization have the skilled overseas leadershipand talent and talent-development program overseas to drive global engagement into the next generation?
47.8%
2011
27.2%
9.8%
15.2%
Figure 77
Figure 79
Figure 78
17 Rated 4 or 5 on a scale of 1–5, where 5 equals “highly important.”18 Rated 4 or 5 on a scale of 1–5, where 5 equals “world-class.”

© 2011 The MPI Group 24 Next Generation Manufacturing Study
More than half of manufacturers (57%) have no direct workforce located overseas and/or located domestically and responsible for global business activities; 9% of manu-facturers have more than one-quarter of their workforces engaged in global business activities (Figure 80).
Only 19% of manufacturers report regular monitoring and reviews in place to measure return from global engagement.19 One in five manufacturers (21%) have ad hoc monitoring and ad hoc reviews, and 51% have no measurement systems or reviews (Figure 81).
Global Engagement Results
The pace of global business for U.S. manufacturers remains brisk:
• Sales volume: One-quarter of manufacturers (27%) report that sales outside the United States have increased by more than 25% in the last three years (Figure 82).
• Production facilities: Approximately 45% of manufac-turers operate or partner in one or more production facilities outside of the United States (Figure 83).
• Sales and/or distribution facilities: Approximately 47% of manufacturers have one or more sales and/or distribution facilities outside of the United States (Figure 84).
Figure 80What percentage of your total direct workforce is located overseas and/or located domestically and responsible for global business activities? 2009 20110% 53.7% 57.0%1–25% 38.5% 35.0%26–50% 4.8% 4.6%>50% 3.0% 3.4%
Figure 81What best describes your measurement system for reviewing return from global engagement? 2009 2011No measurement system per se or reviews 53.9% 51.4%Ad hoc monitoring of basic measures and
ad hoc reviews 17.6% 21.2%Company-specific metrics monitored regularly
by operations staff 9.2% 9.0%Regular monitoring and review of company-
specific metrics by CEO and senior staff 14.4% 13.1%Regular monitoring and review of company-
specific metrics by CEO and senior staff and transparency and clarity throughout the organization 4.8% 5.4%
Figure 82By what percentage has dollar volume of sales outside the United States changed over the past three years? 2009 2011<25% 74.6% 73.0%26–50% 17.4% 19.6%51–100% 5.3% 5.9%>100% 2.7% 1.5%
Figure 83In how many countries outside of the United States does your organization operate or partner in production facilities? 2009 20110 55.5% 54.4%1–5 32.4% 31.6%6–10 5.5% 5.3%>10 6.7% 8.8%
Figure 84In how many countries outside of the United States does your organization have sales and/or distribution facilities? 2009 20110 53.6% 53.3%1–5 29.3% 27.2%6–10 6.3% 7.3%>10 10.8% 12.2%
19 “Regular monitoring and review of company-specific metrics by CEO and senior staff” or “Regular monitoring and review of company-specific metrics by CEO and senior staff and transparency and clarity throughout the organization.”

© 2011 The MPI Group 25 Next Generation Manufacturing Study
World-Class Global Engagement
Manufacturers near or at world-class global engagement are more likely to consider it highly important (68% vs. 19% of manufacturers
furthest from world-class status) and more likely to have a company-specific global strategy with full functional involvement and buy-in (50% vs. 3% of manufacturers furthest from world-class status).
Manufacturers near or at world-class status also are more likely to have:
• Sufficient talent and development programs to drive world-class global engagement,
• State-of-the-art business systems and equipment,
• Staff engaged in global business activities, both domestically and abroad, and
• Advanced methods to measure return from global engagement (Figure 85).
Manufacturers near or at world-class global engagement recognize the need to have physical presences overseas and that partnerships can drive worldwide success. Best-practices cited by firms near or at world-class status include:
• “Continue to develop and nurture licensing programs in Europe and Asia. Begin to utilize the internet to book orders from selected foreign countries throughout the world.”
Figure 85
World-class strategy and practices Furthest from world-class Near or at world-class global engagement global engagement
Rate global engagement as “highly important” 19.1% 67.8%Company-specific global strategy with full functional involvement and buy-in 3.3% 50.0%Sufficient talent and a development program in place to drive
world-class global engagement into the next generation 4.6% 46.3%Business systems and equipment able to provide long-term support 4.2% 20.0%Direct workforce located overseas and/or located domestically and
responsible for global business activities 32.9% 73.6%Regular monitoring and review of company-specific metrics to measure
return from global engagement 8.6% 47.3%
Figure 86
World-class outcomes Furthest from world-class Near or at world-class global engagement global engagement
Sales outside the United States have increased by more than 25% in the last three years 20.0% 48.0%
Operate or partner in production facilities outside of the United States 36.9% 70.8%Sales and/or distribution facilities outside of the United States 37.5% 74.0%
• “Create business units in growing areas like China and India.”
• “Current strategy involves partnership programs with larger OEMs [that] have a strong foothold outside of the U.S.”
• “Devote resources (people, infrastructure, and product development) specifically for global markets.”
• “Expanded global relationships with current U.S. customers.”
• “Local representation with a strong focus on engineering.”
• “Overseas divisions with capable staffing, overseas [representatives], etc., with direct communication.”
• “Partnering with international distribution and manufacturing companies through agreements and private labeling.”
• “Travel and communication with international sales and customers.”
The strategies and practices of manufacturers near or at world-class global engagement drive better results. For example, 48% of firms near or at world-class global engagement have increased sales outside the United States by more than 25% in the last three years, vs. just 20% of manufacturers furthest from world-class status. About 71% of manufacturers near or at world-class status operate or partner in a production facility outside the United States, vs. 37% of firms furthest from world-class status (Figure 86).

Figure 87If you have used outside resources, which of the following have positively impacted your company? 2011Industry association 57.8%State manufacturing associations (including MEPs) 56.1%Consulting firms 54.3%Universities/colleges 41.2%National manufacturing association 24.2%Local/municipal manufacturing associations 24.1%Other 10.0%No positive impact 5.0%
Figure 89How is senior leadership involved outside of your company? 2011Leadership or board position with civic or
charitable organization 46.7%Leadership or board position with industry association 37.4%Leadership or board position with local manufacturing
association 18.5%For-profit board of directors position 18.3%Leadership or board position with state manufacturing
association or MEP 13.8%Leadership, board or teaching position with
university/college 13.0%Leadership or board position with national
manufacturing association 11.5%No outside involvement 28.5%
Figure 88To what extent does your company get support from outside resources for the following activities? Strategic planning Innovation/ R&D Workforce skills Operations improvement Supply-chain development (e.g., lean) development
Never 17.3% 14.9% 8.9% 9.0% 27.7%Rarely 30.9% 33.3% 27.2% 26.8% 35.0%As needed 39.5% 43.2% 49.6% 45.5% 30.7%Ongoing guidance and support 12.4% 8.6% 14.3% 18.7% 6.6% Sustainability Global sales and/or Business Regulatory/ Government initiatives procurement development compliance issues credits/grants
Never 34.5% 34.7% 13.1% 8.9% 24.9%Rarely 31.8% 29.8% 34.7% 24.2% 31.8%As needed 27.2% 29.6% 40.4% 51.9% 35.0%Ongoing guidance and support 6.5% 5.9% 11.8% 15.0% 8.4%
Manufacturers seek outside support to develop their firms, and a majority of manufacturers report that their organizations have been positively impacted
by industry associations (58% of manufacturers); state manufacturing associations including Manufacturing Extension Partnerships (56%); and consulting firms (54%) (Figure 87). Outside support is most frequently sought for:
• Regulatory/compliance issues (67% of manufacturers),
• Operations improvements (64% of manufacturers), and
• Workforce skills development (64% of manufacturers) (Figure 88).
Manufacturing leaders are most likely to be involved outside of their own firms for:
• Leadership or board position(s) with civic or charitable organization (47% of manufacturers),
• Leadership or board position(s) with industry association (37% of manufacturers).
• Leadership or board position(s) with local manufacturing association (19% of manufacturers), and
• For-profit board of directors position(s) (18% of manu-facturers) (Figure 89).
Next Generation Manufacturing Study 26 © 2011 The MPI Group
Going Forward

© 2011 The MPI Group 27 Next Generation Manufacturing Study
T he Next Generation Manufacturing Study was conducted using an online questionnaire. Participants also had access to a PDF version of
the questionnaire, which could be completed and mailed as a hard copy. A total of 824 manufacturers participated. Most responses were received from May through July 2011. Many MEPs across the United States supported the study, using various techniques to promote participation. Responses to the NGM Study were received by the Manu-facturing Performance Institute (MPI), then entered into a database, edited, and cleansed to ensure answers were plausible, where necessary.
All respondent answers to the survey are confidential. As incentives, respondents who provided contact informa-tion were offered a copy of an NGM Performance Report, which shows their individual responses next to categories of respondents with organizational profiles comparable to their own. Respondents who wished to remain anonymous could provide contact information at a separate website and, as their incentive, receive a Data Report of study findings.
Methodology


The MPI Group, Inc.
The Manufacturing Performance Institute, part of The MPI Group, serves leaders with research, advice, and performance-targeted solutions that provide a competitive advantage in today’s fierce marketplace. MPI combines the disciplines of research, strategic advice, knowledge development, and hands-on leadership to create a difference — in performance, in profits, and in the people who make them possible.
P.O. Box 201610Shaker Heights, OH 44120
Phone: 216-991-8390Fax: 216-991-8205
www.mpi-group.net
American Small Manufacturers Coalition
The American Small Manufacturers Coalition (ASMC) is a trade association of manufacturing extension agents who work to improve the innovation and productivity of America’s manufacturing community. ASMC advocates for legislative and programmatic resources that allow its small manufacturing clients to better compete in the global marketplace.
P.O. Box 15289Washington, DC 20003Phone: 202-341-7066
Fax: 202-315-3906www.smallmanufacturers.org
Next Generation ManufacturingNGM
prepared by The Manufacturing Performance Institute
2011 Next Generation Manufacturing Study2011 Next Generation Manufacturing Study
National Executive Summary