
©2011 Laura Nicole Martin ALL RIGHTS RESERVED
178
©2011 Laura Nicole Martin ALL RIGHTS RESERVED
Transcript of ©2011 Laura Nicole Martin ALL RIGHTS RESERVED

©2011
Laura Nicole Martin
ALL RIGHTS RESERVED

Emotion Regulation: Effects on Decision-making and Affective Responses
By Laura Nicole Martin
A Dissertation submitted to the Graduate School-Newark
Rutgers, The State University of New Jersey
in partial fulfillment of the requirements for the degree of
Doctor of Philosophy
Graduate Program in Psychology
written under the direction of
Professor Mauricio R. Delgado
and approved by:
Dr. Mei-Fang Cheng
________________________
Dr. Mauricio R. Delgado
________________________
Dr. Kent Harber
________________________
Dr. Daniela Schiller
________________________
Dr. Elizabeth Tricomi
________________________
Newark, New Jersey
October 2011

ii
ABSTRACT OF THE DISSERTATION
Emotion Regulation: Effects on Decision-making and Affective Responses
By: Laura Nicole Martin
Dissertation Director: Professor Mauricio R. Delgado
Emotions influence our behavior by initiating adaptive response tendencies that
affect our subsequent decision-making. Emotions are often elicited by cues in our
environment that signal potential rewards or punishments. At times the influence of
emotions on behavior can be maladaptive; for instance, the positive emotions elicited by
a reward-conditioned cue (e.g., oster approach behavior (e.g.,
stopping at the drive thru), potentially leading to negative long-term consequences (e.g.,
obesity). One way to promote more goal-directed behavior in the face of environmental
cues may be to engage in emotion regulation, strategies to change the emotions we
experience (Gross, 1998). Previous research has shown that emotion regulation can
increase or decrease the intensity of both positive and negative emotions (Ochsner &
Gross, 2008). Researchers have begun to apply emotion regulation techniques to
decision-making (Sokol-Hessner et al, 2009; Seo and Barrett, 2007), but little is known
about the neural circuitry underlying the modulatory influences cognitive strategies have
on decisions.

iii
The current experiments probed emotion regulation of cues associated with
monetary rewards or punishments and effects on subsequent decision-making and
affective response. Experiments 1 -3 examined the effect of emotion regulation strategies
on decision-making. Imagery-focused regulation decreased risk-taking and associated
striatum activity in Experiment 1, which tested simple financial decisions. In Experiment
2, the financial decisions were more complex, and the imagery strategy no longer
affected risk-taking, suggesting this strategy is best suited to simple contexts.
Experiment 3 showed that cognitive reappraisal regulation was effective with more
complex decisions; reappraisal increased and decreased risk-taking, depending on the
goal of the strategy. Experiment 4 examined the effect of regulation on emotions
associated with loss cues. Here, imagery-focused regulation recruited cortical brain
regions and ameliorated negative emotion experienced when faced with a cue signaling
an unavoidable monetary loss. Taken together, the potential significance of these studies
lies in understanding how individuals can employ regulation strategies to their benefit
either by changing their decision-making in the face of potential rewards or by altering
their subjective experience of emotion in negative situations in which they have no
control over the outcomes.

iv
Dedication
To my dad, who taught me the value of knowledge.
To my mom, who showed me the wonder of mystery.

v
Acknowledgements
I am grateful to everyone who has helped me on this journey. First, I thank my
mentor, Mauricio Delgado, for his guidance throughout my graduate training. Mauricio
was supportive, guiding me through every step of the research process, while still
providing me the space and independence to grow to as a scientist. I appreciate the faith
he showed in me and all of the discussions that we had. I am thankful to my committee,
Mei Cheng, Kent Harber, Daniela Schiller, and Elizabeth Tricomi, for their support and
for their suggestions that shaped and improved this work. I am grateful for my mentors
during my work as a research assistant, Amir Raz and Jin Fan. They helped me to realize
my potential and to learn that graduate school was the right path for me. I am thankful
for the assistance I received from my research assistants, Stefanie Herrera, Nikhilesh
Gorukanti, Christina Cheung, Vicki Lee, and Pollytia Panagioutou, whose efforts greatly
enhanced this research. All of the members of the Delgado lab were wonderfully
supportive. I thank Mike Nizkikiewicz, Meredith Johnson, and Vicki Lee for keeping the
lab functioning and made sure I had all the resources I needed to complete this work. I
am enormously grateful to the people I started this journey with, Katie Dickerson, Swati
Bhattacharya, Dominic Fareri, and Tony Porcelli for their boundless friendship and
support over the last four years. This research would not exist without the research
participants; I am grateful to them for their time and for sharing their thoughts and
experiences, which were invaluable and sometimes surprising. I thank all of the graduate
students of the psychology program for their humor, encouragement, and positive
attitudes. It has been an amazing experience to be surrounded by people who care so
much about their work and about helping others succeed. I feel lucky to be a part of this

vi
particular Psychology Department, and I thank all of our faculty, especially Harold Siegel
and Ken Kressel, for their willingness to listen and their efforts to ensure that this
department is somewhere people are happy to work and learn. I felt the support of my
family and friends throughout my graduate career, and it helped me succeed. I am
thankful to my parents for always giving me the space to pursue what I wanted and for
helping me along the way. Finally, I am so thankful for the love and support of my
fiancé and partner, Will. This journey would not have been the same without him, and I
thank him for everything he did, both the tangible and the immeasurable.

vii
Table of Contents Abstract of the Dissertation ii
Dedication iv
Acknowledgments v
Table of Contents vii
List of Figures x
List of Tables xi
List of Appendices xii
Chapter 1: Introduction 1
1.1 Emotion and Emotion Regulation 3
1.1.1 Cognitive reappraisal 5
1.1.2 Imagery-focused regulation 7
1.1.3 Measuring emotional responses and detecting shifts in emotion 8
1.2 Neural Processes Underlying Emotion Regulation 10
1.2.1 Regulation of negative emotions 12
1.2.2 Regulation of positive emotions 14
1.3 Regulation and Decision-making 17
1.4 Overview of Experiments 19
Chapter 2: Experiment 1: The Influence of Imagery Regulation on Decision-making 24
2.1 Introduction and Hypotheses 24
2.2 Methods 27

viii
2.3 Results 33
2.4 Discussion 43
Chapter 3: The Effect of Imagery and Cognitive Emotion Regulation Strategies on Decision-Making 52
3.1 General Introduction and Hypotheses 52
3.2 General Methods 57
3.3 Experiment 2: The effect of imagery-focused regulation on risk-taking across different financial decisions 63
3.3.1 Methods 63
3.3.2 Results 64
3.3.3 Discussion 66
3.4 Experiment 3: The effect of cognitive emotion regulation strategies on risk-taking across different financial decisions 68
3.4.1 Methods 68
3.4.2 Results 69
3.4.3 Discussion 73
3.5 General Discussion 74
Chapter 4: Experiment 4: Regulation of Negative Emotions Associated with Conditioned Cues 78
4.1 Introduction and Hypotheses 78
4.2 Methods 81
4.3 Results 91
4.4 Discussion 96

ix
Chapter 5: General Discussion 103
5.1 Summary and Significance 103
5.2 Potential Limitations of the Emotion Regulation Strategies 107
5.3 Potential Limitations of the Operational Definition of Decision-making 109
5.4 External Validity of the Financial Consequences 110
5.5 Intensity of Emotional Responses 112
5.6 Individual Differences 113
5.7 Overall Conclusions and Future Directions 114
References 116
Figures 127
Tables 141
Appendices 154
Vita 164

x
List of Figures
Figure 1.1 Overview of Experiments 127
Figure 2.1 Schematic of the Task Used in Experiment 1 128
Figure 2.2 Decision-making Results of Experiment 1 129
Figure 2.3 Neuroimaging Results of Experiment 1: Effects of Strategy and Choice in the Striatum 130
Figure 2.4 Neuroimaging Results of Experiment 1: Effects of Strategy and Choice in the Midbrain and Insula 131
Figure 3.1 Schematic of the Task Used in Experiment 2 132
Figure 3.2 Decision-making Results of Experiment 2 133
Figure 3.3 Schematic of the Task Used in Experiment 3 134
Figure 3.4 Decision-making Results of Experiment 135
Figure 4.1 Schematic of the Task Used in Experiment 4 136
Figure 4.2 Rating Results of Experiment 4 137
Figure 4.3 Activity in the Left Dorsolateral Prefrontal Cortex ROI 138
Figure 4.4 Activity in the Right Superior Frontal Gyrus (BA 6) 139
Figure 4.5 Right Inferior Frontal Gyrus Activity (Relax > Look) Correlation with Emotion Regulation Scores 140

xi
List of Tables Table 2.1 Financial Decisions in Experiment 1 141
Table 2.2 Regions that Correlated with Increasing Probability of Reward in the Regulators Group 142
Table 3.1 Financial Decisions in Experiments 2 and 3 143
Table 3.2 Comparison of Imagery-focused and Reappraisal Strategies 144
Table 4.1 Anticipation Phase ANOVA: Brain Regions Showing a Main Effect of Strategy 145
Table 4.2 Anticipation Phase ANOVA: Brain Regions Showing a Main Effect of Cue Type 146
Table 4.3 Anticipation Phase ANOVA: Brain Regions Showing a an Interaction of Strategy and Cue Type 147
Table 4.4 Cue Phase ANOVA: Brain Regions Showing a Main Effect of Cue Type 148
Table 4.5 Cue Phase ANOVA: Brain Regions Showing a Main Effect of Strategy (All Relax > Look) 149
Table 4.6 Cue Phase ANOVA: Brain Regions Showing an Interaction of Strategy and Cue Type 150
Table 4.7 Loss Cue: Brain Regions Active for the Anticipation Phase Contrast of Relax vs. Look 152
Table 4.8 Variable Cue: Brain Regions Active for the Anticipation Phase Contrast of Relax vs. Look 153

xii
List of Appendices Appendix 1. Post Experimental Survey Used in Experiment 1 154
Appendix 2. Post Experimental Survey Used in Experiment 2 159
Appendix 3. Post Experimental Survey Used in Experiment 3 161

1
Chapter 1: Introduction
It is hard to imagine a life without emotion. Emotions are a major part of our
subjective experiences of the world. Emotions can be described as adaptive
physiological and behavioral response tendencies that are activated by important stimuli
and situations (James, 1894). Emotions signal to us that something is important and
requires our attention. From an evolutionary perspective, emotions prompt us to initiate
approach or avoidance behaviors, guiding us to towards rewards and away from harm
(Panksepp, 1998). The key aspect of these definitions of emotions is the idea that
emotions influence behavior.
Typically, the influence of emotion on our behavior is advantageous; for example,
negative emotions such as fear and anxiety can be important indicators of the need for
attention and vigilance. Imagine driving at high speeds on an unfamiliar highway when
sudden feelings of anxiety accompanied by autonomic changes are experienced. This
emotion is deemed protective, signaling potential caution in behavior. Yet, emotions can
also influence decision-making in maladaptive ways. A surge of anxious symptoms
while driving, for instance, could lead to an overwhelming stressful response with
dangerous consequences on the road. Like negative emotions, positive emotions such as
excitement and reward anticipation can also influence our decision-making. Often
positive emotions are triggered by cues in the environment associated with rewards. For
s golden arches.
Suddenly, you are craving salty French fries and this desire leads you to take the next exit
and go to the drive-through. If you are trying to lose weight, eating fries may be counter-

2
productive. Thus, at times our emotional responses may influence our behavior in
maladaptive ways. Exerting control over our emotional responses to cues is necessary to
facilitate goal-directed behavior.
As humans we have the unique ability to change the emotions we experience and
express using a collection of techniques called emotion regulation strategies (Gross,
1998b). Psychologists have been interested in the process of emotion regulation for
several decades, but research on emotion regulation has grown immensely in the last 10
years. Current research on emotion regulation seeks to understand the subjective,
behavioral, physiological and neural bases of emotion regulation (for a review, see
Ochsner & Gross, 2005; Ochsner & Gross, 2008). This research has created a clear
picture of the psychological processes and neural systems involved in using regulation
techniques to change the subjective experience of emotion. Whether and how the effects
of regulation efforts extend beyond subjective experience to actual behavior, however, is
not well understood. Additionally, most investigations of emotion regulation have
focused on negative emotions, likely because they are subjectively unpleasant to
experience and are often core symptoms of psychiatric disorders such as depression.
Although positive emotions are pleasant to experience, they foster approach tendencies
central to many maladaptive behaviors including over-eating and drug-seeking;
additionally, feelings of anticipation or craving for a rewarding stimulus, a drug, have
been linked to relapse in drug addiction (Weiss, 2005). It is important to understand the
psychological and neural processes underlying the influence of emotion regulation
strategies on decision-making as these regulation processes are a promising method to
ameliorate maladaptive decision-making.
3
The current research examines the application of emotion regulation strategies to
positive and negative cues that predict monetary gains and losses, respectively. The
positive cues immediately precede financial decisions between risky and safe options,
and the effect of regulation on risk-taking is examined in three experiments. The
negative cues immediately precede monetary losses, and the effect of regulation on the
subjective experience of negative emotion during anticipation of these outcomes is
examined in one experiment. Two experiments employ functional neuroimaging (fMRI)
techniques to characterize the shifts in neural processing that underlie the regulation-
driven changes in decision-making and experience of emotion. Before discussing the
details of these four experiments, the psychological and neural literatures on emotion and
emotion regulation and their relationship to decision-making will be reviewed.
1.1 Emotion and Emotion Regulation
Emotions color and enrich our lives. They signal to us that something is
important and requires our attention. Emotions are elicited by salient stimuli in the
environment, for instance those that we have learned to associate with rewards or
punishments like appetitive and aversive cues. Salient stimuli can also be those that are
discrepant, stimuli that are unexpected or that interrupt an ongoing process (Mandler,
1984). Thus, a basic, early definition of emotions described them as adaptive response
tendencies initiated by salient stimuli (James, 1894). This idea became a central
component of the James-Lange theory of emotions, which conceptualizes emotions as the
mental experience of physiological responses to significant environmental cues.

4
Modern theories of emotion expand this early definition of emotions; they posit
that emotions are shaped by appraisals of the stimuli and situation (Lazarus, 1991;
Schachter & Singer, 1962). This description of emotion accounts for the diverse role of
physiological responses such as arousal in emotion. Heightened arousal accompanies
several basic emotions, for instance, surprise, fear, and anger. Despite this common
physiological component, these emotions are experienced as distinct feelings, suggesting
that emotions are not merely perceptions of physiological changes. Appraisal theories of
emotion argue that we experience a physiological sensation, such as arousal, and we
rapidly interpret and label that feeling based on the current situation and available
information (Schachter & Singer, 1962). Importantly, Lazarus and others have argued
for a broad definition of appraisals that includes both conscious and unconscious
evaluative processes (Lazarus, 1991; Scherer, 1999).
Conceptualizing emotions as malleable tendencies that can be influenced by
appraisals is the foundation of theories of emotion regulation; if emotions were not
susceptible to change, strategies for regulation of emotion could not exist. From a
psychological perspective, we know that there are several different approaches that
people can use to change the intensity of the emotion they experience and whether and
how they express that emotion. These different methods of emotion regulation are
directly related to the different stages of the emotion generation process in which they
take effect. Using a process model of emotion, there are two main time points at which
emotion regulation efforts can take place, when first faced with an affective stimulus and
just after the initiation of an emotional response to that stimulus (Gross, 1998b).
Strategies used early in the emotion generation process are called antecedent-focused

5
strategies, and although there are several different types of antecedent-focused strategies,
their central goal is to alter the effect the stimulus has by changing whether or how it is
perceived (Gross, 1998a). Response-focused strategies are applied late in the emotion
generation process, and their goal is to alter the expression of emotion (Gross, 1998a).
Research has demonstrated that antecedent-focused strategies are more flexible
and effective than response-focused strategies at altering emotional experience (Gross,
2002), and that response-focused strategies like suppression, which involves limiting any
outward expression of emotion, are associated with memory deficits for the period that
regulation was used (Richards & Gross, 2000). Additionally, using response-focused
strategies has been found to increase autonomic responding (Gross, 2002); thus, most
research on emotion regulation has focused on understanding antecedent-focused
strategies.
1.1.1 Cognitive reappraisal. There are several types of antecedent-focused
emotion regulation strategies. The most dynamic antecedent-focused strategies are
cognitive change techniques, which involve directing and monitoring conscious thoughts
in order to alter emotional experiences (Gross, 1998b). One type of cognitive change
strategy is reappraisal, in which individuals reevaluate the meaning of a situation or
stimulus, thereby altering their emotional response. Reappraisal strategies were
developed from early work by Lazarus and colleagues who demonstrated that narrating
stressful situations in a detached, neutral way reduced physiological and subjective stress
responses (Lazarus & Alfert, 1964). Recent investigations of reappraisal have involved
training participants to change their thoughts about the emotional stimulus. For example,
given a photograph of a man who appears bruised and injured, one could reduce the

6
negative emotions elicited by the image by thinking that the man is an actor in makeup
and that he is not really hurt at all. This example describes a situation-focused
reappraisal method; to decrease emotion in a situation-focused way the initial evaluation
of the stimulus must be altered such that it can be perceived as not as bad as it seemed at
first (Ochsner, Ray, Cooper, Robertson, Chopra, Gabrieli et al., 2004). Reappraisal can
also be achieved through more self-focused cognitions, for instance distancing oneself
from the stimulus by taking the perspective of a detached observer (Ochsner, Ray,
Cooper et al., 2004). Perhaps because of the thoughtful, cognitive nature of reappraisal it
is particularly effective with complex emotional stimuli such as films (for review, see
Gross, 1998a).
Regardless of the specific method, reappraisal is a verbal process. It involves
changing the appraisal or meaning of the stimulus or situation by generating a different
narrative, for instance, a more positive or neutral one. To illustrate the importance of
narratives in appraisal, one study examined the effect of manipulating narratives by
supplying subjects with verbal descriptions prior to the presentation of negative pictures
(Foti & Hajcak, 2008). While all the pictures were negative, the narrative descriptions
were either negative or neutral. Participants showed lower ratings of unpleasantness and
arousal, for the images that were preceded by neutral descriptions, compared to images
preceded by negative descriptions. This simple design echoed the earlier findings of
Lazarus and demonstrated that the description individuals apply to an emotional stimulus
greatly influences their emotional response to it. These findings support the appraisal
theories of emotion.

7
1.1.2 Imagery-focused regulation. In addition to reappraisal, antecedent
regulation of emotions can also be achieved with strategies focused on distancing or
imagery generation. These strategies involve focusing thoughts away from the emotional
stimulus. Specifically, imagery-focused regulation involves focusing thoughts internally,
instead of at the emotional stimulus, by imagining a visual scene (Delgado, Gillis, &
Phelps, 2008; Delgado, Nearing, LeDoux, & Phelps, 2008). In the previous studies of
imagery-focused regulation, participants visualized calming scenes, for example nature
scenes, the ocean or a beautiful day at the park. Unlike reappraisal, imagery-focused
regulation does not directly alter the meaning of the emotional stimulus. Instead, the goal
of imagery-focused regulation is to create a new emotion, such as a feeling of calm, to
replace the emotion associated with the stimulus. Thus, imagery regulation involves
elements of distraction and relaxation. Imagery-focused strategies are fundamentally
different from reappraisal, but they share features with traditional cognitive behavioral
therapy (CBT) techniques in which patients are trained to use specific strategies or
imagery to cope with certain situations or stimuli (Delgado, Nearing, LeDoux et al.,
2008).
As reappraisal is well-suited for complex emotional stimuli, imagery-focused
regulation is appropriate for simple, repeated stimuli such as conditioned cues. Imagery-
focused regulation has been shown to successfully reduce arousal responses (measured
via skin conductance) to appetitive and aversive cues (Delgado, Gillis, & Phelps, 2008;
Delgado, Nearing, LeDoux et al., 2008). These results suggest that one mechanism by
which imagery-focused regulation changes emotional responses is via modulation of
arousal.
8
1.1.3 Measuring emotional responses and detecting shifts in emotion. The
efficacy of cognitive regulation techniques is typically characterized by the observed
changes in emotional experience and responses. Most studies of emotion regulation rely
on self-report ratings of emotion (i.e., emotion intensity) to detect changes in experienced
emotion. Self-
response, as emotional content is inherently subjective (Barrett, Mesquita, Ochsner, &
Gross, 2007). However, social desirability may affect self-report data by leading
responses to conform to the expected results making self-reports potentially unreliable
(Crowne & Marlowe, 1960). The time of self-report administration may also affect its
validity as research has shown that current emotions are perceived as more intense than
previous emotions (Van Boven, White, & Huber, 2009).
Given the importance of self-report, ratings of emotion and success at using the
emotion regulation strategies were employed in the current experiments. Additionally,
the main dependent variable of three of the current experiments was risk-taking, a
behavioral, rather than a self-report, measure. Assessing changes in choices as a function
of regulation is an important extension of the extant emotion regulation literature. If
emotion regulation alters choices in the current studies, it would demonstrate that the
influence of these strategies goes beyond the subjective experience of emotion.
Other measures of affective responses have been used to supplement self-reports.
For instance, expressive behavior captured by video-taping participants during the
experiment and then coding their facial behavior has been used to assess fluctuations in
emotion (Giuliani, McRae, & Gross, 2008; Goldin, McRae, Ramel, & Gross, 2008).
Further, autonomic measures such as skin conductance responses (SCRs) can assess

9
arousal levels and provide a measure of one component of the emotional response. Such
measures depend on sympathetic nervous system activity increases in response to
motivationally significant stimuli (e.g., affective stimuli), which, in the case of SCRs,
results in greater levels of sweat excretion and increased conductivity of the skin
(Critchley, 2002). However, interpretation of SCRs are limited by the observation that
sympathetic arousal can be caused by not just emotional changes, but also fluctuations in
cognition or attention (Critchley, 2002). These physiological measures typically affirm
self-reports of emotional shifts with regulation. The current experiments employed skin
conductance measurements to assess changes in arousal due to use of emotion regulation
strategies.
Brain imaging techniques are a useful counterpart to the subjective, behavioral,
and physiological assessments described above, as neuroimaging can highlight the
potential neural circuitry involved in emotion perception, experience, expression, and
regulation. Functional magnetic resonance imaging (fMRI), for example, can be used to
detect and contrast brain activity during the natural experience of emotion (for a review
see Kober et al., 2008) and during the experience of emotion under regulation (for a
review, see Ochsner & Gross, 2008). The efficacy of emotion regulation techniques can
be inferred from shifts in activity with regulation, although inferences must be made with
caution as the level of brain activity is not a direct index of the intensity of experienced
emotion. Neuroimaging data was collected for two of the current experiments,
Experiment 1 and Experiment 4. The goal of including neuroimaging methods is to
complement and extend behavioral and physiological measures of emotion and to
identify the underlying neural circuits that mediate how regulatory processes exert their

10
influence on emotional responses. Specifically, Experiment 1 assessed how imagery
regulation altered the neural systems that process risk and reward and Experiment 4
assessed how this same regulation strategy altered activity in brain regions that process
losses.
1.2 Neural Processes Underlying Emotion Regulation
How do emotion regulation processes manifest changes in the neural circuitry
involved in emotion? The consensus in the literature on emotion regulation, specifically
antecedent-focused strategies, is that prefrontal regions involved in cognitive control
influence processing in emotion-related brain regions such as the amygdala (for reviews
see Green & Malhi, 2006; Ochsner & Gross, 2008). Manipulating and reevaluating
situations and stimuli involve prefrontal brain regions important in cognitive control,
response selection, working memory, and keeping task demands online (Miller & Cohen,
2001). More specifically, cognitive reappraisal is thought to involve working memory
and selective attention mediated by the dorsal prefrontal cortex (PFC), inhibition initiated
by the ventral PFC (including the ventral lateral PFC, vlPFC; Lieberman et al., 2007),
regulation of control processes by the dorsal anterior cingulate cortex (ACC), and
consideration of the emotional states of oneself or another mediated by the medial PFC
(Ochsner & Gross, 2008). The dorsolateral region of PFC (dlPFC) is believed to play an
important, but somewhat indirect role in emotion regulation due to the fact that it does
not have direct connections to brain regions such as the amygdala (Delgado, Nearing,
LeDoux et al., 2008; Ochsner & Gross, 2008; Quirk & Beer, 2006). Indeed, the dlPFC
has been shown to be involved in a broad spectrum of cognitive tasks (Miller & Cohen,

11
2001), supporting the notion of its role as a domain-general system. The function of the
dlPFC during emotion regulation is likely to keep regulation goals online and maintain an
active representation of task demands.
Successful emotion regulation does not result solely from recruitment of
prefrontal regions; modulation of activity in regions involved in emotional learning such
as the amygdala, striatum and insula has been linked to regulation success (Ochsner &
Gross, 2008). These regions have direct and indirect anatomical connections to various
prefrontal sites and have been previously implicated in affective processing and
motivation with both negative and positive stimuli (Amaral & Price, 1984; Cardinal,
Parkinson, Hall, & Everitt, 2002). Additionally, a recent functional connectivity analysis
determined that prefrontal cortex activity during emotion regulation covaried with
amygdala activity, and reductions in negative emotion varied with the strength of
functional connectivity between prefrontal regions (orbitofrontal cortex and dorsal medial
PFC) and the amygdala (Banks, Eddy, Angstadt, Nathan, & Phan, 2007). In a related
study, a formal mediation analysis revealed that vlPFC disrupted or partially inhibited
activity in the amygdala via the medial PFC (Lieberman et al., 2007), which is
anatomically connected to both the vlPFC and amygdala (Ghashghaei & Barbas, 2002).
These studies support the theory that regulation is achieved by the engagement of
prefrontal brain regions whose increased activity modulates activity in brain regions
involved in emotion. These cortical-subcortical relationships will be described further in
the following sections, in which we will discuss how neuroimaging studies have
advanced our knowledge of the psychological and neural bases of regulation of negative
and positive emotions.

12
1.2.1 Regulation of negative emotions. Given their prominence and potential
clinical significance, negative emotions have historically been the target of emotion
regulation research. The goal of this research has been to understand the behavioral and
neural mechanisms through which cognitive strategies effectively decrease the intensity
of anticipated or experienced negative affect. One of the first neuroimaging studies of
emotion regulation examined how cognitive reappraisal could reduce the intensity of
negative emotion experienced when viewing aversive pictures (Ochsner, Bunge, Gross,
& Gabrieli, 2002). In this experiment, participants were presented with negative
emotional pictures and cued to either respond naturally or to actively engage in
reappraisal to decrease the intensity of negative emotion they experienced. As assessed
by online self-reports, subjective ratings of negative affect were decreased when
regulation strategies were used. Further, reappraisal techniques compared to a natural
response condition, led to increased responses in cortical brain regions such as the dorsal
and ventral lateral prefrontal cortex (PFC) and medial PFC and decreased activity in the
amygdala and medial orbitofrontal cortex (OFC). Although other studies at this time
were reporting modulation of amygdala and prefrontal cortex by conscious cognitive
effort (Schaefer, Jackson, Davidson, Aguirre, Kimberg, & Thompson-Schill, 2002), this
was one of the first reports demonstrating that the explicit use of an emotion regulation
strategy attenuates negative emotion and modulates activity in cortical and amygdala
regions. Numerous studies investigating the neural correlates underlying successful
reappraisal of negative emotions evoked by pictures followed. Across research reports,
the common theme has been that successful application of emotion regulation strategies
leads to increased activity in the PFC and decreased activity in regions mediating an

13
emotional response such as the amygdala (e.g., Goldin, McRae, Ramel, & Gross, 2008;
Harenski & Hamann, 2006; Kim & Hamann, 2007; Ochsner, Bunge, Gross et al., 2002;
Ochsner, Ray, Cooper et al., 2004; Phan, Fitzgerald, Nathan, Moore, Uhde, & Tancer,
2005; Urry, van Reekum, Johnstone, Kalin, Thurow, Schaefer et al., 2006).
Using a strategy with the goal to distance and detach oneself from the events
depicted in sad film clips, participants decreased their subjective feelings of sadness, and
self-report sadness ratings correlated with increases in BOLD signals in two regions of
frontal cortex, right OFC and dlPFC (Levesque, Fanny, Joanette, Paquette, Mensour,
Beaudoin et al., 2003). Detachment strategies have been shown to successfully decrease
physiological arousal, skin conductance responses (SCRs), elicited by the anticipation of
painful electric pulses while engaging anterolateral PFC (Kalisch, Wiech, Critchley,
Seymour, O'Doherty, Oakley et al., 2005). Interestingly, attempts to distract oneself
during the anticipation of pain did not successfully reduce subjective feelings of anxiety
(Kalisch, Wiech, Herrmann, & Dolan, 2006) suggesting that some strategies may be more
effective than others.
Imagery-focused techniques have been used to regulate physiological and neural
responses to conditioned fear (Delgado, Nearing, LeDoux et al., 2008). In this study, a
previously neutral stimulus, a blue square, elicited a conditioned response, increased
arousal as indexed by SCRs, due to repeated associations with an aversive outcome, an
electric shock (the unconditioned stimulus). The acquisition and expression of this
conditioned fear response has been shown to involve the amygdala (for review, see
Delgado, Olsson, & Phelps, 2006; Phelps & LeDoux, 2005). The use of imagery
techniques that promoted a feeling of calm

14
upon presentation of the conditioned stimulus (CS, the blue square)
decreased conditioned physiological responses, increased the BOLD response in the left
dorsal lateral prefrontal cortex (dlPFC), and attenuated the BOLD response in the
amygdala (Delgado, Nearing, LeDoux et al., 2008) compared to natural responding
during the conditioned stimulus. Notably, a connectivity analysis suggested that the
influence of dlPFC on the amygdala response could be indirectly mediated by the
ventromedial prefrontal cortex (vmPFC), a region previously linked with the extinction of
fears in both rodents (Milad & Quirk, 2002) and humans (Phelps, Delgado, Nearing, &
LeDoux, 2004). This study showed that imagery-focused regulation reduced fear
responses to the shock cues. The goal of experiment four is to examine whether this
same strategy is also effective with cues signaling aversive experiences more common in
daily life, the loss of money.
1.2.2 Regulation of positive emotions. While research over the last few years
has successfully highlighted the potential neural correlates underlying successful
regulation of negative emotions, only more recently have investigations begun to probe if
similar strategies (e.g., reappraisal, Giuliani, McRae, & Gross, 2008) and neural
underpinnings also mediate the control of positive emotions. The arousing feelings
associated with craving and excitement are some examples of positive emotions that can
trigger approach behaviors which become detrimental to well-being if not controlled, for
instance, higher than normal consumption of appetitive stimuli like food or drugs. An
understanding of the behavioral and neural processes underlying successful cognitive
regulation of positive emotions not only bolsters our understanding of general cognitive
control processes; it also has beneficial implications.
15
There is evidence suggesting overlap in the cortical loci implicated in the
successful regulation of positive and negative emotions. Similar to previous studies of
negative emotions, (e.g., Levesque, Fanny, Joanette et al., 2003) increases in BOLD
responses in PFC regions, such as dlPFC and ACC, have been reported to be associated
with diminished feelings of positive arousal elicited by affective films when using
regulation strategies (Beauregard, Levesque, & Bourgouin, 2001). Additionally, a direct
within-subjects comparison of use of reappraisal with positive and negative affective
pictures revealed that both positive and negative regulation involve cortical regions such
as the right lateral PFC, dorsal medial PFC, medial PFC, and bilateral lateral OFC (Kim
& Hamann, 2007). Notably, greater activation in PFC regions was observed when
participants attempted to regulate negative emotions, suggesting that while regulation of
positive and negative emotions may recruit similar cortical structures, the extent and level
of cortical activity may differ between the emotion types, as will the specific subcortical
targets of regulation.
The expectation of a potential reward can bring about positive emotions and
promote approach behaviors, with the caveat that such behaviors can be risky and
detrimental to o -being in extreme cases (Potenza & Winters, 2003). The
striatum, a subcortical region involved in reward-related processing and affective
learning, is a potential target for cortical modulation via cognitive strategies, given its key
role in reward prediction and expectations elicited by conditioned reinforcers (for review,
see Delgado, 2007; Knutson & Cooper, 2005; O'Doherty, 2004) and correlations with
drug-specific cravings (Breiter, Gollub, Weisskoff, Kennedy, Makris, Berke et al., 1997;
Sinha, Lacadie, Skudlarski, Fulbright, Rounsaville, Kosten et al., 2005). Regulation of
16
positive emotion associated with the expectation of reward has been recently investigated
using a conditioning design that varied the type of conditioned stimulus (paired with a
monetary reinforcer, CS+, or paired with no reinforcer, CS-) and type of instruction
(attend to natural emotions or regulate via imagery techniques) (Delgado, Nearing,
LeDoux et al., 2008). Physiological responses, measured by SCRs, demonstrated the
effectiveness of the imagery-focused regulation strategy as the heightened response to the
CS+ observed during natural responding was diminished during regulation. A similar
decrease was observed in BOLD signals in the striatum; that is, striatum signals were
reduced when a regulation strategy was used with a stimulus that predicted a potential
reward. In contrast, increases during emotion regulation trials were observed in dlPFC as
participants used the imagery technique. Echoing these results, another study observed
that regulation decreased striatum activity during reward-processing during a task in
which cues predicted monetary rewards of high or low magnitudes (Staudinger, Erk,
Abler, & Walter, 2009). Specifically, regulation focused on distancing oneself from the
potential rewards eliminated the differential BOLD response to cues associated with high
and low magnitude rewards typically exhibited in the striatum, suggesting that regulation
disrupted normal reward processing. The combination of increased prefrontal and
decreased striatum activity may be the positive analogue of increased PFC and decreased
amygdala activity systematically observed in studies of negative emotion regulation. As
understanding the regulation of conditioned fear has important implications for anxiety
disorders, understanding the regulation of conditioned reward may inform research on
addiction.

17
1.3 Regulation and Decision-making
While historically research in psychology may have segregated emotion and
cognition, it is now accepted that these domains largely overlap (Blair, Smith, Mitchell,
Morton, Vythilingam, Pessoa et al., 2007; Gray, 2004), and the emotions we experience
can have considerable influence on our decisions (Bechara, Damasio, & Damasio, 2000).
Emotions induced via subliminal methods have been shown to influence valuation, the
process by which value is assigned to something, and decision-making; for example,
thirsty participants were willing to pay greater amounts, wanted, poured and drank more
of a sugary beverage after being unconsciously exposed to happy faces (Winkielman,
Berridge, & Wilbarger, 2005). The opposite pattern occurred after unconscious exposure
to angry faces, demonstrating differential effects of positive and negative emotions. Of
course, explicit emotion manipulations can also affect decision-making, as evidenced by
the observation that watching emotionally-charged video clips disrupted typical
economic decision-making patterns such as the endowment effect, in which sellers assign
higher prices to owned items (Lerner, Small, & Loewenstein, 2004). Specifically, disgust
video inductions were associated with an absence of the endowment effect and sadness
video inductions with a reversal of it. In addition to emotion inductions, the existence of
a negative emotional state, for example acute stress, can influence cognition at both the
behavioral (Patil, Apfelbaum, & Zacny, 1995) and neural levels (Arnsten & Goldman-
Rakic, 1998). Further, acute stress modulates financial decision-making (Porcelli &
Delgado, 2009) and may put those who cannot cope with stress at risk of poor decision-
making, as illustrated by addiction relapse (Sinha, 2007). It is plausible that employing

18
cognitive emotion regulation strategies to control these emotions may foster better, more
goal-directed decision-making.
Some studies on self-control help provide insight into the potential mechanisms
involved in cognitive control of decision-making. Having depleted self-regulatory
resources, for example, has been shown to lead to greater impulse buying behaviors
(Vohs & Faber, 2007), suggesting that self-control mechanisms are important for making
advantageous decisions. Moreover, the successful use of self-control by dieters when
making choices about food consumption recruits cortical mechanisms (Hare, Camerer, &
Rangel, 2009). Activity in vmPFC in successful dieters reflected both taste and health
information of displayed food items, while activity in this region in non-self-controllers
reflected only taste information, suggesting different appraisal mechanisms for food
items in self-controllers compared to non-self-controllers. Taken together, these studies
provide evidence that greater self-control promotes decision-making in line with long-
term goals such as saving money and losing weight.
A recent study directly tested the effect of emotion regulation on financial
decision-making in which participants were faced with choices between a gamble and a
guaranteed amount (Sokol-Hessner, Hsu, Curley, Delgado, Camerer, & Phelps, 2009).
For the emotion regulation strategy, participants were instructed to reappraise,
specifically, to think about each decision as if they were a trader assembling a portfolio,
thus diminishing the importance of each individual decision. As a control condition,
participants thought of each decision in isolation. The authors identified individual
differences such that only half of the 30 subjects showed significantly reduced loss
aversion for reappraisal trials compared to control trials
19
reduced skin conductance responses during regulation trials compared to control trials,
-regulators
regulation and control trials.
Neuroimaging studies that specifically examine the effect of emotion regulation
on choices have not yet surfaced, but research close to this question has emerged. A
recent behavioral study examined regulation of craving in cigarette smokers (Kober,
Kross, Mischel, Hart, & Ochsner, 2009). Smokers were presented with cigarette-related
images and were cued either to regulate their feelings of craving by focusing on the long-
term consequences of smoking or to focus on the immediate sensory experience of
smoking (no regulation). Regulation reduced self-reported feelings of craving, and a
follow-up study showed that regulation was associated with increased activity in
prefrontal regions and decreased activity in craving-related brain regions such as ventral
striatum and ACC (Kober, Mende-Siedlecki, Kross, Weber, Mischel, Hart et al., 2010).
While early work with emotion regulation targeted negative emotions, recent studies
indicate that the focus of research on emotion regulation is shifting to the regulation of
positive emotions in the context of decision-making. This shift is likely driven in large
part due to the crucial role of positive emotions in approach behaviors that can become
maladaptive, such as the compulsive drug-seeking exhibited in addiction.
1.4 Overview of Experiments
Emotions, whether elicited by internal thoughts or cues in our environment, affect
our behavior and decision-making. Emotion regulation strategies can be used to control
or change these emotional responses, and strategy use is associated with physiological

20
and neural shifts. Emotion regulation is effective with naturalistic affective stimuli
(e.g., aversive photographs) and conditioned cues (e.g. shapes paired with unconditioned
stimuli like money or shock). Recent research suggests that using emotion regulation
strategies can alter decision-making, but these effects and their neural correlates have not
been fully characterized. The goal of this research is to examine the relationship between
emotion regulation and changes in decision-making and affective responses to
conditioned cues.
The dissertation experiments and predictions will be briefly introduced; see
Figure 1.1 for an overview of the experiments. In daily life, cues often signal
opportunities to take actions to gain rewards or avoid punishments, for example,
e salty, delicious French
fries. To capture the relationship between cues and subsequent rewards or punishments
in the laboratory, we employed simple visual stimuli (slot machine pictures and colored
squares) that were associated with monetary gains or losses. Participants completed
computer tasks involving these cues.
In Experiments 1 through 3, a picture of a slot machine signaled a financial
decision between a risky and a safe option. Because of the association between the slot
machine cues and opportunities to win money, the cues would evoke feelings of reward
anticipation and excitement. We predicted that these natural affective responses would
promote risk-taking to gain larger monetary rewards. To explore this relationship
between affective responses and risk-taking, we manipulated what participants thought
about during cue presentation. On some trials participants responded naturally to the cue,
and on other trials participants engaged in emotion regulation. We predicted that using
21
emotion regulation would alter affective responses to the cues and thereby alter risk-
taking during the financial decisions.
In Experiment 1, participants engaged in two types of imagery-focused regulation,
relaxing imagery and exciting imagery. Imagery-focused regulation has not been applied
to cues in a decision-making context, thus it is not known whether the previously
observed decreased affective responses to cues (e.g., Delgado, Gillis, & Phelps, 2008)
will also exert effects on actual choices. Because imagery regulation involves shifting
focus away from the opportunity for rewards, we expected regulation to alter decision-
making. Specifically, we hypothesized that relaxing imagery would decrease risk-taking
and that exciting imagery would increase risk-taking. During the experiment, fMRI data
were collected, and we predicted that engaging in relaxing imagery would decrease
activity in the ventral striatum, while engaging in exciting imagery would increase
activity during the decision phase. Decreased striatum activity would suggest dampened
responses to potential rewards, and increased striatum activity heightened responses.
The goal of Experiment 2 was to more fully characterize how imagery regulation
affects decision-making by testing the influence of imagery on risk-taking in a more
complex set of decisions. We included a mixed set of three different kinds of financial
decisions which varied with regard to which option had the greatest value, risky or safe.
We wanted to determine if the effects of imagery regulation would persist in a more
complex decision context. This study only employed the relax imagery strategy, and we
predicted that imagery would decrease risk-taking for all decision types. Skin
conductance measures were collected during the cue phase to assess whether imagery-
focused regulation changed arousal. We predicted that imagery regulation would lower

22
skin conductance responses, suggesting less arousal or excitement associated with the
upcoming decision.
The first two studies investigated an imagery-focused regulation strategy, but
there are a variety of strategies for emotion regulation. The third study aimed to
determine whether a more cognitive strategy, reappraisal, could be applied in a decision-
making context. The goal of Experiment 3 was to investigate the effectiveness of
reappraisal at altering risk-taking in a complex decision set. This experiment used the
same set of financial decisions as Experiment 2 in order to have a basis for comparison.
The reappraisal strategy involved replacing natural thoughts and reactions to the slot
machine cue with structured thoughts that would promote a new perspective on the
upcoming decision and opportunity for rewards. Two opposite reappraisal strategies
directed at
increasing or emphasizing the importance of the upcoming decision. For the
at decreasing or
deemphasizing the importance of the upcoming decision. We predicted that emphasize
reappraisals would decrease risk-taking and deemphasize reappraisals would increase it
for all decision types. Skin conductance measures were collected to assess whether
reappraisal changed arousal. We predicted emphasize reappraisals would increase skin
conductance and deemphasize reappraisals would decrease skin conductance. These
results would support the idea that emphasizing increases arousal, perhaps by increasing
anxiety, while deemphasizing decreases arousal, perhaps because participants were more
carefree about the decision.

23
Experiments 1 through 3 probed the regulation of cues associated with monetary
gains and effects on subsequent decision-making. Our environment is composed of cues
predicting both rewards and punishments; therefore, it is important to examine regulation
of negative cues. The previous three experiments examined the effect of regulation on
risk-taking, therefore, they did not directly assess changes in emotion experience.
Experiment 4 interrogated the influence of imagery-focused regulation on feeling of
negative emotion associated with monetary loss cues. This experiment also examined the
neural systems supporting imagery regulation of losses. We predicted that the imagery
regulation strategy would be effective at reducing reports of negative emotion, and that
regulation would recruit regions of the prefrontal cortex.
The overall goal of these experiments is to understand the relationship between
cues, affective responses, and decision-making. We chose to investigate monetary
rewards and punishments, because they are meaningful and common experiences in
everyday life that could be employed in a laboratory setting. These results of these
experiments will be described in detail in the following chapters.

24
Chapter 2
Experiment 1: The Influence of Imagery Regulation on Decision-making
2.1 Introduction and Hypotheses
Many cues in our environment signal potential rewards and elicit positive
emotional responses like excitement and anticipation, which initiate approach behaviors.
The ability to control emotional responses to such cues is essential for adaptive function.
For instance, an individual unable to cope with sudden urges elicited by a conditioned
stimulus (e.g., casino environment) may engage in maladaptive risk-seeking behavior
(e.g., gambling) that can potentially turn into a compulsive disorder (Kushner, Abrams,
Donahue, Thuras, Frost, & Kim, 2007). One promising intervention is the application of
cognitive strategies during the emotion generation process, a practice known as emotion
regulation, which results in an alteration in the affective experience of emotional stimuli
(Ochsner & Gross, 2005). The use of such cognitive strategies has been shown to
decrease physiological and subjective responses associated with the expectation of
prospective monetary rewards, which in turn modulate blood oxygenated level dependent
(BOLD) responses in the striatum (Delgado, Gillis, & Phelps, 2008; Staudinger, Erk,
Abler et al., 2009), a region previously associated with reward-related processing
(Delgado, 2007; Haber & Knutson, 2010; O'Doherty, 2004; Rangel, Camerer, &
Montague, 2008).
It is unclear, however, if the effects of emotion regulation can extend beyond
changes in emotional experience to changes in goal-directed behavior. Affective
responses elicited by salient cues are known to influence behavior, for instance cue-
induced drug craving is associated with increased drug-seeking (Weiss, 2005). Recently,

25
application of regulation strategies to drug cues has been found to reduce subjective
feelings of craving in cigarette smokers (Kober, Mende-Siedlecki, Kross et al., 2010) and
in cocaine abusers (Volkow, Fowler, Wang, Telang, Logan, Jayne et al., 2010), and lead
to decreased activation in regions such as the ventral striatum. While these studies did
not probe shifts in behavior associated with regulation of craving, it is possible that
regulation of such conditioned cues can extend to risk-taking behaviors such as drug-
seeking. The goal of Experiment 1 was to examine the effect of imagery-focused
regulation of a reward conditioned cue on subsequent behavior. Specifically, this study
probed if the successful use of cognitive strategies during presentation of a reward
conditioned stimulus (a slot machine) would influence decision-making (risk-taking in
financial decisions) and associated neural circuits such as the striatum.
We hypothesized that engaging in imagery regulation during the reward cue
would lead to decreased risky choices and attenuated associated BOLD signals in the
striatum. The imagery regulation technique involved focusing thoughts internally and
visualizing a calming scene such as a beach sunset, rather than focusing thoughts on the
reward cue and opportunity to gain money. Feelings of excitement and the anticipation
of receiving money rewards may promote risk-taking, thus, shifting mental focus away
from the potential rewards using the imagery strategy should decrease risk-taking. The
prediction of decreased activity in the striatum is motivated by previous observations that
imagery-focused regulation modulated the expectation of reward and blood-oxygen-
level-dependent (BOLD) responses in reward-related areas (Delgado, Gillis, & Phelps,
2008). The multifaceted human striatum is a region often identified during investigations
of risky decision-making (Christopoulos, Tobler, Bossaerts, Dolan, & Schultz, 2009;

26
Kuhnen & Knutson, 2005; Matthews, Simmons, Lane, & Paulus, 2004), whose signals
correlate with drug specific cravings (Sinha, Lacadie, Skudlarski et al., 2005) and
impulsive, risky decisions in substance users (Leland, Arce, Feinstein, & Paulus, 2006).
As previously mentioned, neural signals in the striatum have also been reported to be
modulated by emotion regulation strategies during expectation of monetary (Delgado,
Gillis, & Phelps, 2008; Staudinger, Erk, Abler et al., 2009) and drug (Kober, Mende-
Siedlecki, Kross et al., 2010; Volkow, Fowler, Wang et al., 2010) rewards. Thus, the
striatum provides an ideal target for potential regulatory influences that may occur during
decision-making under risk.
We investigated the effect of cognitive regulation on risk-taking and its neural
correlates using a functional magnetic resonance imaging (fMRI) experimental paradigm
that included both a cue and a decision phase. The cue phase consisted of the
presentation of a conditioned stimulus (CS+ or CS-
either a selection between risky and safe money options (CS+ trials) or a non-monetary
control decision between two different stamps (CS- trials; Figure 2.1).
decisions were quantified as the proportion of trials in which the risky option was chosen
for each type of cognitive instruction. Finally, we acquired post-experimental self-
assessm
probe how the successful application of emotion regulation modulates decision-making
under risk and its associated neural correlates.

27
2.2 Methods
Participants. Thirty-five right-handed volunteers participated in this study (17
female, 18 male). Three participants were excluded due to failure to comply with task
requirements (assessed by post-experimental questionnaires), which included not
following instructions and using an incorrect strategy. One additional participant was
excluded due to indifference during task performance as assessed by behavior (i.e.,
participant consistently chose one response) and self-report. Finally, data from one MRI
session was excluded due to equipment malfunction. Thus, final analysis was conducted
on thirty participants (15 female, 15 male; mean age: M = 20.87, SD = 2.99). Participants
responded to posted advertisements and gave informed consent according to the Rutgers
University Institutional Review Board for the Protection of Human Subjects in Research
and the Newark Campus Institutional Review Board of the University of Medicine and
Dentistry of New Jersey.
Procedure overview. After informed consent, the experimenter explained the
experimental task to the participants, and participants were trained on the imagery
emotion regulation techniques. Then, participants completed the experimental task while
inside of the MRI scanner. At the conclusion of the scanning session, participants
completed several questionnaires including a post-experimental questionnaire that
assessed compliance with the emotion regulation demands and measured perceived
successful use of cognitive strategies. Additional questionnaires that considered potential
individual differences included a measure of risk preferences (Holt & Laury, 2002), use
of emotion regulation strategies (Emotion Regulation Questionnaire; Gross & John,
2003) and behavioral inhibition and activation (BIS/BAS; Carver & White, 1994). Next,

28
participants were paid based on what they won in the game and debriefed. Finally, at
least a day after the scanning session, participants were asked to complete a paper
questionnaire with the five financial decisions from the scanner task along with two
variations where the amounts were either increased or decreased by $0.50. This
the absence of any regulation instruction.
The Slot Machine Game. The experimental task, the Slot Machine Game
(SMG) consisted of 90 trials, divided into 6 blocks of 15 trials. Each trial started with the
cue phase, involving the presentation of a conditioned stimulus (CS; a slot machine, CS+
or stamp machine, CS-) and a strategy ( Look , Relax or Excite ) for a variable
duration of 4, 6 or 8 s (Figure 2.1). The conditioned stimulus indicated if the trial
presented an opportunity to earn money (CS+) or not (CS-). The strategy was presented
above the CS and directed participants to either a) respond naturally to the slot machine,
engage in imagery-
experiments that used an imagery-focused regulation strategy (Delgado, Gillis, & Phelps,
2008; Delgado, Nearing, LeDoux et al., 2008). The cue phase was followed by the
decision phase, where participants were presented with two options for a fixed duration
of 4 s. For CS+ trials, participants chose between two monetary options: a gamble (risky
option) and a guaranteed amount (safe option) that varied with respect to probability and
amount, but were equated in their expected value. Expected value is the product of the
probability of winning and the amount that could be won. For CS- trials, the decision

29
carried no affective significance as participants chose between two different
representations of postage stamps with no monetary value. The CS- trials were a control
condition. They represented a decision with no affective or monetary significance. A
jittered 10 to 14 s inter-trial interval followed the decision phase.
Monetary incentives and payment. Participants received no immediate
feedback about the outcomes of their decisions. To ensure the perception that each
decision was independent and significant, six decisions were realized during the
experimental session. These outcome sessions occurred during three specific periods
during the experiment. The first outcome session occurred after the initial two task
blocks and as a result, reflected the resolution of those two task blocks. That is, two
decisions were resolved, with one decision being chosen from each of the two blocks just
completed. The second outcome session occurred after task blocks 3 and 4, while the
third and final outcome session occurred at the end of the experiment (after task blocks 5
and 6). During each of these three outcome sessions, participants first saw the computer
select two decisions from the five possible decision types by spinning a wheel. Next,
they watched the experimenter open their data file to identify their choices (risky or safe
option) for those decisions. Finally, participants were informed by the experimenter over
the intercom of the outcomes of the decisions and how much money they had won.
Participants were compensated a base rate of $20, plus whatever money they earned from
the six selected decisions. The decisions selected were the same for all participants
leading to an average earning of $53.33 (SD = $4.08).
Emotion regulation strategies. Prior to scanning, participants were extensively
trained on the task instructions, especially the application of the emotion regulation
30
techniques. They were informed that pictures of a slot machine and a stamp machine
would serve as cues to signal upcoming decisions involving either money or stamps,
respectively. They were also informed that a word presented above the picture would
serve as the strategy for that trial. There were three such strategies
participants were asked to look at the picture while
it was presented on the screen and react naturally while contemplating its significance for
Look strategy was paired with the slot
machine, they were asked to think that they would have to make a financial decision and
based on their choice, they could potentially win money. In contrast, when the Look
strategy was paired with the stamp machine, they would think about a potential decision
between two stamp
were prompted to imagine a calming scene such as a sunny day in a park. During the
training period, each participant generated his/her own image with guidance from the
experimenter with the requirements that such imagery would be relaxing and easy to
conjure up to facilitate regulation. Participants were instructed to think of the same image
each time the word Relax was presented, irrespective of type of trial (CS+, CS-). Finally,
participants were also presented with a third strategy, e emotion
regulation strategy, participants were to imagine an exciting scene, such as a roller
coaster ride, in order to increase their arousal.
Financial and control decisions. There were five different financial decisions in
the task (Table 2.1). Each lottery included a risky option with one of five different levels
of probability (0.20, 0.35, 0.50, 0.65, 0.80) and a safe option with an amount equivalent
to the expected value of the gamble (e.g. risky: 20% chance of winning $10.35 or safe:

31
100% chance of winning $2.07). The location (right or left side of screen) of the risky
and safe options was counterbalanced. For CS- trials, participants made decisions
between two stamps with different patterns, with four types of stamps included overall
and presentation location being counterbalanced. The stamp decisions were included as a
control condition for neuroimaging analyses. Participants used a MRI compatible
response unit and used either the index or middle finger of the right hand to make a
decision during both CS+ and CS- trials. Thus, the experiment included six different
types of trials that varied in respect to cognitive strategy (Look, Relax and Excite) and
affective significance of decision (CS+ and CS-). There were 60 CS+ trials with 20 of
each instruction and 30 CS- trials with 15 of each instruction. The five different financial
decisions were repeated 12 times (four times with each instruction).
Behavioral data analysis. quantified as the
proportion of trials in which the risky option was chosen for each instruction type (Look,
Relax, Excite). To examine the effect of regulation (Relax, Excite) on risk-taking, a
repeated-measures ANOVA with type of instruction as a within-subjects factor was
estimated using SPSS.
FMRI acquisition & analysis. Imaging data were acquired using a 3T Siemens
Allegra head-
Center for Advanced Imaging. Structural images were acquired using a T1-weighted
sequence (256 x 256 matrix, 176 1 mm sagittal slice). Functional images were acquired
using a single-shot gradient echo EPI sequence (TR = 2000 ms, TE = 25 ms, FOV = 192
cm, flip angle = 80°, bandwidth = 2604 Hz/px, echo spacing = 0.29 ms). Thirty-five
contiguous (3 x 3 x 3 mm voxels) oblique-axial images were acquired parallel to the AC-
32
PC line. Imaging data analysis was performed with Brain Voyager software (version 1.9:
Brain Innovation, Maastricht, The Netherlands). Data were corrected for excessive
motion (using a cutoff of 2 mm within a run) and slice scan time adjustments were made
using sinc interpolation. Spatial filtering was performed using a three-dimensional
Gaussian filter (4 mm FWHM) while temporal filtering was used with voxel-wise linear
detrending and high-pass filtering of frequencies (three cycles per time-course). Finally,
structural and functional data for each participant were transformed into standard
Talairach stereotaxic space (Talairach & Tournoux, 1988).
A random-effects analysis was performed on the functional data using a general
linear model (GLM) that estimated beta weights for two boxcar predictors (cue phase and
decision phase) and one parametric predictor time-locked to the onset of the decision
phase that varied in accordance to the five levels of probability (0.20, 0.35, 0.50, 0.65,
0.80). This analysis allowed for the non-biased identification of functionally defined
regions of interest (ROIs) that correlated with risk level. Previous studies have examined
neural coding of expected value of rewards (e.g., Knutson & Cooper, 2005) and how this
process is modulated by emotion regulation (Delgado, Gillis, & Phelps, 2008; Staudinger,
Erk, Abler et al., 2009); thus a goal of the current study was to extend that research by
probing neural coding of risk (i.e., probability) information during decision-making and
examining modulation by emotion regulation. Statistical maps were created using the
False Discovery Rate (FDR) method with a threshold of q < 0.01 (Genovese, Lazar, &
Nichols, 2002), and functional ROIs were extracted based on a peak voxel center and a
cluster extent of 10 voxels in all directions. To test for modulation by emotion regulation,
mean parameter estimates (i.e., beta weights) were extracted from the functional ROIs

33
defined by the parametric probability predictor using a second GLM that included 18
different predictors that indicated the instruction (Look, Relax, Excite) and subsequent
choice (risky, safe, stamp) at the time of the cue phase and the instruction (Look, Relax,
Excite) and choice (risky, safe, stamp) at the time of the decision phase. Additionally,
missed trials and six motion parameters were included as predictors of no interest.
Analysis of variance (ANOVA) tests were then performed on the extracted beta weights
to probe the effects of emotion regulation on decision-making under risk during the
decision phase.
2.3 Results
Behavioral results.
Subjective ratings. Subjective ratings of excitement experienced during
presentation of the CS+ (the slot machine) and the CS- (the stamp machine) cues were
acquired throughout the experiment to verify the affective value attributed to CS+ trials.
Specifically, these ratings were collected six times during the experimental task, once
after each of the six experimental blocks of trials, and were independent of the emotion
regulation manipulation (i.e., did not include the instruction words Look, Relax, Excite).
Participants rated how excited they felt when they saw the slot machine and the stamp
machine using a Likert scale (1 = not at all excited; 7 = extremely excited). Using ratings
from all participants a comparison of the averaged ratings was made with a repeated-
measures ANOVA with CS type (slot machine, stamp machine) as a within subjects
factor. Participants felt significantly more excited about the slot machine (M = 5.32, SD
= 0.83) than the stamp machine (M = 2.97, SD = 1.19) during the task, F(1, 29) = 107.07,

34
p = 0.000, suggesting that participants associated the slot machine cue with an
opportunity for reward.
After the scanning session, all participants completed a post-experiment
questionnaire, which addressed whether they had effectively used the two imagery-
focused regulation strategies. Specifically, participants rated how successful they were at
visualizing relaxing imagery using a Likert scale in which 1 = not at all successful and 7
= very successful. Participants also completed this rating for the excite visualization.
These subjective ratings provide an index of regulation success, and they suggest that on
average participants felt fairly successful at the Relax (M = 5.07, SD = 1.76) and Excite
(M = 5.43, SD = 1.48) techniques.
Decision-making. To examine the effect of regulation on risk-taking, a repeated-
measures ANOVA with type of strategy (Look, Excite, Relax) as a within-subjects factor
and success ratings for relax and excite regulation as between-subjects factors was
estimated. Success ratings were included to account for the observed individual
differences in application of the emotion regulation strategies. The ANOVA revealed a
significant main effect of instruction, F(2, 32) = 5.47, p = 0.009, suggesting that
cognitive strategies can influence decision-making under risk. Moreover, a trend that
approached significance for an interaction of instruction and relax success ratings was
observed, F(8, 32) = 2.03, p = 0.07. Specifically, participants who experienced perceived
success in applying the relax strategy chose the risky option less often during Relax
compared to Look trials. The interaction of instruction and excite success ratings was not
significant, however, F(8, 32) = 1.08, p = 0.40. These results suggest that when
presented with a conditioned cue that represents reward, engaging in relax-focused

35
emotion regulation, but not excite-focused emotion regulation, alters subsequent
decision-making.
Given the effectiveness of the relax-focused regulation and the lack of excite-
focused regulation effects, all further analyses excluded the excite condition. To further
probe the observed effect of the relax emotion regulation strategy on risk-taking, we
divided participants into two groups based on their relax visualization success rating.
Participants who rated themselves as successful (ratings of 5 to 7) were considered to be
effective regulators (n = 20), while those that rated their performance as neutral or
unsuccessful (ratings of 1 to 4) were considered to be non-regulators (n = 10). Notably,
participants in the regulators group rated the relax strategy as significantly easier to
implement than participants in the non-regulators group [regulators: M = 6.3, SD = 0.73,
non-regulators: M = 4.5, SD = 1.84; t(28) = 3.85, p = 0.0006].
Using these two groups, the effect of Relax emotion regulation on decision-
making was probed with a repeated-measures ANOVA using type of instruction (Look,
Relax) as a within-subjects factor and group (regulator, non-regulator) as a between-
subjects factor. A significant interaction of type of instruction and group was found, F(1,
28) = 4.20, p = 0.05, suggesting that regulator status influenced the effect of the relax
emotion regulation strategy on decision-making. We then compared the proportion the
risky option was chosen across each instruction type (Look, Relax) for both the regulator
and non-regulator groups separately (Figure 2.2). In the regulators, the proportion that
the risky option was chosen was lower during Relax compared to Look trials, t(19) =
2.19, p = 0.04, suggesting that the successful use of emotion regulation strategies

36
modulated decision-making under risk. This difference in risk-taking between Relax and
Look was not observed in the non-regulators, t(9) = 1.11, p = 0.30.
To ensure the observed change in risk-taking in the regulator group was due to
decreases in risk-taking associated with successful use of the relax emotion regulation
strategy and not increases in risk-taking associated with the Look condition we assessed
decision-making in the absence of any instruction cues. Specifically, participants were
asked to complete a questionnaire with 15 financial decisions, which consisted of the five
financial decisions from the scanner task and two variations (the amounts plus and minus
$0.50). This questionnaire was completed at least one day after the scanning session and
in this follow-up decision-making questionnaire did not differ from those observed in the
Look condition for either group of participants, supporting the main result of decreases in
risky behavior after successful use of the relax emotion regulation strategy.
Decision-making: Reaction time. An ANOVA was performed to probe
differences in reaction time using instruction (Look, Relax) and choice (risky, safe) as
within-subjects variables and group (regulator, non-regulator) as a between-subjects
variable. No significant effects were observed for any of the contrasts, suggesting that
reaction time did not differ as a function of instruction or choice, or across regulators and
non-regulators.
Comparison of regulators and non-regulators on individual differences
measures. All participants completed a series of questionnaires to probe potential
individual differences. As previously described, the post-experimental questionnaire
divided participants into regulators and non-regulators based on their perceived success

37
in using the imagery-focused regulation strategy. While these groups differed with
respect to how emotion regulation influenced their decision-making, we did not find
differences between the groups on any of the individual difference measures we obtained.
Regulators and non-regulators did not show different levels of risk aversion as assessed
by the Holt & Laury (2002) questionnaire, suggesting that the different patterns of
decision-making observed in these groups were not due to different risk preferences.
These groups also did not differ on the subscale scores of the Emotion Regulation
Questionnaire, which assesses use of emotion regulation in daily life, (Gross & John,
2003). Finally, the groups showed no differences in approach- and avoidance-focused
motivation as measured by the Behavioral Inhibition and Activation Scales (Carver &
White, 1994). Although it is possible that these groups may differ in ways not probed by
these selected questionnaires, the results highlight the major difference between the two
groups as their success at visualizing the relaxing imagery.
Neuroimaging results.
All subjects. Neuroimaging analysis focused on the decision phase and sought to
indentify brain regions recruited during decision-making that were modulated by emotion
regulation. Regions of the brain involved in processing risk and reward were identified
using a GLM in which the probability of winning each risky lottery (0.20, 0.35, 0.50,
0.65, 0.80) was included as a parametric regressor time-locked to the onset of the
decision phase. This GLM revealed brain regions whose BOLD signals correlated with
increasing probability of reward, including various structures that have been previously
associated with risky decision-making in humans (see Table 2.2): the striatum with a loci
of activation that extended ventrally (Christopoulos, Tobler, Bossaerts et al., 2009; Hsu,

38
Krajbich, Zhao, & Camerer, 2009; Kuhnen & Knutson, 2005; Matthews, Simmons, Lane
et al., 2004; Tom, Fox, Trepel, & Poldrack, 2007), the midbrain (Tom, Fox, Trepel et al.,
2007), the insula (Kuhnen & Knutson, 2005), and the medial frontal cortex
(Christopoulos, Tobler, Bossaerts et al., 2009; Engelmann & Tamir, 2009).
Modulation of ventral striatum activity by emotion regulation was an a priori
prediction. To test for effects of emotion regulation, a second GLM was applied to the
left ventral striatum ROI to extract mean beta weights. This GLM included cue phase
and decision phase predictors that each specified the type of strategy (Look, Relax,
Excite) and option chosen (risky, safe). The cue and decision phase predictors were
matched in starting time and duration to their task events. The decision phase beta
weights were input into a repeated-measures ANOVA with instruction and choice as
within-subjects factors and success ratings for relax and excite regulation as between-
subjects factors. The ANOVA demonstrated a significant interaction of strategy and
choice, F(2, 30) = 4.70, p = 0.02, and a trend for an interaction of strategy, choice and
relax success rating, F(8, 30) = 1.94, p = 0.09, in the left ventral striatum. Echoing the
behavioral analysis, there were no interactions involving excite success ratings, F(8, 30)
= 1.25, p = 0.30. Post-hoc paired t tests showed that in trials without emotion regulation
(Look), the BOLD response was significantly greater when participants made risky
choices compared to safe ones, t(29) = 2.49, p = 0.02. This heightened natural response
to risky choices was diminished in the relax regulation trials such that there was no
difference in the level of activity for risky and safe choices, t(29) = 0.81, p = 0.42. These
results demonstrate that regulation dampened activity associated with risky choices.

39
Regulators: Shifts in striatum activity with regulation. Given the influence of
the relax emotion regulation strategy on risk-taking observed in the behavioral results,
along with the lack of behavioral or neural effects with the excite regulation strategy,
additional neuroimaging analyses were conducted focusing specifically on the regulators
group defined by relax success ratings. Using the 20 regulator participants, regions
whose BOLD signals correlated with increasing probability of reward were identified
with the parametric GLM described above. Of particular interest are results highlighting
the modulation of both left and right ventral striatum BOLD signals during risky
decision-making by the relax emotion regulation strategy (Figure 2.3A). In the left
ventral striatum (Figure 2.3B), a main effect of strategy, F(1, 19) = 6.85, p = 0.02, a main
effect of choice that approached significance, F(1, 19) = 4.25, p = 0.05, and an interaction
of strategy and choice, F(1, 19) = 6.76, p = 0.02, were observed. Specifically, greater
BOLD signals in the left ventral striatum were observed when participants chose the
risky option compared to when they chose the safe option during trials where they were
responding naturally [Look condition; t(19) = 3.51, p = 0.002], but not after they used
emotion regulation strategies [Relax condition; t(19) = 0.63, p = 0.54] as assessed by
post-hoc paired t tests. BOLD signals were lower during Relax than Look when the
choice was the risky option, t(19) = 2.90, p = 0.009, while no significant effects of
instruction were found when the decision was to take the safe option, t(19) = 0.08, p =
0.94. Finally, beta weights associated with control decisions (CS-), a choice between two
postage stamps, were also obtained. While both Look and Relax instructions were used
in the control trials, no modulation was expected in the ventral striatum as the control
decisions did not involve risky propositions or rewards. As expected, no significant

40
differences between Look and Relax beta weights for the control condition were seen,
suggesting that emotion regulation effects were particular to trials where a risky decision
was presented.
Similar patterns emerged in the right ventral striatum (Figure 2.3C), depicted by a
trend approaching significance for a main effect of strategy, F(1, 19) = 3.70, p = 0.07, a
significant main effect of choice, F(1, 19) = 4.88, p = 0.04, and an interaction of
instruction and choice, F(1, 19) = 7.06, p = 0.02. Greater activity in the right ventral
striatum was observed when participants chose the risky option, compared to when they
chose the safe option during trials in which they acted naturally [Look condition; t(19) =
4.00, p = 0.0008], but not after using emotion regulation [Relax condition; t(19) = 0.31, p
= 0.76]. Additionally, BOLD signals were influenced by strategy; specifically, activity
was lower during Relax than Look when the choice was risky, t(19) = 2.53, p = 0.02, as
observed in the left striatum ROI. Interestingly, when the choice was the safe option, in
the right ventral striatum ROI only, BOLD signals were greater during Relax than Look,
t(19) = 2.18, p = 0.04. There were no emotion regulation effects on the BOLD response
for control decisions (CS- trials). Taken together, these results suggest that the relax
emotion regulation strategy modulated brain activity in the striatum associated with
decision-making under risk, particularly decreasing BOLD responses for risky choices.
An additional analysis was performed to test if a specific level of probability (e.g.,
0.50) was driving the observed pattern of BOLD signals in the striatum. Mean beta
weights were extracted from the left ventral striatum region previously defined by the
parametric analysis of probability of reward using a model that included predictors for
instruction (Look, Relax) and level of probability (0.20, 0.35, 0.50, 0.65, 0.80). These

41
beta weights were entered into a repeated measures ANOVA which revealed a main
effect of strategy, F(1, 19) = 5.46, p = 0.03, and a trend for a main effect of probability,
F(4, 76) = 2.07, p = 0.09. Importantly, this region did not show a significant interaction
of strategy and probability, F(4, 76) = 0.27, p = 0.89. The lack of interaction between
strategy and level of probability coupled with the significant main effect of instruction
suggests that the decreased activity associated with risky choices observed in the Relax
condition is not primarily driven by one particular level of probability in this paradigm.
To probe potential interactions between the ventral striatum and other regions, an
exploratory correlation analysis was performed using the left ventral striatum.
Specifically, a whole brain correlation was conducted using the left ventral striatum ROI
as the seed region, which served to identify regions that may be functionally connected
with the striatum. The resulting statistical parametric map was thresholded at p < 0.01
using conservative Bonferroni corrections for multiple comparisons. A cluster in the
dorsal medial prefrontal cortex, located in the dorsal cingulate cortex (x, y, z, = 2, 7, 42),
was observed to correlate with BOLD signals in the left ventral striatum. A post-hoc test
of this region during the use of emotion regulation strategies was further conducted by
extracting beta weights using a simplified GLM with instruction predictions (e.g., Look,
Relax) during the cue phase. This post-hoc paired t test revealed that beta weights for
Relax (regulation condition) trials tended to be greater than those for Look (no regulation
condition), t(19) = 1.81, p = 0.09. While these results are deemed exploratory, they
suggest that the dorsal cingulate cortex was engaged in emotion regulation and may have
mediated control over the striatum during decision-making.

42
Regulators: Additional regions showing modulation by regulation. Within other
regions that correlated with increasing probability of reward during decision-making,
only regions in the midbrain, insula, and superior frontal gyrus (BA 6; encompassing
premotor cortex and supplementary motor area) were found to be modulated by strategy
and/ or choice in the regulators group. An ANOVA performed with beta weights
extracted from the left midbrain, for instance, showed a significant interaction of strategy
and choice, F(1, 19) = 4.60, p = 0.05, with a pattern of results resembling that of the
striatum (Figure 2.4A). Specifically, when participants chose the risky option, a paired t
test revealed that activity in the regulation condition was significantly lower than that in
the Look condition, t(19) = 2.32, p = 0.03, while no differences for safe choices were
seen, t(19) = 0.38, p = 0.71. In the right midbrain region, a main effect of strategy was
observed, F(1, 19) = 5.16, p = 0.04. During the CS- decisions, BOLD signals in the left
and right midbrain region did not vary as a function of instruction.
A trend for an interaction of strategy and choice and was also observed in the left
anterior insula, F(1, 19) = 3.92, p = 0.06, although a main effect of choice was the
primary effect in this ROI, F(1, 19) = 5.01, p = 0.04 (Figure 2.4B). Interestingly, a
different pattern was apparent in a smaller, more dorsal anterior insula ROI in the left
hemisphere, where a main effect of strategy was observed, F(1, 19) = 5.76, p = 0.03,
characterized by decreased activation during regulation. In both insula ROIs, activity
during CS- decisions was not affected by strategy. Finally, activity in the left superior
frontal gyrus (BA 6) during financial (CS+), but not control (CS-), decisions
demonstrated a main effect of strategy, F(1, 19) = 12.23, p = 0.002, such that activity was
decreased after regulation compared to after natural responding.

43
Non-regulators. Two exploratory analyses were conducted to test for effects of
strategy and choice in the non-regulator sample (n=10). First, using the left ventral
striatum ROI defined by the regulator group parametric risk analysis, we extracted mean
beta weights for the non-regulators with the model that included strategy and choice
predictors. An ANOVA found no significant effects of strategy or choice. Similar
results were found with the right ventral striatum ROI defined by the regulator group risk
analysis. Second, a parametric risk analysis was conducted in the non-regulator group
only, leading to the identification of a left ventral striatum ROI defined by this set of
participants. A follow-up ANOVA on beta weights extracted for this ROI did not show
any significant effects of strategy or choice. Interestingly, the non-regulator group did
not show the same heightened response to risky choices in the striatum that was observed
in the regulator group during the natural response condition (Look).
2.4 Discussion
Previous studies have highlighted how an array of emotion regulation strategies
can be used to alter the intensity of emotional experience (for review, see Green & Malhi,
2006; Ochsner & Gross, 2008). The present study suggests that imagery-focused emotion
regulation strategies influence subsequent decision-making. Specifically, participants
who were successful in their application of the imagery-focused relax regulation strategy
(i.e., regulator group) showed a decrease in risky behaviors; in particular selecting a safe,
compared to a risky monetary lottery more often after regulation. This shift in behavior
during decision-making under risk was accompanied by attenuation in BOLD signals in
the striatum, a structure previously linked with reward-related processing (Delgado,
2007; Haber & Knutson, 2010; O'Doherty, 2004; Rangel, Camerer, & Montague, 2008).
44
In contrast, participants who did not effectively use emotion regulation strategies (i.e.,
non-regulator group) failed to show behavioral or neural differences during decision-
making. While further research is necessary to fully understand the conditions in which
regulation can exert its effect (e.g., individual differences), these findings represent a
potential approach to control decision-making under risk that may become compulsive.
Relationship to previous work. The observed relax regulation results support the
idea that successful use of imagery strategies can foster more goal-directed behavior and
promote safer, compared to riskier decision-making. This is in slight contrast with recent
studies that suggest successful use of emotion regulation can lead one to reduce loss
aversion (Sokol-Hessner, Hsu, Curley et al., 2009) and maximize rewards (Seo & Barrett,
2007). One potential difference between these studies is the type of strategy employed.
The strategy used by Sokol-Hessner and colleagues (2009) was focused on the particular
task at hand, asking participants to place less weight on the outcome of a single decision,
experiment, we used a more general imagery-based strategy previously shown to be
successful in attenuating the physiological and neural correlates of conditioned fear
(Delgado, Nearing, LeDoux et al., 2008) and the expectation of reward (Delgado, Gillis,
& Phelps, 2008). While both strategies can be considered a form of cognitive control,
they might exert different influences in the underlying neural circuitry, as observed in
studies comparing reappraisal and distraction strategies during negative emotions
(Kalisch, Wiech, Herrmann et al., 2006; K. McRae, Hughes, Chopra, Gabrieli, Gross, &
Ochsner, 2010), that could cause different effects in behavior. This is an interesting
question that will be addressed in Experiments 2 and 3.
45
Regulator and non-regulator groups. Individual differences with respect to the
effective use of the imagery-based strategy were observed in the current experiment as
measured by post-experimental ratings. A regulator group was defined by perceived
success in applying the Relax strategy, while a non-regulator group comprised
participants who felt they were unable to successfully implement the Relax strategy.
Differences between these two groups were apparent in subjective ratings (how easy was
it to implement strategy), behavioral responses (picking between safe and risky options)
and neural signals (striatum responses during decision-making under risk). Of particular
interest, participants in the regulator group made fewer risky choices than their
counterparts. This behavior was not due to an inherent risk aversion, as both groups risk
preferences did not differ according to a paper test assessment (Holt & Laury, 2002).
Instead, this shift in behavior could be attributed to the successful use of cognitive
strategies.
This decrease in risk-taking with regulation was not observed in the group of self-
assessed non-regulators. Neither was the modulation of striatum activation by the
imagery strategy, consistent with previous studies suggesting that striatum signals during
decision-making can correlate with success in task performance (Schonberg, Daw, Joel,
& O'Doherty, 2007). The non-regulators did not show increased BOLD signal for risky
compared to safe choices during natural responding. This lack of difference could
indicate that the risky choices represented lower reward values for the non-regulators. It
is possible that no regulation-associated changes were observed in the striatum of non-
regulators, because there was no risky-safe difference during Look. While these null
findings should be interpreted with caution given the nature of null findings in fMRI

46
analysis and the small sample size of the non-regulator group (n = 10), the observations
are in line with the non- -reports and behavioral results.
Perhaps a different kind of regulation strategy such as reappraisal would have
been more affective at altering decision-making in the non-regulators. The non-
regulators rated the imagery strategy as significantly more difficult than the regulators,
suggesting employing imagery regulation may have been challenging. It is unlikely that
the non-regulators are simply unable to regulate reward cues, but rather the imagery
strategy may not have been the best fit or they may have needed additional training.
Finally, it is possible that fatigue contributed to the non-
using the imagery regulation, as the task duration was about 40 minutes.
While the regulators and non-regulators did not differ in any individual measures
used in our study, only a few individual differences measures were assessed. Additional
research may probe potential differences that allow some to exert better control over their
decisions. For instance, are there specific traits, or perhaps more likely, do certain
situational factors (e.g. type of strategy attempted, amount of effort applied) determine
whether a person will be able to successfully employ regulation?
Neural correlates of risk and regulation. The current study found that activity
in ventral striatum of regulators was influenced by the use of cognitive regulation, in
accordance with previous research (Delgado, Gillis, & Phelps, 2008; Staudinger, Erk,
Abler et al., 2009). Yet, such studies focused mostly on reward expectations and
learning, while the current paradigm focuses on the role of emotion regulation on
decision-making under risk. The human striatum is often identified during investigations
of reward and risky decision-making (Christopoulos, Tobler, Bossaerts et al., 2009;

47
Kuhnen & Knutson, 2005; Matthews, Simmons, Lane et al., 2004), showing greater
responses as expected reward values increase (Knutson & Cooper, 2005; Tom, Fox,
Trepel et al., 2007; Yacubian, Glascher, Schroeder, Sommer, Braus, & Buchel, 2006) and
patterns of activity that suggest processing of reward probabilities (Abler, Walter, Erk,
Kammerer, & Spitzer, 2006; Hsu, Krajbich, Zhao et al., 2009; Yacubian, Sommer,
Schroeder, Glascher, Braus, & Buchel, 2007). Building on previous research that
suggests expected value-related reward activity in the striatum is modulated by emotion
regulation (Delgado, Gillis, & Phelps, 2008; Staudinger, Erk, Abler et al., 2009), we
chose to model reward probability in our analyses to probe the role of the striatum in
probability (risk) coding during decision-making and the effects of emotion regulation on
this process. In our experiment, during the decision phase for regulation trials, regulators
showed decreased activity in the ventral striatum overall, and especially during trials
where a risky choice was made, suggesting that effective regulation can dampen the
natural heightened response to decisions involving risk.
The BOLD signal observed in the striatum during the decision-phase may reflect
deliberation with respect to the two options, the choice itself and a reaction to the choice
made. While our model accounted for increasing probability of reward, the magnitude of
the options might have influenced neural activity. The expected value of the risky and
safe options was equated, but the magnitude of the risky option was always higher. Thus,
the increased activity observed in ventral striatum for risky relative to safe choices during
Look trials could perhaps be explained by the greater magnitude of the risky option, in
turn suggesting that the lack of differentiation between risky and safe choices by the
ventral striatum during regulation may indicate regulation-induced disruption of the

48
ability to code reward magnitude. This interpretation is in line with a recent paper that
found that distance-focused regulation disrupted expected-value coding in the ventral
striatum such that during regulation trials ventral striatum activity failed to differentiate
high and low magnitude cues (Staudinger, Erk, Abler et al., 2009). Nevertheless,
participants who successfully employed cognitive strategies prior to making financial
decisions made fewer risky choices and showed attenuated BOLD signals in the striatum.
Whether emotion regulation specifically affects the coding of the magnitude of potential
rewards or the perception of probability (risk) inherent in the decision process is a topic
for further exploration that will continue to advance our understanding of the ability to
control emotional responses for adaptive function.
The ventral striatum is an integral component of a corticostriatal circuit involved
in motivated behaviors (Alexander & Crutcher, 1990; Balleine, Delgado, & Hikosaka,
2007; Haber & Knutson, 2010; Middleton & Strick, 2002), with important connections
with cortical regions, such as orbitofrontal cortex and the anterior cingulate cortex (Haber
& Knutson, 2010). Given the connectivity of the ventral striatum, it is plausible that the
observed decrease in ventral striatum activity in the regulator group during decision-
making after using emotion regulation may have been driven in part by cortical signals.
An exploratory analysis revealed that BOLD signals in dorsal cingulate cortex (BA 24)
correlated with those from the left ventral striatum, suggesting a potential functional
connectivity that may underlie the control of striatum responses during decision-making.
Further analysis of the BOLD response within this cingulate region revealed a trend for
greater recruitment during the use of regulation strategies than natural responding, which
is consistent with findings from previous emotion regulation studies (Eippert, Veit,

49
Weiskopf, Erb, Birbaumer, & Anders, 2007; Kim & Hamann, 2007; Ochsner, Bunge,
Gross et al., 2002; Phan, Fitzgerald, Nathan et al., 2005; Staudinger, Erk, Abler et al.,
2009). Although this analysis is exploratory and thus results should be interpreted with
caution, the findings point to the recruitment of cortical regions such as the dorsal
cingulate cortex during regulation as potential modulators of striatal responses during
decision-making.
In addition to the striatum, the effective use of regulation led to attenuation of
BOLD signals in the midbrain and insula. The midbrain results are particularly
interesting given that it includes dopaminergic centers that project to the striatum (Haber
& Knutson, 2010), and much like the striatum, BOLD signals in the midbrain increase in
conjunction with increasing reward values during decision-making under risk (Tom et al.,
2007), suggesting that cognitive strategies can have a global impact on the neurocircuitry
involved in reward and decision-making. Regulation strategies also had an effect in the
insula, a region implicated in risky decision-making (Clark, Bechara, Damasio, Aitken,
Sahakian, & Robbins, 2008; Kuhnen & Knutson, 2005) perhaps coding different levels of
risk (Preuschoff, Quartz, & Bossaerts, 2008). Specifically, a marginal interaction of
instruction and choice was seen in the anterior insula, while an instruction effect was
observed in a more dorsal anterior insula ROI. Future research is needed to fully
characterize the anatomical and functional dissociations within the insula as a function of
emotion regulation during decision-making.
Excite condition. This study employed two opposite imagery-focused regulation
strategies, Relax and Excite. No significant shifts in risk-taking or neural activity were
associated with the Excite strategy. There are several possible explanations for why we

50
did not observe an effect of excite regulation on decision-making, given that relax
regulation did influence decision-making. Although the majority of participants rated
themselves as successful at visualizing the exciting imagery, they also reported the need
to periodically update the exciting images that they thought about as over time these
images lost their potency. Additionally, there were some conflicts between what
participants wanted to imagine (e.g., Las Vegas casinos) and the instruction to think of
something non-task specific (e.g., a roller coaster). Finally, it is possible that the level of
excitement achieved with the Excite strategy may have been comparable to that which
participants experienced when naturally responding to the slot machine cue. If similar
affect was associated with the Excite and Look condition, that could underlie the lack of
observed differences in risk-taking between these conditions. Future work could address
this question by including affect ratings during the task.
Conclusions. Emotion regulation strategies have been traditionally used to
control emotional responses induced by stimuli such as pictures, movies or narratives that
evoke negative affect (for review, see Ochsner & Gross, 2008). More recently, such
strategies have also been applied to positive emotions evoked by pictures, food stimuli or
cues that predict reward (Delgado, Gillis, & Phelps, 2008; Hare, Camerer, & Rangel,
2009; Kim & Hamann, 2007; Staudinger, Erk, Abler et al., 2009; Wang, Volkow, Telang,
Jayne, Ma, Pradhan et al., 2009). Here, we extend these findings by focusing on the
influence of emotion regulation strategies on decision-making processes and associated
neural circuits. This research has applications ranging from simple decisions such as
dieting (e.g., Hare, Camerer, & Rangel, 2009) to more complex decisions where goal-
directed and habit learning systems may be at conflict, such as substance abuse (e.g.,

51
Balleine & O'Doherty, 2010; Everitt, Belin, Economidou, Pelloux, Dalley, & Robbins,
2008; Nelson & Killcross, 2006).

52
Chapter 3
The Effect of Imagery and Cognitive Emotion Regulation Strategies on Decision-
Making
3.1 General Introduction and Hypotheses
In daily life, appetitive cues signal the opportunity to gain rewards and promote
approach behaviors, actions aimed at increasing our chances of obtaining a reward.
Often larger rewards may be gained by taking a risk. For example, a billboard
advertising the current lottery jackpot may prompt us to consider buying a lottery ticket.
We compute the value of the available options, giving up a dollar for a small chance to
win millions or keeping the dollar, and determine whether the risk is worth taking. Thus,
our behavior, specifically our decision-making, is influenced by the value of available
rewards (Rangel, Camerer, & Montague, 2008)
decisions in a neutral emotional state; our affective and cognitive responses to the
rewards also influence our decision-making. The excitement evoked by seeing value of
the jackpot might cause us to overlook our low odds of winning the lottery. Fortunately,
we have the unique ability to alter our responses to salient cues using a variety of emotion
regulation strategies (e.g., Ochsner & Gross, 2008). For instance, when faced with an
emotional stimulus we can alter our affective response to it by using an imagery-focused
strategy, imagining a calming scene instead of focusing on the stimulus itself (Delgado,
Gillis, & Phelps, 2008; Delgado, Nearing, LeDoux et al., 2008), or by employing a
cognitive reappraisal strategy, changing our description of the stimulus to decrease or
increase its impact.

53
Experiment 1 and other recent research has demonstrated that these emotion
regulation strategies can be applied in decision-making contexts (Heilman, Crisan,
Houser, Miclea, & Miu, 2010; Martin & Delgado, 2011; Sokol-Hessner, Hsu, Curley et
al., 2009). However, it remains unclear whether imagery and reappraisal regulation
strategies produce the same effects on financial decision-making, specifically risk-taking.
Additionally, it is not known whether the effects of emotion regulation on risk-taking are
independent of or interact with the value of the decision options. The present
experiments address these two questions by examining the effects of two regulation
strategies, imagery-focused (Experiment 2) and reappraisal (Experiment 3), on risk-
taking in financial decisions in which the value of the two options is systematically
varied.
Two specific types of antecedent-focused (Gross, 2002) emotion regulation
strategies, imagery-focused (Delgado, Gillis, & Phelps, 2008; Delgado, Nearing, LeDoux
et al., 2008) and cognitive (e.g., Ochsner, Bunge, Gross et al., 2002; Ochsner & Gross,
2008) have been used with decision-making paradigms. Experiment 1 of this dissertation
probed shifts in financial decision-making associated with imagery-focused regulation
(Martin & Delgado, 2011). Participants visualized a relaxing image such as a beach
sunset when faced with cues signaling upcoming financial decisions. Participants who
felt successful at visualizing the imagery reduced their risk-taking (Martin & Delgado,
2011). Using a different financial task, Sokol-Hessner and colleagues found that
successful use of a cognitive technique, attempting to think like a stock trader assembling
a portfolio, during decision-making reduced risk-aversion and increased risk-taking
(Sokol-Hessner, Hsu, Curley et al., 2009). These studies examined regulation of

54
emotions and thoughts that were putatively elicited by the opportunity for money rewards
and the decision-making task.
Incidental emotions, those unrelated to the decision-making task, also can
influence behavior (Lerner, Small, & Loewenstein, 2004; Winkielman, Berridge, &
Wilbarger, 2005). One study that investigated the regulation of incidental emotions
showed that participants who used reappraisal while viewing disgust and fear movie clips
showed increased risk-taking in a subsequent financial risk-taking task, the Balloon
Analogue Risk Task (BART), compared to participants who engaged in suppression or
did not use emotion regulation during the movies (Heilman, Crisan, Houser et al., 2010).
As the financial risk-taking tasks and regulation strategies differed across these studies, it
remains unclear whether different types of regulation strategies affect decision-making in
a similar manner and which strategy is most effective for a given context. Additionally,
it is unknown if the effects of regulation on risk-taking would persist in more complex
financial decision contexts, for instance those in which a risk is worth taking.
Evidence from previous research suggests that reappraisal and imagery-focused
strategies may have different effects on behavior. Although reappraisal and imagery-
focused regulation have yielded similar decreases in affective responses in non-decision-
making studies, they were tested on different types of affective stimuli, pictures and
conditioned cues, and with different dependent measures, emotion experience self-reports
and skin conductance physiological measures. Moreover, imagery-focused regulation
(Delgado, Gillis, & Phelps, 2008; Delgado, Nearing, LeDoux et al., 2008; Martin &
Delgado, 2011) and reappraisal (Gross, 1998a; Ochsner & Gross, 2008) are
fundamentally different in two important ways. First, reappraisal involves focusing

55
attention and thoughts on the affective stimulus, whereas imagery-focused regulation
involves directing attention internally instead of at the affective stimulus. Second,
reappraisal involves decreasing (or increasing) the emotional response elicited by the
stimulus, whereas imagery-focused regulation involves creating a new emotion, typically
a feeling of calm, instead of directly altering the emotion elicited by the stimulus.
In the current experiments, these two strategies were applied to cues that preceded
financial decisions. Given the different mechanisms of imagery and reappraisal
regulation, it is unclear whether these strategies will elicit the same shifts in risk-taking.
Additionally, it is not known if emotion regulation will lead to global shifts in risk-taking
regardless of the value of the decision options, or if regulation effects will interact with
the value information. One way to assign value to each option is to calculate the
expected value of each decision option, the product of the probability of winning and the
amount to be won, for instance, a 50% chance of winning $10 has an expected value of
$5. Experiment 1 found that the imagery strategy decreased risk-taking (Martin &
Delgado, 2011); however, the design did not manipulate the relative expected values of
the decision options, leaving the relationship between value information and emotion
regulation untested.
In the current experiments, the financial decisions consisted of binary choices
between risky and safe options. Additionally, three different types of decisions were
created by manipulating which option, risky or safe, had the greatest EV: risky > safe,
safe > risky, and risky = safe. The type of regulation strategy was manipulated between
experiments. In Experiment 2 participants used imagery-focused strategies, and in
Experiment 3 a separate group of participants employed cognitive reappraisal strategies.

56
As in Experiment 1, the imagery participants engaged in regulation by visualizing a
relaxing scene in their mind (Relax), rather than focusing on the upcoming decision itself.
The reappraisal participants engaged in regulation during cue presentation by increasing
(Emphasize) or decreasing (Deemphasize) the subjective importance of the upcoming
decision by changing their thoughts. As in Experiment 1, both experiments included a
control condition (Look) in which participants responded naturally to the cue.
Additionally, the same set of decisions was used in both experiments, so that we could
make exploratory comparisons between the two strategy categories. The dependent
variable of interest was a measure of risk-taking, the proportion of time that the risky
option was chosen, as in Experiment 1. Physiological measures of general arousal, skin
conductance responses (SCRs), were collected during cue presentation to assess if
emotion regulation altered physiological responding.
We hypothesized that decision type and emotion regulation would exert
independent effects on risk-taking. We expected that participants' decision-making
would be affected by the different decision types such that risk-taking would be highest
when the EV of the risky option was greater than that of the safe option and lowest when
the EV of the risky option was less than that of the safe option. Although the reappraisal
and imagery strategies involve different psychological mechanisms, we predicted both
would alter risk-taking relative to the no regulation condition. With regard to the
imagery regulation, we hypothesized that relax regulation would bias choices in favor of
the safe options regardless of their EV. If this result was observed, it would suggest that
the imagery regulation simply decreases risk-taking. However, if the imagery regulation
biases choices in favor of the option with the greater value, regardless of whether that

57
option is risky or safe, this result would suggest that this strategy fosters more optimal
decision-making. Understanding the fundamental nature of imagery regulation will allow
for better real world application of this strategy. For Experiment 2, we hypothesized that
the reappraisal strategies would alter decision-making in opposite ways. Specifically,
regardless of the decision type, Emphasize reappraisals would decrease risk-taking and
Deemphasize reappraisals would increase risk-taking relative to no regulation. With
regard to physiological responses, we predicted that imagery regulation would decrease
SCRs relative to natural responding in Experiment 2. In Experiment 3, we hypothesized
that Emphasize regulation would increase SCRs and Deemphasize regulation would
decrease SCRs relative to natural responding.
3.2 General Methods
Procedure overview. Participants completed the experimental task on a PC
computer in a testing room at Rutgers University. Prior to starting the task, participants
received instructions for the game and were trained on in applying the emotion regulation
technique. During the experimental task skin conductance measurements were collected
to assess general arousal responses to the reward cues. The experimental task, the Slot
Machine Game (SMG), was adapted from that used in Experiment 1 and was
programmed using E-Prime (Psychology Software Tools). Briefly, the SMG consisted of
the presentation of a strategy word that prompted natural responding or regulation when
faced with the cue, a slot machine image signaling the opportunity to win money, and
finally, a financial decision between two options. There were two versions of the SMG,
which differed in the regulation techniques they involved. The imagery SMG

58
(Experiment 2) employed the imagery-focused regulation strategy used in Experiment 1
and previous work (Delgado, Gillis, & Phelps, 2008; Delgado, Nearing, LeDoux et al.,
2008). The reappraisal SMG (Experiment 3) employed two reappraisal strategies, which
were designed for this study and adapted from previous work (e.g., Ochsner et al., 2004,
Sokol-Hessner et al., 2009). After the task was complete, participants completed several
questionnaires, were debriefed, awarded research credits and paid.
The Slot Machine Game (SMG). In the SMG, each trial started with the
presentation of a strategy word for a fixed duration of 2 s followed by the cue phase,
which was the presentation of a reward cue (slot machine) for a variable duration of 4 or
6 s. The cue phase was followed by the decision phase, in which participants had a
maximum of 4 seconds to indicate their choice by pressing a button. The decisions were
always between two monetary options: a gamble (risky option, e.g., 50% chance of
winning $8.41) and a guaranteed amount (safe option, e.g., 100% chance of winning
$4.20) that varied with respect to probability and magnitude both within and across
decisions. A 4 or 6 s inter-trial interval (display of a fixation cross in the center of the
screen) followed the decision phase.
To create different decision types we manipulated the expected value (EV)
difference between the two options. Decisions consisted of options of equal EV (neutral
condition), greater EV for the risky option (good condition), or greater EV for the safe
option (bad condition); See Table 3.1 for a list of the financial decisions used.
Participants were not explicitly made aware of these contingencies. There were nine
unique financial decisions in the task, one of each combination of decision type (neutral,
good, bad) and level of risk (0.35, 0.50, 0.65). The location, right or left side of screen,
59
of the risky and safe options was counterbalanced. Participants responded using the
keyboard; the 1 key indicated a choice of the left option, the 2 key the right option.
The strategy word presented at the start of a trial directed participants either to
respond naturally to the slot machine, that is, to think about the decision coming up and
regulation, either imagery-focused (Experiment 2) or reappraisal (Experiment 3).
Prior to beginning the experimental task, all participants were extensively trained
on the task instructions, especially the application of the emotion regulation techniques.
They were informed that a slot machine picture would serve as the cue signaling an
upcoming decision and opportunity to win money. They were instructed that the word
presented just before the slot machine would serve as the strategy for that trial.
Importantly, in both Experiment 2 and Experiment 3 efforts were taken to reduce or
eliminate any experimental demand. Participants were directed to engage in the strategy
for only the duration of the slot machine image (reward cue) presentation; once the
decision options appeared, participants were to focus on the decision and make a choice.
Participants were explicitly told that no matter what word they saw at the beginning of
the trial, the decisions were always up to them, and they were free to choose however
they liked.
Monetary incentives and payment. Participants did not receive immediate,
within-task feedback about the outcomes of their decisions. To ensure the perception that
each decision was independent and significant, two randomly chosen decisions were
realized at the end of the experimental session, and participants were informed during
training that they would be paid based on their choices in two randomly selected

60
decisions. Participants were compensated whatever amount they won, with a minimum
possible compensation of $0 and a maximum possible compensation of $20. At the end
of the experiment, participants randomly selected two decisions, and they were paid
based on the option they chose in each decision. Participants in Experiment 2 received an
average of $7.75 (SD = $3.51), and participants in Experiment 3 received an average of
$8.11 (SD = $3.11).
Questionnaires. In addition to the SMG, all participants completed several
questionnaires including a post-experimental questionnaire that assessed compliance with
the emotion regulation demands and measured perceived successful use of cognitive
strategies. After the SMG, all participants completed questionnaires that assessed
individual differences that may be related to risk-taking or successful emotion regulation:
measures of risk preferences (Holt & Laury, 2002), use of emotion regulation strategies
(Emotion Regulation Questionnaire; Gross & John, 2003), behavioral inhibition and
activation (BIS/BAS; Carver & White, 1994), hope (the Hope Scale; Snyder, Harris,
Anderson, Holleran, Irving, Sigmon et al., 1991) and emotional intelligence (Trait Meta-
Mood Scale; Salovey, Mayer, Goldman, Turvey, & Palfai, 1995). Additional individual
differences measures were completed as part of an online survey prior to the
experimental session: differentiation of emotions (Kang & Shaver, 2004), self-esteem
(Rosenberg, 1989), social support (Social Provisions Scale; Cutrona & Russell, 1987) and
big five personality traits (Ten-Item Personality Inventory; Gosling, Rentfrow, & Swann,
2003). From these questionnaires, these 11 scores were used for the individual
differences analyses described below: risk preferences, ERQ reappraisal, ERQ

61
suppression, BAS reward, Hope agency, Hope pathways, TMMS repair, DOE range,
DOE openness, self-esteem, and TIPI emotional stability.
Skin conductance data collection and analysis. Skin conductance responses
(SCRs) were collected using the BIOPAC systems skin conductance module (BIOPAC
second and third fingers in their non-dominant hand. AcqKnowledge software was used
to analyze SCR waveforms (BIOPAC Systems, Goleta, CA). SCR waveforms were low-
pass filtered using a Blackman window (cutoff frequency = 31 Hz) and smoothed over
three consecutive data points prior to scoring. The level of SCR was assessed as the base
to peak difference for an increase in the 0.5 to 4.5 s window following the onset of the
reward cue (LaBar, LeDoux, Spencer, & Phelps, 1995). A minimum response criterion
of 0.02 microSiemens was used, and all responses below this criterion were scored as 0.
Responses were square-root transformed prior to statistical analysis to reduce skewness
(LaBar, Gatenby, Gore, LeDoux, & Phelps, 1998). Participants that showed a low level
of responses (less than one standard deviation from the average number of responses)
were excluded from further analysis. Acquired SCRs for each participant were averaged
per type of trial (regulation or no regulation condition). Repeated measures ANOVA was
used to test for effects of regulation on physiological responding.
Data analysis. The SMG task included two independent variables: strategy type
(natural responding or regulation) and decision type (neutral, good, bad). There were
quantified as the average proportion that the risky option was chosen. Choice data were
analyzed to test for effects of strategy type and decision type on risk-taking using a

62
repeated-measures analysis of variance (ANOVA) in SPSS. Given that Experiment 1
found that self-reported success with employing the regulation strategy influenced the
risk-taking results, an additional ANOVA was conducted using the regulation success
ratings from the post-experiment questionnaire as a covariate.
Previous research found that women show greater emotional responses than men
(Kring & Gordon, 1998), and because of these differences in emotional expression many
studies of emotion regulation have used only women (Goldin, McRae, Ramel et al., 2008;
Kim & Hamann, 2007; K. McRae, Hughes, Chopra et al., 2010; Ochsner, Bunge, Gross
et al., 2002; Ray, Ochsner, Cooper, Robertson, Gabrieli, & Gross, 2005). There was one
study that included both genders and directly tested for gender differences, but only
neural differences were observed; regulation decreased negative emotions to a similar
degree in men and women (Kateri McRae, Ochsner, Mauss, Gabrieli, & Gross, 2008).
Given the limited data comparing emotion regulation effects in men and women and a
sample of men and women large enough to compare the genders, we performed
exploratory ANOVAs with strategy and decision type as within-subjects variables and
gender as a between-subjects variable.
A secondary goal of the study was to assess relationships between scores on the
11 individual difference measures and shifts in risk-taking associated with regulation. To
determine these relationships, regulation scores (RegScore) were calculated for each
participant by subtracting the proportion the risky option was chosen in the regulation
condition from Look for each decision type (good, bad, neutral). These RegScores were

63
3.3 Experiment 2: The effect of imagery-focused regulation on risk-taking across
different financial decisions
3.3.1 Methods.
Participants. Thirty-seven undergraduate volunteers participated in this study (19
females, 18 males). One participant was excluded due to failure to understand the
contingencies of the financial decisions (assessed by post-experimental questionnaire).
Final analysis was conducted on 36 participants (18 females; age: M = 20, SD = 3.6).
Participants completed this experiment at Rutgers University for Psychology course
credit and gave informed consent according to the Rutgers University Institutional
Review Board for the Protection of Human Subjects in Research.
Imagery SMG. Participants completed the imagery SMG (Figure 3.1), which
consisted of 72 total trials divided into 4 blocks of 18 trials each. In the imagery SMG,
-focused regulation, which
involved imagining a calming scene instead of focusing thoughts on the reward cue.
Training in the imagery SMG involved showing participants example pictures of calming
scenes (a sunny day in the park, the beach), asking them to generate their own images,
verifying these images were appropriate (i.e., not exciting or related to the task), and
instructing them not to close their eyes during the imagery. Each trial in the imagery
SMG consisted of presentation of a strategy word, Look or Relax, a financial decision,
and an inter-trial interval. The timing and other details of the imagery SMG were as
described in the General Methods section. After the SMG, participants completed several
questionnaires, as described in the General Methods.

64
3.3.2 Results.
Subjective ratings: Regulation success. After completing the experimental task,
participants completed a post-experiment questionnaire which addressed whether they
had effectively used the imagery strategy. Participants rated how successful (1 = not at
all successful and 7 = very successful) they were at using the relax imagery. Participants
who rated their performance 5-7 were considered to be effective regulators (n = 29) while
those that rated their performance 1-4 were considered to be non-regulators (n = 7).
While there were individual differences in perceived self-reported success, on average
participants (M = 5.39, SD = 1.20) felt somewhat successful.
Decision-making.
the risky option was chosen. To test the effects of strategy and decision type on risk-
taking, a repeated measures ANOVA was performed with strategy (look, relax) and
decision type (neutral, good, bad) as within-subjects variables (Figure 3.2). The ANOVA
revealed only a main effect of decision type, F(1.50, 52.83) = 72.91, p = 0.001
Greenhouse-Geisser corrected. Paired t tests demonstrated that participants were
sensitive to the EV of the options as risk-taking was greatest for good decisions and
lowest for bad decision types (good: M = 0.68, SD = 0.28; neutral: M = 0.38, SD = 0.26;
bad: M = 0.20, SD = 0.17). There was no main effect of strategy, F(1, 35) = 0.03, p =
0.87, or interaction of strategy and decision type, F(2, 70) = 0.52, p = 0.60.
Experiment 1, which used the same imagery strategy in a decision-making context
found that perceived success at visualizing the relaxing imagery was necessary to observe
shifts in risk-taking (Martin & Delgado, 2011). Given the observed individual
differences in imagery success ratings in the current study, an additional ANOVA was

65
performed that included the relax success ratings as a covariate. This ANOVA identified
only a significant main effect of decision type, as in the primary ANOVA, F(1.51, 51.32)
= 3.54, p = 0.048 Greenhouse-Geisser corrected. There was no significant interaction of
strategy and success rating, F(5, 34) = 1.15, p = 0.29, or of strategy, decision type and
success rating, F(2, 68) = 0.10, p = 0.90.
Gender effects. To probe for gender effects, an ANOVA with strategy (Look,
Relax) and decision type (neutral, good, bad) as within-subjects variables and gender as a
between-subjects variable was conducted. The ANOVA revealed a main effect of
decision type, F(1.50, 50.88) = 74.68, p = 0.001, and an interaction of strategy, decision
type and gender, F(2, 68) = 3.47, p = 0.04. To explore this three-way interaction, t tests
were conducted. The Look and Relax conditions were compared for each decision type
in men and women separately. There were no significant effects of regulation in men for
bad, t(17) = 0.39, p = 0.70, good, t(17) = 0.78, p = 0.44, or neutral decisions, t(17) = 0.17,
p = 0.86 decisions. There were no significant effects of regulation in women for bad,
t(17) = 1.53, p = 0.15, good, t(17) = 0.91, p = 0.37, or neutral decisions t(17) = 1.59, p =
0.13. Comparisons of risk-taking in men and women for each condition did reveal
differences. Specifically, men took significantly more risks than women in two
conditions, Relax Bad, t(17) = 2.25, p = 0.04, and Relax Good, t(17) = 2.55, p = 0.02.
While males took more risks in certain task conditions, there was no significant main
effect of gender on risk-taking, F(1, 34) = 2.39, p = 0.13.
Individual differences. Since no significant effects of emotion regulation on risk-
taking were observed, it was not appropriate to test for relationships between shifts in
risk-taking and individual differences.

66
Reaction time. A repeated measures ANOVA was performed to test for effects of
strategy (Look, Relax) and decision type (good, bad, neutral) on reaction times for the
decision phase. The ANOVA revealed only a main effect of decision type that
approached significance, F(1.71, 60.10) = 2.73, p = 0.081 (Greenhouse-Geisser
corrected). The main effect of strategy, F(2, 35) = 0.20, p = 0.66, and the interaction of
strategy and decision type, F(2, 70) = 0.74, p = 0.48, were not significant. Reaction times
were fastest for bad decisions and slowest for good decisions (bad: M = 1902.64, SD =
324.70, neutral: M = 1962.34, SD = 373.17, good: M = 1999.42, SD = 315.07).
Skin Conductance. To probe for effects of regulation on physiological
responding, SCRs were input into a one-way repeated measures ANOVA with strategy
(Look, Relax) as the factor. This ANOVA did not find a significant effect of strategy,
F(1, 31) = 1.52, p = 0.23. However, participants may have habituated to the cue, as the
same slot machine image was repeated throughout the task. A second ANOVA was
performed using SCRs to the cues presented in the first half of the task (Blocks 1 and 2)
only. This ANOVA also did not find any effect of strategy, F(1, 31) = 1.48, p = 0.23.
3.3.3 Discussion. This experiment examined the influence of imagery regulation
on risk-taking in a financial decision-making task. Additionally, this study tested the
effect of different decision types, manipulated by varying which option, risky or safe, had
the greatest expected value, on risk-taking. No effect of regulation was observed, but
there was a strong effect of decision type on risk-taking. Experiment 1 used the same
imagery strategy, and found that it resulted in reduced risk-taking for those participants
who felt successful. There are several important differences between the two experiment

67
paradigms, which may account for the current lack of a regulation effect. The previous
study employed a different financial decision set, one that contained only choices
between options with equal expected value (like the neutral decisions in the current
studies). The presence of decisions in which it was more advantageous to take a risk
changed the overall decision context in the current study. Given the more complex level
of information to be considered at the decision phase in the current study compared to the
previous one, it is likely that greater attentional resources were needed to make a
decision. The imagery strategy theoretically affects decision-making by focusing
thoughts away from the decision and creating a feeling of calm during the cue phase just
before the decision phase. In the previous study, this effect of regulation carried over to
the decision phase; however, in the current study, the greater need to focus on the details
of the decision options may have overridden the effects of regulation. Another possibility
is that it may have been more difficult to engage in the relaxing imagery during the
reward cue in the current study, because the specific options that would follow the cue
were uncertain, and participants knew that they were going to face real consequences for
two of their decisions. It seems that the imagery strategy may be best suited for simple
decision contexts.
Unlike the imagery strategy, the cognitive strategies tested in the next Experiment
involved focusing on the upcoming decision. The cognitive strategies were applied to the
same reward cue and set of decisions that were used in Experiment 2. This consistency
allowed for general comparison of the efficacies of the two strategies. Given the greater

68
task-focus of the cognitive reappraisal strategies, will they produce significant shifts in
risk-taking?
3.4 Experiment 3: The effect of cognitive emotion regulation strategies on risk-
taking across different financial decisions
3.4.1 Methods.
Participants. Thirty-six undergraduate volunteers participated in this study (18
females, 18 males; age: M = 22, SD = 6.1). Participants completed this experiment at
Rutgers University for Psychology course credit and gave informed consent according to
the Rutgers University Institutional Review Board for the Protection of Human Subjects
in Research.
Reappraisal SMG. The reappraisal SMG consisted of 108 total trials divided into
4 blocks of 27 trials each (Figure 3.3). The reappraisal SMG involved two different
reappraisal strategies, which prompted participants to change their thoughts about the
reward cue and t
prompted participants to think that the upcoming decision was very important, and they
participants to think of the upcoming decision as one of many opportunities to win
money, and that it did not matter that much what happened on this particular one.
Training in the reappraisal SMG involved giving participants example statements
they could think for each reappraisal strategy. For Emphasize they were given examples

69
ing up is not a big deal; I will have other chances; even if I
presentation of a strategy word, Look, Emphasize, or Deemphasize, a financial decision,
and an inter-trial interval. The timing and other details of the reappraisal SMG were as
described in the General Methods section. After the SMG, participants completed several
questionnaires, as described in the General Methods.
3.4.2 Results.
Subjective ratings: Regulation success. After completing the experimental task,
all participants completed a post-experiment questionnaire which addressed whether they
had effectively used the regulation strategies. Participants rated how successful (1 = not
at all successful and 7 = very successful) they were at using the two reappraisal strategies.
Participants who rated their performance 5-7 were considered to be effective regulators,
Emphasize n = 26, Deemphasize n = 21, both n = 17, while those that rated their
performance 1-4 were considered to be non-regulators: Emphasize n = 10, Deemphasize
n = 15, both n = 6. While there were individual differences in perceived self-reported
success, on average participants felt somewhat successful (Emphasize: M = 5.17, SD =
1.34, Deemphasize: M =4.86, SD = 1.84), and there was no significant difference
between reported success for Emphasize and Deemphasize, t(35) = 1.01, p = 0.32.
Decision-making.
the risky option was chosen. To test the effects of strategy and decision type on risk-
taking, repeated measures ANOVA with strategy (Look, Emphasize, Deemphasize) and
70
decision type (neutral, good, bad) as within-subjects variables (Figure 3.4). The ANOVA
revealed a main effect of decision type, F(1.56, 54.54) = 82.99, p = 0.001, and a main
effect of strategy, F(1.37, 47.96) = 7.42, p = 0.005, both Greenhouse-Geisser corrected
for non-sphericity. The interaction of strategy and decision type approached significance,
F(4, 140) = 1.97, p = 0.102. With regard to the main effect of decision type, risk-taking
was greatest for good decisions and lowest for bad decision types (good: M = 0.66, SD=
0.17; neutral: M = 0.41, SD = 0.21; bad: M = 0.26, SD = 0.19). With regard to the main
effect of strategy, risk-taking was greatest for Deemphasize trials and lowest for
Emphasize trials (Deemphasize: M = 0.52, SD = 0.22; Look: M = 0.44, SD = 0.17;
Emphasize: M = 0.37, SD = 0.22).
As in Experiment 1 and 2, we tested whether success ratings for the two emotion
regulation strategies exerted any influence on the risk-taking results. We addressed this
question by computing an ANOVA that included the Emphasize and Deemphasize
success ratings as covariates. This ANOVA revealed that the main effects of decision
type, F(1.56, 51.29) = 2.00, p = 0.16 (Greenhouse-Geisser corrected), and strategy,
F(1.38, 45.60) = 2.44, p = 0.12 (Greenhouse-Geisser corrected), were no longer
significant. The interaction of strategy and decision type approached significance, F(4,
132) = 2.23, p = 0.07. The interaction of strategy and Emphasize success, F(1.38, 45.60)
= 2.01, p = 0.16 (Greenhouse-Geisser corrected), and the interaction of strategy and
Deemphasize success, F(1.38, 45.60) = 0.49, p = 0.55 (Greenhouse-Geisser corrected),
were not significant. The three-way interaction of strategy, decision type, and Emphasize
success showed a trend that approached significance, F(4, 132) = 2.19, p = 0.074, and the
three-way interaction of strategy, decision type, and Deemphasize success was not

71
significant, F(4, 132) = 0.38, p = 0.83. The trend for a three-way interaction of strategy,
decision type, and Emphasize success was explored with t tests. For the purpose of these
comparisons, participants were divided into two groups, regulators and non-regulators,
based on their Emphasize success ratings. In the regulators group, significantly greater
risk-taking (p < 0.05) was observed during Deemphasize for the following comparisons:
Emphasize versus Deemphasize for good, neutral, and bad decisions and Deemphasize
versus Look for good and bad decisions. The comparisons of risk-taking in Emphasize
versus Look for good and neutral decisions approached significance (p = 0.07 and p =
0.09, respectively), with greater risk-taking occurring in the Look condition. In the non-
regulators group, the only significant effect was lower risk-taking in Emphasize than
Look for good decisions (p = 0.01).
Gender effects. To test for effects of gender, an exploratory ANOVA was
conducted with strategy (Look, Emphasize, Deemphasize) and decision type (neutral,
good, bad) as within-subjects variables and gender as a between-subjects variable. Like
the main analysis, this ANOVA revealed a main effect of decision type, F(1.56, 53.19) =
81.58, p = 0.001, a main effect of strategy, F(1.36, 46.25) = 7.31, p = 0.005 (both
Greenhouse-Geisser corrected), and an interaction of strategy and decision type that
approached significance, F(4, 136) = 1.99, p = 0.10. The interactions of strategy and
gender, F(1.36, 46.25) = 0.51, p = 0.53, and strategy, decision type and gender, F(4, 136)
= 1.23, p = 0.30, were not significant. There was no significant main effect of gender,
F(1, 34) = 1.06, p = 0.31.
Individual differences. To explore whether any individual difference measures
were related to observed shifts in decision-making (RegScore), correlation analyses were

72
performed. A significant negative correlation was observed between the Deemphasize
RegScore for bad decisions and self-esteem, R = -0.347, p = 0.048. The relationship
revealed that the more participants increased their risk-taking in Deemphasize relative to
Look, the lower their self-esteem scores.
Reaction time. A repeated measures ANOVA was performed to test for effects of
strategy (Look, Emphasize, Deemphasize) and decision type (good, bad, neutral) on
reaction times for the decision phase. The ANOVA revealed only a significant main
effect of decision type, F(1.29, 45.26) = 11.81, p = 0.001 (Greenhouse-Geisser
corrected). The main effect of strategy, F(2, 70) = 0.38, p = 0.68, and the interaction of
strategy and decision type, F(4, 140) = 0.24, p = 0.92, were not significant. Reaction
times were fastest for bad decisions and slowest for good decisions (bad: M = 1998.17,
SD = 411.87, neutral: M = 2077.02, SD = 441.28, good: M = 2173.88, SD = 464.88).
Skin conductance. To probe for effects of regulation on physiological
responding, SCRs were tested using one-way repeated measures ANOVA with strategy
(Look, Emphasize, Deemphasize) as the factor. This ANOVA did not find a significant
effect of strategy, F(1.58, 45.71) = 1.76, p = 0.19. However, participants may have
habituated to the cue, as the same slot machine image was repeated throughout the task.
A second ANOVA was performed using SCRs to the cues presented in the first half of
the task (Blocks 1 and 2) only. This ANOVA revealed a trend for a main effect of
strategy, F(2, 58) = 3.05, p = 0.055. Skin conductance responses were greatest in
Emphasize (M = 0.28, SD = 0.22), and there was no significant difference between SCRs
in Look (M = 0.25, SD = 0.19) and Deemphasize (M = 0.24, SD = 0.20).
73
3.4.3 Discussion. This experiment examined the influence of reappraisal
regulation on risk-taking in a financial decision-making task. Additionally, the effect of
different decision types, manipulated by varying which option, risky or safe, had the
greatest expected value, on risk-taking was probed. The two reappraisal strategies did
successfully alter decision-making; Emphasize reappraisals decreased risk-taking and
Deemphasize reappraisals increased it. Including the self-reported Emphasize and
Deemphasize success ratings in the analysis resulted in the previously significant main
effects of strategy and decision type no longer being significant. This result likely
indicates that participants were consciously aware of the effects of the reappraisal
strategies on their risk-taking. They may have used observations of their behavior to
inform their success ratings, which were made at the end of the experiment. Because the
reappraisal strategies involved maintaining focus on the upcoming decision, it is
reasonable that there was a relationship between success rating and risk-taking.
The reappraisal strategies may have been more effective than the imagery strategy
because they maintained focus on the decision and modulated emotions associated with
the decision. The effect of Deemphasize reappraisal was similar to that observed by
Sokol-
(2009). Emphasize reappraisal seemed to increase risk aversion as participants made
fewer risky choices in this condition. Skin conductance results suggest that the
Emphasize reappraisals may have increased arousal, perhaps indicating increased anxiety
about the decision.

74
3.5 General Discussion
The current studies examined shifts in risk-taking as a function of different types
of decisions and engaging in imagery-focused and cognitive emotion regulation strategies
when faced with cues signaling opportunities to win money. In accordance with our
hypotheses, both experiments revealed effects of decision type such that risk-taking was
elevated when the risky option had the greatest expected value and decreased when the
risky option had the lowest expected value. These results suggest that participants are
sensitive to the expected value of choices, and they alter their decision-making to favor
the option with the greatest expected value, regardless of whether it is risky or safe. The
imagery regulation strategy did not alter decision-making, but the cognitive regulation
strategies did. Cognitive reappraisals that heightened the perceived importance of the
next decision decreased risk-taking, while cognitive reappraisals that reduced the
perceived significance of the next decisions increased risk-taking.
To understand why the reappraisal strategies altered risk-taking, but the imagery-
focused strategy did not, it is helpful to consider the mechanistic differences between
these two strategies. The imagery and reappraisal strategies differ on two main
dimensions: attention and effects on emotion (Table 3.2). During imagery regulation
attention is focused away from the emotional stimulus, and instead is directed internally;
however, during reappraisal, attention remains directed at the emotional stimulus.
Imagery regulation generates a new emotion, one related to the scene that is imagined, for
instance, a feeling of calm would accompany a visualization of the ocean. In reappraisal,
the emotional response to the stimulus itself is modulated, either increased or decreased,
depending on the specific thoughts applied.

75
Because the decision set contained three different types of decisions, more
attention may have been required to make a decision in Experiments 2 and 3 relative to
Experiment 1. The reappraisal strategies maintained attention on the upcoming
decisions, while the imagery strategy did not. This difference could explain why the
imagery strategy did not alter risk-taking in Experiment 2.
Another explanation for the lack of imagery effects on risk-taking is suggested by
the skin conductance results. The imagery strategy did not decrease skin conductance,
indicating that this strategy did not significantly reduce arousal. Earlier studies found
that imagery regulation decreased skin conductance (Delgado, Gillis, & Phelps, 2008;
Delgado, Nearing, LeDoux et al., 2008), thus similar decreases were expected in the
current study. This lack of arousal modulation may have prevented behavioral shifts
from occurring. However, it is important to consider that in Experiment 3 the
deemphasize strategy also did not alter skin conductance, yet risk-taking was affected.
Although the imagery strategy did not significantly alter risk-taking, participants
felt somewhat successful at engaging in the relaxing imagery. Interestingly, exploratory
comparisons of the success ratings for the Relax strategy and the Emphasize and
Deemphasize strategies using independent samples t tests did not find any significant
differences in reported success. It possible that participants accurately assessed and
reported on their success at visualizing that imagery, but that the effects of the imagery
did not carry over to the decision phase or were overridden by the increased attention to
the decision options. These two strategies were tested in separate groups of participants.
It is possible that some individuals would feel more successful at one type of strategy if
these strategies were tested in a within-subjects design.

76
Prior work with the cognitive and imagery strategies in decision-making contexts
revealed individual differences such that both strategies were affective only with a subset
of the sample (Martin & Delgado, 2011; Sokol-Hessner, Hsu, Curley et al., 2009). Thus,
a secondary goal of the current study was to examine whether any individual differences
measures, for instance in emotion differentiation, habitual emotion regulation, emotional
intelligence, behavioral inhibition and activation, personality traits, self-esteem, or social
support, may explain for whom these techniques are effective. The current study found
that only one of these individual difference measures, self-esteem, was significantly
related to observed changes in risk-taking with regulation. Specifically, participants with
lower self-esteem scores tended to increase their risk-taking in Deemphasize relative to
Look for the bad decisions. This finding is interesting, as gambling more for bad
decisions was economically a poor decision; the safe option had a higher expected value
in the bad decisions. While overall Deemphasize reappraisals increased risk-taking, this
correlation suggests that people with lower self-esteem increased their risk-taking more
for bad decisions than participants with high self-esteem.
Of the 11 individual differences measures tested, only one was related to changes
in decision-making. One caveat is that this sample of Rutgers undergraduate students
may not capture the variability in the population. The current data do lend support to the
idea that overall, differences in the efficacy of emotion regulation techniques observed
between subjects are not due to different traits, but rather different states, situational
factors such as the amount of effort applied to engage in the technique. This result is
encouraging, as it suggests that most people will be able to benefit from using emotion
regulation techniques.
77
This research has potential clinical applications as it demonstrates that changing
how we experience an appetitive cue can alter our behavior. Appetitive cues signal
opportunities for rewards, but certain patterns of reward-seeking can become
maladaptive, for instance, drug-seeking in addiction. Understanding which strategies are
most helpful in altering behavior that is linked to reward cues is an important step in
developing potential treatments. Recent work with addicted populations suggests the
promise of emotion regulation techniques; studies have found that by employing
regulation strategies cigarette smokers lowered their feelings of craving (Kober, Kross,
Mischel et al., 2009; Kober, Mende-Siedlecki, Kross et al., 2010) and both cigarette
smokers (Kober, Mende-Siedlecki, Kross et al., 2010) and cocaine addicts (Volkow,
Fowler, Wang et al., 2010) reduced neural signatures of drug craving. Future research
needs to be conducted to determine if regulating affective responses to drug cues using
cognitive strategies can foster shifts in actual behavior (i.e., reduce drug-seeking after
coming in contact with drug cues).

78
Chapter 4
Experiment 4: Regulation of Negative Emotions Associated with Conditioned Cues
4.1. Introduction and Hypotheses
The previous three experiments examined the application of emotion regulation
strategies to cues associated with financial gains. Using regulation lead to shifts in the
level of risk-taking in financial decisions. In daily life, we encounter both appetitive
cues, those signaling potential gains, and aversive cues, those signaling potential losses.
The fourth study investigates the application of imagery-focused emotion regulation to
cues signaling monetary losses. Although much previous research has examined the
regulation of negative emotions, applying regulation to conditioned cues that signal
actual financial consequences has not been examined. Additionally, given the mixed
efficacy of the imagery-focused regulation strategy in the domain of monetary gains, the
current experiment provided an opportunity to probe this strategy in a different context,
that of monetary losses. The goals of this study were to determine whether imagery-
focused emotion regulation would decrease affective responses to cues associated with
losing money and to identify the brain regions that support the regulation process. This
study departs from the decision-making theme of the previous ones in order to directly
assess regulation-driven changes in the subjective and neural experience of losses.
Many previous emotion regulation studies employed visual stimuli such as
complex photographs (e.g., International Affective Picture Systems, IAPS) or film clips
and demonstrated that regulation decreased subjective reports of negative emotion
experienced (Goldin, McRae, Ramel et al., 2008; Levesque, Fanny, Joanette et al., 2003;

79
Ochsner, Bunge, Gross et al., 2002; Ochsner, Ray, Cooper et al., 2004; Phan, Fitzgerald,
Nathan et al., 2005; Urry, van Reekum, Johnstone et al., 2006). Regulation has also been
successfully applied to aversive conditioned cues, stimuli that are associated with the
physical experience of primary reinforcers such as pain (Kalisch, Wiech, Critchley et al.,
2005) or shock (Delgado, Nearing, LeDoux et al., 2008). While emotion regulation is an
important tool for coping with the anticipation of pain, it is unclear if regulation would be
effective with a secondary reinforcer commonly encountered in daily life, the loss of
money. Previous research has demonstrated that cues associated with the loss of money
elicit negative emotions and increase arousal responses (Delgado, Labouliere, & Phelps,
2006).
The current study employs the same imagery-focused strategy that was used in the
shock cue study (Delgado, Nearing, LeDoux et al., 2008). In that study, shifts in
affective responses were assessed with a physiological measure, skin conductance. The
current study included subjective emotion rating measures in addition to skin
conductance in order to fully capture the shifts in affective responding associated with
emotion regulation. Additionally, fMRI data were collected to probe shifts in neural
responses to loss cues with regulation. Are the neural circuits involved in the regulation
of cues associated with a secondary reinforcer, money, the same as those involved in the
regulation of a primary reinforcer, shock?
The goal of the current study was to examine whether imagery-focused regulation
would decrease the intensity of negative emotion experienced during the anticipation of
unavoidable monetary losses. Simple visual cues, three different colored squares, were
associated with three different monetary outcomes: always losing money (loss cue), never

80
losing money (safe cue), and sometimes losing money (variable cue). Participants
experienced three phases for each cue type. In the first phase, the cue phase, participants
saw the square appear on the screen. Next, a question mark appeared inside of the
square, the anticipation phase, and participants waited to see the outcome of the square.
Participants either responded naturally (look condition), or engaged in imagery-focused
regulation (relax condition) during the anticipation phase. When the question mark
disappeared, the anticipation phase ended, and participants saw the outcome of the square
(loss or safe).
Most neuroimaging studies of emotion regulation have varied the strategy, natural
responding or regulation, in a pseudo-random, event-related manner. This structure
requires participants to switch strategies often. We varied the strategies less frequently,
by presenting a new strategy word only every six trials. Additionally, participants were
only explicitly instructed to engage in the relaxing imagery during the anticipation phase
for each cue. They were free to respond naturally during the cue phase, which came just
before the anticipation phase. This design allowed us to explore regulation effects during
the cue period-
We hypothesized that engaging in regulation during anticipation would
successfully decrease subjective feelings of negative emotion, and these emotional shifts
would be accompanied by decreased physiological arousal responses and reduced neural
activity in brain regions involved in emotion processing. Previous studies of negative
emotion regulation have found that regulation reduces activity in brain regions involved
in emotion including the amygdala and increases activity in brain regions involved in
cognitive control including the dorsolateral, ventrolateral, ventromedial, and anterior

81
cingulate cortices (for reviews, see Green & Malhi, 2006; Ochsner & Gross, 2005;
Ochsner & Gross, 2008).
Understanding whether emotion regulation is beneficial when faced with cues
signaling actual money losses is important not only because negative emotions are
unpleasant to experience, but also because negative emotions may promote risk-taking in
decision making contexts. Decisions framed as losses may elicit negative affect (De
Martino, Kumaran, Seymour, & Dolan, 2006) and the presence of a loss frame increases
risky decision-making (Kahneman & Tversky, 1979). These studies suggest that cues
indicating potential losses may shift choices in favor of risky options, which may be less
optimal. It is possible that reducing the negative emotions elicited by loss cues or frames
may eliminate or reduce risk-taking in these situations. Before examining the effects of
regulation of negative emotions on decision-making, it is important to understand the
effects of emotion regulation on the expectation of monetary losses.
4.2 Methods
Participants. Twenty-nine volunteers participated in this study (15 females, 14
males). Two participants were excluded, because they did not follow the emotion
regulation instructions as determined by the post-experiment questionnaire. Two
participants were excluded due to excessive movement during the MRI scan, and one
participant was excluded due to an error in the functional image acquisition settings.
Final analysis was conducted on 24 participants (12 females, 12 males; mean age: M =
20.29, SD = 2.61). Participants completed this experiment for pay at the Advanced
Imaging Center, a joint venture of Rutgers University and the University of Medicine and
82
Dentistry of New Jersey. All participants gave informed consent according to the
Rutgers University Institutional Review Board for the Protection of Human Subjects in
Research and the Newark Campus Institutional Review Board of the University of
Medicine and Dentistry New Jersey.
Procedure overview. After signing the consent form, participants were trained
on the experimental task on a PC computer in a testing room at Rutgers University. Next,
participants were escorted by the experimenter to the Imaging Center, and they
completed the experimental task while inside the MRI scanner. After the scanning
session, participants completed several questionnaires: a brief post-experiment
questionnaire that assessed compliance with instructions, the Emotion Regulation
Questionnaire that measured use of emotion regulation strategies (Gross & John, 2003),
and the behavioral inhibition and activation scales that measured approach and avoidance
motivation (BIS/BAS; Carver & White, 1994). After the questionnaires, participants
received their payment in cash and were debriefed.
The experimental task was programmed in E-Prime version 2.0 (PST, Pittsburgh)
and presented to participants in the MRI scanner via a back projection system.
Participants made responses with their right hands using an MRI compatible response
box. The experimental task consisted of two different games, the Gambling Game and
the Colored Squares Game. The purpose of the Gambling Game was to provide
participants with a bank of earned experimental dollars. The Colored Squares Game was
the main experimental task, and its purpose was to expose participants to cues signaling
money losses. When faced with the cues, participants either responded naturally or
engaged in imagery-focused regulation. These money losses were deducted from the
83
Gambling Game earnings. Participants played each game twice. Each Gambling Game
lasted three minutes and the Colored Squares Game about 18 minutes (some responses
were self-paced, so the duration varied across participants).
Gambling Game.
whether the numerical value of a card was lower or higher than 5. Participants earned
money (2 experimental dollars) for correct guesses and lost money (1 experimental
dollar) for incorrect guesses. Participants had two seconds to guess the value of the card,
and they did so by pressing the 1 key to guess low or the 2 key to guess high. After the
time elapsed, the actual value of the card was revealed along with either a check mark
earnings across participants the Gambling Games were fixed; participants won 30
experimental dollars in the first game and 36 in the second one.
Colored Squares Game. Two independent variables were manipulated in the
Colored Squares Game: cue type (loss, safe, variable) and strategy type (natural
responding, emotion regulation). In the game, participants saw three different colored
squares (cues) that were associated with different monetary outcomes (Figure 4.1). The
loss square was associated with always losing money, the safe square with never losing
money, and the variable square with a probability of losing money (50% loss, 50% safe).
The associations between the square colors (yellow, blue, and purple) and these outcomes
were explicitly explained to participants during training; therefore, they did not have to
learn them. For the variable square, participants were not informed of the exact
consisted of three main phases. The cue phase consisted of the appearance of the square

84
in the center of the screen for 4 or 6 s. Next, in the anticipation phase, a question mark
appeared inside of the square for 4 or 6 s; during this phase participants waited to see the
outcome of the square. The outcome phase consisted of the presentation of the monetary
outcome, loss (negative dollar sign) or safe (pound sign), for 1 s. After the outcome, a
fixation cross was presented for 7 s, followed by a rating question, which remained on the
screen until participants responded. The trial ended with a 10 s inter-trial-interval
(fixation cross). The color of each cue type (loss, safe, variable) was counter-balanced
across participants.
The Colored Square Game trials were grouped into 10 mini-blocks of six square
trials each. The task was divided into two big blocks each consisting of 5 mini-blocks.
The order of the mini-blocks was counterbalanced across participants, by using two
different sequences. At the beginning of each mini-block, participants were presented
with a strategy word for 4 s; the strategy word indicated to them whether to respond
about the upcoming outcomes during the anticipation period (indicated by a question
mark appearing inside of the square), observe all the outcomes, and to respond naturally.
when the question mark appeared (anticipation phase), to imagine a relaxing scene in
told to keep their eyes open and to attend to all the outcomes.
Prior to the MRI scan, the experimenter explained the instructions for the two
games. Training in the use of the Relax imagery-focused strategy involved showing

85
participants example pictures of calming scenes (a beach sunset), asking them to generate
their own images, verifying these images were appropriate (i.e., not exciting or task-
related), and instructing them not to close their eyes during the imagery. Participants
then completed short practice versions of both the Gambling Game and the Colored
Squares Game.
Monetary losses. Given that our manipulation depended on negative emotions
being elicited by the presentation of the loss and variable cues, the monetary outcomes
and payment procedures were explicitly outlined and emphasized during training.
Participants were told that each loss outcome they experienced in the Colored Squares
Game was equivalent to two experimental dollars subtracted from their earnings in the
Gambling Game. Further, they were told that the experimental dollars would be
converted to real dollars at the end of the experiment by a spin of a computerized wheel
with 8 possible values ranging from $1 to $8. Participants saw this wheel and practiced
spinning it during training. Participants were informed that they would be only be
guaranteed $20 for their participation, and that they might receive bonus money if the
amount they earned in the Gambling Games was greater than the amount they lost in the
Colored Squares Games.
At the end of the experiment, while still in the scanner, participants spun the
wheel to determine the value of each experimental dollar. To equate earnings across
participants, the outcome of the spin was fixed. Participants saw how many experimental
dollars they won in each Gambling Game minus how many they lost in each Colored
Squares Game, and then they saw their total earnings in actual dollars.

86
Rating questions. There were 60 total Colored Squares Game trials, 30 in each
round of the game. There were 20 trials of each square type (loss, safe, variable); 10
trials were without regulation (Look), and 10 trials were with regulation (Relax). There
were three different Likert scale rating questions, which were distributed across the cues.
The emotion intensity question assessed the level of negative emotion experienced during
the anticipation phase (1 = very weak, 7 = very strong); this question was given in both
look and relax trials and was a central dependent variable for assessing the effect of
regulation. The focus question assessed how much the participant thought about the
outcome of the square during the anticipation phase (1 = not at all, 7 = very much); this
question only occurred in look trials. The relax success question assessed how successful
the participant felt at visualizing relaxing imagery during the anticipation phase (1 = not
at all, 7 = very successful); this question only occurred in relax trials.
Behavioral data analysis. We tested for effects of strategy (2: look, relax) and
cue type (3: loss, safe, variable) on the emotion intensity ratings using repeated measures
analysis of variance (ANOVA) in SPSS 19. Additionally, we probed for effects of cue
type on both the focus ratings and relax success ratings, separately, using repeated
measures ANOVA. The ANOVA results were further explored with paired t tests.
Skin conductance acquisition and analysis. Skin conductance responses
(SCRs) were collected using the BIOPAC systems skin conductance module (BIOPAC
Systems, Goleta, CA). MRI compatible radiotranslucent electrodes were used, along
with a transducer amplifier to correct for potential sources of noise and acquisition of
distal phalanges of the second and third fingers in their non-dominant hand.

87
AcqKnowledge software was used to analyze SCR waveforms (BIOPAC Systems,
Goleta, CA). SCR waveforms were filtered using a 1 Hz low-pass filter. The level of
SCR was assessed as the base to peak difference for an increase in the 0.5 to 4.5 s
window following the onset of the reward cue (LaBar, LeDoux, Spencer et al., 1995). A
minimum response criterion of 0.02 microSiemens was used, and all responses below this
criterion were
data was reviewed to determine if it could be scored. Most data were not scoreable. The
poor quality of the data may have been due to difficulty collecting SCRs in the MRI
environment, low arousal responses to the cues, or some combination of two factors.
Acquisition of SCR data is challenging in the MRI environment due to signal interference
from the scanner. Given that the data could not be scored, no SCR results are available to
be reported.
FMRI acquisition and analysis. Imaging data were acquired at the University
Heights Center for Advanced Imaging using a 3T Siemens Allegra head-only scanner
with a standard head coil. Structural images were acquired using a T1-weighted
sequence (256 x 256 matrix, 176 1 mm sagittal slice). Functional images were acquired
using a single-shot gradient echo EPI sequence (TR = 2000 ms, TE = 25 ms, FOV = 192
cm, flip angle = 80°, bandwidth = 2604 Hz/px, echo spacing = 0.29 ms). Each functional
volume consisted of thirty-five contiguous (3 x 3 x 3 mm voxels) oblique axial images
acquired parallel to the anterior commissure (AC), posterior commissure (PC) line.
Imaging data preprocessing and analysis were performed with Brain Voyager
software (version 1.10 and 2.2: Brain Innovation, Maastricht, The Netherlands). Data
preprocessing consisted of correction for motion (6 parameters; motion greater than 6

88
mm within run resulted in exclusion from analysis) slice scan time adjustment (sinc
interpolation), spatial filtering (three-dimensional Gaussian filter 8 mm FWHM), and
temporal filtering (voxel-wise linear detrending and high-pass filtering of frequencies
with three cycles per time-course). Motion correction parameters were included in the
statistical model. Mean intensity analyses were performed to assess deviations from the
first volume; to account for observed variability, deviation parameters were included in
the statistical model. Functional images were co-registered with the high-resolution
structural images, and structural and functional data were transformed into standard
Talairach stereotaxic space (Talairach & Tournoux, 1988).
Data analysis focused on testing for effects of strategy (look, relax) and cue type
(loss, safe, variable) on blood oxygen level dependent (BOLD) signal change in the
anticipation and cue phases of the task. To estimate beta weights for these conditions, we
generated a general linear model (GLM) that included a separate predictor for each
unique task condition at each task phase: six cue predictors (strategy by cue type, e.g.,
Look Loss, Relax Loss), six anticipation predictors (strategy by cue type), and eight
outcome predictors (strategy by cue type by outcome). Additionally, the GLM included
predictors of no interest for strategy word presentation, rating question presentation,
missed trials, motion parameters, and mean intensity parameters. Each predictor was
modeled as a box car convolved with a canonical two gamma hemodynamic response
function. A whole brain random-effects analysis was performed on the functional data
using this GLM. Statistical parametric maps (SPMs) were created using a threshold of p
< 0.005, cluster threshold corrected.

89
Each map was corrected for multiple comparisons using the cluster level
statistical threshold estimator plugin tool from the Brain Voyager analysis package
(Forman, Cohen, Fitzgerald, Eddy, Mintun, & Noll, 1995; Goebel, Esposito, &
Formisano, 2006). To determine the likelihood of observing of clusters various sizes
clusters in the map, this tool uses Monte Carlo simulations. First, each map was
thresholded at p = 0.005. Then, at least 1000 (the recommended number) iterations were
run to estimate the rate of cluster level false positives. The analysis generates a range of
minimum cluster sizes, and each is associated with an alpha value determined by its
frequency. For all maps, the cluster size associated with a false positive rate of 0.005 or
less was chosen. Clusters smaller than then cluster size were excluded from the SPM
before additional analysis.
To test for effects of strategy and cue type, four different analyses were
performed. First, beta weights were estimated and extracted for the anticipation phase for
three a priori regions of interest (ROIs) using the above GLM. The ROIs were the
regions of dorsolateral prefrontal cortex (dlPFC), ventromedial prefrontal cortex
(vmPFC), and amygdala indentified by the previous study of imagery regulation and
shock cues (Delgado, Nearing, LeDoux et al., 2008). The beta weights for each ROI
were input into a repeated measures ANOVA with strategy (look, relax) and cue type
(loss, safe, variable) using SPSS 19. This analysis would determine whether the signal
change in these regions showed significant effects of strategy or cue type.
For the second analysis, a whole brain ANOVA was conducted in Brain Voyager,
and regions showing a main effect of strategy, a main effect of cue type, and an
interaction of strategy and cue type were identified for the anticipation and cue phases,

90
separately. Because regulation was explicitly directed during anticipation, the
anticipation ANOVA results most directly assessed effects of regulation. The cue phase
data were tested to explore for effects of being in a regulation mini-block, even though
regulation was not instructed during the cue phase. Beta weights were extracted from the
functional regions of interest (fROIs) defined by these six statistical parametric maps
(SPMs) using a peak voxel center and a cluster extent of 10 voxels in all directions.
Paired t tests were performed on the beta weights as necessary to characterize the
observed effects. Regions showing larger beta weights for Relax than Look were deemed
to be involved in regulation.
For the third analysis, a whole brain contrast plus correlation analysis was
performed in Brain Voyager to identify brain regions in which activity was greater during
regulation (compared to natural responding) and was correlated with shifts in negative
emotion intensity during regulation. Shifts in emotion intensity were quantified by the
difference of Look and Relax emotion intensity ratings (Look Relax, emotion
regulation score). This analysis should identify brain regions supporting regulation
processes.
The final analyses were done to identify brain regions recruited more strongly
during regulation than natural responding during the anticipation period (when active
regulation occurred). Specifically, whole brain contrasts of Relax greater than Look were
performed separately for the two negative cues, loss and variable.

91
4.3 Results
Behavioral results: Subjective ratings. To examine whether relax regulation
reduced the negative emotion experienced while anticipating the outcome of the squares,
a 2 strategy (look, relax) by 3 cue type (loss, safe, variable) repeated measures ANOVA
was performed on the emotion intensity ratings (Figure 4.2). The ANOVA revealed a
main effect of strategy, F(1, 23) = 7.90, p = 0.01, a main effect of cue type, F(1.22,
27.95) = 61.61, p = 0.001 (Greenhouse-Geisser corrected), and an interaction of strategy
and cue type, F(1.52, 35.03) = 4.95, p = 0.02. Paired t tests were conducted to
characterize the nature of the observed interaction. Relax regulation decreased the
intensity of negative emotion for the loss [look M = 4.50, relax M = 4.00; t(23) = 1.77, p
= 0.09] and variable [look M = 3.73, relax M = 2.96; t(23) = 3.85, p = 0.001] cues, but
there was no difference for the safe cue [look M = 1.61, relax M = 1.60; t(23) = 0.20, p =
0.85].
Additional analyses probed the influence of cue type on the two other ratings
collected during the Colored Squares Game, the focus and relax success ratings. To
determine if the level of focus on the cue outcomes during anticipation varied as a
function of cue type, we used a one-way repeated measures ANOVA with cue type (loss,
safe, variable) as the factor. There was a significant main effect of cue type, F(1.38,
31.66) = 37.18, p = 0.001. Subjects reported focusing the most on outcomes for the
variable cue (M = 5.6, SD = 1.47); ratings for the loss (M = 2.92, SD = 1.71) and safe (M
= 2.85, SD = 1.53) cues were significantly lower than those for the variable cue and did
not differ from each other. A final analysis assessed whether success at using the relax
imagery differed across the three cue types. A repeated-measures ANOVA with cue type

92
(loss, safe, variable) as the factor revealed that the main effect of cue type was not
significant, F(2, 46) = 1.30, p = 0.28, suggesting that participants felt equally successful
using the imagery regulation for all the cues.
Neuroimaging Results.
Overview. Four main analyses were performed on the neuroimaging data: an
independent ROI analysis, whole brain strategy by cue type ANOVA, a whole brain
contrast plus correlation analysis that used emotion rating regulation scores, and whole
brain Relax versus Look contrasts for the loss and variable cues. The ROI analyses were
performed on beta weights estimated during the anticipation phase. The whole brain
ANOVAs tested beta weights from both the anticipation and cue phases, separately.
Finally, the emotion regulation score correlation analysis and the contrasts were
performed with anticipation phase data only, because active regulation putatively
occurred during this phase.
A priori ROIs. We estimated beta weights for the anticipation phase using the
GLM for three ROIS identified by the previous study of imagery regulation of shock cues
(Delgado, Nearing, LeDoux et al., 2008). These beta weights were input into repeated
measures ANOVAs with strategy (2: look, relax) and cue type (3: loss, safe, variable) as
the factors. The dlPFC ROI (x, y, z = -43, 28, 30) showed a trend for a main effect of
strategy, F(1, 23) = 3.51, p = 0.07, characterized by greater BOLD signal during
regulation (Figure 4.3). There was no main effect of cue type, F(2, 46) = 1.10, p = 0.34,
nor an interaction, F(2, 46) = 0.24, p = 0.79. The vmPFC ROI (x, y, z = 0, 35, -8)
revealed only a significant interaction of strategy and cue type, F(2, 46) = 3.26, p =
0.047; the main effect of strategy, F(1, 23) = 0.62, p = 0.44, and main effect of cue type,

93
F(1.56, 35.91) = 0.81, p = 0.43 (Greenhouse-Geisser corrected), were not significant.
Paired t tests determined that the there was a trend for higher beta weights in Look
relative to Relax for the loss cue, t(23) = 1.75, p = 0.09, but no significant differences
were observed for the safe, t(23) = 1.56, p = 0.13, or variable, t(23) = 1.25, p = 0.23 cues.
Finally, the amygdala ROI (x, y, z = -20, 0, -20) did not show any significant effects:
main effect of strategy, F(1, 23) = 0.54, p = 0.47, cue type, F(2, 46) = 0.72, p = 0.49,
interaction, F(2, 46) = 0.17, p = 0.84.
Whole brain ANOVAs.
Anticipation phase. To determine the brain regions involved in emotion
regulation in this task, a whole brain strategy (2: look, relax) by cue type (3: loss, safe,
variable) ANOVA was performed on the anticipation phase BOLD data using Brain
Voyager. Regions identified by the main effect of strategy statistical parametric map
(SPM) that showed a greater response during Relax were the right medial frontal lobe
(BA 6, see Figure 4.4) and left precentral gyrus (BA 4). Regions that showed greater
response during Look were the right inferior parietal lobe, bilateral fusiform gyrus, right
middle temporal gyrus and the left cerebellum. These regions are involved in visual
attention, which is consistent with the greater focus on the cues during Look compared to
Relax. See Table 4.1 for a list of all regions identified by this analysis.
The main effect of cue type SPM identified a number of brain regions, which are
all reported in Table 4.2. We grouped these regions into four categories based on the
observed pattern of activity for the three different cues. Regions that were potentially
sensitive to negative valence would show this pattern of activity: loss > variable > safe,
and regions sensitive to positive valence would show the opposite pattern: safe > variable

94
> loss. Sensitivity to uncertainty would be reflected in this pattern: variable > loss = safe,
while sensitivity to certainty would be reflected in this pattern: loss = safe > variable.
There were no regions that fit the negative valence pattern. One region, left postcentral
gyrus, had activity consistent with the positive valence pattern. Two regions fit the
uncertainty sensitivity pattern, left cuneus and right cuneus. Only the right subcallosal
gyrus (BA 25) conformed to the certainty pattern. Other patterns of activity were
observed in the remaining regions identified by the main effect of cue SPM.
The final SPM for the anticipation phase revealed regions that showed an
interaction of instruction and cue type including the precentral gyrus, postcentral gyrus,
parahippocampal gyrus, inferior parietal lobe, and superior and middle temporal gyri (see
Table 4.3 for a complete list). Based on the behavioral results, which showed decreased
negative emotion ratings for the loss and variable cues, we were interested in brain
regions that showed a consistent pattern. Specifically, we looked for regions that showed
increased activity in Relax compared to Look for the loss and variable cues. No regions
showed this specific pattern. Regions showing greater BOLD response in Relax
compared to Look for the loss cue were the superior temporal gyrus and inferior parietal
lobe; the postcentral and middle temporal gyri showed trends for this effect. No regions
showed greater BOLD signal in Relax relative to Look for the variable cue. Regions
demonstrating increased BOLD signal in Relax compared to Look for the safe cue were
the precentral, postcentral, and parahippocampal gyri. Several regions evinced
increased responses during natural responding relative to regulation. Regions that
showed greater responses during Look for the loss cue were the middle temporal and
parahippocampal gyri. The postcentral gyrus, middle temporal gyrus, and inferior
95
parietal lobes all demonstrated greater BOLD in Look relative to Relax for the variable
cue. Finally, no regions showed increased responses in Look compared to Relax for the
safe cue.
Cue phase. To assess how BOLD signal varied with cue type, we performed a
second whole brain 2 X 3 ANOVA on the cue phase data. Of primary interest, were
regions identified in the main effect of cue type SPM. As an exploratory analysis, we
examined the SPMs for the main effect of strategy and interaction of strategy and cue
type. These SPMS identified regions whose BOLD signal change pattern suggests
modulation due to the state of being in a relax mini-block, when regulation was not
explicitly instructed. We grouped regions identified by the main effect of cue type SPM
into the four categories discussed above. No regions were identified that conformed to
the negative valence pattern. A region of the right caudate nucleus fit with the positive
valence pattern. No regions were consistent with the uncertainty pattern. Three regions,
the inferior parietal lobe, the right precuneus, and the right lingual gyrus conformed to the
certainty pattern. Several other regions were identified by the main effect of cue type
SPM that did not conform to any of these four patterns; see Table 4.4 for a complete list
of all active regions. The main effect of strategy SPM revealed a number of brain
regions, all of which showed greater activity during Look (see Table 4.5). For the
interaction of strategy and cue type SPM, a large number of regions were detected. A full
list of the regions identified by this SPM is reported in Table 4.6.
Emotion regulation score correlation. The correlation analysis revealed brain
regions in which activity was greater during regulation compared to natural responding
and was correlated with the shift in negative emotion ratings from Look to Relax. For the

96
loss cue, this analysis did not reveal any regions. For the variable cue, only a region of
the right inferior frontal gyrus (BA 45) was negatively correlated with emotion regulation
scores. Greater activity in this region in Relax (relative to Look) was associated with
higher negative emotion ratings in Relax (relative to Look), and lower activity in this
region in Relax (relative to look) was associated with lower negative emotion ratings in
Relax (relative to Look).
Relax versus Look contrasts. The final analysis was just a simple contrast of
Relax versus Look for the anticipation phase. For the loss cue, a region of the left middle
frontal gyrus (BA 9/44), the middle and superior temporal gyri (BA 21, 22), and two
regions of the inferior parietal lobe (BA 40) showed greater activity during Relax relative
to Look (Table 4.7). These regions were potentially involved in the process of
regulation. Several regions showed the opposite pattern, greater activity during Look.
They are the right medial frontal lobe (BA 8), right parahippocampal gyrus, right
occipital lobe, and left cerebellum.
The Relax versus Look contrast for the variable cue (Table 4.8) did not reveal any
regions whose activity was greater in Relax. The regions that showed greater activity
during Look included the right postcentral gyrus (BA 43), left precentral gyrus (BA) 6),
right fusiform gyrus, and left occipital lobe (BA 19).
4.4 Discussion
This experiment demonstrated that imagery-focused emotion regulation
effectively decreases negative emotion elicited by loss conditioned cues. Although the
observed decreases in negative emotion were quite clear, the neural circuits supporting

97
regulation were less well elucidated. The brain regions implicated in emotion regulation
in this task, those showing greater BOLD signal during Relax compared to Look trials,
were somewhat different from those identified in previous studies. The current results
and their implications will be reviewed.
First, the ratings results will be discussed. The emotion intensity ratings
demonstrated significant decreases in negative emotion during regulation trials for the
loss and variable cues. There was no difference for the safe cue, but because the Likert
rating scale used only assessed negative emotion ranging from weak to strong, this result
is not surprising. The safe cue was a positive cue in the context of the experiment. It is
important to consider that although efforts were taken to make the financial consequences
of the cues salient, the negative emotion ratings for the loss and variable cues were not
very high. During Look, the average rating for the loss cue was 4.50, and the average
rating for the variable cue was 3.73; on a 7 point scale ranging from 1 = weak to 7 =
strong, these rating suggest moderate levels of negative emotion.
The ratings of how much participants thought about the cue outcomes for Look
trials, the focus ratings, were also telling. Participants reported thinking about the
outcome of the variable cue significantly more than that of the loss or safe cue. This
result is expected, as the outcome of each trial of the variable cue was not known. It is
focus ratings for the loss cue were so low. In this task,
participants had no control over the outcome of any of the cues; moreover, the outcomes
of the loss and safe cues were 100% deterministic. The low focus ratings for the loss cue
could indicate tha
outcome. This response is quite adaptive and suggests some amount of spontaneous

98
regulation may have occurred during Look trials for the loss cue. If something bad is
going to ha
negative outcome. If participants were spontaneously regulating during Look with the
loss cue, that may complicate or weaken the neural comparisons of Relax versus Look.
Turning to the neuroimaging results, the patterns of BOLD signal for the a priori
ROIs suggested some overlap in the regulation of primary and secondary reinforcers.
The trend for greater activity observed during regulation in the dlPFC ROI is consistent
with the previous study by Delgado and colleagues (2008). Additionally, numerous other
regulation studies have implicated the dlPFC in emotion regulation (Ochsner & Gross,
2008). The observed result of increased activity in vmPFC ROI for Look trial compared
to Relax trials is opposite of that found in the previous shock study, which showed a
relative increase in vmPFC activity during regulation relative to natural responding.
Additionally, the lack of modulation of the BOLD signal in the amygdala ROI in the
current study is not consistent with the previous study, which found that emotion
regulation decreased activity in the amygdala; however, previous research did not find a
role for the amygdala in responding to cues associated with money losses (Delgado, Jou,
& Phelps, 2011). The vmPFC is interconnected with the amygdala and plays a central
role in modulating the amygdala during the processes of extinction (Delgado, Olsson, &
Phelps, 2006; Phelps, Delgado, Nearing et al., 2004) and emotion regulation (Delgado,
Nearing, LeDoux et al., 2008). It is possible that the vmPFC may not have been recruited
during regulation in the current task, because the loss and variable cues did not elicit
significant amygdala activation during natural responding.

99
Previous research has found that emotion regulation strategies engage regions of
the prefrontal cortex, including the dorsal and ventral lateral regions, and the anterior
cingulate cortex (Delgado, Gillis, & Phelps, 2008; Delgado, Nearing, LeDoux et al.,
2008; Green & Malhi, 2006; Ochsner & Gross, 2008). The main effect of strategy SPM
determined by the whole brain strategy by cue type ANOVA for the anticipation phase
identified only two regions that showed greater activity during regulation compared to
natural responding, a region of the right superior frontal gyrus (BA 6) and a region of the
left precentral gyrus (BA 4). However, these regions do not exactly correspond to those
prefrontal areas typically implicated in emotion regulation. Previous studies of regulation
have identified more anterior regions of the superior frontal gyrus including Brodmann
areas 8 and 9. The regions identified in this task were more posterior and included
regions of the primary motor cortex. These regions are different from what was predicted
based on the previous work, and therefore it is difficult to make conclusions. Because
these two regions were the only regions that showed a main effect of increased activity
during regulation, it is likely that they were recruited to support the process of regulation.
The regions identified by the main effect of strategy SPM for the cue phase
included those involved in attention and visual processing as well as areas of the
prefrontal cortex. All of these regions showed greater activity during natural responding
compared to regulation, revealing that neural activity during the cue phase was very
different for Look and Relax trials. Although regulation was not explicitly directed
during the cue phase, these results demonstrate that neural activity during regulation was
reduced in brain regions involved in attention and visual processing, suggesting that less
attention was paid to the cues during Relax mini-blocks.

100
Regions identified as having a main effect of cue type for the anticipation and cue
phases were categorized based on their specific pattern of activity for the three cue types.
For the anticipation phase, the postcentral gyrus demonstrated a pattern of activity that
suggested it was tracking positive valence. The postcentral gyrus includes the sensory
cortex. Future research is needed to understand its role in differentiating the valence of
the cues. The cuneus showed sensitivity to uncertainty, perhaps indicating greater visual
processing of the variable cue. Finally, activity in the right subcallosal gyrus (BA 25),
also known as the subgenual cingulate, was greatest for the certain cues, loss and safe.
The subgenual cingulate is involved in emotion (Kober, Barrett, Joseph, Bliss-Moreau,
Lindquist, & Wager, 2008), and it is part of the affective processing subsection of the
anterior cingulate cortex (Bush, Luu, & Posner, 2000).
Regions identified by the main effect of cue type in the cue phase were fairly
different than those identified for the anticipation phase. These differences could be due
to regulation, phase, or a combination of both. For the cue phase, a region of the right
caudate nucleus seemed to be tracking positive valence, which is consistent with previous
research (Balleine, Delgado, & Hikosaka, 2007; Delgado, Locke, Stenger, & Fiez, 2003;
Delgado, Stenger, & Fiez, 2004). The three regions that showed greater BOLD signal for
the certain cues were brain regions involved in visual attention, suggesting that the cues
signaling known outcomes may have captured attention at a higher level during initial
presentation (cue phase).
Finally, brain regions identified as showing an interaction of strategy and cue type
for the anticipation phase consisted mostly of regions in the inferior parietal and temporal
lobes. Regions showing this interaction for the cue phase were primarily identified in the

101
inferior parietal, temporal and occipital cortices. These results suggest that regions
involved in attention and visual processing showed differential effects of strategy and cue
type.
The correlation analysis was conducted to identify brain regions whose activity
was related to observed shifts in emotion intensity from Look to Relax. For the variable
cue, this analysis determined that activity in a region of the right inferior frontal gyrus
(BA 45) was negatively correlated with emotion intensity shifts (emotion regulation
score: Look minus Relax intensity ratings). The nature of the observed relationship was
such that increased activity in this region in Relax relative to Look was associated with
higher negative emotion ratings in Relax relative to Look. This pattern suggests that this
region was involved in emotional responses to the cues, as greater activity in this region
was related to greater reports of negative emotion.
Finally, the Relax versus Look contrasts for the loss and variable cues showed
which regions were recruited during regulation. For the loss cue, one prefrontal region
showed greater activity in Relax compared to Look, the left middle frontal gyrus (BA
9/44). This region overlaps with those prefrontal regions identified in other regulation
work. For the variable cue, no regions showed greater recruitment during regulation
compared to natural responding. It is unclear why several brain regions including a
region of the prefrontal cortex were involved in regulation with the loss cue, but similar
regions were not involved for the variable cue. Reactions to the variable cue may have
differed more across participants than reactions to the loss cue, leading to less consistent
neural activity for the variable cue.

102
Overall, this study demonstrated that the imagery regulation strategy ameliorated
negative emotions elicited by loss cues. The neural mechanisms of this strategy share
some overlap with those of previous, namely increased activity in prefrontal brain regions
during regulation. The observed shifts in neural activity from Look to Relax were
widespread in the brain, suggesting that regulation affected processing in regions
involved in attention and vision. These results hint that the primary responses evoked by
the loss and variable cues were more perceptual and attentional rather than visceral. The
cues may have been processed more on a cognitive level than a basic emotional one.

103
Chapter 5: General Discussion
5.1 Summary and Significance
Overall summary. What we think about when faced with cues signaling potential
monetary gains or losses affects how we feel and what we chose. Four empirical
experiments demonstrated these effects. The first three experiments tested the effect of
emotion regulation on risk-taking in financial decisions. The fourth experiment
examined the influence of emotion regulation on feelings of negative emotion associated
with monetary loss cues. Within-subjects design was used in all experiments and all
experiments included a natural responding (Look) condition in addition to the regulation
condition(s).
In the first experiment, participants engaged in imagery-focused regulation when
presented with cues signaling financial decisions in which money could be won.
Generating relaxing imagery during the cue decreased risk-taking in the subsequent
financial decisions for participants who felt successful at visualizing the imagery.
Neuroimaging data collected during the decision-making task revealed that responses to
risky choices in the ventral striatum were decreased after using regulation.
Experiment 2 sought to further explore this effect of imagery regulation by testing
it with a more complex set of financial decisions. Specifically, three types of financial
decisions that varied with regard to which option had the greater value (risky, safe or
equal) were used. When tested in this diverse decision environment, the relax imagery
strategy did not have any effect on risk-taking. Experiment 3 employed the same
financial decisions as Experiment 2, but it tested cognitive reappraisal regulation

104
strategies instead of imagery regulation. Cognitive reappraisal involved participants
changing their thoughts about the upcoming decision during the cue presentation before
the decision appeared. Two cognitive reappraisals were used, one in which participants
thought about the decision as being very important (Emphasize) and one in which they
thought about the decision as being insignificant (Deemphasize). These reappraisals
significantly altered risk-taking such that participants took the most risks on
Deemphasize trials and the fewest risks on Emphasize trials.
To elucidate a complete characterization of the Relax imagery strategy, the last
experiment tested whether imagery regulation would successfully decrease negative
emotions in response to cues signaling monetary losses. Imagery regulation decreased
negative emotion and altered neural responding. The regions affected by regulation were
diverse and not localized to the prefrontal cortex. Brain regions involved in attention and
visual processing showed decreased activity during regulation compared to natural
responding.
Neural circuitry involved in regulation. The current experiments enhance and
affirm current knowledge about the neural systems involved in emotion regulation.
Typically, emotion regulation studies have focused on changes in neural activity during
regulation of emotional stimuli. Experiment 1 added to this literature by demonstrating
that applying emotion regulation strategies to stimuli affects subsequent neural
processing during decision-making. Experiment 1 examined regulation-induced shifts in
neural signals in subcortical brain regions involved in processing risk and reward.
Imagery-focused regulation reduced activity associated with risky choices in the ventral
striatum, midbrain, and insula. These results are consistent with previous research

105
showing that activity in subcortical brain regions involved in affective learning and
emotion is modulated by emotion regulation.
Cortical regions were implicated in emotion regulation in both Experiments 1 and
4. In Experiment 1 an exploratory analysis determined that activity in a region of dorsal
cingulate cortex demonstrated both greater signal during regulation (compared to natural
responding) and correlation with activity in the ventral striatum. These results suggest
that the dorsal cingulate cortex was involved in imagery regulation and modulated
activity in the striatum. Modulation of the striatum by cortical regions is supported by
the existence of cortico-striatal loops and anatomical connections between regions of the
cingulate cortex and the striatum (Haber & Knutson, 2010).
While the primary neuroimaging goal of Experiment 1 was to identify regulation-
induced changes in neural activity during the decision phase, the aim of Experiment 4
was to probe the brain regions recruited during regulation of affective stimuli (monetary
cues). In Experiment 4 cortical regions showed greater signal during regulation trials
compared to natural responding. Cortical regions that showed greater signal during
regulation compared to natural responding regardless of the type of cue were the right
superior frontal gyrus (BA 6) and the left precentral gyrus (BA 4). These regions are
more posterior than those typically implicated in emotion regulation, but most previous
research employed reappraisal rather than imagery and tested regulation of more complex
stimuli (i.e., photographs rather than simple, repeated shapes). Notably, the intensity of
negative emotions evoked by the cues in the current study was moderate. A simple
contrast of regulation versus natural responding for the loss cue, which was rated the

106
most negative, revealed that the left middle frontal gyrus (BA 9/44) showed a pattern of
greater signal during regulation. This region is quite consistent with previous work.
Taken together, the current studies illustrate the circuitry involved in regulation.
Regions of frontal and cingulate cortex are recruited during regulation. These regions are
involved in cognitive control and keeping task goals online (Bush, Luu, & Posner, 2000;
Miller & Cohen, 2001). Regulation decreases activity in brain regions involved in
emotion and affective learning such as the striatum, insula, and amygdala. More
conceptually, emotions can be thought of as fairly automatic, rapid responses to
important cues in the environment. Structuring or interrupting these responses using
emotion regulation dampens their intensity and their associated neural activity via the
engagement of brain regions involved in control.
Significance. These studies involved novel paradigms and contribute new
knowledge to the emotion regulation literature. Most research on emotion regulation has
assessed changes in subjective emotion experience, typically via Likert rating self-
reports. The current research extends our knowledge about the effects of emotion
regulation by applying emotion regulation in decision-making contexts. The first three
studies demonstrate that there is a relationship between cognitions and affective
responses and subsequent choices, specifically, that choices can be altered by using
emotion regulation strategies. The last study showed that regulation can dampen the
emotional response to loss cues, which had not been examined previously. This research
is significant as appetitive and aversive cues can influence behavior by prompting
approach and avoidance tendencies. Approaching appetitive stimuli such as drug cues,
can lead to maladaptive patterns of behaviors such as drug-seeking. Curbing affective

107
reactions to these cues using emotion regulation techniques may help prevent the
development of addictions in at risk populations. Before making broad generalizations
about the application of this work, there are a few potential limitations to be considered.
These limitations will be discussed below.
5.2 Potential Limitations of the Emotion Regulation Strategies
There are several limitations of the emotion regulation strategies employed these
experiments. First, regulation was instructed and specifically directed in all tasks.
Second, there may be differences in the effectiveness of the imagery regulation strategy
at altering emotions versus decision-making. Third, it is useful to consider the difference
between regulation of emotions and regulation of behavior. These three topics are
explored in greater detail below.
All four studies used instructed regulation strategies. This means that participants
were trained on what to think about for regulation trials when faced with the gain or loss
cues. Within the tasks, participants were directed to engage in the regulation techniques
via the presentation of strategy words. Thus, participants did not have to generate
regulation strategies on their own, nor did they have to decide when to engage in
regulation. Additionally, in all of the studies participants were not made explicitly aware
that the goal of the strategies was to change their emotional responses. To avoid
experimenter demand, we did not tell participants that they were to change their
emotions. Instead, we explained to them what to think about for each regulation strategy.
In daily life, we are not guided through our emotional experiences in this way; we have to
choose when to use regulation and determine which strategy is most appropriate. Despite

108
these differences between real world and laboratory experiences of regulation, these
studies demonstrate the promise and potential of emotion regulation strategies. If
participants can effectively use these strategies in the lab setting, it suggests they could be
applied in daily life. Future research is needed to test whether long-term training in the
use of regulation would lead to greater shifts in behavior, for instance risk-taking.
With regard to the imagery strategy, it is interesting to compare its effects on
decision-making versus negative emotions. Experiment 1 found that the strategy
effectively decreased risk-taking, but only for participants who felt they had successfully
visualized the relaxing imagery. In Experiment 2, the imagery strategy had no effects on
risk-taking, even when success was taken into account. Finally, in Experiment 4, the
imagery strategy decreased negative emotion associated with money losses. Previous
research has demonstrated that the imagery strategy decreases responses to cues signaling
money gains and cues signaling shock (Delgado, Gillis, & Phelps, 2008; Delgado,
Nearing, LeDoux et al., 2008). Taking all of these findings together, the underlying
message is that the imagery strategy is most effective in simple contexts.
It is important to distinguish regulation of emotions from regulation of behavior in
this work. All of the experiments employed emotion regulation strategies, however, the
first three experiments focused on changes in behavior, risk-taking, instead of changes in
emotion. The broad theory supporting the current work is that emotions influence
behavior by promoting approach or avoidance tendencies. Emotion regulation strategies
effectively change emotional responses to affective stimuli such as conditioned cues. In
the decision-making studies, conditioned cues predicted financial decisions, opportunities
to engage in risk-taking or to choose risk-free options. We theorized that natural

109
emotional responses to these cues, excitement and reward anticipation, would promote
risk-taking to gain larger rewards. Further, we hypothesized that engaging in emotion
regulation when faced with the conditioned cues would alter (decrease in Experiment 1
and 2 and Decrease or Increase in Experiment 3) these natural responses and therefore
alter risk-taking. It was not possible to assess both emotion ratings and decision-making
on the same trials in these experiments, so we relied on skin conductance measures to
ascertain whether shifts in actual emotion responses had occurred with regulation. Skin
conductance measures from Experiment 3 provided evidence that the reappraisal
regulation strategies did change actual affective responses during exposure to the cues.
Skin conductance measures from Experiment 2 did not demonstrate that any shifts in
arousal occurred as a function of imagery regulation, but this null finding was consistent
with the absence of an effect of imagery regulation on risk-taking.
5.3 Potential Limitations of the Operational Definition of Decision-making
A goal of this research was to understand how emotion regulation can alter
decision-making. The modern environment is filled with cues that signal opportunities
for rewards and potential punishments. It is important to understand how changing
thoughts and emotional reactions to theses cues can change decision-making. We chose
to study financial decision-making, and to examine risk-taking as the dependent variable
and the operational definition of decision-making. The first three experiments measure
changes in risk-taking as a function of regulation. The choices that participants made
were either risky or safe, and these choices were the outputs of the decision process.
Focusing on the specific choices was a very specific measure of decision-making. Of

110
course, the term, decision-making, encompasses a wide variety of situations. Decisions
can range from very complex and temporally extended, for instance, deciding which
house to buy, to very simple and short in duration, Coke or Sprite. All of the decisions
studies in these experiments were simple; they involved only two options, and the options
contained the same kinds of information, probability and amount. All of the decisions in
these experiments were also of short durations; participants had four seconds to indicate
their choice. The nature of the decisions used potentially limits the generalizability of the
results. It is possible that emotion regulation strategies would not be as effective when
used with complex or temporally extended decisions; however, before testing that
relationship it would be important to understand the influence of emotions on complex
and/ or temporally extended decisions. The current research does represent one kind of
experience that occurs in everyday life, cues signaling opportunities for gains or losses;
therefore, this research is informative about how changing natural reactions to those cues
impacts simple choices.
5.4 External Validity of the Financial Consequences
The external validity of the financial consequences of all four experiments was
somewhat limited. All four studies involved actual financial outcomes that were
experienced by the participants, but these outcomes never involved the loss of money
from the partici s. The worst possible outcome in the decision-making
studies was to receive no money and the worst possible outcome of the loss cues study
was to receive $20, the minimum amount that was guaranteed. All three decision-making
studies involved risky options in which the probability of winning the full amount of

111
money or receiving nothing was known. If a risky option was chosen and the participant
t win any. However,
since participants always had a choice between a guaranteed amount of money (safe
option) and risky option, it can be argued that losing on a risky choice is equivalent to
losing the guaranteed amount they could have had, had they chosen the safe option. Still,
we cannot be certain that participants conceptualized the risky options in this manner.
The experimental decisions present a different kind of risk than that encountered in the
real world. When a bet is made gambling at a casino, for example, a sum of money is put
on the line and there is a chance (typically an unknown probability) that that sum will be
lost. Given that the consequences of losing a gamble in the decision-making experiments
were less severe, one might have expected that people would often or even almost always
take a risk. The data from the three experiments show that this is not the case. People
are quite risk averse in these experiments, choosing the risky option less than half of the
time. If the contingencies of the decisions had involved actual losses, it is likely that
participants would have exhibited even greater levels of risk aversion in their choices.
In the fourth experiment, participants earned money during the Gambling Game,
and the money losses they experienced for the loss and variable cues were taken from
these earnings. Although efforts were taken to make participants feel endowed with these
Gambling Game earnings, it is possible that the losses were not salient. Further, losses
experienced in daily life typically have greater consequences and involve reductions to
the total sum of money owned.
The three decision-making studies demonstrated that people were fairly risk
averse. During the natural responding conditions (Look), participants chose the risky

112
option only about 35-45% of the time. Additionally, reaction time data revealed that
when participants chose the safe option decision times were shorter than when they chose
the risky option, suggesting that the safe option was the pre-potent response. If
pick the safe option, then it may be easier to enhance that
tendency than decrease it with regulation. The failure of the Excite imagery regulation
strategy in Experiment 1 to increase risk-taking above the levels observed in Look might
be in part be due to participants risk aversion and tendency to chose the safe response.
However, the cognitive Deemphasize strategy in Experiment 3 did increase risk-taking
above levels observed in Look, suggesting that cognitive regulation can effectively
modulate risk-taking in the opposite direction of the pre-potent response.
5.5 Intensity of Emotional Responses
The intensity of the emotions generated by the cues used in all four studies was on
average moderate based on review of the subjective ratings. It is difficult to evoke strong
emotional responses in a laboratory setting. In the first three studies, we attempted to
elicit feelings like excitement and pleasure with the presentation of the slot machine
reward cues, which always signaled the opportunity to gain money. Although
participants were paid based on their choices in selected decisions from the tasks, there
was no feedback about the outcomes of decisions within the task. Trial-by-trial feedback
likely would have increased the emotional intensity of the cues. We did not include trial-
by-trial feedback in the tasks, as it is known that feedback influences subsequent
decision-making, and we wanted to examine the effect of emotion regulation without
confounding it with feedback. The fourth study did contain trial-by-trial outcome

113
information yet, emotion ratings were still low in this study. All of the tasks used simple,
repeated stimuli; this design could have fostered habituation and lowered the emotion
intensity of the cues.
5.6 Individual Differences
Emotion regulation techniques were not affective for all participants. In
Experiment 1 two-thirds of the sample (regulators) felt successful at visualizing the
relaxing imagery. The other one-third (non-regulators) did not feel successful, and
decreases in risk-taking and striatum activity were not observed. It is possible that the
imagery strategy may have been difficult for these participants; perhaps they would have
been more successful with a different type of strategy, for instance cognitive reappraisal.
Given that there are different kinds of emotion regulation strategies, it is highly unlikely
that the ability to visualize and engage in mental imagery is equivalent to regulation
ability.
A large number of individual difference measures were included in Experiments 2
and 3. Only one of these measures, self-esteem, was significantly related to observed
shifts in risk-taking with regulation, and then only for one specific condition. The
participants in these experiments were undergraduate students; therefore, it is possible
that this sample was somewhat homogenous, and the variability observed in the
individual differences measures may not be representative of the general population.
Based on this sample, the most parsimonious conclusion is that differences observed
across participants in the overall effect of regulation on risk-taking are not due to any
particular traits, but rather situational factors. Importantly, this sample represents healthy

114
young adults. Deficits in emotion regulation have been observed in many clinical
disorders including depression and schizophrenia.
The current studies did not reveal any gender differences in the effects of emotion
regulation on risk-taking. It is possible that gender differences would emerge with larger
sample sizes, suggesting that if there are real gender differences, they may be small
effects.
5.7 Overall Conclusions and Future Directions
Broadly, this collection of experiments illustrates the power of our thoughts.
Changing what we think about when faced with appetitive and aversive cues affects how
we feel and how we act. Emotion regulation strategies typically used to alter subjective
affective responses to negative stimuli and situations can be applied in the context of
positive stimuli and decision-making. This research demonstrates that imagery-focused
strategies are most effective in simple contexts. Reappraisal strategies altered risk-taking
in a complex decision context; future research is needed to characterize the effects of
reappraisal strategies on risk-taking in simple decision contexts. Given the effectiveness
of reappraisal strategies with the set of mixed decision types, future investigations of
emotion regulation applications to subsequent behavior should utilize cognitive strategies
like reappraisal.
Based on the current findings, it would be beneficial to explore the effects of
more extensive training in use of cognitive emotion regulation strategies. Perhaps with
long-term practice, people could develop habits of regulation, which would help them to
make their responses to appetitive and aversive cues more in line with their long term

115
goals. The current research demonstrates the potential of emotion regulation strategies to
influence behavior; future research is needed to determine the limits of and extents of
these influences. Additionally, future research should test these strategies in clinical
populations, for instance drug addicted individuals, to determine if emotion regulation
will alter behavior in those individuals.
116
References
Abler, B., Walter, H., Erk, S., Kammerer, H., & Spitzer, M. (2006). Prediction error as a linear function of reward probability is coded in human nucleus accumbens. Neuroimage, 31(2), 790-795.
Alexander, G. E., & Crutcher, M. D. (1990). Functional architecture of basal ganglia circuits: neural substrates of parallel processing. Trends in Neuroscience, 13(7), 266-271.
Arnsten, A. F., & Goldman-Rakic, P. S. (1998). Noise stress impairs prefrontal cortical cognitive function in monkeys: evidence for a hyperdopaminergic mechanism. Archives of General Psychiatry, 55(4), 362-368.
Balleine, B. W., Delgado, M. R., & Hikosaka, O. (2007). The role of the dorsal striatum in reward and decision-making. Journal of Neuroscience, 27(31), 8161-8165.
Balleine, B. W., & O'Doherty, J. P. (2010). Human and rodent homologies in action control: corticostriatal determinants of goal-directed and habitual action. Neuropsychopharmacology, 35(1), 48-69.
Beauregard, M., Levesque, J., & Bourgouin, P. (2001). Neural correlates of conscious self-regulation of emotion. Journal of Neuroscience, 21(18), RC165.
Bechara, A., Damasio, H., & Damasio, A. R. (2000). Emotion, decision making and the orbitofrontal cortex. Cerebral Cortex, 10(3), 295-307.
Blair, K. S., Smith, B. W., Mitchell, D. G., Morton, J., Vythilingam, M., Pessoa, L., Fridberg, D., Zametkin, A., Sturman, D., Nelson, E. E., Drevets, W. C., Pine, D. S., Martin, A., & Blair, R. J. (2007). Modulation of emotion by cognition and cognition by emotion. Neuroimage, 35(1), 430-440.
Breiter, H. C., Gollub, R. L., Weisskoff, R. M., Kennedy, D. N., Makris, N., Berke, J. D., Goodman, J. M., Kantor, H. L., Gastfriend, D. R., Riorden, J. P., Mathew, R. T., Rosen, B. R., & Hyman, S. E. (1997). Acute effects of cocaine on human brain activity and emotion. Neuron, 19(3), 591-611.
Bush, G., Luu, P., & Posner, M. I. (2000). Cognitive and emotional influences in anterior cingulate cortex. Trends in Cognitive Sciences, 4(6), 215-222.
117
Carver, C. S., & White, T. L. (1994). Behavioral inhibition, behavioral activation, and affective responses to impending reward and punishment: The BIS/BAS Scales. Journal of Personality and Social Psychology, 67(2), 319-333.
Christopoulos, G. I., Tobler, P. N., Bossaerts, P., Dolan, R. J., & Schultz, W. (2009). Neural correlates of value, risk, and risk aversion contributing to decision making under risk. Journal of Neuroscience, 29(40), 12574-12583.
Clark, L., Bechara, A., Damasio, H., Aitken, M. R., Sahakian, B. J., & Robbins, T. W. (2008). Differential effects of insular and ventromedial prefrontal cortex lesions on risky decision-making. Brain, 131(Pt 5), 1311-1322.
Cutrona, C. E., & Russell, D. W. (1987). The provisions of social relationships and adaptation to stress. Advances in Personal Relationships, 1, 37-67.
De Martino, B., Kumaran, D., Seymour, B., & Dolan, R. J. (2006). Frames, biases, and rational decision-making in the human brain. Science, 313(5787), 684-687.
Delgado, M. R. (2007). Reward-related responses in the human striatum. Annals of the New York Academy of Sciences, 1104, 70-88.
Delgado, M. R., Gillis, M. M., & Phelps, E. A. (2008). Regulating the expectation of reward via cognitive strategies. Nature Neuroscience, 11(8), 880-881.
Delgado, M. R., Jou, R. L., & Phelps, E. A. (2011). Neural systems underlying aversive conditioning in humans with primary and secondary reinforcers. Frontiers in Neuroscience, 5, 71.
Delgado, M. R., Labouliere, C. D., & Phelps, E. A. (2006). Fear of losing money? Aversive conditioning with secondary reinforcers. Social Cognitive Affective Neuroscience, 1(3), 250-259.
Delgado, M. R., Locke, H. M., Stenger, V. A., & Fiez, J. A. (2003). Dorsal striatum responses to reward and punishment: effects of valence and magnitude manipulations. Cognitive, Affective, and Behavioral Neuroscience, 3(1), 27-38.
Delgado, M. R., Nearing, K. I., LeDoux, J. E., & Phelps, E. A. (2008). Neural circuitry underlying the regulation of conditioned fear and its relation to extinction. Neuron, 59(5), 829-838.

118
Delgado, M. R., Olsson, A., & Phelps, E. A. (2006). Extending animal models of fear conditioning to humans. Biological Psychology, 73(1), 39-48.
Delgado, M. R., Stenger, V. A., & Fiez, J. A. (2004). Motivation-dependent responses in the human caudate nucleus. Cerebral Cortex, 14(9), 1022-1030.
Eippert, F., Veit, R., Weiskopf, N., Erb, M., Birbaumer, N., & Anders, S. (2007). Regulation of emotional responses elicited by threat-related stimuli. Human Brain Mapping, 28(5), 409-423.
Engelmann, J. B., & Tamir, D. (2009). Individual differences in risk preference predict neural responses during financial decision-making. Brain Research, 1290, 28-51.
Everitt, B. J., Belin, D., Economidou, D., Pelloux, Y., Dalley, J. W., & Robbins, T. W. (2008). Review. Neural mechanisms underlying the vulnerability to develop compulsive drug-seeking habits and addiction. Philosophical Transactions of the Royal Society of London: B Biological Sciences, 363(1507), 3125-3135.
Forman, S. D., Cohen, J. D., Fitzgerald, M., Eddy, W. F., Mintun, M. A., & Noll, D. C. (1995). Improved assessment of significant activation in functional magnetic resonance imaging (fMRI): use of a cluster-size threshold. Magnetic Resonance Medicine, 33(5), 636-647.
Foti, D., & Hajcak, G. (2008). Deconstructing reappraisal: descriptions preceding arousing pictures modulate the subsequent neural response. Journal of Cognitive Neuroscience, 20(6), 977-988.
Genovese, C. R., Lazar, N. A., & Nichols, T. (2002). Thresholding of statistical maps in functional neuroimaging using the false discovery rate. Neuroimage, 15(4), 870-878.
Giuliani, N. R., McRae, K., & Gross, J. J. (2008). The up- and down-regulation of amusement: Experiential, behavioral, and autonomic consequences. Emotion, 8(5), 714-719.
Goebel, R., Esposito, F., & Formisano, E. (2006). Analysis of functional image analysis contest (FIAC) data with brainvoyager QX: From single-subject to cortically aligned group general linear model analysis and self-organizing group independent component analysis. Human Brain Mapping, 27(5), 392-401.

119
Goldin, P. R., McRae, K., Ramel, W., & Gross, J. J. (2008). The neural bases of emotion regulation: Reappraisal and suppression of negative emotion. Biological Psychiatry, 63(6), 577-586.
Gosling, S. D., Rentfrow, P. J., & Swann, W. B., Jr. (2003). A very brief measure of the Big-Five personality domains. Journal of Research in Personality, .37(6), pp.
Gray, J. R. (2004). Integration of emotion and cognitive control. Current Directions in Psychological Science, 13(2), 46-48.
Green, M. J., & Malhi, G. S. (2006). Neural mechanisms of the cognitive control of emotion. Acta Neuropsychiatrica, 18(3-4), 144-153.
Gross, J. J. (1998a). Antecedent- and response-focused emotion regulation: Divergent consequences for experience, expression, and physiology. Journal of Personality and Social Psychology, 74(1), 224-237.
Gross, J. J. (1998b). The emerging field of emotion regulation: An integrative review. Review of General Psychology, 2(3), 271-299.
Gross, J. J. (2002). Emotion regulation: Affective, cognitive, and social consequences. Psychophysiology, 39(3), 281-291.
Gross, J. J., & John, O. P. (2003). Individual differences in two emotion regulation processes: Implications for affect, relationships, and well-being. Journal of Personality and Social Psychology, 85(2), 348-362.
Haber, S. N., & Knutson, B. (2010). The reward circuit: linking primate anatomy and human imaging. Neuropsychopharmacology, 35(1), 4-26.
Hare, T. A., Camerer, C. F., & Rangel, A. (2009). Self-control in decision-making involves modulation of the vmPFC valuation system. Science, 324(5927), 646-648.
Harenski, C. L., & Hamann, S. (2006). Neural correlates of regulating negative emotions related to moral violations. Neuroimage, 30(1), 313-324.

120
Heilman, R. M., Crisan, L. G., Houser, D., Miclea, M., & Miu, A. C. (2010). Emotion regulation and decision making under risk and uncertainty. Emotion, 10(2), 257-265.
Holt, C. A., & Laury, S. K. (2002). Risk aversion and incentive effects. American Economic Review, Vol. 92, No. 5, 1644-1655.
Hsu, M., Krajbich, I., Zhao, C., & Camerer, C. F. (2009). Neural response to reward anticipation under risk is nonlinear in probabilities. Journal of Neuroscience, 29(7), 2231-2237.
Kahneman, D., & Tversky, A. (1979). Prospect theory: An analysis of decision under risk. Econometrica, 47(2), 263-291.
Kalisch, R., Wiech, K., Critchley, H. D., Seymour, B., O'Doherty, J. P., Oakley, D. A., Allen, P., & Dolan, R. J. (2005). Anxiety Reduction through Detachment: Subjective, Physiological, and Neural Effects. Journal of Cognitive Neuroscience, 17(6), 874-883.
Kalisch, R., Wiech, K., Herrmann, K., & Dolan, R. J. (2006). Neural correlates of self-distraction from anxiety and a process model of cognitive emotion regulation. Journal of Cognitive Neuroscience, 18(8), 1266-1276.
Kang, S.-M., & Shaver, P. R. (2004). Individual Differences in Emotional Complexity: Their Psychological Implications. Journal of Personality, 72(4), 687-726.
Kim, S. H., & Hamann, S. (2007). Neural correlates of positive and negative emotion regulation. Journal of Cognitive Neuroscience, 19(5), 776-798.
Knutson, B., & Cooper, J. C. (2005). Functional magnetic resonance imaging of reward prediction. Current Opinion in Neurology, 18(4), 411-417.
Kober, H., Barrett, L. F., Joseph, J., Bliss-Moreau, E., Lindquist, K., & Wager, T. D. (2008). Functional grouping and cortical-subcortical interactions in emotion: a meta-analysis of neuroimaging studies. Neuroimage, 42(2), 998-1031.
Kober, H., Kross, E. F., Mischel, W., Hart, C. L., & Ochsner, K. N. (2009). Regulation of craving by cognitive strategies in cigarette smokers. Drug and Alcohol Dependence, 106(1), 52-55.

121
Kober, H., Mende-Siedlecki, P., Kross, E. F., Weber, J., Mischel, W., Hart, C. L., & Ochsner, K. N. (2010). Prefrontal-striatal pathway underlies cognitive regulation of craving. PNAS Proceedings of the National Academy of Sciences of the United States of America, 107(33), 14811-14816.
Kring, A. M., & Gordon, A. H. (1998). Sex differences in emotion: Expression, experience, and physiology. Journal of Personality and Social Psychology, 74(3), 686-703.
Kuhnen, C. M., & Knutson, B. (2005). The neural basis of financial risk taking. Neuron, 47(5), 763-770.
Kushner, M. G., Abrams, K., Donahue, C., Thuras, P., Frost, R., & Kim, S. W. (2007). Urge to gamble in problem gamblers exposed to a casino environment. Journal of Gambling Studies, 23(2), 121-132.
LaBar, K. S., Gatenby, J. C., Gore, J. C., LeDoux, J. E., & Phelps, E. A. (1998). Human amygdala activation during conditioned fear acquisition and extinction: a mixed-trial fMRI study. Neuron, 20(5), 937-945.
LaBar, K. S., LeDoux, J. E., Spencer, D. D., & Phelps, E. A. (1995). Impaired fear conditioning following unilateral temporal lobectomy in humans. Journal of Neuroscience, 15(10), 6846-6855.
Lazarus, R., & Alfert, E. (1964). Short-Circuiting of Threat by Experimentally Altering Cognitive Appraisal. Journal of Abnormal Psychology, 69, 195-205.
Lazarus, R. S. (1991). Progress on a cognitive-motivational-relational theory of emotion. American Psychologist, .46(8), 819-834.
Leland, D. S., Arce, E., Feinstein, J. S., & Paulus, M. P. (2006). Young adult stimulant users' increased striatal activation during uncertainty is related to impulsivity. Neuroimage, 33(2), 725-731.
Lerner, J. S., Small, D. A., & Loewenstein, G. (2004). Heart strings and purse strings: Carryover effects of emotions on economic decisions. Psychological Science, 15(5), 337-341.

122
Levesque, J., Fanny, E., Joanette, Y., Paquette, V., Mensour, B., Beaudoin, G., Leroux, J.-M., Bourgouin, P., & Beauregard, M. (2003). Neural circuitry underlying voluntary suppression of sadness. Biological Psychiatry, 53(6), 502-510.
Mandler, G. (1984). Mind and Body: Psychology of Emotion and Stress. New York: W. W. Norton & Company.
Martin, L. N., & Delgado, M. R. (2011). The Influence of Emotion Regulation on Decision-making under Risk. Journal of Cognitive Neuroscience, 23(9), 25692581.
Matthews, S. C., Simmons, A. N., Lane, S. D., & Paulus, M. P. (2004). Selective activation of the nucleus accumbens during risk-taking decision making. Neuroreport, 15(13), 2123-2127.
McRae, K., Hughes, B., Chopra, S., Gabrieli, J. D., Gross, J. J., & Ochsner, K. N. (2010). The neural bases of distraction and reappraisal. Journal of Cognitive Neuroscience, 22(2), 248-262.
McRae, K., Ochsner, K. N., Mauss, I. B., Gabrieli, J. J. D., & Gross, J. J. (2008). Gender differences in emotion regulation: An fMRI study of cognitive reappraisal. Group Processes & Intergroup Relations, 11(2), 143-162.
Middleton, F. A., & Strick, P. L. (2002). Basal-ganglia 'projections' to the prefrontal cortex of the primate. Cerebral Cortex, 12(9), 926-935.
Milad, M. R., & Quirk, G. J. (2002). Neurons in medial prefrontal cortex signal memory for fear extinction. Nature, 420(6911), 70-74.
Miller, E. K., & Cohen, J. D. (2001). An integrative theory of prefrontal cortex function. Annual Review of Neuroscience. Vol 24 2001, 167-202.
Nelson, A., & Killcross, S. (2006). Amphetamine exposure enhances habit formation. Journal of Neuroscience, 26(14), 3805-3812.
O'Doherty, J. P. (2004). Reward representations and reward-related learning in the human brain: Insights from neuroimaging. Current Opinion in Neurobiology, 14(6), 769-776.

123
Ochsner, K. N., Bunge, S. A., Gross, J. J., & Gabrieli, J. D. E. (2002). Rethinking feelings: An fMRI study of the cognitive regulation of emotion. Journal of Cognitive Neuroscience, 14(8), 1215-1229.
Ochsner, K. N., & Gross, J. J. (2005). The cognitive control of emotion. Trends in Cognitive Sciences, 9(5), 242-249.
Ochsner, K. N., & Gross, J. J. (2008). Cognitive emotion regulation: Insights from social cognitive and affective neuroscience. Current Directions in Psychological Science, 17(2), 153-158.
Ochsner, K. N., Ray, R. D., Cooper, J. C., Robertson, E. R., Chopra, S., Gabrieli, J. D., & Gross, J. J. (2004). For better or for worse: neural systems supporting the cognitive down- and up-regulation of negative emotion. Neuroimage, 23(2), 483-499.
Panksepp, J. (1998). Affective neuroscience: The foundations of human and animal emotions. Series in affective science. Affective neuroscience: The foundations of human and animal emotions xii, 466 pp New York, NY, US: Oxford University Press.
Patil, P. G., Apfelbaum, J. L., & Zacny, J. P. (1995). Effects of a cold-water stressor on psychomotor and cognitive functioning in humans. Physiology & Behavior, 58(6), 1281-1286.
Phan, K. L., Fitzgerald, D. A., Nathan, P. J., Moore, G. J., Uhde, T. W., & Tancer, M. E. (2005). Neural substrates for voluntary suppression of negative affect: a functional magnetic resonance imaging study. Biological Psychiatry, 57(3), 210-219.
Phelps, E. A., Delgado, M. R., Nearing, K. I., & LeDoux, J. E. (2004). Extinction learning in humans: role of the amygdala and vmPFC. Neuron, 43(6), 897-905.
Phelps, E. A., & LeDoux, J. E. (2005). Contributions of the amygdala to emotion processing: from animal models to human behavior. Neuron, 48(2), 175-187.
Porcelli, A. J., & Delgado, M. R. (2009). Acute stress modulates risk taking in financial decision making. Psychological Science, 20(3), 278-283.

124
Potenza, M. N., & Winters, K. C. (2003). The neurobiology of pathological gambling: Translating research findings into clinical advances. Journal of Gambling Studies, 19(1), 7-10.
Preuschoff, K., Quartz, S. R., & Bossaerts, P. (2008). Human insula activation reflects risk prediction errors as well as risk. Journal of Neuroscience, 28(11), 2745-2752.
Quirk, G. J., & Beer, J. S. (2006). Prefrontal involvement in the regulation of emotion: convergence of rat and human studies. Current Opinion in Neurobiology, 16(6), 723-727.
Rangel, A., Camerer, C., & Montague, P. R. (2008). A framework for studying the neurobiology of value-based decision making. Nature Reviews Neuroscience, 9(7), 545-556.
Ray, R. D., Ochsner, K. N., Cooper, J. C., Robertson, E. R., Gabrieli, J. D. E., & Gross, J. J. (2005). Individual differences in trait rumination and the neural systems supporting cognitive reappraisal. Cognitive, Affective, & Behavioral Neuroscience, 5(2), 156-168.
Richards, J. M., & Gross, J. J. (2000). Emotion regulation and memory: The cognitive costs of keeping one's cool. Year of Publication 2000. Journal of Personality and Social Psychology, 79(3), 410-424.
Rosenberg, M. (1989). Society and the adolescent self-image (rev. ed.). 1989. Society and the adolescent self-image (rev. ed.). xxxii, 347 pp. Middletown, CT, England: Wesleyan University Press; England.
Salovey, P., Mayer, J. D., Goldman, S. L., Turvey, C., & Palfai, T. P. (1995). Emotional attention, clarity, and repair: Exploring emotional intelligence using the Trait Meta-Mood Scale. In Emotion, disclosure, & health (pp. 125-154). Washington, DC: American Psychological Association; US.
Schachter, S., & Singer, J. E. (1962). Cognitive, social, and physiological determinants of emotional state. Psychological Review, 69(5), 379-399.
Schaefer, S. M., Jackson, D. C., Davidson, R. J., Aguirre, G. K., Kimberg, D. Y., & Thompson-Schill, S. L. (2002). Modulation of amygdalar activity by the conscious regulation of negative emotion. Journal of Cognitive Neuroscience, 14(6), 913-921.
125
Scherer, K. R. (Ed.). (1999). Appraisal Theory. West Sussex: John Wiley & Sons Ltd.
Schonberg, T., Daw, N. D., Joel, D., & O'Doherty, J. P. (2007). Reinforcement learning signals in the human striatum distinguish learners from nonlearners during reward-based decision making. Journal of Neuroscience, 27(47), 12860-12867.
Seo, M. G., & Barrett, L. F. (2007). Being Emotional during Decision Making-Good or Bad? An Empirical Investigation. Academy of Management Journal, 50(4), 923-940.
Sinha, R. (2007). The role of stress in addiction relapse. Current Psychiatry Reports, 9(5), 388-395.
Sinha, R., Lacadie, C., Skudlarski, P., Fulbright, R. K., Rounsaville, B. J., Kosten, T. R., & Wexler, B. E. (2005). Neural activity associated with stress-induced cocaine craving: a functional magnetic resonance imaging study. Psychopharmacology (Berl), 183(2), 171-180.
Snyder, C. R., Harris, C., Anderson, J. R., Holleran, S. A., Irving, L. M., Sigmon, S. T., Yoshinobu, L., Gibb, J., Langelle, C., & Harney, P. (1991). The will and the ways: development and validation of an individual-differences measure of hope. Journal of Personality and Social Psychology, 60(4), 570-585.
Sokol-Hessner, P., Hsu, M., Curley, N. G., Delgado, M. R., Camerer, C. F., & Phelps, E. A. (2009). Thinking like a trader selectively reduces individuals' loss aversion. Proceedings of the National Academy of Sciences, U.S.A., 106(13), 5035-5040.
Staudinger, M. R., Erk, S., Abler, B., & Walter, H. (2009). Cognitive reappraisal modulates expected value and prediction error encoding in the ventral striatum. Neuroimage, 47(2), 713-721.
Talairach, J., & Tournoux, P. (1988). Co-planar stereotaxic atlas of the human brain: 3-dimensional proportional system: an approach to cerebral imaging. New York: Thieme Medical Publishers, Inc.
Tom, S. M., Fox, C. R., Trepel, C., & Poldrack, R. A. (2007). The neural basis of loss aversion in decision-making under risk. Science, 315(5811), 515-518.

126
Urry, H. L., van Reekum, C. M., Johnstone, T., Kalin, N. H., Thurow, M. E., Schaefer, H. S., Jackson, C. A., Frye, C. J., Greischar, L. L., Alexander, A. L., & Davidson, R. J. (2006). Amygdala and ventromedial prefrontal cortex are inversely coupled during regulation of negative affect and predict the diurnal pattern of cortisol secretion among older adults. Journal of Neuroscience, 26(16), 4415-4425.
Vohs, K. D., & Faber, R. J. (2007). Spent Resources: Self-Regulatory Resource Availability Affects Impulse Buying. Journal of Consumer Research, 33(4), 537-547.
Volkow, N. D., Fowler, J. S., Wang, G. J., Telang, F., Logan, J., Jayne, M., Ma, Y., Pradhan, K., Wong, C., & Swanson, J. M. (2010). Cognitive control of drug craving inhibits brain reward regions in cocaine abusers. Neuroimage, 49(3), 2536-2543.
Wang, G. J., Volkow, N. D., Telang, F., Jayne, M., Ma, Y., Pradhan, K., Zhu, W., Wong, C. T., Thanos, P. K., Geliebter, A., Biegon, A., & Fowler, J. S. (2009). Evidence of gender differences in the ability to inhibit brain activation elicited by food stimulation. Proceedings of the National Academy of Sciences, U.S.A., 106(4), 1249-1254.
Weiss, F. (2005). Neurobiology of craving, conditioned reward and relapse. Current Opinion in Pharmacology, 5(1), 9-19.
Winkielman, P., Berridge, K. C., & Wilbarger, J. L. (2005). Unconscious Affective Reactions to Masked Happy Versus Angry Faces Influence Consumption Behavior and Judgments of Value. Personality and Social Psychology Bulletin, 31(1), 121-135.
Yacubian, J., Glascher, J., Schroeder, K., Sommer, T., Braus, D. F., & Buchel, C. (2006). Dissociable systems for gain- and loss-related value predictions and errors of prediction in the human brain. Journal of Neuroscience, 26(37), 9530-9537.
Yacubian, J., Sommer, T., Schroeder, K., Glascher, J., Braus, D. F., & Buchel, C. (2007). Subregions of the ventral striatum show preferential coding of reward magnitude and probability. Neuroimage, 38(3), 557-563.

127
Figures Figure 1.1 Overview of Experiments
Figure 1.1. Overview of experiments. Experiment 1: imagery-focused monetary gain cues risk-taking in financial decisions & neural activity. Experiment 2: imagery-focused monetary gain cues risk-taking in financial decisions & arousal (skin conductance). Experiment 3: reappraisal monetary gain cues risk-taking in financial decisions & arousal (skin conductance). Experiment 4: imagery-focused monetary loss cues emotion ratings & neural activity.

128
Figure 2.1 Schematic of the Task Used in Experiment 1
Figure 2.1. Schematic of the Slot Machine Game, the experimental task used in Experiment 1. The number line on the left shows the task phases and their durations. A picture of a slot machine indicated a money decision and a picture of a stamp machine indicated a stamp decision. Money trials involved decisions between risky and safe options, and stamp trials involved control decisions between two representations of
indicated natur -focused regulation.

129
Figure 2.2 Decision-making Results of Experiment 1 Figure 2.2. Risk-taking in Experiment 1 was affected by strategy (Look = natural responding, Relax = imagery regulation) and self-reported success at using the imagery regulation. Regulators (n = 20) and Non-regulators (n = 10) groups were defined based on success ratings. Regulators showed decreased risk-taking during Relax trials, while Non-average proportion the risky option was chosen for decisions made on a paper questionnaire that completed days after the experimental session.

130
Figure 2.3 Neuroimaging Results of Experiment 1: Effects of Strategy and Choice in the Striatum Figure 2.3. A) Bilateral striatum correlated with increasing probability of reward during decision-making under risk. B) Mean parameter estimates for left ventral striatum reveal an interaction between instruction (Look, Relax) and choice (risky, safe). C) A similar result is observed in the right ventral striatum (Error bars indicate ±s.e.m.).

131
Figure 2.4 Neuroimaging Results of Experiment 1: Effects of Strategy and Choice in the Midbrain and Insula
Figure 2.4. The effect of strategy and choice in (A) the midbrain and (B) the insula. The left midbrain BOLD responses demonstrated an interaction of strategy and choice such that activity to risky choices was significantly reduced after regulation (Relax) compared to after responding naturally (Look). A main effect of choice was observed in the left anterior insula, with greater responses to risky compared to safe choices (Error bars indicate ±s.e.m.).

132
Figure 3.1 Schematic of the Task Used in Experiment 2
Figure 3.1. Schematic of the Imagery Slot Machine Game, the experimental task used in Experiment 2. The number line on the left indicates the phases of the task and their durations.

133
Figure 3.2 Decision-making Results of Experiment 2
Figure 3.2.Risk-taking was not affected by emotion regulation (Look = no regulation condition, Relax = regulation condition), but it was affected by decision type (good, bad, neutral).
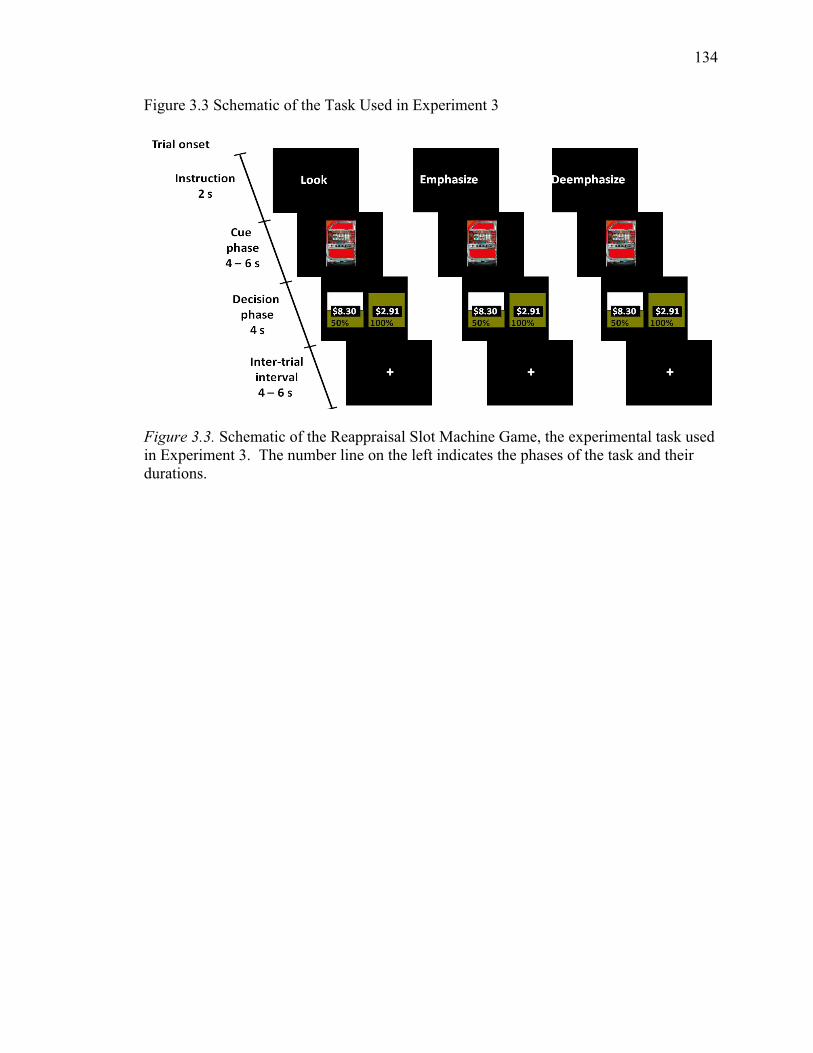
134
Figure 3.3 Schematic of the Task Used in Experiment 3
Figure 3.3. Schematic of the Reappraisal Slot Machine Game, the experimental task used in Experiment 3. The number line on the left indicates the phases of the task and their durations.

135
Figure 3.4 Decision-making Results of Experiment 3
Figure 3.4. Risk-taking was significantly affected by emotion regulation (Emphasize, Deemphasize) and by decision type (good, bad, neutral).

136
Figure 4.1 Schematic of the Task Used in Experiment 4
Figure 4.1. Experimental task used in Experiment 4, the Colored Squares Game. The phases and durations of the task are indicated along the number line on the left side. Trials for all three cue types (loss, safe, and variable) are illustrated.

137
Figure 4.2 Rating Results of Experiment 4
Figure 4.2. Negative emotion intensity ratings for the Loss and Variable cues were significantly lower during regulation (Relax) compared to natural responding (Look). Emotion intensity ratings were made using a Likert scale in with 1 = weak and 7 = strong negative emotions.

138
Figure 4.3 Activity in the Left Dorsolateral Prefrontal Cortex ROI
Figure 4.3. Results from Experiment 4. The left dorsolateral prefrontal cortex a priori ROI showed a main effect of strategy, with greater BOLD signal in Relax relative to Look.
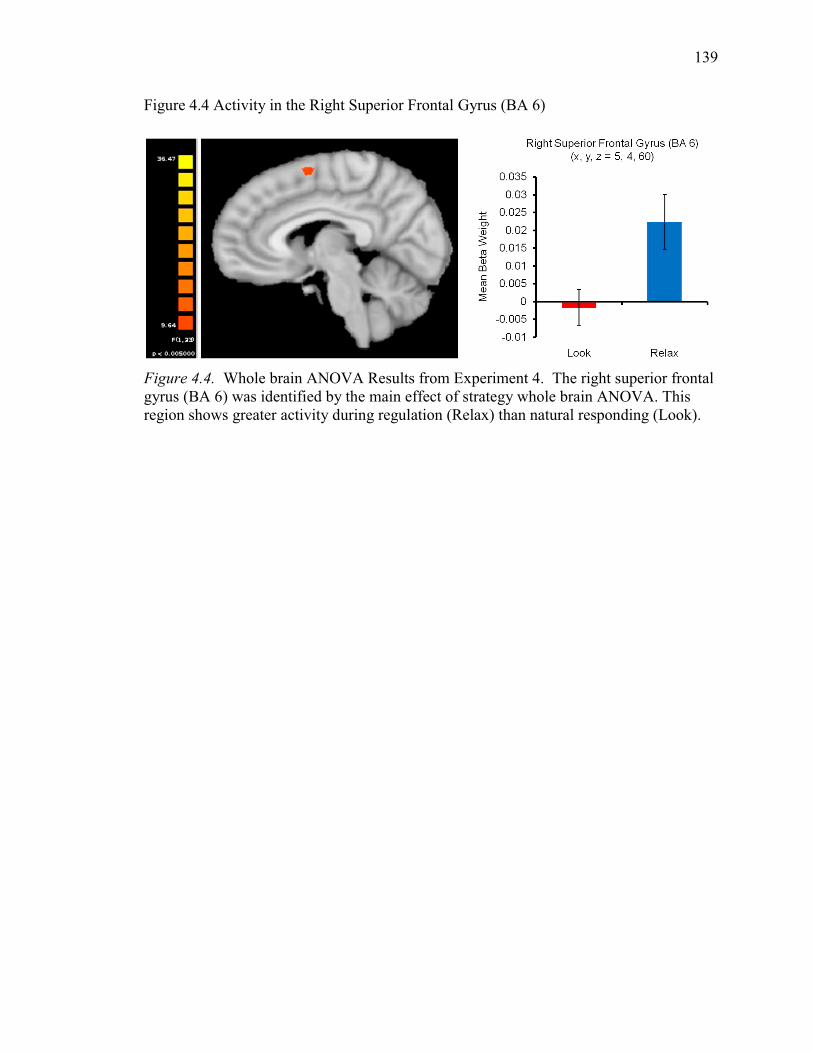
139
Figure 4.4 Activity in the Right Superior Frontal Gyrus (BA 6)
Figure 4.4. Whole brain ANOVA Results from Experiment 4. The right superior frontal gyrus (BA 6) was identified by the main effect of strategy whole brain ANOVA. This region shows greater activity during regulation (Relax) than natural responding (Look).

140
Figure 4.5 Right Inferior Frontal Gyrus Activity (Relax > Look) Correlation with Emotion Regulation Scores
Figure 4.5. Correlation Results of Experiment 4: Contrast plus correlation analysis for the variable cue. A) BOLD signal in the right inferior frontal gyrus (BA 45) was greater during Relax and negatively correlated with emotion regulation scores, Look minus Relax emotion ratings. B) Scatter plot showing that that greater activity in this region in Relax (relative to Look) was associated with higher negative emotion ratings in Relax (relative to Look).

141
Tables Table 2.1 Financial Decisions in Experiment 1 Risky Option Safe Option Decision Probability Amount Probability Amount
1 0.20 $10.35 1 $2.07 2 0.35 $11.66 1 $4.08 3 0.50 $12.18 1 $6.09 4 0.65 $6.28 1 $4.08 5 0.80 $2.59 1 $2.07

142
Table 2.2 Regions that Correlated with Increasing Probability of Reward in the Regulators Group Talairach Coordinates Region Laterality BA Voxels x y z t-stat Superior frontal gyrus L 6 161 -3 -16 55 6.39 Medial frontal gyrus R 32/6 347 6 2 49 6 Medial frontal gyrus L 32/6 365 -3 0 49 5.35 Inferior frontal gyrus L 44 119 -39 8 31 6.69 Insula L 132 -36 5 13 5.73 Ventral striatum L 340 -15 5 4 7.38 Thalamus L 342 -6 -10 4 6.86 Ventral striatum R 284 12 2 1 6.61 Thalamus R 283 6 -16 1 7.12 Insula L 300 -36 11 -2 8.79 Hippocampus R 194 21 -28 -2 7.48 Midbrain R 889 6 -22 -8 11.4 Midbrain L 747 -6 -16 -8 9.54 Midbrain L 850 -6 -25 -8 8.72 Lingual gyrus R 17 804 18 -91 -8 8.81 Lingual gyrus L 17 344 -18 -94 -8 7.46 Occipital lobe R 18 544 24 -85 -14 8.08 Cerebellum L 200 -1 -49 -28 5.76 Note. BA = Brodmann area; L = left; R = right; Map was FDR corrected, q(FDR) < 0.01

143
Table 3.1 Financial Decisions in Experiments 2 and 3
Risky Option Safe Option Decision Type Probability Amount EV Probability Amount EV
Good 0.35 $11.74 $4.11 1 $2.88 $2.88 Good 0.5 $8.30 $4.15 1 $2.91 $2.91 Good 0.65 $6.45 $4.19 1 $2.93 $2.93
Neutral 0.35 $11.85 $4.15 1 $4.15 $4.15 Neutral 0.5 $8.41 $4.21 1 $4.20 $4.20 Neutral 0.65 $6.56 $4.26 1 $4.26 $4.26
Bad 0.35 $11.59 $4.06 1 $5.27 $5.27 Bad 0.5 $8.15 $4.08 1 $5.30 $5.30 Bad 0.65 $6.30 $4.10 1 $5.32 $5.32
Note. EV = expected value

144
Table 3.2 Comparison of Imagery-focused and Reappraisal Strategies Strategy Dimension Imagery Regulation Reappraisal Regulation Attention Directed internally Directed at stimulus Effects on Emotion Create a new emotion Alter emotion elicited by the stimulus

145
Table 4.1 Anticipation Phase ANOVA: Brain Regions Showing a Main Effect of Strategy
Talairach
Coordinates Region Laterality BA Voxels x y z F p Relax > Look Superior frontal gyrus R 6 198 5 4 60 12.8589 0.00156 Precentral gyrus L 4 254 -34 -11 54 14.8755 0.0008 Look > Relax Inferior parietal lobe R 40 512 41 -65 42 15.6741 0.00062 Middle temporal gyrus R 21 317 69 -38 -13 16.7907 0.00044 Fusiform gyrus R 18 963 20 -95 -21 35.4603 5E-06 Fusiform gyrus L 18 714 -28 -95 -21 31.661 0.00001 Cerebellum L 282 -22 -77 -43 17.9991 0.00031

146
Table 4.2 Anticipation Phase ANOVA: Brain Regions Showing a Main Effect of Cue Type Talairach Coordinates Region Laterality BA Voxels x y z F p Postcentral gyrus L 1/2 514 -22 -32 60 12.41 5E-05 Superior frontal gyrus/ Middle frontal gyrus L 6 988 -4 4 54 18.10 2E-06 Precentral gyrus R 4 256 23 -23 51 8.54 0.0007 Superior frontal gyrus R 6/8 330 20 18 45 9.83 0.0003 Cingulate R 31 567 14 -32 33 12.30 5E-05 Cingulate L 24 495 -7 8 27 10.15 0.0002 Insula L 169 -31 19 21 7.61 0.0014 Corpus callosum (white matter) L 652 -4 -26 15 10.00 0.0002 Cuneus L 18 277 -25 -98 9 8.18 0.0009 Cuneus/ Occipital lobe R 18 665 29 -92 3 8.95 0.0005 Superior temporal gyrus L 22 253 -61 -26 3 10.68 0.0002 Subcallosal gyrus R 25 289 14 19 -12 8.76 0.0006 Cerebellum L 695 -10 -53 -15 10.41 0.0002 Fusiform gyrus R 37 307 44 -44 -18 8.50 0.0007 Note. BA =Brodmann area; L = left; R = right

147
Table 4.3 Anticipation Phase ANOVA: Brain Regions Showing a an Interaction of Strategy and Cue Type
Talairach
Coordinates Region Laterality BA Voxels x y z F p Precentral gyrus R 4/6 300 17 -14 55 11.56 9E-05 Postcentral gyrus R 4 319 23 -29 49 9.01 0.0005 Postcentral gyrus R 1/2 450 47 -23 45 9.09 0.0005 Superior temporal gyrus R 22 816 47 -35 15 11.20 0.0001 Middle temporal gyrus R 21 337 47 -20 -3 8.56 0.0007 Middle temporal gyrus R 21 564 41 -35 -3 13.28 3E-05 Parahippocampal gyrus R 35 505 11 -35 -9 10.22 0.0002 Parahippocampal gyrus L 19 656 -10 -47 -6 10.18 0.0002 Inferior parietal lobe L 40 289 -37 -38 30 10.21 0.0002 Inferior parietal lobe L 40 188 -55 -23 31 8.83 0.0006 Note. BA =Brodmann area; L = left; R = right

148
Table 4.4 Cue Phase ANOVA: Brain Regions Showing a Main Effect of Cue Type
Talairach
Coordinates Region Laterality BA Voxels x y z F p Postcentral gyrus R 1/2 223 50 -32 58 7.77 0.0012 Inferior parietal lobe R 40 198 32 -38 39 7.42 0.0016 Inferior parietal lobe R 40 298 41 -56 36 7.45 0.0016 Precuneus R 7 209 5 -59 30 8.90 0.0005 Lingual gyrus R 18/19 183 26 -56 3 7.94 0.0011 Caudate R 513 5 16 0 9.65 0.0003 Middle temporal gyrus R 21 613 51 -14 -3 12.60 4E-05 Fusiform gyrus L 21 359 -64 5 -24 16.31 4E-06 Note. BA =Brodmann area; L = left; R = right

149
Table 4.5 Cue Phase ANOVA: Brain Regions Showing a Main Effect of Strategy (All Relax > Look)
Talairach
Coordinates Region Laterality BA Voxels x y z F p Superior parietal lobe R 7 798 38 -56 57 29.16 2E-05 Inferior parietal lobe R 40 1000 44 -50 45 22.35 9E-05 Middle frontal gyrus L 8 331 -43 16 42 13.81 0.0011 Precentral gyrus L 6/4 265 -46 -8 42 17.00 0.0004 Inferior parietal lobe L 40 418 -58 -53 36 14.65 0.0009 Middle frontal gyrus R 9/8 944 44 19 36 27.41 3E-05 Precuneus R 19/7 571 5 -74 33 13.68 0.0012 Middle frontal gyrus R 9/46 409 41 43 30 20.02 0.0002 Lingual gyrus/ Cuneus L 17 892 -4 -95 0 16.17 0.0005 Middle temporal gyrus R 21 510 69 -35 -3 29.24 2E-05 Lingual gyrus L 18 607 -16 -98 -3 17.28 0.0004 Middle temporal gyrus L 21 631 -58 -35 -9 17.21 0.0004 Cerebellum R 390 26 -74 -33 16.13 0.0005 Cerebellum L 430 -13 -44 -36 22.65 9E-05 Cerebellum L 349 -37 -68 -36 17.06 0.0004 Note. BA =Brodmann area; L = left; R = right

150
Table 4.6 Cue Phase ANOVA: Brain Regions Showing an Interaction of Strategy and Cue Type
Talairach
Coordinates Region Laterality BA Voxels x y z F p Paracentral lobule/ Precuneus L 194 -13 -41 61 8.82 0.0006 Inferior parietal lobe R 40 375 34 -41 51 11.10 0.0001 Precuneus R 7 747 15 -56 48 18.33 1E-06 Precuneus L 7 692 -19 -58 48 12.93 4E-05 Inferior parietal lobe L 40 539 -37 -38 48 9.07 0.0005 Precuneus R 7 668 20 -56 46 13.81 2E-05 Precuneus L 685 -22 -50 39 11.50 9E-05 Inferior parietal lobe R 106 35 -46 39 7.96 0.0011 Inferior frontal gyrus L 44 235 -52 10 30 9.00 0.0005 Interior parietal lobe L 40 153 -43 -32 30 7.43 0.0016 White matter R 471 35 -35 27 7.98 0.0011 Cuneus R 18 217 17 -77 18 8.00 0.001 Insula L 183 -31 -26 18 7.66 0.0013 White matter L 375 -19 -47 18 7.32 0.0017 Cuneus L 18 472 -22 -69 15 12.92 4E-05 Cuneus L 18 472 -22 -69 15 12.92 4E-05 Inferior frontal gyrus L 46 331 -49 37 9 8.51 0.0007 Cuneus/ Occipital lobe R 31 733 23 -62 9 11.13 0.0001 Occipital lobe R 19 109 37 -80 9 6.76 0.0027 Occipital lobe L 19 526 -30 -70 6 8.61 0.0007 Superior temporal gyrus L 42/ 22 145 -45 -26 6 8.77 0.0006 Superior temporal gyrus L 22 359 -40 -32 5 12.38 5E-05 Superior temporal gyrus R 22 283 47 -20 4 8.92 0.0005 Superior temporal gyrus R 22 132 59 -17 3 7.73 0.0013 Inferior temporal gyrus R 37 657 50 -68 0 9.75 0.0003 Middle temporal gyrus L 21/37 209 -49 -53 -3 8.27 0.0009 Fusiform gyrus/ Lingual gyrus L 19 235 -25 -53 -6 7.95 0.0011 Fusiform gyrus/ Occipital lobe R 19 476 35 -68 -9 9.48 0.0004 Occipital lobe L 19 307 -46 -69 -9 8.28 0.0008 Middle temporal gyrus L 21 725 -58 -26 -12 12.23 6E-05 Fusiform gyrus R 20 248 38 -35 -17 8.22 0.0009

151
Table 4.6 (continued) Talairach Coordinates Region Laterality BA Voxels x y z F p Cerebellum L 258 -28 -32 -30 9.15 0.0005 Cerebellum R 238 17 -29 -36 9.29 0.0004 Note. BA =Brodmann area; L = left; R = right

152
Table 4.7 Loss Cue: Brain Regions Active for the Anticipation Phase Contrast of Relax vs. Look
Talairach
Coordinates Region Laterality BA Voxels x y z F p Relax > Look Middle frontal gyrus L 9/44 662 -37 16 27 4.95 5.3E-05 Inferior parietal lobe R 40 4431 44 -38 27 4.54 0.00015 Superior temporal gyrus L 22 1090 -46 -41 18 3.97 0.00061 Middle temporal gyrus R 21 4431 44 -44 6 4.54 0.00015 Look > Relax Superior frontal gyrus R 8 930 5 46 45 -4.94 5.4E-05 Occipital lobe R 19 583 35 -74 36 -3.74 0.00106 Parahippocampal gyrus R 30 205 12 -38 0 -3.50 0.00192 Cerebellum L 695 -10 -47 -6 -4.05 0.0005 Parahippocampal gyrus R 35 753 17 -32 -6 -4.92 5.7E-05 Cerebellum L 540 -10 -35 -12 -4.35 0.00024 R Fusiform Gyrus R 18 2815 17 -102 -18 -4.07 0.00048 L Fusiform Gyrus L 18 6165 -28 -95 -21 -5.81 6E-06 Cerebellum L 632 -49 -62 -36 -4.23 0.00031 Note. BA =Brodmann area; L = left; R = right

153
Table 4.8 Variable Cue: Brain Regions Active for the Anticipation Phase Contrast of Relax vs. Look
Talairach
Coordinates Region Laterality BA Voxels x y z F p Relax > Look No regions Look > Relax Precentral gyrus L 6 699 -61 -5 33 -3.74 0.00107 Postcentral gyrus R 43 794 50 -11 21 -4.05 0.0005 Middle temporal gyrus R 21 2450 47 -26 0 -5.61 0.00001 Fusiform gyrus R 37 598 38 -35 -9 -4.25 0.0003 Occipital lobe L 19 5554 -43 -86 -12 -4.66 0.00011 Fusiform gyrus R 18 1968 23 -95 -18 -4.52 0.00015 Note. BA =Brodmann area; L = left; R = right

154
Appendices
Appendix 1. Post Experimental Survey Used in Experiment 1 Post Experimental Survey
ID ______________ Date ____________
1. a) Overall, how positive or negative did the EXCITE imagery make you feel? 1 2 3 4 5 6 7 Very Negative Very Positive b) Overall, how excited did the EXCITE imagery make you feel? 1 2 3 4 5 6 7 Not Excited Very at all Excited 2. a) Overall, how positive or negative did the RELAX imagery make you feel? 1 2 3 4 5 6 7 Very Negative Very Positive b) Overall, how excited did the RELAX imagery make you feel? 1 2 3 4 5 6 7 Not Excited Very at all Excited 3. a) Overall, how positive or negative did what you thought about for LOOK
make you feel? 1 2 3 4 5 6 7 Very Negative Very Positive
b) Overall, how excited did what you thought about for LOOK imagery make you feel?
1 2 3 4 5 6 7 Not Excited Very at all Excited

155
4. How excited were you about the money? (1 =not at all excited, 7 =very excited)
Look 1 2 3 4 5 6 7 Excite 1 2 3 4 5 6 7 Relax 1 2 3 4 5 6 7 5. How excited were you about the stamps? (1 =not at all excited, 7 =very
excited) Look 1 2 3 4 5 6 7 Excite 1 2 3 4 5 6 7 Relax 1 2 3 4 5 6 7 6. How did you feel when you saw the slot machine? (1 =not at all excited,
7 =very excited) Look 1 2 3 4 5 6 7 Excite 1 2 3 4 5 6 7 Relax 1 2 3 4 5 6 7 7. How did you feel when you saw the stamp machine? (1 =not at all excited,
7 =very excited) Look 1 2 3 4 5 6 7 Excite 1 2 3 4 5 6 7 Relax 1 2 3 4 5 6 7 8. a) What did you think about when you saw LOOK and the slot machine?
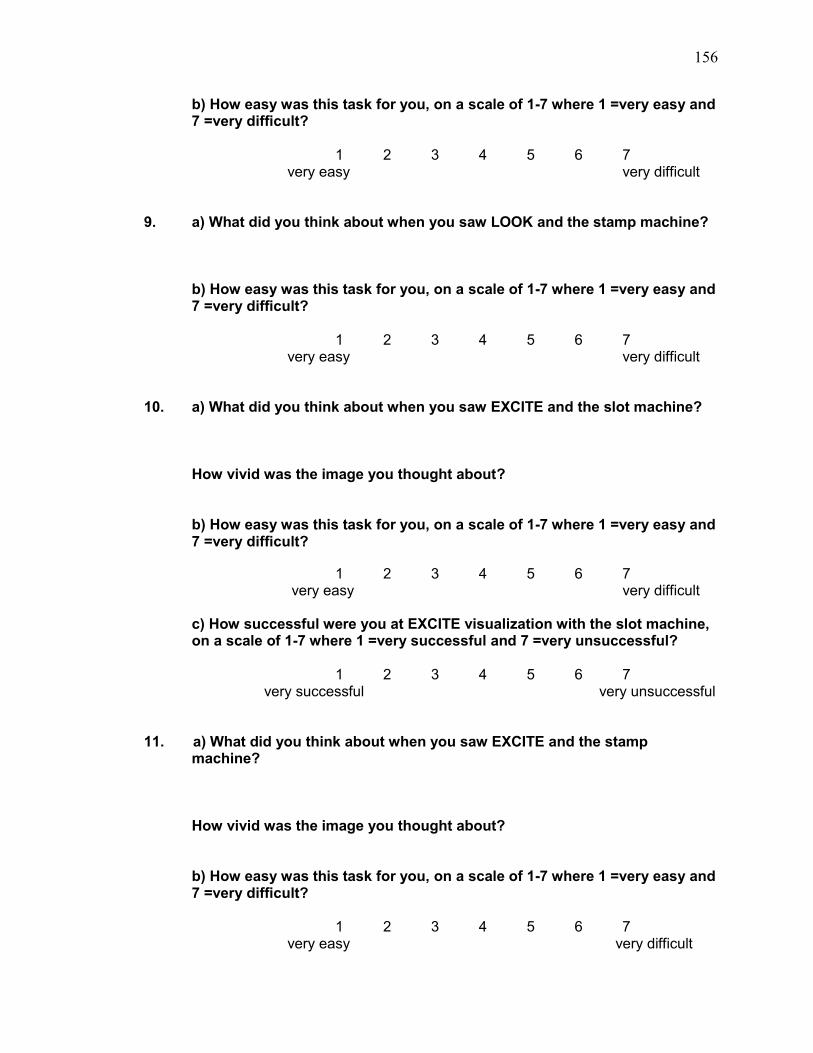
156
b) How easy was this task for you, on a scale of 1-7 where 1 =very easy and 7 =very difficult? 1 2 3 4 5 6 7 very easy very difficult 9. a) What did you think about when you saw LOOK and the stamp machine? b) How easy was this task for you, on a scale of 1-7 where 1 =very easy and 7 =very difficult? 1 2 3 4 5 6 7 very easy very difficult 10. a) What did you think about when you saw EXCITE and the slot machine? How vivid was the image you thought about? b) How easy was this task for you, on a scale of 1-7 where 1 =very easy and 7 =very difficult? 1 2 3 4 5 6 7 very easy very difficult
c) How successful were you at EXCITE visualization with the slot machine, on a scale of 1-7 where 1 =very successful and 7 =very unsuccessful?
1 2 3 4 5 6 7 very successful very unsuccessful 11. a) What did you think about when you saw EXCITE and the stamp
machine? How vivid was the image you thought about? b) How easy was this task for you, on a scale of 1-7 where 1 =very easy and 7 =very difficult? 1 2 3 4 5 6 7
very easy very difficult

157
c) How successful were you at EXCITE visualization with the stamp machine, on a scale of 1-7 where 1 =very successful and 7 =very unsuccessful?
1 2 3 4 5 6 7 very successful very unsuccessful 12. a) What did you think about when you saw RELAX and the slot machine? How vivid was the image you thought about? b) How easy was this task for you, on a scale of 1-7 where 1 =very easy and 7 =very difficult?
1 2 3 4 5 6 7
very easy very difficult c) How successful were you at RELAX visualization with the slot machine,
on a scale of 1-7 where 1 =very successful and 7 =very unsuccessful? 1 2 3 4 5 6 7 very successful very unsuccessful 13. a) What did you think about when you saw RELAX and the stamp machine? How vivid was the image you thought about? b) How easy was this task for you, on a scale of 1-7 where 1 =very easy and 7 =very difficult? 1 2 3 4 5 6 7
very easy very difficult
c) How successful were you at RELAX visualization with the stamp machine, on a scale of 1-7 where 1 =very successful and 7 =very unsuccessful?
1 2 3 4 5 6 7 very successful very unsuccessful

158
14. What do you think was the difference between the instructions (Look, Excite, Relax)?
15. For the money choices only, in general, how did you decide which option
to pick? 16. Do you think the instructions affected how you made your choices?

159
Appendix 2. Post Experimental Survey Used in Experiment 2 1. What did you think about when you saw LOOK and then the slot machine? 2. What did you think about when you saw RELAX and then the slot machine?
How easy or difficult was it to think about what you imagined for the RELAX trials?
1 2 3 4 5 6 7
very easy very difficult
How successful or unsuccessful were you at the RELAX visualization? 1 2 3 4 5 6 7 very unsuccessful very successful 3. Overall, how positive or negative did what you thought about for LOOK make you feel? 1 2 3 4 5 6 7 very negative very positive 4. Overall, how excited did what you thought about for LOOK make you feel? 1 2 3 4 5 6 7 not excited very at all excited 5. Overall, how positive or negative did the RELAX imagery make you feel? 1 2 3 4 5 6 7 very negative very positive

160
6. Overall, how excited did the RELAX imagery make you feel? 1 2 3 4 5 6 7 not excited very at all excited 7. How excited were you about the money? 1 2 3 4 5 6 7 not excited very at all excited 8. Do you believe that the money is real and will actually be paid to you if you win? 1 2 3 4 5 6 7 do not totally believe believe 9. What do you think was the difference between the two instruction words LOOK and RELAX? 10. In general, how did you decide which option to pick? 11. Do you think the instruction words, LOOK and RELAX, affected how you made your choices?

161
Appendix 3. Post Experimental Survey Used in Experiment 3 1. What did you think about when you saw LOOK and then the slot machine? 2. What did you think about when you were EMPHASIZING the slot machine?
How easy or difficult was it to think about the slot machine and the decision in a new way for the EMPHASIZE trials?
1 2 3 4 5 6 7
very easy very difficult
How successful or unsuccessful were you at EMPHASIZING? 1 2 3 4 5 6 7
very unsuccessful very successful 3. What did you think about when you were DEEMPHASIZING the slot machine?
How easy or difficult was it to think about the slot machine and the decision in a new way for the DEEMPHASIZE trials?
1 2 3 4 5 6 7
very easy very difficult
How successful or unsuccessful were you at DEEMPHASIZING? 1 2 3 4 5 6 7
very unsuccessful very successful 4. Overall, how positive or negative did what you thought about for LOOK make you feel? 1 2 3 4 5 6 7 very negative very positive
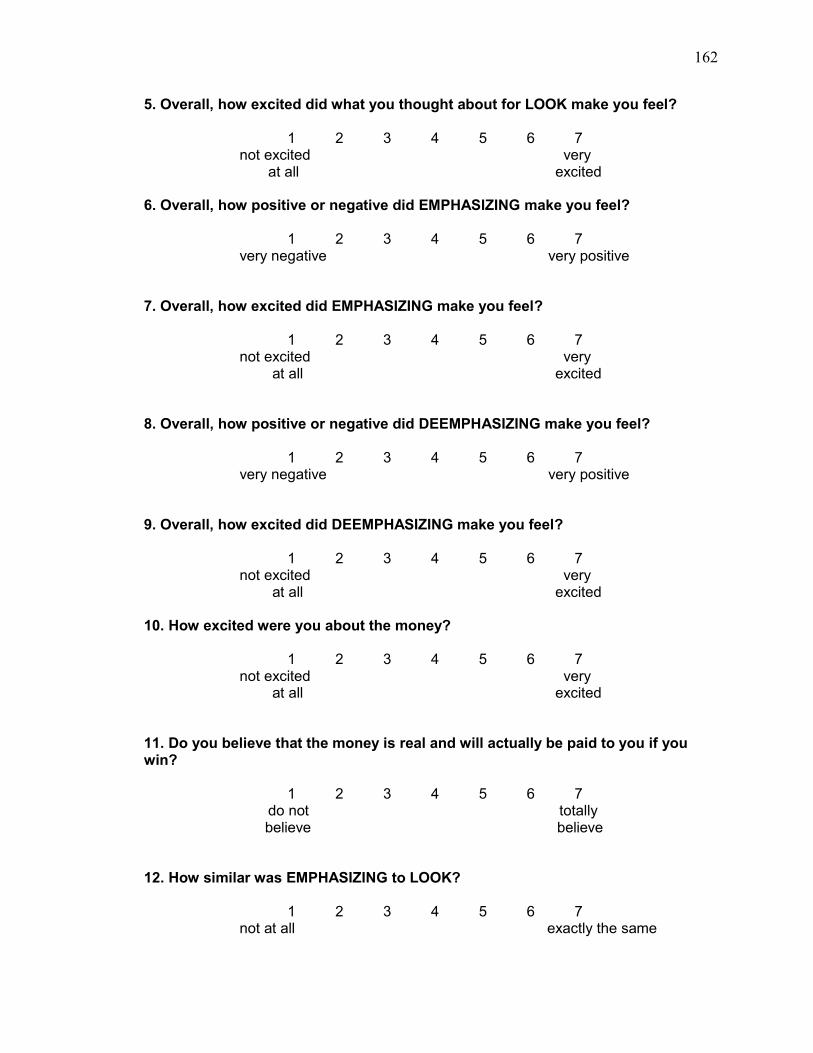
162
5. Overall, how excited did what you thought about for LOOK make you feel? 1 2 3 4 5 6 7 not excited very at all excited 6. Overall, how positive or negative did EMPHASIZING make you feel? 1 2 3 4 5 6 7 very negative very positive 7. Overall, how excited did EMPHASIZING make you feel? 1 2 3 4 5 6 7 not excited very at all excited 8. Overall, how positive or negative did DEEMPHASIZING make you feel? 1 2 3 4 5 6 7 very negative very positive 9. Overall, how excited did DEEMPHASIZING make you feel? 1 2 3 4 5 6 7 not excited very at all excited 10. How excited were you about the money? 1 2 3 4 5 6 7 not excited very at all excited 11. Do you believe that the money is real and will actually be paid to you if you win? 1 2 3 4 5 6 7 do not totally believe believe
12. How similar was EMPHASIZING to LOOK?
1 2 3 4 5 6 7 not at all exactly the same

163
13. How similar was DEEMPHASIZING to LOOK?
1 2 3 4 5 6 7 not at all exactly the same 14. In general, how did you decide which option to pick? 15. Do you think the instruction words, EMPHASIZE and DEEMPHASIZE, affected how you made your choices?
164
Vita
Laura N. Martin
1980 Born January 21 in New Orleans, Louisiana. 1998 Graduated from Benjamin Franklin High School, New Orleans, Louisiana. 1998-2002 Attended Emory University, Atlanta, Georgia. 2002 B.S. in Neuroscience and Behavioral Biology, Emory University, Atlanta,
Georgia.
2001-2002 Research Assistant, Yerkes Regional Primate Research Center, Emory University, Atlanta, Georgia
2002-2005 Research Assistant, New York State Psychiatric Institute & Columbia
University, New York, New York. 2005-2006 Research Coordinator, Mount Sinai School of Medicine, New York, New
York. 2006-2011 Graduate work in Psychology, Rutgers University, Newark, New Jersey. 2008-2011 National Research Service Award (NRSA) Predoctoral Fellowship,
Decision-
2006 Age, rapid-cycling, and pharmacotherapy effects on ventral
prefrontal cortex in bipolar disorder: a cross-Psychiatry, vol. 59(7), p. 611-8.
2006 Hippocampus and amygdala morphology in attention-
Archives of General Psychiatry, vol. 63(7), p.795-807.
2007 Suggestion overrides the Stroop effect in highly hypnotizable
331 338. 2007 A Anterior cingulate activity in bulimia nervosa: A fMRI case
stu e78-e82. 2008 -related processing in the human brain: Developmental
l .20(4), p. 11911211.

165
2011 Neural correlates of positive and negative emotion regulation: Implications for decision- Decision-making, Affect and Learning: Attention and Performance XXIII, p. 311-327.
2011 The influence of emotion regulation on decision-making under
risk Journal of Cognitive Neuroscience.


