2011 ANNUAL REPORT WORKERS’ COMPENSATION BOARD
26
2011 ANNUAL REPORT WORKERS’ COMPENSATION BOARD Andrew M. Cuomo, Governor Robert E. Beloten, Chair
Transcript of 2011 ANNUAL REPORT WORKERS’ COMPENSATION BOARD
2011 ANNUAL REPORT
WORKERS’ COMPENSATION BOARD
Andrew M. Cuomo, Governor
Robert E. Beloten, Chair

2011 Annual Report Workers’ Compensation Board
1 February 2012
WORKERS’ COMPENSATION BOARD’S 2011 ANNUAL REPORT The Workers’ Compensation WCB (WCB) is pleased to submit its 2011 annual report. Pursuant to Workers’ Compensation Law § 153, this report sets forth basic data regarding the WCB’s operations, including assembly and adjudication of workers’ compensation claims and issuance of stop work orders against employers that fail to maintain appropriate workers’ compensation coverage. WCB Operations The WCB maintains 11 district offices throughout the state. (Appendix (“A”) – 1.) Stop Work Orders Nearly all employers in New York State are required to secure workers’ compensation insurance. In 2007, the WCB gained the authority to issue a stop work order (SWO) if an employer fails to maintain required workers’ compensation coverage or to pay WCB penalties (WCL § 141-a). The SWO has proven to be an effective vehicle to promote compliance. Since 2007, the WCB has issued 6,897 SWOs. In 2011, the WCB issued 1,477 SWOs, the overwhelming majority of SWOs were issued downstate – 1,097 in New York City. (A – 2.) Claims Assembly Claim assembly occurs when the WCB learns of a workplace injury and assigns the claim a WCB claim number.1 The WCB “assembles” a claim in which an injured worker has lost more than one week of work, has a serious injury that may result in a permanent disability, is disputed by the carrier or employer, or receives a claim form from the injured worker (Form C-3). In August 2011, the WCB began assembling every claim for which it received a Notice to Chair of Carrier’s Action on Claim for Benefits (Form C-669). The number of assembled claims increased 1% over 2010 to 123,245. (A – 3.) This represents the second consecutive increase in the number of assembled claims after eight consecutive years of declining claim counts. (A – 3.) The geographic distribution of assembled claims is reflected in the map at A – 5. Reopened Claims There was a 16% increase in reopened claims over 2010 (227,030 v. 196,160). (A – 3.) A reopened claim is one that has been reactivated to resolve new issues following a finding that no further action was necessary. We believe that the introduction of Medical Treatment Guidelines (MTG) in December 2010 is likely responsible for a significant
1Claim assembly was introduced in 2008 in connection with the “Rocket Docket” regulations for controverted claims, part of the 2007 reform. Prior to 2008, new claims were both assembled and “indexed” when the WCB received notice of the workplace injury. The standard for assembling a claim is very similar to that of indexing for claims before 2008. The count of assembled claims excludes claims that are assigned a WCB claim number but for which the Board does not receive sufficient information, despite requests, to take further action.
2011 Annual Report Workers’ Compensation Board
2 February 2012
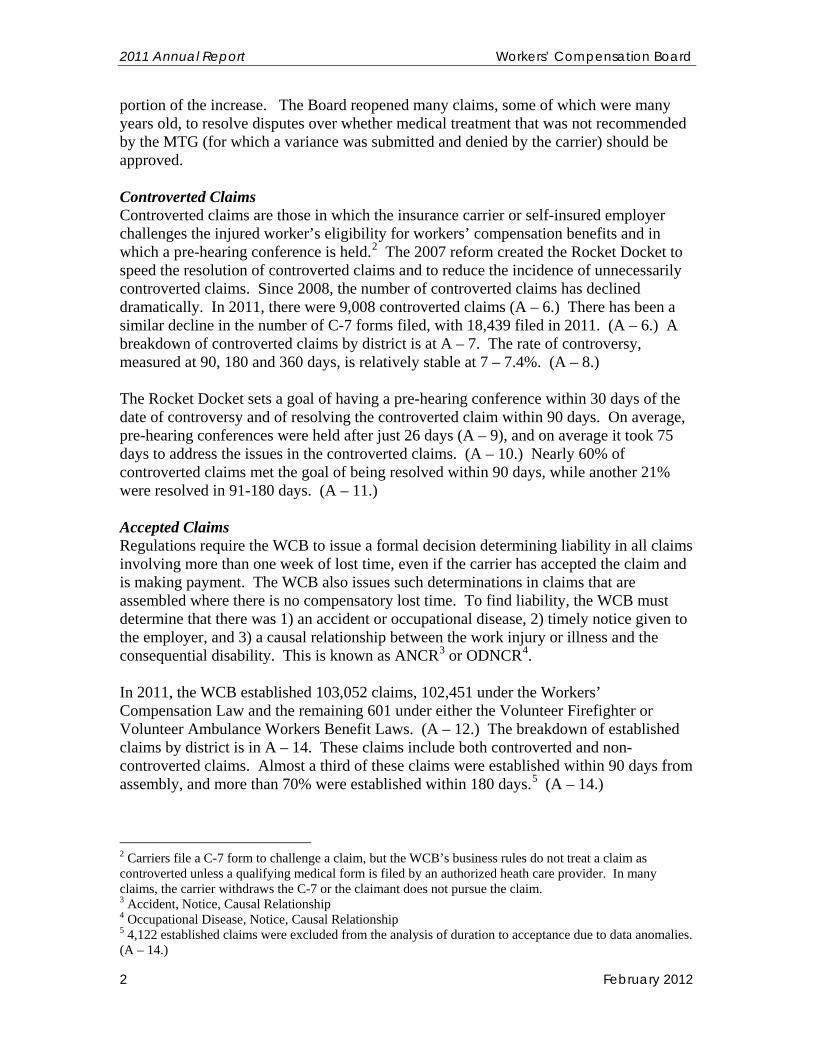
portion of the increase. The Board reopened many claims, some of which were many years old, to resolve disputes over whether medical treatment that was not recommended by the MTG (for which a variance was submitted and denied by the carrier) should be approved. Controverted Claims Controverted claims are those in which the insurance carrier or self-insured employer challenges the injured worker’s eligibility for workers’ compensation benefits and in which a pre-hearing conference is held.2 The 2007 reform created the Rocket Docket to speed the resolution of controverted claims and to reduce the incidence of unnecessarily controverted claims. Since 2008, the number of controverted claims has declined dramatically. In 2011, there were 9,008 controverted claims (A – 6.) There has been a similar decline in the number of C-7 forms filed, with 18,439 filed in 2011. (A – 6.) A breakdown of controverted claims by district is at A – 7. The rate of controversy, measured at 90, 180 and 360 days, is relatively stable at 7 – 7.4%. (A – 8.) The Rocket Docket sets a goal of having a pre-hearing conference within 30 days of the date of controversy and of resolving the controverted claim within 90 days. On average, pre-hearing conferences were held after just 26 days (A – 9), and on average it took 75 days to address the issues in the controverted claims. (A – 10.) Nearly 60% of controverted claims met the goal of being resolved within 90 days, while another 21% were resolved in 91-180 days. (A – 11.) Accepted Claims Regulations require the WCB to issue a formal decision determining liability in all claims involving more than one week of lost time, even if the carrier has accepted the claim and is making payment. The WCB also issues such determinations in claims that are assembled where there is no compensatory lost time. To find liability, the WCB must determine that there was 1) an accident or occupational disease, 2) timely notice given to the employer, and 3) a causal relationship between the work injury or illness and the consequential disability. This is known as ANCR3 or ODNCR4. In 2011, the WCB established 103,052 claims, 102,451 under the Workers’ Compensation Law and the remaining 601 under either the Volunteer Firefighter or Volunteer Ambulance Workers Benefit Laws. (A – 12.) The breakdown of established claims by district is in A – 14. These claims include both controverted and non-controverted claims. Almost a third of these claims were established within 90 days from assembly, and more than 70% were established within 180 days.5 (A – 14.) 2 Carriers file a C-7 form to challenge a claim, but the WCB’s business rules do not treat a claim as controverted unless a qualifying medical form is filed by an authorized heath care provider. In many claims, the carrier withdraws the C-7 or the claimant does not pursue the claim. 3 Accident, Notice, Causal Relationship 4 Occupational Disease, Notice, Causal Relationship 5 4,122 established claims were excluded from the analysis of duration to acceptance due to data anomalies. (A – 14.)
2011 Annual Report Workers’ Compensation Board
3 February 2012
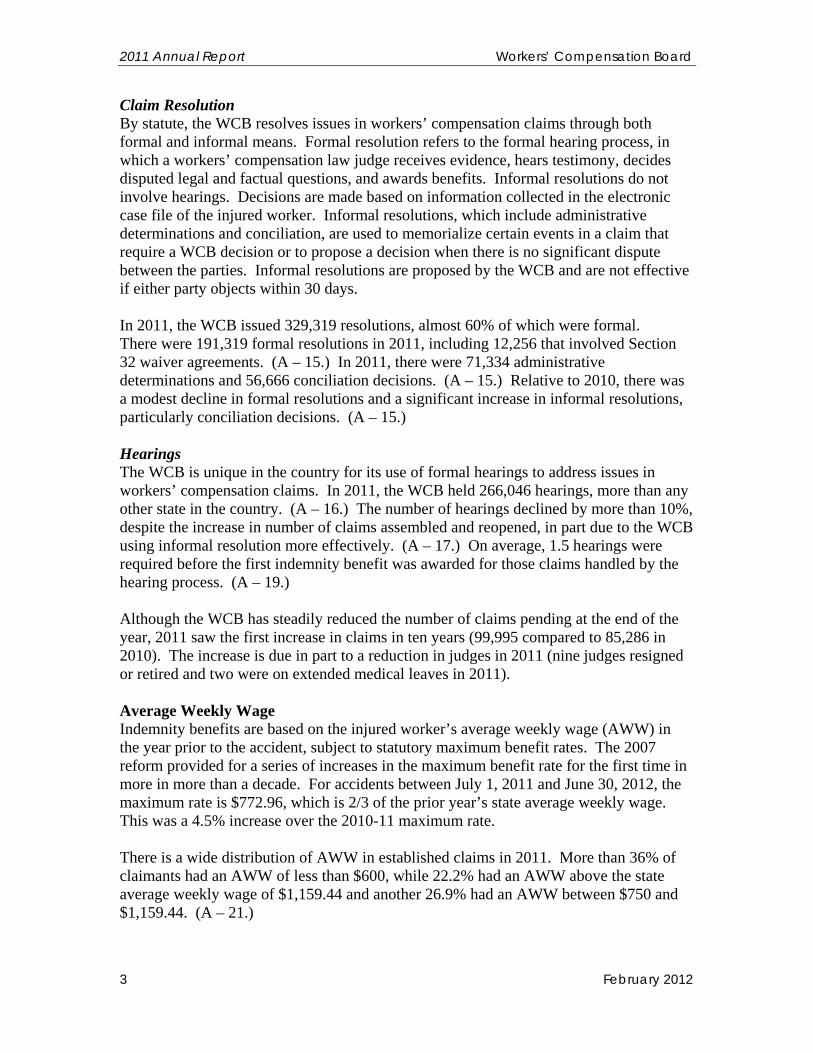
Claim Resolution By statute, the WCB resolves issues in workers’ compensation claims through both formal and informal means. Formal resolution refers to the formal hearing process, in which a workers’ compensation law judge receives evidence, hears testimony, decides disputed legal and factual questions, and awards benefits. Informal resolutions do not involve hearings. Decisions are made based on information collected in the electronic case file of the injured worker. Informal resolutions, which include administrative determinations and conciliation, are used to memorialize certain events in a claim that require a WCB decision or to propose a decision when there is no significant dispute between the parties. Informal resolutions are proposed by the WCB and are not effective if either party objects within 30 days. In 2011, the WCB issued 329,319 resolutions, almost 60% of which were formal. There were 191,319 formal resolutions in 2011, including 12,256 that involved Section 32 waiver agreements. (A – 15.) In 2011, there were 71,334 administrative determinations and 56,666 conciliation decisions. (A – 15.) Relative to 2010, there was a modest decline in formal resolutions and a significant increase in informal resolutions, particularly conciliation decisions. (A – 15.) Hearings The WCB is unique in the country for its use of formal hearings to address issues in workers’ compensation claims. In 2011, the WCB held 266,046 hearings, more than any other state in the country. (A – 16.) The number of hearings declined by more than 10%, despite the increase in number of claims assembled and reopened, in part due to the WCB using informal resolution more effectively. (A – 17.) On average, 1.5 hearings were required before the first indemnity benefit was awarded for those claims handled by the hearing process. (A – 19.) Although the WCB has steadily reduced the number of claims pending at the end of the year, 2011 saw the first increase in claims in ten years (99,995 compared to 85,286 in 2010). The increase is due in part to a reduction in judges in 2011 (nine judges resigned or retired and two were on extended medical leaves in 2011). Average Weekly Wage Indemnity benefits are based on the injured worker’s average weekly wage (AWW) in the year prior to the accident, subject to statutory maximum benefit rates. The 2007 reform provided for a series of increases in the maximum benefit rate for the first time in more in more than a decade. For accidents between July 1, 2011 and June 30, 2012, the maximum rate is $772.96, which is 2/3 of the prior year’s state average weekly wage. This was a 4.5% increase over the 2010-11 maximum rate. There is a wide distribution of AWW in established claims in 2011. More than 36% of claimants had an AWW of less than $600, while 22.2% had an AWW above the state average weekly wage of $1,159.44 and another 26.9% had an AWW between $750 and $1,159.44. (A – 21.)
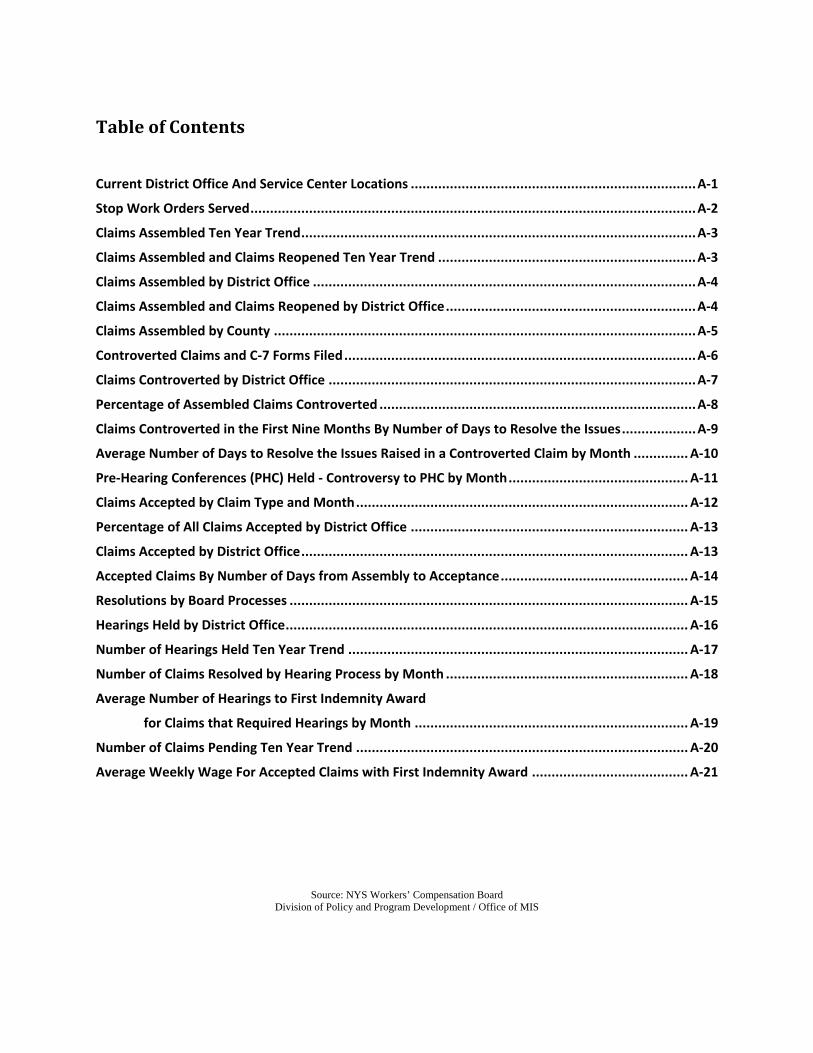
TableofContents
Current District Office And Service Center Locations ......................................................................... A‐1
Stop Work Orders Served .................................................................................................................. A‐2
Claims Assembled Ten Year Trend ..................................................................................................... A‐3
Claims Assembled and Claims Reopened Ten Year Trend .................................................................. A‐3
Claims Assembled by District Office .................................................................................................. A‐4
Claims Assembled and Claims Reopened by District Office ................................................................ A‐4
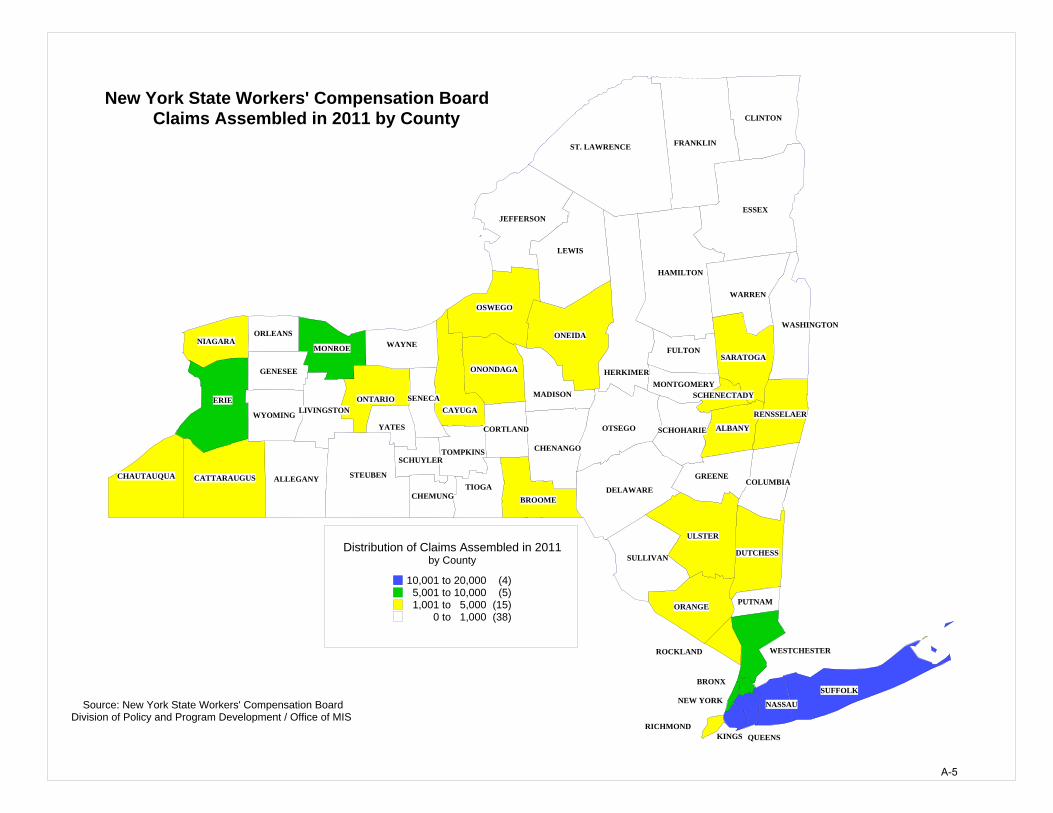
Claims Assembled by County ............................................................................................................ A‐5
Controverted Claims and C‐7 Forms Filed .......................................................................................... A‐6
Claims Controverted by District Office .............................................................................................. A‐7
Percentage of Assembled Claims Controverted ................................................................................. A‐8
Claims Controverted in the First Nine Months By Number of Days to Resolve the Issues ................... A‐9
Average Number of Days to Resolve the Issues Raised in a Controverted Claim by Month .............. A‐10
Pre‐Hearing Conferences (PHC) Held ‐ Controversy to PHC by Month .............................................. A‐11
Claims Accepted by Claim Type and Month ..................................................................................... A‐12
Percentage of All Claims Accepted by District Office ....................................................................... A‐13
Claims Accepted by District Office ................................................................................................... A‐13
Accepted Claims By Number of Days from Assembly to Acceptance ................................................ A‐14
Resolutions by Board Processes ...................................................................................................... A‐15
Hearings Held by District Office ....................................................................................................... A‐16
Number of Hearings Held Ten Year Trend ....................................................................................... A‐17
Number of Claims Resolved by Hearing Process by Month .............................................................. A‐18
Average Number of Hearings to First Indemnity Award
for Claims that Required Hearings by Month ...................................................................... A‐19
Number of Claims Pending Ten Year Trend ..................................................................................... A‐20
Average Weekly Wage For Accepted Claims with First Indemnity Award ........................................ A‐21
Source: NYS Workers’ Compensation Board Division of Policy and Program Development / Office of MIS
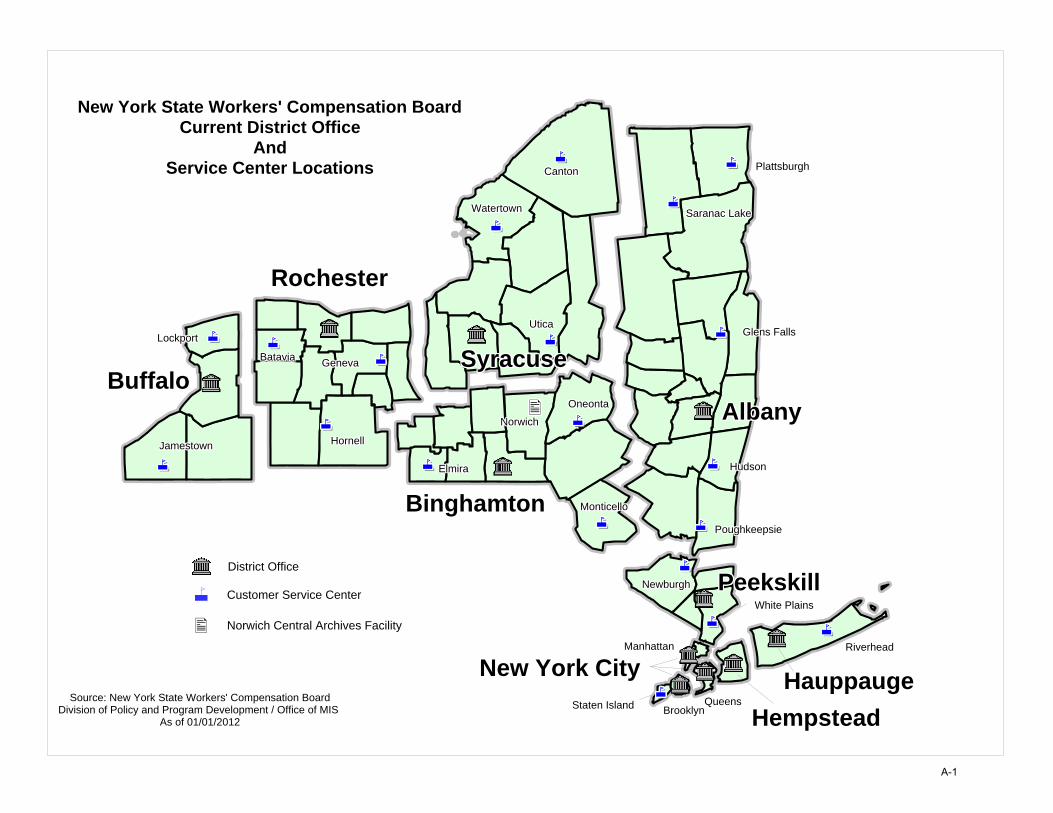
Source: New York State Workers' Compensation BoardDivision of Policy and Program Development / Office of MIS
As of 01/01/2012
New York State Workers' Compensation BoardCurrent District Office
AndService Center Locations
District Office
Customer Service Center
Norwich Central Archives Facility
BrooklynBrooklynBrooklynBrooklynBrooklynBrooklynBrooklynBrooklynBrooklyn
ManhattanManhattanManhattanManhattanManhattanManhattanManhattanManhattanManhattan
QueensQueensQueensQueensQueensQueensQueensQueensQueens
NorwichNorwichNorwichNorwichNorwichNorwichNorwichNorwichNorwich
UticaUticaUticaUticaUticaUticaUticaUticaUtica
OneontaOneontaOneontaOneontaOneontaOneontaOneontaOneontaOneonta
ElmiraElmiraElmiraElmiraElmiraElmiraElmiraElmiraElmira
MonticelloMonticelloMonticelloMonticelloMonticelloMonticelloMonticelloMonticelloMonticello
BataviaBataviaBataviaBataviaBataviaBataviaBataviaBataviaBatavia GenevaGenevaGenevaGenevaGenevaGenevaGenevaGenevaGeneva
HornellHornellHornellHornellHornellHornellHornellHornellHornell
Glens FallsGlens FallsGlens FallsGlens FallsGlens FallsGlens FallsGlens FallsGlens FallsGlens Falls
PoughkeepsiePoughkeepsiePoughkeepsiePoughkeepsiePoughkeepsiePoughkeepsiePoughkeepsiePoughkeepsiePoughkeepsie
HudsonHudsonHudsonHudsonHudsonHudsonHudsonHudsonHudson
NewburghNewburghNewburghNewburghNewburghNewburghNewburghNewburghNewburgh
CantonCantonCantonCantonCantonCantonCantonCantonCanton
White PlainsWhite PlainsWhite PlainsWhite PlainsWhite PlainsWhite PlainsWhite PlainsWhite PlainsWhite Plains
RiverheadRiverheadRiverheadRiverheadRiverheadRiverheadRiverheadRiverheadRiverhead
HauppaugeHauppaugeHauppaugeHauppaugeHauppaugeHauppaugeHauppaugeHauppaugeHauppauge
LockportLockportLockportLockportLockportLockportLockportLockportLockport
JamestownJamestownJamestownJamestownJamestownJamestownJamestownJamestownJamestown
Staten IslandStaten IslandStaten IslandStaten IslandStaten IslandStaten IslandStaten IslandStaten IslandStaten Island
Saranac LakeSaranac LakeSaranac LakeSaranac LakeSaranac LakeSaranac LakeSaranac LakeSaranac LakeSaranac LakeWatertownWatertownWatertownWatertownWatertownWatertownWatertownWatertownWatertown
PlattsburghPlattsburghPlattsburghPlattsburghPlattsburghPlattsburghPlattsburghPlattsburghPlattsburgh
SyracuseSyracuseSyracuseSyracuseSyracuseSyracuseSyracuseSyracuseSyracuse
BinghamtonBinghamtonBinghamtonBinghamtonBinghamtonBinghamtonBinghamtonBinghamtonBinghamton
RochesterRochesterRochesterRochesterRochesterRochesterRochesterRochesterRochester
PeekskillPeekskillPeekskillPeekskillPeekskillPeekskillPeekskillPeekskillPeekskill
AlbanyAlbanyAlbanyAlbanyAlbanyAlbanyAlbanyAlbanyAlbanyBuffaloBuffaloBuffaloBuffaloBuffaloBuffaloBuffaloBuffaloBuffalo
New York CityNew York CityNew York CityNew York CityNew York CityNew York CityNew York CityNew York CityNew York City
HempsteadHempsteadHempsteadHempsteadHempsteadHempsteadHempsteadHempsteadHempstead
A-1
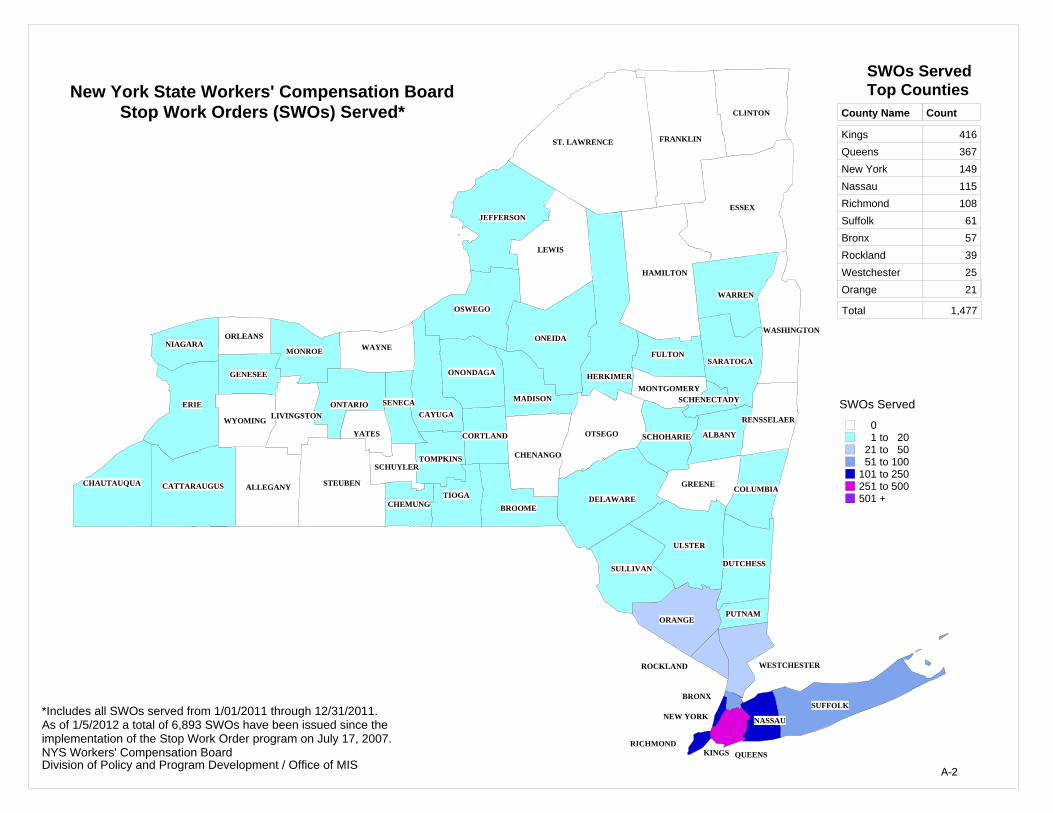
New York State Workers' Compensation BoardStop Work Orders (SWOs) Served*
ULSTER
SENECA MADISON
CAYUGA
BROOME
HERKIMER
ROCKLAND WESTCHESTER
BRONX
NEW YORKSUFFOLK
ESSEX
ERIE
RICHMONDQUEENSKINGS
WASHINGTON
NASSAU
ALBANY
ALLEGANYCATTARAUGUSCHAUTAUQUA
CHEMUNG
CHENANGO
CLINTON
COLUMBIA
CORTLAND
DELAWARE
DUTCHESS
FRANKLIN
FULTON
GENESEE
GREENE
HAMILTON
JEFFERSON
LEWIS
LIVINGSTON
MONROE
MONTGOMERY
NIAGARAONEIDA
ONONDAGA
ONTARIO
ORANGE
ORLEANS
OSWEGO
OTSEGO
PUTNAM
RENSSELAER
SARATOGA
SCHENECTADY
SCHOHARIE
SCHUYLER
ST. LAWRENCE
STEUBEN
SULLIVAN
TIOGA
TOMPKINS
WARREN
WAYNE
WYOMING
YATES
SWOs Served
01 to 20
21 to 5051 to 100
101 to 250251 to 500501 +
County Name Total
Total 1,477
County Name Count
Kings 416Queens 367New York 149Nassau 115Richmond 108Suffolk 61Bronx 57Rockland 39Westchester 25Orange 21
SWOs ServedTop Counties
*Includes all SWOs served from 1/01/2011 through 12/31/2011.As of 1/5/2012 a total of 6,893 SWOs have been issued since the implementation of the Stop Work Order program on July 17, 2007.NYS Workers' Compensation BoardDivision of Policy and Program Development / Office of MIS A-2
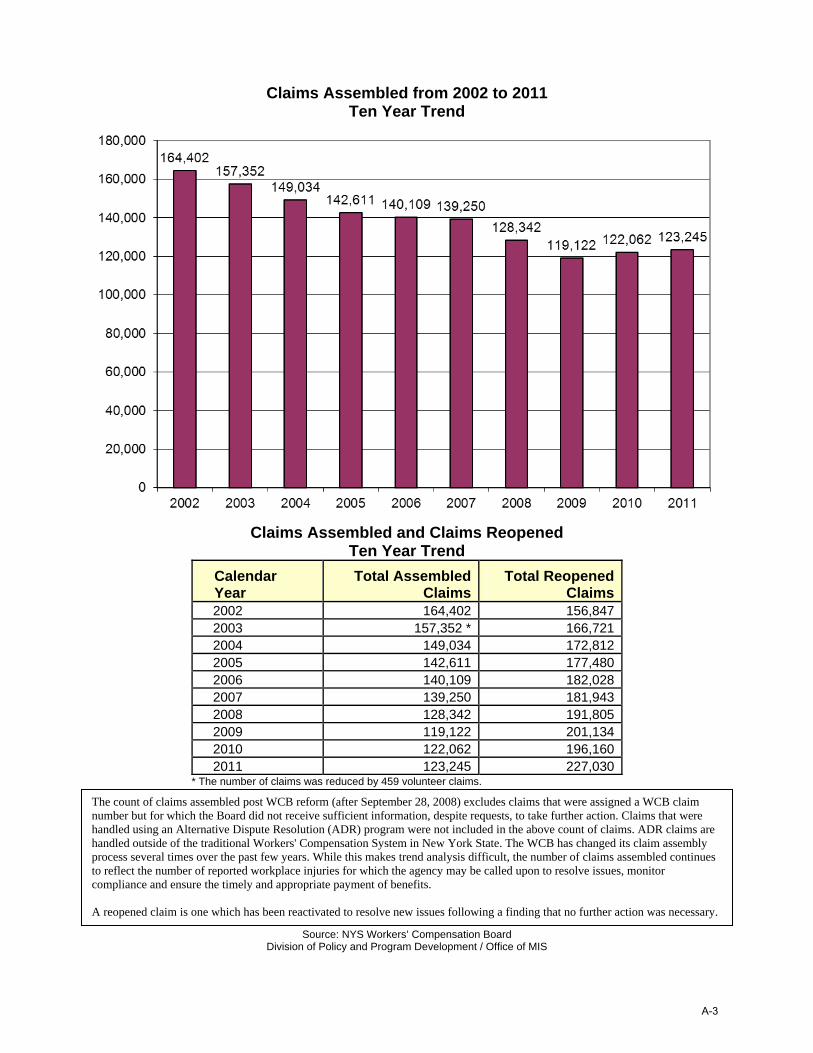
Claims Assembled from 2002 to 2011 Ten Year Trend
Claims Assembled and Claims Reopened
Ten Year Trend Calendar Year
Total Assembled Claims
Total Reopened Claims
2002 164,402 156,847 2003 157,352 * 166,721 2004 149,034 172,812 2005 142,611 177,480 2006 140,109 182,028 2007 139,250 181,943 2008 128,342 191,805 2009 119,122 201,134 2010 122,062 196,160 2011 123,245 227,030
* The number of claims was reduced by 459 volunteer claims.
Source: NYS Workers’ Compensation Board Division of Policy and Program Development / Office of MIS
The count of claims assembled post WCB reform (after September 28, 2008) excludes claims that were assigned a WCB claim number but for which the Board did not receive sufficient information, despite requests, to take further action. Claims that were handled using an Alternative Dispute Resolution (ADR) program were not included in the above count of claims. ADR claims are handled outside of the traditional Workers' Compensation System in New York State. The WCB has changed its claim assembly process several times over the past few years. While this makes trend analysis difficult, the number of claims assembled continues to reflect the number of reported workplace injuries for which the agency may be called upon to resolve issues, monitor compliance and ensure the timely and appropriate payment of benefits. A reopened claim is one which has been reactivated to resolve new issues following a finding that no further action was necessary.
A-3
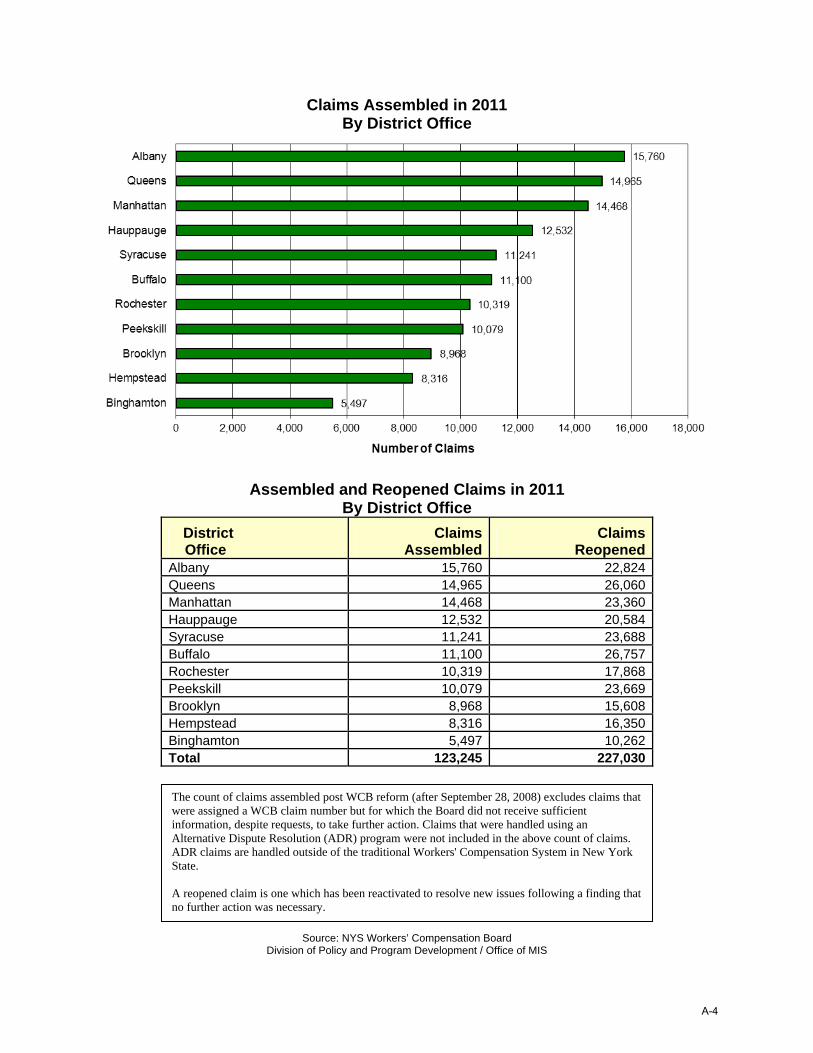
Claims Assembled in 2011 By District Office
Assembled and Reopened Claims in 2011 By District Office
District Office
Claims Assembled
Claims Reopened
Albany 15,760 22,824 Queens 14,965 26,060 Manhattan 14,468 23,360 Hauppauge 12,532 20,584 Syracuse 11,241 23,688 Buffalo 11,100 26,757 Rochester 10,319 17,868 Peekskill 10,079 23,669 Brooklyn 8,968 15,608 Hempstead 8,316 16,350 Binghamton 5,497 10,262 Total 123,245 227,030
Source: NYS Workers’ Compensation Board Division of Policy and Program Development / Office of MIS
The count of claims assembled post WCB reform (after September 28, 2008) excludes claims that were assigned a WCB claim number but for which the Board did not receive sufficient information, despite requests, to take further action. Claims that were handled using an Alternative Dispute Resolution (ADR) program were not included in the above count of claims. ADR claims are handled outside of the traditional Workers' Compensation System in New York State. A reopened claim is one which has been reactivated to resolve new issues following a finding that no further action was necessary.
A-4
WASHINGTON
Source: New York State Workers' Compensation BoardDivision of Policy and Program Development / Office of MIS
New York State Workers' Compensation Board Claims Assembled in 2011 by County
ESSEX
MADISON
BROOME
ERIE
ULSTER
HERKIMER
CAYUGASENECA
ROCKLAND WESTCHESTER
SUFFOLKNEW YORK
BRONX
QUEENSKINGSRICHMOND
NASSAU
ALBANY
ALLEGANYCATTARAUGUSCHAUTAUQUA
CHEMUNG
CHENANGO
CLINTON
COLUMBIA
CORTLAND
DELAWARE
DUTCHESS
FRANKLIN
FULTON
GENESEE
GREENE
HAMILTON
JEFFERSON
LEWIS
LIVINGSTON
MONROE
MONTGOMERY
NIAGARAONEIDA
ONONDAGA
ONTARIO
ORANGE
ORLEANS
OSWEGO
OTSEGO
PUTNAM
RENSSELAER
SARATOGA
SCHENECTADY
SCHOHARIE
SCHUYLER
ST. LAWRENCE
STEUBEN
SULLIVAN
TIOGA
TOMPKINS
WARREN
WAYNE
WYOMINGYATES
Distribution of Claims Assembled in 2011by County
10,001 to 20,000 (4)5,001 to 10,000 (5)1,001 to 5,000 (15)
0 to 1,000 (38)
A-5
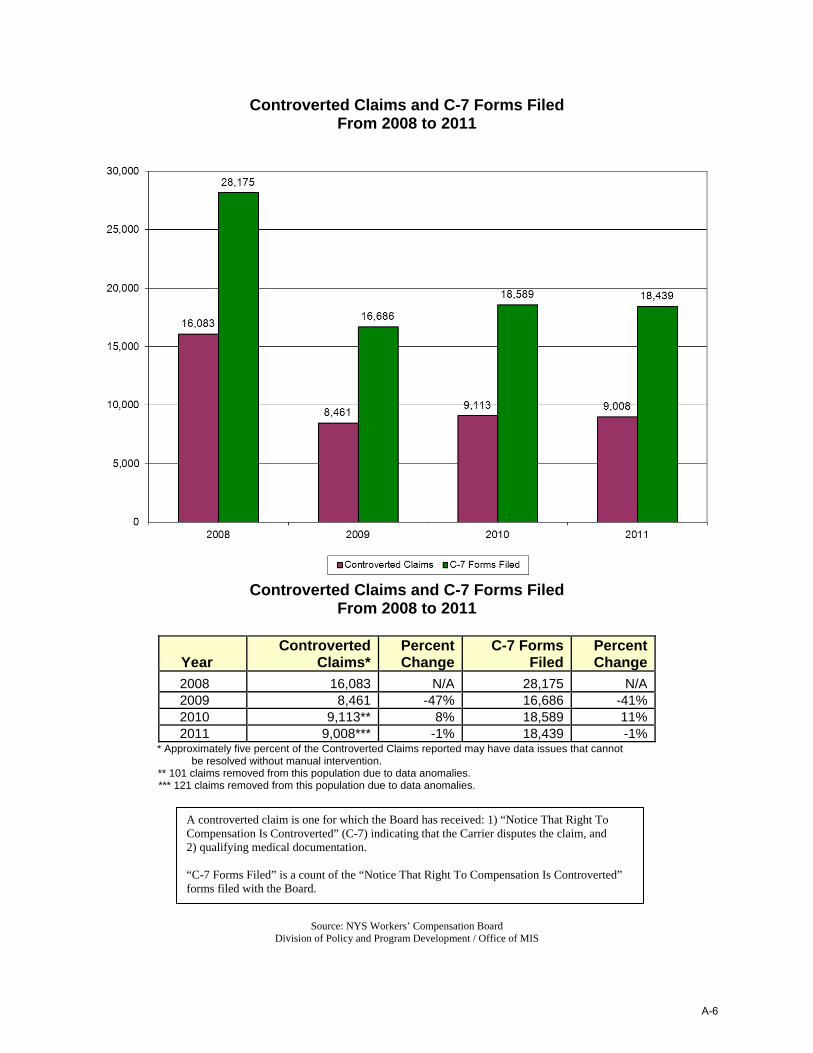
Controverted Claims and C-7 Forms Filed From 2008 to 2011
Controverted Claims and C-7 Forms Filed From 2008 to 2011
Year Controverted
Claims*Percent Change
C-7 Forms Filed
Percent Change
2008 16,083 N/A 28,175 N/A 2009 8,461 -47% 16,686 -41% 2010 9,113** 8% 18,589 11% 2011 9,008*** -1% 18,439 -1%
* Approximately five percent of the Controverted Claims reported may have data issues that cannot be resolved without manual intervention.
** 101 claims removed from this population due to data anomalies. *** 121 claims removed from this population due to data anomalies.
Source: NYS Workers’ Compensation Board
Division of Policy and Program Development / Office of MIS
A controverted claim is one for which the Board has received: 1) “Notice That Right To Compensation Is Controverted” (C-7) indicating that the Carrier disputes the claim, and 2) qualifying medical documentation. “C-7 Forms Filed” is a count of the “Notice That Right To Compensation Is Controverted” forms filed with the Board.
A-6
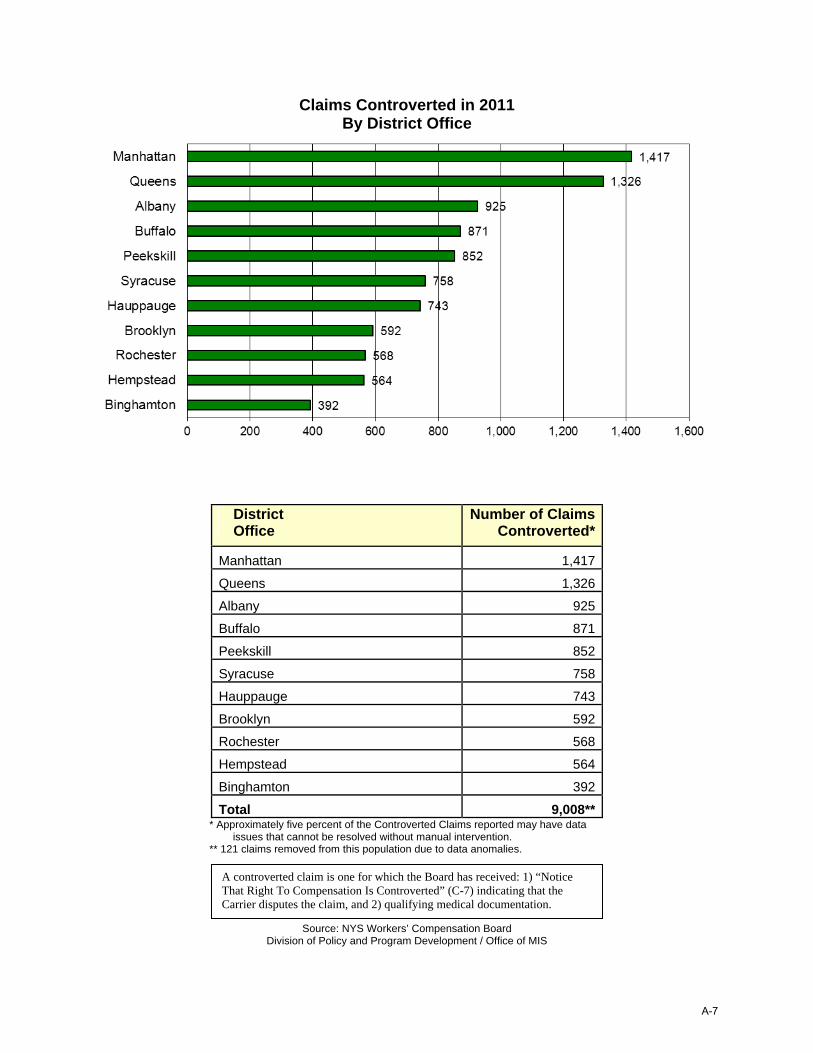
Claims Controverted in 2011 By District Office
District Office
Number of Claims Controverted*
Manhattan 1,417
Queens 1,326
Albany 925
Buffalo 871
Peekskill 852
Syracuse 758
Hauppauge 743
Brooklyn 592
Rochester 568
Hempstead 564
Binghamton 392
Total 9,008** * Approximately five percent of the Controverted Claims reported may have data
issues that cannot be resolved without manual intervention. ** 121 claims removed from this population due to data anomalies.
Source: NYS Workers’ Compensation Board Division of Policy and Program Development / Office of MIS
A controverted claim is one for which the Board has received: 1) “Notice That Right To Compensation Is Controverted” (C-7) indicating that the Carrier disputes the claim, and 2) qualifying medical documentation.
A-7
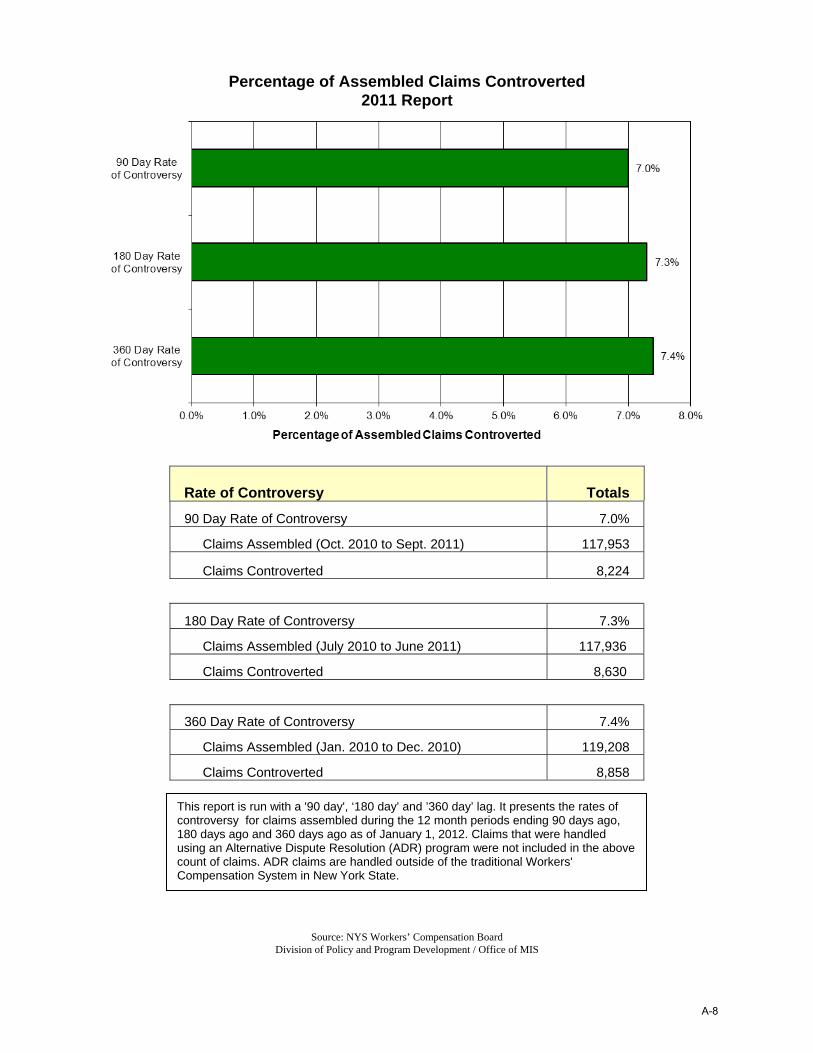
Percentage of Assembled Claims Controverted 2011 Report
Rate of Controversy
Totals
90 Day Rate of Controversy 7.0%
Claims Assembled (Oct. 2010 to Sept. 2011) 117,953
Claims Controverted 8,224
180 Day Rate of Controversy 7.3%
Claims Assembled (July 2010 to June 2011) 117,936
Claims Controverted 8,630
360 Day Rate of Controversy 7.4%
Claims Assembled (Jan. 2010 to Dec. 2010) 119,208
Claims Controverted 8,858
Source: NYS Workers’ Compensation Board Division of Policy and Program Development / Office of MIS
This report is run with a '90 day', ‘180 day’ and ’360 day’ lag. It presents the rates of controversy for claims assembled during the 12 month periods ending 90 days ago, 180 days ago and 360 days ago as of January 1, 2012. Claims that were handled using an Alternative Dispute Resolution (ADR) program were not included in the above count of claims. ADR claims are handled outside of the traditional Workers' Compensation System in New York State.
A-8
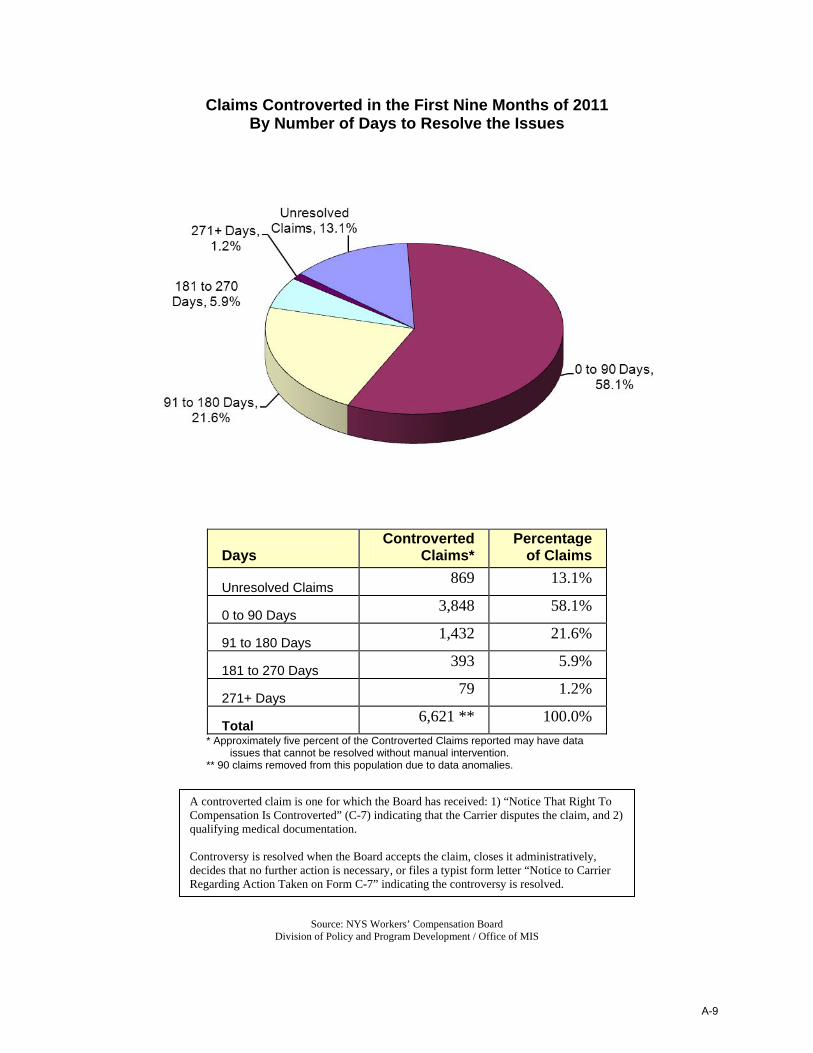
Claims Controverted in the First Nine Months of 2011 By Number of Days to Resolve the Issues
Days
Controverted Claims*
Percentage of Claims
Unresolved Claims 869 13.1%
0 to 90 Days 3,848 58.1%
91 to 180 Days 1,432 21.6%
181 to 270 Days 393 5.9%
271+ Days 79 1.2%
Total 6,621 ** 100.0%
* Approximately five percent of the Controverted Claims reported may have data issues that cannot be resolved without manual intervention.
** 90 claims removed from this population due to data anomalies.
Source: NYS Workers’ Compensation Board
Division of Policy and Program Development / Office of MIS
A controverted claim is one for which the Board has received: 1) “Notice That Right To Compensation Is Controverted” (C-7) indicating that the Carrier disputes the claim, and 2) qualifying medical documentation. Controversy is resolved when the Board accepts the claim, closes it administratively, decides that no further action is necessary, or files a typist form letter “Notice to Carrier Regarding Action Taken on Form C-7” indicating the controversy is resolved.
A-9

Average Number of Days to Resolve the Issues Raised in a Controverted Claim in 2011
By Month
Month
Average Number of Days
January 77 February 82 March 79 April 72 May 73 June 72 July 73 August 71 September 76 October 72 November 75 December 72 Average 75
Source: NYS Workers’ Compensation Board
Division of Policy and Program Development / Office of MIS
A claim is considered eligible for hearing as a controverted claim only if a C-7 form and a qualifying medical form have been filed. Controversy is resolved when the Board accepts the claim, closes it administratively, decides that no further action is necessary, or files a typist form letter “Notice to Carrier Regarding Action Taken on Form C-7” indicating the controversy is resolved.
A-10

Pre-Hearing Conferences (PHC) Held in 2011 Median Days from Controversy to PHC
By Month
Month
Total PHC
Eligible
PHC*
Median Days from Controversy
to PHC
Unknown
Controversy Date
January 568 520 26 48
February 539 518 26 21
March 659 613 26 46
April 689 642 26 47
May 733 679 26 54
June 747 715 25 32
July 549 522 26 27
August 758 710 25 48
September 631 597 26 34
October 712 679 25 33
November 775 738 25 37
December 699 682 26 17
Year 8,059 ** 7,615 26 444*** Approximately five percent of the Controverted Claims reported may have data issues that cannot be resolved without manual intervention. * An ‘Eligible PHC’ is the first pre-hearing conference for a controverted claim. ** The total number of PHCs held in calendar year 2011 is 8,561; out of these claims, 502 had a PHC in the previous year. *** The ‘Unknown Controversy Date’ number reflects re-opened controverted claims, data anomalies, and claims
with unknown controversy dates.
Source: NYS Workers’ Compensation Board Division of Policy and Program Development / Office of MIS
A controverted claim is one for which the Board has received: 1) “Notice That Right To Compensation Is Controverted” (C-7) indicating that the Carrier disputes the claim, and 2) qualifying medical documentation.
A-11
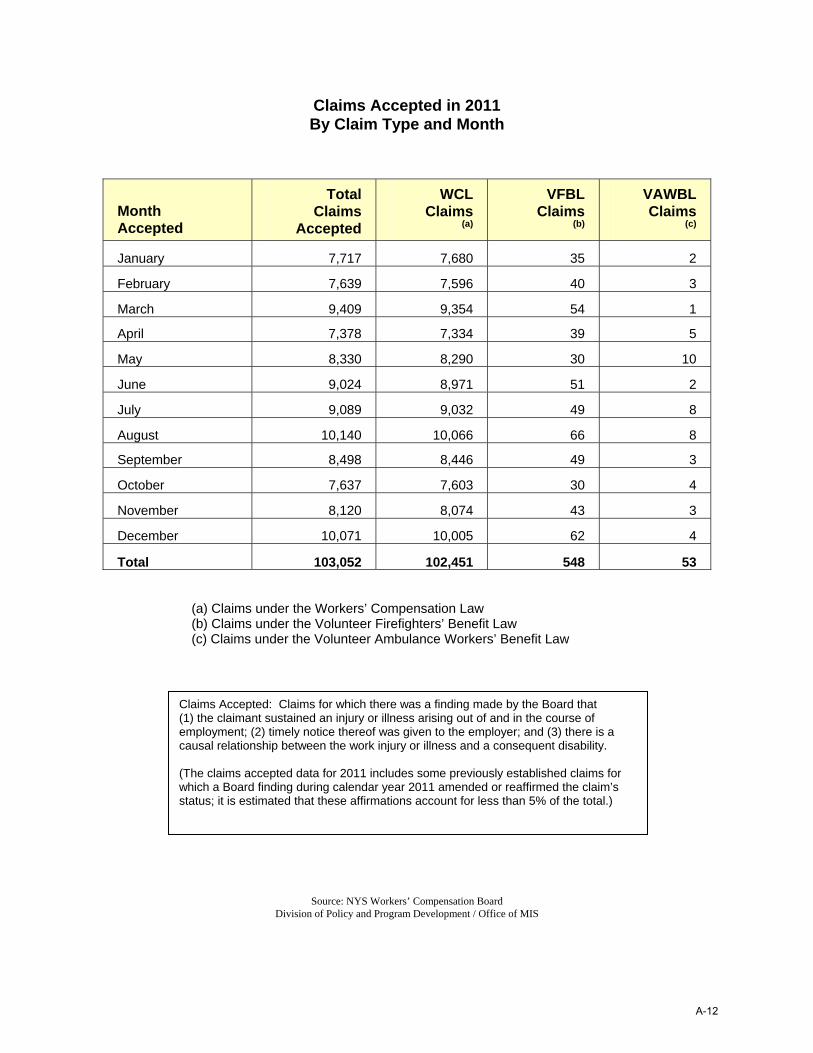
Claims Accepted in 2011 By Claim Type and Month
Month Accepted
Total
Claims Accepted
WCL Claims
(a)
VFBL Claims
(b)
VAWBL Claims
(c)
January 7,717 7,680 35 2
February 7,639 7,596 40 3
March 9,409 9,354 54 1
April 7,378 7,334 39 5
May 8,330 8,290 30 10
June 9,024 8,971 51 2
July 9,089 9,032 49 8
August 10,140 10,066 66 8
September 8,498 8,446 49 3
October 7,637 7,603 30 4
November 8,120 8,074 43 3
December 10,071 10,005 62 4
Total 103,052 102,451 548 53
(a) Claims under the Workers’ Compensation Law (b) Claims under the Volunteer Firefighters’ Benefit Law (c) Claims under the Volunteer Ambulance Workers’ Benefit Law
Source: NYS Workers’ Compensation Board Division of Policy and Program Development / Office of MIS
Claims Accepted: Claims for which there was a finding made by the Board that (1) the claimant sustained an injury or illness arising out of and in the course of employment; (2) timely notice thereof was given to the employer; and (3) there is a causal relationship between the work injury or illness and a consequent disability. (The claims accepted data for 2011 includes some previously established claims for which a Board finding during calendar year 2011 amended or reaffirmed the claim’s status; it is estimated that these affirmations account for less than 5% of the total.)
A-12

Percentage of All Claims Accepted in 2011 By District Office
Claims Accepted in 2011
By District Office District Office
Claims Accepted
Albany 13,875 Queens 11,741 Manhattan 10,917 Buffalo 10,322 Syracuse 9,895 Peekskill 9,798 Hauppauge 9,724 Rochester 9,555 Hempstead 7,121 Binghamton 5,158 Brooklyn 4,946 Total 103,052
Source: NYS Workers’ Compensation Board Division of Policy and Program Development / Office of MIS
Claims Accepted: Claims for which there was a finding made by the Board that (1) the claimant sustained an injury or illness arising out of and in the course of employment; (2) timely notice thereof was given to the employer; and (3) there is a causal relationship between the work injury or illness and a consequent disability. (The claims accepted data for 2011 includes some previously established claims for which a Board finding during calendar year 2011 amended or reaffirmed the claim’s status; it is estimated that these affirmations account for less than 5% of the total.)
A-13
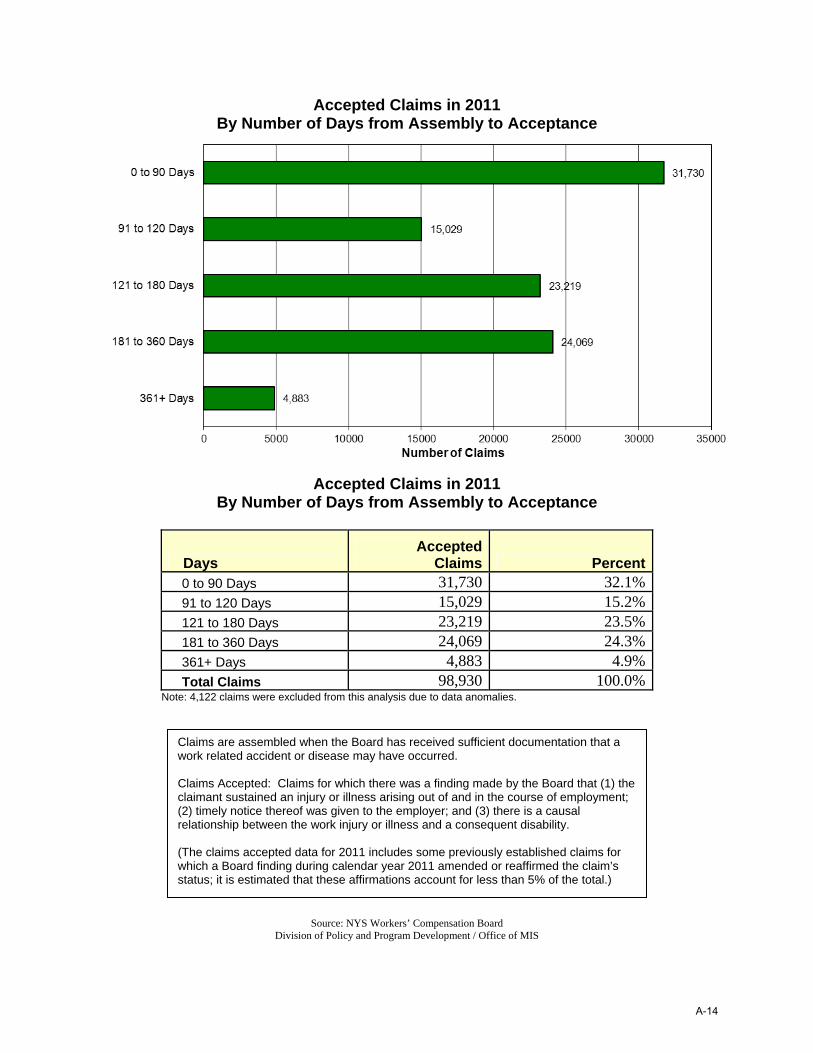
Accepted Claims in 2011 By Number of Days from Assembly to Acceptance
Accepted Claims in 2011
By Number of Days from Assembly to Acceptance
Days Accepted
Claims Percent 0 to 90 Days 31,730 32.1% 91 to 120 Days 15,029 15.2% 121 to 180 Days 23,219 23.5% 181 to 360 Days 24,069 24.3% 361+ Days 4,883 4.9% Total Claims 98,930 100.0%
Note: 4,122 claims were excluded from this analysis due to data anomalies.
Source: NYS Workers’ Compensation Board
Division of Policy and Program Development / Office of MIS
Claims are assembled when the Board has received sufficient documentation that a work related accident or disease may have occurred. Claims Accepted: Claims for which there was a finding made by the Board that (1) the claimant sustained an injury or illness arising out of and in the course of employment; (2) timely notice thereof was given to the employer; and (3) there is a causal relationship between the work injury or illness and a consequent disability. (The claims accepted data for 2011 includes some previously established claims for which a Board finding during calendar year 2011 amended or reaffirmed the claim’s status; it is estimated that these affirmations account for less than 5% of the total.)
A-14

Resolutions by Board Processes in 2011
Claim Resolution
Number of Resolutions
Percentage of Resolutions
Informal 128,000 40.1% Administrative 71,334 22.3% Conciliation 56,666 17.7% Formal 191,319 59.9% Hearings 179,063 56.1% Waiver Agreements 12,256 3.8% Total 319,319 100.0%
Source: NYS Workers’ Compensation Board Division of Policy and Program Development / Office of MIS
“Administrative” includes Administrate Determinations, Administrative Closures and Cancellations (A claim is cancelled if it is determined to be a duplicate). “Conciliation” provides an informal and prompt resolution of the claim based upon the cooperation of both parties: the injured worker and the insurance carrier/self-insured employer. A claim resolved by the “Hearing” process is one for which a judge had determined that no further action by the Board was necessary at the conclusion of the hearing, this includes Pre-Hearing Conferences. A Pre-Hearing Conference provides a mechanism for the identification of issues and relevant evidence and to permit parties [in interest] an opportunity to assess their case and to resolve outstanding issues prior to [trial] scheduling a hearing regarding those issues. “Waiver Agreements” settle any or all issues in a claim for workers’ compensation benefits, subject to the Board’s approval.
A-15
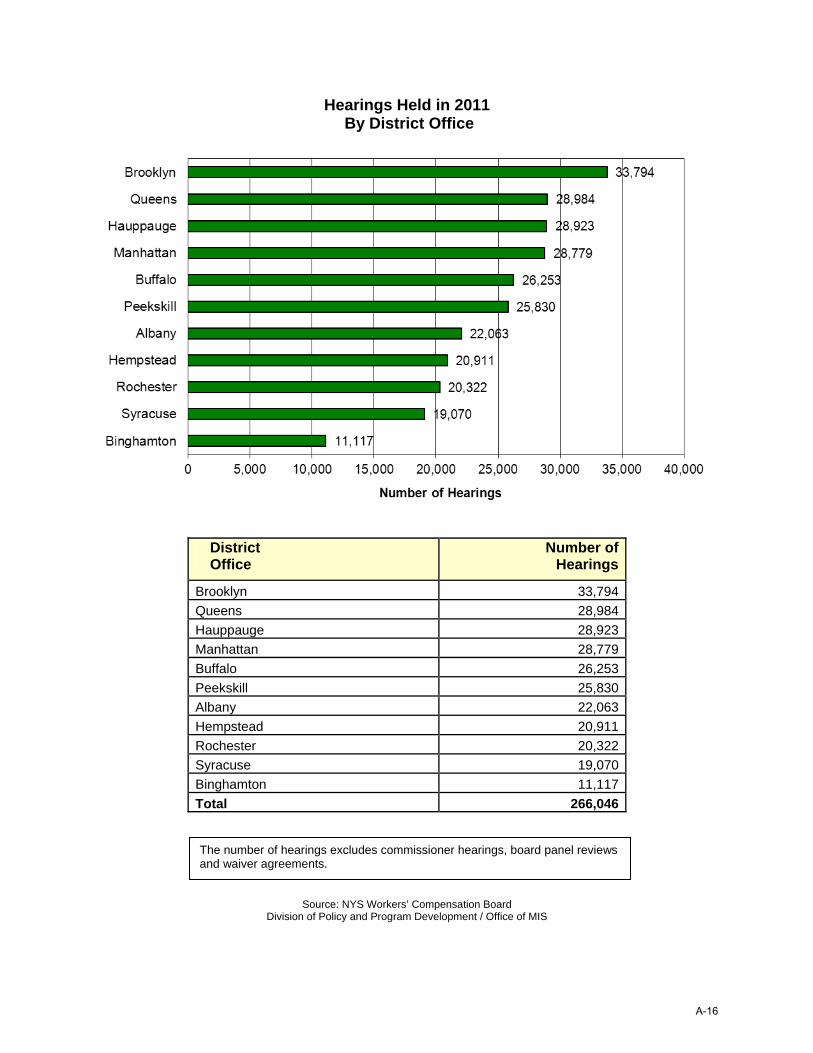
Hearings Held in 2011 By District Office
District Office
Number of Hearings
Brooklyn 33,794 Queens 28,984 Hauppauge 28,923 Manhattan 28,779 Buffalo 26,253 Peekskill 25,830 Albany 22,063 Hempstead 20,911 Rochester 20,322 Syracuse 19,070 Binghamton 11,117 Total 266,046
Source: NYS Workers’ Compensation Board Division of Policy and Program Development / Office of MIS
The number of hearings excludes commissioner hearings, board panel reviews and waiver agreements.
A-16

Number of Hearings Held from 2002 to 2011 Ten Year Trend
Number of Hearings Held Ten Year Trend
Year Total
Hearings Held
Claims Pending at Years End
Ratio of Hearings Held to Claims Pending
2002 369,819 160,176 2.3 2003 337,396 149,588 2.3 2004 319,751 137,735 2.3 2005 305,722 126,054 2.4 2006 290,406 122,860 2.4 2007 287,864 116,392 2.5 2008 267,277 96,058 2.8 2009 279,870 90,315 3.1 2010 291,737 85,286 3.4 2011 266,046 99,995 2.7
Source: NYS Workers’ Compensation Board Division of Policy and Program Development / Office of MIS
The number of hearings excludes commissioner hearings, board panel reviews and waiver agreements.
A-17

Number of Claims Resolved by Hearing Process in 2011 By Month
Month
Resolved by Hearing Process
January 14,903 February 14,496 March 16,940 April 12,881 May 15,630 June 16,195 July 13,638 August 15,533 September 14,519 October 15,596 November 14,232 December* 14,500 Total 179,063
* As of 1/08/2012.
Source: NYS Workers’ Compensation Board Division of Policy and Program Development / Office of MIS
A claim resolved by the Hearing process is one for which a judge had determined that no further action by the Board was necessary at the conclusion of the hearing, this includes Pre-Hearing Conferences. A Pre-Hearing Conference provides a mechanism for the identification of issues and relevant evidence and to permit parties [in interest] an opportunity to assess their case and to resolve outstanding issues prior to [trial] scheduling a hearing regarding those issues.
A-18
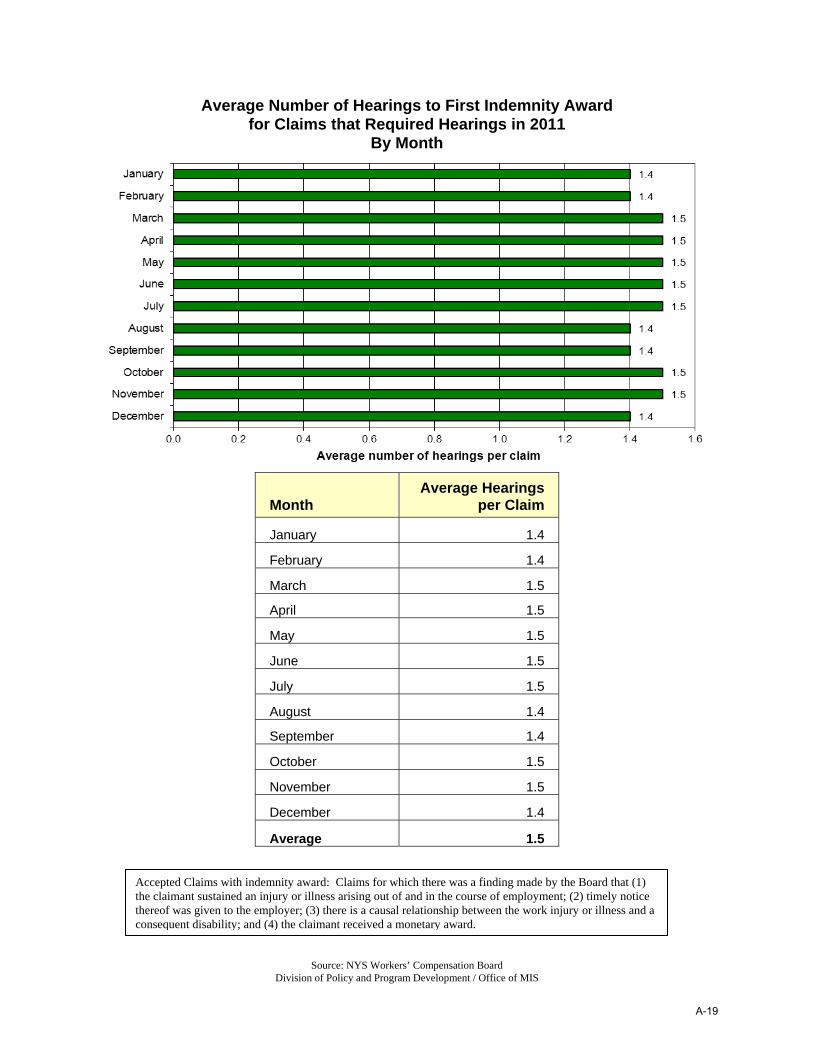
Average Number of Hearings to First Indemnity Award for Claims that Required Hearings in 2011
By Month
Month
Average Hearings per Claim
January 1.4
February 1.4
March 1.5
April 1.5
May 1.5
June 1.5
July 1.5
August 1.4
September 1.4
October 1.5
November 1.5
December 1.4
Average 1.5
Source: NYS Workers’ Compensation Board Division of Policy and Program Development / Office of MIS
Accepted Claims with indemnity award: Claims for which there was a finding made by the Board that (1) the claimant sustained an injury or illness arising out of and in the course of employment; (2) timely notice thereof was given to the employer; (3) there is a causal relationship between the work injury or illness and a consequent disability; and (4) the claimant received a monetary award.
A-19

Number of Claims Pending from 2002 to 2011 Ten Year Trend
Number of Claims Pending Ten Year Trend
Calendar Year
Claims Pending at End of Year
Annual Percent Change in
Claims Pending 2002 160,176 N/A 2003 149,588 -7% 2004 137,735 -8% 2005 126,054 -8% 2006 122,860 -3% 2007 116,392 -5% 2008 96,058 -17% 2009 90,315 -6% 2010 85,286 -6% 2011 99,995 17%
Source: NYS Workers’ Compensation Board
Division of Policy and Program Development / Office of MIS
A pending claim is one with unresolved issues.
A-20

Average Weekly Wage For Accepted Claims with First Indemnity Award in 2011
Average Weekly Wage
Number of Claimants
Percentage of Claimants
Not Available 1,534 2.1%
Less than $150 1,082 1.5%
$150 - $299 5,163 7.1%
$300 - $449 9,183 12.6%
$450 - $599 9,688 13.3%
$600 - $749 10,485 14.4%
$750 - $899 8,681 11.9%
$900 - $1159.43 10,908 15.0%
$1159.44 or more 16,190 22.2%
Totals 72,914 100.0% The maximum benefit rate effective 7/1/2011 is based upon the Statewide Average
Weekly Wage of $1159.44.
Source: NYS Workers’ Compensation Board Division of Policy and Program Development / Office of MIS
Claims Accepted: Claims for which there was a finding made by the Board that (1) the claimant sustained an injury or illness arising out of and in the course of employment; (2) timely notice thereof was given to the employer; and (3) there is a causal relationship between the work injury or illness and a consequent disability. (The claims accepted data for 2011 includes some previously established claims for which a Board finding during calendar year 2011 amended or reaffirmed the claim’s status; it is estimated that these affirmations account for less than 5% of the total.)
A-21